


Abstract
Active management making forests more resistant to wildfire and more resilient afterwards is a widely held assumption that is rarely tested against comparable fires. In March 2023, two wildfires ignited three days and 54 km apart under the same synoptic weather in southern Korea, one in a naturally regenerating forest of Jirisan National Park and one in a pine-dominated production forest. Treating the pair as a natural experiment, we compared burn severity and three-year recovery using Sentinel-2 imagery, hourly ERA5-Land weather, the 1:5000 national stand map and a composition-weighted unburned reference. Both fires burned under light mean winds over nearly equal areas (117 and 122 ha), yet high severity covered 0.4% of the park fire and 11.4% of the managed-forest fire. Broadleaved stands burned alike at the two sites. Pine stands burned far more severely in the managed forest (mean differenced Normalised Burn Ratio 0.37) than in the park (0.25), and pine made up 57% of the managed-forest burn, whereas conifers, mostly pine, made up only 14% of the park burn. The park’s steeper and more sun-exposed terrain would, if anything, have favoured more severe fire. The 2025 stand map reclassified 98% of the managed forest’s pine but classified 19% of its broadleaved stands as unstocked, consistent with the post-fire clearing of pine. Three years later, the park had regained at least 80% of its pre-fire levels for all three spectral indices, whereas the managed forest remained below 80% for NBR and NDMI. Broadleaved and mixed stands showed similar spectral recovery at both sites; pine showed slower spectral recovery at both sites, and the managed forest’s lightly burned pine regained about half the share of its loss observed in the park’s pine, which remained classified as stocked forest, although the intervals of the two estimates overlapped. The managed regime was associated with greater burn severity and slower spectral recovery; the latter coincided with its pine-dominated composition and the post-fire reclassification of most pine stands as unstocked.
1. Introduction
Forest policy in the Republic of Korea has long rested on a premise: forests become healthier and more fire-resistant when they are actively managed, through road construction, thinning, understorey removal and planting. After each large wildfire, insufficient forest roads and inadequate tending are cited as causes, and after the fire, salvage logging followed by planting is presented as the standard route to recovery [1]. The premise is intuitive and it is embedded in operational practice, yet it has seldom been tested with field data in the temperate humid forests where it is applied. Recent Korean case studies have begun to do so, and their findings run the other way: roads did not act as fire breaks even in the most densely roaded burn areas [2,3], and in the 2025 Sancheong fire, the largest in Jirisan’s history, the naturally regenerating national park forest burned less severely than the surrounding managed forest under identical topographic conditions [4].
Fuel-reduction treatments such as thinning and prescribed burning have been shown to reduce subsequent fire severity in dry, fire-adapted conifer forests [5,6], but whether active management confers similar benefits in humid temperate forests with a large broadleaved component is less clear. The international evidence on post-fire management in humid temperate systems points in the same direction as the Korean case studies. Salvage logging and clear-cut restoration suppress natural regeneration and delay ecosystem recovery in Alpine pine forests [7,8], and in northern Japan, thirty years of observation show that stands left untreated after disturbance recovered to mixed conifer–broadleaf forest, whereas salvaged and planted stands developed a different species composition with a third of the conifer cover [9,10,11]. Long-term satellite records in the Greater Hinggan Mountains found natural regeneration faster than artificial restoration, with larger trees after 33 years [12], and Korean comparisons of the 1996 Goseong and 2000 East Coast burns found no significant advantage of planted over naturally regenerated sites [13]. At the same time, the resistance and resilience of a forest are distinct properties [14,15]: a stand that burns lightly need not recover quickly, and the 2025 Sancheong analyses showed that the two can be decoupled at the stand level [4]. Evaluating a management regime therefore requires measuring both.
What has been missing is a comparison in which management differs while the fire weather does not. Burn severity is sensitive to wind, fuel moisture and terrain [16,17], so comparisons across fires in different seasons or regions confound management with meteorology. The two wildfires of March 2023 in Gyeongsangnam-do provide an unusual opportunity. The Hapcheon fire (ignited 8 March) burned a production forest of Korean red pine planted during the national reforestation programme and managed for timber since. The Hadong fire (ignited 11 March) burned inside Jirisan National Park, where silviculture has been excluded since the park’s designation in 1967. The two fires are 54 km apart, burned under the same spring synoptic pattern before leaf-out, and produced burned forest areas of nearly the same size. Treatment—a management regime—differs; the season and the synoptic weather do not, and the remaining local differences in weather are measured and reported.
We used this pairing to ask three questions. First, did the two forests burn with different severity under comparable weather, and is the difference robust to the way severity is measured? Second, is the severity difference explained by the stand composition that management has produced, by stand structure beyond composition, or by terrain? Third, did the forests recover at different rates over the three growing seasons after fire, and does any recovery difference persist when initial severity and stand composition are held constant? Throughout, we report effect sizes and residual deficits rather than inferential tests across fires, because two fires cannot supply replication at the treatment level; the design is a natural experiment with one replicate per treatment, and we treat it as such.
2. Materials and Methods
2.1. Study Sites and Fire Events
The two fires occurred in Gyeongsangnam-do, southern Korea, in a temperate humid climate with summer-concentrated rainfall (Figure 1). The Hadong fire burned in Daeseong-ri, Hwagae-myeon, on the southern slopes of Jirisan National Park (centre 127.659° E, 35.290° N). The park was designated in 1967 as Korea’s first national park and is managed by the Korea National Park Service without commercial silviculture. The burned stands are from a secondary forest that has regenerated naturally for at least six decades, dominated by deciduous oaks with scattered Korean red pine (Pinus densiflora) on ridges; conifer stands make up 13.6% of the burned area and 91% of their area is Korean red pine (the rest larch and Korean white pine). The Hapcheon fire burned in Wolpyeong-ri, Yongju-myeon (centre 128.118° E, 35.596° N), in a low-elevation production forest under Korea Forest Service and private management. The burned stands are dominated by P. densiflora planted during the national reforestation programme of the 1960s–1970s and have since been held under production management. The forest’s conifer stands are entirely Korean red pine, so we refer to the conifer stands of both sites as pine stands; stand-level treatment records are not public, so the intensity of tending is documented here only by designation and by the stand map. The Landsat record (Section 3.6) shows that neither site has experienced clear-cutting or replanting since 1985, so both forests entered the 2023 fires after at least four decades without stand-replacing disturbance. Neither site had burned in the two decades before 2023 as far as satellite fire detection can tell: the MODIS and VIIRS active-fire archives (2001–2022 and 2012–2022) contain no detection within 1 km of the Hadong burn and a single partial-pixel MODIS detection at the edge of the Hapcheon buffer in April 2004 that left no trace in that summer’s Landsat composite, and in every pre-fire year of the Sentinel-2 series, the burned areas tracked their unburned surroundings (Section 3.4). Satellite active-fire products can miss small, low-intensity or short-duration surface fires, so a small earlier burn cannot be excluded; however, no fire large enough to produce a detectable stand-level change was identified before the 2023 events. The two centres are 53.7 km apart.
Figure 1.
Study areas. (a) Hadong fire in Jirisan National Park and (b) Hapcheon fire in the managed production forest, showing burn severity classes (Sentinel-2 dNBR, immediate post-fire pairing) over a cloud-masked summer 2022 true-colour composite, with the unburned reference ring (600–2000 m from the perimeter) in light blue; (c) location of the two fires in southern Korea.
Table 1 summarises the events. The Hapcheon fire ignited at about 14:00 on 8 March 2023 at the forest edge near Wolpyeong-ri; the investigating authority attributed it to a cigarette discarded by a person collecting firewood [18]. The main front was declared contained after about 20 h, the fire re-ignited late on 9 March and was contained again the following morning, and containment was declared final on 11 March, 67 h after ignition. The Hadong fire ignited at about 13:20 on 11 March at the edge of a settlement in Daeseong-ri; its cause was not established, with ash from a domestic wood-burning boiler suspected [19]. The main front was held by noon on 12 March, when spring rain began, and containment was declared after 27 h. Both fires were fought by the same national system with aerial suppression as the main tool. On the first afternoon, 33 helicopters were deployed at Hapcheon, with about 1500 ground personnel mobilised overnight [20]; at Hadong, 20 helicopters and 276 ground personnel were deployed, rising to about 600 personnel overnight in steep roadless terrain, where one firefighter died of a heart attack [21,22]. The official damage areas were 163 ha at Hapcheon and 91 ha at Hadong. Both fires occurred before leaf-out of the deciduous canopy, which is the typical season for Korean wildfires [23]. Official areas are administrative estimates of the fire-affected zone made during the incident; they include non-forest cover and differ from the forest burned areas mapped here, in opposite directions at the two sites, for reasons explained in Section 2.4.
Table 1.
The two wildfires compared in this study.
2.2. Fire Weather
To test whether meteorology could account for differences in fire behaviour, we extracted hourly ERA5-Land reanalysis (0.1°, approximately 9 km) [24] at each fire centre for 15 January–15 March 2023: 10 m wind components, from which speed and direction were computed; 2 m air and dew-point temperature, from which relative humidity and vapour-pressure deficit were derived; hourly precipitation, from which antecedent totals over 7, 14 and 30 days and the number of days since the last day with at least 1 mm were computed; and volumetric soil water in the 0–7 cm layer. Statistics were calculated over the calendar days of each fire (Hadong 11–12 March, 48 h; Hapcheon 8–11 March, 96 h) and, as a sensitivity check, over the reported burning durations (27 h and 67 h from the reported ignition hours). Times are given in Korean Standard Time. Because ERA5-Land smooths valley winds in complex terrain such as Jirisan, we also report the mean wind speeds estimated from the nearest Korea Forest Service automatic weather stations in the official incident report, and treat the two sources as bounds rather than as a single value. The reanalysis cell containing the Hadong centre has a mean elevation of 912 m against 618 m for the burned area, and the Hapcheon cell 207 m against 269 m, so cell temperatures were also adjusted to the elevation of each burned area with a lapse rate of 6.5 °C km−1 for comparison.
2.3. Burn Severity from Sentinel-2
Burn severity was quantified with the differenced Normalised Burn Ratio (dNBR) [25], the standard index for burn-severity mapping [26,27,28]. All processing used Sentinel-2 MultiSpectral Instrument (MSI) Level-2A surface reflectance (COPERNICUS/S2_SR_HARMONIZED) in Google Earth Engine [29]. The harmonised collection was used because the processing-baseline change of January 2022 introduced a reflectance offset that would otherwise create an artificial discontinuity inside our pre-fire baseline period. Clouds, cloud shadows and snow were masked pixel-wise with the Scene Classification Layer (classes 1, 3, 8, 9, 10, 11) and with the s2cloudless cloud-probability layer (threshold 40%), and scenes with more than 80% cloud cover were excluded.
The Normalised Burn Ratio (NBR) was computed from band B8A (narrow near-infrared, 865 nm) and band B12 (shortwave infrared, 2190 nm), both at their native 20 m resolution:
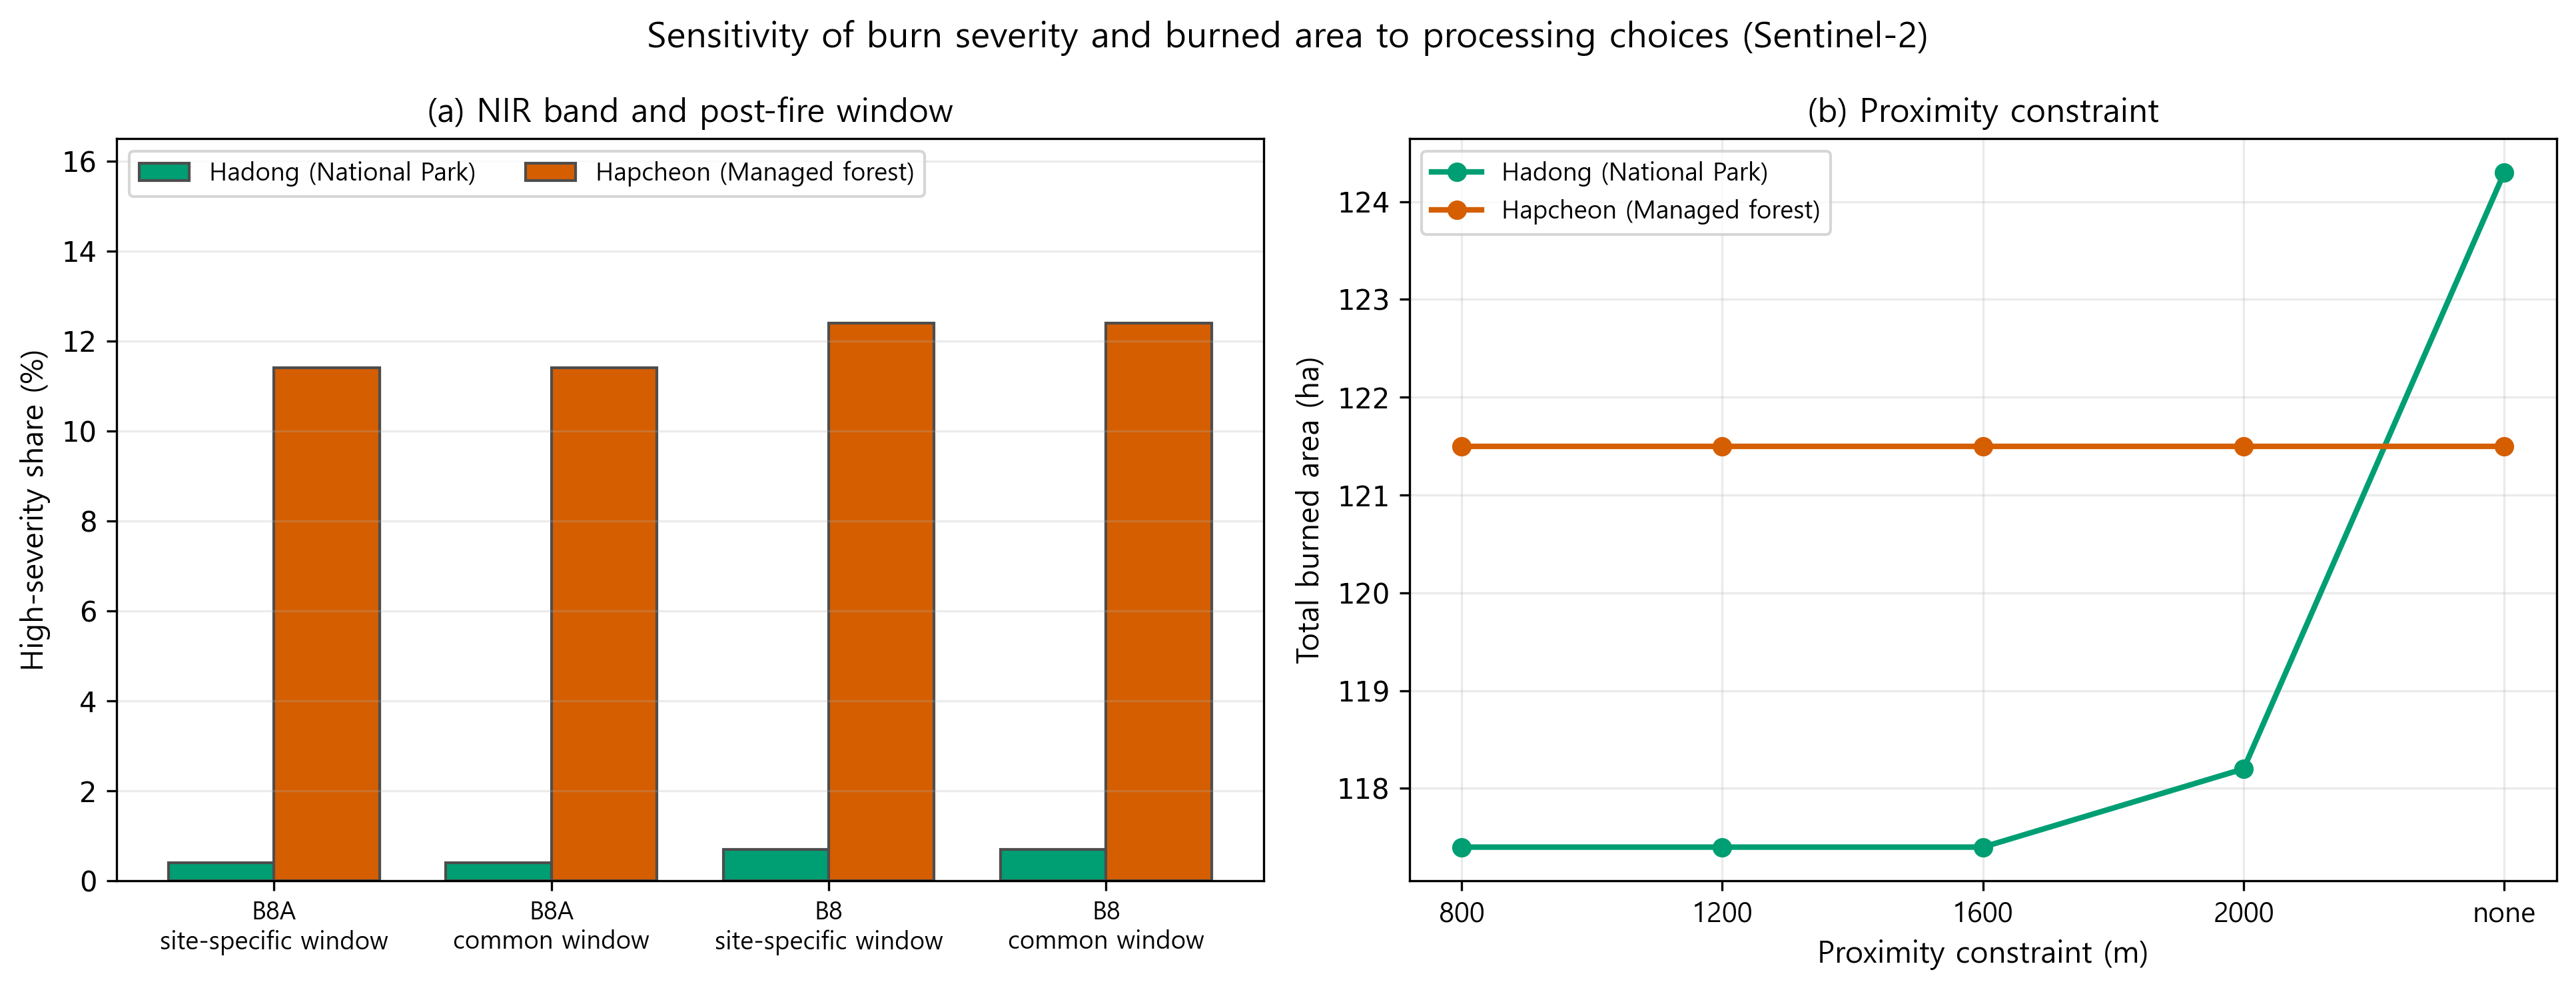
B8A was preferred to the wide B8 band because its centre wavelength and bandwidth match Landsat OLI band 5, on which the standard severity thresholds were developed, and because it shares the 20 m grid of B11 and B12 so that no resampling enters the index. Results with B8 are reported as a sensitivity (Appendix A).
The pre-fire image was the median of cloud-free observations from 24 February to 6 March 2023, immediately before both ignitions. The post-fire window was set separately for each fire to begin the day after containment and last ten days (Hadong 13–23 March; Hapcheon 12–22 March), so that no scene acquired while a fire was still burning entered the composite. Immediate post-fire imagery was used for perimeter mapping because Korean spring fires burn largely as surface fires beneath a leafless deciduous canopy; once leaf-out proceeds, lightly burned pixels become spectrally indistinguishable from unburned forest and the low-severity margin is lost [4,30]. Severity classes followed the Key and Benson thresholds (dNBR × 1000 of 100, 270, 440 and 660 separating low, moderate–low, moderate–high and high). These thresholds were developed for leaf-on fires and are conservative for spring fires in deciduous forest; they are applied here for comparability between the two sites, not as calibrated ecological classes.
2.4. Forest Mask and Burned-Area Delineation
Because pre-fire imagery necessarily predates leaf-out, the forest mask cannot rely on pre-fire greenness. In an earlier version of this analysis, a mask of pre-fire NBR ≥ 0.20 removed 60% of the candidate burned pixels in the national park but only 22% in the managed forest, because leafless deciduous canopy in early March has an NBR near 0.1, whereas evergreen pine retains a value above 0.4. The mask therefore excluded precisely the stands that distinguish the national park. We replaced it with a phenology-independent definition: a pixel was forest if it was mapped as tree cover in ESA WorldCover 2021 [31] and had a leaf-on NBR ≥ 0.30 in the median composite of July–August 2022. The three phenology-independent alternatives we tested (WorldCover alone, leaf-on NBR alone, and their intersection) gave identical burned areas for Hadong (117.4 ha) and areas within 6 ha of each other for Hapcheon, and a mask taken from the stocked-forest polygons of the 2019 stand map gave the same class proportions (Appendix A).
The burned area was defined as forest pixels with dNBR ≥ 0.10 within 1200 m of 130 location markers digitised over the visible burn scars in Google Earth for Web (Google LLC, Mountain View, CA, USA; web version, no fixed release), with 62 markers at Hadong and 68 at Hapcheon, after removal of connected components smaller than 12 pixels (0.48 ha). The markers served only to restrict the search to the known fire locations. The proximity constraint had no effect at 800–2000 m and changed the Hadong area by 7 ha when removed altogether (Appendix A); it serves only to exclude distant false positives. Total burned areas are therefore approximate to within a few hectares, and the severity comparison is made on the class proportions within each burned area.
The forest burned areas mapped here differ from the official damage areas of Table 1 in opposite directions, and the difference is instructive. At Hapcheon the official figure (163 ha) exceeds the forest burned area (121.5 ha) because it includes non-forest cover at the foot of the slopes, such as fields, orchards and settlements, that the forest mask excludes. At Hadong, the official figure (91 ha) is smaller than the forest burned area (117.4 ha) even though it too includes non-forest cover. Official areas in Korea are estimates of the fire-affected zone compiled during and immediately after the incident from ground observation and aerial reconnaissance, before any satellite assessment, and they are not subsequently revised to a mapped perimeter. In the Hadong fire, 77% of the mapped forest burned area was in the low-severity class. Such low-severity burning beneath a leafless canopy may have been difficult to delineate during rapid ground and aerial assessment, particularly on steep terrain (mean slope 32°). The dNBR threshold of 0.10 includes this lightly burned margin, whereas such areas may be underrepresented in rapid incident-based estimates; restricting the Hadong burn to dNBR ≥ 0.27 gives 26.7 ha, well below the official figure, which thus lies between the two. By contrast, the Hapcheon burn contained a substantially larger proportion of moderate–high- and high-severity pixels, including conspicuous canopy damage. The official areas are therefore neither a check on nor a substitute for the mapped areas, and the comparison rests on the class proportions within each mapped area, which are insensitive to the perimeter definition (Appendix A).
2.5. Robustness of the Severity Comparison
Two features of the setting could bias a dNBR comparison against the deciduous national park. First, dNBR is compressed where the pre-fire NBR is low, because a leafless canopy cannot lose reflectance it does not have. We therefore also computed the Relativised Burn Ratio, [32], and an anniversary-paired dNBR in which the pre-fire reference is the leaf-on composite of 1 May–20 June 2022 and the post-fire image is the same window in 2023, following the extended-assessment convention that captures delayed canopy mortality [26,33]. Second, the burned areas differ in stand composition. Composition was taken from the Korea Forest Service 1:5000 digital forest stand map, publicly distributed through the Forest Geographic Information System [34], using the 2019 edition as the pre-fire state (its polygons were last surveyed between 2015 and 2021). Stand polygons carry forest type (coniferous, broadleaved, mixed), dominant species group, age class (10-year classes), diameter class and crown density. The map is compiled by interpretation of aerial photographs with field verification [34]. A stand is classed as coniferous or broadleaved where one group occupies at least 75% of the crown area or stem count and as mixed otherwise; the dominant species group is assigned on the same 75% rule; age class follows the trees that occupy at least half of the crown area; crown density is classed as sparse (≤50%), medium (51–70%) or dense (≥71%) crown cover; and forest land is classed as stocked (tree crown cover of at least 30%, or an adequately stocked young stand) or as unstocked, a class that includes land from which trees have been temporarily removed. The unstocked class in the 2025 edition is therefore a survey record that a stand no longer carried a tree canopy of the stocking standard at the time of the update; it does not by itself say whether the trees died or were cut, or what vegetation had replaced them. Severity polygons were intersected with the stand polygons and compared between the two fires within each forest type, species group and age class, with pixel counts derived from intersected area. As a continuous complement that does not depend on polygon boundaries, we also used the pre-fire leaf-off NBR of each pixel as a proxy for its evergreen fraction, divided into five classes (<0.10, 0.10–0.20, 0.20–0.30, 0.30–0.40 and ≥0.40), and repeated the comparison within each class; these classes were also used to weight the unburned reference in the recovery analysis (Section 2.6). The 2024 and 2025 editions of the stand map were compared with the 2019 edition inside each burn perimeter and its reference ring to detect post-fire reclassification potentially associated with mortality or management treatment, and any such change was checked against the summer Sentinel-2 series for the spectral signature of clearing (a rise in the fraction of pixels with NDVI < 0.30). To test whether post-fire treatment rather than fire explained the managed forest’s recovery, the reclassified and retained parts of the Hapcheon burn were compared within the same stand type and severity class using the joint stratification of Section 2.6, and the reclassified area was tabulated by stand type and severity to examine whether reclassification was more strongly associated with burn severity or with stand type, providing indirect evidence relevant to mortality- versus management-related explanations.
Terrain was characterised from the ALOS World 3D 30 m digital surface model [35]; it is a canopy-top surface, which does not materially affect slope and aspect over closed forest at this resolution. Elevation, slope and aspect were summarised for each burned area, and severity was compared within terrain strata defined by 100 m elevation and 5° slope intervals in which both fires had at least 30 pixels.
2.6. Post-Fire Recovery
Recovery was tracked from 2019 to 2026 with median composites of Sentinel-2 imagery for a fixed spring window after leaf-out (1 May–20 June) and a summer window (1 July–31 August), processed as in Section 2.3. Fixing the spring window after leaf-out removes the phenological bias that would arise if pre-leaf-out scenes entered some composites and not others. When fewer than four cloud-free scenes were available, the window was widened (spring to 10 July; summer 25 June–15 September); all composites in the final series had between 8 and 24 scenes, and no composite was missing. Three indices were computed with B8A: NBR (char and canopy consumption), the Normalised Difference Vegetation Index (NDVI; green biomass; B8A and B4) and the Normalised Difference Moisture Index (NDMI; canopy water content; B8A and B11). Agreement among the three is required before recovery is asserted [36]. These indices register the return of green and moisture-related spectral signals at the 20 m grid; they do not distinguish tree regeneration from shrub or resprout cover, and they do not measure stem density or stand structure. Recovery in this paper therefore refers specifically to spectral recovery of the burned area towards its pre-fire level and towards its unburned reference, and the limits of that meaning are discussed in Section 4.3.
Interannual weather and phenology affect burned and unburned forest alike, so recovery was measured relative to an unburned reference. Rather than sampling reference points, we used every forest pixel (Section 2.4) that lay between 600 m and 2000 m from the burn perimeter and had dNBR < 0.10, an annulus of 50,820 pixels (203 ha) around the Hadong fire and 41,571 pixels (166 ha) around the Hapcheon fire. Because the reference ring need not share the stand composition of the burned area, the reference value for each composite was post-stratified: the ring was divided into the five pre-fire NBR classes of Section 2.5, and the class means were weighted by the proportion of burned pixels in each class. The pre-fire leaf-off NBR of the composition-weighted reference matched that of the burned area to within 0.02 at both sites. Unweighted ring means and a 30-point azimuthal sample (the design of an earlier version of this study) are reported alongside; the three references differed by less than 0.005 in every composite.
The deviation was computed for each index and composite. Its value before fire (2019–2022) tests whether the reference is valid; a valid reference gives Δ near zero. From the spring series we derived: the initial deficit in spring 2023; the residual deficit in spring 2026; the recovery fraction ; and a difference-in-differences version in which the mean pre-fire Δ was subtracted before computing the deficits. Following [37,38,39], we also computed, from the burned-area values alone, , where is the 2019–2022 spring mean (values ≥ 1 indicate that 80% of the pre-fire level has been regained); the relative recovery indicator ; and the annual rate . The recovery fraction and R80P answer different questions and need not agree. The recovery fraction is normalised by the initial loss relative to the reference, so a stand that lost little and regained half of it scores 50%; R80P compares the 2026 value with the stand’s own pre-fire level and is not normalised by the loss, so the same stand, if its loss was only 20% of its pre-fire value, scores above 1. Where R80P equals 1, the burned area has regained 80% of its pre-fire level, not 80% of its loss. The reference shift over 2023–2026 is reported so that readers can judge how much of any recovery fraction reflects movement of the reference. All burned-area metrics were also computed within each severity class.
Because severity classes do not equalise composition (a lightly burned pixel in the park is usually broadleaved, in the managed forest often pine), recovery was finally stratified jointly by 2019 stand type and severity class. For this analysis, the severity polygons were intersected with the stand polygons, each piece was compared with the reference-ring pixels of the same stand type in the same year, the mean pre-fire (2019–2022) deviation was subtracted, and the initial deficit, residual deficit and recovery fraction were computed for each stand type × severity cell from area-weighted means. Uncertainty was quantified by a block bootstrap that resampled stand polygons, the unit at which stand attributes and management are assigned, with replacement 1000 times (burned-area stands and reference-ring stands independently); 95% intervals are the 2.5th and 97.5th percentiles. The same bootstrap gives intervals for the stand-type severity comparison of Section 3.3.
2.7. Management History from the Landsat Record
Landsat was used for this purpose only because the Sentinel-2 record does not extend before 2017; all severity and recovery analyses use Sentinel-2. To establish whether the two regimes differed in practice and not only in designation, and to check for stand-replacing disturbance before the fires, we reconstructed summer (1 July–15 September) NBR and NDVI for each burned area and its reference ring from 1985 to 2022 using Landsat 5, 7, 8 and 9 Collection 2 Level-2 surface reflectance, masking clouds and shadows with the QA_PIXEL band and compositing by median. Harvest and planting appear in such series as abrupt declines followed by multi-year recovery, and a persistently low tenth percentile or a high fraction of open-canopy pixels (NBR < 0.30) indicates partial cutting. Sensor differences were not cross-calibrated because the purpose is to compare the two sites and to detect disturbance events, not absolute values. Years in which a burned area and its reference ring dropped together were treated as scene-level artefacts of the sparse early Landsat 5 record (residual cloud, haze or stratospheric aerosol) rather than as disturbance; such artefacts affect the whole scene and are recognised by their equal appearance in the unburned ring.
2.8. Inference
Each management regime is represented by one fire. Pixels within a fire are not independent replicates of the regime, and any test that treats them as such is pseudoreplicated. We therefore present the comparison as a natural experiment with descriptive effect sizes: class proportions, mean and percentile dNBR, deficits and recovery fractions, with pixel counts stated so that the precision of each estimate can be judged. Robustness was assessed by re-running the analysis under alternative processing choices (NIR band, post-fire window, forest mask, proximity constraint, reference definition, index and pairing) rather than by significance testing across fires, and within-fire precision is given by stand-level bootstrap intervals, which treat the stand polygon rather than the pixel as the sampling unit. Analyses were run in Google Earth Engine (Google LLC, Mountain View, CA, USA; a continuously updated cloud platform without release versions) and Python 3.12 (Python Software Foundation, Wilmington, DE, USA), with code written with the assistance of a generative AI tool and verified by the authors (see Acknowledgments); code and processed tables are archived (Data Availability Statement).
3. Results
3.1. Fire Weather
Both fires burned under light winds (Figure 2). Over the calendar days of each fire, mean wind speed at the Hadong centre was 1.63 m s−1 with a maximum of 3.72 m s−1 (21:00 on 12 March, after containment of the main front), and at Hapcheon 1.82 m s−1 with a maximum of 3.64 m s−1 (11:00 on 9 March, during active burning). Over the reported burning durations, the means were 1.29 and 1.95 m s−1 and the maxima were 2.23 and 3.64 m s−1. The 90th percentiles were 3.04 and 2.92 m s−1. Under every definition of the window, wind was below 4 m s−1 at both fires and, if anything, slightly stronger at the managed-forest fire. The station-based means in the official report (2.0 m s−1 at Hadong and 0.9 m s−1 at Hapcheon) rank the sites in the opposite order, which reflects the smoothing of valley winds by the 9 km reanalysis grid; taken together, the two sources bound both fires within the same light-wind regime. Hourly means do not resolve gusts, which were locally stronger at both fires, so these values describe the prevailing wind rather than its peaks. Wind cannot explain a higher severity at Hapcheon.
Figure 2.
Hourly wind speed, air temperature, relative humidity, vapour-pressure deficit and surface soil water from ERA5-Land at the two fire centres, March 2023. Orange shading marks the burning days of the Hapcheon fire (8–11 March) and green shading those of the Hadong fire (11–12 March); the darker band is where the two periods overlap on 11 March. The dashed horizontal line in the upper panel marks 4 m s−1.
The other components of fire weather were not identical (Table 2). Both fires burned in dry air, with the same minimum relative humidity of 28% and less than 2 mm of rain in the preceding week, but the Hapcheon fire was the warmer and drier of the two: mean air temperature over its burning days was 11.7 °C against 7.5 °C at Hadong (11.3 against 9.4 °C after adjustment to the elevation of each burned area), mean vapour-pressure deficit 0.66 against 0.37 kPa, surface soil water 0.28 against 0.33 m3 m−3, and the last rain of at least 1 mm had fallen 13 days before ignition at Hapcheon against 2 days at Hadong, although that rain was only 1.1 mm. Thirty-day antecedent precipitation was similar (25 and 29 mm). Fuel-drying conditions were therefore somewhat more favourable to fire at the managed-forest site, partly because it lies 350 m lower. This difference is addressed directly in Section 3.3, where the two forests are compared within the same stand composition: if the warmer, drier conditions at Hapcheon had driven its severity, its deciduous stands should have burned more severely than the deciduous stands at Hadong, and they did not; the argument is weaker for pine stands, because crown fire responds to vapour-pressure deficit more strongly than surface fire in leaf litter does (Section 4.3).
Table 2.
Fire weather over the burning days of each fire from ERA5-Land hourly reanalysis at the fire centre (Hadong 11–12 March, 48 h; Hapcheon 8–11 March, 96 h; KST).
3.2. Burn Severity
The two fires burned nearly the same forest area, 117.4 ha at Hadong and 121.5 ha at Hapcheon (Table 3, Figure 1), but the distribution of severity within those areas differed sharply. At Hadong, 77% of the burned area was low severity and 0.4% (0.5 ha) was high severity; moderate–high and high classes together made up 3.3%. At Hapcheon, 58% was low severity, 11.4% (13.8 ha) was high severity, and moderate–high and high classes together made up 21.5%. Mean dNBR was 0.216 at Hadong and 0.323 at Hapcheon, and the difference widened in the upper tail: the 90th percentile was 0.333 versus 0.697 and the 95th percentile 0.394 versus 0.870. High-severity pixels at Hapcheon formed contiguous patches on the central and southern ridges of the burn (Figure 1b), whereas at Hadong, they were isolated cells.
Table 3.
Burn severity classes in the two fires (Sentinel-2, B8A, immediate post-fire pairing, phenology-independent forest mask). Thresholds after Key and Benson [25]. Area in ha with the share of the burned area in parentheses; one 20 m pixel is 0.04 ha.
3.3. Robustness to Index, Pairing and Composition
The direction of the difference did not depend on how severity was measured, but its magnitude did (Table 4). Under RBR, which corrects for the low pre-fire NBR of leafless canopy, the mean was 0.184 at Hadong and 0.229 at Hapcheon, and the share above the high-severity RBR threshold of 0.27 was 12.2% versus 27.0%. Under leaf-on anniversary pairing, which registers canopy mortality that becomes visible only after leaf-out, mean dNBR was 0.214 versus 0.450, the median 0.084 versus 0.421, and the high-severity share 9.9% (11.6 ha) versus 24.9% (30.2 ha). The anniversary median of 0.084 at Hadong is below the low-severity threshold: most of the national park’s burned area was spectrally indistinguishable from unburned forest by the following June, which is the signature of a surface fire beneath a canopy that survived and leafed out. The ratio of high-severity shares between the fires was therefore 28 under immediate pairing and 2.2–2.5 under the two phenology-corrected measures. We regard the immediate pairing as the appropriate basis for delineating the burned area and the anniversary pairing as the appropriate basis for canopy mortality; on either basis, the managed forest had two to three times the share of severely burned area, over a nearly identical burned area.
Table 4.
Sensitivity of the severity comparison to index and image pairing (burned areas of Table 3).
Stratifying by the stand map separated two contributions (Table 5). Broadleaved stands burned alike at the two sites (mean dNBR 0.212 at Hadong and 0.206 at Hapcheon; high-severity share 0.1% and 0.8%), and oak stands in particular burned no more severely in the managed forest (0.225 versus 0.181). Pine stands did not: mean dNBR was 0.245 in the national park’s pines and 0.371 in the managed forest’s, with stand-level bootstrap intervals of 0.19–0.29 and 0.28–0.46 that overlapped slightly, while the high-severity share was 2.3% (0–4.6%) against 17.7% (6.5–28.4%); mixed stands showed the same contrast (0.200 versus 0.346; 0% versus 7.9%). The managed forest was 57% pine and the national park was 14% conifer, so the compositional legacy of management and the behaviour of managed pine stands both contributed. Within the managed forest, severity peaked in age class 4 (31–40 years; mean dNBR 0.365, high-severity 18.2%) and was lower in class 5 (0.302, 7.9%); in the national park, 79% of the burn was class 5 with a high-severity share of 0.5%. Crown density was class C (dense) over 94–97% of both burns, so density does not separate the sites.
Table 5.
Burn severity within forest type and species group of the 2019 stand map (area-weighted; pixel counts from intersected area). Brackets give 95% stand-level bootstrap intervals for the forest-type rows.
The continuous composition proxy gave the same picture (Table 6, Figure 3). The burned areas differed strongly in composition: 53% of Hapcheon pixels but only 7% of Hadong pixels fell in the most evergreen class (leaf-off NBR ≥ 0.40), whereas 68% of Hadong pixels and 17% of Hapcheon pixels fell in the two most deciduous classes. In the three most deciduous classes, mean dNBR was practically identical between fires (0.172 versus 0.190, 0.234 versus 0.227, 0.235 versus 0.246), and high-severity pixels were absent or rare (0–1.0%). Severity rose with evergreen fraction at both sites, but more steeply in the managed forest: in the most evergreen class, mean dNBR was 0.278 at Hadong and 0.390 at Hapcheon, their high-severity share was 5.4% versus 19.4%, and their anniversary dNBR was 0.430 versus 0.542. The whole-fire severity gap thus reflected partly the evergreen-dominated composition of the managed forest and partly its higher severity even within evergreen stands. The Hadong evergreen class comprised 239 pixels, so the within-class comparison rests on a modest sample at that site.
Table 6.
Burn severity within classes of pre-fire (leaf-off) NBR, a continuous proxy for evergreen fraction.
Figure 3.
Burn severity within the same pre-fire composition class: mean dNBR, mean RBR and high-severity share by class of pre-fire leaf-off NBR.
Terrain did not favour the national park (Table 1, Appendix B). The Hadong burn lay at a mean elevation of 618 m on slopes averaging 31.7°, with 72% of pixels facing east, south-east or south; the Hapcheon burn lay at 269 m on slopes averaging 22.9° with a more even aspect distribution. Steeper and sun-facing slopes favour fire spread and intensity, so the national park burned less severely despite terrain that was more conducive to severe fire. In the three elevation–slope strata shared by both fires (300–400 m, 25–40°), mean dNBR was 0.167 at Hadong and 0.343 at Hapcheon, and their high-severity share was 0% versus 7–12%, although only 203 Hadong pixels fell in these strata.
3.4. Post-Fire Recovery
The composition-weighted reference ring was a valid control (Figure 4). Before fire, the spring deviation of the burned area from its reference lay between +0.007 and +0.037 in NBR at both sites over 2019–2022 (mean +0.029 at Hadong and +0.013 at Hapcheon), with similar small positive values in NDVI and NDMI; the burned stands were marginally denser than their surroundings but tracked them year by year. In spring 2023, the deviation fell to −0.176 at Hadong and −0.435 at Hapcheon in NBR, −0.113 and −0.299 in NDVI, and −0.141 and −0.336 in NDMI. The two trajectories then diverged (Figure 4): by spring 2026, the NBR deviation had narrowed to −0.067 at Hadong but remained at −0.228 at Hapcheon, and the summer series showed the same ordering in every year.
Figure 4.
Deviation of the burned area from the composition-weighted unburned reference ring (spring composites, 2019–2026) for NBR, NDVI and NDMI.
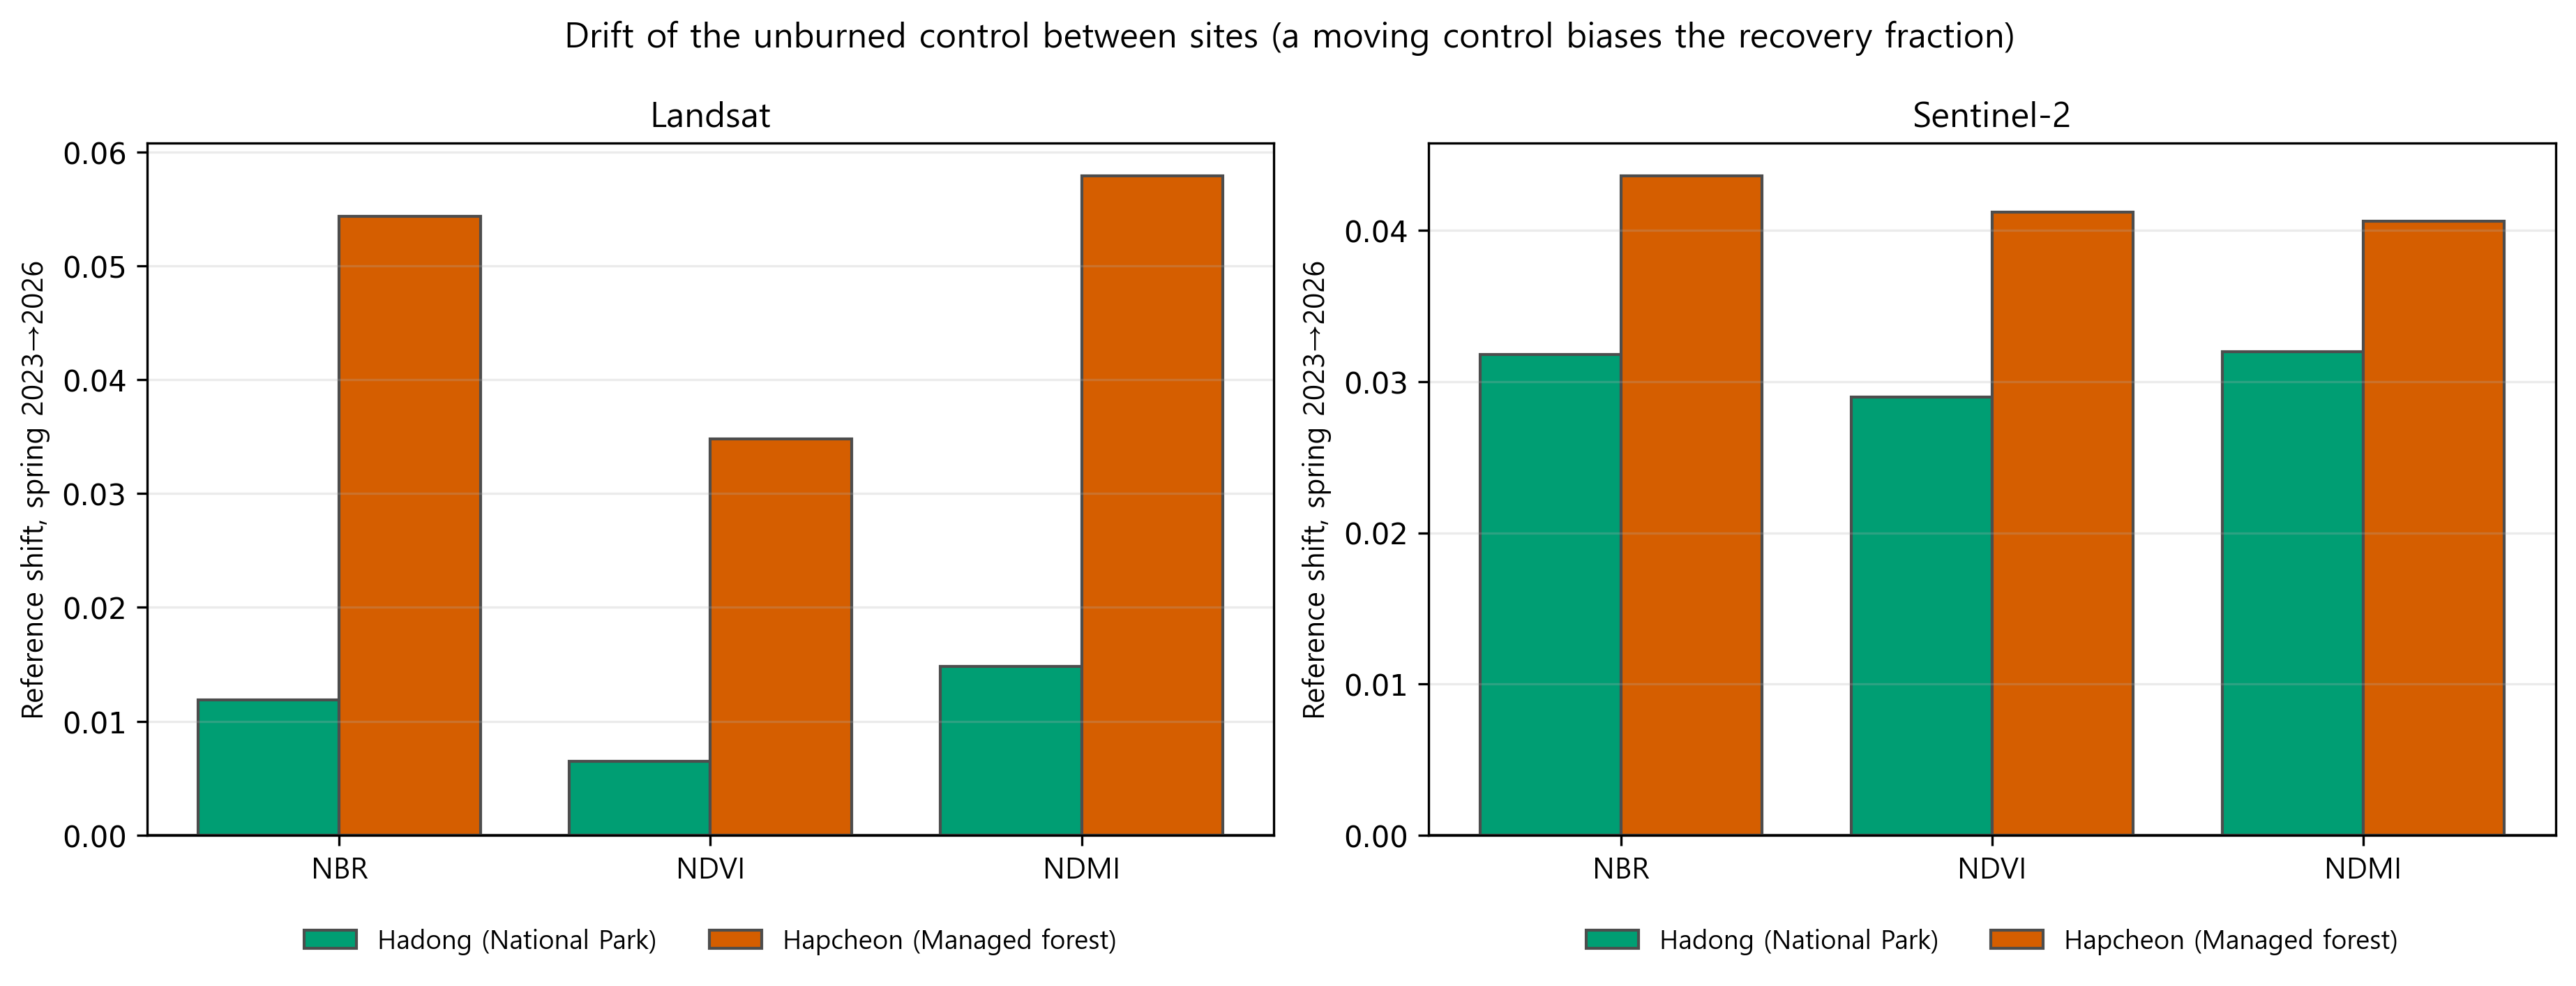
Table 7 summarises the recovery metrics. The recovery fraction was higher at Hadong for every index (62% versus 48% in NBR, 76% versus 60% in NDVI, 52% versus 40% in NDMI). Subtracting the pre-fire offset narrowed the gap in the fraction (53% versus 46% in NBR), because the Hadong offset was larger, and we therefore do not rest the comparison on the fraction alone. The residual deficit in 2026 was 2.5 times larger at Hapcheon in NBR (0.241 versus 0.096 after offset correction), 2.6 times in NDVI and 2.3 times in NDMI, but this largely mirrors the 2.5-fold larger initial loss: as a share of the initial deficit, the residual was 47% at Hadong and 54% at Hapcheon. R80P exceeded 1 at Hadong for all three indices (1.15, 1.23, 1.07), meaning that the national park had regained more than 80% of its 2019–2022 level in NBR, NDVI and NDMI, whereas at Hapcheon, it was below 1 for NBR (0.86) and NDMI (0.64) and above 1 only for NDVI (1.13); R80P describes the state attained and is likewise conditioned by the size of the loss. The relative recovery indicator ranked the sites the same way for all indices (NBR 0.71 versus 0.56). Whole-burn metrics therefore establish that the managed forest remained much further from its pre-fire state three years after fire; whether it also recovered more slowly per unit of loss is a separate question, answered by stratification in Section 3.5. The absolute annual gain was larger at Hapcheon (NBR +0.083 versus +0.047 per year) because its loss had been much larger; this is the expected consequence of a larger distance to recover and does not indicate faster relative recovery. The reference itself rose by 0.03–0.04 in NBR at both sites over 2023–2026, a general greening that affected both comparisons equally.
Table 7.
Recovery metrics from spring composites, 2023–2026, relative to the composition-weighted reference ring and to the 2019–2022 pre-fire mean.
3.5. Recovery Within Severity Classes and Stand Types
Because the managed forest burned more severely, part of its slower recovery could reflect the dependence of recovery on severity. Stratifying by severity class alone (Table 8, Figure 5) left the national park ahead in every class, but the stand-level bootstrap intervals overlap in three of the four classes, and the classes do not hold composition constant: a lightly burned pixel in the park is almost always broadleaved, whereas in the managed forest, half of the lightly burned pixels are pine.
Table 8.
NBR recovery by severity class (spring composites, 2023–2026), each pixel referenced to unburned stands of its own type, with the pre-fire offset removed. Brackets give 95% stand-level bootstrap intervals; Park = Hadong, Managed = Hapcheon.
Figure 5.
Spring NBR trajectories of the burned area by severity class, with the composition-weighted unburned reference (weighted to the composition of the low-severity class), 2021–2026.
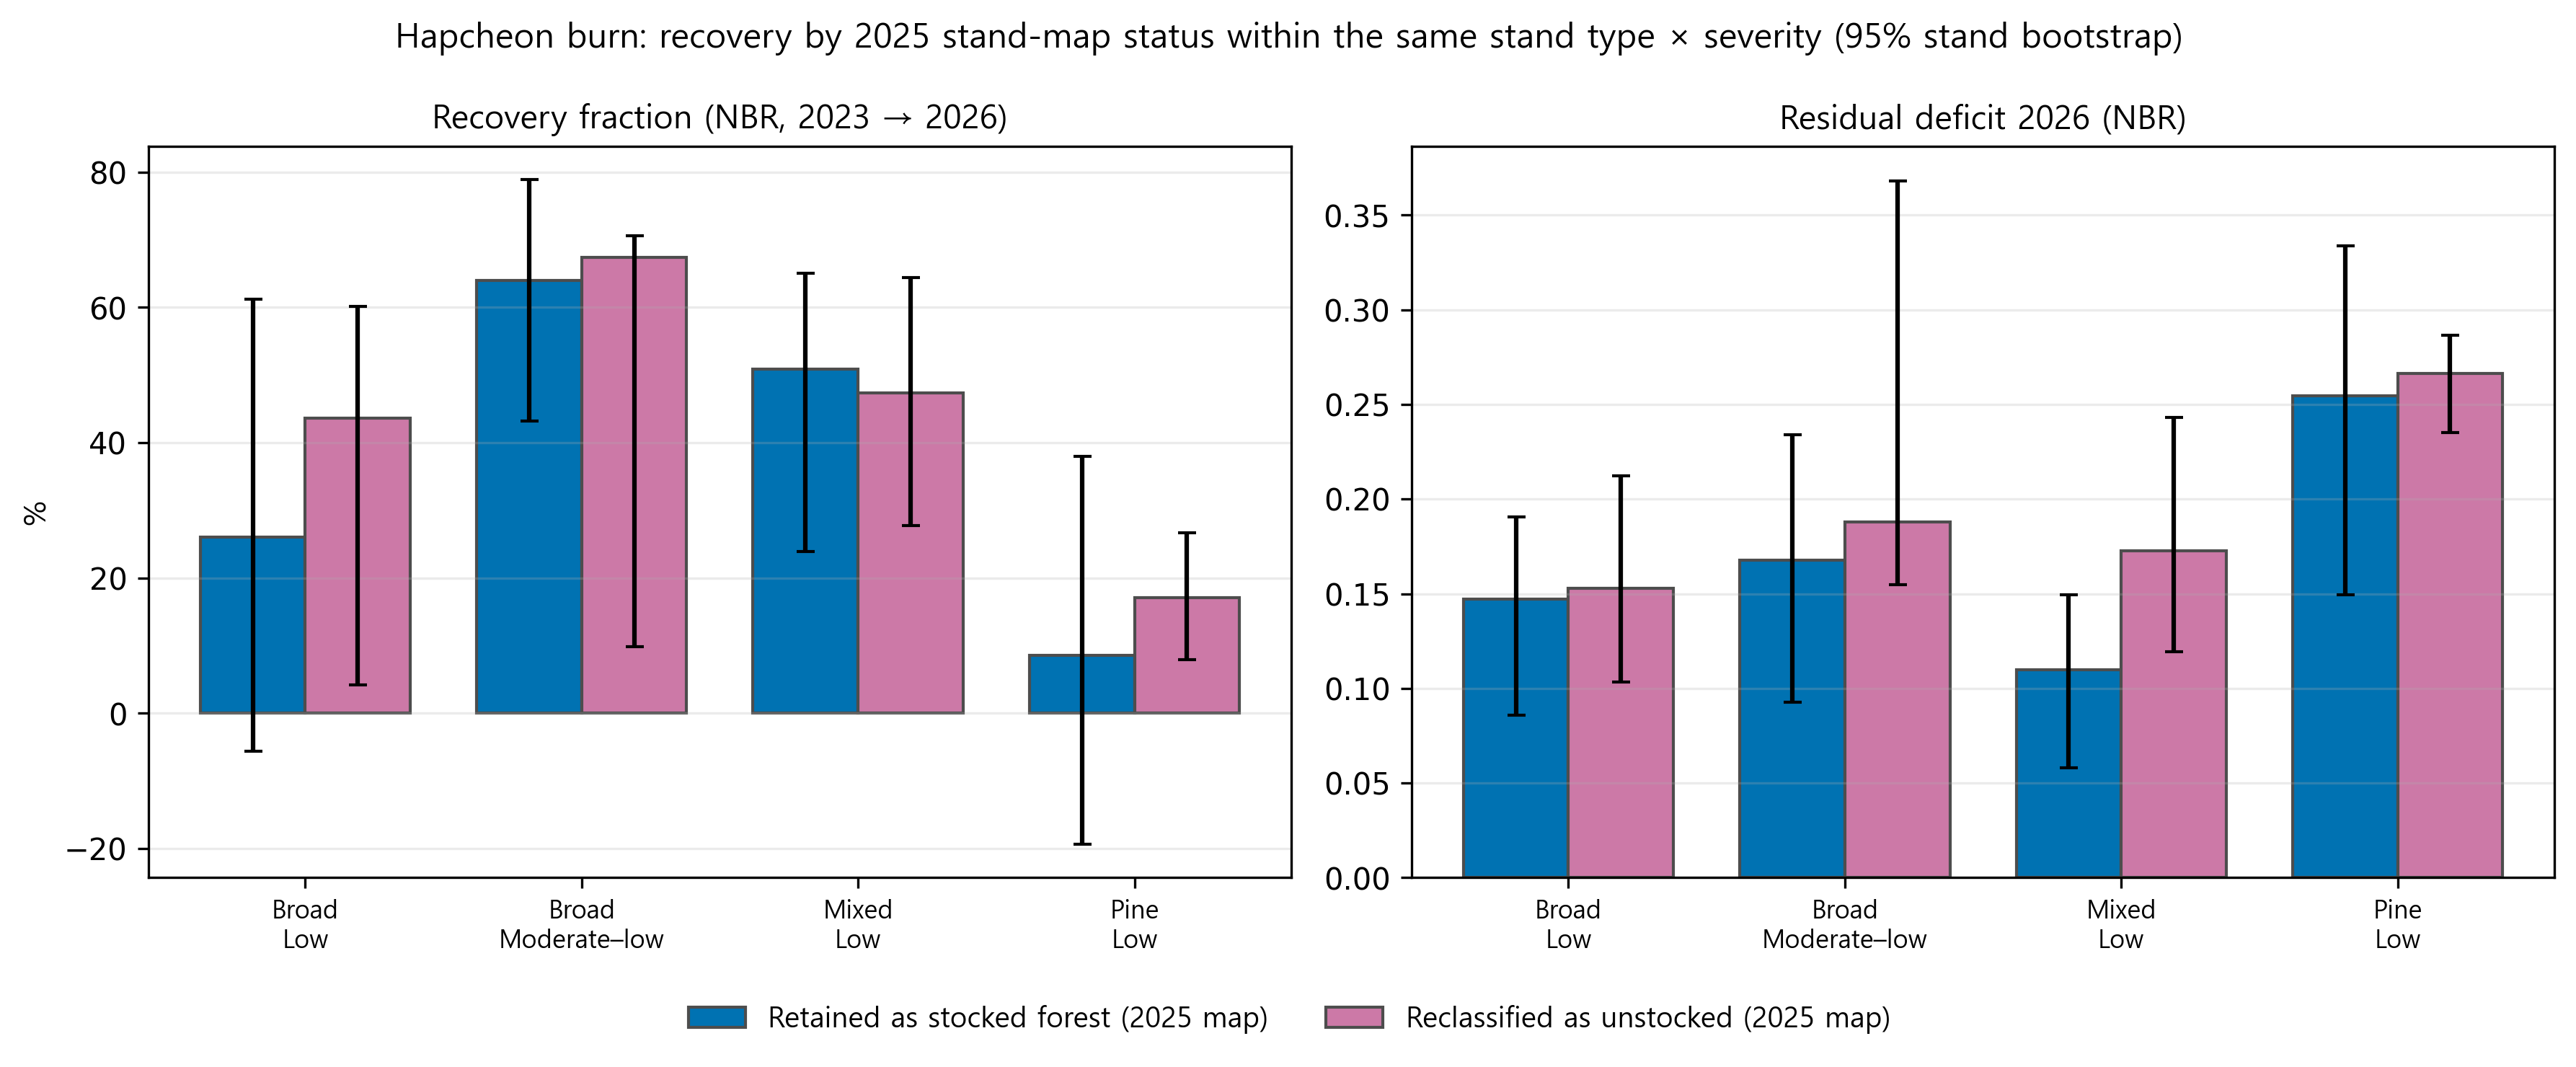
Stratifying jointly by stand type and severity class separated the two (Table 9, Figure 6). Broadleaved and mixed stands recovered alike at the two sites: in the moderate–low class, the recovery fraction was 70% (65–75) at Hadong, 66% (49–73) at Hapcheon for broadleaved stands, and 69% (61–72) against 68% (53–75) for mixed stands; in the low class, the intervals overlapped entirely, although the residual deficit of lightly burned broadleaved stands was larger at Hapcheon (0.149 against 0.066). Pine stands recovered more slowly than broadleaved stands at both sites, and it is in pine that the sites differed. Lightly burned pine in the managed forest had regained 17% (7–26) of its deficit by 2026 against 32% (4–43) in the park; the two intervals overlap, but its residual deficit of 0.266 (0.236–0.290) exceeded the park’s 0.169 (0.130–0.204) without overlap. In the moderate–low class, the two were similar (52% against 56%); in the high class, the managed forest’s 303 pixels had regained 52% (39–59) against 70% for the park’s nine pixels, which are too few to weigh. NDVI and NDMI gave the same pattern, with the largest within-type contrast again in lightly burned pine (NDMI 11% against 26%). The whole-burn recovery gap therefore arose mainly from composition, because the managed forest consisted largely of pine and pine recovered slowly at both sites, and secondarily from the poorer recovery of the managed forest’s lightly burned pine; where the two forests were compositionally alike, they recovered alike.
Table 9.
NBR recovery within the same 2019 stand type and severity class (spring 2023–2026; type-specific reference; pre-fire offset removed). Cells with at least 20 pixels at both sites, plus the pine–high cell (nine pixels at Hadong), which is listed for completeness but not interpreted (Section 3.5); brackets give 95% stand-level bootstrap intervals; Park = Hadong, Managed = Hapcheon.
Figure 6.
Recovery fraction and residual deficit of NBR (spring 2023–2026) within the same stand type and severity class at the two sites, with 95% stand-level bootstrap intervals (the cells of Table 9 with at least 20 pixels at both sites).
3.6. Management History and Post-Fire Stand Status
The Landsat record showed no stand-replacing disturbance at either site between 1985 and 2022 (Figure 7). Outside the two artefact years discussed below, summer NBR of the Hapcheon burned area remained between 0.63 and 0.72, the fraction of open-canopy pixels (NBR < 0.30) never exceeded 0.6%, and the tenth percentile stayed above 0.56; the Hadong burned area remained between 0.66 and 0.81 with no open-canopy pixels. In two years, values fell abruptly and recovered the next year: at Hadong in 1990 and at both sites in 1992, the reference ring fell as much as or more than the burned area in each case (Figure 7, open markers). A drop shared by a burned area and the 200 ha of unburned forest around it is a property of the scenes, not of the stands. The 1992 composites fall within the period of stratospheric aerosol loading that followed the June 1991 eruption of Mount Pinatubo, which depressed vegetation indices in satellite records worldwide [40], and the 1990 Hadong composite, built from six partly hazy scenes, shows the same signature in its ring (open-canopy fraction 32% in the ring against 24% in the burned area). These years are marked as artefacts in Figure 7 and excluded from the ranges quoted here. Throughout the 38 years, the Hapcheon burned area had a lower mean and a lower tenth percentile than Hadong, consistent with an evergreen pine canopy of lower summer NBR and greater within-stand heterogeneity, and both burned areas tracked their reference rings closely, with the Hadong area running 0.01–0.02 above its ring in most years as it did in the Sentinel-2 series.
Figure 7.
Summer NBR of the two burned areas (solid) and their reference rings (dashed) reconstructed from Landsat 5, 7, 8 and 9, 1985–2022, with the tenth percentile of burned-area NBR and the fraction of open-canopy pixels. Open markers, dotted segments and grey bands mark scene-level artefacts (occurring at Hadong in 1990 and at both sites in 1992;), which appear equally in the reference rings and are not disturbance.
The stand map corroborates the record. The 2019 edition shows the Hadong burn as 78.5% broadleaved, 13.6% coniferous and 7.0% mixed forest, almost entirely in age class 5, and the Hapcheon burn as 57.0% Korean red pine, 24.9% broadleaved and 15.1% mixed in age classes 4 and 5; the pine stands were therefore 31–50 years old in 2019, which places their establishment in the 1970s, the peak of the national reforestation programme. The 2024 edition, compiled from surveys up to 2024, records no change in either burn. The 2025 edition, however, reclassifies 92.8 ha (77%) of the Hapcheon burn from stocked forest to unstocked land, updated in 2025, comprising 67.4 ha of former pine, 17.4 ha of mixed and 8.0 ha of broadleaved stands; the Hadong burn remains 100% stocked forest in the same edition, and the reference rings of both sites are unchanged (98.2% stocked at Hapcheon). The national survey thus recorded a transition to unstocked status over more than three-quarters of the managed-forest burn, whereas the national-park burn remained classified as stocked forest. The reclassified area exceeds the area of moderate–high and high severity under anniversary pairing (about one-third of the burn), and its composition shows why: the reclassification tracked species more closely than severity (Table A5). Of the pine stands in the burn, 98% (66.8 of 68.4 ha) were reclassified as unstocked, including 96% of the lightly burned pine (32.9 of 34.4 ha), compared with 92% of the mixed stands (16.7 of 18.1 ha) and only 19% of the broadleaved stands (5.6 of 29.7 ha), although broadleaved stands had burned at low severity just as the lightly burned pine had. If reclassification primarily reflected fire mortality, a stronger correspondence with burn severity would be expected; the observed association with stand type is also consistent with selective post-fire management. The map pattern is therefore consistent with substantial post-fire clearance of pine stands, as expected under standard Korea Forest Service practice for fire-damaged pine [1], although the map alone cannot establish that every reclassified stand was cut, and the timing is known only to the 2025 update. The summer Sentinel-2 series gives no spectral evidence of clearing: within the area later mapped as unstocked, the fraction of bare pixels (NDVI < 0.30) was 17.3% in summer 2023, immediately after the fire, and fell to 2.6%, 2.1% and 1.7% in 2024, 2025 and 2026, while NBR and NDVI rose monotonically; removal of standing stems without soil disturbance would leave little signature at 20 m and is not excluded (Appendix D).
Within the Hapcheon burn, reclassified and retained stands of the same type and severity recovered alike where both existed (broadleaved, low severity: 44% against 26% of the NBR deficit regained, with widely overlapping intervals; mixed, low severity: 47% against 51%; Figure A5), so the reclassification itself did not mark a subset of stands that recovered worse than their untreated neighbours. Because only 1.5 ha of Hapcheon pine remained classified as stocked, a reliable within-site comparison between reclassified and retained pine was not possible. The cross-site comparison of Section 3.5 therefore contrasts Hapcheon pine, almost all of which was reclassified as unstocked, with Hadong pine, which remained classified as stocked. Its trajectory is consistent with that contrast: lightly burned pine at Hapcheon showed no recovery in the first year (NBR deviation −0.32 in 2023 and −0.33 in 2024) and then regained slowly (−0.28, −0.27), whereas lightly burned pine at Hadong also paused in 2024 (−0.25, −0.24) but then regained more (−0.22, −0.17).
Two conclusions follow. The compositional contrast between the sites was already established by 1985 and is the legacy of the reforestation era rather than of recent planting; and whatever management was applied to the Hapcheon forest after 1985 did not produce the stand-replacing spectral signature detectable in the 30 m summer composites; no stand-replacing harvest was detected. The satellite record therefore cannot by itself document the intensity of recent tending, which rests on the site’s designation and management records; what it does establish is that both forests had been free of stand-replacing disturbance for at least four decades before the fires, which strengthens their comparability.
4. Discussion
4.1. Why the Managed Forest Burned More Severely
The two fires shared their season, their synoptic weather and, within a few hectares, their burned forest area; the managed-forest fire burned in somewhat warmer and drier air, and terrain favoured more severe fire in the national park; and yet the managed forest had two to three times the severely burned share under phenology-corrected measures, as well as a high-severity share of 11.4% against 0.4% under immediate assessment. The composition stratification indicates that stand composition contributed importantly to the observed severity contrast. In deciduous-dominated stands, where the two forests were compositionally alike, they burned alike, as surface fires that left the canopy intact. This within-composition equality is also the main evidence that the warmer, drier conditions at Hapcheon did not drive the difference in deciduous stands: deciduous fuels at Hapcheon burned no more severely than deciduous fuels at Hadong. For pine, which is more sensitive to atmospheric dryness, the argument is weaker and a meteorological contribution cannot be excluded (Section 4.3). The managed forest differed in having half its area in evergreen pine stands, and in those stands fire climbed into the canopy. Korean red pine stands can carry substantial crown fuel, and field studies in Korea show that canopy bulk density and canopy base height are directly relevant to crown-fire potential [41]; fuel-treatment effectiveness also depends on stand structure and landscape context [42]. Broadleaved and mixed stands, by contrast, hold more moisture in litter and canopy and resist crown fire [43]. The pine stands at Hapcheon were established during the reforestation programme of the 1960s–1970s and have been maintained as pine since, so the composition that burned is a product of management even though the planting itself predates the satellite record. In this paired comparison, the managed regime was not associated with lower severity; much of the observed contrast coincided with the greater extent of pine-dominated stands at Hapcheon.
The second finding, that within the evergreen class the managed forest still burned more severely, indicates that composition is not the whole explanation. The Hadong evergreen pixels occur mainly as ridge-top pine embedded within a deciduous matrix, whereas the Hapcheon evergreen pixels form more contiguous, relatively even-aged pine stands. Thinning and understorey removal are intended to reduce ladder fuels and crown-fire potential, and do so where they are designed for that purpose [5,44]; where they leave a uniform pine canopy over an opened, sun-exposed surface, they can also dry the surface fuel and remove the broadleaved shrubs that moderate the understorey microclimate. Which of these effects operated in the Hapcheon stands cannot be established without treatment records; what the data show is that pine in the managed forest burned more severely than the scattered ridge-top pine of the park. The Sancheong analysis found the same pattern on a much larger sample: the national park burned less severely than the managed forest within identical terrain strata, and the effect of management was not explained by species composition alone [4]. Two independent fires in two years, in the same national park, point the same way.
Containment duration differed between the two fires, but it should not be interpreted as a rate of fire spread because it also reflects suppression effort, access, mop-up and re-ignition. At Hapcheon, the main front was initially contained after approximately 20 h but subsequently re-ignited, and final containment was reported 67 h after ignition; at Hadong, containment was reported after 27 h. We therefore treat containment duration as contextual information rather than as an independent measure of fire behaviour. Suppression effort was not measured systematically and remains an unquantified difference between the two events.
4.2. Why It Recovered More Slowly
The recovery difference should be read against the post-fire status recorded by the national survey: three-quarters of the managed-forest burn was reclassified as unstocked land by 2025, whereas the national-park burn remained classified as stocked forest. The two sites therefore differed not only in burn severity but also in their post-fire stand status. The joint stratification clarifies how the recovery contrast varied by stand type and severity. Where the two forests were compositionally alike they recovered alike: broadleaved and mixed stands regained the same share of their loss at the two sites within the bootstrap intervals. Pine recovered more slowly than broadleaved forest at both sites, and the managed forest was mostly pine. The recovery gap was therefore strongly associated with the compositional contrast between the sites: pine showed slower spectral recovery than broadleaved and mixed stands, and pine occupied a much larger share of the managed forest. Several biological mechanisms may contribute to the slower spectral recovery observed in pine. Korean oaks and most temperate broadleaved species resprout vigorously from the stump and root collar after top-kill [45,46,47], so canopy loss is followed within one season by dense regrowth from an intact root system; pine does not resprout and depends on surviving trees and on seed. A multi-layered broadleaved stand also retains seed sources and shade after surface fire, and its soil is less affected: recent Korean measurements show that severe crown fire creates strong water repellency in the top 5 cm of soil and increases runoff and erosion, whereas surface fire leaves the litter layer to protect the soil [48]. The largest whole-burn recovery gap between the sites was in NDMI, the index most sensitive to canopy water content, indicating that canopy moisture recovered most slowly in the managed forest.
A second, smaller component is specific to the managed forest’s pine, and it points to what happened after the fire rather than during it. Lightly burned pine at Hapcheon regained about half as much of its deficit as lightly burned pine at Hadong (17% against 32%), although the intervals of the two fractions overlap; its residual deficit was larger without overlap, partly because its initial deficit was also larger, and moderately burned pine recovered alike at the two sites. Lightly burned pine is precisely the stand type whose fate depends on post-fire treatment: a scorched canopy may recover, die or be cut. The 2025 stand map reclassified 96% of the lightly burned pine at Hapcheon as unstocked while retaining the lightly burned broadleaved stands beside it, a species-based pattern that is not readily explained by burn severity alone and is consistent with selective post-fire management of fire-damaged pine [1]; the Hadong burn remained classified as stocked forest and is not subject to commercial silviculture, and its lightly burned pine regained roughly twice the share of its loss. One plausible interpretation is that the poorer spectral recovery of lightly burned Hapcheon pine partly reflects post-fire removal of pine stands. Clearance itself lowers spectral indices, however, so this comparison reflects the short-term spectral trajectory, not long-term stand development. Two qualifications apply. Delayed mortality of scorched pine over the following seasons [33] could contribute, and would also be greater in a contiguous even-aged stand with few broadleaves to fill gaps than in the park’s ridge-top pines within a resprouting broadleaved matrix; and the satellite series cannot separate cutting from mortality, because removal of standing stems leaves little signature at 20 m and no soil-exposing clearance was detected. These post-fire differences are nevertheless part of the management regimes being compared: Hapcheon likely underwent substantial post-fire pine removal, whereas the Hadong burn remained stocked and was allowed to recover without commercial silvicultural intervention. The same asymmetry between salvaged and untreated stands appears in the northern Japanese record, where stands left to regenerate naturally after disturbance recovered a mixed canopy that salvaged and planted stands did not [9], in the Greater Hinggan Mountains, where natural regeneration outpaced planting for three decades [12], and in a Siberian national park, where planted seedlings survived but stalled in the most severely burned areas [49].
4.3. What the Design Can and Cannot Establish
A comparison of two fires cannot establish a causal effect of management in the statistical sense. Its strength lies elsewhere: the treatment is not confounded with season or synoptic weather, the outcome is measured identically at both sites, and the mechanisms proposed to explain the difference are tested within the data. Stratifying by composition, by terrain, and by severity class tested three alternative explanations of the severity difference, and the difference persisted under each; the joint stratification of recovery located the recovery difference in the composition that management had produced and in the managed forest’s pine. Unmeasured site differences may nevertheless have contributed to the observed contrast, and the paired design cannot exclude such factors. The Landsat record (Section 3.6) shows that neither forest experienced stand-replacing disturbance after 1985, so the difference cannot be attributed to a recent harvest or planting at either site. The record does not document the intensity of tending at Hapcheon, which rests on the site’s designation, on the stand map’s record of 31–50-year-old planted pine, and on management records that we were not able to obtain. The measured differences in elevation and fire weather are addressed below.
The design nevertheless has limits. First, replication at the treatment level is one, and effect sizes rather than tests are reported for that reason [50]. Second, the two burned areas differ in elevation by 350 m, and the reanalysis shows that the managed-forest fire burned in air about 2 °C warmer and with nearly twice the vapour-pressure deficit, which could raise fire intensity independently of management; the steeper, sun-facing terrain of the national park works the other way, the shared-strata comparison agrees with the whole-fire result, and the within-composition comparison shows no effect of the drier conditions on deciduous fuels. That last argument does not fully extend to pine: surface fire in leaf litter is governed mainly by litter moisture, which the equal minimum humidity suggests was similar, whereas crown fire in pine responds to vapour-pressure deficit, so part of the difference between the two pine strata (0.25 against 0.37) may be meteorological. The weather difference cannot be removed by design and is reported as such. Suppression effort and ground access, which may have differed between a roaded production forest and a steep park interior, were not measured and are a further unquantified difference. Third, reported containment duration differed between the fires, but these durations include suppression, mop-up and, at Hapcheon, re-ignition; they therefore cannot be interpreted as comparable measures of active fire spread or residence time. Fourth, dNBR in spring deciduous forest is compressed by leaf-off phenology; we addressed this with RBR, anniversary pairing and a phenology-independent forest mask, and the direction of the difference survived every alternative, but its magnitude depends on the measure, and we have reported the range rather than a single ratio. Fifth, the Key and Benson thresholds were not calibrated to field observation here; they serve for comparison between sites, not as ecological classes. Sixth, the management contrast is documented by designation, by the stand map and by the compositional legacy visible in the imagery, not by stand-level treatment records, and the recent tending history of the Hapcheon stands should be verified against Korea Forest Service records. Seventh, post-fire treatment of the managed-forest burn is known only from its reclassification as unstocked land in the 2025 stand map; the species-based pattern of that reclassification is consistent with substantial post-fire clearing, but whether individual stands were cut, as well as when, is not recorded, and virtually no Hapcheon pine remained classified as stocked to serve as an internal control. The recovery comparison therefore evaluates the management regime as a whole, including its post-fire treatment, rather than fire alone. Eighth, the reference ring, although composition-weighted, is not the burned stand itself, and its 3–4% rise over 2023–2026 shows that unburned forest was itself changing; we therefore emphasise R80P, which uses only the burned area’s own pre-fire level, and the residual deficit, which needs no normalisation. Ninth, recovery is measured spectrally. The indices register the return of green and moisture-related spectral signals, and the 2025 stand map records only whether a stand met the stocking standard; neither the indices nor the stand map can determine whether the recovered signal represents tree regeneration, resprouting shrubs or other understorey vegetation, nor can they quantify stem density or stand structure. The distinction matters for the long-term outcome, because a stand that has resprouted to shrub cover and one regenerating as forest will differ structurally for decades. Field plots in the two burns, recording species, stem density and height by stand type and severity class would resolve this and are a necessary complement to the spectral record.
4.4. Implications for Management
The results have implications for three aspects of current practice. First, this paired comparison does not support the expectation that a managed, roaded forest will necessarily experience lower burn severity: the managed site burned more severely. Second, the slower spectral recovery of pine relative to broadleaved and mixed stands suggests that pine-dominated composition can constrain short-term post-fire return. Third, the poorer spectral recovery of lightly burned Hapcheon pine, most of which was reclassified as unstocked by 2025, suggests caution against assuming that routine post-fire clearance will accelerate recovery, at least over the three-year spectral record. These findings apply to temperate humid forests with a resprouting broadleaved component and should not be generalised directly to dry conifer systems, where natural regeneration after high-severity fire frequently fails and regeneration constraints differ substantially [51,52]. In the Korean context, the results support evaluating greater structural and compositional diversity as part of fire-resilience planning [4,53].
For managed forests that will remain in production, the two fires suggest specific measures, offered as hypotheses consistent with these data rather than as tested prescriptions. Before fire, increasing broadleaved admixture may help interrupt the continuity of even-aged pine. In our stand classification, stands with at least 25% broadleaved representation entered the mixed category, which showed lower severity and stronger spectral recovery than pine-dominated stands in this study. Broadleaved belts along ridges and drainage lines could likewise reduce the spatial continuity of pine-dominated canopy, and where the understorey is removed for tending, retaining the broadleaved shrub layer may help moderate surface fuel moisture [42,43]. After fire, managers could consider delaying clearance of lightly burned pine until post-fire survival can be assessed, given that lightly burned pine at Hadong regained approximately one-third of its spectral deficit over three years without commercial silvicultural intervention; retaining broadleaved resprouters wherever they occur; avoiding soil-disturbing site preparation on steep slopes, where post-fire erosion is greatest [48]; and prioritising active planting where severe canopy loss coincides with limited natural regeneration or seed availability, using mixed rather than pure pine stock [8,9]. For new plantations, mixed-species designs with a broadleaved admixture, smaller even-aged blocks separated by broadleaved strips, and longer rotations that allow structural heterogeneity to develop would address the stand structure that was associated with high severity at Hapcheon. These options may involve production trade-offs that should be evaluated against their potential benefits for fire resistance and post-fire recovery.
5. Conclusions
Two wildfires that ignited three days apart, 54 km apart, under similarly light mean winds, burned nearly equal areas of forest with very different outcomes. The naturally regenerating national park forest was dominated by low-severity burning; the managed production forest lost canopy over a fifth to a quarter of its area. The severity contrast was associated partly with the much larger extent of evergreen pine in the managed forest and persisted within the evergreen stratum. Terrain did not explain the observed direction of the severity contrast in the stratified comparison. Three years later the national park had regained at least 80% of its pre-fire NBR, NDVI and NDMI levels; the managed forest remained below this level for NBR and NDMI, and its residual deficit was 2.5 times larger, reflecting its deeper initial loss. Where the two forests were compositionally alike, they showed similar spectral recovery. The managed forest’s slower spectral return was associated with its pine-dominated composition: pine showed slower spectral recovery than broadleaved and mixed stands at both sites, and lightly burned Hapcheon pine, most of which was reclassified as unstocked after the fire, regained about half the share of its spectral deficit regained by Hadong pine, although the intervals of the two estimates overlapped. In this paired comparison, the managed forest showed lower fire resistance and slower spectral recovery than the national park forest; both patterns were associated with its pine-dominated composition, while the recovery contrast was further associated with the post-fire reclassification of most pine stands as unstocked. For temperate humid forests with a resprouting broadleaved component, these results support considering greater structural and compositional diversity, rather than relying primarily on pine-focused tending, as part of strategies to enhance fire resistance and post-fire recovery.
Author Contributions
Conceptualisation, S.-H.H. and M.-Y.A.; methodology, S.-H.H. and M.-Y.A.; software, M.-Y.A.; validation, S.-H.H. and M.-Y.A.; formal analysis, M.-Y.A.; investigation, S.-H.H. and M.-Y.A.; data curation, M.-Y.A.; writing—original draft preparation, M.-Y.A.; writing—review and editing, S.-H.H. and M.-Y.A.; visualisation, M.-Y.A.; supervision, S.-H.H.; project administration, S.-H.H. All authors have read and agreed to the published version of the manuscript.
Funding
This research received no external funding.
Institutional Review Board Statement
Not applicable.
Informed Consent Statement
Not applicable.
Data Availability Statement
Processed tables, burned-area and reference-ring definitions, the stand-map subsets clipped to the two study areas, and all Google Earth Engine and Python scripts are archived at Zenodo (https://doi.org/10.5281/zenodo.22402774). Sentinel-2, Landsat, ERA5-Land, ESA WorldCover and ALOS World 3D data are publicly available through Google Earth Engine, and the 1:5000 forest stand map is publicly available from the Korea Forest Service Forest Geographic Information System (https://fgis.forest.go.kr (accessed on 5 September 2026)).
Acknowledgments
During the preparation of this work the authors used a generative AI assistant (Claude Opus 5.5; Anthropic, San Francisco, CA, USA) to help write and debug the analysis code and to draft and edit text. The authors reviewed and verified all code, results and text and take full responsibility for the content of the publication.
Conflicts of Interest
The authors declare no conflicts of interest.
Appendix A. Sensitivity of the Burned Area and Severity to Processing Choices
Table A1.
Burned area and high-severity share under alternative processing choices (Sentinel-2, immediate pairing).
Figure A1.
Sensitivity of the severity comparison to NIR band, post-fire window and proximity constraint.
Appendix B. Terrain of the Two Burned Areas
Figure A2.
Distributions of elevation, slope and aspect of burned pixels at the two sites (ALOS World 3D 30 m).
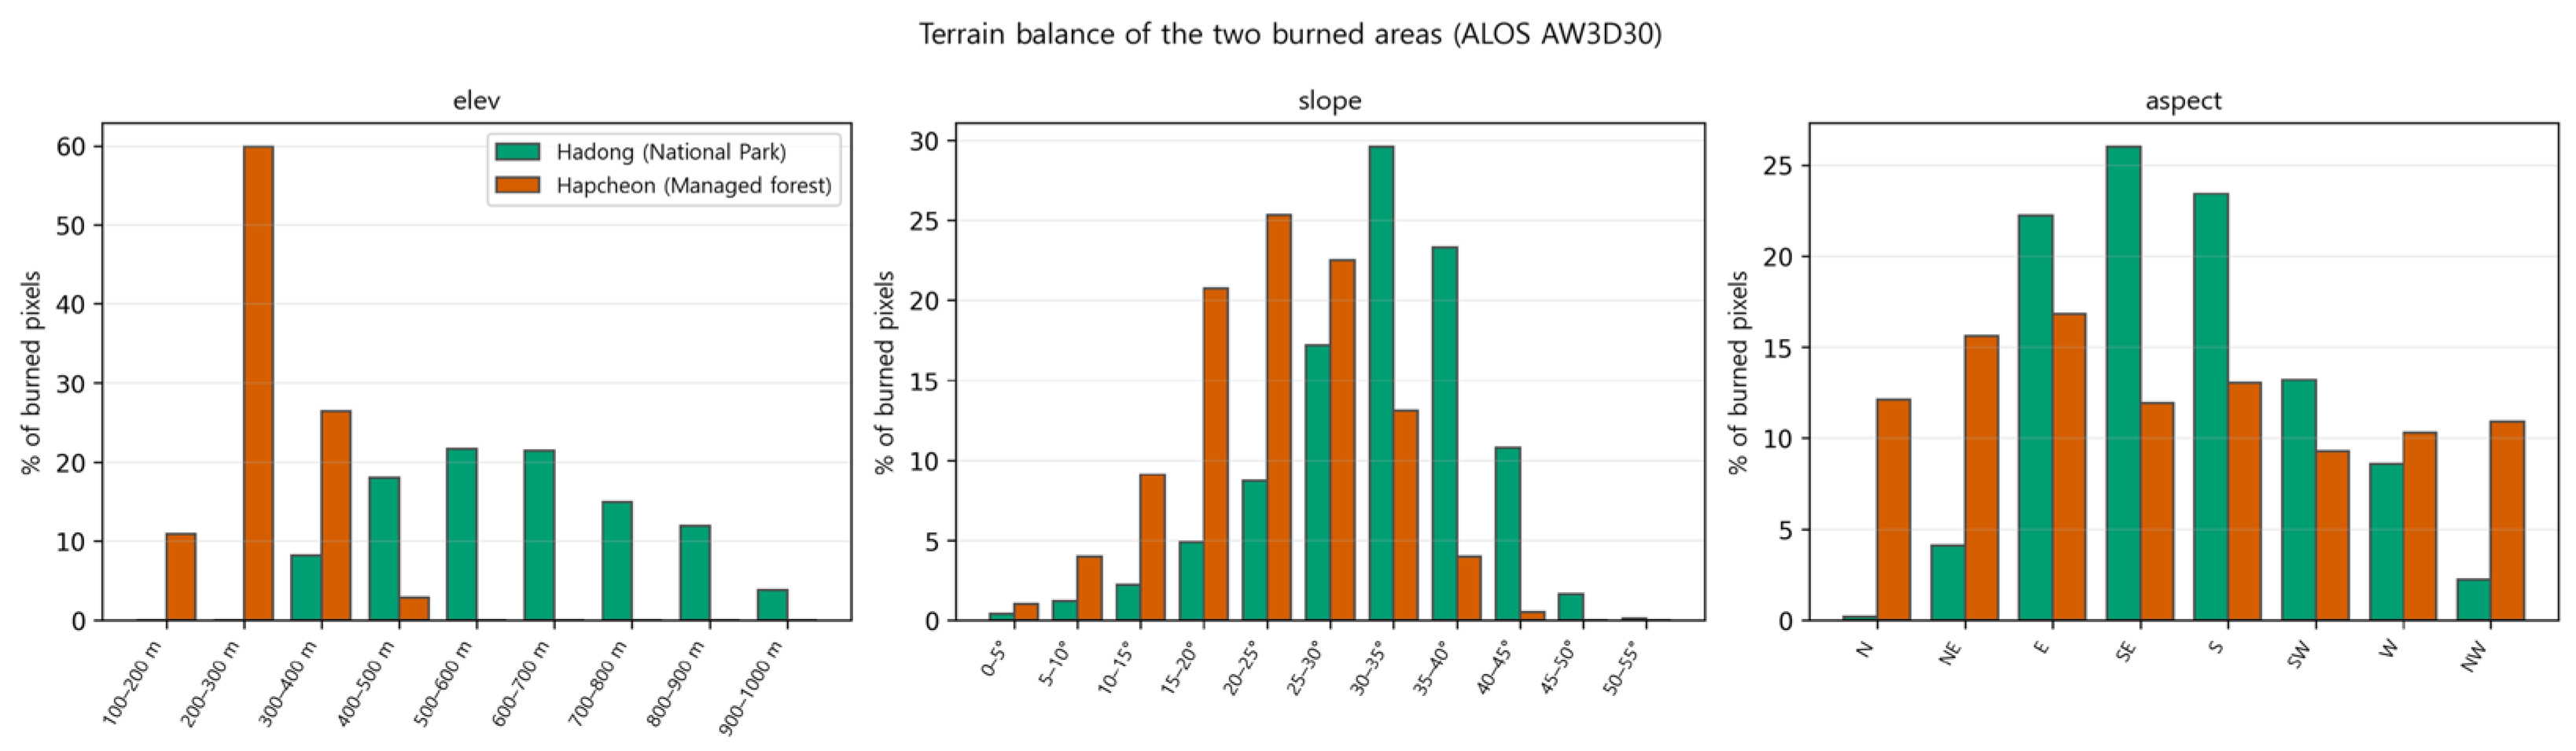
Table A2.
Burn severity within elevation–slope strata shared by both fires (≥30 pixels at each site).
Appendix C. Reference Definitions and Drift
Table A3.
Spring NBR deviation of the burned area from three reference definitions, 2023 and 2026.
Figure A3.
Trend of the reference ring itself over 2023–2026 for the three indices at both sites.
Appendix D. Post-Fire Stand Status and the Salvage-Logging Check
This appendix documents what can and cannot be established about post-fire treatment of the Hapcheon burn. In Korea Forest Service practice, fire-damaged stands in production forest are normally cleared by emergency salvage cutting within one to two years of the fire and then replanted, usually with pine [1]; cutting precedes planting, and the stand map records the state of a stand at the time of its survey. The 2025 stand map reclassifies 77% of the Hapcheon burn from stocked forest to unstocked land. Under the map’s definitions (Section 2.5) that class means that the stand no longer carried a tree canopy of the stocking standard when surveyed in 2025; it is consistent with stands that were cleared and not yet replanted, with stands that were cleared and replanted with seedlings still below the stocking standard, and with stands that died standing. The species-based pattern of the reclassification (Table A5), in which almost all pine but few broadleaved stands were reclassified regardless of severity, is more consistent with selective post-fire management than with fire severity alone and suggests that substantial areas of pine were cleared; the stand map, however, cannot establish that every reclassified stand was cut. The summer imagery (Table A4, Figure A4) shows no clear soil-exposure signature of intensive mechanical site preparation at the time of the composites, and the stand map does not record whether replanting had occurred. The link to salvage logging is therefore inferential: the reclassification pattern is consistent with substantial clearance of fire-damaged pine under standard post-fire practice, but ‘unstocked’ is not itself a salvage-logging class and does not establish whether or when individual stands were cut or replanted. The recovery comparison of Section 3.5 accordingly evaluates the regime including whatever treatment followed.
Table A4.
Summer Sentinel-2 indices inside the Hapcheon burn, split by the stand status recorded in the 2025 stand map.
Figure A4.
Summer true-colour Sentinel-2 composites of the two burns, 2022–2026. Yellow outlines indicate the mapped burn perimeters.
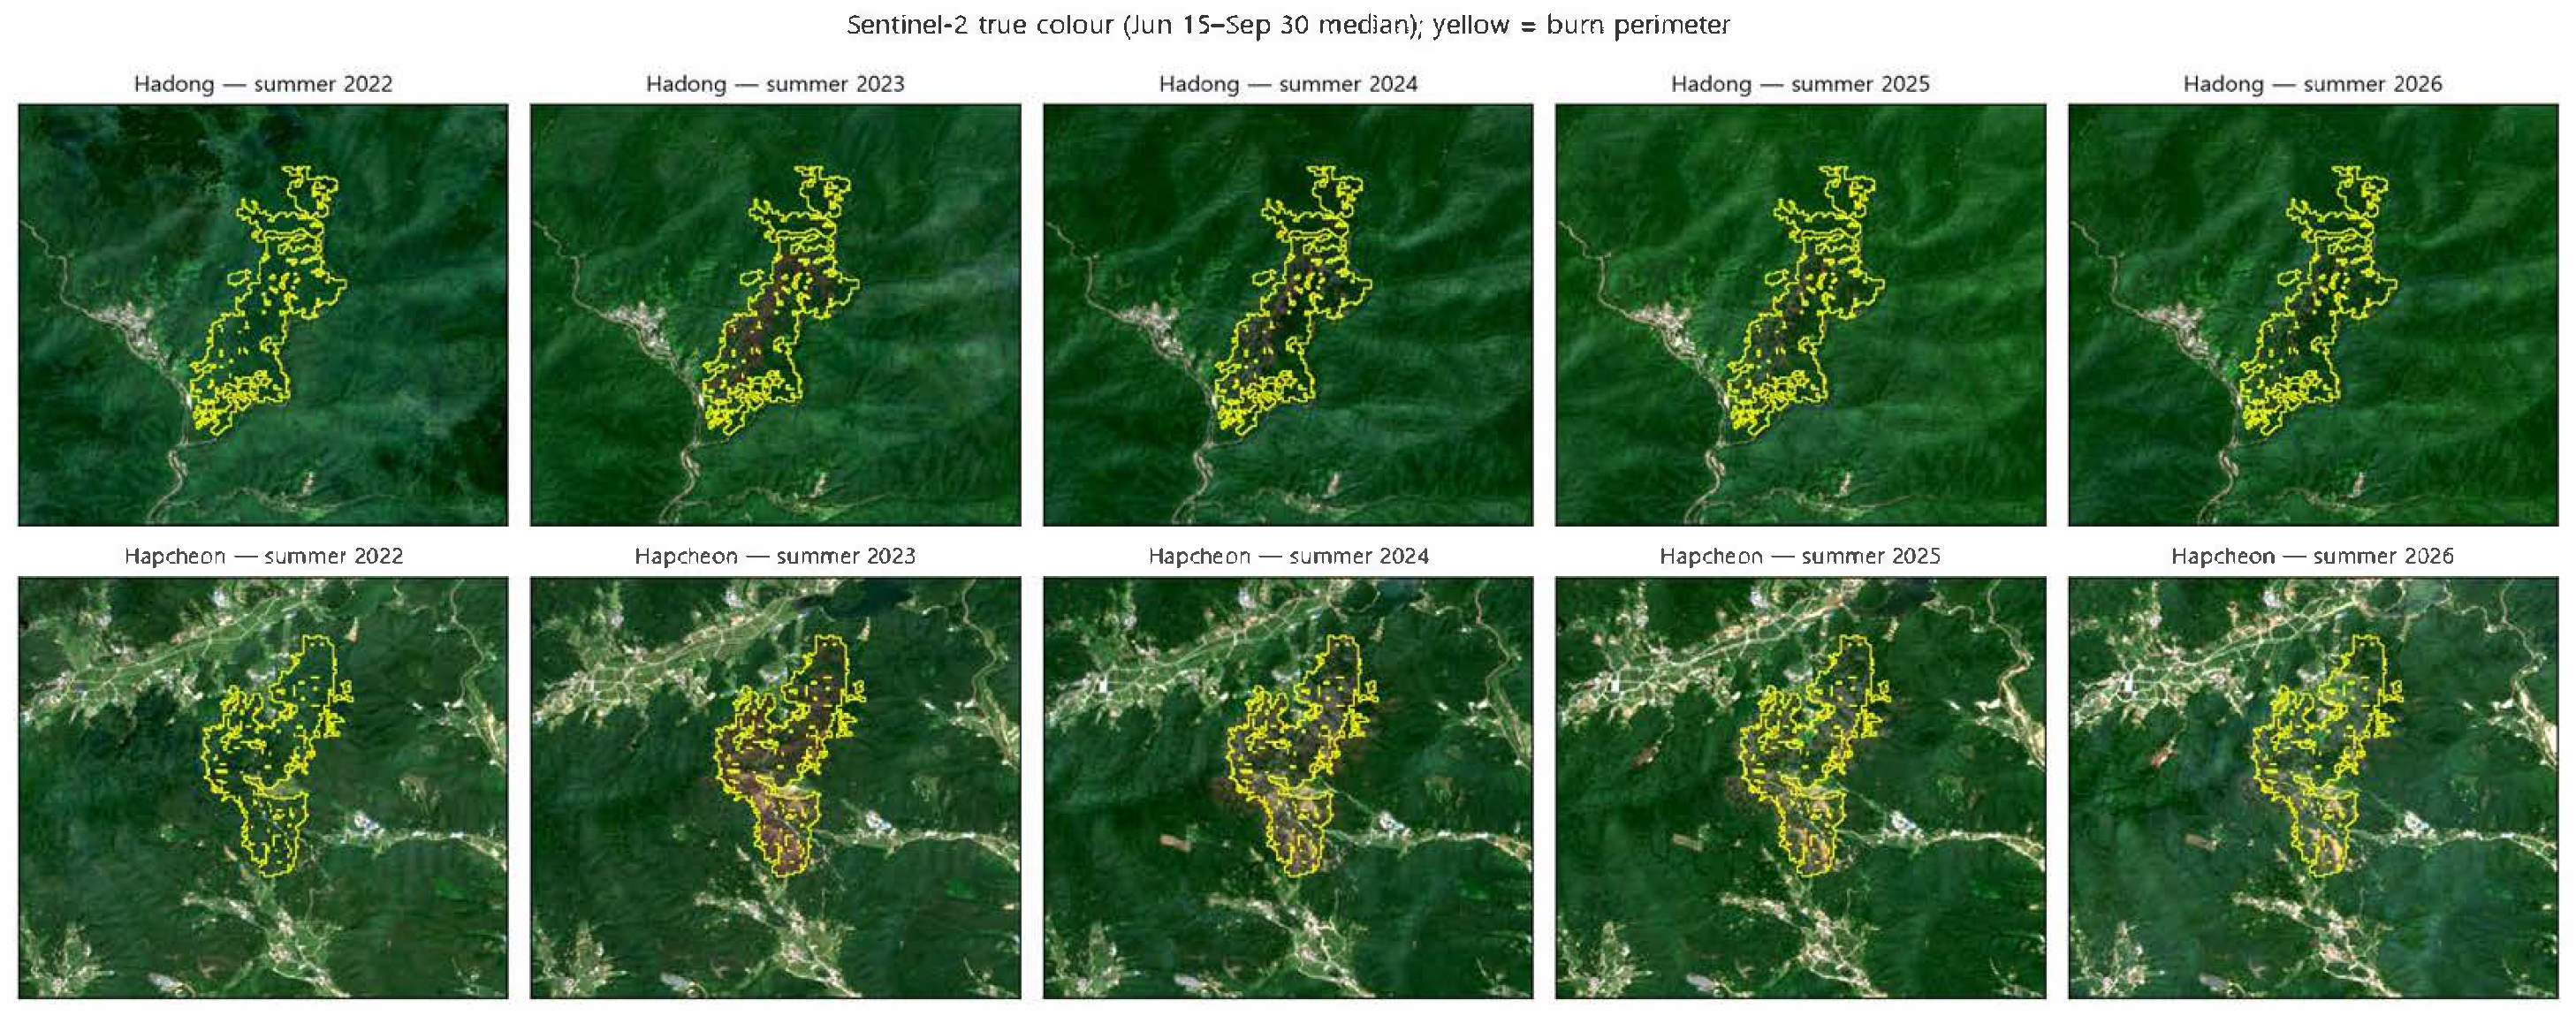
Table A5.
Area of the Hapcheon burn reclassified as unstocked in the 2025 stand map, by 2019 stand type and severity class (ha; share of the cell in parentheses). Areas are from the intersection of the severity pieces of Section 3.5 with the 2019 stand polygons (116.1 ha in total) and differ slightly from the polygon-based totals quoted in Section 3.6.
Figure A5.
Recovery fraction and residual deficit of NBR (spring 2023–2026) within the Hapcheon burn, comparing stands retained as stocked forest with stands reclassified as unstocked in the 2025 stand map, within the same stand type and severity class (cells with at least 20 pixels in both groups; 95% stand-level bootstrap intervals).
References
- Korea Forest Service. Wildfire-Damaged Forests Will Be Restored in Consideration of Economic, Environmental and Social Factors (Press Clarification, 28 November 2022); Forest Resources Division, Korea Forest Service: Daejeon, Republic of Korea, 2022.
- Hong, S.-H.; An, M.-Y.; Hwang, J.-S. Can the Expansion of Forest Roads Prevent Large Forest Fires? Korean J. Environ. Ecol. 2023, 37, 439–449, (In Korean with English Abstract). [Google Scholar] [CrossRef] [Scilit]
- Hong, S.-H.; An, M.-Y.; Hwang, J.-S. Impact of Road Density and Vegetation Type on Large-Scale Forest Fire Damage: A Case Study of the 2023 Hongseong Forest Fire. Korean J. Environ. Ecol. 2024, 38, 634–645, (In Korean with English Abstract). [Google Scholar] [CrossRef] [Scilit]
- An, M.-Y.; Hong, S.-H. Evaluating Landscape-Scale Wildfire Resistance: A Comparative Assessment of Forest Management Regimes and Environmental Damage. Remote Sens. 2026. under review. [Google Scholar]
- Stephens, S.L.; Moghaddas, J.J. Experimental Fuel Treatment Impacts on Forest Structure, Potential Fire Behavior, and Predicted Tree Mortality in a California Mixed Conifer Forest. For. Ecol. Manag. 2005, 215, 21–36. [Google Scholar] [CrossRef] [Scilit]
- Stephens, S.L.; McIver, J.D.; Boerner, R.E.J.; Fettig, C.J.; Fontaine, J.B.; Hartsough, B.R.; Kennedy, P.L.; Schwilk, D.W. The Effects of Forest Fuel-Reduction Treatments in the United States. BioScience 2012, 62, 549–560. [Google Scholar] [CrossRef] [Scilit]
- Mantero, G.; Anselmetto, N.; Morresi, D.; Meloni, F.; Bolzon, P.; Lingua, E.; Garbarino, M.; Marzano, R. Modeling Post-Fire Regeneration Patterns Under Different Restoration Scenarios to Improve Forest Recovery in Degraded Ecosystems. For. Ecol. Manag. 2024, 551, 121520. [Google Scholar] [CrossRef] [Scilit]
- Lingua, E.; Marques, G.; Marchi, N.; Garbarino, M.; Marangon, D.; Taccaliti, F.; Marzano, R. Post-Fire Restoration and Deadwood Management: Microsite Dynamics and Their Impact on Natural Regeneration. Forests 2023, 14, 1820. [Google Scholar] [CrossRef] [Scilit]
- Li, J.; Morimoto, J.; Hotta, W.; Suzuki, S.N. The 30-Year Impact of Post-Windthrow Management on the Forest Regeneration Process in Northern Japan. Landsc. Ecol. Eng. 2023, 19, 227–242. [Google Scholar] [CrossRef] [Scilit]
- Hotta, W.; Haga, C.; Morimoto, J.; Suzuki, S.N.; Matsui, T.; Owari, T.; Shibata, H.; Nakamura, F. Leaving Disturbance Legacies Conserves Boreal Conifers and Maximizes Net CO2 Absorption Under Climate Change and More Frequent and Larger Windthrow Regimes. Landsc. Ecol. 2023, 38, 1785–1805. [Google Scholar] [CrossRef] [Scilit]
- Suzuki, S.N.; Owari, T. Forest Recovery Process and Restoration After Large-Scale Disturbances. In Integrative Forest Management and Silviculture: Harmonizing Conservation and Production; Owari, T., Suzuki, S.N., Tanaka, N., Fukui, D., Eds.; Springer Nature: Singapore, 2026; pp. 207–221. [Google Scholar]
- Zhao, G.; Xu, E.; Yi, X.; Guo, Y.; Zhang, K. Comparison of Forest Restorations with Different Burning Severities Using Various Restoration Methods at Tuqiang Forestry Bureau of Greater Hinggan Mountains. Remote Sens. 2023, 15, 2683. [Google Scholar] [CrossRef] [Scilit]
- Hwang, Y.; Kweon, H.; Kang, W.; Lee, J.-W. Comparison of Vegetation Recovery According to the Forest Restoration Technique Using the Satellite Imagery: Focus on the Goseong (1996) and East Coast (2000) Forest Fire. Korean J. Agric. Sci. 2023, 50, 555–567. [Google Scholar] [CrossRef] [Scilit]
- Holling, C.S. Resilience and Stability of Ecological Systems. Annu. Rev. Ecol. Syst. 1973, 4, 1–23. [Google Scholar] [CrossRef] [Scilit]
- Seidl, R.; Thom, D.; Kautz, M.; Martin-Benito, D.; Peltoniemi, M.; Vacchiano, G.; Wild, J.; Ascoli, D.; Petr, M.; Honkaniemi, J.; et al. Forest Disturbances Under Climate Change. Nat. Clim. Change 2017, 7, 395–402. [Google Scholar] [CrossRef] [Scilit]
- Rothermel, R.C. A Mathematical Model for Predicting Fire Spread in Wildland Fuels; USDA Forest Service, Intermountain Forest and Range Experiment Station: Ogden, UT, USA, 1972.
- Jolly, W.M.; Cochrane, M.A.; Freeborn, P.H.; Holden, Z.A.; Brown, T.J.; Williamson, G.J.; Bowman, D.M.J.S. Climate-Induced Variations in Global Wildfire Danger from 1979 to 2013. Nat. Commun. 2015, 6, 7537. [Google Scholar] [CrossRef] [Scilit]
- Kyunghyang Shinmun. The Cause of the Hapcheon Wildfire That Burned a Large Forest Area Was a Cigarette Butt; Kyunghyang Shinmun: Seoul, Republic of Korea, 2023. (In Korean) [Google Scholar]
- MBC News. Wildfire Near Jirisan, Hadong, Gyeongnam: Residents Evacuated; MBC News: Seoul, Republic of Korea, 2023. (In Korean) [Google Scholar]
- Edaily. Hapcheon Wildfire Contained After 20 Hours, Having Burned Forest the Size of 230 Football Fields; Edaily: Seoul, Republic of Korea, 2023; Available online: https://www.edaily.co.kr/News/Read?newsId=01866326635541680&mediaCodeNo=257 (accessed on 26 September 2026).
- Financial News. Hadong Hwagae-Myeon Wildfire Spreads on Strong Wind; Response Level 1 Declared; Financial News: Seoul, Republic of Korea, 2023. (In Korean) [Google Scholar]
- Seoul Shinmun. Firefighter Deployed to the Hadong Wildfire Dies of Cardiac Arrest; Suppression in Difficulty; Seoul Shinmun: Seoul, Republic of Korea, 2023. (In Korean) [Google Scholar]
- National Institute of Forest Science. Understanding Wildfire 2026; National Institute of Forest Science (NIFOS): Seoul, Republic of Korea, 2026.
- Muñoz-Sabater, J.; Dutra, E.; Agustí-Panareda, A.; Albergel, C.; Arduini, G.; Balsamo, G.; Boussetta, S.; Choulga, M.; Harrigan, S.; Hersbach, H.; et al. ERA5-Land: A State-of-the-Art Global Reanalysis Dataset for Land Applications. Earth Syst. Sci. Data 2021, 13, 4349–4383. [Google Scholar] [CrossRef] [Scilit]
- Key, C.H.; Benson, N.C. Landscape Assessment (LA): Sampling and Analysis Methods. In FIREMON: Fire Effects Monitoring and Inventory System; USDA Forest Service, Rocky Mountain Research Station: Fort Collins, CO, USA, 2006; pp. LA-1–LA-55. [Google Scholar]
- Eidenshink, J.; Schwind, B.; Brewer, K.; Zhu, Z.-L.; Quayle, B.; Howard, S. A Project for Monitoring Trends in Burn Severity. Fire Ecol. 2007, 3, 3–21. [Google Scholar] [CrossRef] [Scilit]
- Miller, J.D.; Thode, A.E. Quantifying Burn Severity in a Heterogeneous Landscape with a Relative Version of the Delta Normalized Burn Ratio (dNBR). Remote Sens. Environ. 2007, 109, 66–80. [Google Scholar] [CrossRef] [Scilit]
- Keeley, J.E. Fire Intensity, Fire Severity and Burn Severity: A Brief Review and Suggested Usage. Int. J. Wildland Fire 2009, 18, 116–126. [Google Scholar] [CrossRef] [Scilit]
- Gorelick, N.; Hancher, M.; Dixon, M.; Ilyushchenko, S.; Thau, D.; Moore, R. Google Earth Engine: Planetary-Scale Geospatial Analysis for Everyone. Remote Sens. Environ. 2017, 202, 18–27. [Google Scholar] [CrossRef] [Scilit]
- Verbyla, D.L.; Kasischke, E.S.; Hoy, E.E. Seasonal and Topographic Effects on Estimating Fire Severity from Landsat TM/ETM+ Data. Int. J. Wildland Fire 2008, 17, 527–534. [Google Scholar] [CrossRef] [Scilit]
- Zanaga, D.; Van De Kerchove, R.; Daems, D.; De Keersmaecker, W.; Brockmann, C.; Kirches, G.; Wevers, J.; Cartus, O.; Santoro, M.; Fritz, S.; et al. ESA WorldCover 10 m 2021 v200; Zenodo: Geneva, Switzerland, 2022. [Google Scholar]
- Parks, S.A.; Dillon, G.K.; Miller, C. A New Metric for Quantifying Burn Severity: The Relativized Burn Ratio. Remote Sens. 2014, 6, 1827–1844, Correction in Remote Sens. 2014, 6, 12509–12510. https://doi.org/10.3390/rs61212509. [Google Scholar] [CrossRef] [Scilit]
- Busby, S.; Evers, C.; Holz, A. Patterns, Drivers, and Implications of Postfire Delayed Tree Mortality in Temperate Conifer Forests of the Western United States. Ecosphere 2024, 15, e4805. [Google Scholar] [CrossRef] [Scilit]
- Korea Forest Service Digital Forest Stand Map 1:5000 (2019, 2024 and 2025 Editions), Gyeongsangnam-do. 2025. Available online: https://fgis.forest.go.kr (accessed on 5 September 2026).
- Tadono, T.; Ishida, H.; Oda, F.; Naito, S.; Minakawa, K.; Iwamoto, H. Precise Global DEM Generation by ALOS PRISM. ISPRS Ann. Photogramm. Remote Sens. Spat. Inf. Sci. 2014, II-4, 71–76. [Google Scholar] [CrossRef] [Scilit]
- Lee, K.; Kim, B.; Park, S. Evaluating the Potential of Burn Severity Mapping and Transferability of Copernicus EMS Data Using Sentinel-2 Imagery and Machine Learning Approaches. GISci. Remote Sens. 2023, 60, 2192157. [Google Scholar] [CrossRef] [Scilit]
- Pickell, P.D.; Hermosilla, T.; Frazier, R.J.; Coops, N.C.; Wulder, M.A. Forest Recovery Trends Derived from Landsat Time Series for North American Boreal Forests. Int. J. Remote Sens. 2016, 37, 138–149. [Google Scholar] [CrossRef] [Scilit]
- Frazier, R.J.; Coops, N.C.; Wulder, M.A.; Hermosilla, T.; White, J.C. Analyzing Spatial and Temporal Variability in Short-Term Rates of Post-Fire Vegetation Return from Landsat Time Series. Remote Sens. Environ. 2018, 205, 32–45. [Google Scholar] [CrossRef] [Scilit]
- De Keersmaecker, W.; Rodríguez-Sánchez, P.; Milencović, M.; Herold, M.; Reiche, J.; Verbesselt, J. Evaluating Recovery Metrics Derived from Optical Time Series over Tropical Forest Ecosystems. Remote Sens. Environ. 2022, 274, 112991. [Google Scholar] [CrossRef] [Scilit]
- Tucker, C.J.; Pinzon, J.E.; Brown, M.E.; Slayback, D.A.; Pak, E.W.; Mahoney, R.; Vermote, E.F.; El Saleous, N. An Extended AVHRR 8-Km NDVI Dataset Compatible with MODIS and SPOT Vegetation NDVI Data. Int. J. Remote Sens. 2005, 26, 4485–4498. [Google Scholar] [CrossRef] [Scilit]
- Kim, S.Y.; Lee, B.D.; Seo, Y.O.; Jang, M.N.; Lee, Y.J. Effects of Forest Tending Works on the Crown Fuel Characteristics of Pinus densiflora S. et Z. Stands in Korea. J. Korean Soc. For. Sci. 2011, 100, 359–366. [Google Scholar] [CrossRef]
- Prichard, S.J.; Povak, N.A.; Kennedy, M.C.; Peterson, D.W. Fuel Treatment Effectiveness in the Context of Landform, Vegetation, and Large, Wind-Driven Wildfires. Ecol. Appl. 2020, 30, e02104. [Google Scholar] [CrossRef] [Scilit]
- Agee, J.K.; Skinner, C.N. Basic Principles of Forest Fuel Reduction Treatments. For. Ecol. Manag. 2005, 211, 83–96. [Google Scholar] [CrossRef] [Scilit]
- Reinhardt, E.D.; Keane, R.E.; Brown, J.K. First Order Fire Effects Model: FOFEM 4.0, User’s Guide; USDA Forest Service, Intermountain Research Station: Ogden, UT, USA, 1997.
- Kim, J.; Lim, J.-H.; Shin, M.; Han, S.-H.; Kang, W. Oak Resprouting Survival and Competition for 19 Years After Wildfire in the Republic of Korea. Forests 2020, 11, 515. [Google Scholar] [CrossRef] [Scilit]
- Matsuni, T.; Utsumi, Y.; Enoki, T. Effects of Stem Size and Age on Resprouting Ability of Different Tree Species After Clear-Cutting in a Warm Temperate Secondary Forest. J. For. Res. 2024, 29, 417–424. [Google Scholar] [CrossRef] [Scilit]
- Suzuki, M. Successional Pathways of a Warm-Temperate Forest After Disturbance: Effects of Clear-Cutting and Herbivory. In Sika Deer: Life History Plasticity and Management; Kaji, K., Uno, H., Iijima, H., Eds.; Springer Nature: Singapore, 2022; pp. 431–445. [Google Scholar]
- Kim, T.; Tun, Z.P.H.; Jeong, J.; Im, S. Short-Term Effects of Burn Severity on Post-Fire Runoff and Soil Erosion in Pine Forests. Water Air Soil Pollut. 2026, 237, 686. [Google Scholar] [CrossRef] [Scilit]
- Atutova, Z.V. Post-Fire Restoration of Pine Forests in the Badary Area, Tunkinskiy National Park, Russia. Nat. Conserv. Res. 2023, 8, 22–32. [Google Scholar] [CrossRef] [Scilit]
- Simler-Williamson, A.B.; Germino, M.J. Statistical Considerations of Nonrandom Treatment Applications Reveal Region-Wide Benefits of Widespread Post-Fire Restoration Action. Nat. Commun. 2022, 13, 3472. [Google Scholar] [CrossRef] [Scilit]
- Coop, J.D. Postfire Futures in Southwestern Forests: Climate and Landscape Influences on Trajectories of Recovery and Conversion. Ecol. Appl. 2023, 33, e2725. [Google Scholar] [CrossRef] [Scilit]
- Stevens-Rumann, C.S.; Kemp, K.B.; Higuera, P.E.; Harvey, B.J.; Rother, M.T.; Donato, D.C.; Morgan, P.; Veblen, T.T. Evidence for Declining Forest Resilience to Wildfires Under Climate Change. Ecol. Lett. 2018, 21, 243–252. [Google Scholar] [CrossRef] [Scilit]
- Hagmann, R.K.; Hessburg, P.F.; Salter, R.B.; Merschel, A.G.; Reilly, M.J. Contemporary Wildfires Further Degrade Resistance and Resilience of Fire-Excluded Forests. For. Ecol. Manag. 2022, 506, 119975. [Google Scholar] [CrossRef] [Scilit]
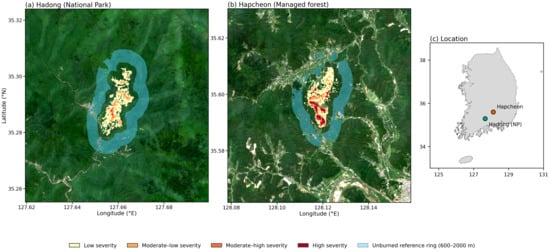
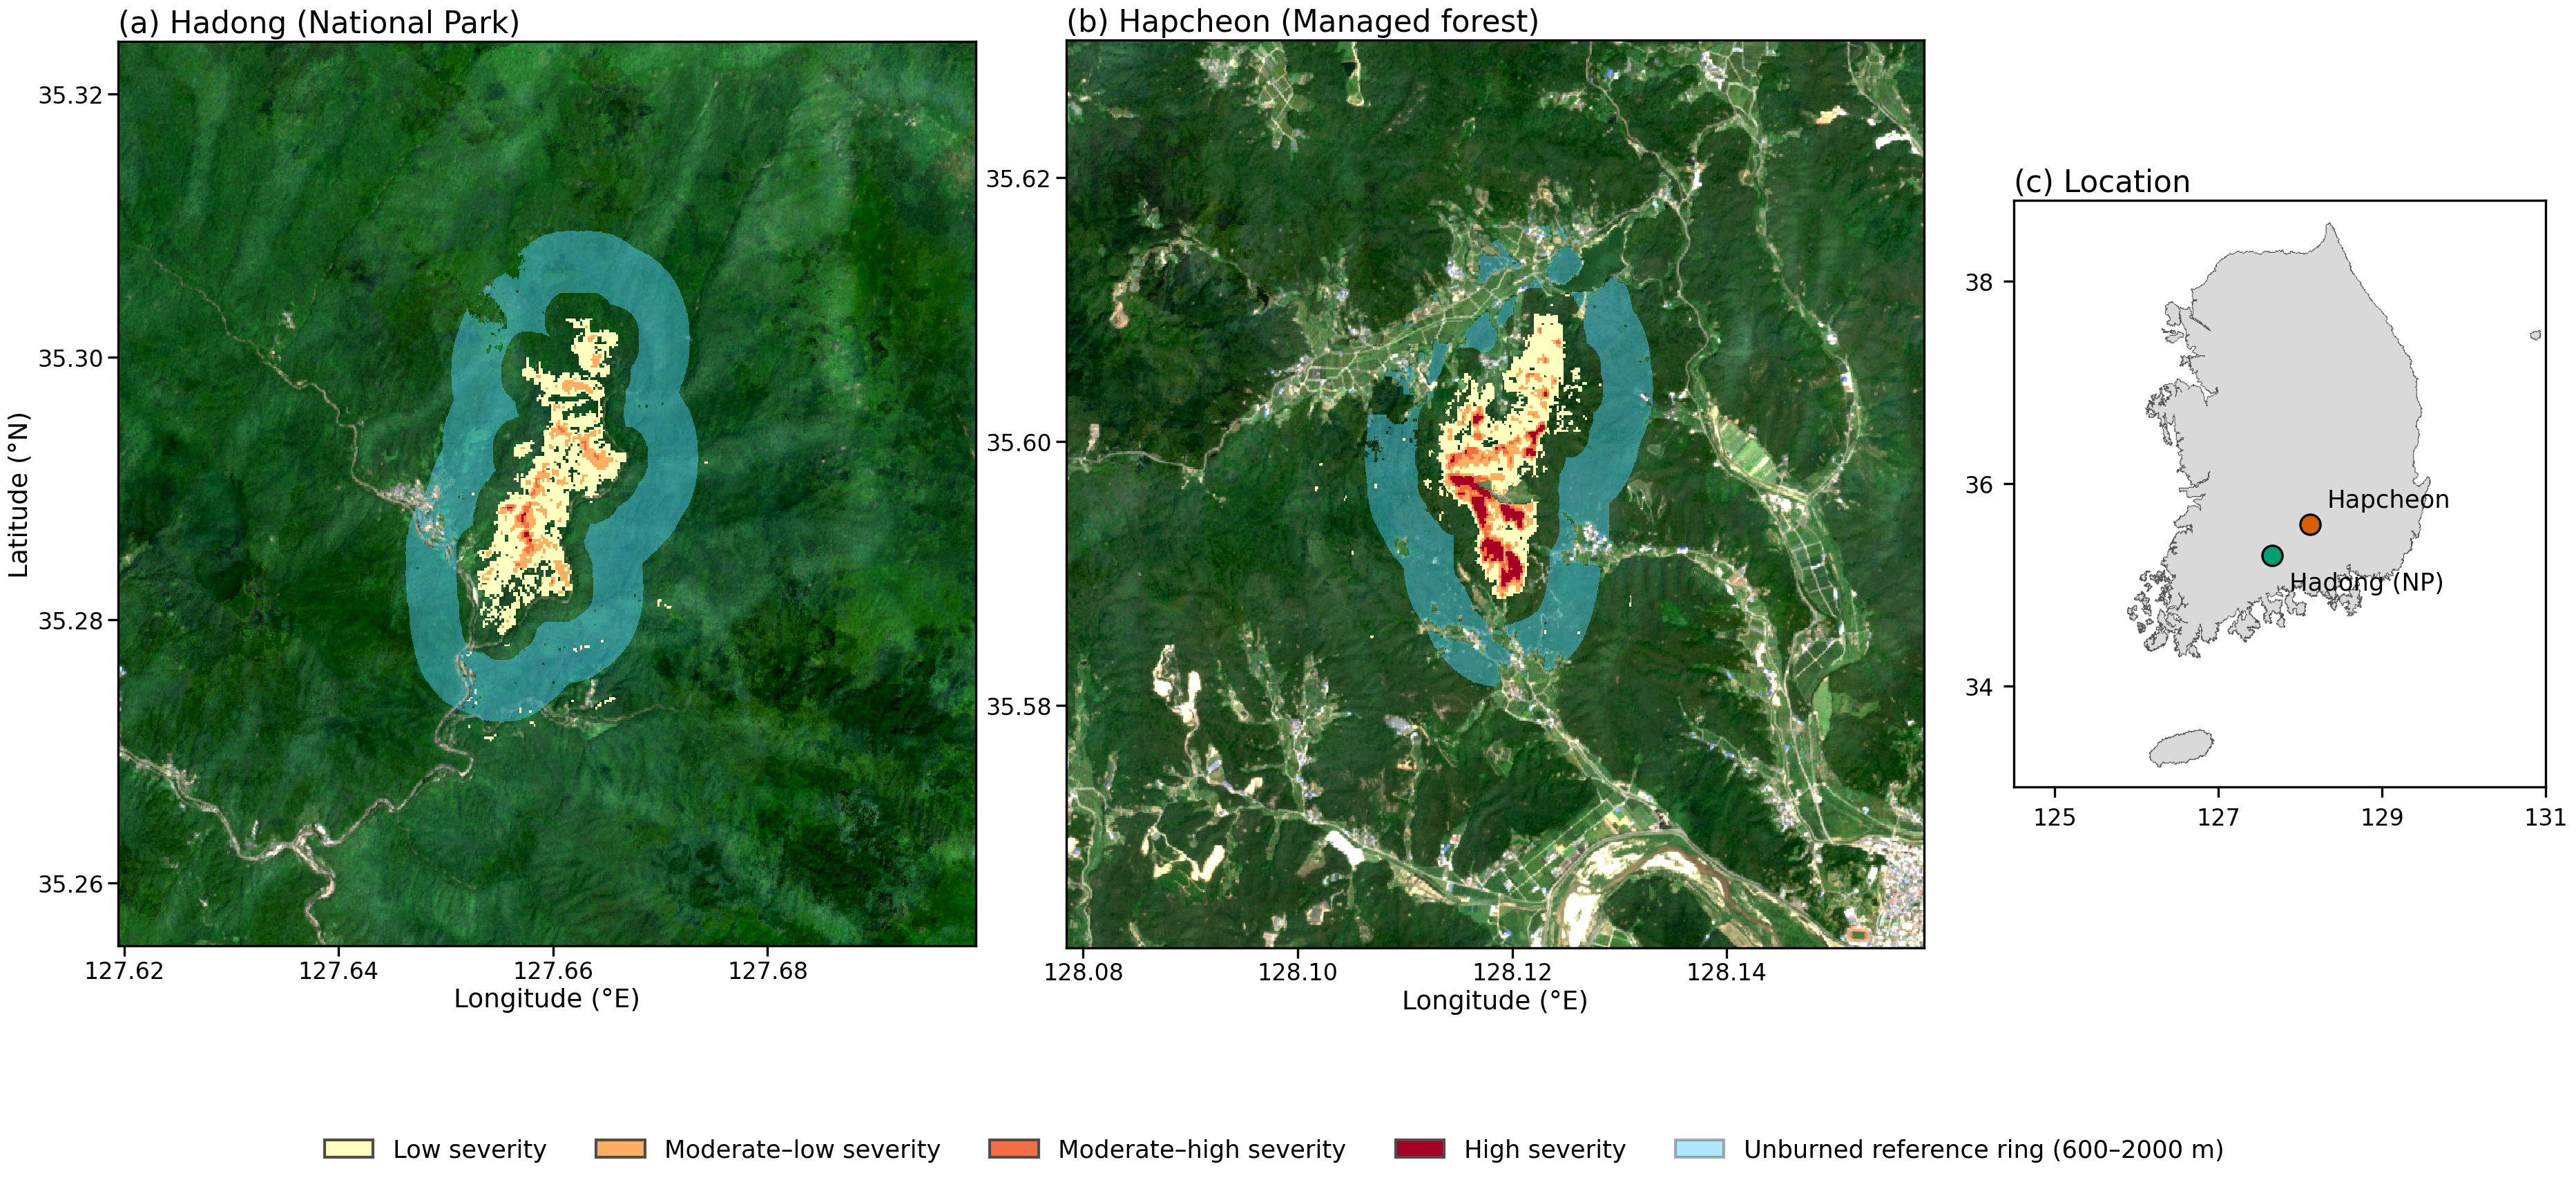
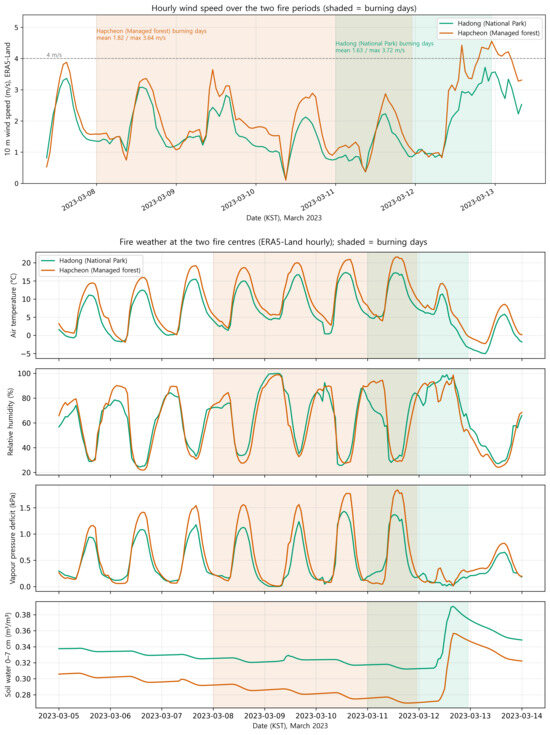
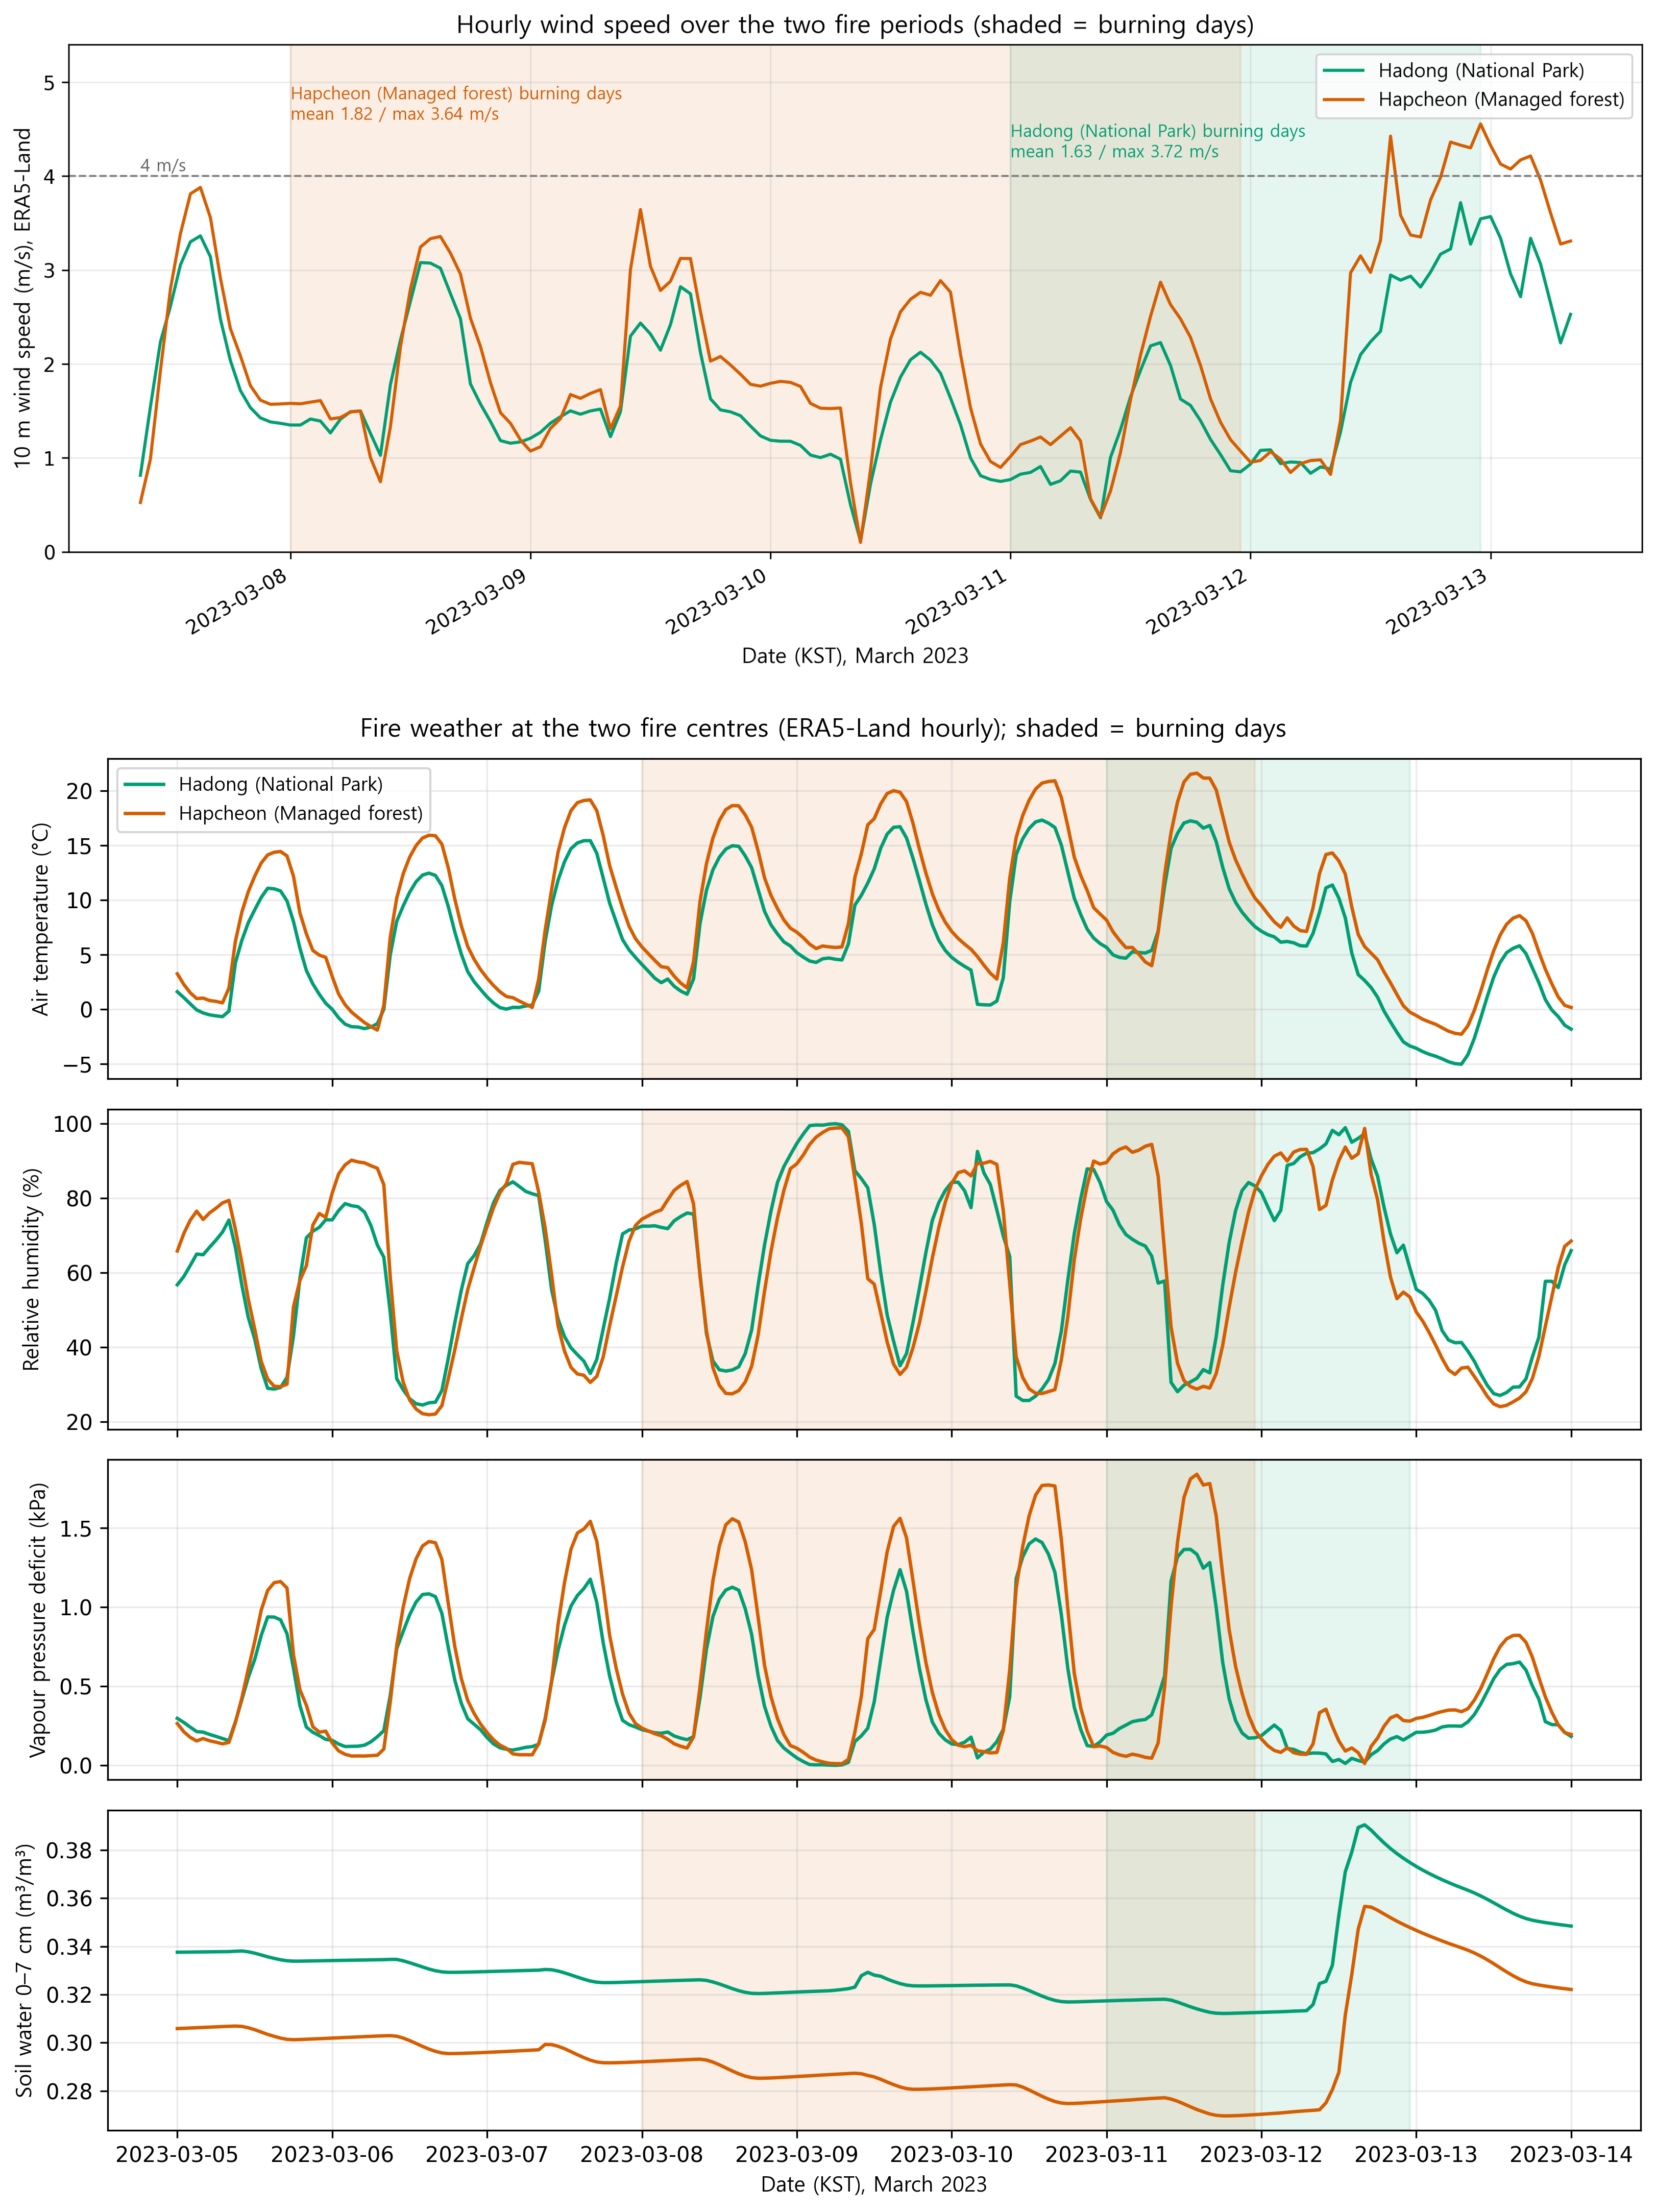
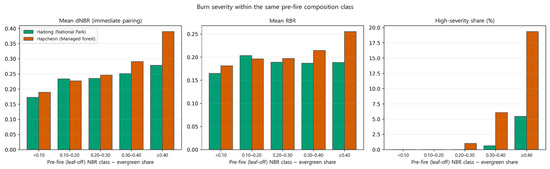
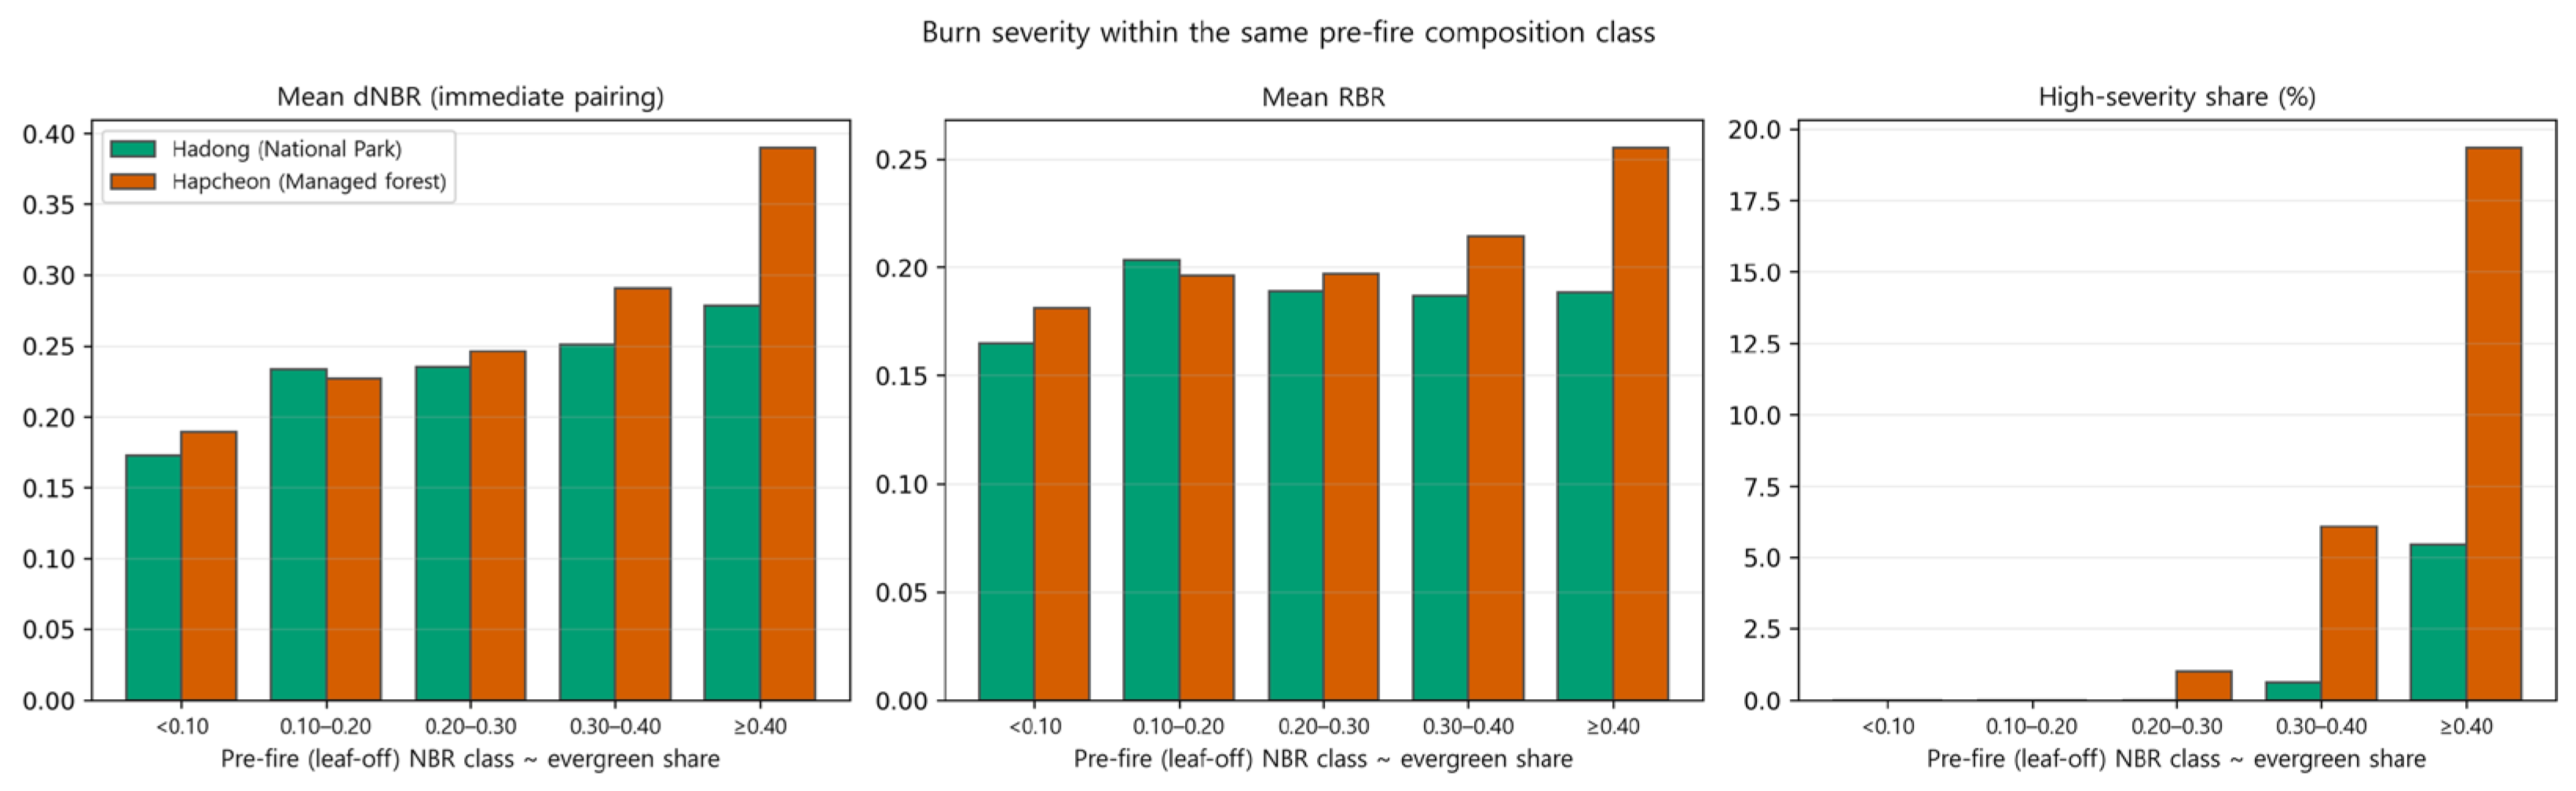
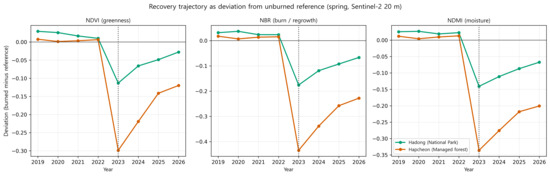
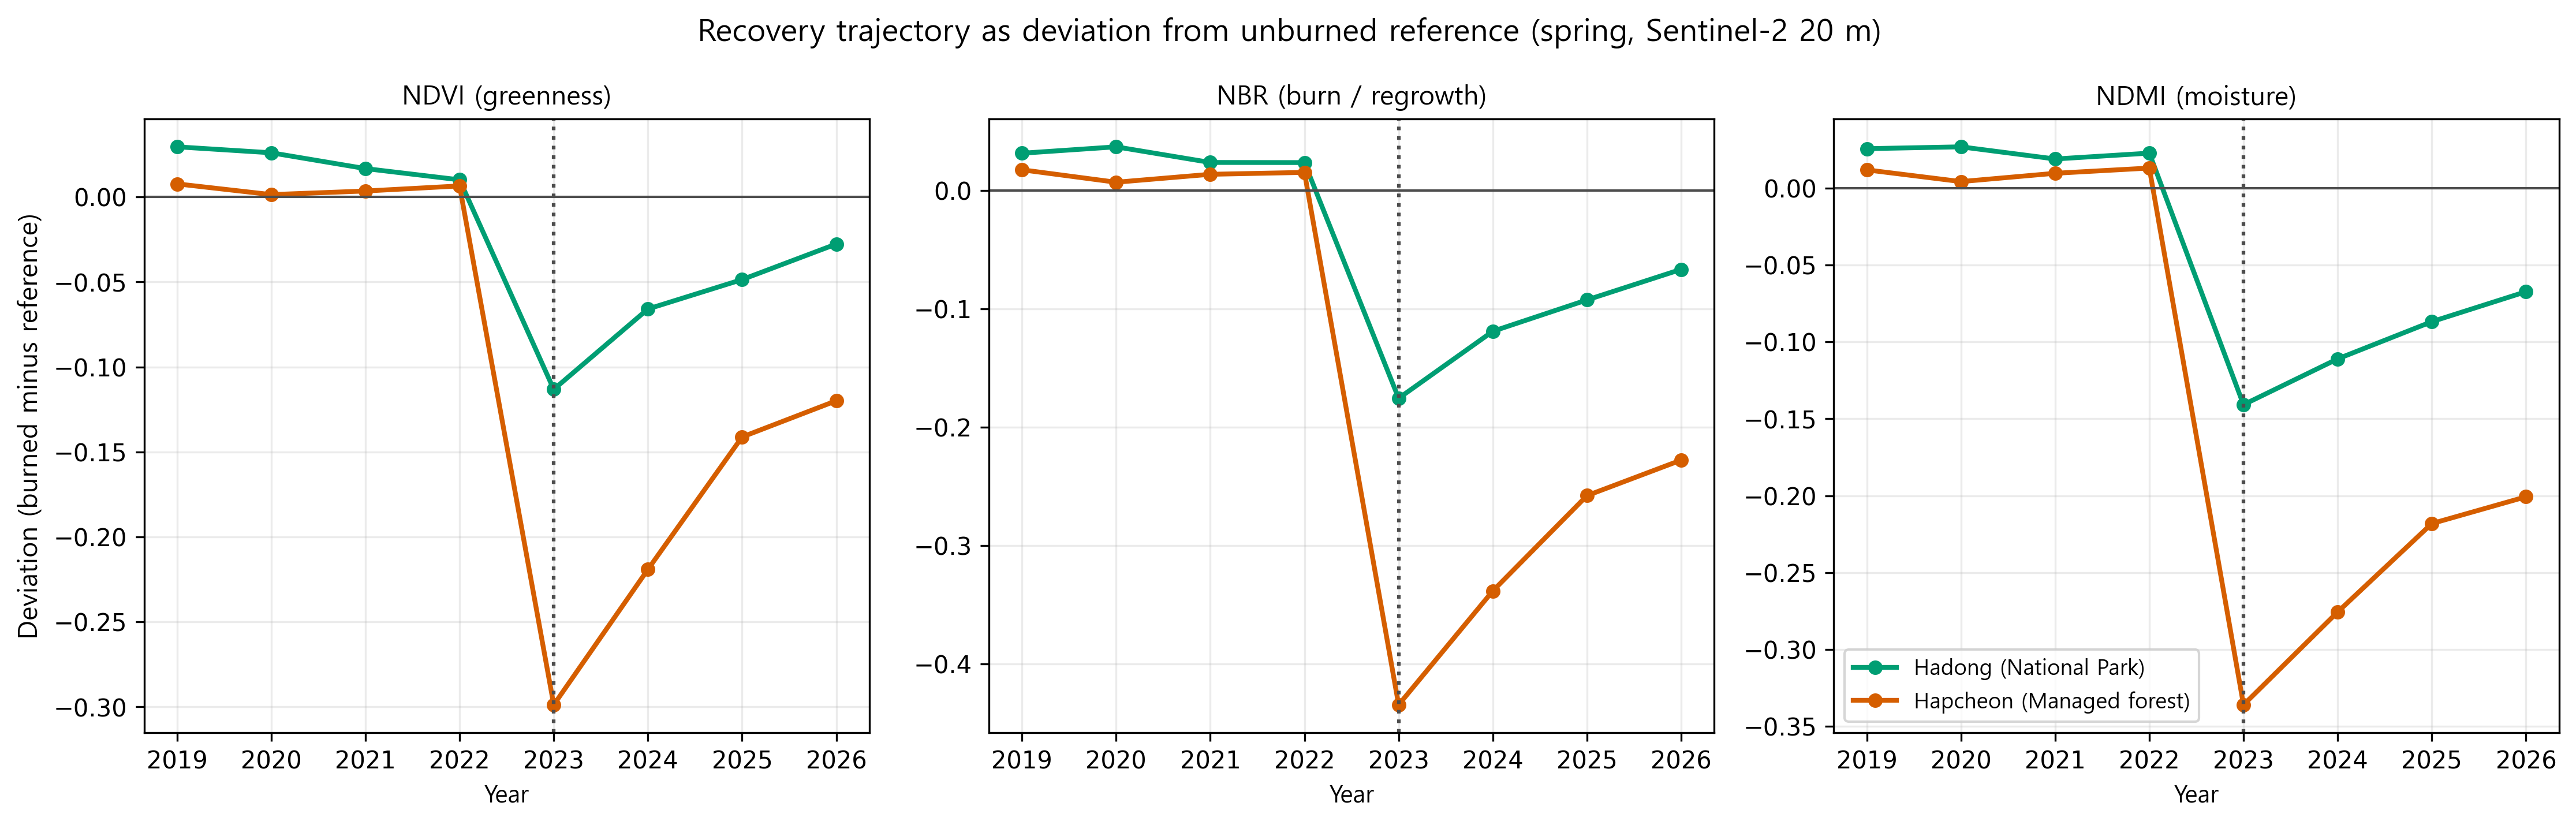
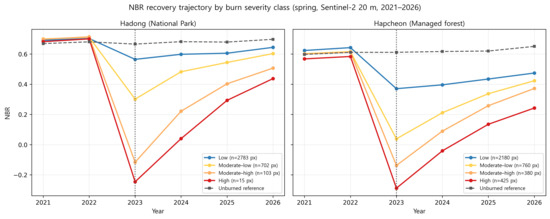
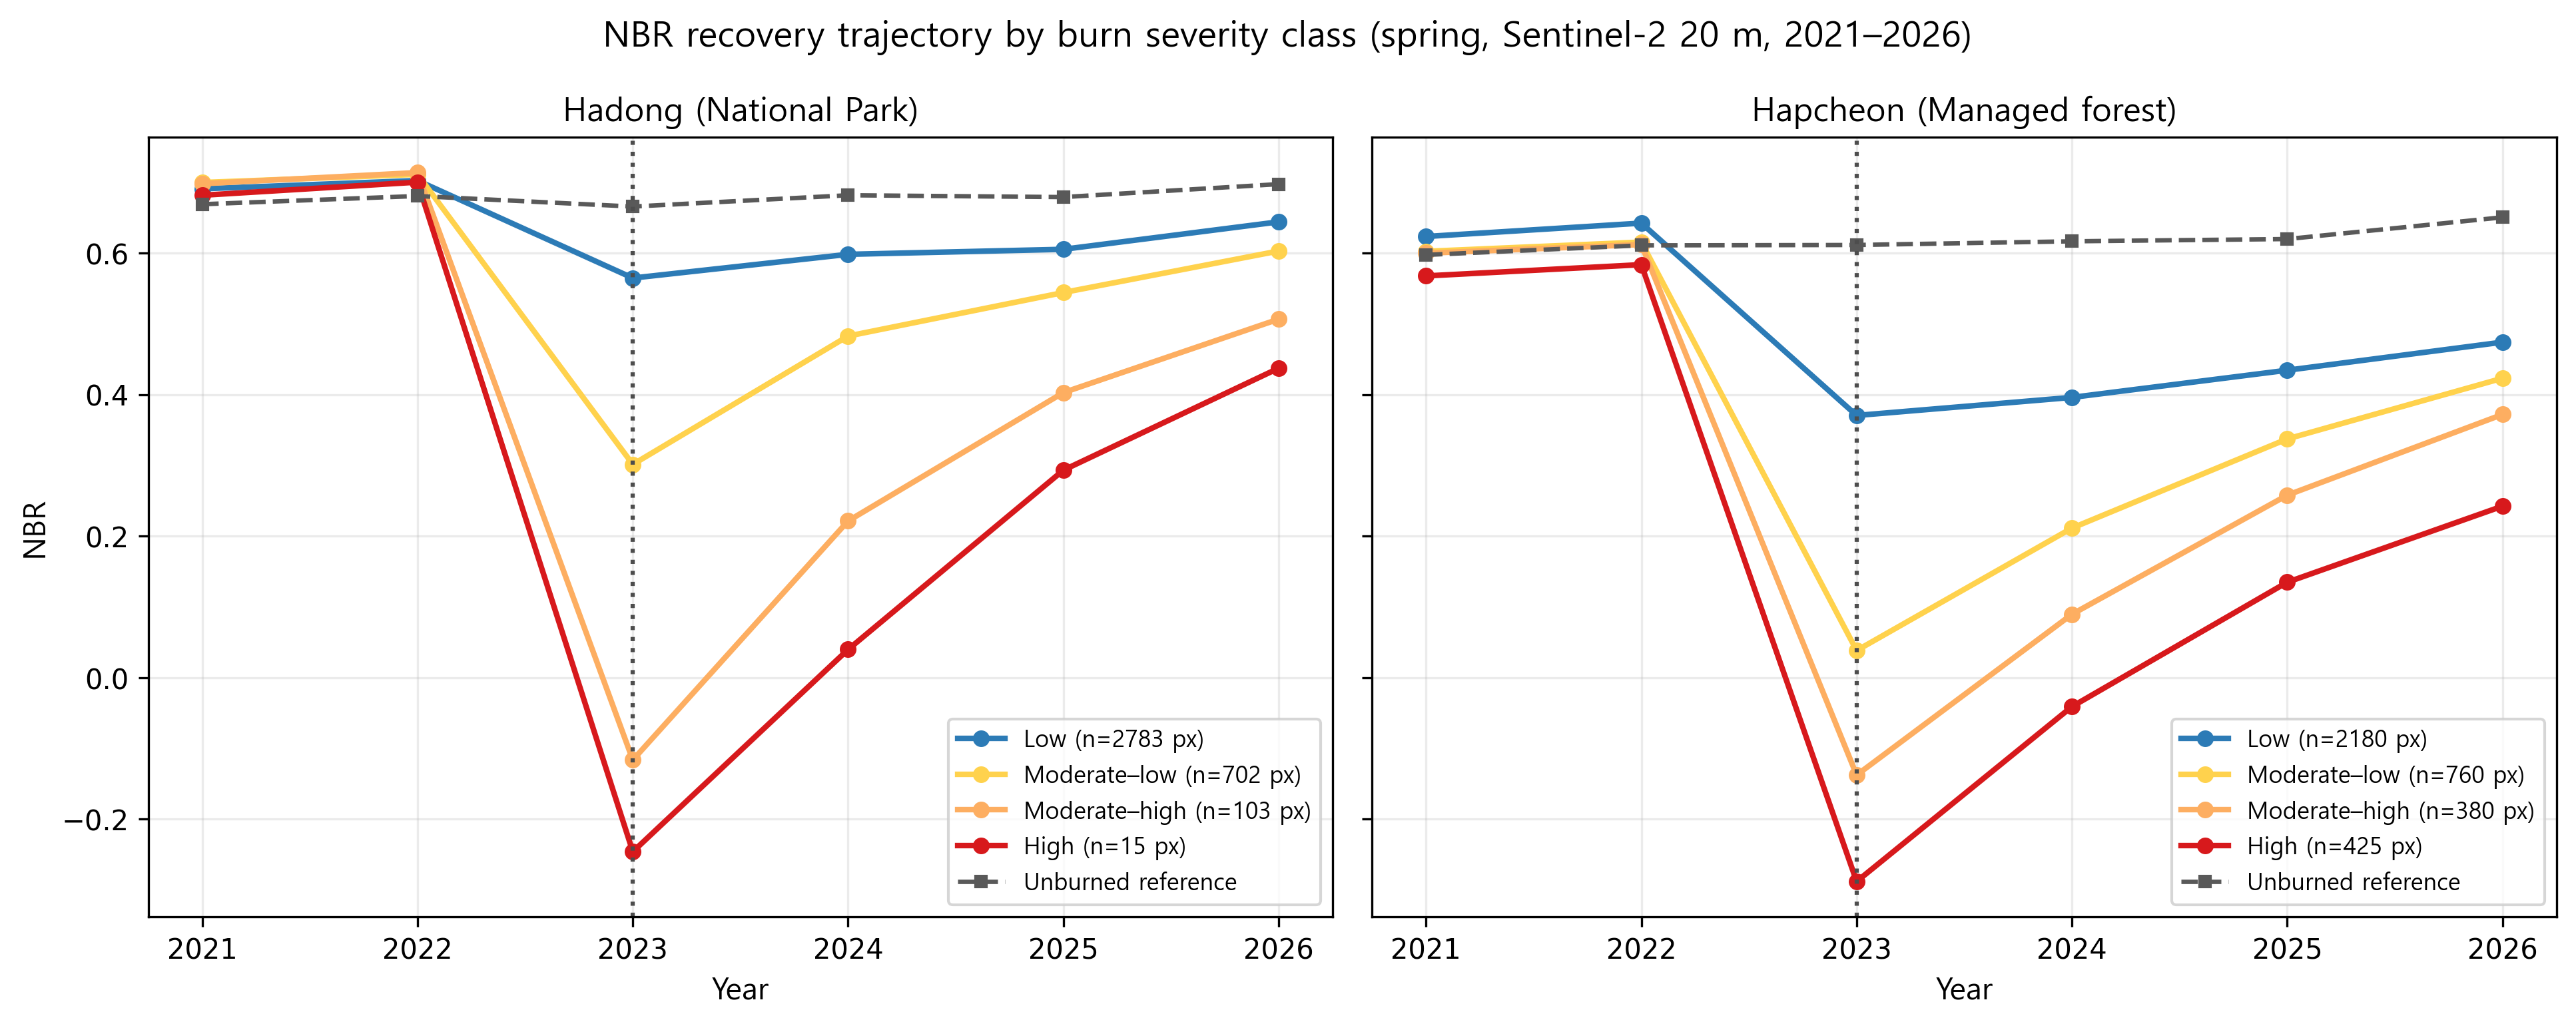
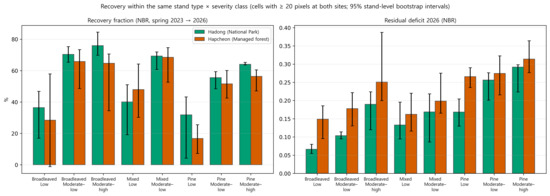
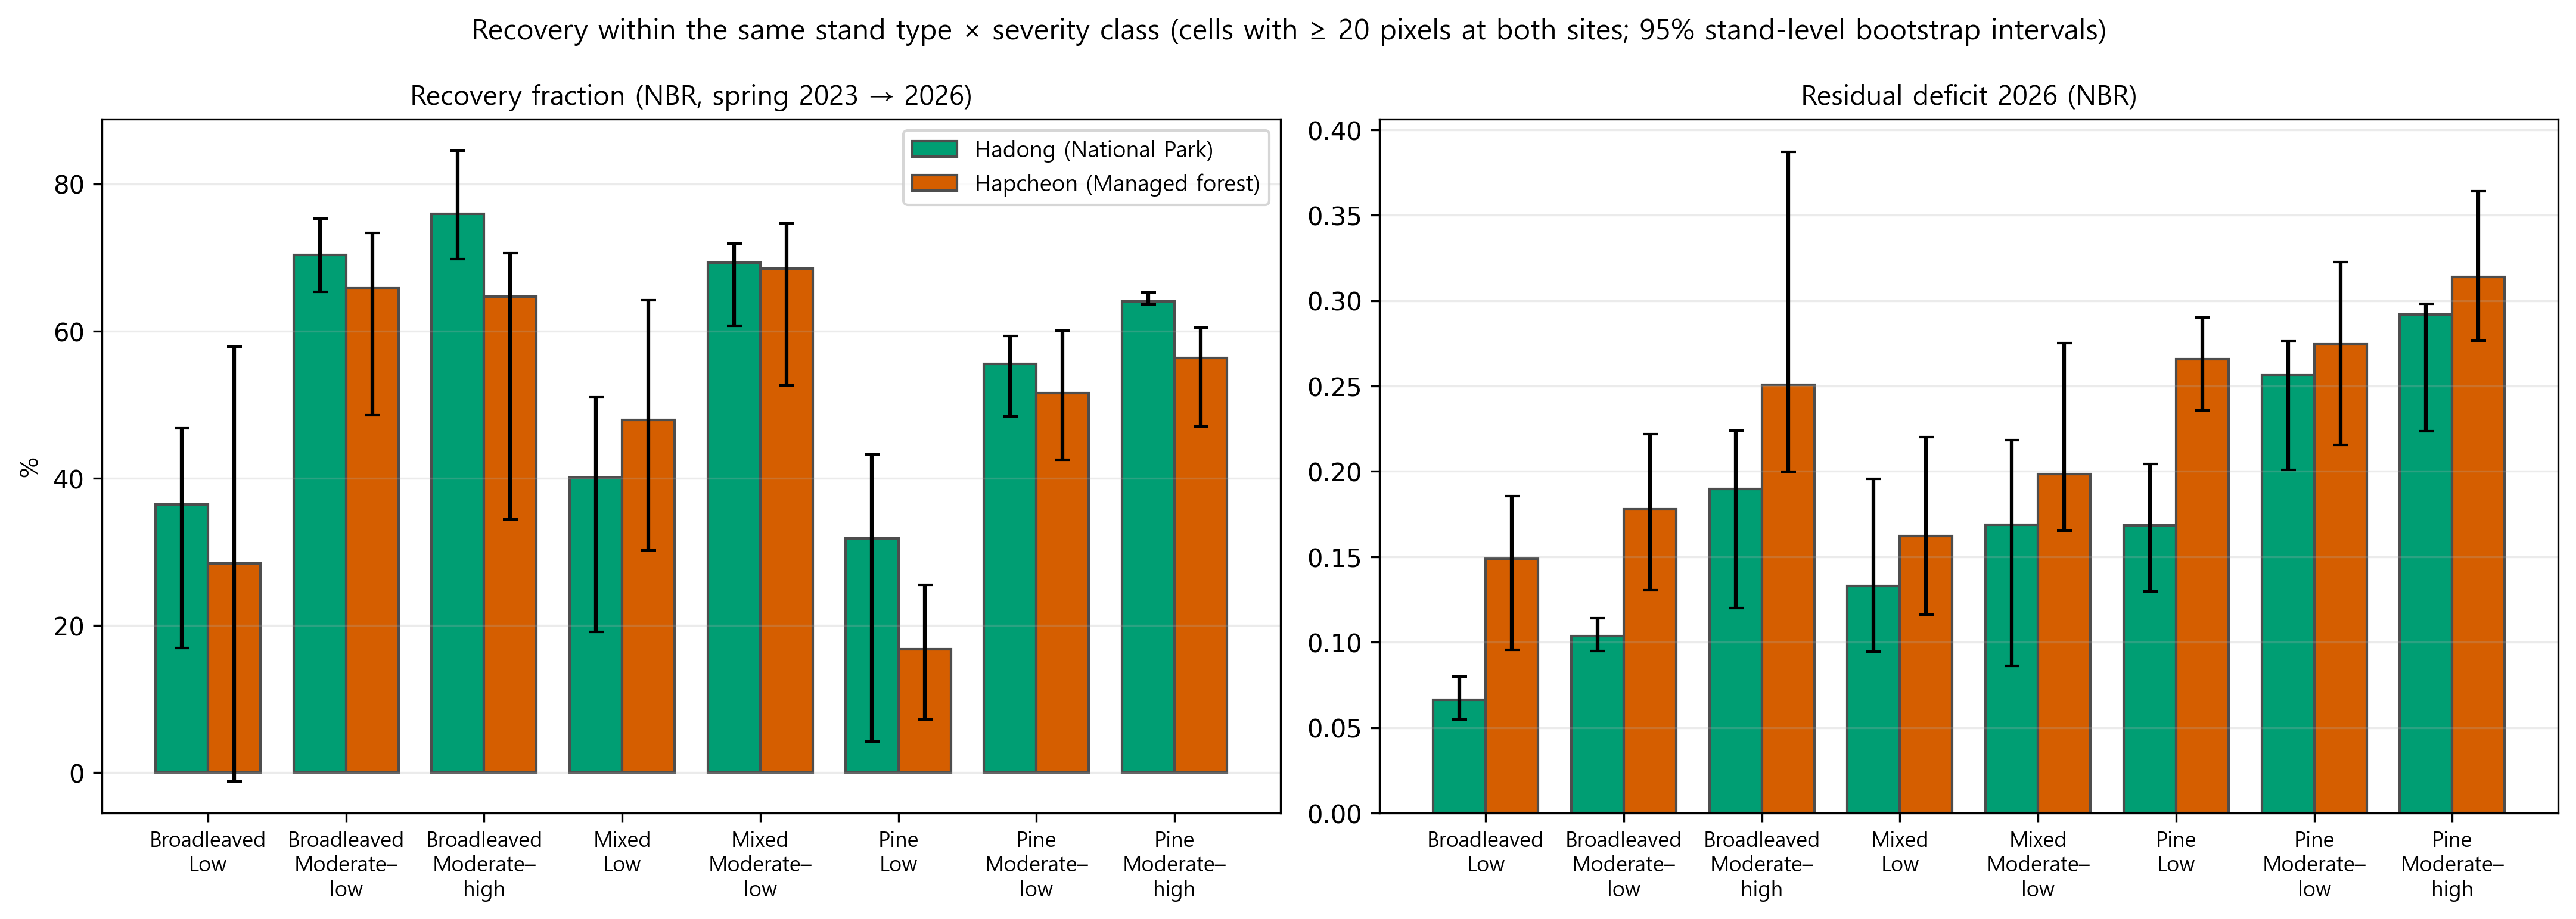
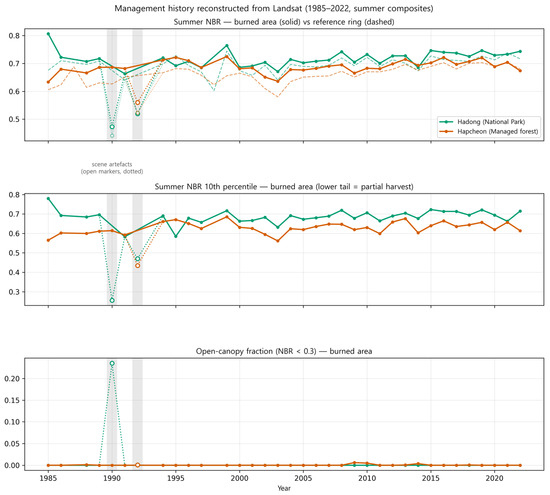

Disclaimer/Publisher’s Note: The statements, opinions and data contained in all publications are solely those of the individual author(s) and contributor(s) and not of MDPI and/or the editor(s). MDPI and/or the editor(s) disclaim responsibility for any injury to people or property resulting from any ideas, methods, instructions or products referred to in the content. |
© 2026 by the authors. Licensee MDPI, Basel, Switzerland. This article is an open access article distributed under the terms and conditions of the Creative Commons Attribution (CC BY) license.