


Abstract
Coal spontaneous combustion fire is a major hazard threatening mine safety and production. Accurate identification of hidden fire sources is the key to preventing and controlling coal spontaneous combustion fires. Given that traditional detection methods are unable to accurately identify high-temperature zones, this study develops an acoustic-signal-based approach for reconstructing the temperature field associated with coal spontaneous combustion. By constructing a two-dimensional acoustic thermometry experimental system for temperature field measurement, multipath acoustic signals were collected in both the air medium and a loose coal medium, respectively. The variation characteristics of the acoustic spectrum, energy attenuation, and travel time were analyzed under different heat source temperatures, media, and sound source positions. The results show that the dominant frequencies of the received signals under different heat source temperatures are concentrated in the range of 1000–1300 Hz. An increase in temperature does not significantly alter the dominant frequency range, but it reduces the peak amplitude of the received signals. Compared with propagation in air, acoustic waves experience greater energy loss in loose coal. Their travel time is also generally longer, indicating that the pore structure alters the propagation path and influences the acoustic propagation process. To account for pore-structure-induced deviations between the actual acoustic propagation path and the geometric path, a path correction coefficient is introduced. Using the compensated correction model, the temperature fields under working conditions of 100 °C, 150 °C, and 200 °C were reconstructed, with peak temperatures of 91.507 °C, 140.554 °C, and 188.665 °C, respectively. The gap between the reconstructed results and those obtained in the air medium is significantly narrowed. This suggests the model effectively corrects path deviations due to pore structure and enhances acoustic reconstruction accuracy for non-uniform temperature fields in loose coal. These findings offer a methodological basis for acoustic temperature field reconstruction and hidden fire source detection in loose coal, with practical value for enhancing mine fire prevention efficiency.
1. Introduction
Coal spontaneous combustion hotspots typically occur within mine goafs. Due to factors such as the shielding effect of the caved coal-rock mass, the poor thermal conductivity of coal, and the complex environment of the goaf, the evolution process exhibits strong concealment [1]. Continued development of these high-temperature regions may eventually lead to spontaneous-combustion disasters and threaten mine safety [2,3,4]. Therefore, determining the internal temperature distribution and locating thermal anomalies are essential for the early recognition and targeted control of coal spontaneous combustion [5].
Acoustic thermometry is a non-contact method that retrieves temperature by measuring travel times or path features of acoustic waves, based on the temperature-dependent sound speed [6,7]. This technique enables non-contact temperature measurement over a broad spatial range while supporting real-time monitoring [8,9,10,11]. It has received extensive attention in the fields of boiler furnace combustion, grain storage, and aero-engine health monitoring [12,13,14]. Temperature field reconstruction is essentially a typical inverse problem [15]. The spatially continuous temperature field is retrieved from the acoustic travel-time data measured along a limited number of propagation paths [16]. Existing acoustic temperature field reconstruction models are mostly based on air or structurally relatively homogeneous media, and typically assume that sound waves propagate along the geometric straight-line path between transducers for reconstruction [17,18,19]. In the loose coal medium, coal particles and pores together constitute a heterogeneous porous structure [20]. Acoustic waves primarily propagate through the gas phase in the pores, and their actual propagation paths are influenced by porosity, pore connectivity, and local structural variations, resulting in path tortuosity, energy attenuation, and travel time deviations [21]. To address deviation of acoustic propagation paths, numerous scholars have conducted relevant research. Kong et al. [22] achieved correction by solving the ray paths in a given sound speed field and then iteratively updating the temperature field together with the acoustic travel-time data. Yan et al. [23] proposed a method for determining the emission angle of three-dimensional eigen-rays. By proposing a novel nonlinear ray-tracing method, simultaneous reconstruction of the three-dimensional non-uniform temperature field and the complex flow field within the boiler was achieved. Zhang et al. [24] constructed a physical model that separates the bidirectional propagation paths of acoustic waves. Using a newly developed nonlinear ray-tracing technique, the three-dimensional non-uniform temperature and complex flow fields within the boiler were reconstructed simultaneously. However, the path-correction studies reviewed above mainly address deviations associated with sound-speed variations [25]. Applying these methods to loose coal also requires consideration of additional propagation effects caused by its heterogeneous pore structure.
To address this problem, this study incorporates pore-structure-induced propagation deviations into travel-time-based temperature field reconstruction, with the aim of improving its applicability to loose coal. Accordingly, a two-dimensional acoustic test platform was developed to investigate a locally heated non-uniform temperature field. Multipath acoustic responses measured in air and loose coal were comparatively examined, with particular attention to their spectral characteristics under different experimental conditions. The mechanisms responsible for variations in acoustic travel time were further analyzed. A temperature field reconstruction model incorporating the path correction coefficient was established to compensate for porous propagation-induced deviations. Its effectiveness in enhancing the reconstruction accuracy of non-uniform temperature fields in loose coal was evaluated by comparing the inversion results obtained before and after correction.
2. Materials and Methods
2.1. Sample Preparation
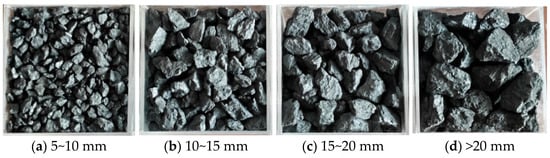
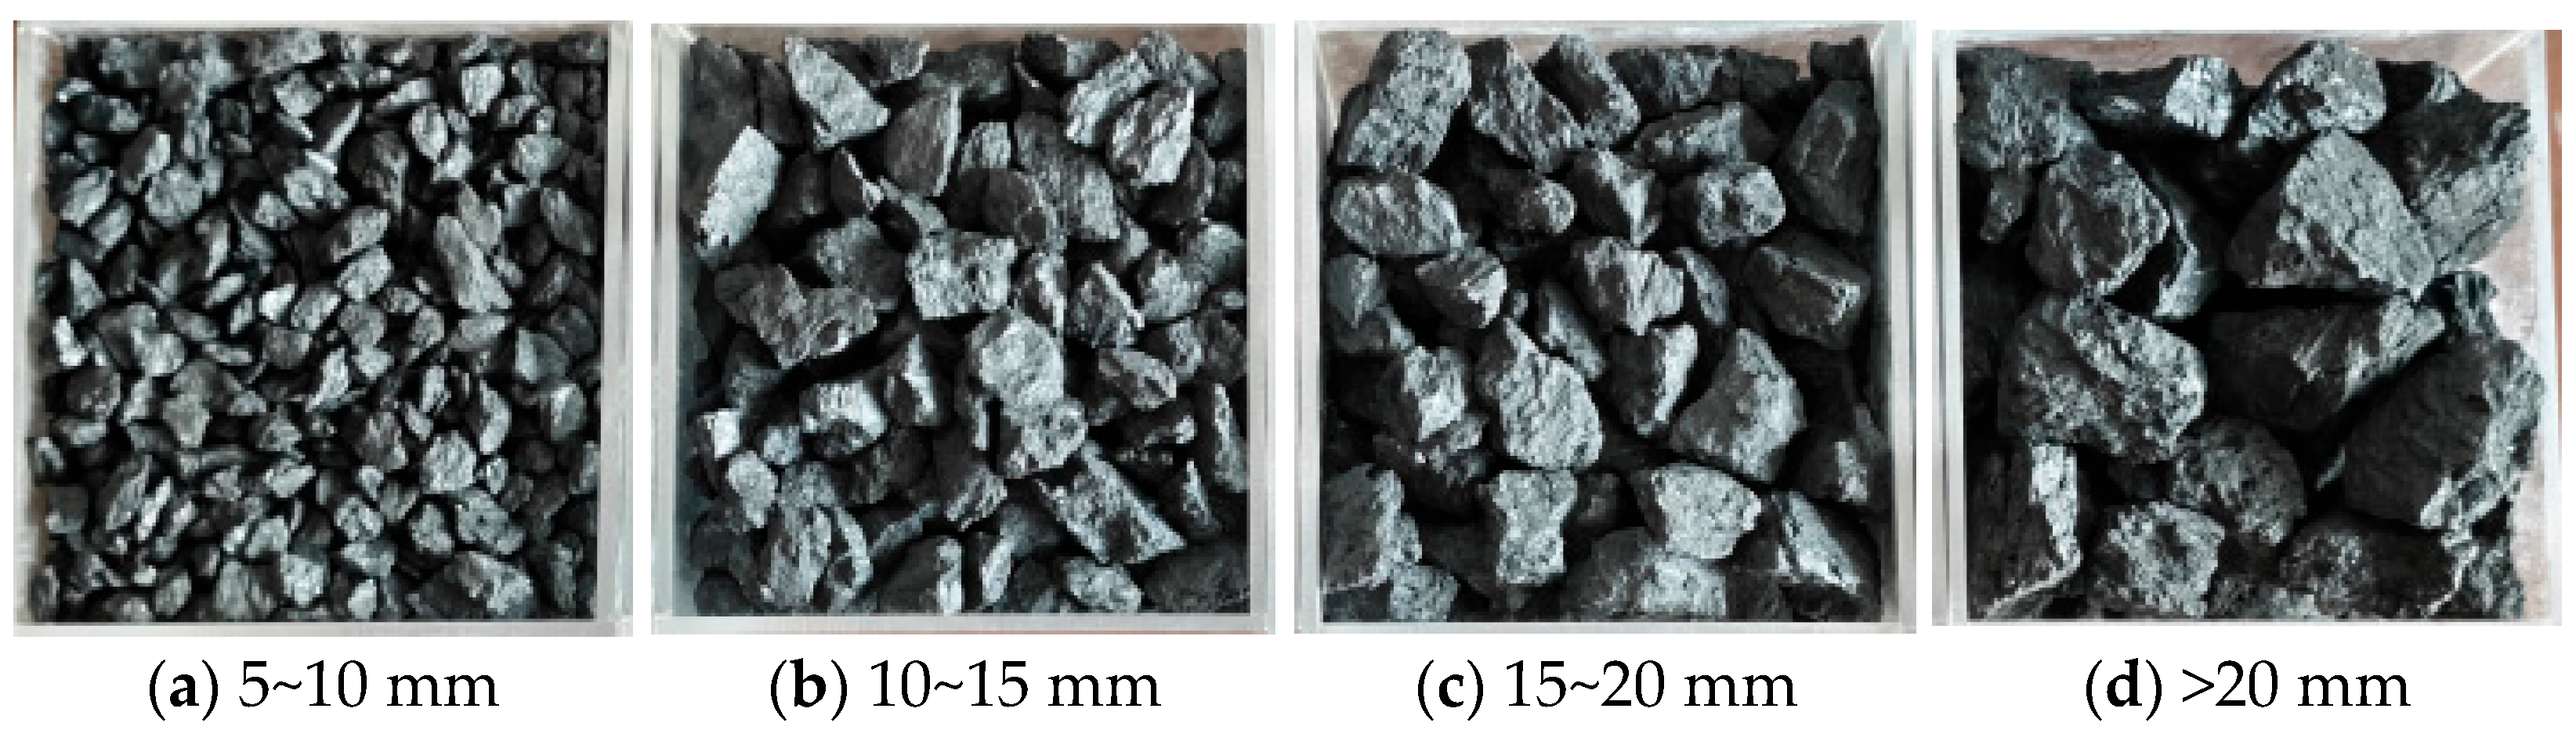
The coal samples collected from the field were transported to the laboratory. After being crushed by a jaw crusher, the coal samples were sieved into four different particle size ranges: 5–10 mm, 10–15 mm, 15–20 mm, and >20 mm. The 15–20 mm fraction was used in all loose-coal acoustic tests to maintain a consistent particle-size range across experimental conditions. The same sample preparation and initial packing procedures were followed to reduce variations in travel time and attenuation associated with differences in sample state. The experimental samples are shown in Figure 1.
Figure 1.
Experimental samples with different particle size ranges.
2.2. Experimental Procedure
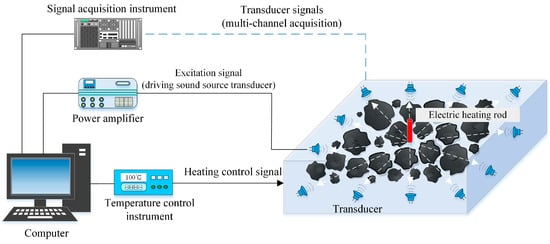
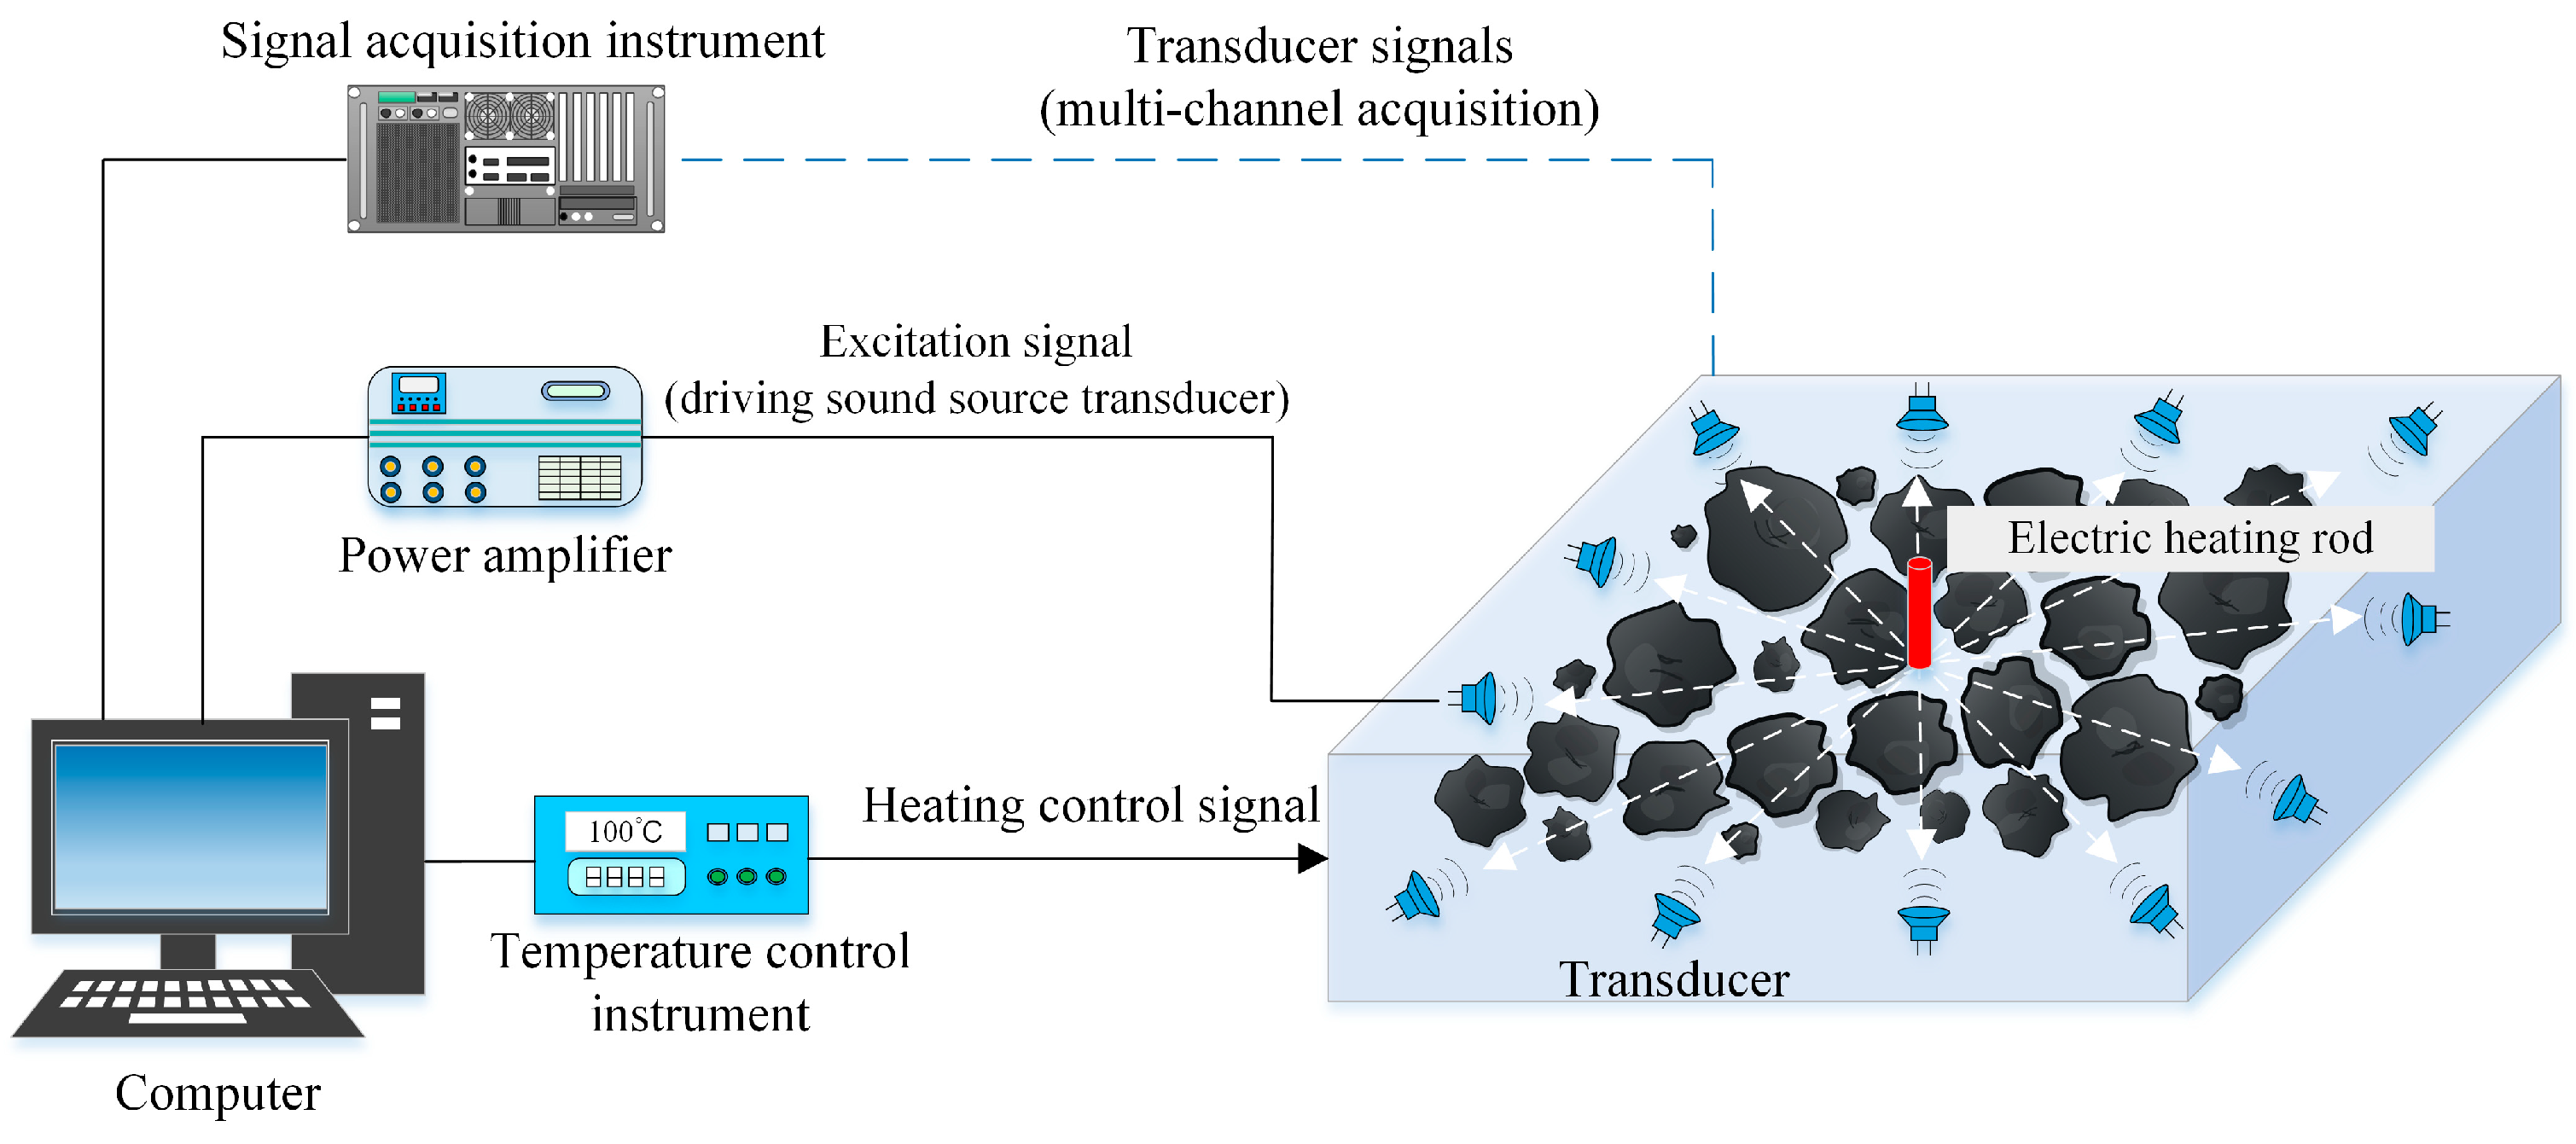
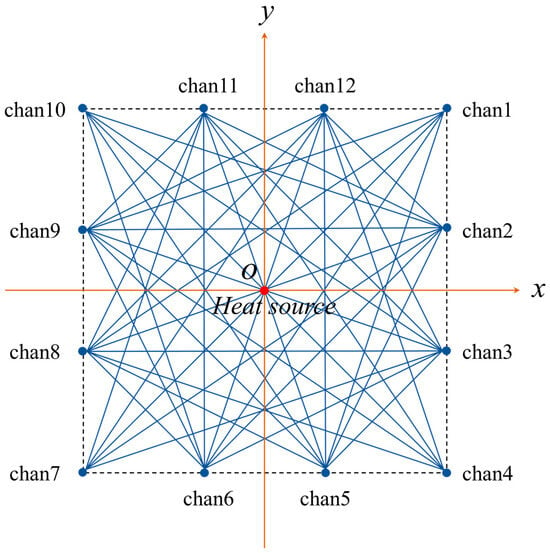
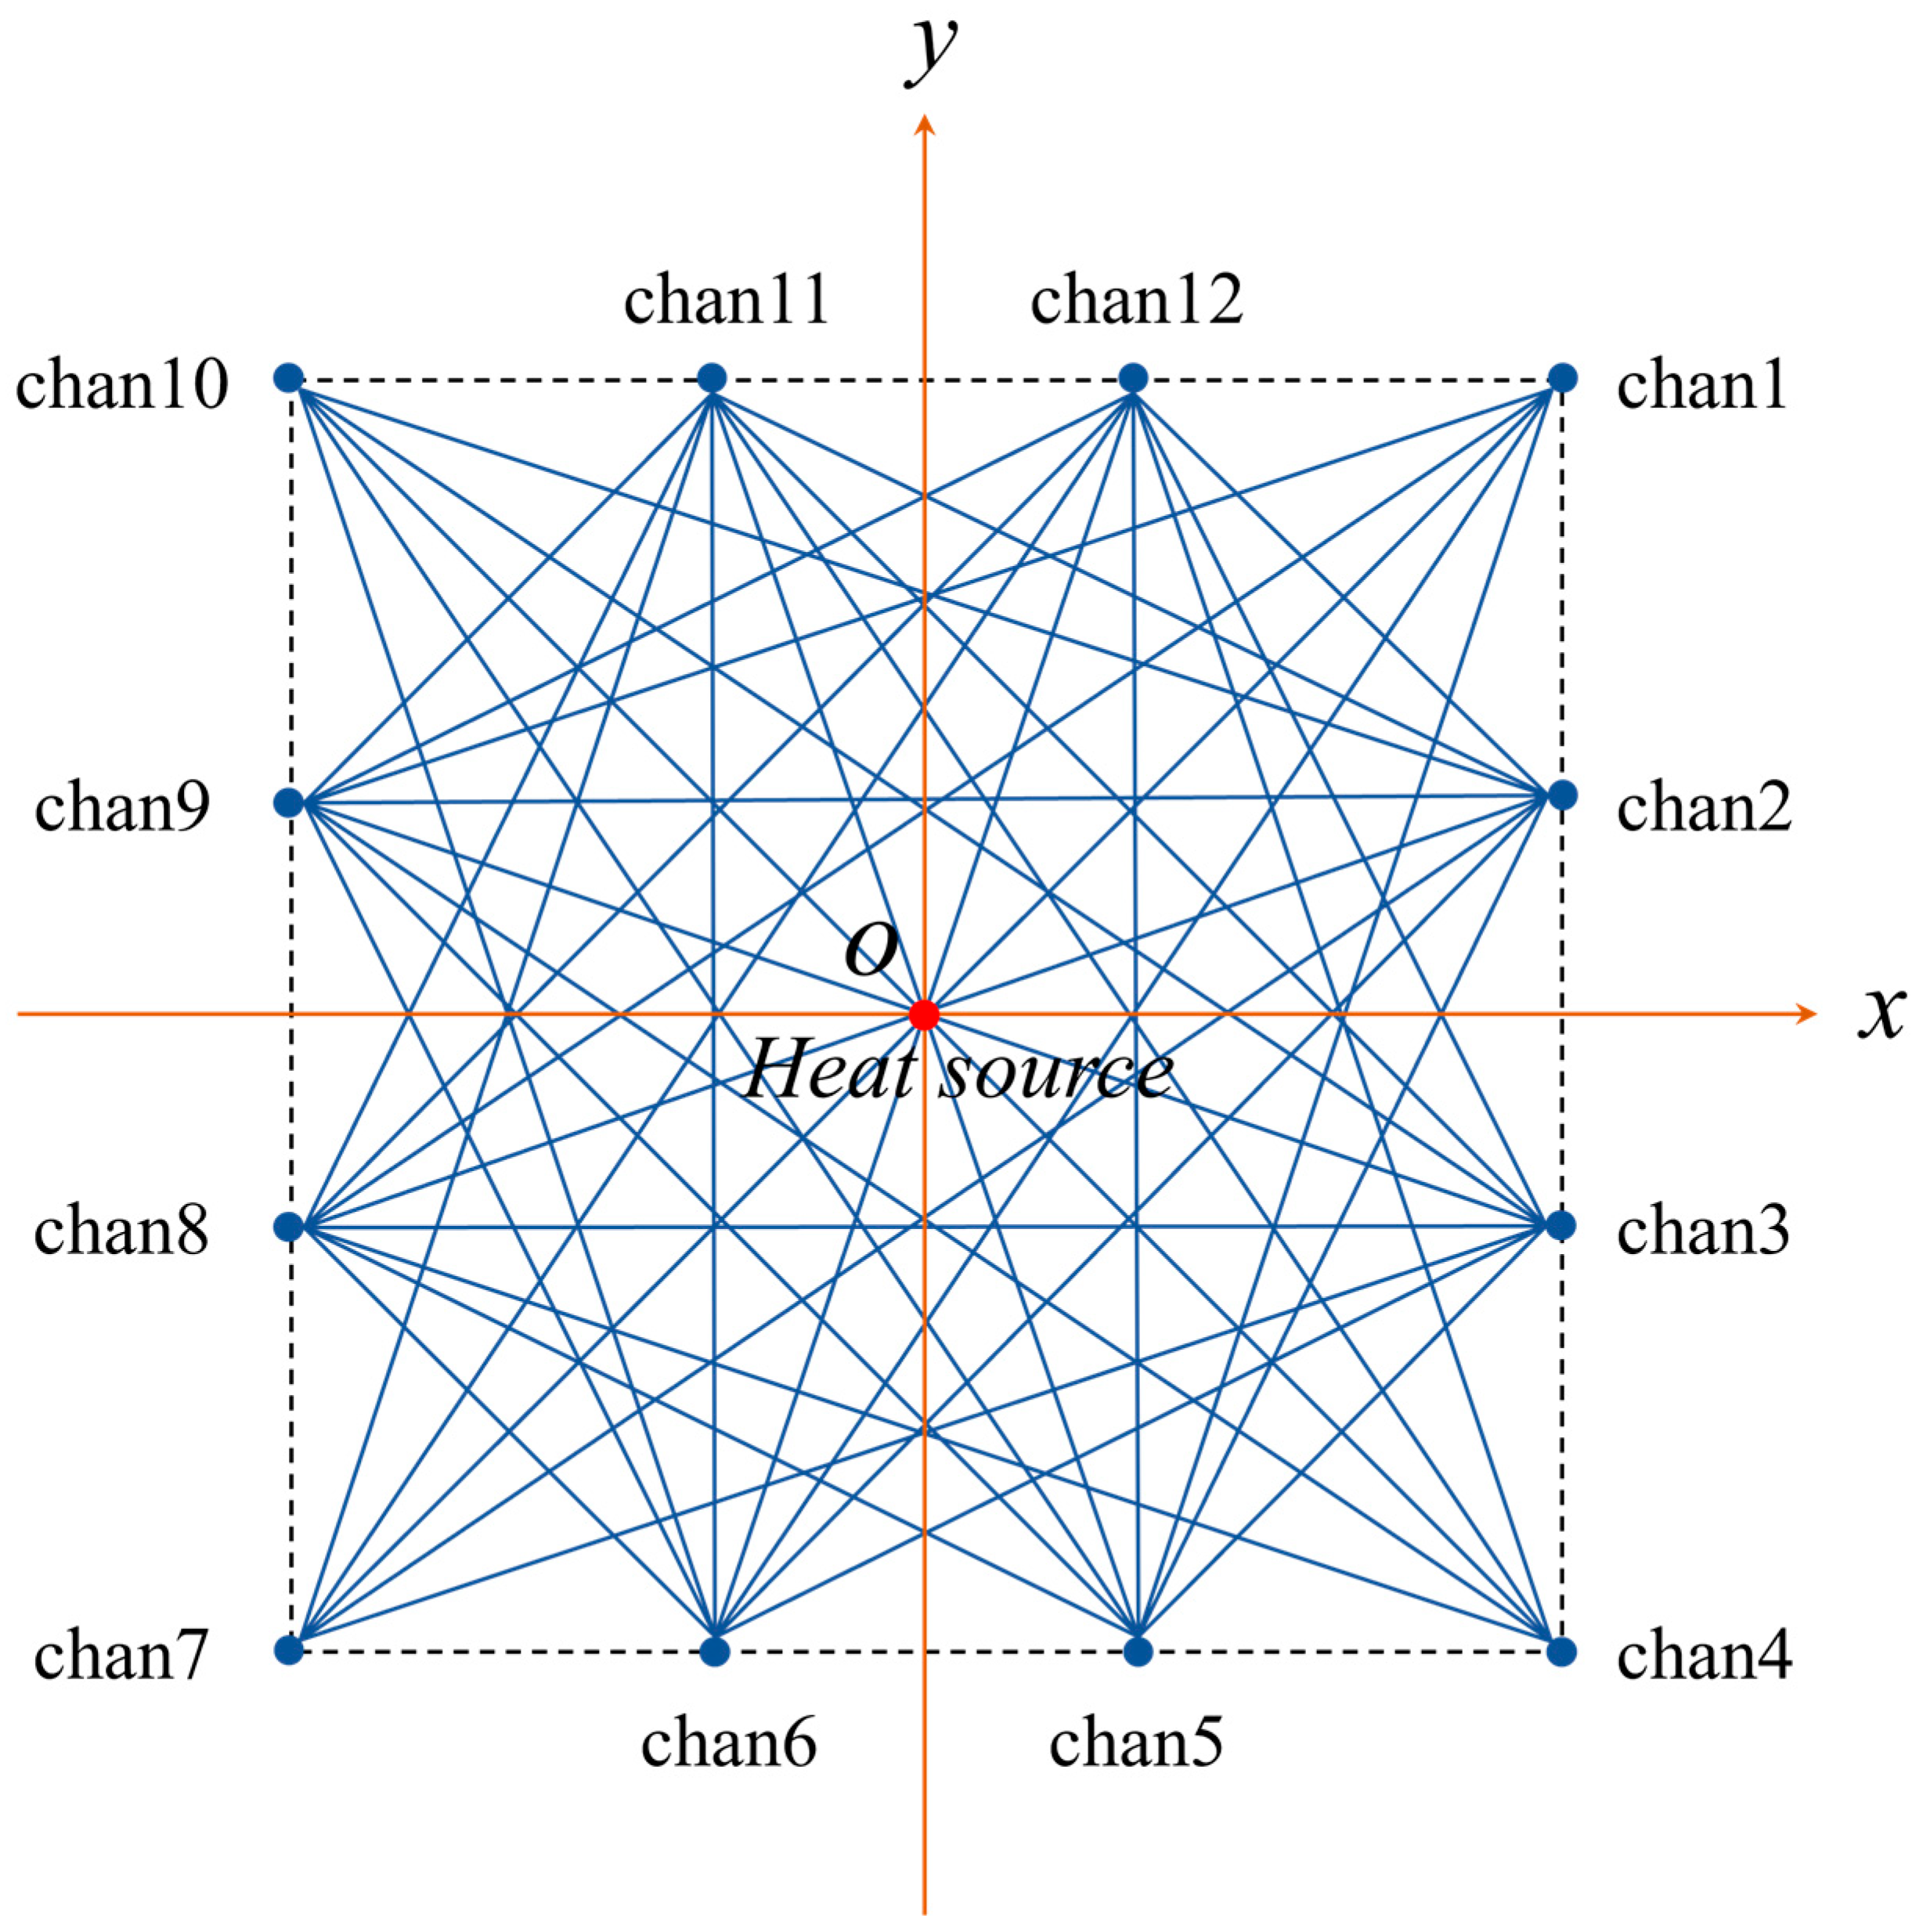
To investigate the influence of the non-uniform temperature field on acoustic wave propagation characteristics, a two-dimensional acoustic thermometry experimental system was designed and constructed, as shown in Figure 2. The experimental section adopts a square structure of 0.8 m × 0.8 m. A controllable electric heating rod was placed at the center as the local heat source. The heating power and duration were adjusted to generate a non-uniform temperature field as heat was transferred from the central heating rod to the surrounding region. The measurement state was defined when the heat-source temperature reached 100, 150, or 200 °C. Twelve acoustic measurement points were evenly arranged around the perimeter of the experimental section. The adjacent measurement points are equally spaced, and their installation heights are kept consistent, so as to ensure that the acoustic wave propagation can be approximated as two-dimensional plane propagation. In the experiment, a single-point excitation and multi-point reception scheme is employed. The acoustic signal was emitted by the designated source, while the remaining measurement points simultaneously recorded the response signals. By changing the position of the sound source, multiple acoustic wave propagation paths with different spatial positions and propagation directions can be obtained. The multipath acoustic dataset acquired at each prescribed heat-source temperature (100, 150, or 200 °C) was used separately for reconstruction.
Figure 2.
Two-dimensional acoustic thermometry experimental system.
The acquired source–receiver signals were used to determine the acoustic travel times [26]. Since temperature variations alter the local sound speed, the travel time extracted from each source–receiver signal contains the integrated temperature-dependent acoustic information along its propagation path. The measured travel times from multiple intersecting paths are combined with the corresponding geometric path lengths to establish the path-integral equations. By solving the slowness distribution of the discretized elements and applying the sound speed–temperature relationship, the spatial temperature field within the measurement region is reconstructed.
2.3. Calculation Method
2.3.1. Geometric Model of Sound Wave Propagation Path
To describe the spatial behavior of acoustic wave propagation within a non-uniform temperature field, a two-dimensional Cartesian coordinate system Oxy is established in the measurement region. The center of the measurement region is taken as the coordinate origin (0, 0). The measurement region is a square with a side length of 0.8 m, and its boundary ranges are as follows:
The acoustic propagation paths are numbered in a “source–receiver” format and are denoted as chani–chanj.
where chani denotes the measurement point serving as the sound source, and chanj denotes the measurement point receiving the acoustic signal. This numbering scheme can identify the propagation direction of acoustic waves and the corresponding geometric path relationships.
For any given propagation path, the geometric straight-line path length is defined as:
where Lij is the geometric propagation distance between measurement points i and j, m; xi and yi are the coordinates of chani, and xj and yj are the coordinates of chanj. This path length reflects the geometric propagation scale of the acoustic wave within the measurement region and determines the baseline level of the acoustic travel time.
Acoustic paths located on the same side of the boundary mainly propagate along the edge of the measurement region, resulting in limited spatial coverage of the internal temperature field. Therefore, during the path modeling process, the paths between measurement points on the same side of the boundary are not used for temperature field reconstruction. Among the 66 measurement-point combinations formed by the 12 transducers, after excluding the 24 same-side boundary paths, a total of 42 cross-region effective propagation paths are retained. The above paths pass through the measurement region from different positions and directions, forming a crossed-ray network that covers the central heat source and its surrounding area, as shown in Figure 3.
Figure 3.
Distribution of acoustic wave propagation paths in the measurement region.
2.3.2. Calculation Method of Acoustic Thermometry
The sound speed in a gaseous medium is governed by its thermodynamic state. Under the ideal-gas assumption, sound speed is primarily controlled by temperature, and its expression is given by:
where c is the sound speed, m/s; γ is the specific heat ratio; R is the gas constant, J/(mol·K); T is the absolute temperature, K; and m is the molar mass of the gas, kg/mol. This equation establishes the basic relationship between sound speed and temperature, providing the physical basis for inferring temperature from measured acoustic travel time.
When the temperature distribution of the medium is uniform, the sound speed can be approximately regarded as constant in space. The acoustic propagation path can usually be simplified as a straight line, and the acoustic travel time can be expressed as:
where L is the geometric propagation distance between the sound source and the receiving point, m; t is the acoustic travel time, s; c is the sound speed, m/s; and T is the absolute temperature, K. This equation applies to a uniform temperature field, while the following expression describes acoustic propagation when sound speed varies spatially in a non-uniform field.
When the sound speed varies continuously with spatial coordinates, the acoustic propagation path follows Fermat’s principle, propagating along the path with the minimum travel time. The propagation of the acoustic ray in space can be expressed as:
where Γ denotes the actual propagation path of the acoustic ray, ds is the differential arc length element along the path, and c(r) is the spatial distribution function of sound speed.
2.3.3. Establishment of Porosity Correction Model
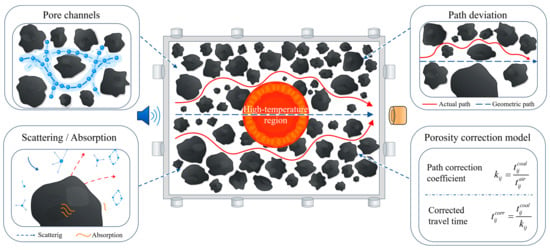
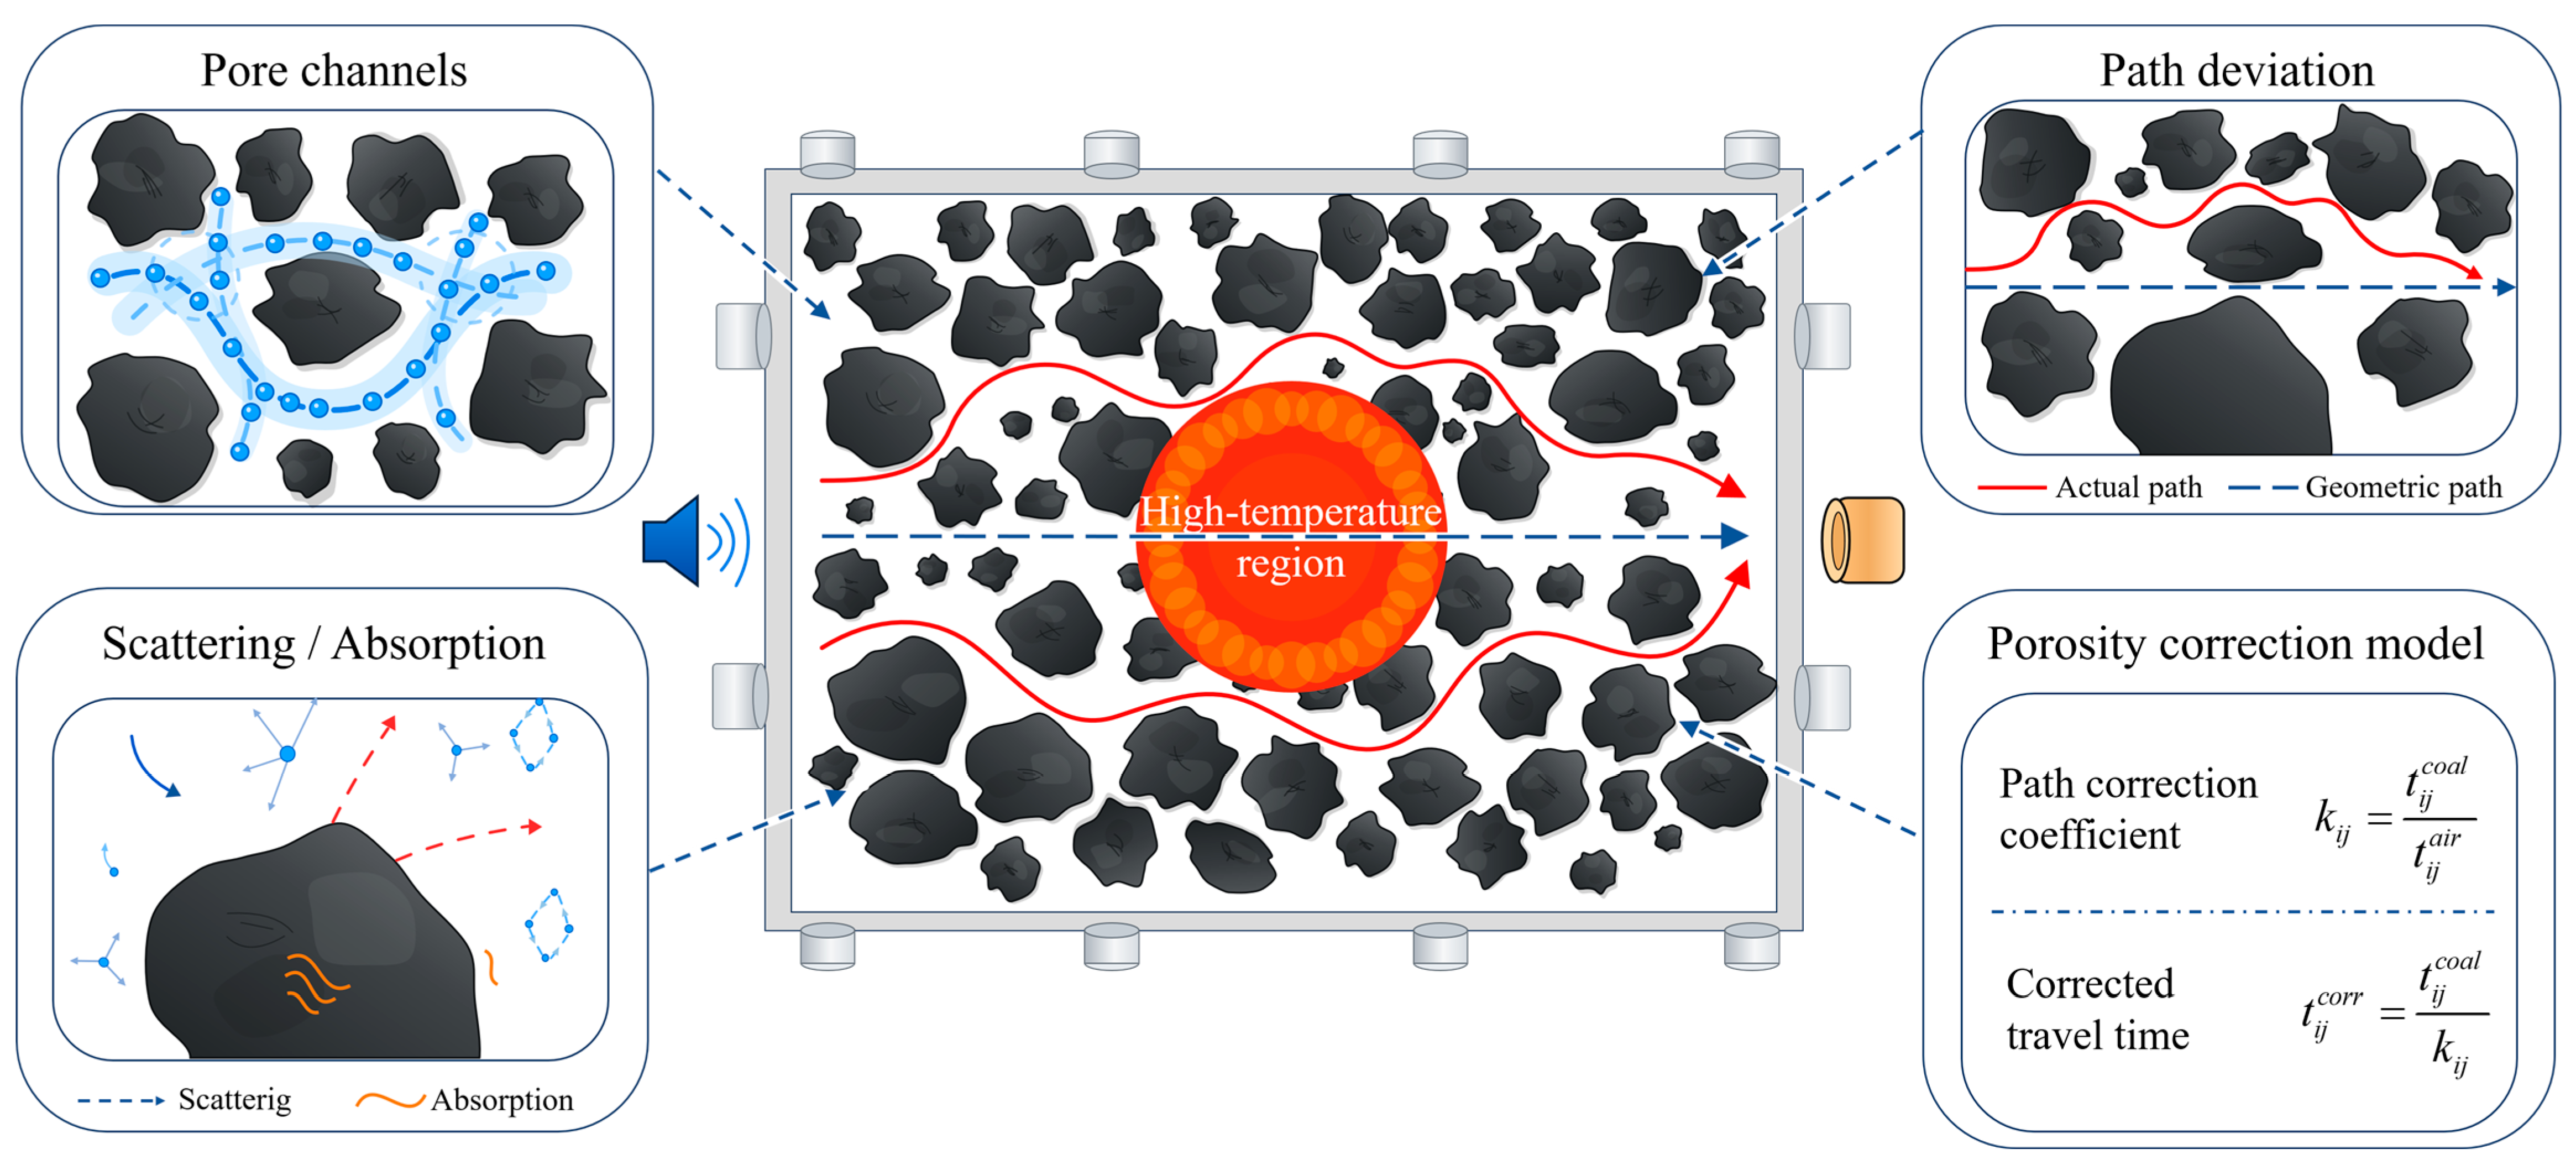
Due to the tortuous propagation of acoustic waves in the pore structure of loose coal, the actual propagation path length is not equal to the geometric path length. When the porosity is high and the pore connectivity is good, the acoustic wave propagation path is relatively close to a geometric straight line. When the porosity is low, or the local pore structure is complex, the acoustic wave undergoes more significant tortuous propagation within the pore channels, and the actual path length becomes greater than the geometric path length [27].
Assume that the geometric path length between the transducers is Lij. The actual propagation path length of the acoustic wave in the pore structure is given by:
where is the actual propagation path length of the acoustic wave, m; Lij is the geometric path length between the transducers, m; and kij is a dimensionless path correction coefficient, which represents the amplification factor of the equivalent propagation path length relative to the geometric path length in the loose coal medium. In the air medium, the acoustic wave propagation path is approximately a straight line, in which case kij ≈ 1. Due to the tortuous propagation paths caused by the pore structure, kij is generally greater than 1. The values of kij vary among different propagation paths. This equation describes the equivalent increase in acoustic propagation distance caused by the tortuous pore structure of loose coal relative to the geometric path.
Combining the acoustic travel time data under air and loose coal conditions, the path correction coefficient can be defined as:
where is the acoustic travel time measured under loose coal conditions, s; is the acoustic travel time measured along the same propagation path under air conditions, s. The correction coefficient reflects the additional propagation effect of the porous structure, and the corrected travel time is used for subsequent temperature field inversion.
The corrected equivalent acoustic travel time is expressed as:
where is the corrected equivalent acoustic travel time, s.
2.3.4. Correction Coefficient for Temperature Field Reconstruction
To mitigate the influence of internal porosity variations in loose coal on temperature field reconstruction results, path correction is applied to the acoustic travel time.
The original temperature field reconstruction process can be expressed as a system of linear equations in discrete form [28]:
where A is the path length coefficient matrix; x is the slowness vector to be solved, m/s; and b is the measured acoustic travel-time vector, s. This equation expresses each measured travel time as the sum of path-length-weighted slowness values, providing the discrete basis for temperature field reconstruction.
In the air medium, b mainly reflects the influence of temperature variation on sound speed. Under loose coal conditions, the measured acoustic travel time bcorr includes both the sound-speed variation caused by temperature changes and the change in actual propagation path length induced by porosity differences. If bcorr is directly inputed into the reconstruction equations, the inversion model will mistakenly interpret the path-length variation as a temperature change, thereby affecting the reconstruction results. Therefore, the correction coefficients of all paths are assembled into a diagonal matrix K, which is used to correct the acoustic travel time vector in loose coal as follows:
The correction matrix compensates for pore-structure-induced travel-time deviations, allowing the reconstructed slowness distribution to better represent the temperature-dependent acoustic response.
The corrected acoustic travel time vector bcorr is then input into the original temperature field reconstruction model as follows:
By solving the equations, the corrected slowness distribution xcorr is obtained, and the corrected temperature field distribution is then calculated based on the relationship between sound speed and temperature.
Measured travel times are assembled into a vector, and the corresponding geometric path lengths form the path-length coefficient matrix. For loose coal, the travel-time vector is corrected using the path-specific coefficients before inversion. The slowness distribution is then solved and converted into sound speed, from which the temperature of each discrete element is calculated to reconstruct the two-dimensional temperature field.
3. Results and Discussion
Temperature changes the sound speed and consequently affects acoustic propagation. Therefore, spectral characteristics, energy attenuation, and travel time were selected to characterize the acoustic response from the frequency-domain, energy-transmission, and propagation-time perspectives, respectively. Among them, travel time is directly used for temperature-field reconstruction. Spectral characteristics and energy attenuation are used to characterize signal response and propagation losses under different temperature and medium conditions.
3.1. Acoustic Spectral Response Characteristics
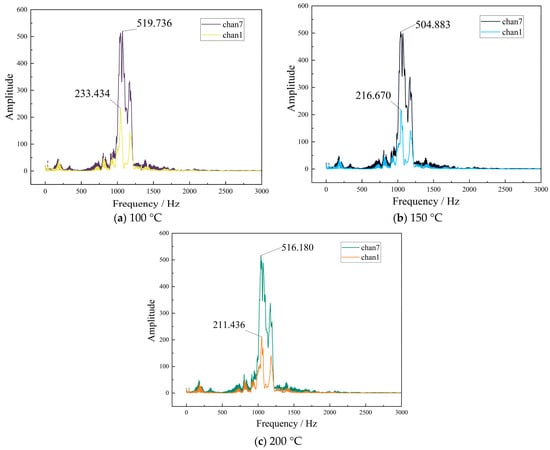
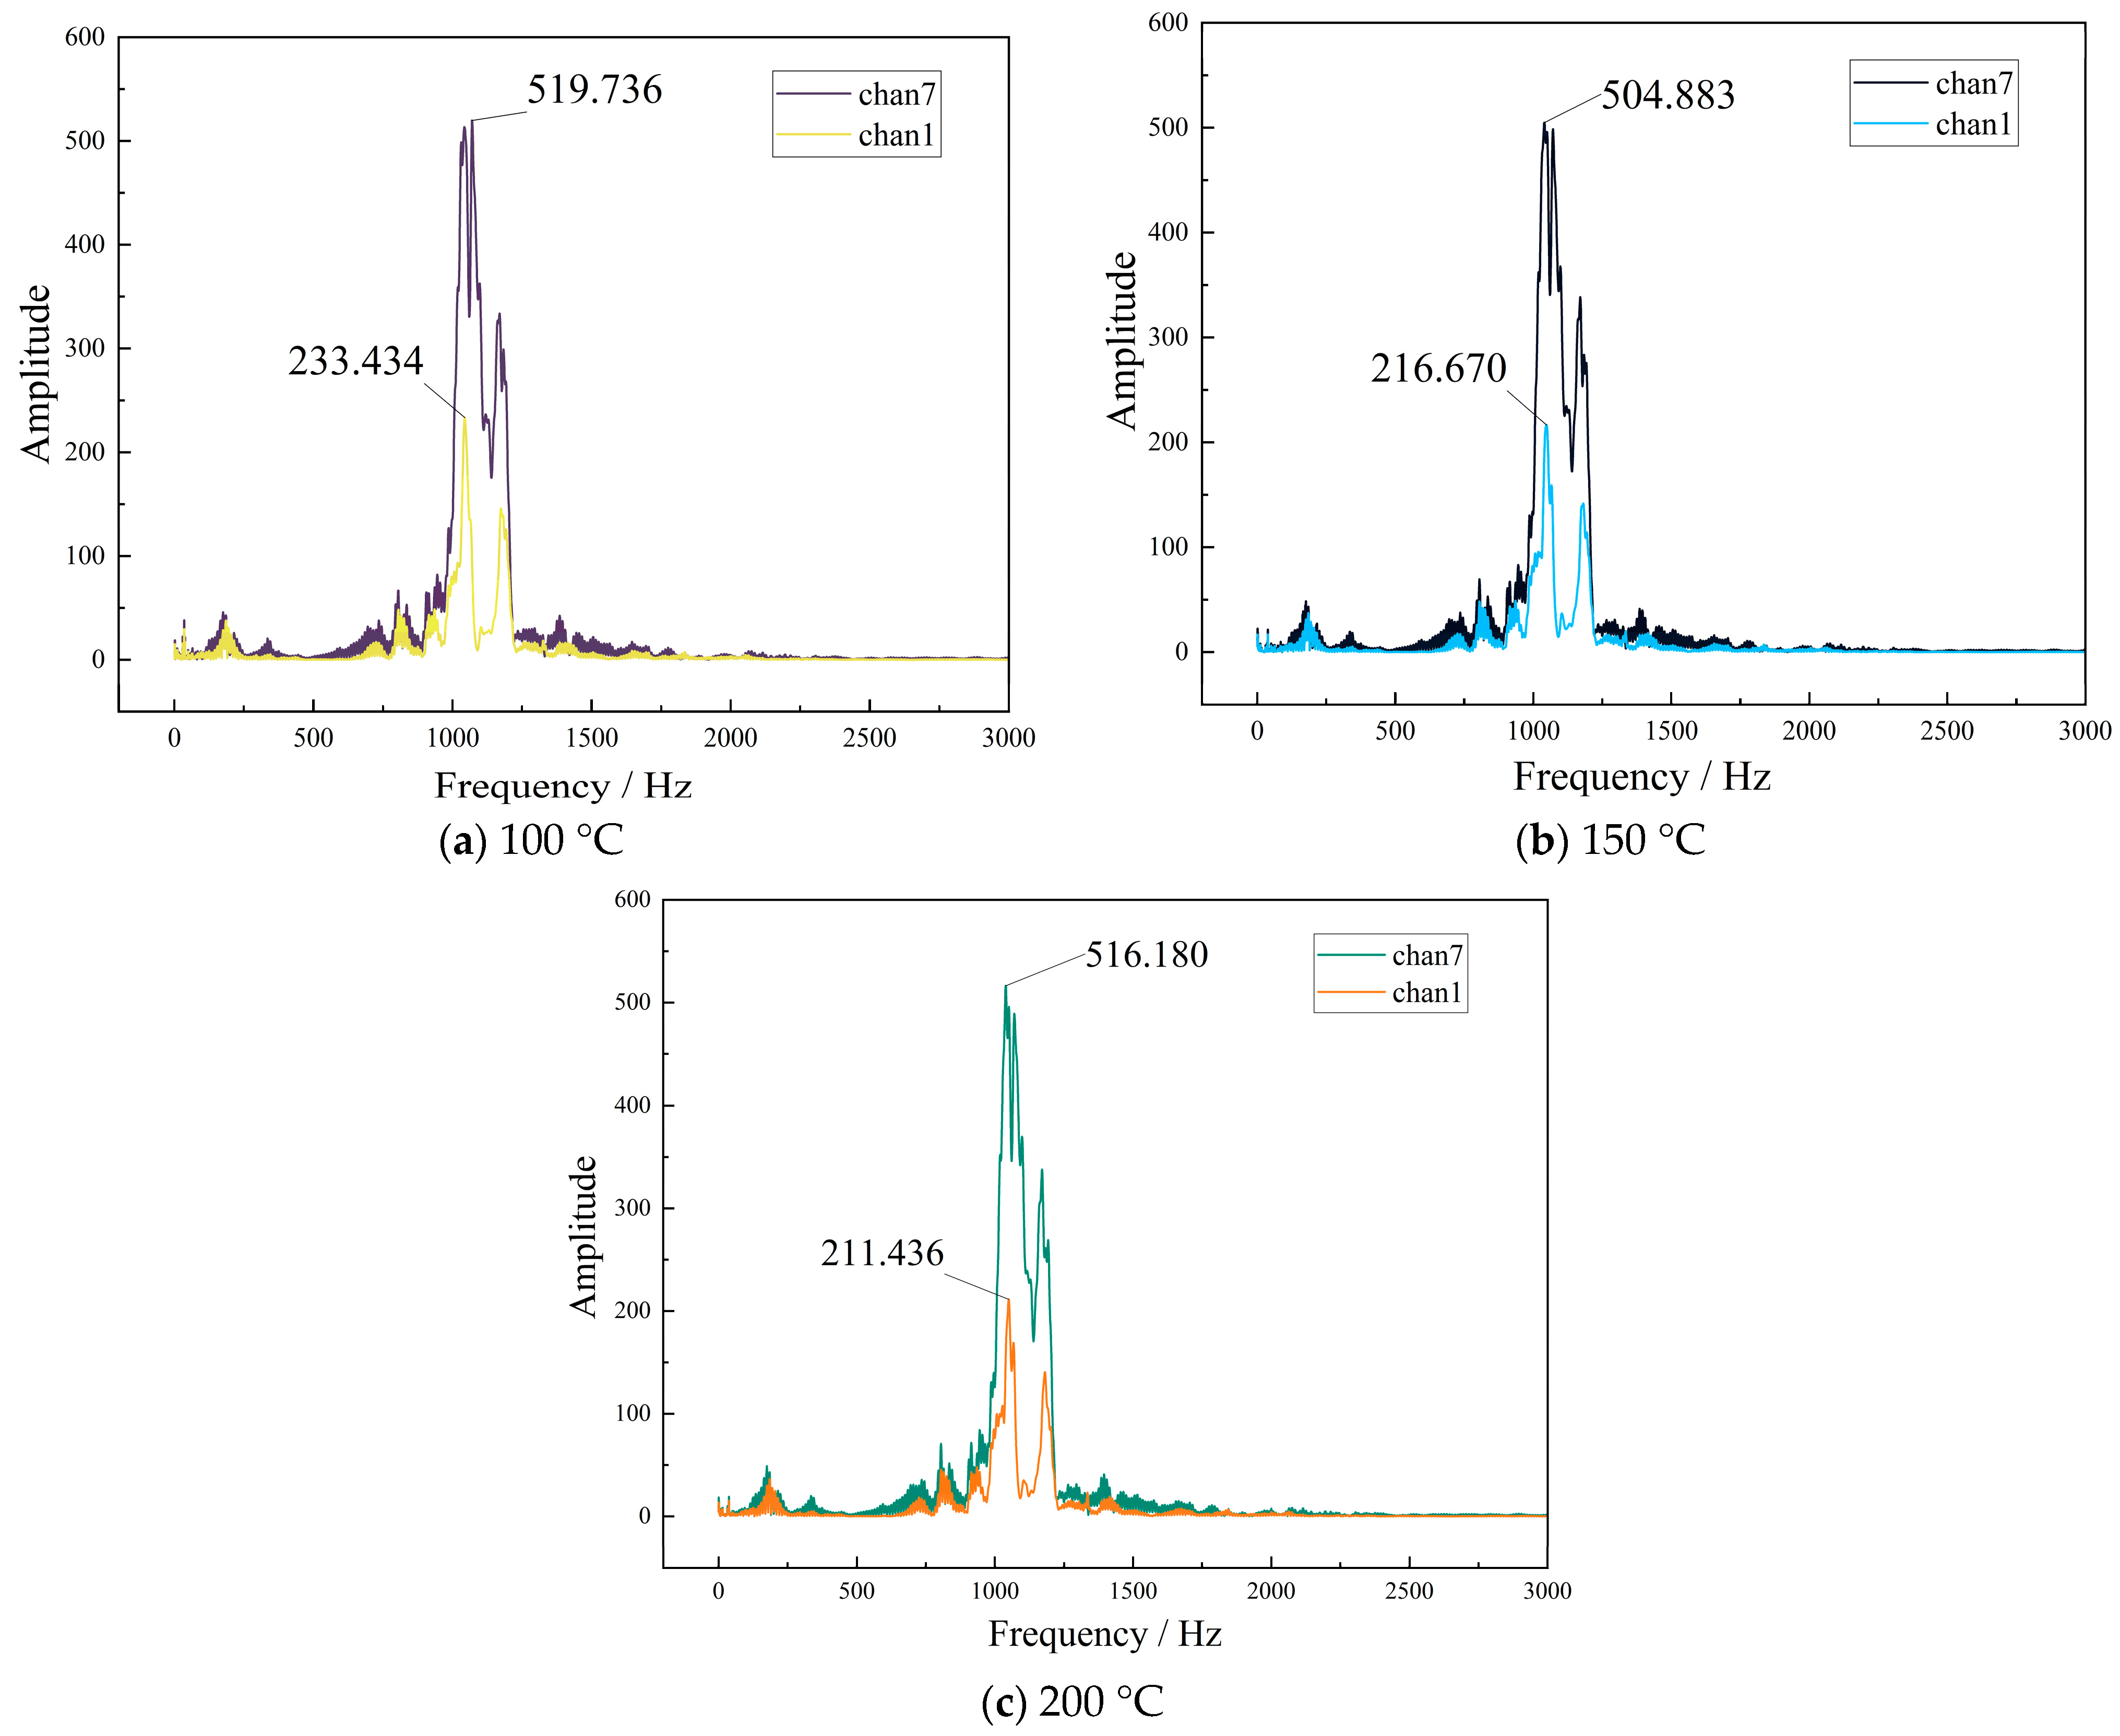
To analyze the influence of temperature variation on the acoustic spectral characteristics in a non-uniform temperature field, the propagation path with chan7 as the source and chan1 as the receiver is selected. By comparing the amplitude spectra of acoustic signals under different heat source center temperatures, the acoustic spectral response characteristics are obtained, as shown in Figure 4.
Figure 4.
Amplitude-frequency variations of acoustic signals under different temperatures.
It can be seen from Figure 4 that, under different heat source temperature conditions, the dominant frequency peak of the received signal on the chan7–chan1 path is mainly concentrated in the range of 1000–1300 Hz. The dominant frequency distribution range of the signal remains generally consistent, indicating that the temperature increase does not significantly change the dominant frequency range of the acoustic signal. The dominant frequencies of acoustic wave propagation are concentrated near the original excitation frequency band. As the heat source center temperature increased from 100 °C to 150 °C and 200 °C, respectively, the main peak amplitude of the signal decreased from 233.434 Pa to 216.670 Pa and 211.436 Pa, respectively. This indicates that the non-uniform temperature field has a relatively limited effect on the dominant frequency position of the acoustic wave, while the temperature gradient plays a modulating role in the energy distribution and propagation intensity during acoustic wave propagation.
3.2. Acoustic Energy Attenuation Variations
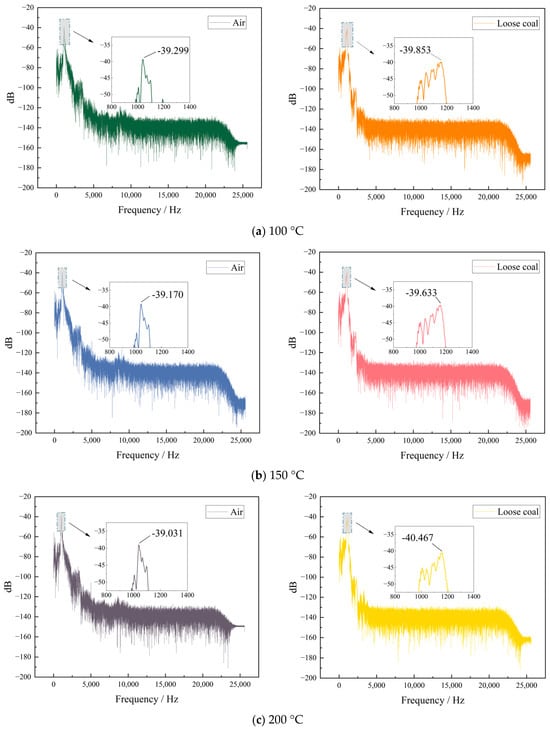
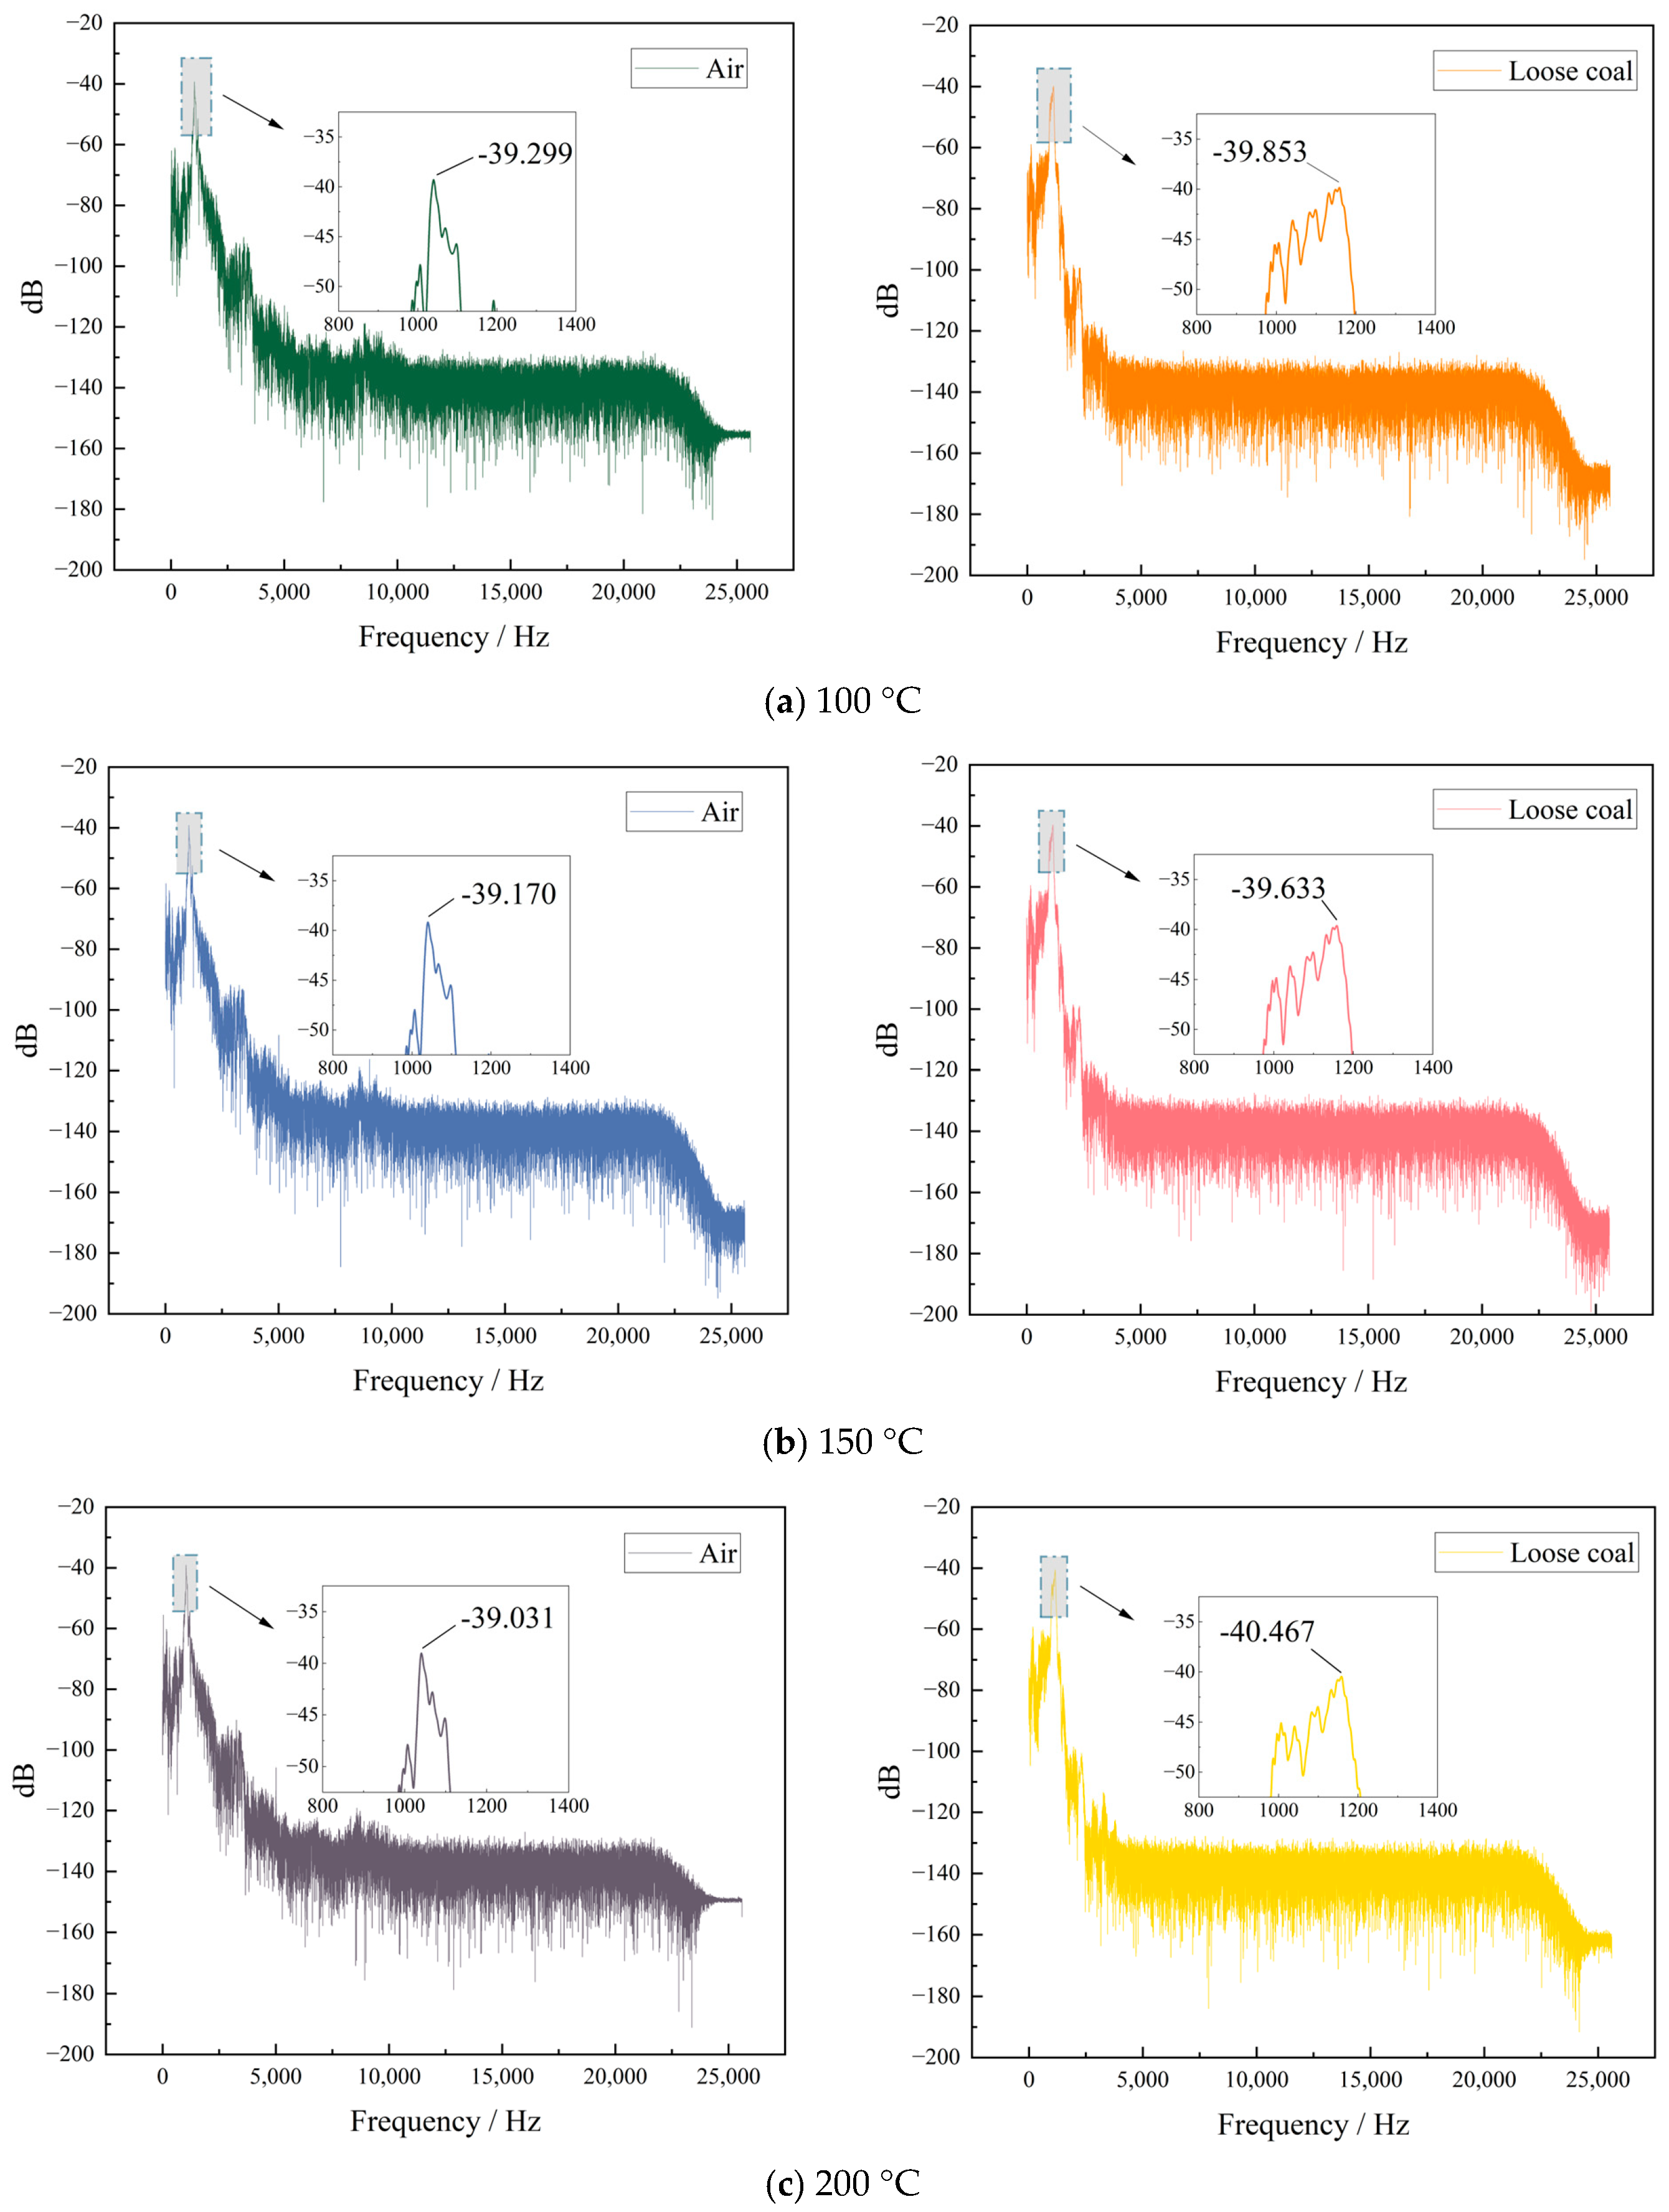
To analyze the influence of medium conditions on the energy attenuation characteristics of acoustic wave propagation, chan6 is selected as the sound source and chan12 as the receiver. Fourier transform analysis was performed on the signals in air and loose coal under different heat source center temperatures, and the variations in acoustic energy attenuation were obtained, as shown in Figure 5.
Figure 5.
Acoustic wave energy attenuation under different medium conditions.
It can be seen from Figure 5 that, under the same heat source temperature, the peak sound pressure in the loose coal medium is generally lower than that in the air medium. This indicates that the energy attenuation of acoustic waves is relatively significant when propagating in the loose coal medium. When the heat source center temperatures are 100, 150, and 200 °C, the peak sound pressures of the signals in the air medium are −39.299, −39.170, and −39.031 dB, respectively, and those in the loose coal medium are −39.853, −39.633, and −40.467 dB, respectively. The peak sound pressure in the air medium exhibits relatively minor variations with increasing temperature, generally remaining around −39 dB. The peak sound pressure in the loose coal medium exhibits relatively obvious fluctuations, especially under the 200 °C condition, where the sound pressure level drops to −40.467 dB. This indicates that the loose coal medium exerts a stronger attenuation effect on the acoustic wave propagation energy. The main reason for the above-mentioned differences is that air is a relatively homogeneous medium, and the acoustic propagation path is essentially close to the geometric straight line between the transducers. The energy loss during propagation is relatively small. However, the loose coal medium is jointly composed of a particle skeleton and a pore structure. When acoustic waves propagate in the pore gas phase, they are affected by factors such as particle scattering, pore absorption, and path tortuosity, leading to a reduction in signal intensity at the receiver [29]. Therefore, the influence of the loose coal medium on acoustic wave propagation is reflected not only in the variation in travel time but also in energy attenuation.
3.3. Variation of Acoustic Wave Travel Time
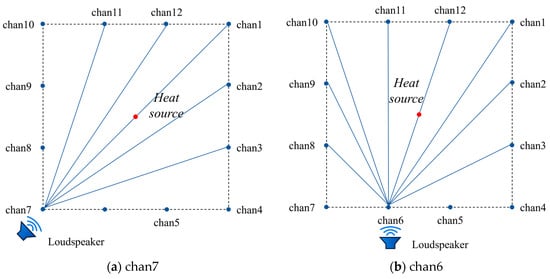
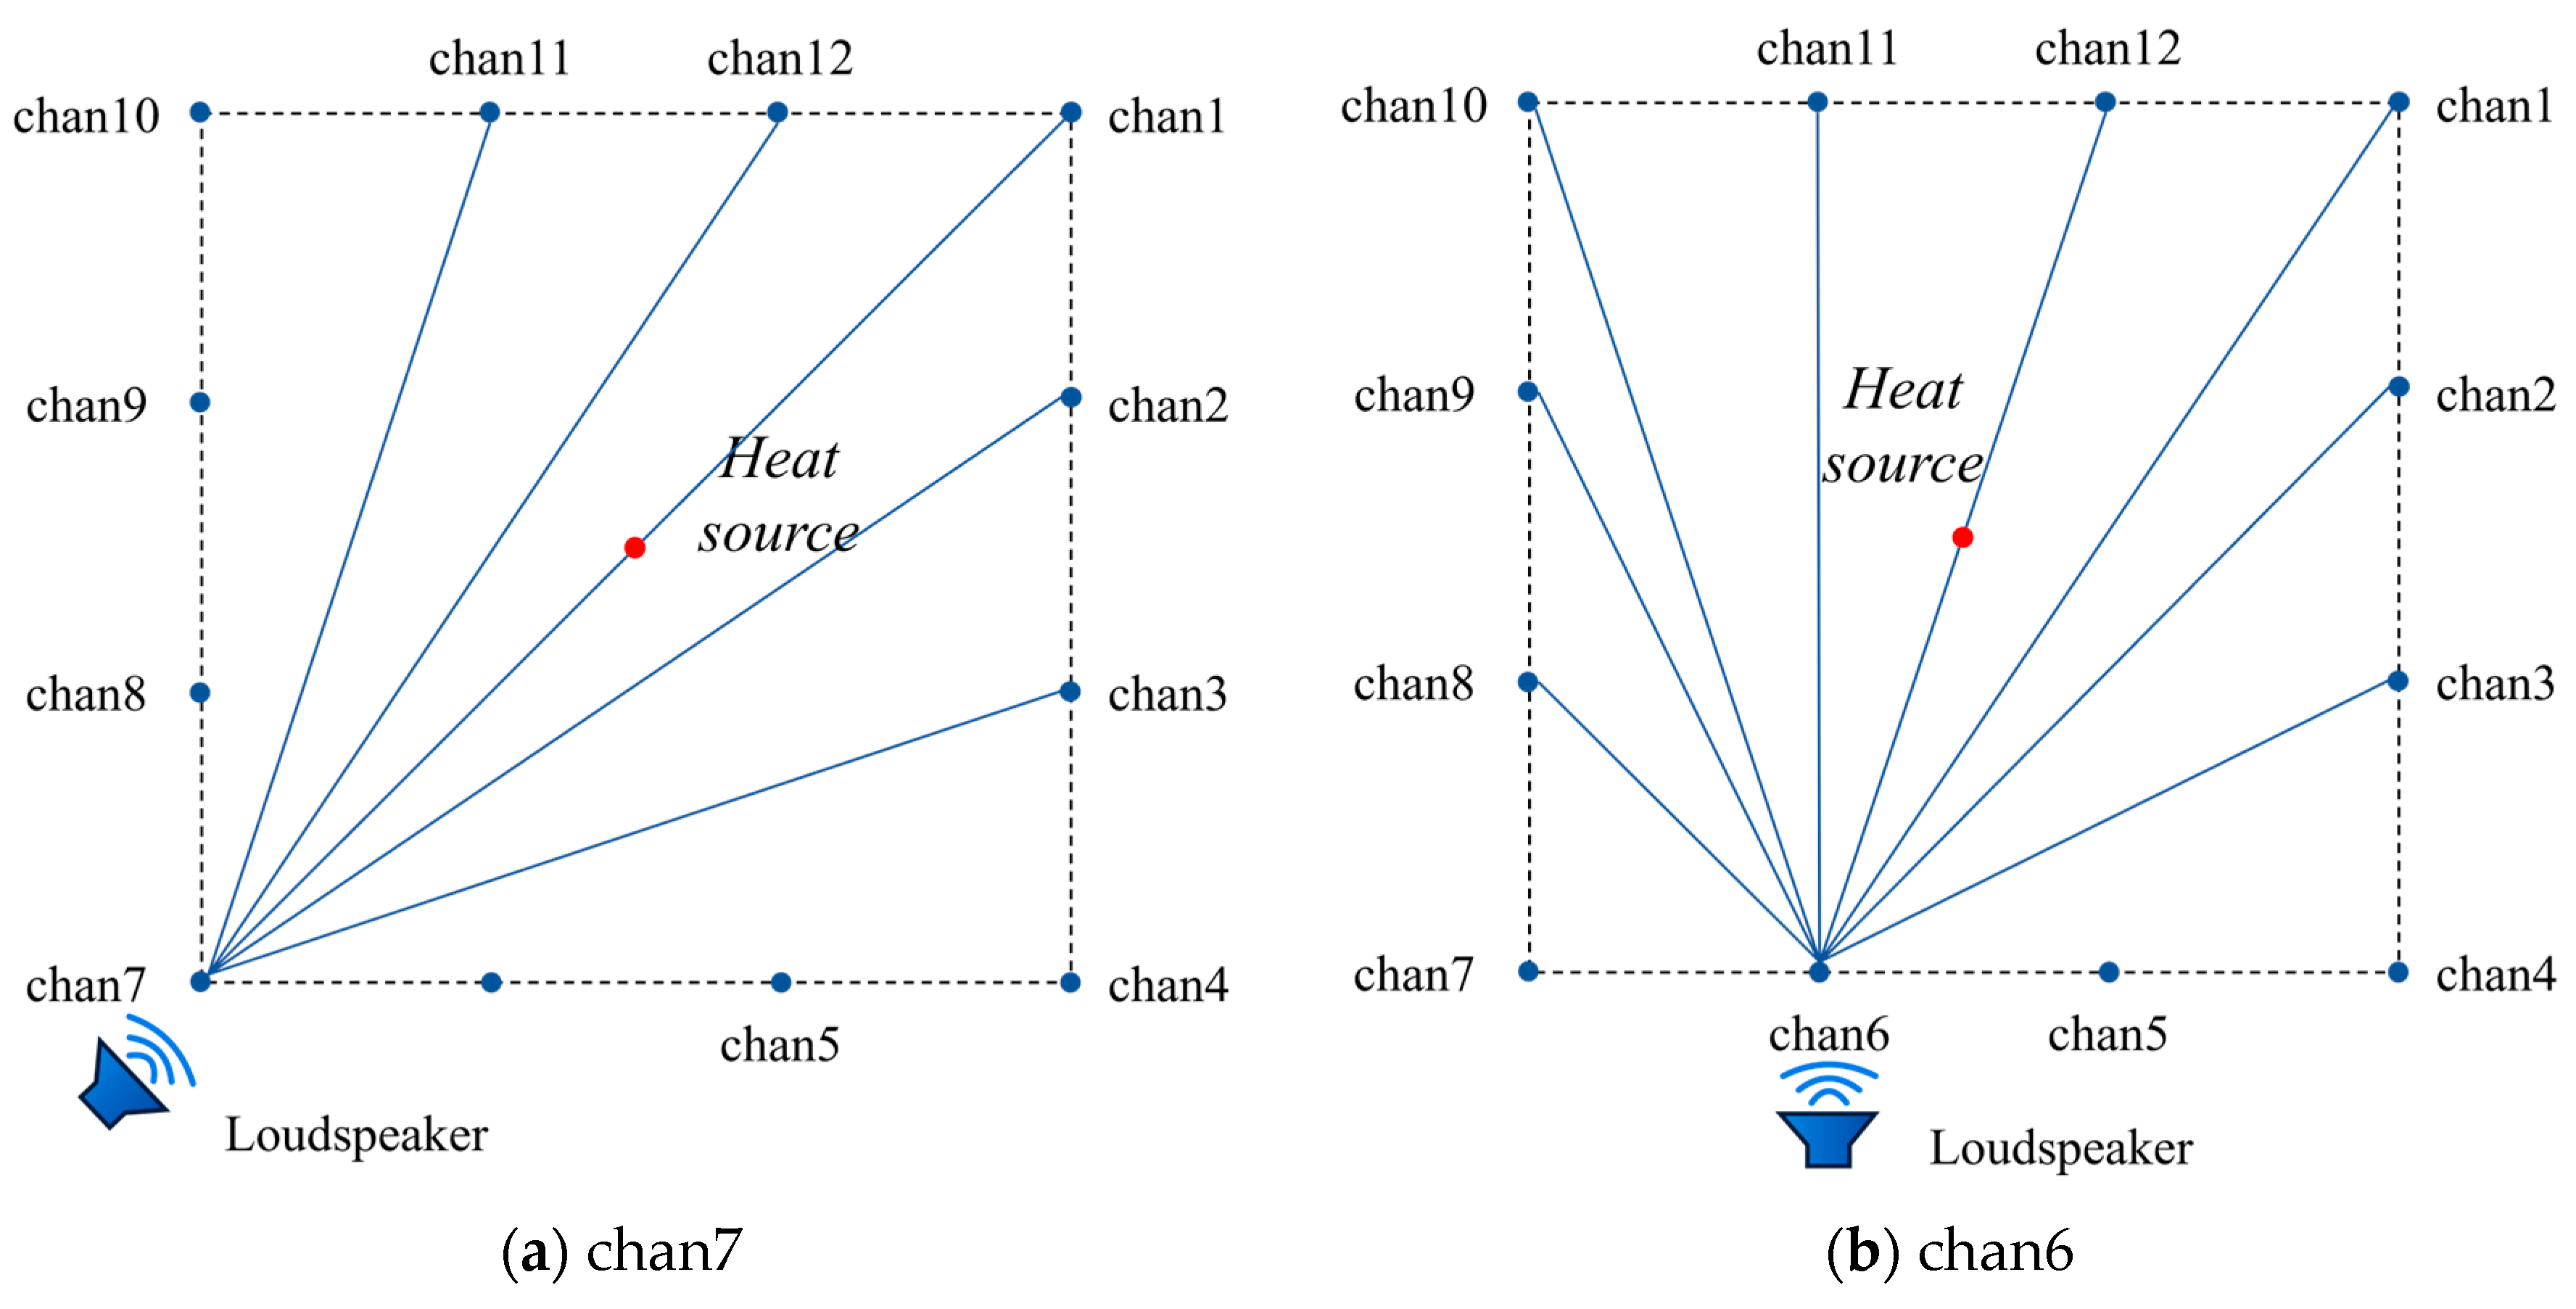
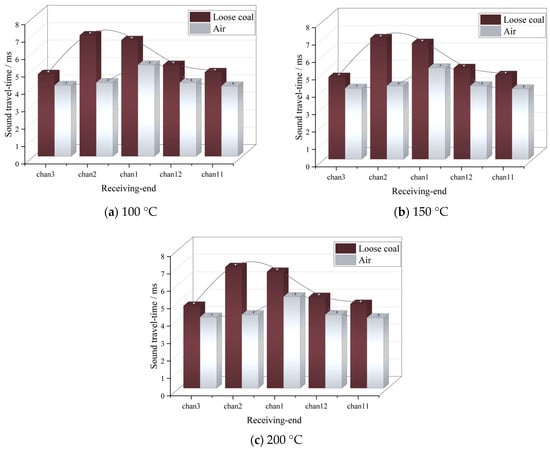
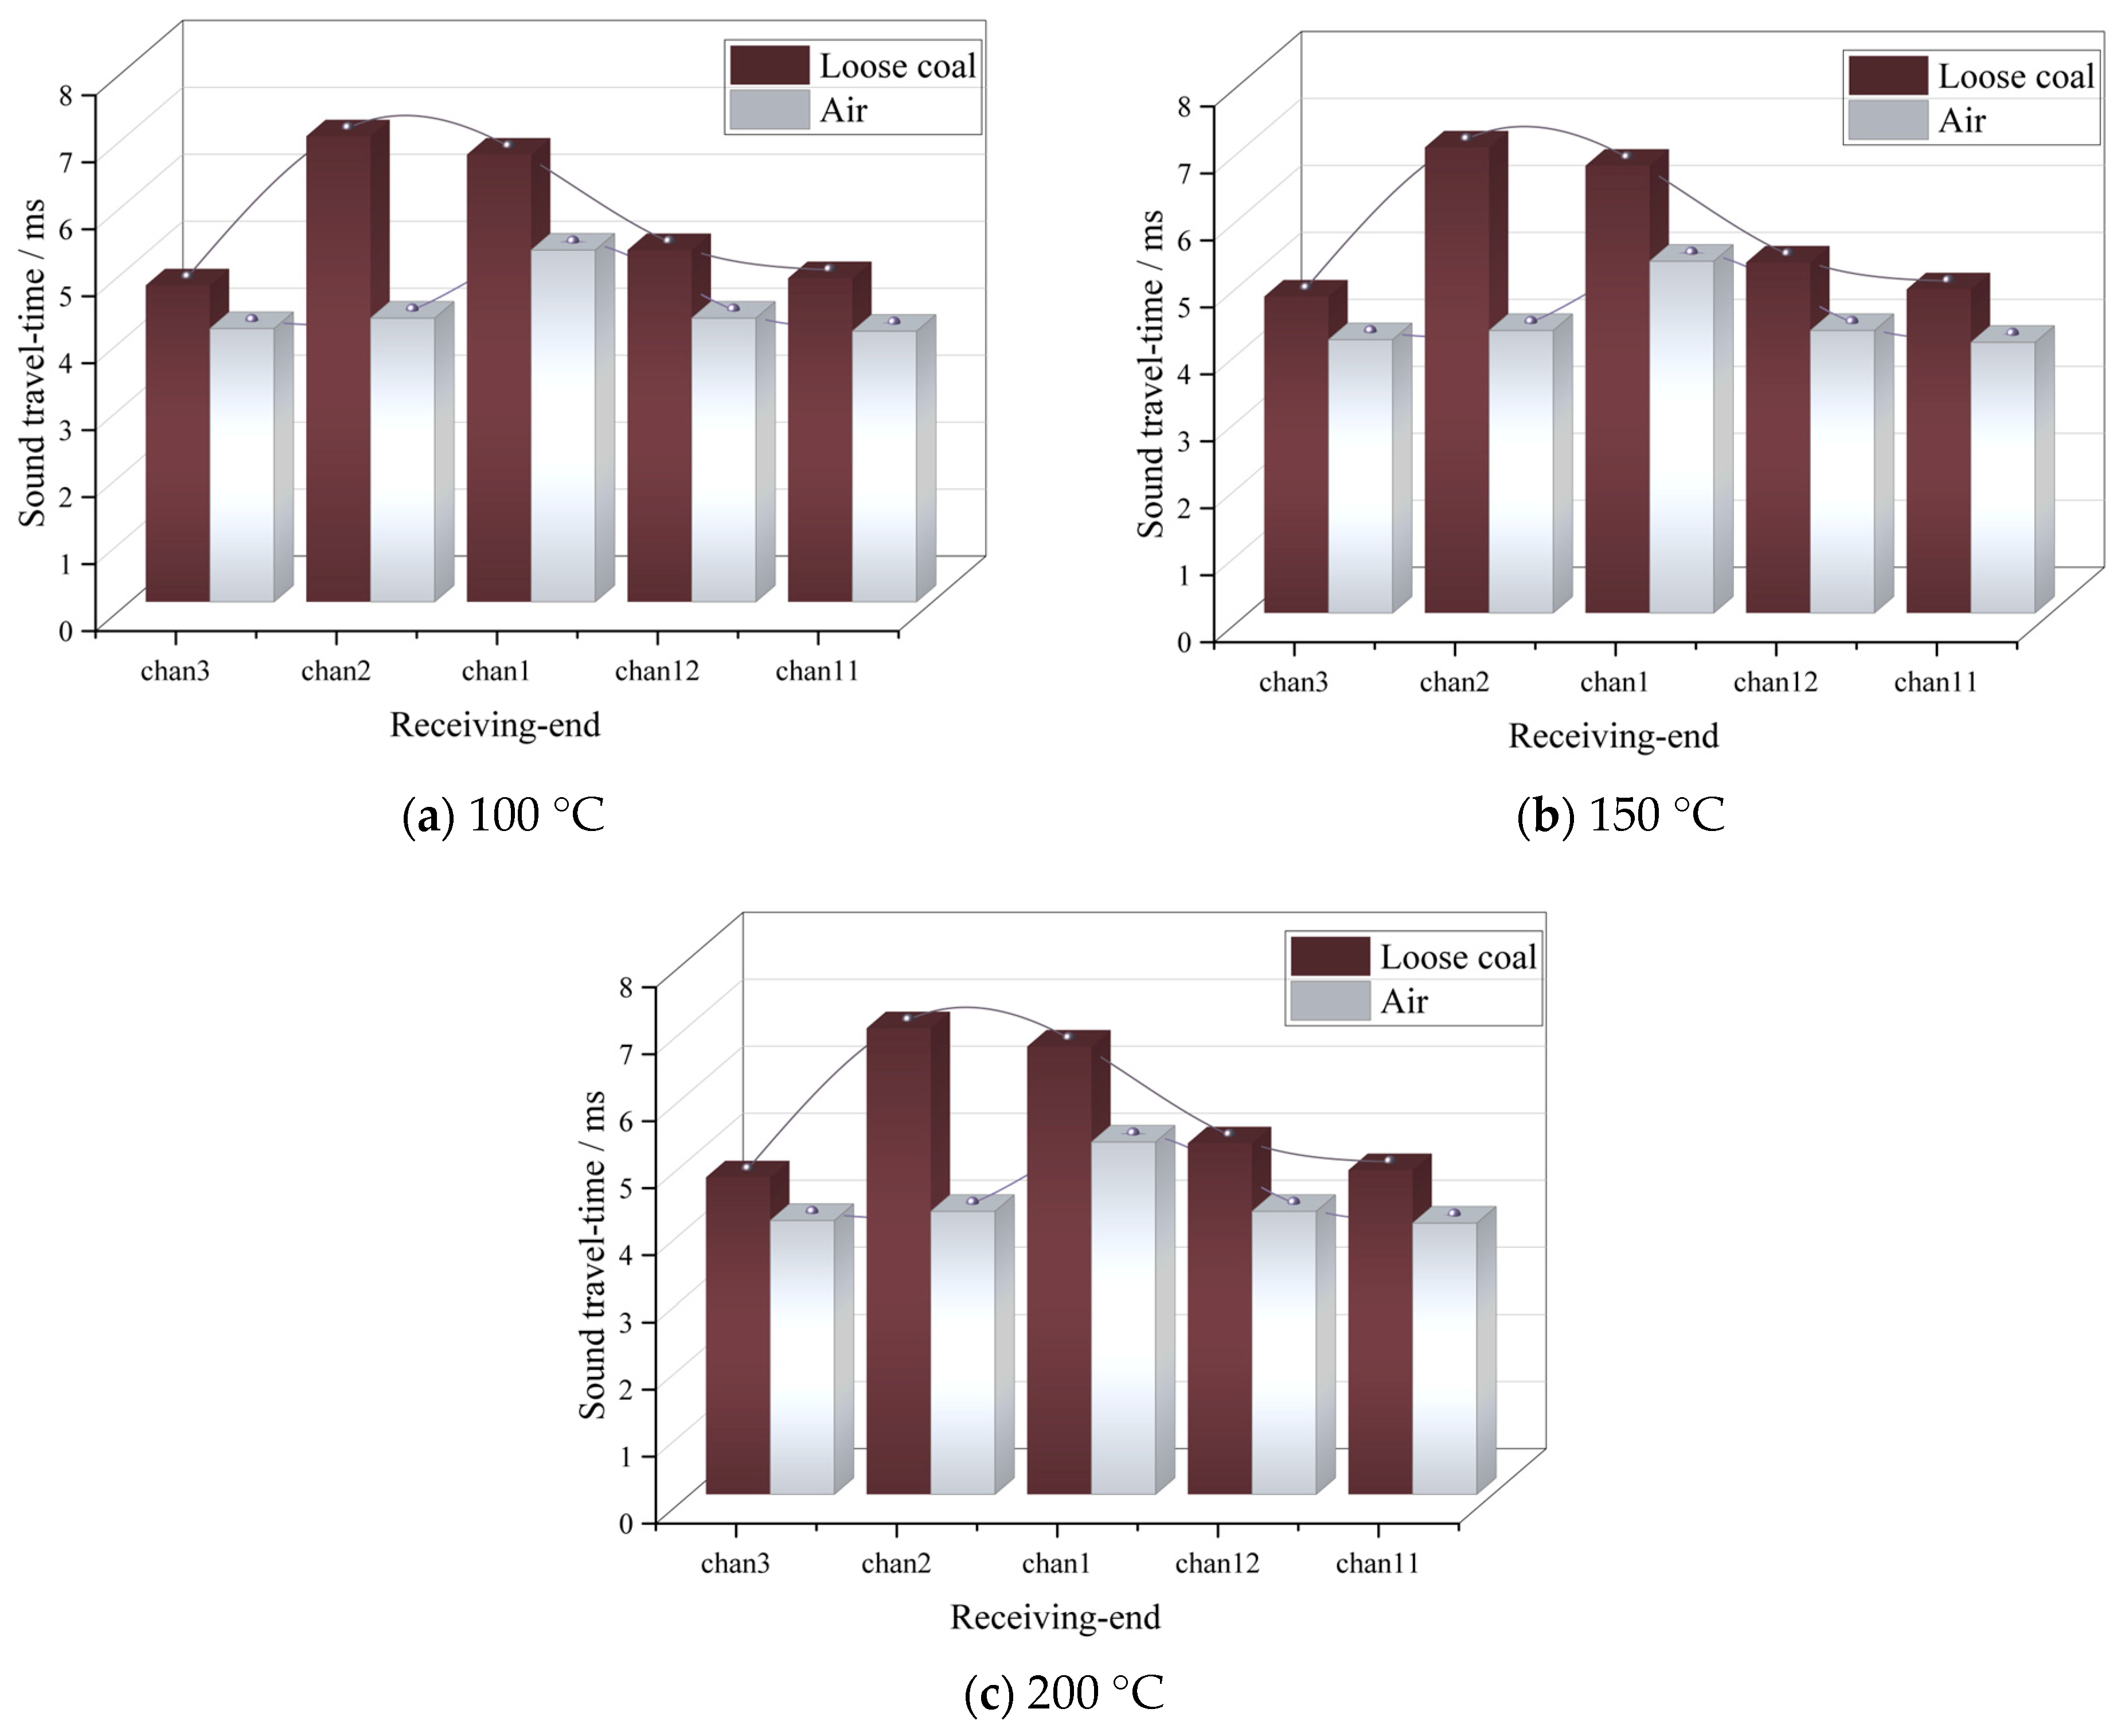
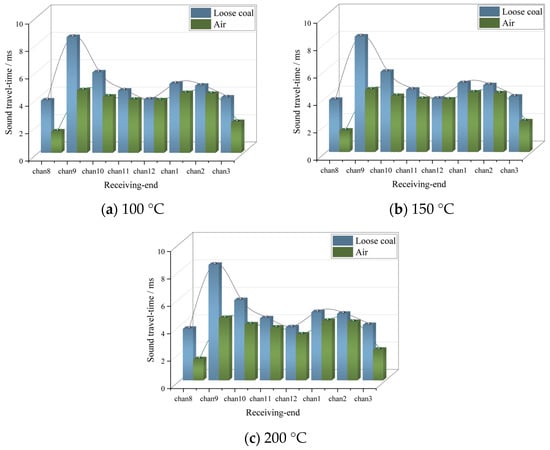
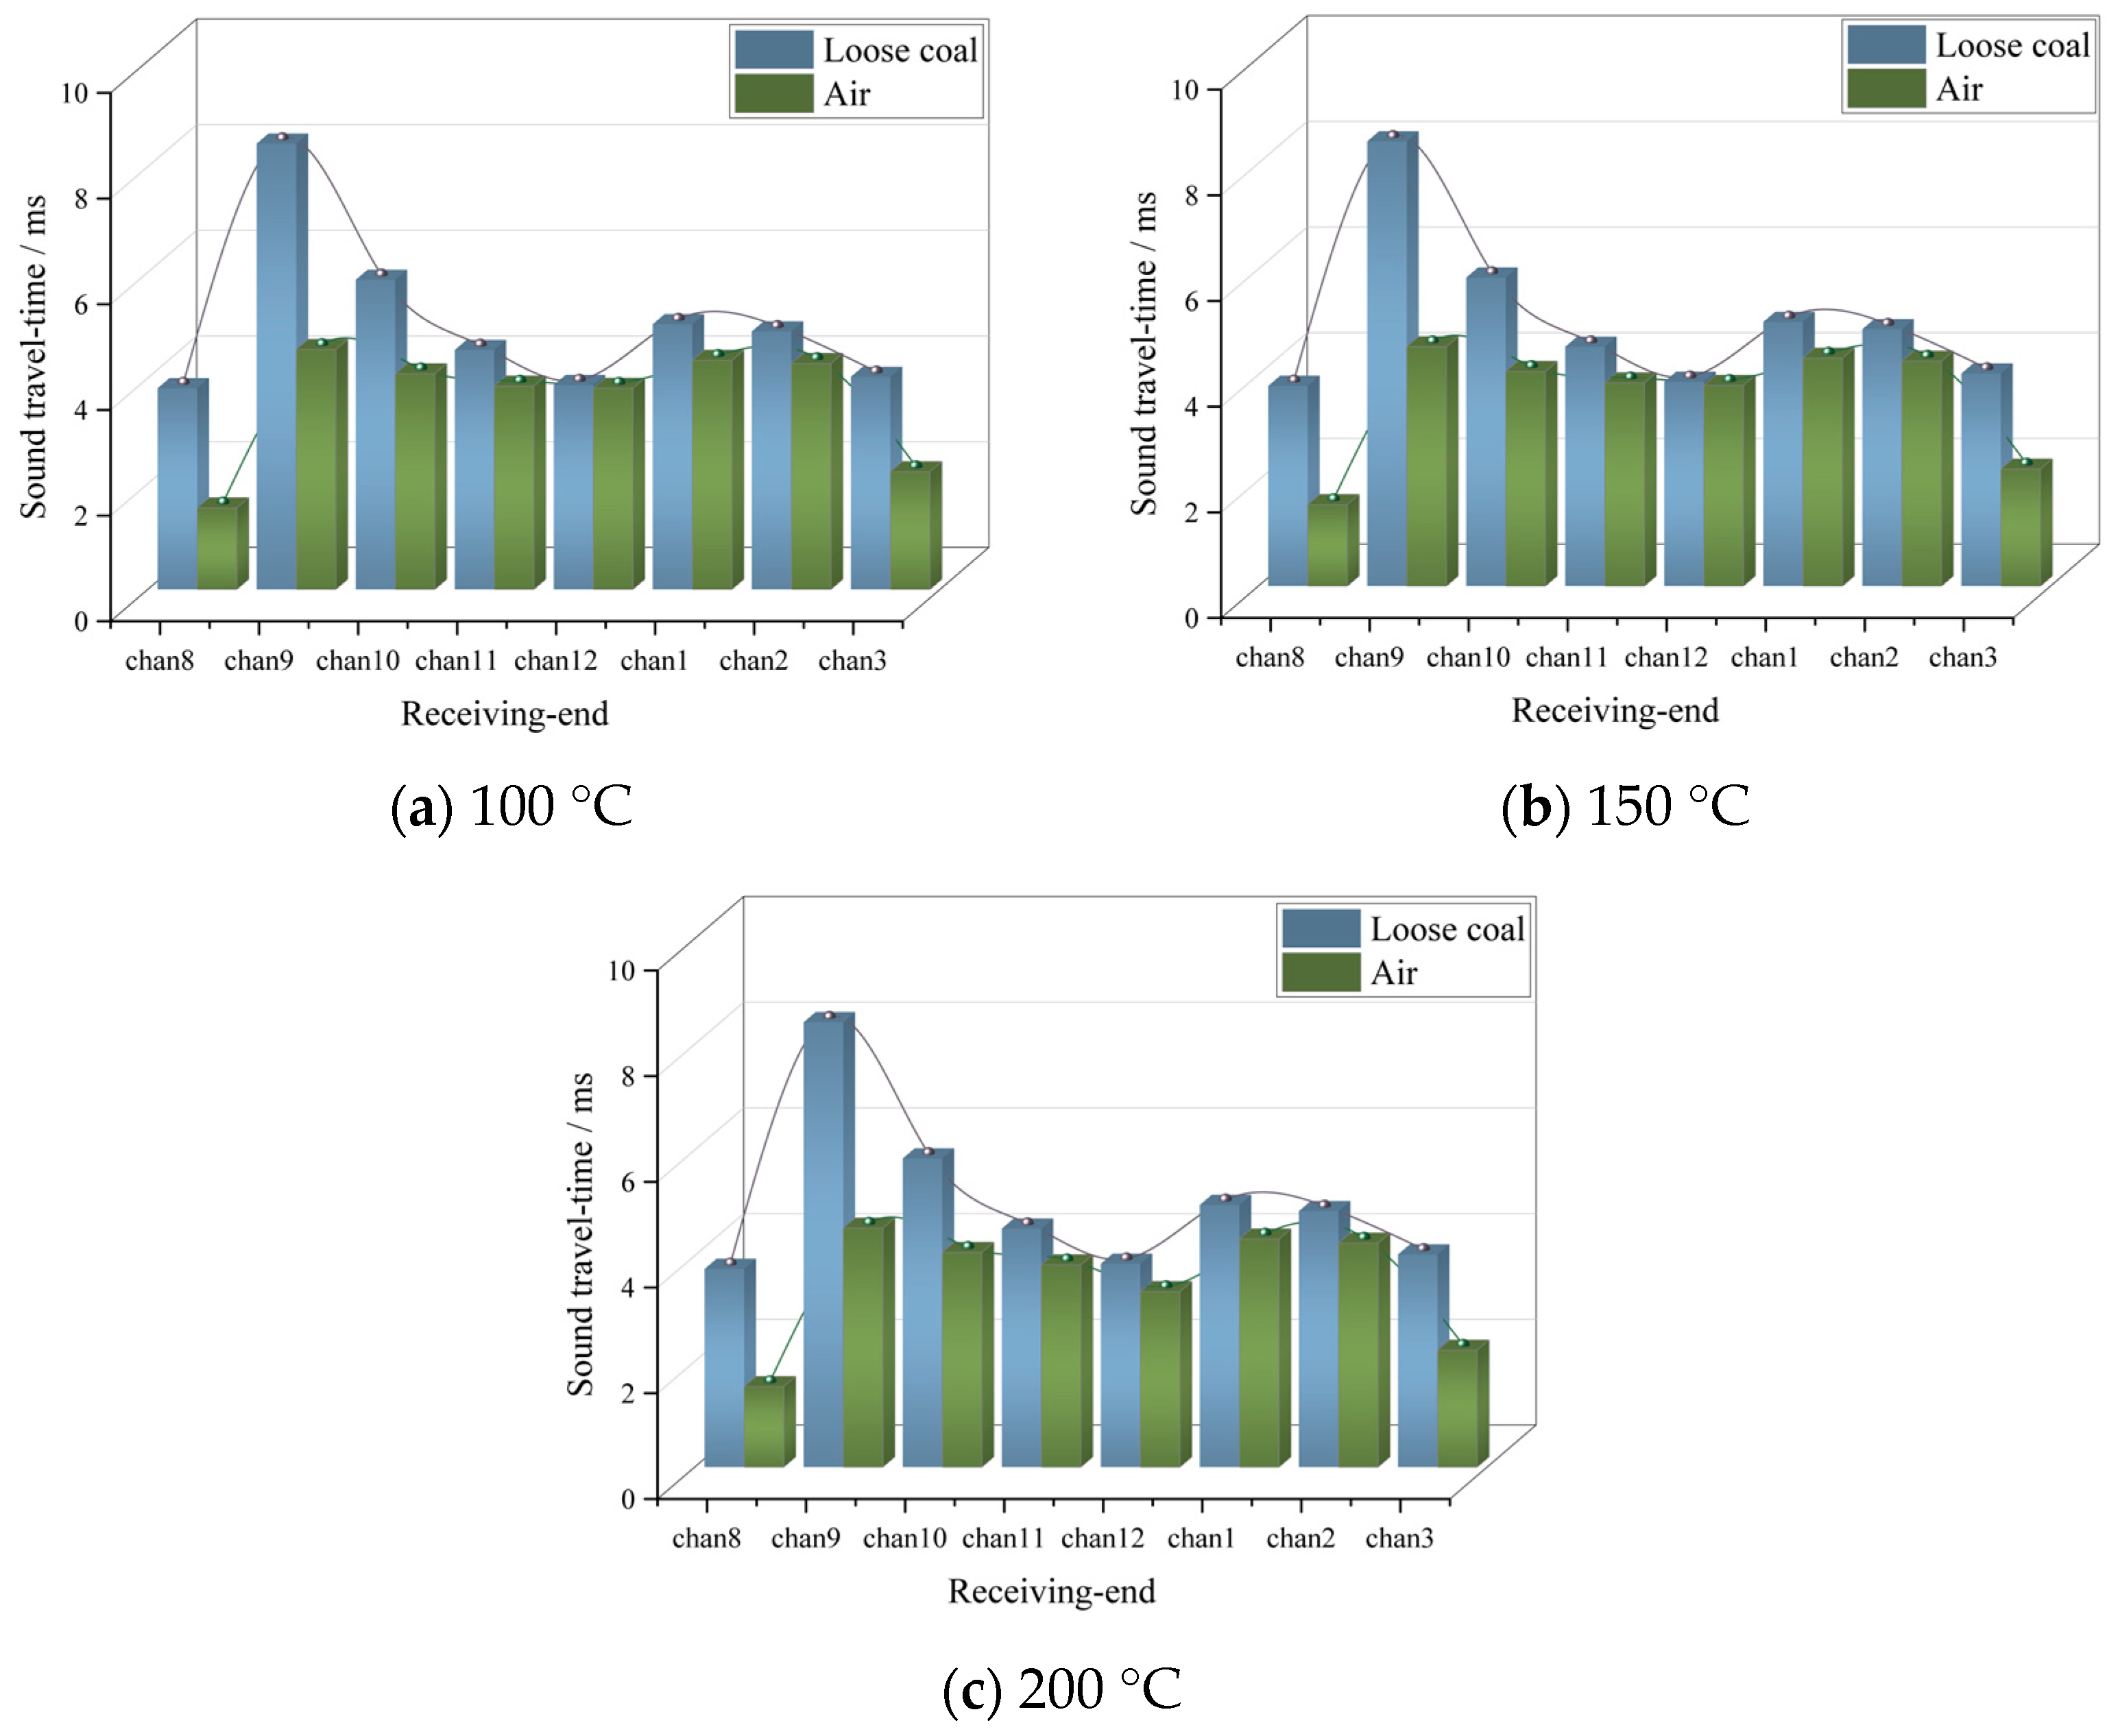
To further analyze the influence of the non-uniform temperature field and different media on the acoustic wave travel time, chan7 and chan6 are selected as the sound source points. Chan7 is located at a corner of the measurement region boundary, and its propagation paths span a relatively wide range, with some paths passing through the central area of the measurement region. Chan6 is located at the mid-edge position of the boundary, and its propagation paths exhibit asymmetric distribution characteristics, with some paths directly traversing the central heat source region. The different sound source positions and the corresponding ray trajectories are shown in Figure 6.
Figure 6.
Acoustic propagation paths from different source positions.
The acoustic wave travel times of each propagation path were calculated under different central heat source temperatures, and the results are shown in Figure 7 and Figure 8.
Figure 7.
Acoustic travel time for different media from source chan7.
Figure 8.
Acoustic travel time for different media from source chan6.
It can be seen from Figure 7 and Figure 8 that the acoustic travel times along each propagation path in both the air and loose coal media exhibit a decreasing trend with increasing heat source temperature. This indicates that temperature rise is the dominant factor affecting the variation of acoustic travel time. When the temperature increased from 100 °C to 200 °C, the travel time on the chan7–chan2 propagation path in the loose coal decreased from 6.953 ms to 6.934 ms. The travel time on the chan7–chan12 path decreased from 5.254 ms to 5.215 ms, and on the chan6–chan8 path from 3.809 ms to 3.750 ms. This indicates that the acoustic travel time generally decreases with increasing temperature, while the variation magnitudes differ significantly among different propagation paths. Under the same propagation path conditions, the acoustic travel time in the loose coal medium is significantly greater than that under air conditions. This is because the pore structure of the loose coal causes the actual propagation path of the acoustic wave to be longer than the geometric straight-line path between the transducers [30]. This results in an increase in the acoustic wave travel time.
3.4. Temperature Field Reconstruction Results Using the Baseline Algorithm
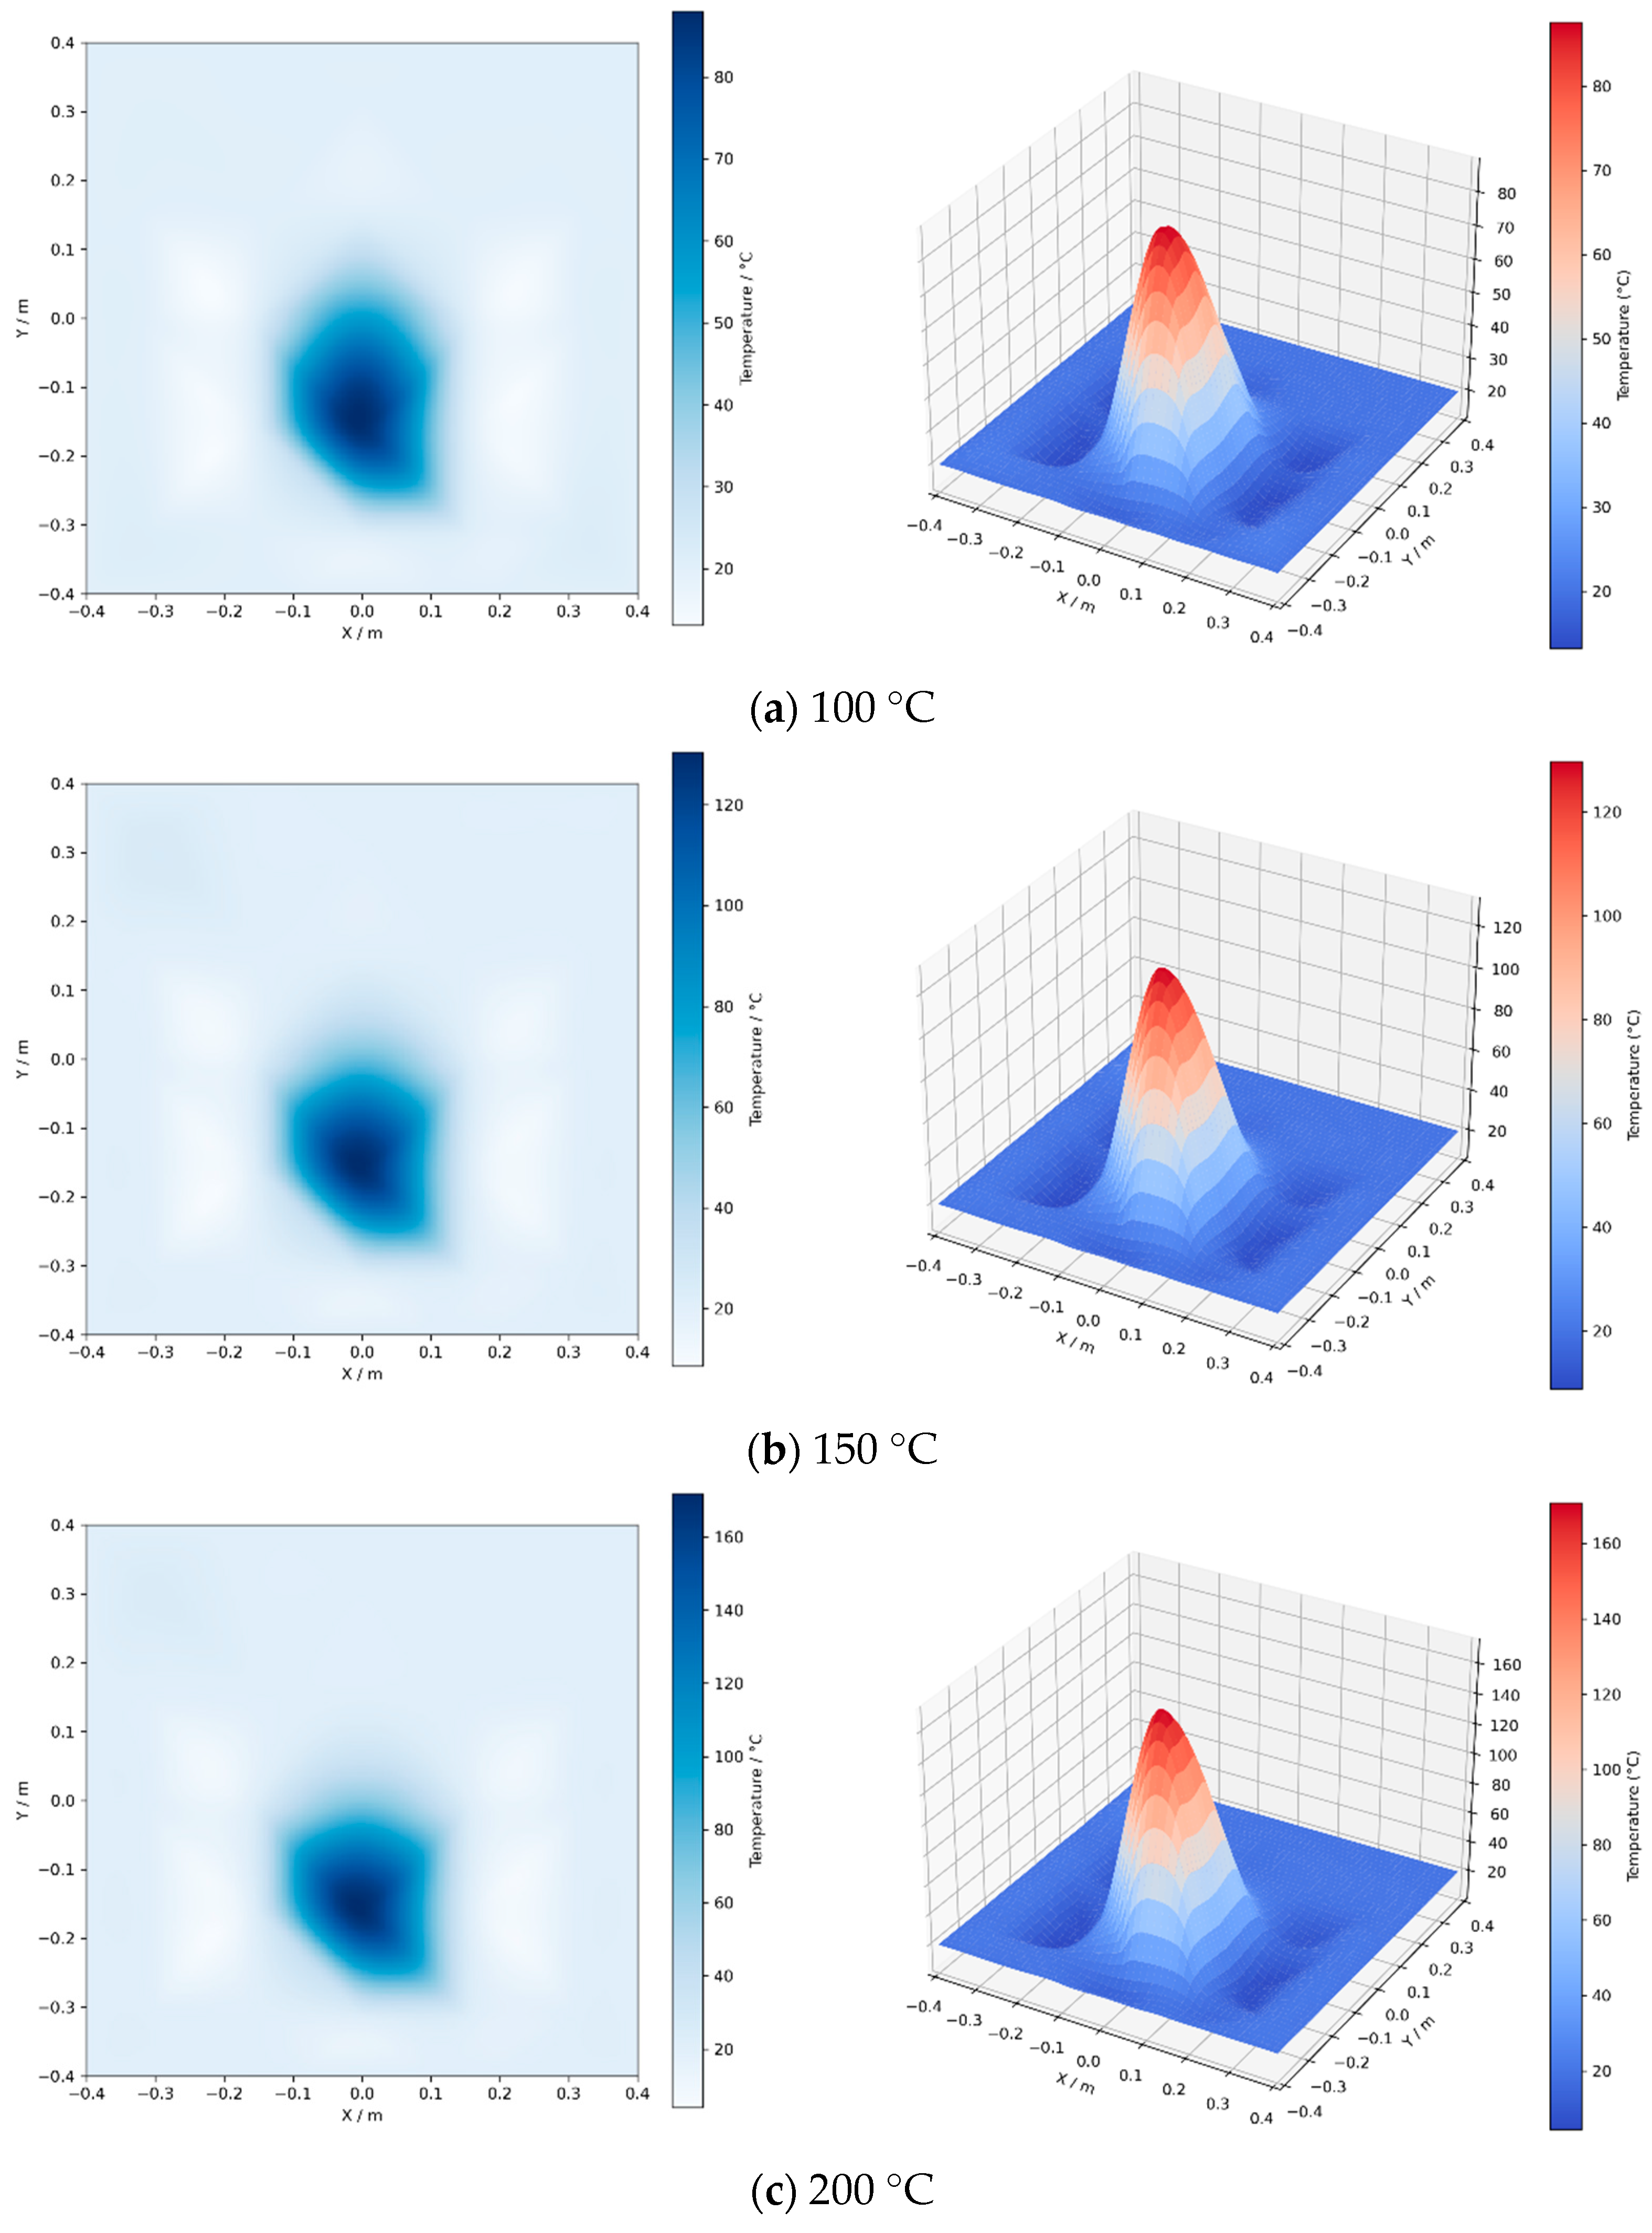
Using the pre-correction temperature field reconstruction model, the temperature fields in both the air and loose coal media were reconstructed. The results are shown in Figure 9 and Figure 10.
Figure 9.
Temperature field reconstruction results in the air medium at different temperatures.
Figure 10.
Temperature field reconstruction results in loose coal at different temperatures.
It can be seen from Figure 9 and Figure 10 that, under air medium conditions, the acoustic temperature field reconstruction results can well reflect the spatial distribution characteristics of the non-uniform temperature field induced by the central heat source. When the central heat source temperatures are 100, 150, and 200 °C, the reconstructed peak temperatures in the air medium are 93.374, 141.233, and 189.092 °C, respectively. The reconstructed temperature increases synchronously with the rise in heat source temperature, and the high-temperature regions are all concentrated near the center of the measurement region. This indicates that under conditions where the propagation paths are approximately straight lines, the typical acoustic reconstruction method can identify the temperature field distribution trend and heat source location with reasonable accuracy [31]. In contrast, the reconstructed peak temperatures in the loose coal medium are 87.323, 129.942, and 171.323 °C, respectively. The reconstruction temperature errors of the loose coal medium are significantly higher than those under air conditions. This indicates that as the heat source temperature increases, the influence of the pore structure of loose coal on acoustic wave propagation and temperature field reconstruction results becomes more pronounced. In addition, the reconstructed temperature field in the loose coal medium exhibits a certain degree of asymmetric distribution and high-temperature region deviation. This indicates that the pore structure not only causes underestimation of the reconstructed peak temperature, but also affects the identification of the heat source location. These deviations can be attributed to the combined effects of acoustic propagation, measurement sensitivity, and the inversion process. In loose coal, pore-induced path tortuosity introduces additional travel-time variations that are not represented by the straight-line path assumption. Moreover, the measured propagation time reflects the integrated acoustic response along the entire propagation path. When only a portion of the path passes through the heating zone, its sensitivity to local high-temperature areas is limited. During inversion, the temperature field is reconstructed from a finite number of intersecting acoustic paths, which may smooth localized temperature variations and redistribute the corresponding spatial information. Consequently, the reconstructed field may exhibit both peak-temperature underestimation and displacement of the high-temperature region [32].
3.5. Temperature Field Reconstruction Results Based on the Corrected Model
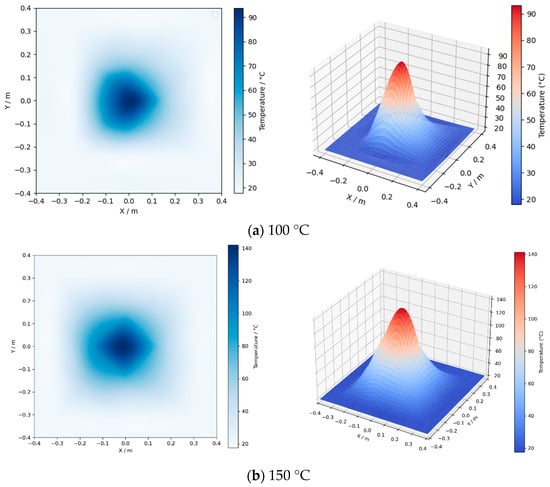
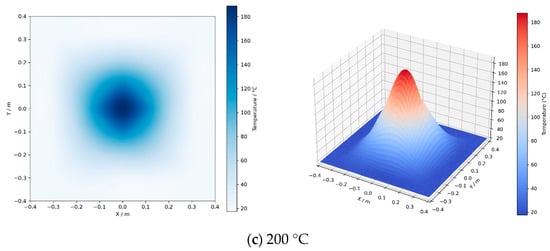
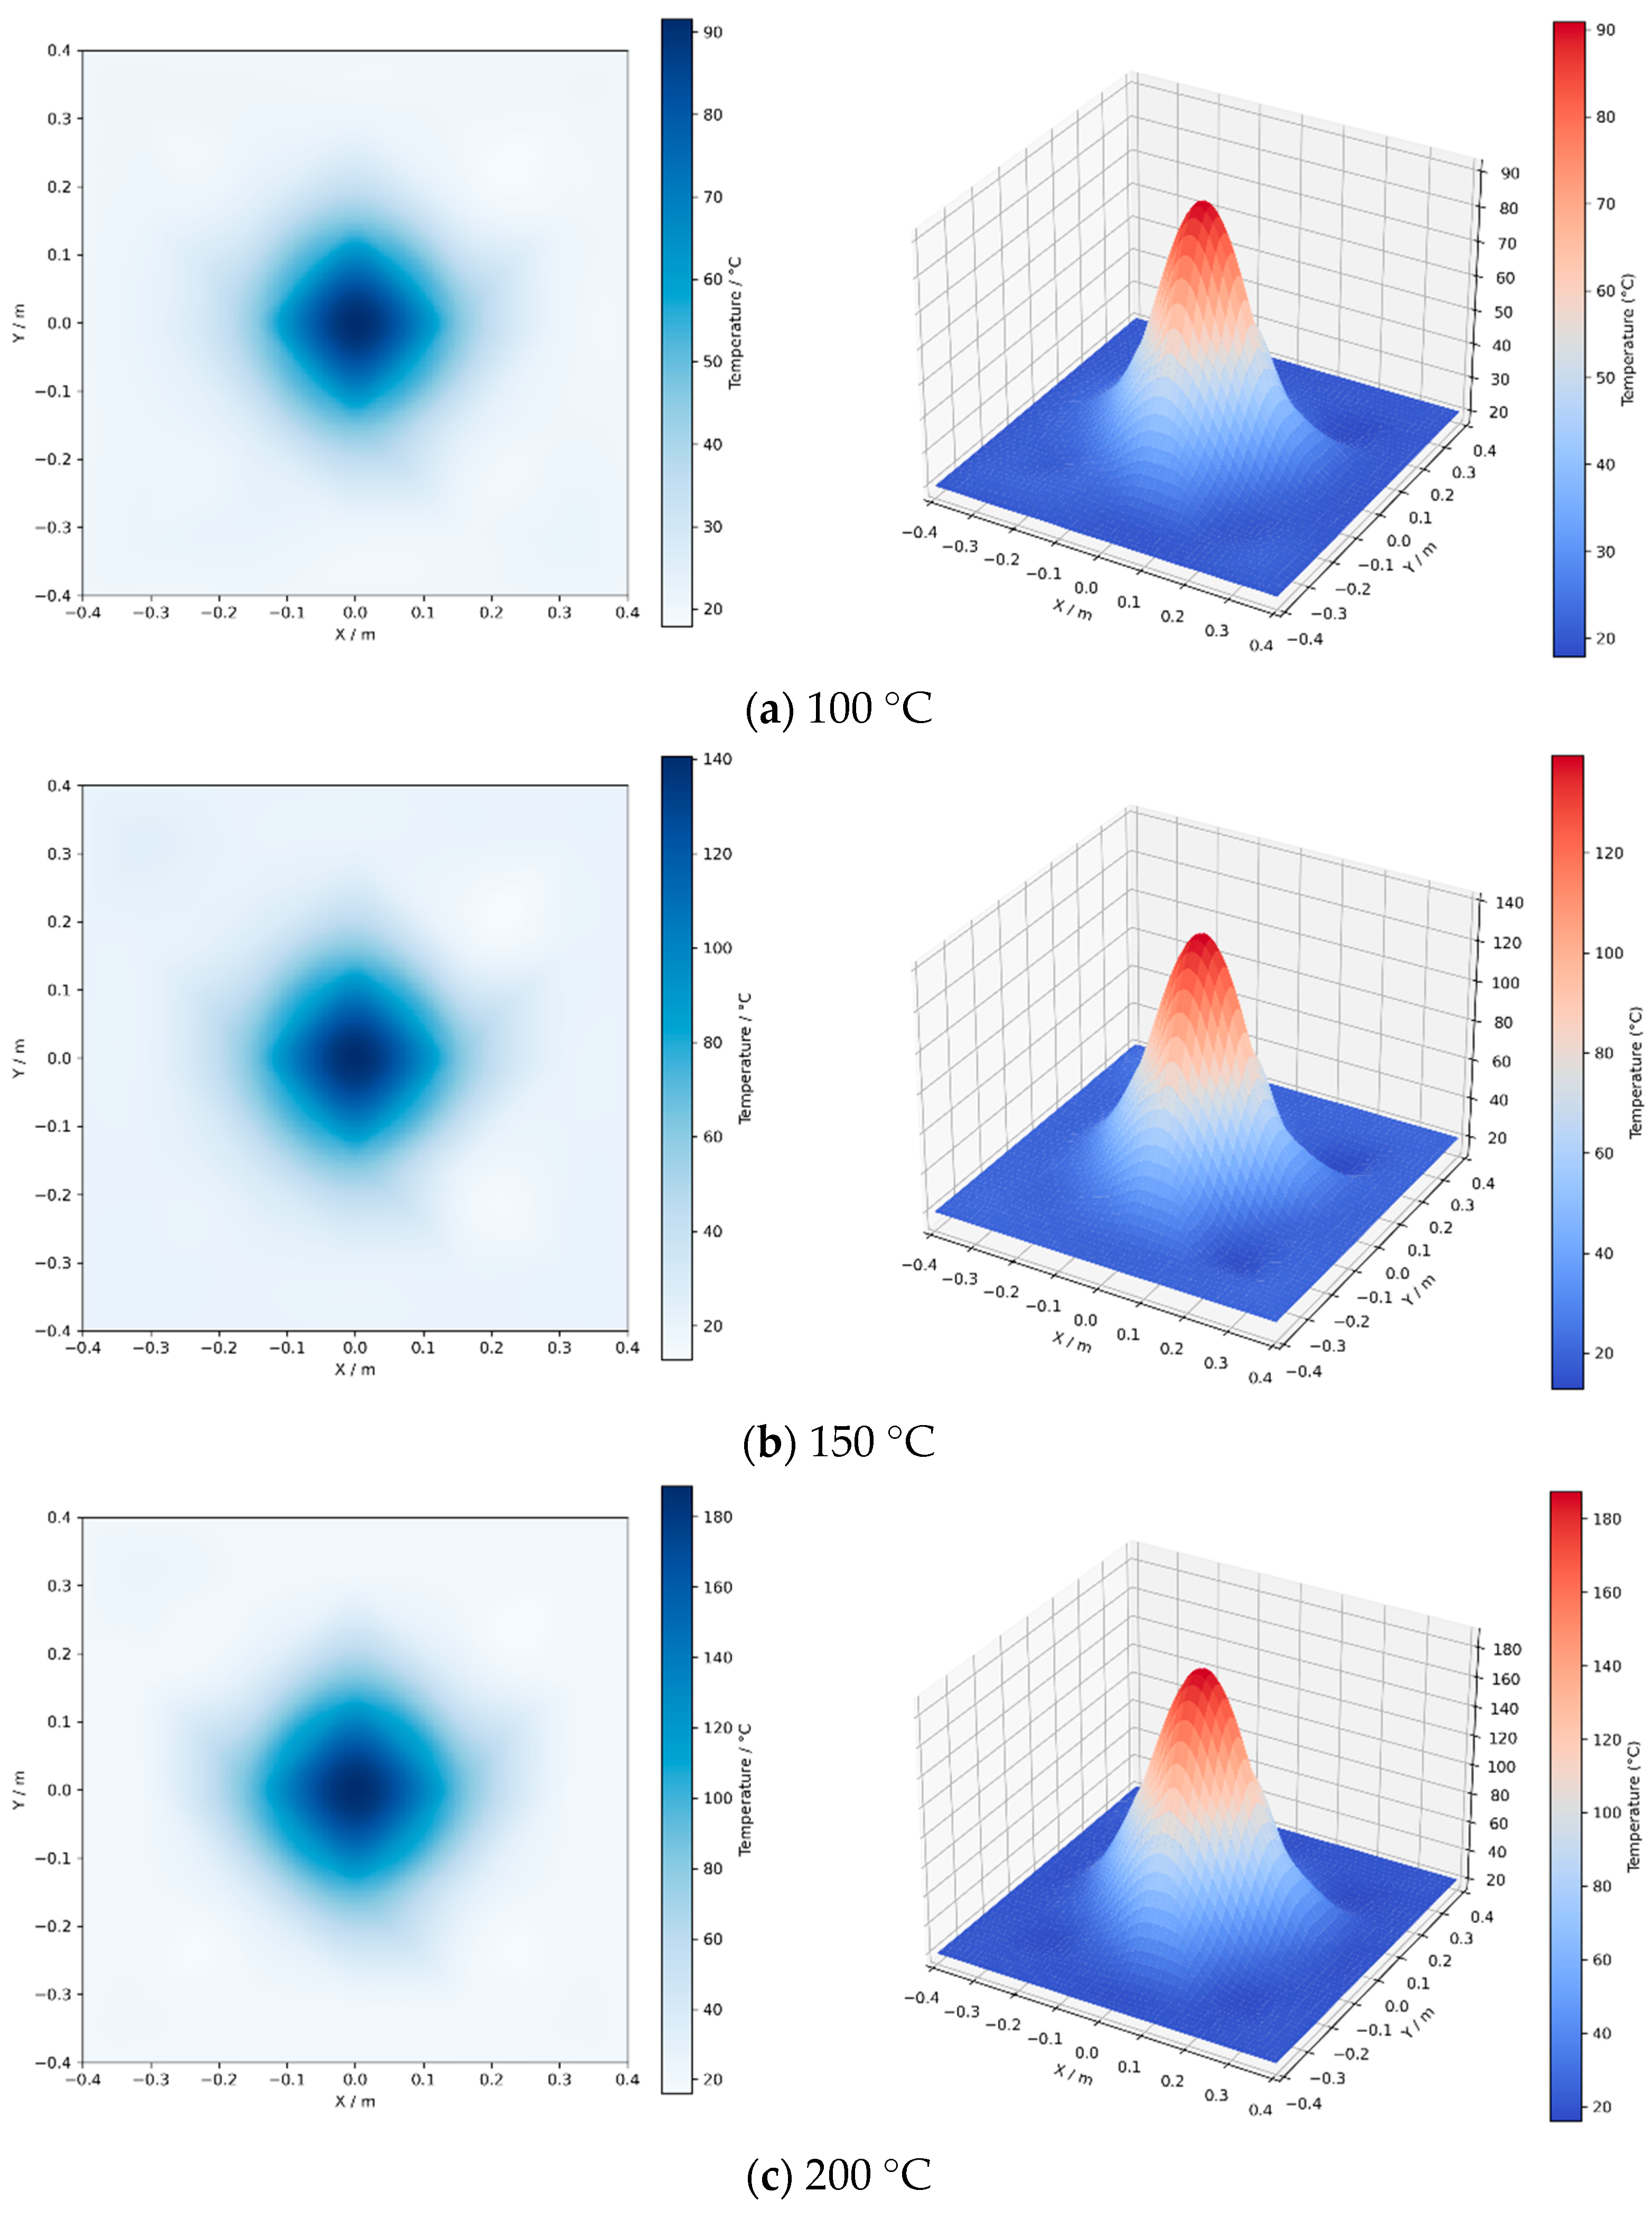
To minimize the effect of pore structure on acoustic travel-time measurements in loose coal, temperature field reconstruction was performed using the corrected model. The corresponding results are presented in Figure 11, while Table 1 compares the reconstructed peak temperatures obtained before and after correction.
Figure 11.
Temperature field reconstruction results based on the corrected model.
Table 1.
Peak temperatures of the reconstructed temperature field under different conditions.
It can be seen from Figure 11 and Table 1 that the peak temperatures of the loose coal reconstructed by the pre-correction model are all lower than those reconstructed in the air medium. The peak temperatures in loose coal reconstructed by the corrected model are 91.507, 140.554, and 188.665 °C, respectively, which are close to the reconstruction results under air conditions. Compared with the uncorrected results, the corrected temperature fields show reduced displacement of the high-temperature region and a more concentrated distribution around the known heat-source location. The spatial asymmetry is also weakened, indicating reduced path-dependent distortion in the reconstructed temperature field. Together with the peak-temperature results, these spatial changes support improved reconstruction of peak temperature and localization of the high-temperature region under the tested conditions.
The mechanism illustrated in Figure 12 links the pore structure of loose coal to travel-time deviations and reconstruction errors. Irregular particle packing and interconnected pores can lead to tortuous acoustic propagation, introducing additional travel time beyond that associated with temperature-dependent sound speed. A straight-line reconstruction model may interpret this additional time as a sound-speed change, resulting in temperature errors. The path-specific correction coefficient provides an equivalent correction to the measured travel time before inversion. This treatment makes the corrected data more consistent with the geometric-path assumption used in reconstruction and helps explain the changes in peak temperature and high-temperature-region localization.
Figure 12.
Mechanism of temperature-field reconstruction considering porous propagation effects.
4. Conclusions
In this study, an acoustic thermometry experimental system was designed and constructed to investigate the effects of temperature variation and pore structure on acoustic wave propagation characteristics and temperature field reconstruction results. By introducing a path-correction model considering porous propagation effects, the temperature field reconstruction results in loose coal were improved. The main conclusions are as follows:
(1) In the non-uniform temperature field generated by a local heat source, the dominant frequency of the acoustic spectrum is concentrated in the range of 1000–1300 Hz. An increase in heat source temperature does not significantly change the dominant frequency range of the received signal, but it does reduce the peak amplitude of the signal. When the heat source temperature increased from 100 °C to 150 °C and 200 °C, the main peak amplitude of the received signal on the chan7–chan1 path decreased from 233.434 Pa to 216.670 Pa and 211.436 Pa, respectively. This indicates that the non-uniform temperature field mainly affects the acoustic spectral response by altering signal intensity and energy distribution.
(2) Under different medium conditions, both the acoustic propagation energy and the travel time exhibit significant differences. Compared with the air medium, the overall sound pressure level of the received signals in the loose coal medium is relatively low. The pore structure leads to increased scattering, absorption, and energy loss during acoustic wave propagation. The acoustic travel time along each propagation path generally decreases with increasing heat source temperature, indicating that the temperature-induced increase in sound speed is the dominant factor causing the variation of travel time. Travel times in loose coal are generally longer than in air, suggesting that the pore structure makes the actual acoustic path longer than the straight-line path.
(3) Under the conventional straight-line path assumption, the reconstructed temperature field in loose coal suffers from an underestimation of peak temperature and a deviation of the high-temperature region. The peak temperature of the temperature field reconstructed using the uncorrected model is significantly lower than the actual temperature. After introducing the correction model, the reconstructed peak temperatures in loose coal are increased to 91.507, 140.554, and 188.665 °C, respectively. The gap between the reconstructed results and those obtained in the air medium is significantly reduced, and the temperature field distribution becomes more regular. The proposed path correction model effectively corrects path deviations in loose coal and enhances acoustic reconstruction accuracy for non-uniform temperature fields.
The proposed approach incorporates an equivalent correction for pore-structure-induced travel-time deviations into acoustic temperature field reconstruction. The laboratory results indicate its potential for locating concealed high-temperature regions associated with coal spontaneous combustion in loose coal.
Author Contributions
Funding acquisition, S.R.; investigation, J.W. and L.Z.; methodology, S.R. and J.W.; project administration, S.R.; resources, S.R. and L.Z.; software, J.W. and L.Z.; supervision, S.R. and Y.X.; validation, F.K.; visualization, Z.B. and C.S.; writing—original draft, J.W. and L.Z.; writing—review and editing, J.W. and Y.X. All authors have read and agreed to the published version of the manuscript.
Funding
This research was funded by the Key Research and Development Program of Shaanxi Province (2025GH-YBXM-054), the National Natural Science Foundation of China (No. 52204239), and the Young Elite Scientists Sponsorship Program by CAST (No. 2023QNRC001).
Data Availability Statement
The datasets generated and analyzed during the current study are available from the corresponding author upon reasonable request.
Conflicts of Interest
The authors declare no conflicts of interest.
References
- Chen, Q.J.; Kang, J.H.; Peng, C.Y.; Zhang, R.; Tian, J.K.; Yang, C.H.; Chen, A.X. Prediction model of spontaneous combustion temperature intervals of coal samples from multiple mining regions. Fuel 2026, 425, 139383. [Google Scholar] [CrossRef] [Scilit]
- Bai, Z.; Zhang, P.; Deng, J.; Wang, C.; Zhang, J.; Yang, J. Effect of imidazole [EMIm]+ and [BMIm]+ ionic liquids on the evolution of coal functional groups. Fuel 2027, 428, 140056. [Google Scholar] [CrossRef] [Scilit]
- Wang, J.; Deng, J.; Rashwan, T.L.; Qao, G.; Ren, S.; Liu, D. Oxygen-lean thermokinetics and early-warning of Laojunmiao non-caking coal in Xinjiang coalfield. Int. J. Min. Sci. Technol. 2026; in press. [CrossRef] [Scilit]
- Shi, Q.L.; Zhang, Q.J.; Long, L.H.; Xi, X. Study of the novel dehydrogenation composite inhibitor and the inhibition mechanism on coal spontaneous combustion. Chem. Eng. Sci. 2026, 325, 123416. [Google Scholar] [CrossRef] [Scilit]
- Ren, S.J.; Zhang, L.; Deng, J.; Wang, J.R.; Wang, C.P.; Xiao, Y.; Kang, F.R.; Li, Q.W.; Li, H.J.; Dou, L.H. Multiscale regulation mechanism of air leakage and oxygen supply on the evolution process of typical coalfield fire zone. J. Anal. Appl. Pyrolysis 2026, 199, 108054. [Google Scholar] [CrossRef] [Scilit]
- Rui, X.; Ma, Y.; He, C.; Zhang, C.; Wang, Z.; Zhang, H. Design and Fabrication of Air-Coupled CMUT for Non-Contact Temperature Measurement Applications. Micromachines 2025, 16, 1008. [Google Scholar] [CrossRef] [Scilit] [PubMed]
- Koulountzios, P.; Rymarczyk, T.; Soleimani, M. Ultrasonic Time-of-Flight Computed Tomography for Investigation of Batch Crystallisation Processes. Sensors 2021, 21, 639. [Google Scholar] [CrossRef] [Scilit] [PubMed]
- Guo, J.; Shang, H.; Cai, G.; Jin, Y.; Wang, K.; Li, S. Early Detection of Coal Spontaneous Combustion by Complex Acoustic Waves in a Concealed Fire Source. ACS Omega 2023, 8, 16519–16531. [Google Scholar] [CrossRef] [Scilit] [PubMed]
- Zhang, C.; Dai, A.; Yang, H.; Wu, Z.; Zhou, X.; Jayas, D.S. Influence of Moisture of Wheat on Acoustic Wave Propagation Characteristics. Trans. ASABE 2020, 63, 1315–1326. [Google Scholar] [CrossRef] [Scilit]
- Ren, S.J.; Zhang, Y.N.; Song, Z.Y.; Xiao, Y.; Deng, J.; Shu, C.M. Initial exploration on potential fire hazards detection from coal spontaneous combustion applied by acoustic wave. Sci. Total Environ. 2023, 897, 165475. [Google Scholar] [CrossRef] [Scilit] [PubMed]
- Hu, Y.H.; Guo, M.; Yan, Y.; Lu, G.; Cheng, X.F. Temperature measurement of stored biomass of different types and bulk densities using acoustic techniques. Fuel 2019, 257, 115986. [Google Scholar] [CrossRef] [Scilit]
- Othmani, C.; Dokhanchi, N.S.; Merchel, S.; Vogel, A.; Altinsoy, M.E.; Voelker, C.; Takali, F. Acoustic tomographic reconstruction of temperature and flow fields with focus on atmosphere and enclosed spaces: A review. Appl. Therm. Eng. 2023, 223, 119953. [Google Scholar] [CrossRef] [Scilit]
- Zhang, J.Q.; Qi, H.; Ren, Y.T.; Su, M.X.; Cai, X.S. Acoustic tomography of temperature and velocity fields by using the radial basis function and alternating direction method of multipliers. Int. J. Heat Mass Transf. 2022, 188, 122660. [Google Scholar] [CrossRef] [Scilit]
- Wu, Y.H.; Zhou, X.Z.; Li, Z.; Dong, C.L.; Wang, H.L. A Method for Reconstruction of Boiler Combustion Temperature Field Based on Acoustic Tomography. Math. Probl. Eng. 2021, 2021, 9922698. [Google Scholar] [CrossRef] [Scilit]
- Mou, F.S.; Zuo, Y.H.; Chen, Q.L.; Zhang, J.L.; Zhang, L.Q.; Kang, H.M.; Wang, X.L.; Jiang, G.Z.; Wang, Y.C.; Yu, R.Y. Physics-constrained, surrogate-assisted inversion for thermophysical calibration and basin-scale present-day temperature-field reconstruction in the Sichuan Basin. Geoenergy Sci. Eng. 2026, 267, 214698. [Google Scholar] [CrossRef] [Scilit]
- Kong, Q.; Jiang, G.S.; Liu, Y.C.; Sun, J.H. 3D high-quality temperature-field reconstruction method in furnace based on acoustic tomography. Appl. Therm. Eng. 2020, 179, 115693. [Google Scholar] [CrossRef] [Scilit]
- Wu, K.Y.; Ni, K.Q.; Chen, L.W.; Xu, H.Y.; Wang, J.Q.; Zhou, J.Y.; Zhou, X.Z. ATTRN: Acoustic Information Encoder and Temperature Field Reconstruction Decoder Network for Boiler Temperature Field Reconstruction. Sensors 2025, 25, 2567. [Google Scholar] [CrossRef] [Scilit] [PubMed]
- Kong, Q.; Jiang, G.S.; Liu, Y.C.; Yu, M. Numerical and experimental study on temperature field reconstruction based on acoustic tomography. Appl. Therm. Eng. 2020, 170, 114720. [Google Scholar] [CrossRef] [Scilit]
- Guo, J.Y.; Wang, C.X.; Xu, J.; Jia, S.; Yang, H.; Sun, Z.L.; Wang, X.B. Study and Analysis of the Thunder Source Location Error Based on Acoustic Ray-Tracing. Remote Sens. 2024, 16, 4000. [Google Scholar] [CrossRef] [Scilit]
- Xie, Y.R.; Duan, S.; He, P.Y.; Ling, X.Y.; Shen, P.F. Synthesis and characterization of zeolite NaA with different Si/Al ratios from coal gangue: Adsorption thermodynamic properties of CO2 and N2. J. Ind. Eng. Chem. 2026, 161, 291–314. [Google Scholar] [CrossRef] [Scilit]
- Ren, S.J.; Zhang, L.X.Q.; Deng, J.; Wang, J.R.; Wang, C.P.; Xiao, Y.; Kang, F.R.; Li, H.J.; Dou, L.H. Porosity inversion and determination in gob unconsolidated materials based on acoustic signal response. Fuel 2026, 426, 139614. [Google Scholar] [CrossRef] [Scilit]
- Kong, Q.; Wang, Z.; Cui, F.; Zhao, Y.; Jiang, G.S.; Li, P. Acoustic tomography method for temperature and velocity fields simultaneous measurement. Measurement 2025, 250, 117198. [Google Scholar] [CrossRef] [Scilit]
- Yan, H.; He, A.N.; Wang, X.N. Solution of eigen acoustic ray paths in three dimensional temperature gradient field. J. Shenyang Univ. Technol. 2016, 38, 185–189. [Google Scholar] [CrossRef]
- Zhang, W.; Jiang, G.S.; Sun, J.H.; Jiang, Y. Simultaneous reconstruction of 3D non-uniform temperature and velocity fields in a furnace using a bidirectional acoustic path separation tracking method. Appl. Therm. Eng. 2024, 236, 121768. [Google Scholar] [CrossRef] [Scilit]
- Ren, S.J.; Zhang, L.; Deng, J.; Wang, C.-P.; Xiao, Y.; Wang, J.-R.; Kang, F.-R.; Li, Q.-W.; Qu, G.-Y.; Li, H.-J. Study on early temperature inversion identification of coal spontaneous combustion based on acoustic signals. Fuel 2027, 430, 141333. [Google Scholar] [CrossRef] [Scilit]
- Liu, Q.; Zhou, B.; Cheng, R.X.; Zhang, J.Y.; Zhao, R.; Dai, M.L.; Zhao, X.H.; Wang, Y.H. Online monitoring instantaneous 2D temperature distributions in a furnace using acoustic tomography based on frequency division multiplexing. Case Stud. Therm. Eng. 2023, 48, 103176. [Google Scholar] [CrossRef] [Scilit]
- Shi, Q.L.; Zhu, Y.X.; Zhang, Q.J.; Xi, X.; Sambaeva, D.A. Effects of carbon dioxide concentration on the mineralization characteristics of high-calcium fly ash and its physicochemical properties. Fuel 2027, 428, 140355. [Google Scholar] [CrossRef] [Scilit]
- Yan, H.; Wei, Y.K.; Zhou, Y.G.; Wang, Y.F. Temperature Distribution Reconstruction Method for Acoustic Tomography Based on Compressed Sensing. Ultrason. Imaging 2022, 44, 77–95. [Google Scholar] [CrossRef] [Scilit] [PubMed]
- Fellah, Z.E.A.; Mitri, F.G.; Fellah, M.; Ogam, E.; Depollier, C. Ultrasonic characterization of porous absorbing materials: Inverse problem. J. Sound Vib. 2007, 302, 746–759. [Google Scholar] [CrossRef] [Scilit]
- Umnova, O.; Attenborough, K.; Shin, H.-C.; Cummings, A. Deduction of tortuosity and porosity from acoustic reflection and transmission measurements on thick samples of rigid-porous materials. Appl. Acoust. 2005, 66, 607–624. [Google Scholar] [CrossRef] [Scilit]
- Dong, X.H.; Zhang, L.F.; Qian, L.F.; Wu, C.B.; Tang, Z.H.; Li, A. Acoustic tomography temperature reconstruction based on improved sparse reconstruction model and multi-scale feature fusion network. Eng. Appl. Artif. Intell. 2024, 133, 108168. [Google Scholar] [CrossRef] [Scilit]
- Shi, Q.L.; Zhu, Y.X.; Deng, C.; Qin, B.T.; Sambaeva, D. Properties of ultrasound-assisted calcium ion leaching of fly ash for CO2 mineralization and inhibition of coal spontaneous combustion. Sep. Purif. Technol. 2026, 408, 139145. [Google Scholar] [CrossRef] [Scilit]

Disclaimer/Publisher’s Note: The statements, opinions and data contained in all publications are solely those of the individual author(s) and contributor(s) and not of MDPI and/or the editor(s). MDPI and/or the editor(s) disclaim responsibility for any injury to people or property resulting from any ideas, methods, instructions or products referred to in the content. |
© 2026 by the authors. Licensee MDPI, Basel, Switzerland. This article is an open access article distributed under the terms and conditions of the Creative Commons Attribution (CC BY) license.