


Abstract
Wildfires are increasingly recognized as a climatological hazard, able to threaten industrial and critical infrastructure safety and operations and lead to Natech disasters. Future projections of exacerbated fire regimes increase the likelihood of Natech disasters, therefore increasing expected direct damage costs, clean-up costs, and long-term economic losses due to business interruption and environmental remediation. While large industrial complexes, such as oil, gas, and chemical facilities have sufficient resources for the implementation of effective prevention and mitigation plans, small-to-medium-sized industrial hubs are particularly vulnerable due to their scattered distribution and limited resources for investing in comprehensive fire prevention systems. This study targets the vulnerability of these communities by proposing the deployment of Wireless Sensor Networks (WSNs) as cost-effective Early Wildfire Detection Systems (EWDSs) to safeguard wildland and industrial domains. The proposed approach leverages wildland–industrial interface (WII) geospatial data, simulated wildfire dynamics data, and mathematical optimization to maximize detection efficiency at minimal cost. The WII delimits the boundary where the presence of wildland fires impacts industrial activity, thus representing a proxy for potential Natech disasters. The methodology is tested in Cocentaina, Spain, a municipality characterized by a highly flammable Mediterranean landscape and medium-scale industrial parks. Results reveal the complex trade-offs between detection characteristics and the degree of protection in the combined wildland and WII areas, enabling stakeholders to make informed decisions. This methodology is easily replicable for any municipality and industrial installation, or for generic wildland–human interface (WHI) scenarios, provided there is access to wildfire dynamics data and geospatial boundaries delimiting the areas to protect.
1. Introduction
Wildfires at the wildland–human interface (WHI) are becoming increasingly frequent [1,2]. Recent examples include the fires in Maui (2023, Hawaii), Valparaíso (2024, Chile), Evros (2023, Greece) [3], Palisades (2025, California, US), and Sancheong (2025, South Korea) [4]. These fires resulted in loss of life, widespread destruction of property and cultural heritage, ecological damage, population displacement, and severe air quality degradation.
Wildfires affecting industry is an emerging problem [5], motivating the definition of the wildland–industrial interface (WII). While the risks associated with wildfires in wildland–urban interfaces (WUIs) have been extensively studied due to their direct impact on human life and property, industrial areas face unique challenges and additional risks that are often overlooked. Natech accidents are industrial disasters triggered by natural disasters, and may lead to severe cascading effects. These include meteorological (lightning, tornadoes, torrential rains), hydrological (floods and landslides), geological (earthquakes, tsunamis, volcanic eruptions), and climatic disasters (extreme temperatures, drought, and wildfires) [6]. Typical cascading effects include the release of hazardous and toxic substances, fires, and explosions, escalating the initial disaster’s impact on people, environment, and infrastructure [7], and the disruption of critical services like healthcare, communications, or transport [8]. The infrequent and complex nature of Natech events means risk assessment heavily relies on advanced probabilistic methods like fault tree analysis (FTA) and Bayesian networks (BNs) to manage inherent uncertainties and the lack of sufficient historical data [9,10].
However, the unpredictability of fire spread and the future projections for more severe and frequent wildfires [11] call for attention to the possibility of catastrophic scenarios and demands stronger involvement of the industry to improve preparedness [12]. An example of a severe wildfire-triggered Natech was the Fort McMurray record-breaking fires in 2016, with two casualties during mass evacuations, burning 587,000 ha of land, destroying 2400 homes, and causing $3.7 billion in insurance costs [13]. These fires threatened the oil sand processing plants, which were not physically affected but faced a 40% reduction in production.
Given the proximity of the industry to populated areas, these events can occur at the WUI and WII overlap. This is more common in forested countries with rapid economic growth like South Korea [12]. On 4th March 2022, in Uljin, North Gyeongsang province, a sky lantern ignited a grass fire, whose delayed response further provoked the destruction of around one hundred dwellings and the explosion of an underground storage tank filled with 4440 m3 of gasoline, and compromised the operations of a nuclear power plant. In February 2024, Viña del Mar, Chile, experienced the country’s most devastating wildfires in the past 30 years [14], resulting in 137 fatalities and burning 9215 hectares. The flames completely engulfed the 100-hectare industrial zone of El Salto, incapacitating 46% of its companies (58% of which lacked insurance coverage) and causing an estimated $25 billion in losses [15]. Explosions were recorded in chemical warehouses and paint factories, releasing hazardous chemicals that contributed to extreme episodes of black carbon and particulate matter [16]. A summary of 32 wildfires affecting industrial activity from 1997 to 2022 is recorded in [5], impacting landfills, biogas facilities, decommissioned hazardous sites, nuclear power plants, storage facilities, chemical and petrochemical plants, and pipeline and transport infrastructures. Table 1 presents wildland fire events involving the WII since 2022, reflecting their ongoing prevalence.
Table 1.
Recent wildland–industrial interface (WII) incidents and impacts.
The 2025 European fire season is on track to be the worst on record, with over 1 million hectares burned across the EU by December 2025, underscoring industrial vulnerabilities near wildfire-prone zones [17]. Despite the growing concern of wildfires initiating Natech disasters, the Seveso III Directive, when referring to “Identification and accidental risk analysis and prevention methods” mentions natural hazards like floods and earthquakes, without explicitly mentioning wildfires [18]. Likewise, public regulations provide fire protection guidelines for critical facilities [19], but they lack the corresponding norms for wildfire scenarios, including specific measures for the surrounding wildland.
The Natech risk assessment is rapidly evolving, though critical gaps in integrated frameworks and investment incentives persist. For instance, by 2025, the RAPID-N tool, originally designed for earthquake Natechs, has been updated to include wildfire as a recognized climatic hazard [20,21]. Yet, technical guidance as of February 2025 confirms that existing quantitative risk analysis (QRA) frameworks are still rarely applied to wildfire-driven cascading effects in industrial areas, especially within the WII [22]. On the governance side, the EU Preparedness Union Strategy (launched March 2025) [23] seeks to enhance cross-sector disaster response, but regulatory and financial arrangements still place most prevention costs on the public sector. This sustains a disincentive for private operators to invest in dedicated Natech mitigation [24,25]. Emerging solutions, including the forthcoming Wildfire Data Portal (late 2025) [26] and improved vulnerability indicators, aim to better connect forest management, climate risk data, and industrial safety planning.
In the absence of detailed guidelines, the responsibility for wildfire prevention falls largely on stakeholders. Large-scale facilities—often backed by substantial investments and managed by organized corporate structures—are typically better equipped to implement effective prevention and mitigation strategies, including advanced detection systems, suppression technologies, and well-trained emergency response teams [27]. This is exemplified by the wildfire incident at the refinery in Attica included in Table 1, where firefighting forces successfully contained a wildfire advancing from surrounding vegetation. In contrast, small industrial parks scattered across rural landscapes often lack the financial resources, technical expertise, and organizational capacity to develop and execute similar plans. These difficulties are exacerbated by the aging and low-density populations in rural territories, which limit the availability of local human capital [28]. There is an urgent need for cost-effective, low-maintenance preventive solutions that can operate with minimal human intervention to safeguard these vulnerable territories.
The WHI, including WUI and WII, represents the spatial domain where wildfires and their byproducts are a direct threat to the residential and industrial areas located within the buffer zones. Risks for wildfire-driven Natechs stem from fires igniting within the WII, as well as wildland fires that ignite beyond the WII limits and spread towards industrial facilities. The risk of fires spreading into urban or industrial areas needs to account for the probability of wildland fire crossing into the WUI, or WII boundaries [29]. Therefore, industrial wildfire mitigation plans must consider both an accurate definition of the WII and a comprehensive understanding of fire susceptibility across the surrounding wildland territory [5].
The use of wireless sensor technologies, machine learning, and Internet of Things (IoT) for fire detection is an active field of research and engineering [30,31]. Given the potential of these technologies, we provide a design framework to obtain optimal WSN configurations, using a multi-objective optimization problem formulation. This study advocates for the wide application of Early Wildfire Detection Systems (EWDSs) to support vulnerable small–medium industrial hubs as indicated in the recently released WII dataset [5]. The proposed approach leverages WII geospatial data and simulates wildfire dynamics data to design WSNs with optimal spatial configurations to safeguard both wildland and WII. Our design framework is built on open datasets for landscape-specific fire behavior. The method is autonomous, inexpensive, and requires minimal expert knowledge. For any landscape and prioritization level, the framework derives Pareto-optimal WSN configurations, enabling informed decisions that balance resources and stakeholder criteria. The quantitative estimates have the added value to help raise fire risk community awareness, necessary to enhance fire resilience in current anthropogenic wildland territories. The methodology can be easily extended to address scenarios involving different interfaces, e.g., WUI, or areas with high ecological/cultural value.
The organization of the paper is as follows: Section 2 reviews research on the impact of wildfires on industrial assets, and motivates the adoption of WSNs as cost-effective mitigation systems at the municipality scale. Section 3 details the Materials and Methods, introducing the optimization framework enabling the design of optimal WSN configurations (Section 3.1), the case study (Section 3.2), the WII geospatial data (Section 3.3), and the fire simulations and high-risk fire weather scenarios (Section 3.4). Section 4 presents and discusses the results. Section 5 concludes and summarizes the work, and discusses future perspectives.
2. Fire Vulnerability in Small–Medium-Scale Industrial Hubs
This section argues that existing guidelines and regulations do not properly address the cases of wildfires threatening small–medium-scale industrial sites. WSNs can offer a timely and cost-effective solution for wildfire detection for such cases.
2.1. Guidelines and Regulations
Fire affects artificial structures through three mechanisms: direct flame contact, thermal radiation, and ember transport [32]. Several studies use CFD modeling and empirical formulas to link fire effects to structural failure times in storage tank facilities (i.e., the interval of time that the structural resistance is compromised). The resulting data can be correlated to environmental variables such as flame shape, emitted radiation, and distance [33,34]. In industrial complexes, storage tanks are often arranged in compact configurations, which can facilitate fire propagation between adjacent vessels and trigger domino effects—a risk that has attracted attention in safety research [35].
In countries like Spain, Italy, and Greece, public regulations for oil, gas, and chemical industries mandate fuel-free buffer zones in the immediate vicinity of vulnerable structures, well below the limits recommended in the literature [34]. Moreover, these studies largely overlook the spotting mechanism, a critical factor in fire dynamics that operates over longer distances, potentially impacting infrastructure far beyond the immediate buffer zone. Studies addressing the problem of WII boundary suggest that realistic buffer distances accounting for spotting can extend up to 2.4 km [36].
For smaller-scale industries, qualitative guidelines like Canada’s FireSmart program share rule-of-thumb recommendations for buffer zones. These guidelines prioritize high-critical infrastructure, leaving smaller facilities in need of tailored support [37]. Moreover, very few studies aim to address the fire dynamics patterns characterizing the wildland areas that affect critical infrastructure [38,39].
2.2. Wireless Sensor Networks (WSNs) for Timely and Cost-Effective Wildfire Detection
Many technologies can be used for preparedness, timely detection, and response to wildfires. These include satellite imagery [40], fuel breaks [41], suppression planning [42] prescribed burning campaigns [43], unmanned aerial vehicles (UAVs) [44], optimal allocation of fire suppression resources [45], surveillance towers [46], and deploying sensor networks [47]. These strategies present drawbacks for the characteristics of the domains in consideration in this study. Satellite systems, while capable of broad-area coverage, are constrained by low spatial resolution and infrequent revisit times. UAVs, although flexible, demand continuous operation and maintenance. Similarly, the planning and implementation of fuel breaks, prescribed burning, and suppression scenarios—though essential—are labor-intensive and serve only as preventive measures. In comparison, WSNs enable continuous, real-time environmental monitoring, providing accurate point-like observations with minimal human intervention, covering large extensions. Although WSNs provide point-based measurements, increasing their density enables the generation of high-resolution spatial coverage, effectively mapping fire-related variables throughout the monitored domain. Their modular design allows for flexible deployment strategies suited to the scale and risk profile of each site. These characteristics make WSNs a suitable option for mitigating wildfire hazards in vulnerable WII areas, particularly when early detection is critical [32]. By integrating wildfire dynamics models with geospatial data, sensor placement can be optimized to meet operational demands and enable early detection when fires are still at more manageable stages of development [48].
3. Materials and Methods
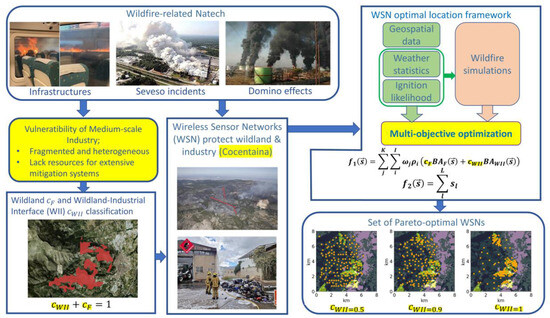
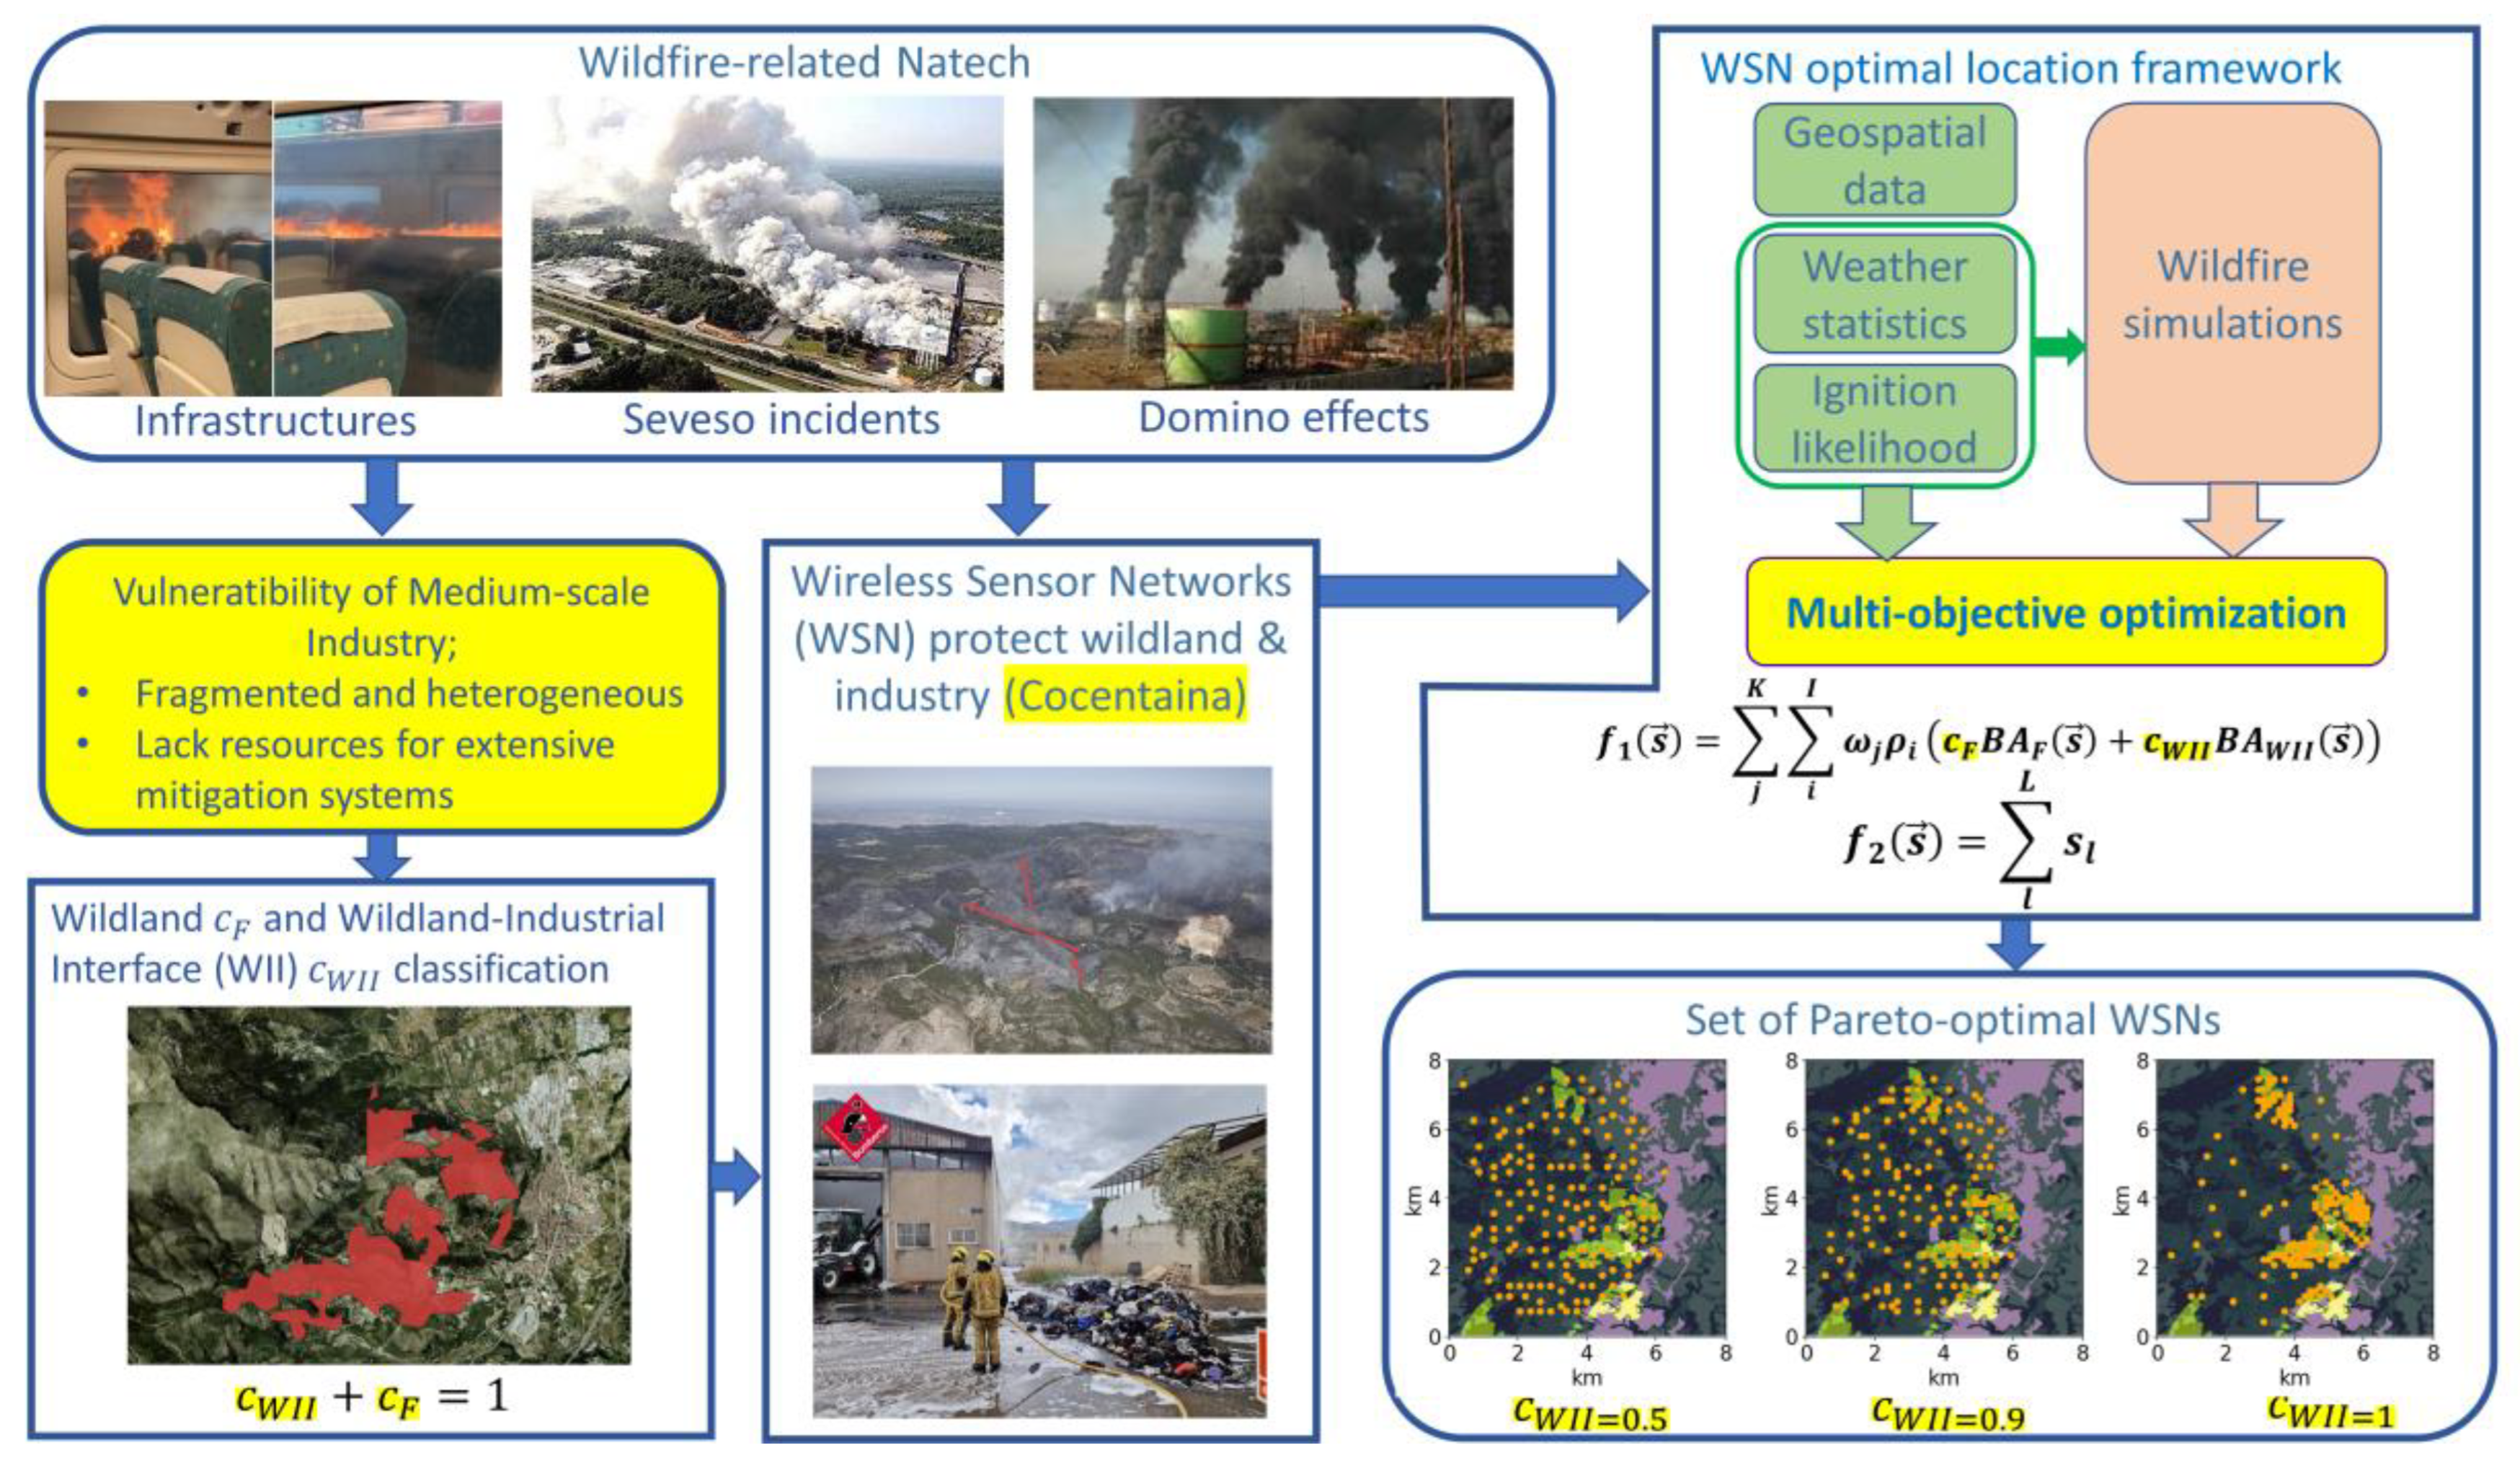
This section introduces the formulation of optimal WSNs with WII geospatial and wildfire spread dynamics information as the necessary input data. The case study, simulated data, WII mapping, and meteorological information are detailed as well. Figure 1 is a visual representation of our research.
Figure 1.
Overview of the study’s motivation and methodology.
3.1. Problem Formulation to Prioritize Protection for the WII
This study addresses the problem of identifying the optimal WSNs by framing it as a bi-objective optimization problem, balancing fire detection performance and WSN cost. These WSNs are represented using binary vectors, , to indicate whether a sensor is present (1) or absent (0) in a specific location within a predefined grid of candidate locations. A population of solutions is iteratively evaluated and modified based on detection performance and network size over an extensive set of potential wildfire scenarios.
The optimization methodology is based on [48], and is extended to include, Natech risks by integrating geospatial land classification data during the optimization process. The implementation assumes static network configurations. The problem involves identifying which sensor first triggers a fire detection based on the ignition, the weather scenario, and its location. Identification of the detection is a nonlinear problem, and exhaustive search of the best WSN for a given size constitutes a huge combinatorial problem. Therefore, the problem is solved using genetic algorithms that are well-suited for this type of optimization tasks [49]. The final solution is a population of network configurations approximating the Pareto front, i.e., the boundary where solutions cannot improve either of the objectives without deterioration of another objective.
At the wildland scale, burnt areas (BAs) remain the most critical variable influencing wildfire costs and severity [50,51,52]. Long-range wildfire spread mechanisms, such as thermal radiation and ember transport, are closely tied to fire size, which increases with biomass burning [53]. In Spain, first-response fire management is delegated to regional communities, where some prevention plans designate 30 ha as the threshold of dangerous fires, demanding the incorporation of resources and personnel from the central government [54]. Effective mitigation systems should aim to maintain the BA monitoring locations within specific operational limits and maximize monitoring efficiency within the WII.
Accordingly, we propose using the BA once the sensor network triggers the first fire detection as the observable to optimize sensor configurations. This research considers the combination of WII and wildland territory and aims to protect both while sharing the same amount of resources. Therefore, locations can belong to two land classifications: WII and wildland. The performance objective (Equation (1)) is defined as the weighted sum of BA in both regions—wildland () and WII ()—at the instant of fire detection, across various ignition (i) and weather scenarios (j).
Here, the dependence on represents the simulated BA at detection (DBA), broken-down into wildland () and WII (). For numerical efficiency, these values are precomputed under the assumption that each fire is detected by individual sensors placed at candidate locations. When a wildfire is not detected by any sensor in , a penalty value is added to , consisting of the final simulated BAi,j without distinguishing between regions. This penalization scales with fire severity (larger BA), ensuring large fires will be detected and neglecting those un-dangerous ones. The coefficients and satisfy the following relationship,
Equation (2) forces the optimizer to prioritize WII areas by adjusting one of the coefficients while maintaining a normalized weighting. The allocation of sensors is agnostic of the WII when . Note that the WII and wildland components in Equation (1) are not balanced. Since the WII usually occupies a smaller fraction of the studied area, there are fewer ignition scenarios within the WII. However, the variability of fire spread is complex and depends on meteorology, topography, and fuels, so fires can threaten the industrial sites regardless of their ignition location.
The effective transition at which the optimizer decides to allocate more resources in protecting the WII occurs when the wildland and WII terms have comparable weight in the performance objective function,
The ratio of coefficients calibrates this transition as follows:
The transition governed by Equation (4) is dynamically evaluated using the fire dynamics information without considering detection by any sensors, where refers to the data/simulated time.
For the cost objective, we assume that the sensor installation and logistical costs are proportional to the number of sensors as expressed in Equation (5):
Note that the optimizer can easily consider more elaborated cost functions if available.
This study demonstrates the ability of the optimizer to share resources between wildland and WII domains. The results will assess the DBA distributions through different parameterizations in Equation (1), without imposing constraints on the maximum number of undetected wildfires. Gómez–González et al. [48] showed that the maximum number of undetected wildfires correlates to the optimal WSN size, independent of constraints in this value.
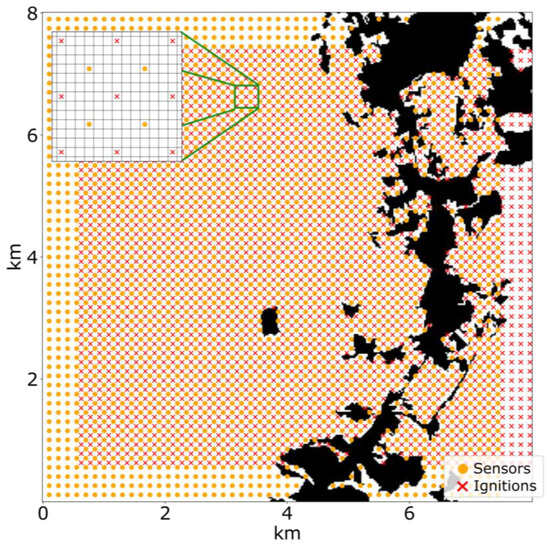
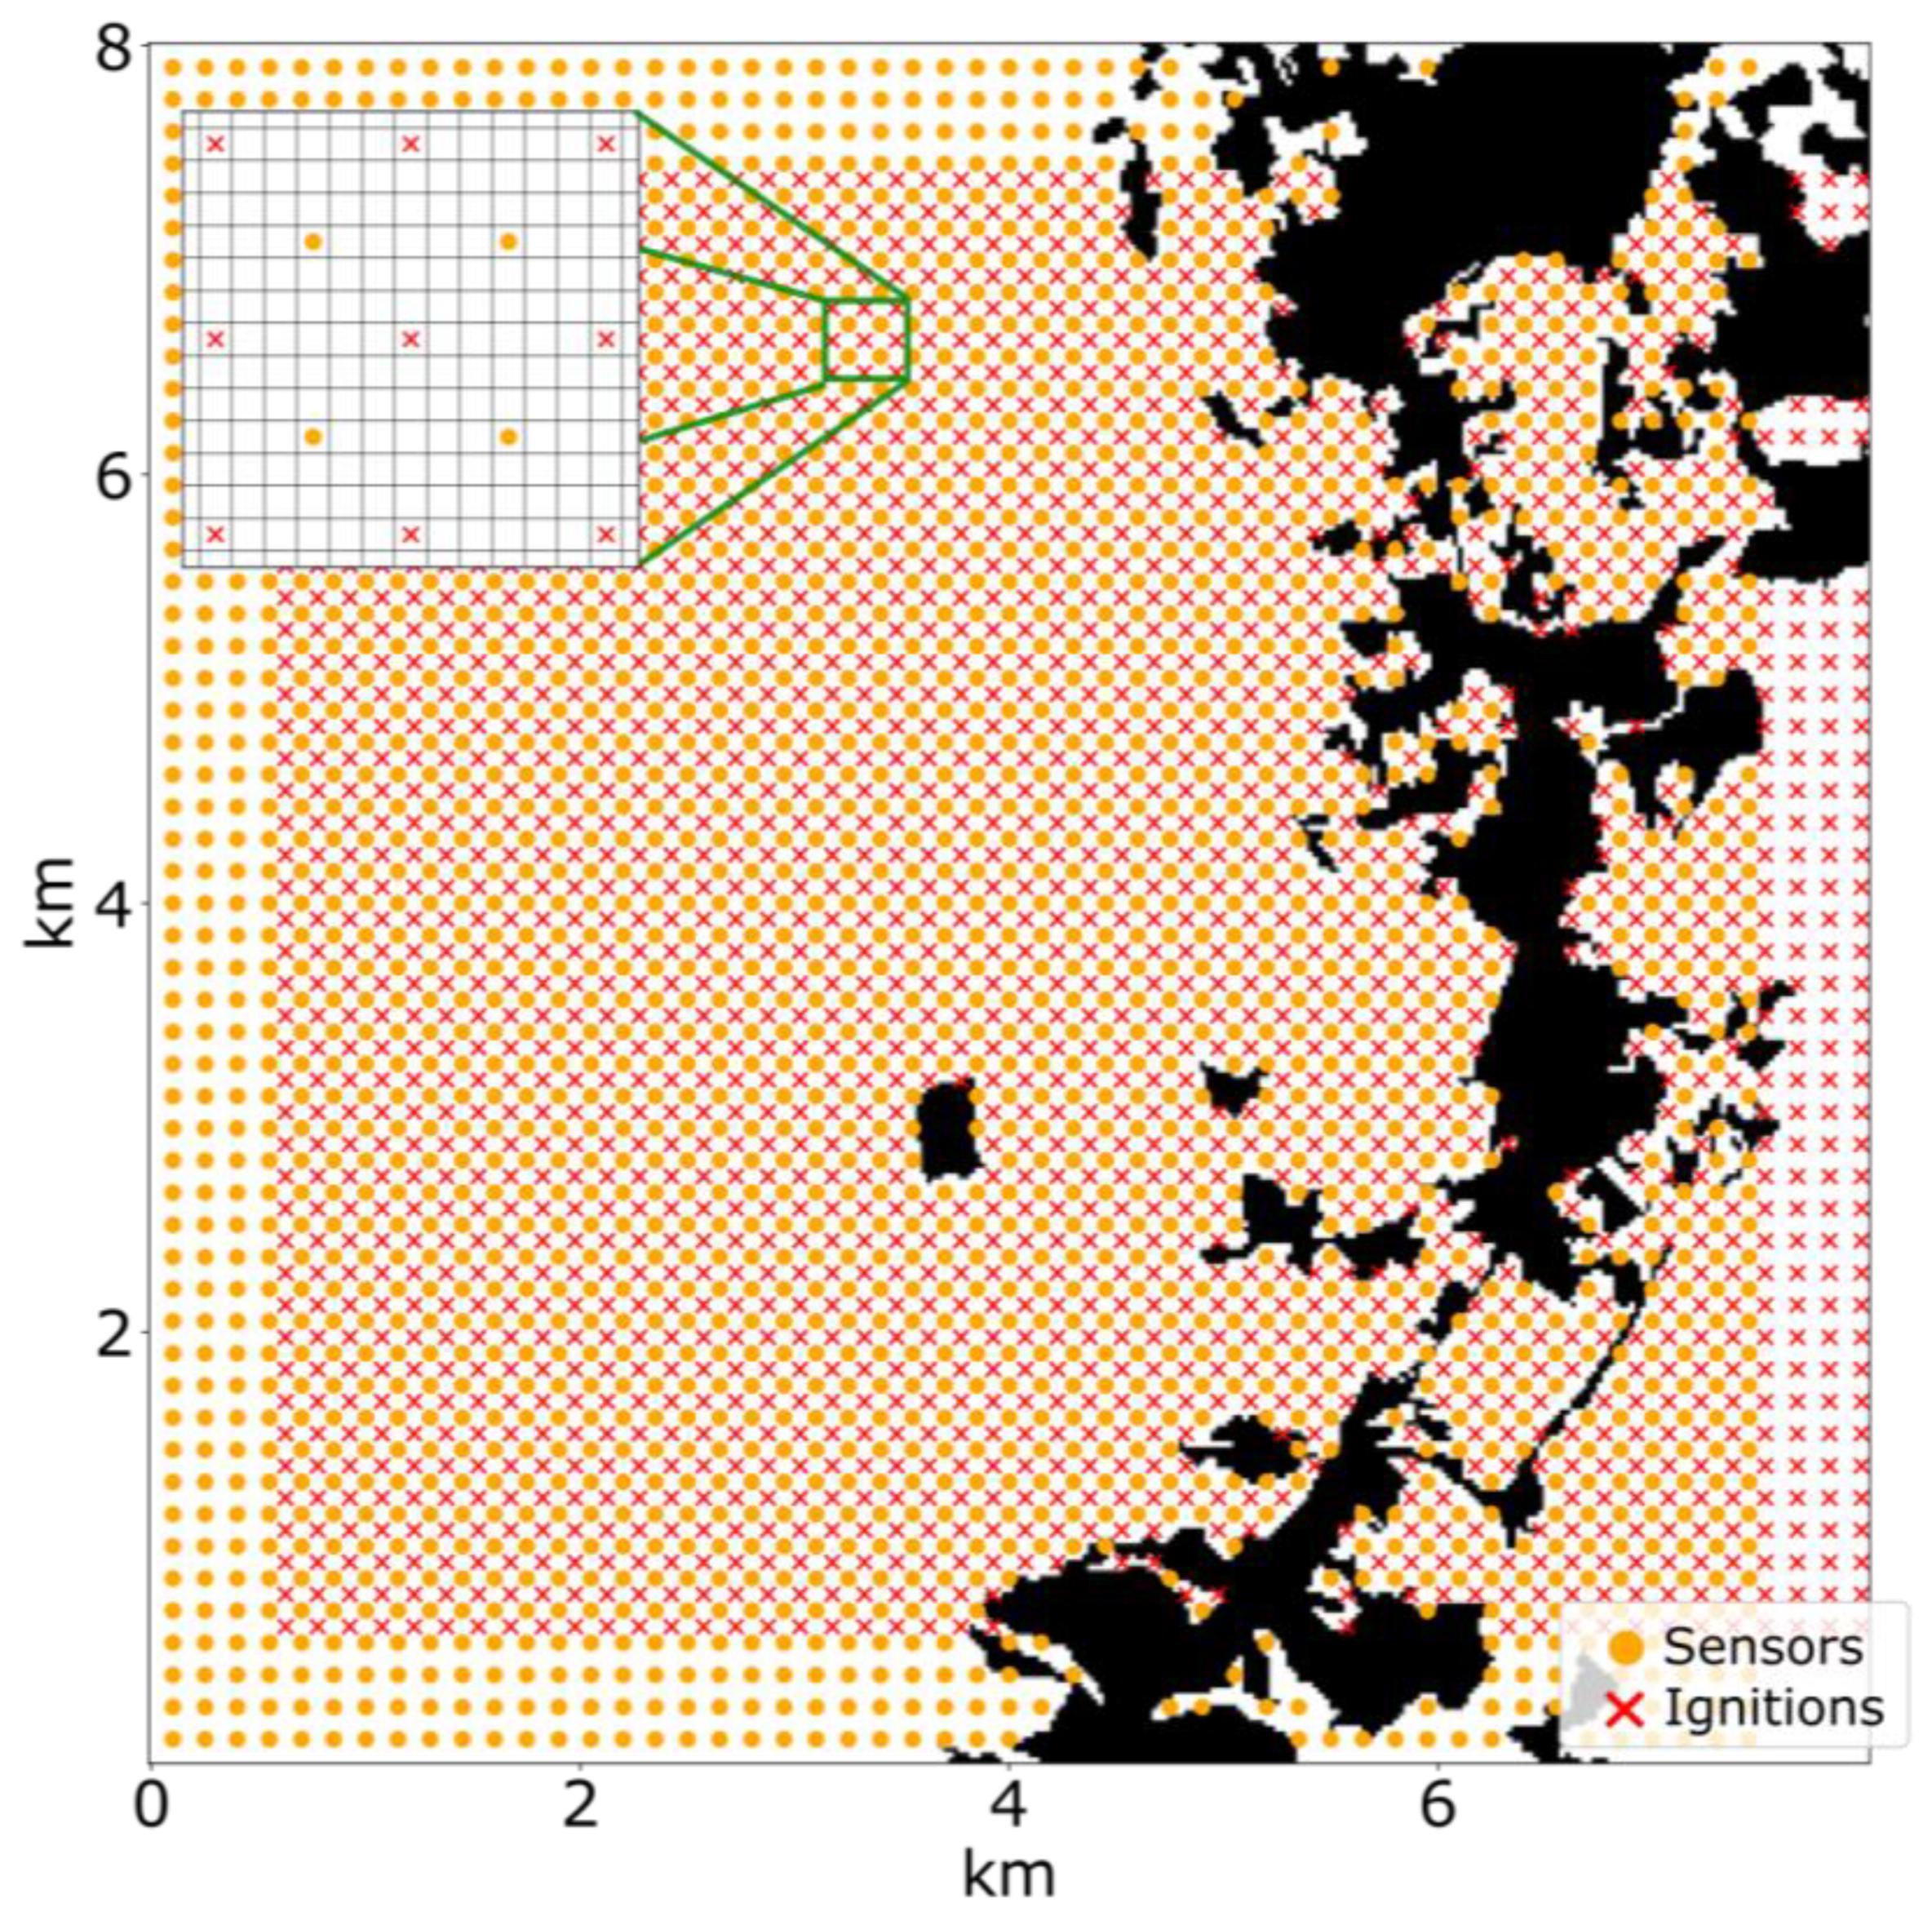
The optimization is performed with the NSGA-II (Non-dominated Sorting Genetic Algorithm II) algorithm implemented in Pymoo [55]. Pymoo (version 0.6.1.5) is an open-source Python framework that provides state-of-the-art algorithms and comprehensive tools for optimization, including popular implementations of multi-objective algorithms such as NSGA-II. The predefined sets of ignitions and candidate sensor locations are shown in Figure 2.
Figure 2.
The spatial distribution of sensors is defined over a static, fixed grid of ● candidate sensor locations. To characterize fire dynamics across this landscape, the study considers a grid of × potential ignitions. Figure adapted from [48].
3.2. Case Study
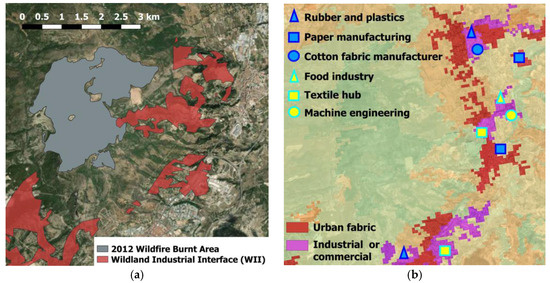
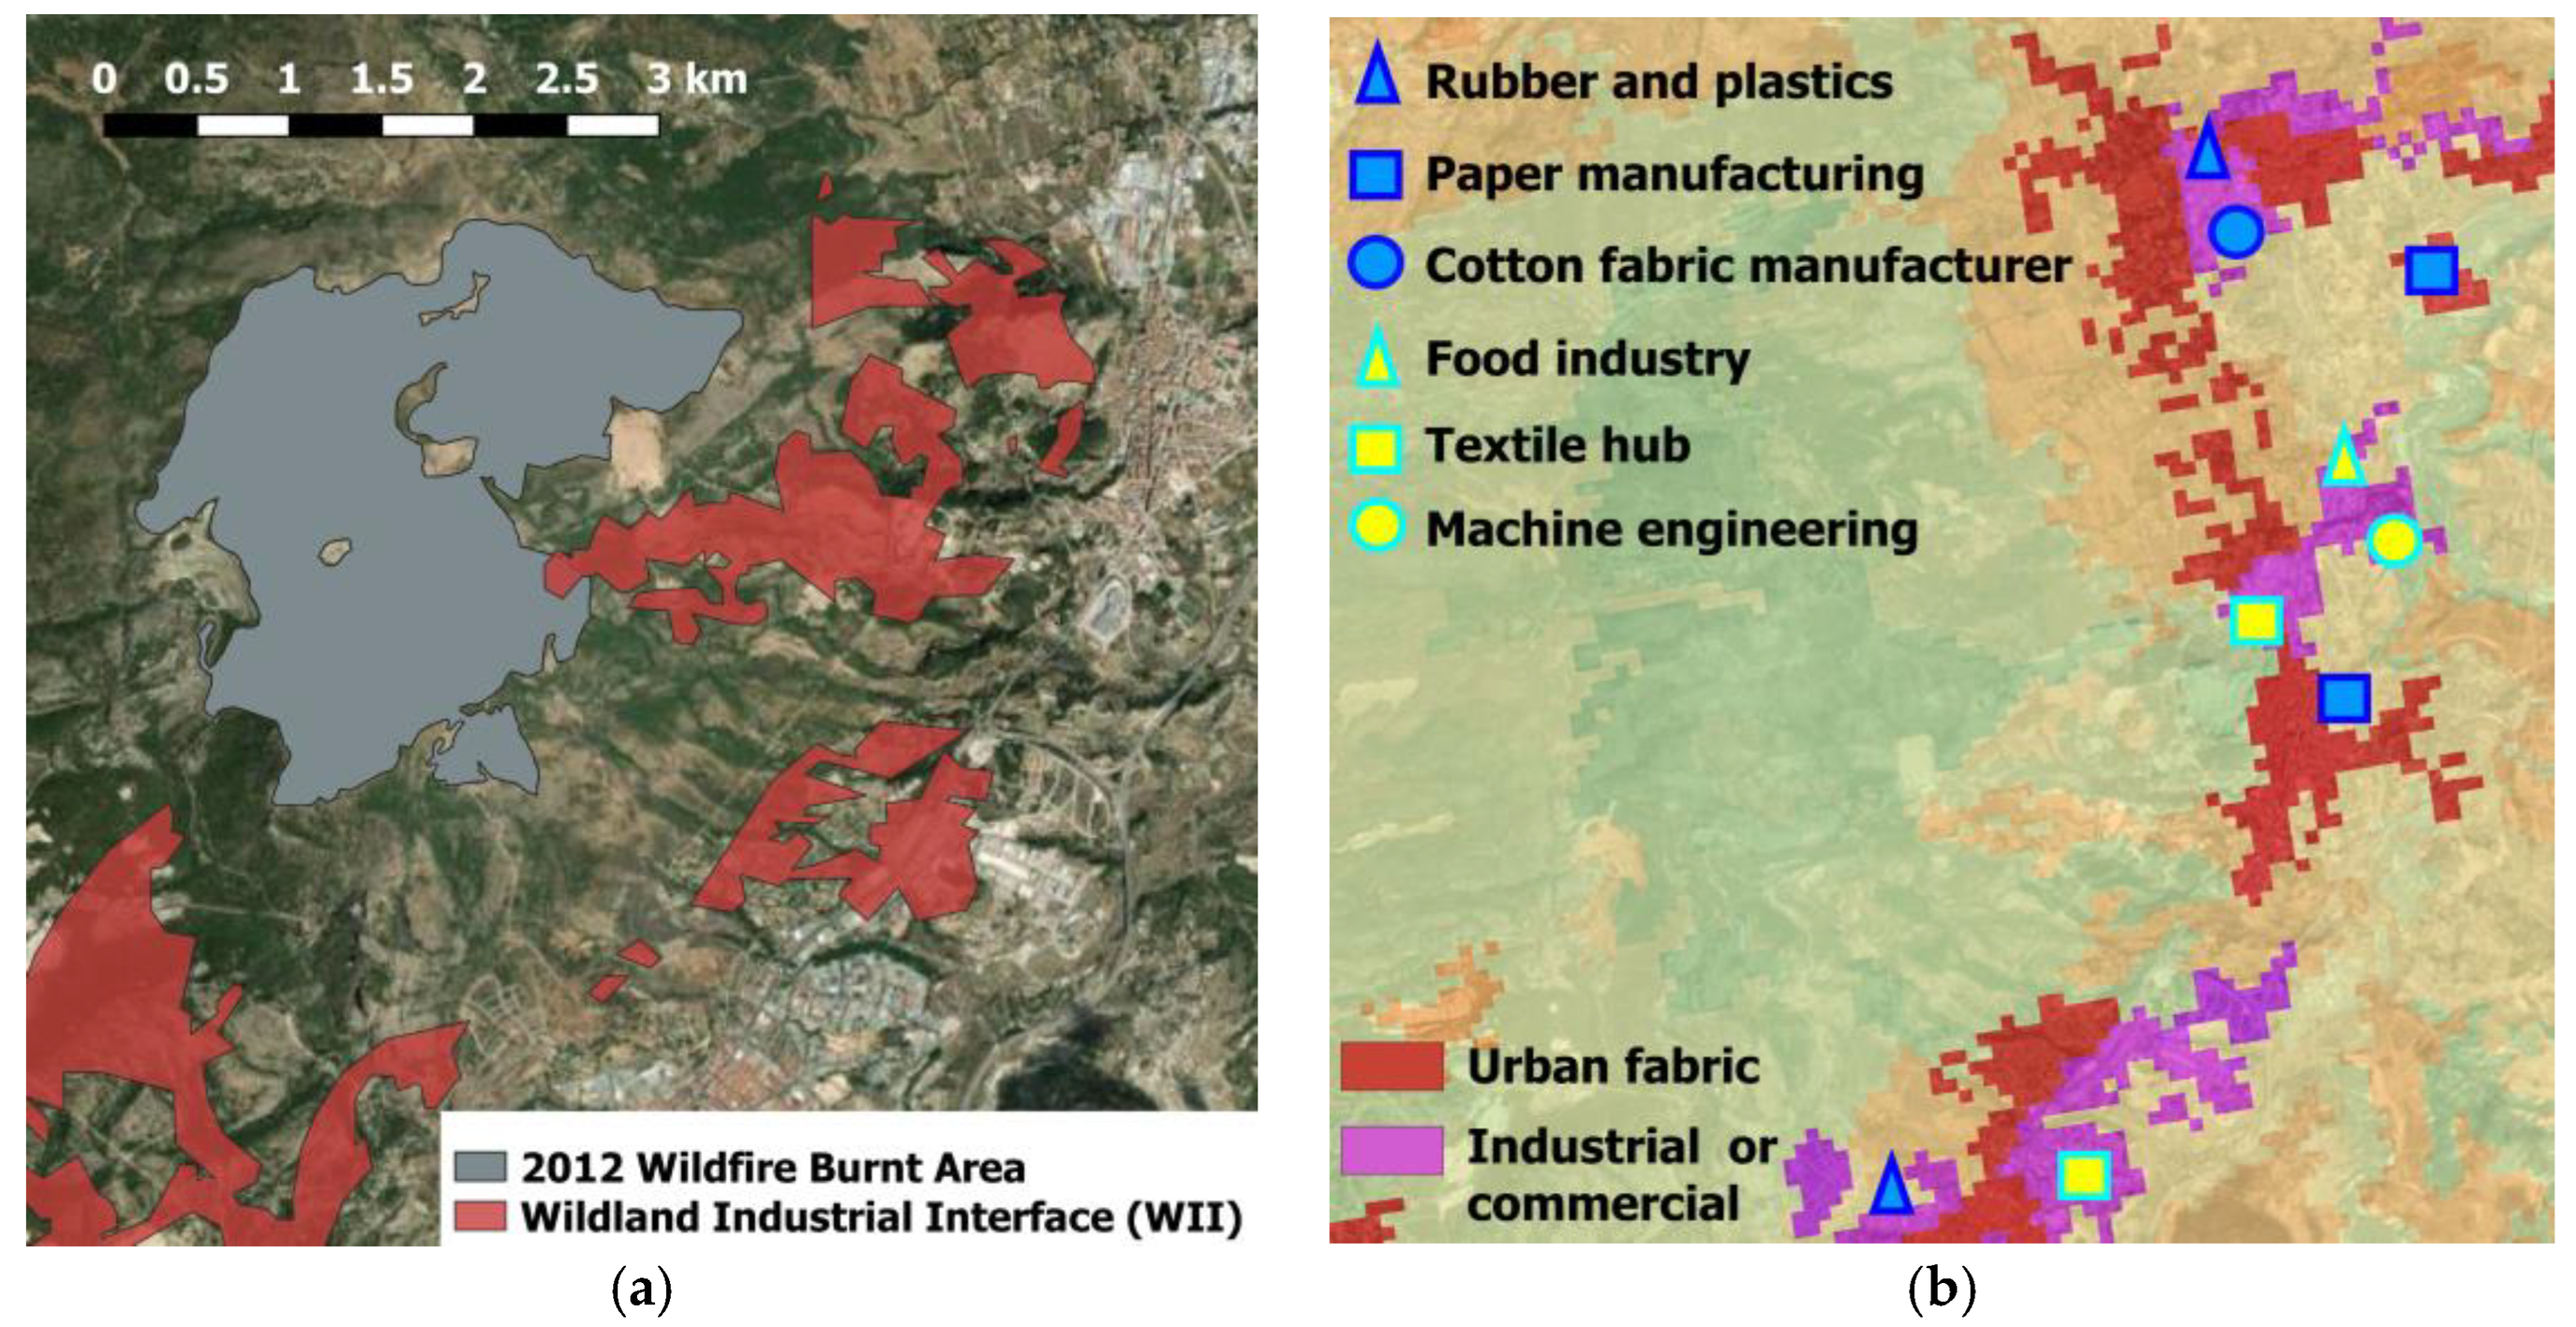
The case study focuses on the town of Cocentaina, located in the province of Alicante, Southeast Spain. The town lies on the outskirts of the natural park Sierra de Mariola, characterized by a typical Mediterranean ecosystem dominated by shrubland and pine species such as Pinus pinaster. The area experiences hot, dry summers, contributing to a high prevalence of wildfires. According to the Spanish Forest Fire Statistics, between 1995 and 2019, there were 88 wildfire outbreaks in this area, 18 of which exceeded initial suppression efforts [56]. The most significant incident occurred in July 2012, when a wildfire burned over 500 ha, threatening both residential and industrial zones in close proximity (See Figure 3a).
Figure 3.
(a) The final burnt area from the fire event of 2012, in gray shade, is compared to the wildland–industrial interface (WII) from [5], in red shade. (b) The CORINE land cover map for the Cocentaina municipality, where the urban areas are highlighted in red and industrial parks in purple.
Cocentaina, with a population of 12,000 people, serves as the capital of the Comcat county and is a regional industrial hub. Historically, the town’s industry centered on textiles and shoemaking but has since diversified into sectors such as paper, food production, rubber and plastics, machine engineering, metal working, and wood/cork and furniture manufacturing. Industrial activities are distributed across three industrial parks (See Figure 3b). Table 2 summarizes the industrial activities in the region, based on 2005 data [57], showcasing a total of 368 industry-related companies.
Table 2.
Industrial activity in the “Comcat” county illustrated by the number of companies and the percentage with respect to the total. Sourced from [57].
In recent years, several industrial fire incidents have been recorded, particularly in the textile sector [58,59]. Cocentaina lies within a highly flammable landscape, making WII characterization extensive (See Figure 3a). The dual vulnerability of wildland and industrial areas underscores the necessity for EWDS capable of mitigating fire spread in both domains, as wildland fires can propagate to industrial areas, potentially causing Natech incidents.
3.3. Wildland–Industrial Interface (WII) Mapping
The WII boundaries used in this study are derived from [5] based on publicly available geospatial datasets that identify areas where industrial installations are close to wildland vegetation. To define these boundaries, buffer distances are applied according to the fire hazard associated with vegetation types, with a maximum buffer distance of 2.4 km. The final WII boundaries result from the intersection of hazardous vegetation zones with buffered industrial areas.
Vegetation data for Europe are sourced from the 2018 CORINE Land Cover dataset [60], while global vegetation information is taken from the Copernicus Global Land Cover dataset [61]. Industrial site locations are mapped using the OpenStreetMap (OSM) dataset [62], which includes industrial areas exceeding one hectare.
The WII boundaries are visualized through an online tool [5]. For this study, the geospatial polygons were digitized in QGIS (version 3.44.5-Solothurn), following precise geographical calibration. Figure 3a displays the WII polygons utilized in the analysis
3.4. Fire Simulations and High-Risk Weather Scenarios
The wildfire dataset characterizing the fire dynamics patterning on the landscape is obtained from simulations on a predefined set of ignitions, under different weather scenarios. The simulator used to generate the data is as in [63], validated in the “Sierra de Mariola” region. Simulations predict fire spread for 5 h. In real scenarios, an uncontrolled wildfire is always detected after a few hours by visual inspection of the smoke plume or by satellite monitoring. Therefore, 5 h is more than enough for the assessment of an EWDS [64]. The fire landscape is digitized, generating a 321 × 321 resolution raster, with a spatial resolution of 25 × 25 m2. The presence of wildland fires at the WII is a proxy for their impact on industrial assets. Thus, simulations addressing the specific fire impacts on these elements are not deemed necessary at this stage.
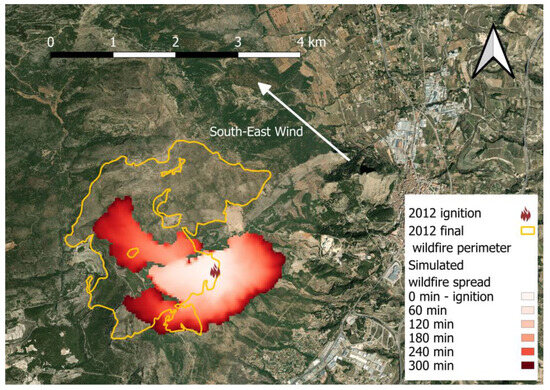
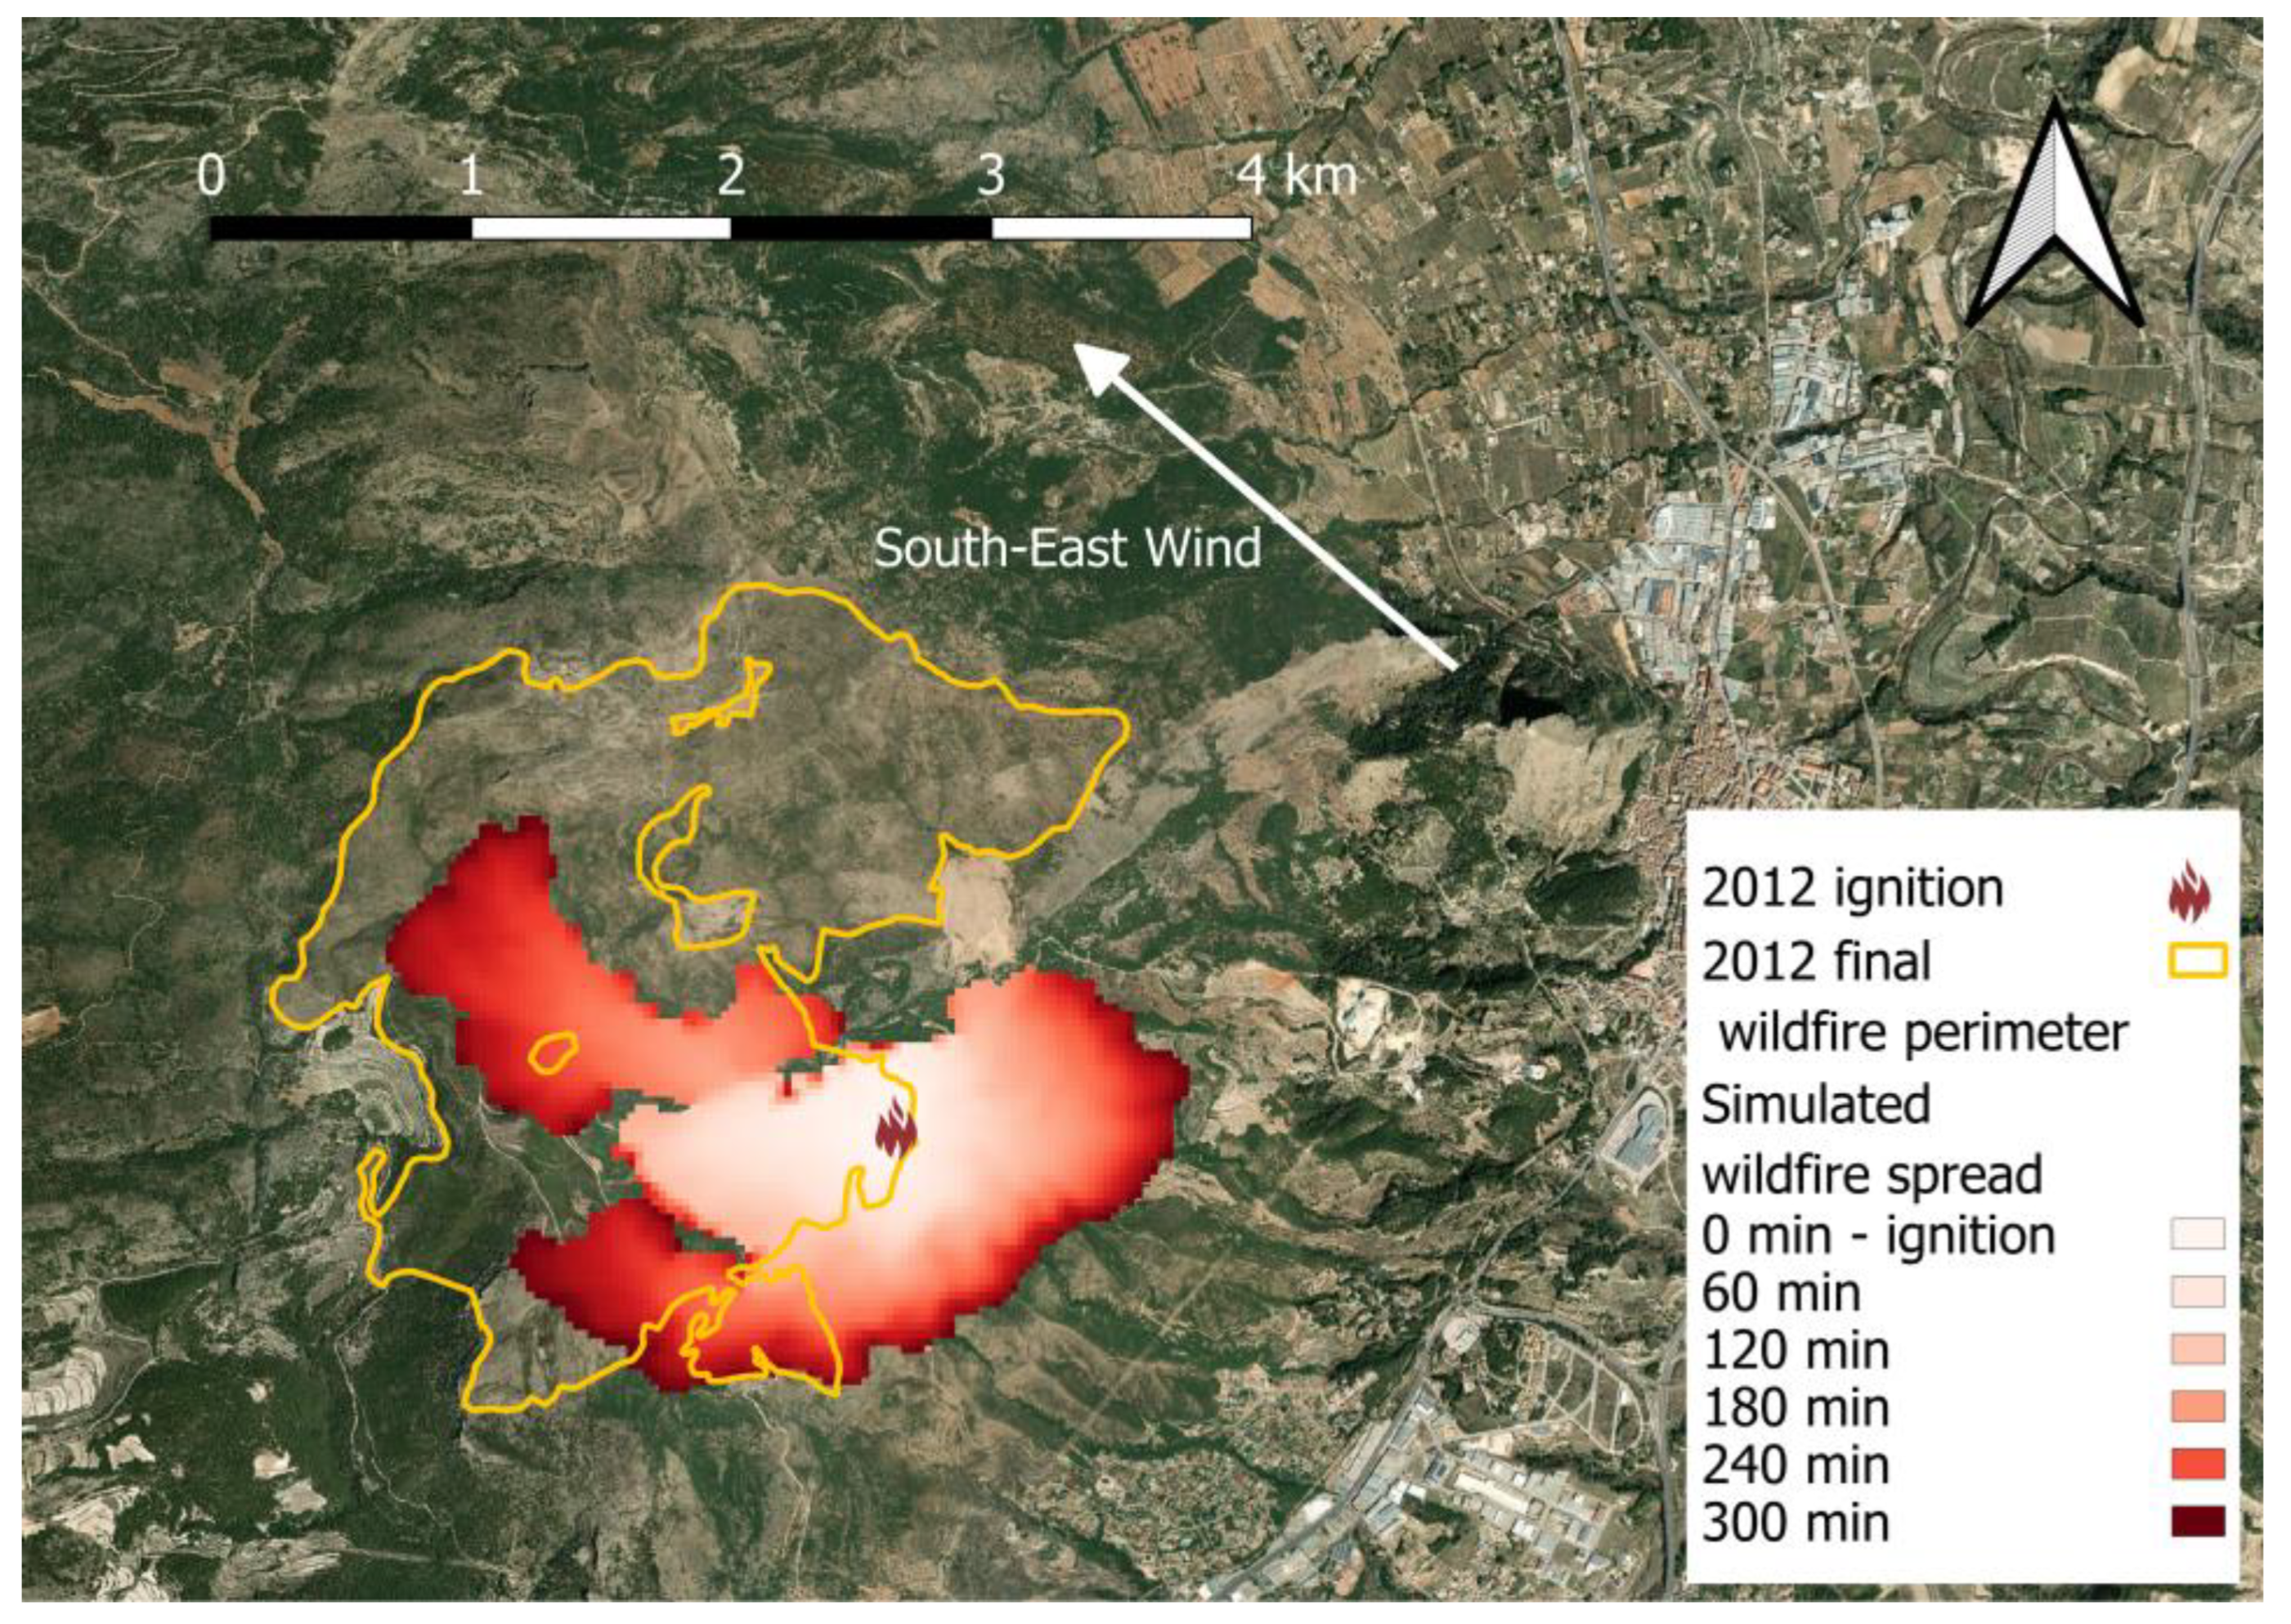
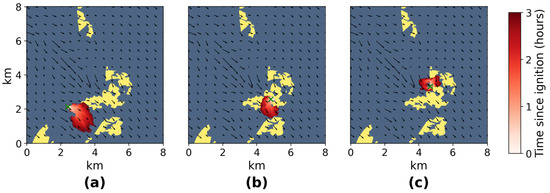
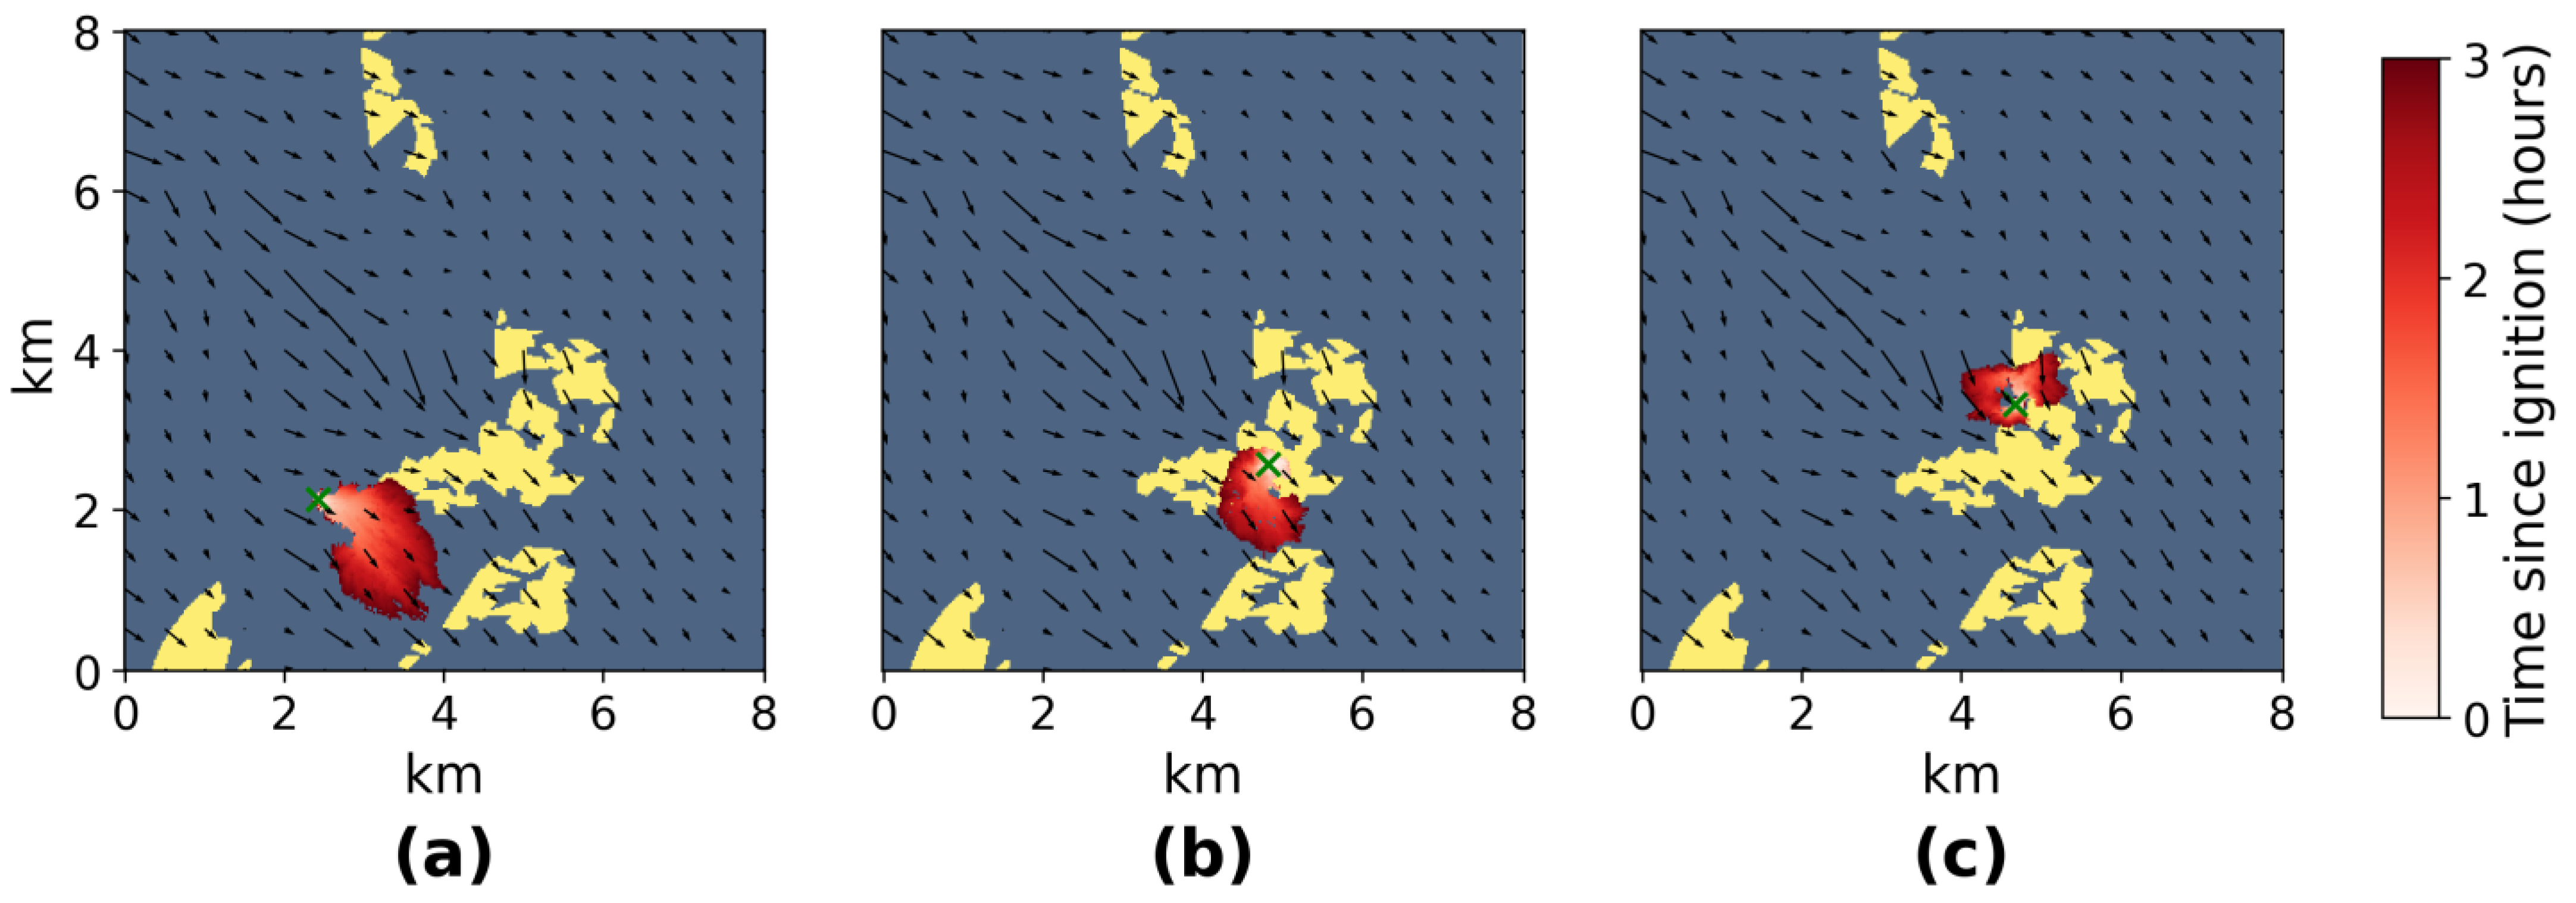
The simulation results strongly depend on the weather, particularly wind and fuel moisture conditions. The methodology to characterize high-risk weather scenarios was presented in [48], and involves public data from the weather re-analysis ERA5 [65] and datasets from the Canadian Fire Weather Indexes (FWI) [66]. Figure 4 visualizes a comparison between a simulated wildfire from the dataset used in this study and the final wildfire perimeter from the 2012 event cited in Section 3.2. The result displays 5 h of fire spread using a color-gradient visualization of the arrival times. The simulation is taken for the ignition closest to the original incident, with south–east wind conditions reflecting the most similar weather scenario during the first stages of the 2012 wildfire development. Figure 5 shows other three wildfire scenarios considered in this study for three different ignition locations and weather conditions. All three scenarios are characterized by high-risk north–west winds. These illustrate three different cases affecting the wildland and WII relevant to the industrial protection perspective; a wildfire spreading only within the wildland (Figure 5a), a wildfire igniting within the WII (Figure 5b), and a wildfire propagating from to the wildland to WII domains (Figure 5c).
Figure 4.
Simulation corresponding to the closest conditions (ignition and weather scenario) of the 2012 wildfire incident cited in Section 3.2.
Figure 5.
In wildland–WII landscapes, there are three different wildfire propagating scenarios: (a) fire spreading mainly in the wildland, (b) starting in the WII domain and spreading across WII and wildland, (c) igniting in the wildland and threatening WII. The visualization reproduces 3 h of real time.
Table 3 presents the different weather scenarios, characterized by their wind conditions and their frequency based on the data, as computed in [48]. These wind speeds and directions are the input to generate spatial wind maps with WindNinja [67], a mass-conserving operational wind field modeling tool, producing the final wind inputs to the simulator. The wind field corresponding to the north–west wind direction is shown as the background vector field in Figure 5. In total, 1556 and eight weather scenarios are considered, accounting for 12,448 simulations.
Table 3.
Wind speeds and direction statistics used to generate wildfire scenarios.
4. Results and Discussion
This section reports results from applying Section 3.1 methodology to the Section 3.2 case study. Section 4.1 is a brief outline of the experimental setup. Section 4.2 analyzes the transition governed by Equation (4). Section 4.3 presents the sets of optimal WSNs obtained for different levels of WII protection. Section 4.4 assesses the performance of these solutions as an EWDS, using the distribution of detected burnt areas, with a disaggregated analysis for WII and wildland domains to underline their distinct protection implications. Section 4.5 performs a comparative analysis of the results with varying WII/wildland protection levels, to demonstrate the benefits of adopting this framework. Finally, Section 4.6 discusses the difference in the number of sensors necessary to achieve similar levels of protection for different prioritization coefficient values.
4.1. Experimental Setup
The optimizer uses the binary random sampling, the two-pint crossover and the bit flip mutation methods implemented in Pymoo for the NSGA-II algorithm. The optimizer settings for population size, offspring and number of generations are reported in Table 4.
Table 4.
NSGA-II settings for population size, offspring and number of generations and the number of ignitions and candidate sensor locations.
The solution space considered here comprises WSN configurations, where L is the total number of sensor locations and n the WSN size. For and the total cardinality of possible solutions, thus the total number of objective function evaluations, is . With the optimizer setup of Table 3, we only need to explore 6 million configurations (approximately the number of generations times the offspring parameter) to get an accurate approximation of the front. Using our experimental setting (a regular laptop with 16 GB RAM) the Pareto front is obtained within 6 to 10 h of CPU time. Extensive enumeration of all possible solutions for a particular population size would be impossible, accounting just to evaluate all the possible configurations for a given , rendering this problem impossible to solve in real time.
4.2. Transition of Prioritized Mitigation
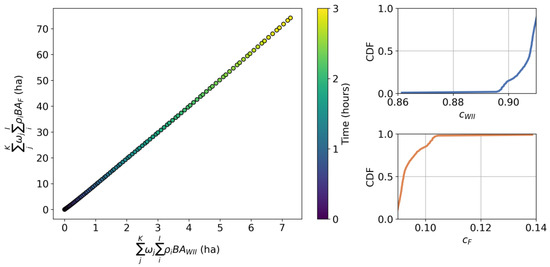
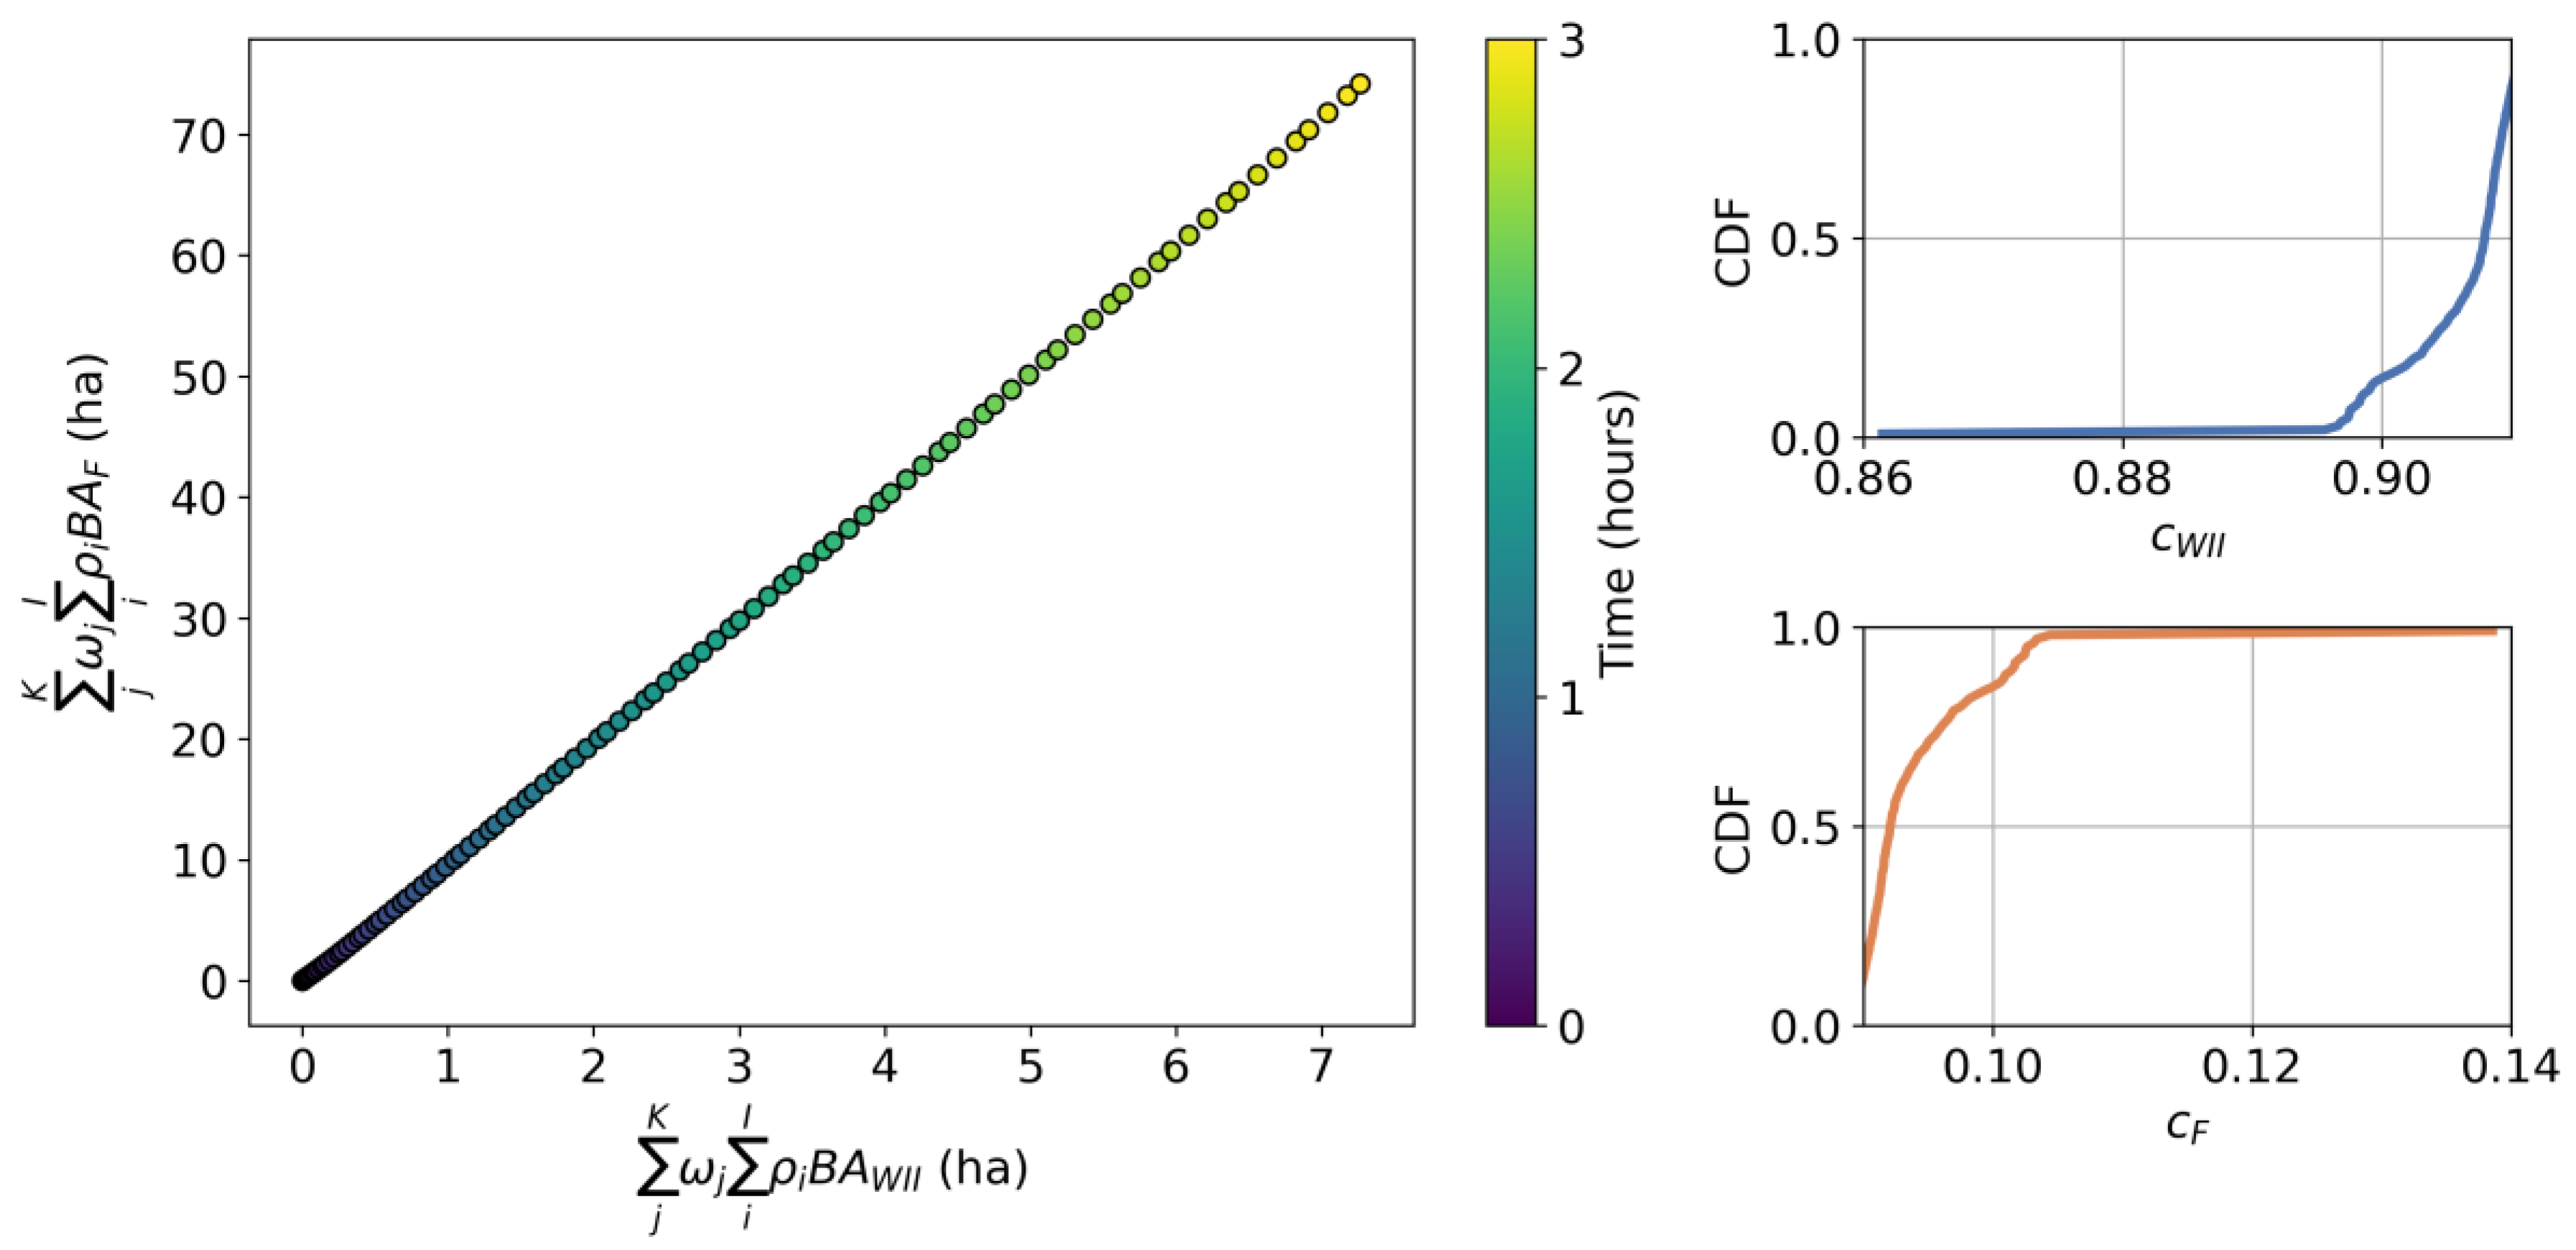
Effective industrial protection requires prioritizing WII over wildland, which occurs when . At optimal WSNs weigh locations solely by local fire susceptibility (). Since is typically much smaller than and most ignitions do not impact the interface, the two terms in Equation (1) are imbalanced, and the effective transition is governed by Equation (4). These quantities are evaluated at each simulation time, t, to form the time distributions and . Figure 6 (left) shows the dynamic scatter for up to 3 h after ignition. In this case study, the ratio remains approximately constant, supporting the use of Equation (4). Figure 6 (right) illustrates the Cumulative Density Functions (CDFs) of derived from time sampling. In these figures, it is possible to estimate the onset for effective WII as the median of the distribution, that approximately takes place for the value (). For simplicity, we take the values and through the remainder of the Results section.
Figure 6.
Comparison of wildland and WII contributions in the performance objective Equation (1), considering the wildfire spread simulation data. Left: dispersion of the performance objective components up to 3 h after ignition. Only the first 3 h are shown for readability; the same behavior holds up to 5 h. Right: the Cumulative Density Functions (CDFs) resulting from the estimations of and through their ratio expressed as Equation (4) and the normalization condition from Equation (2).
4.3. Optimization Setting and Pareto-Optimal WSNs
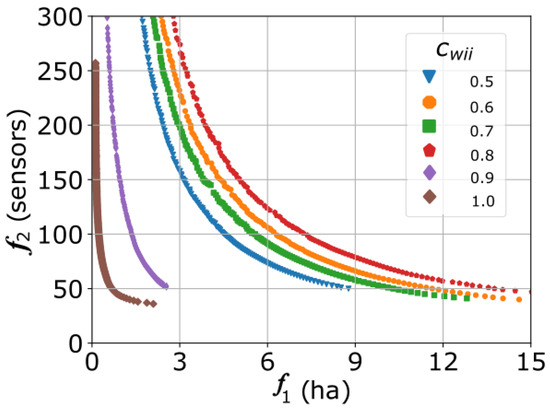
In this section, we present illustrative optimization results, including the visualization of the Pareto fronts, DBA distributions, and spatial layouts of WSNs across different values, in support of Section 3.1. Figure 7 shows resulting Pareto fronts for with WSN sizes larger than 50 sensors. To avoid finite size effects due to the resolution of the sensor locations grid, the Pareto fronts only include up to 250 sensors. The special cases in which the WSN only protects WII () represent the scenario for the theoretical maximum protection to this domain. Focusing on the arrangement of Pareto curves in the objective plane, for increasing values of , these lie further away relative to the origin of coordinates. This trend abruptly changes for values and which are successively placed closer to the origin of coordinates. The inversion in this trend illustrates the transition to effective fire mitigation in the WII domain. For larger values, the performance function is dominated by the contribution of .
Figure 7.
Pareto-optimal fronts for different values of . As increases, the optimizer shifts protection from wildland to WII areas, leading to lower values due to increased sensor allocation in the WII domain.
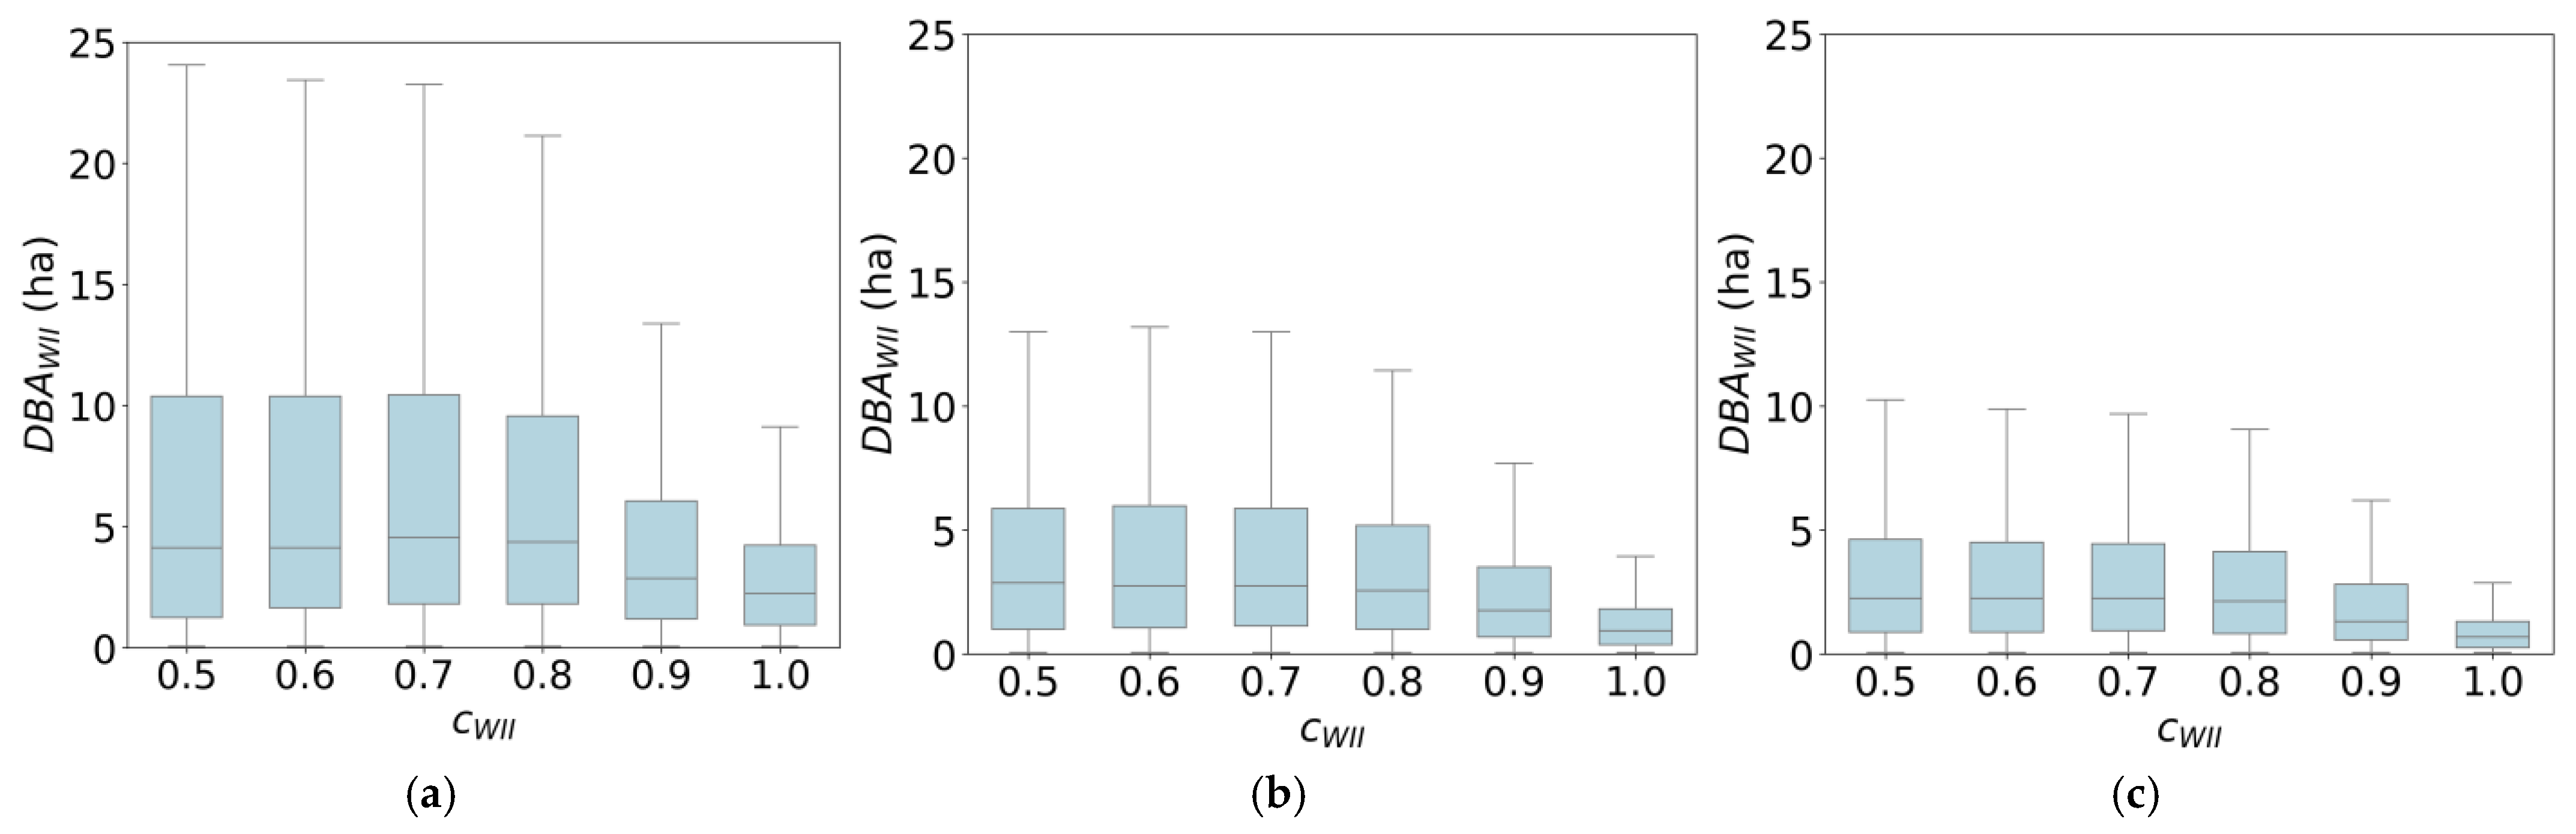
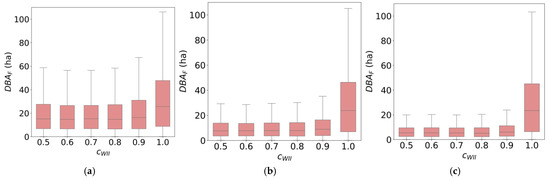
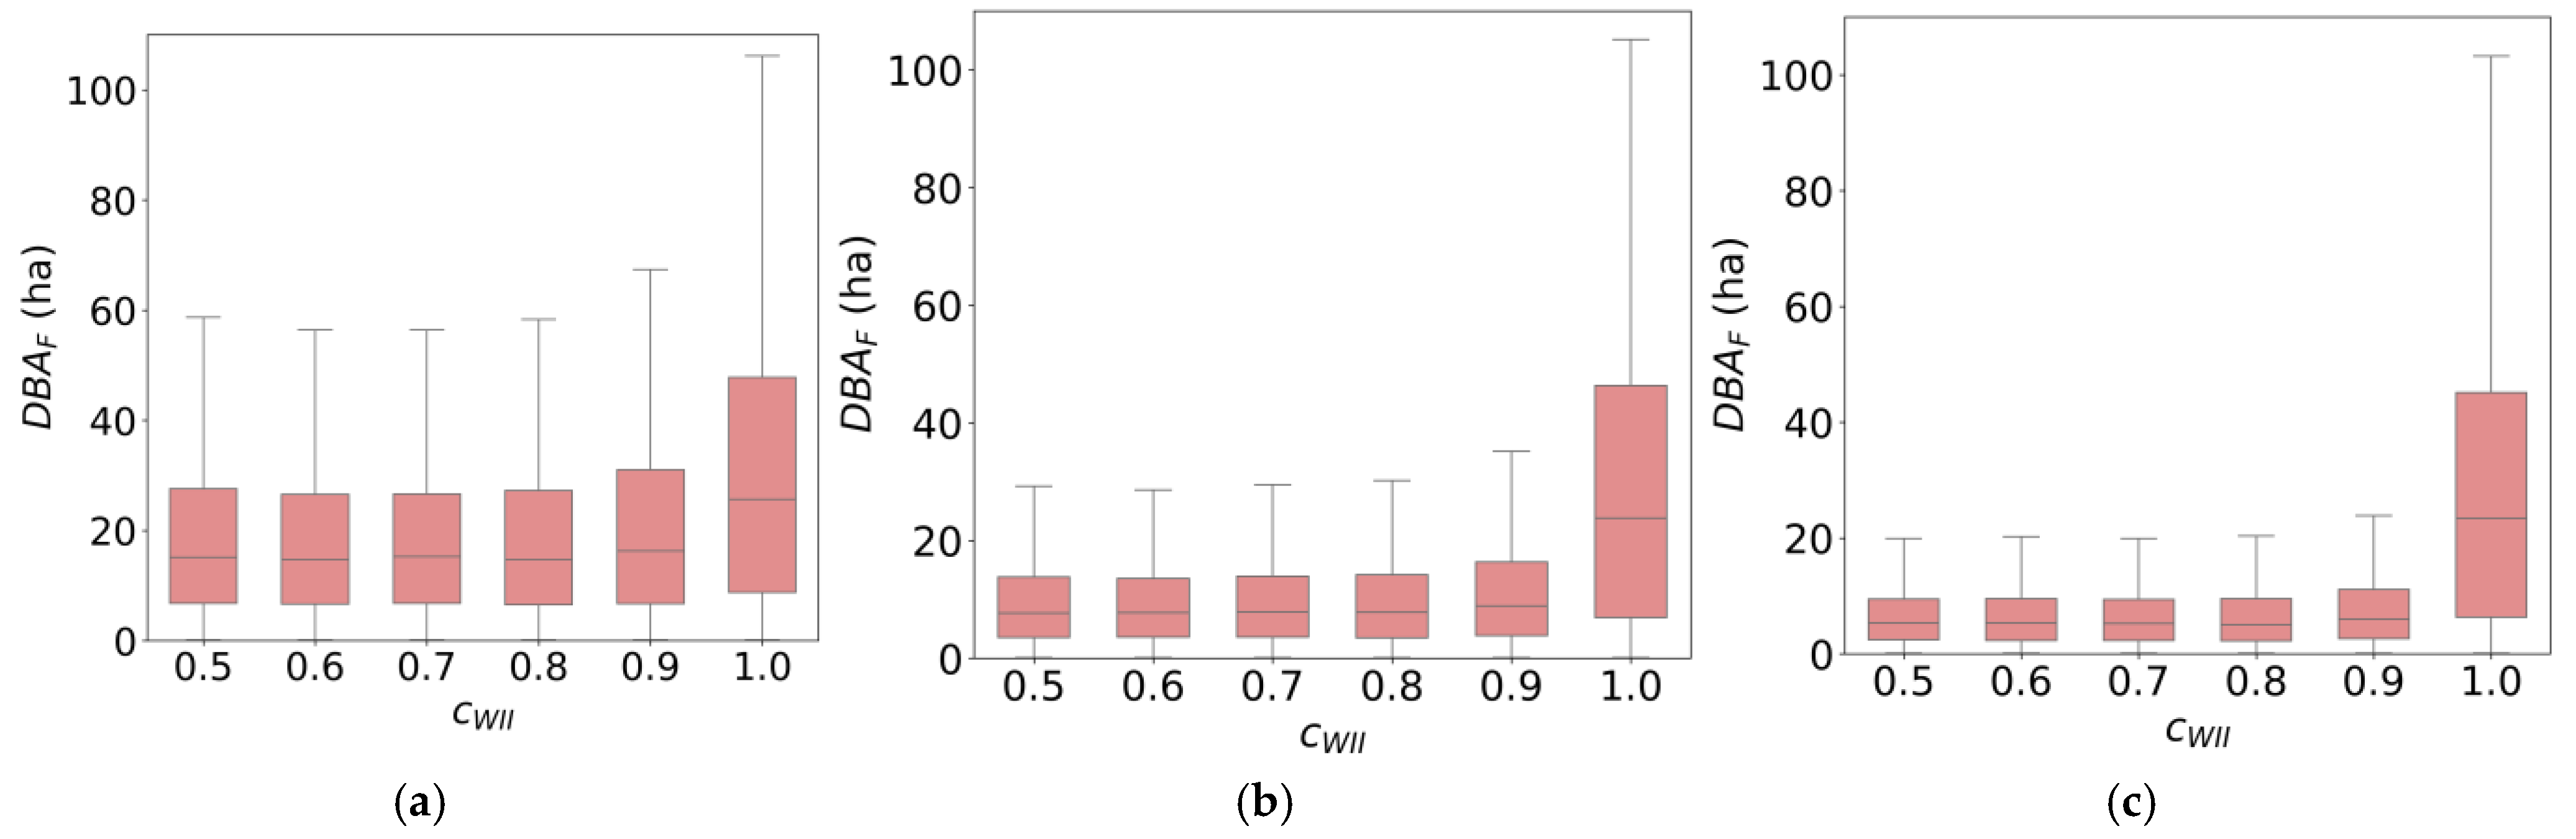
Because is the average-weighted sum of and , it does not reflect the specific level of protection of a particular domain. Instead, better metrics are the disaggregated DBA distributions across these domains, and . Notably, these distributions do not adhere to Pareto optimality for a varying number of sensors, exhibiting variability and resulting in an irregular distribution pattern. This randomness is the motivation to analyze results as cumulative distributions. Figure 8 and Figure 9 visualize and for different protection coefficients and different WSN size distributions with boxplots, respectively. Figure 8a and Figure 9a correspond to a WSN with 50 sensors, Figure 8b and Figure 9b with 100 sensors, and Figure 8c and Figure 9c with 150 sensors.
Figure 8.
Boxplots visualizing the detected burnt area in WII () domain for different and Wireless Sensor Network (WSN) sizes of (a) 50, (b) 100, and (c) 150 sensors. Note that increasing reduces the median and the variability of the DBA.
Figure 9.
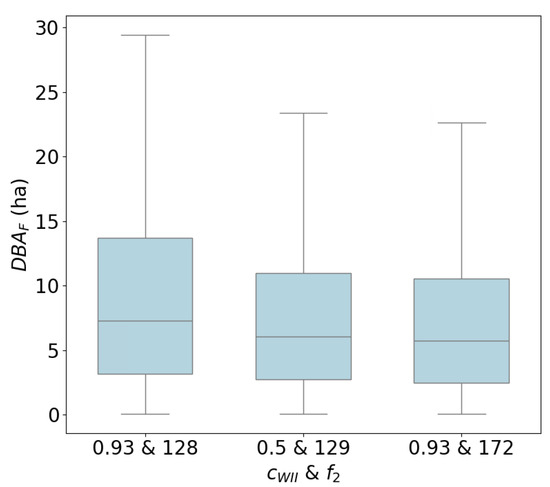
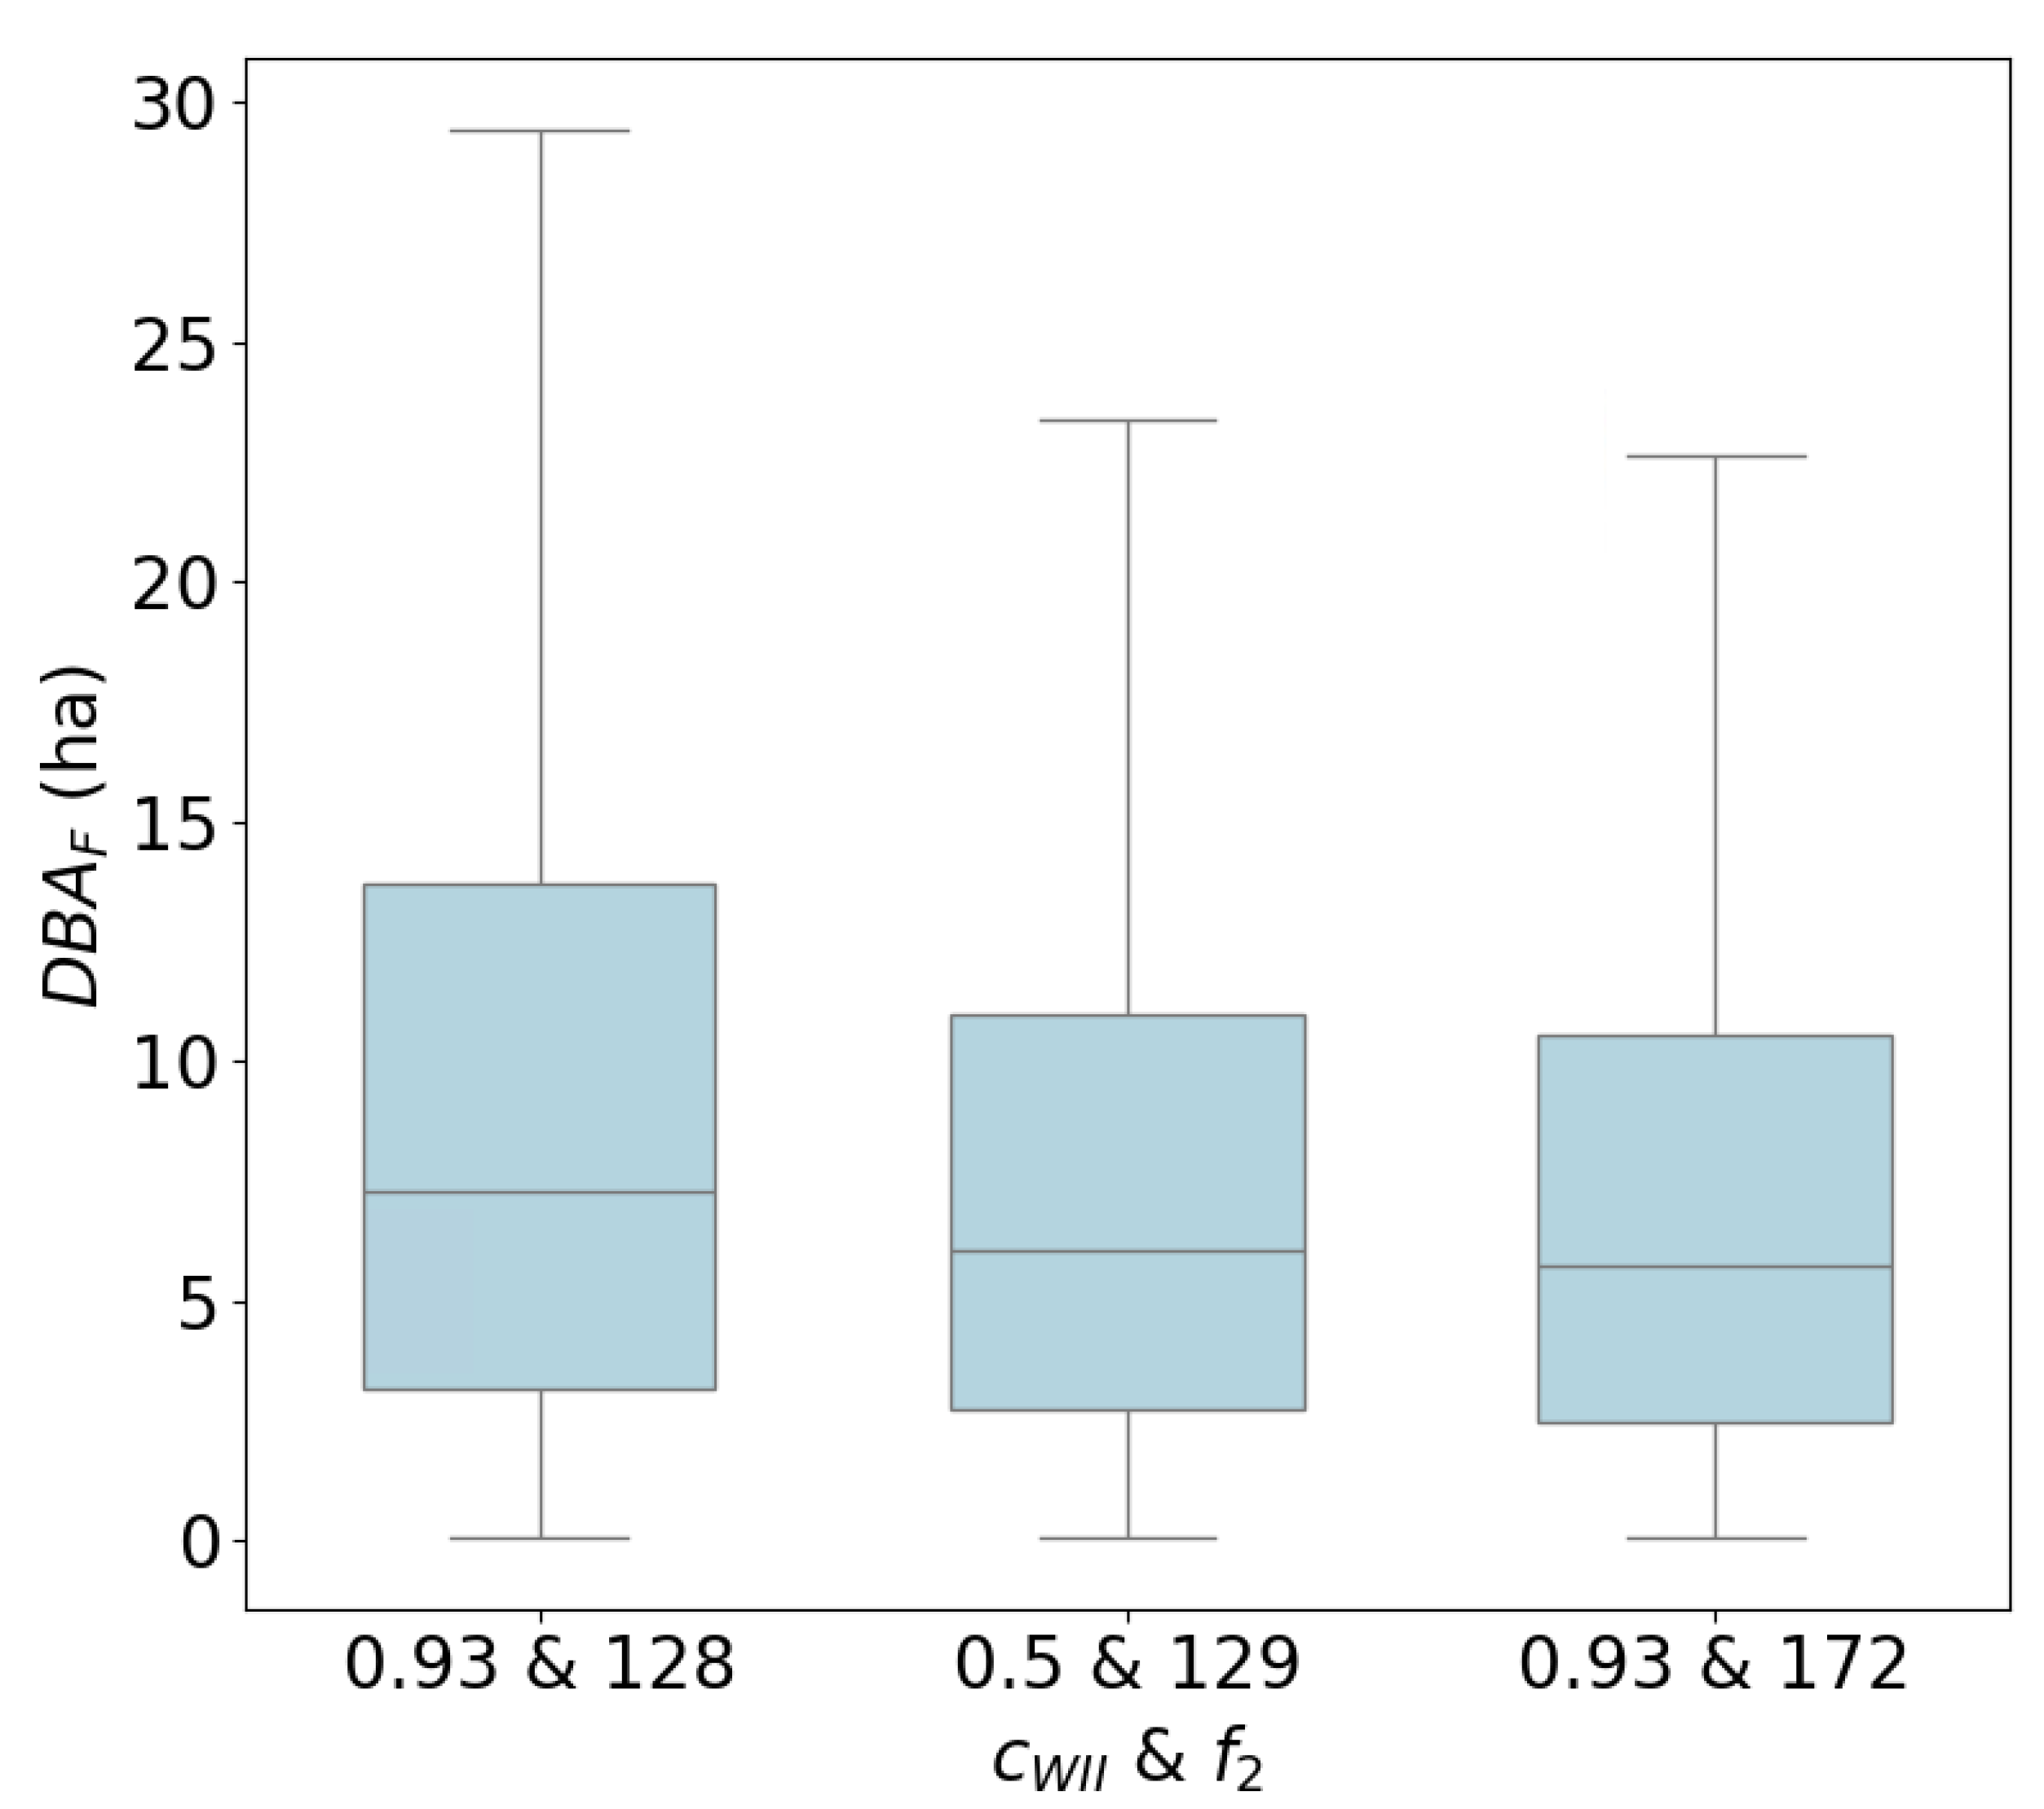
Boxplots visualizing the detected burnt area in the wildland domain () for different and WSN sizes of (a) 50, (b) 100, and (c) 150 sensors. Unlike Figure 8, increasing increases the median and the variability of , but the change is more dramatic for closer to one for a large number of sensors.
It is important to note that the area monitored by sensors is 90% wildland and 10% WII. As a consequence of this fragmentation, and consequently the are smaller than their counterparts in the wildland, (BAF, DBAF), confirmed by the extent of the vertical scale in the boxplot representations.
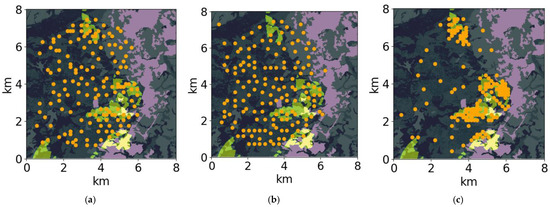
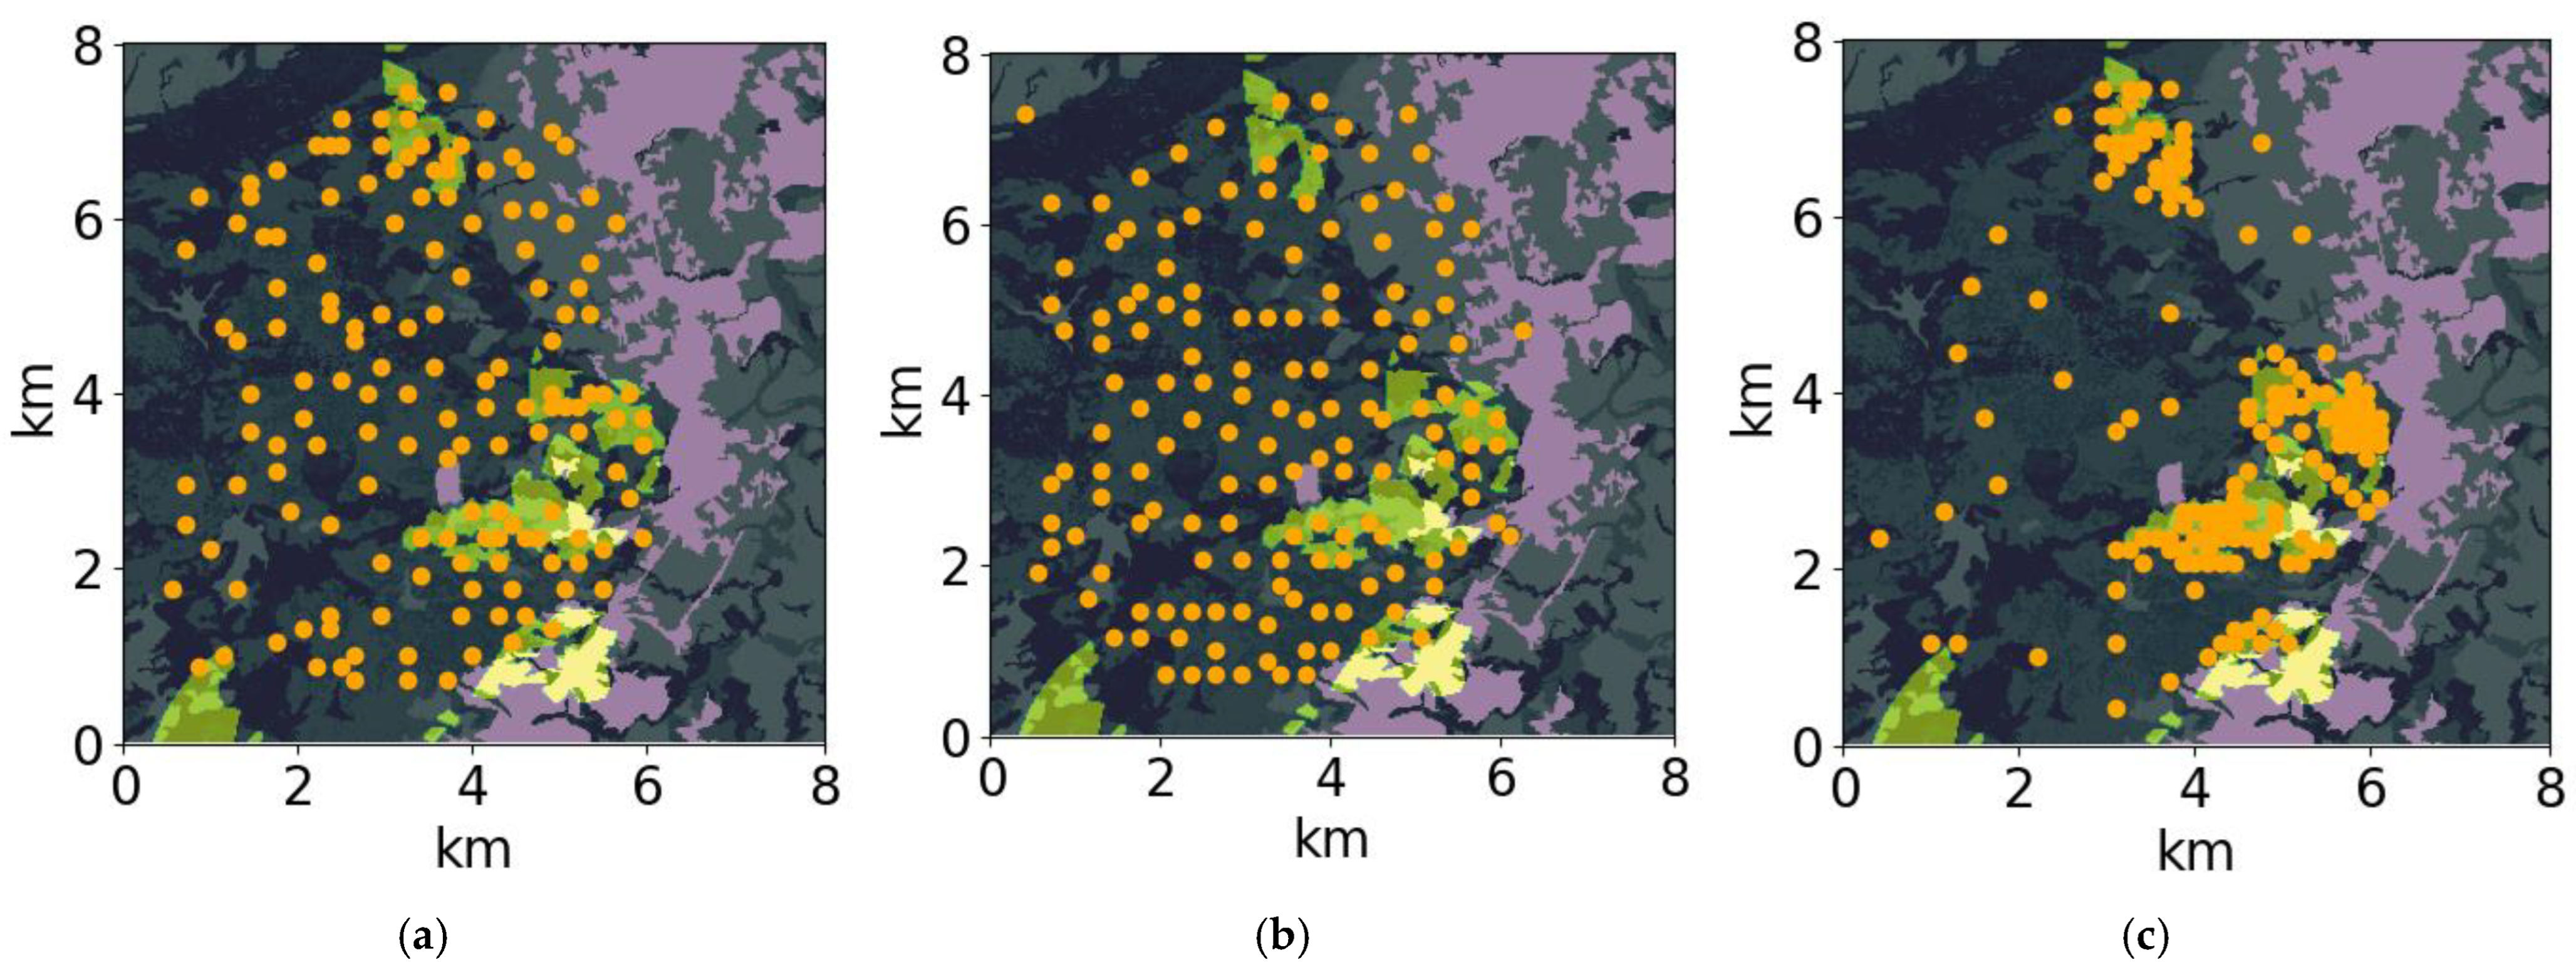
Figure 8 and Figure 9 show that, in the limiting case of , the maximum level of WII protection comes at the cost of a total neglect on the wildland. This is simply because sensor locations saturate WII areas, and in case no more candidate sensor locations are available, the remaining sensors are placed randomly in the wildland. Figure 10 visualizes the spatial arrangement of optimal WSNs for . In the case study, notice how the spatial configurations of solutions are difficult to distinguish by visual inspection in Figure 10b,c, although the optimizer effectively arranges the WSN to protect the WII in Figure 10c.
Figure 10.
Wireless sensor network (WSN) spatial configurations with 150 sensors selected from the Pareto fronts resulting from solving the multi-optimization problem defined by the criteria of Equations (1) and (5). The figures show the correlation between protection prioritization of WII and the dispersion of sensors locations. (a), (b), (c) . Yellow-shadowed areas denote the wildland–industrial interface (WII) in this municipality. Background raster indicate the fuel models as computed in [48].
4.4. Choice of Trade-Offs in the WII–Wildland System
The DBA distributions in Figure 8 and Figure 9 indicate that WSN size is the variable most strongly correlated with detection performance. To assess the beneficial trade-offs introduced by , we aim to study its effect in isolation from WSN size as much as possible. For this purpose, we analyze the relative variation in different distribution statistics between protected WII and the non-protected-WII—for which we refer to case due to recurrence using this example—scenarios using optimal WSNs of the same size for the comparison.
Performance across network configurations is evaluated using the 50th percentile (representing typical DBA) and higher percentiles (90th and 95th) to capture mitigation effectiveness for larger fires through early detection. The standardized metric used here is the percentage variation when comparing an optimization with against the case across WSNs of equal size,
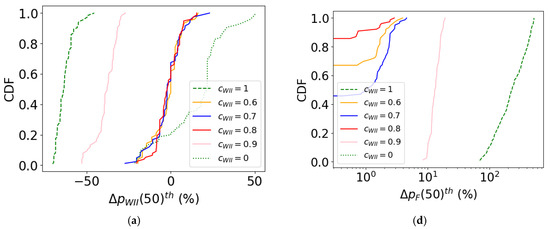
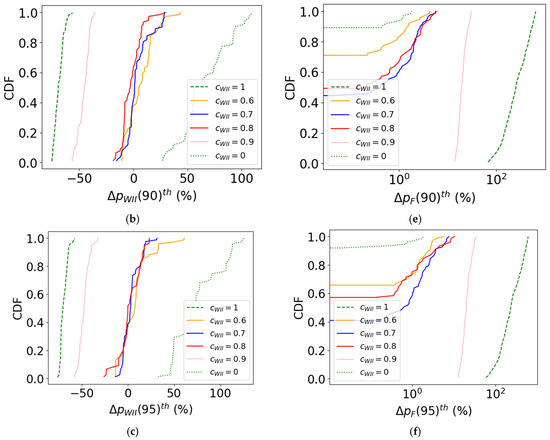
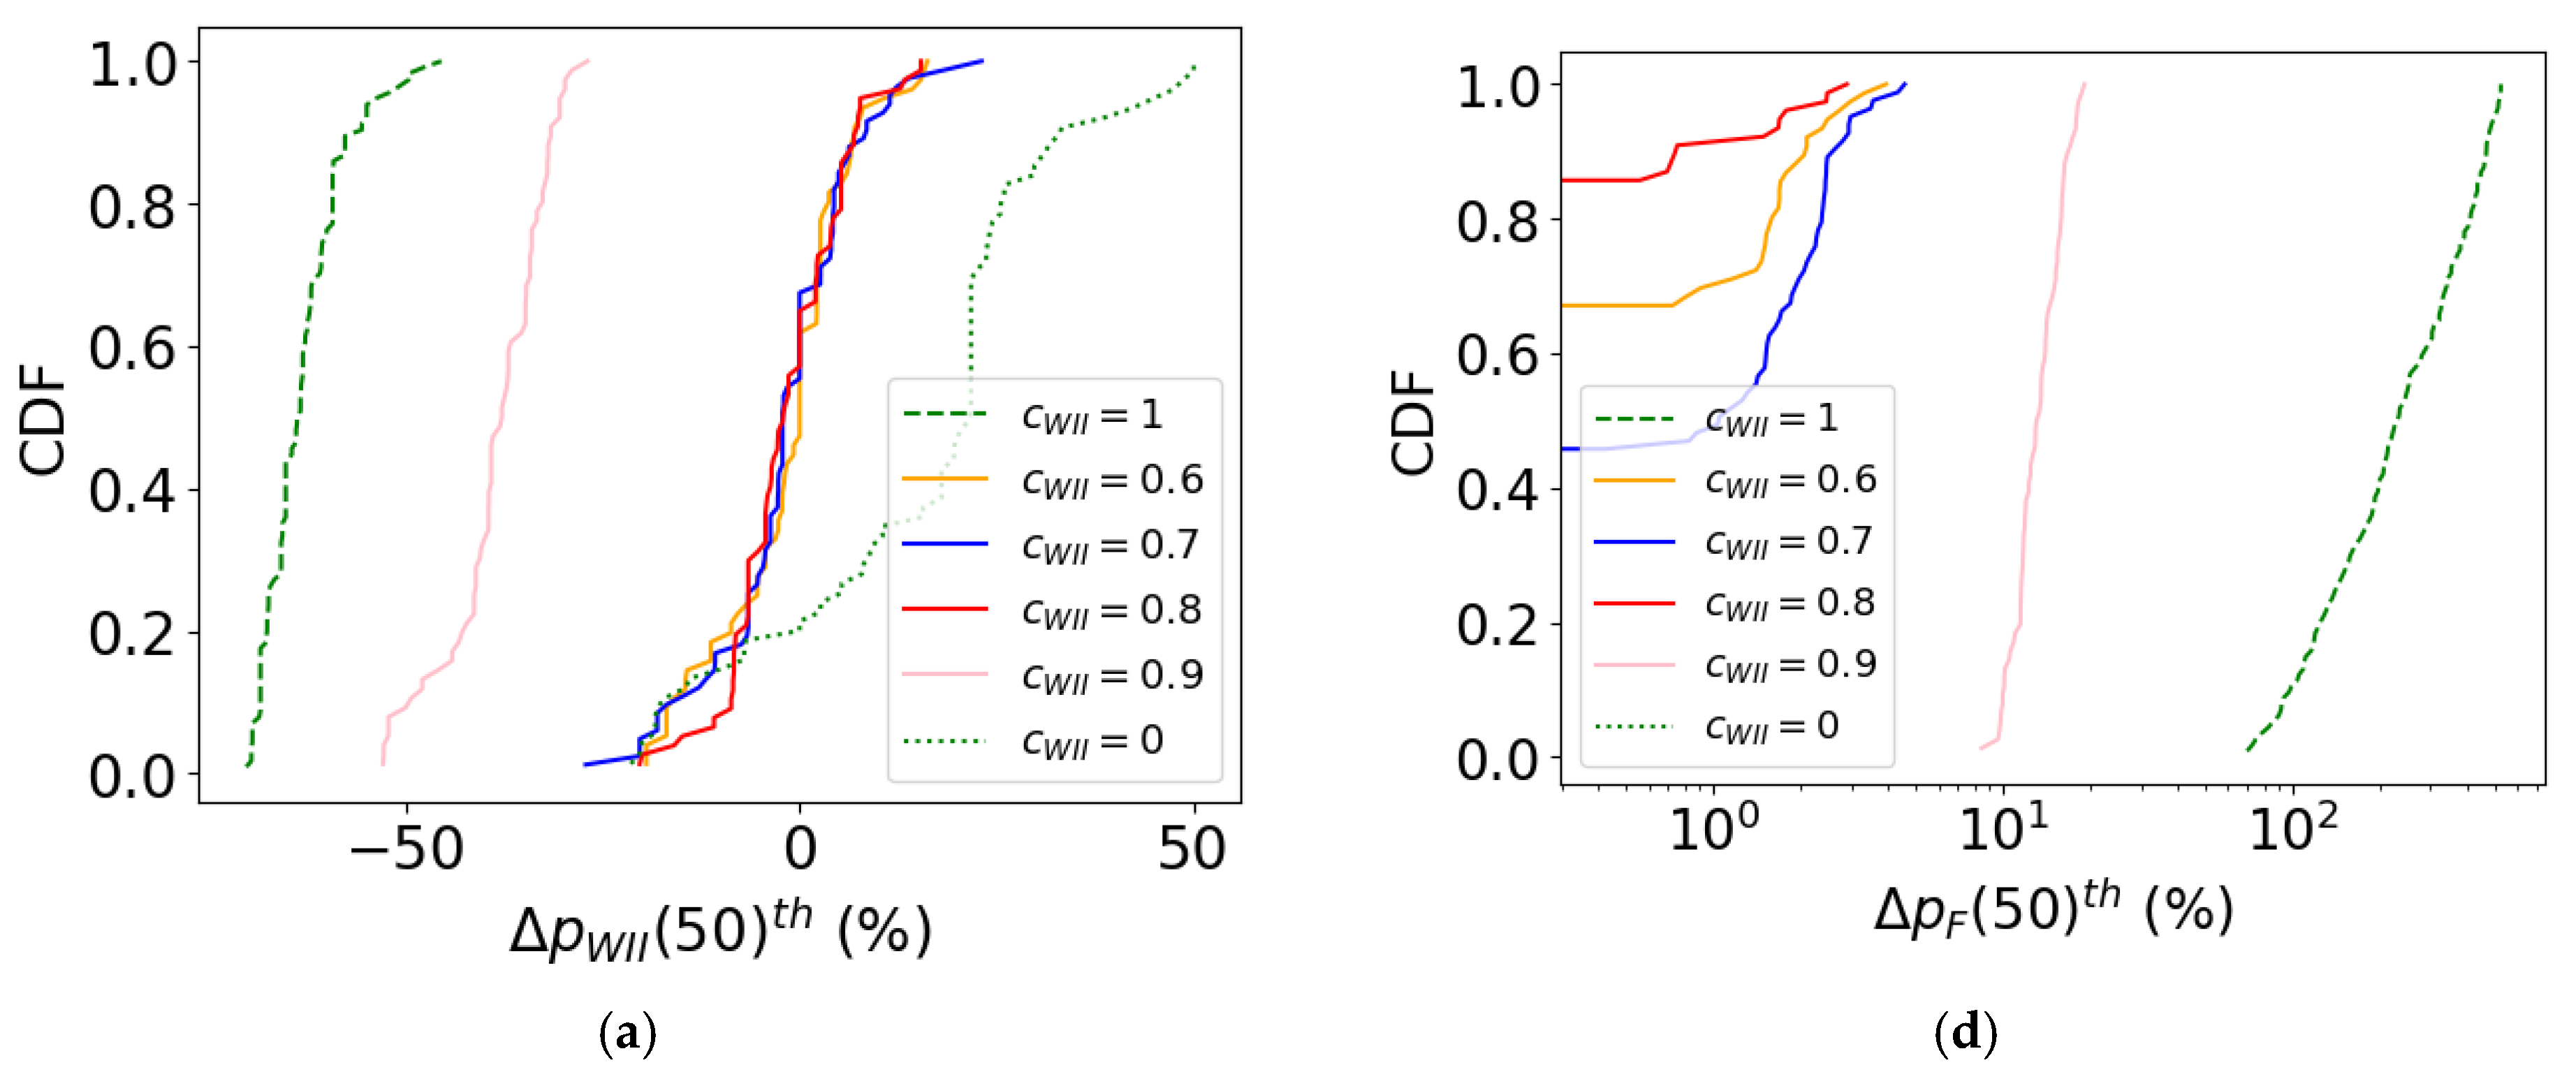
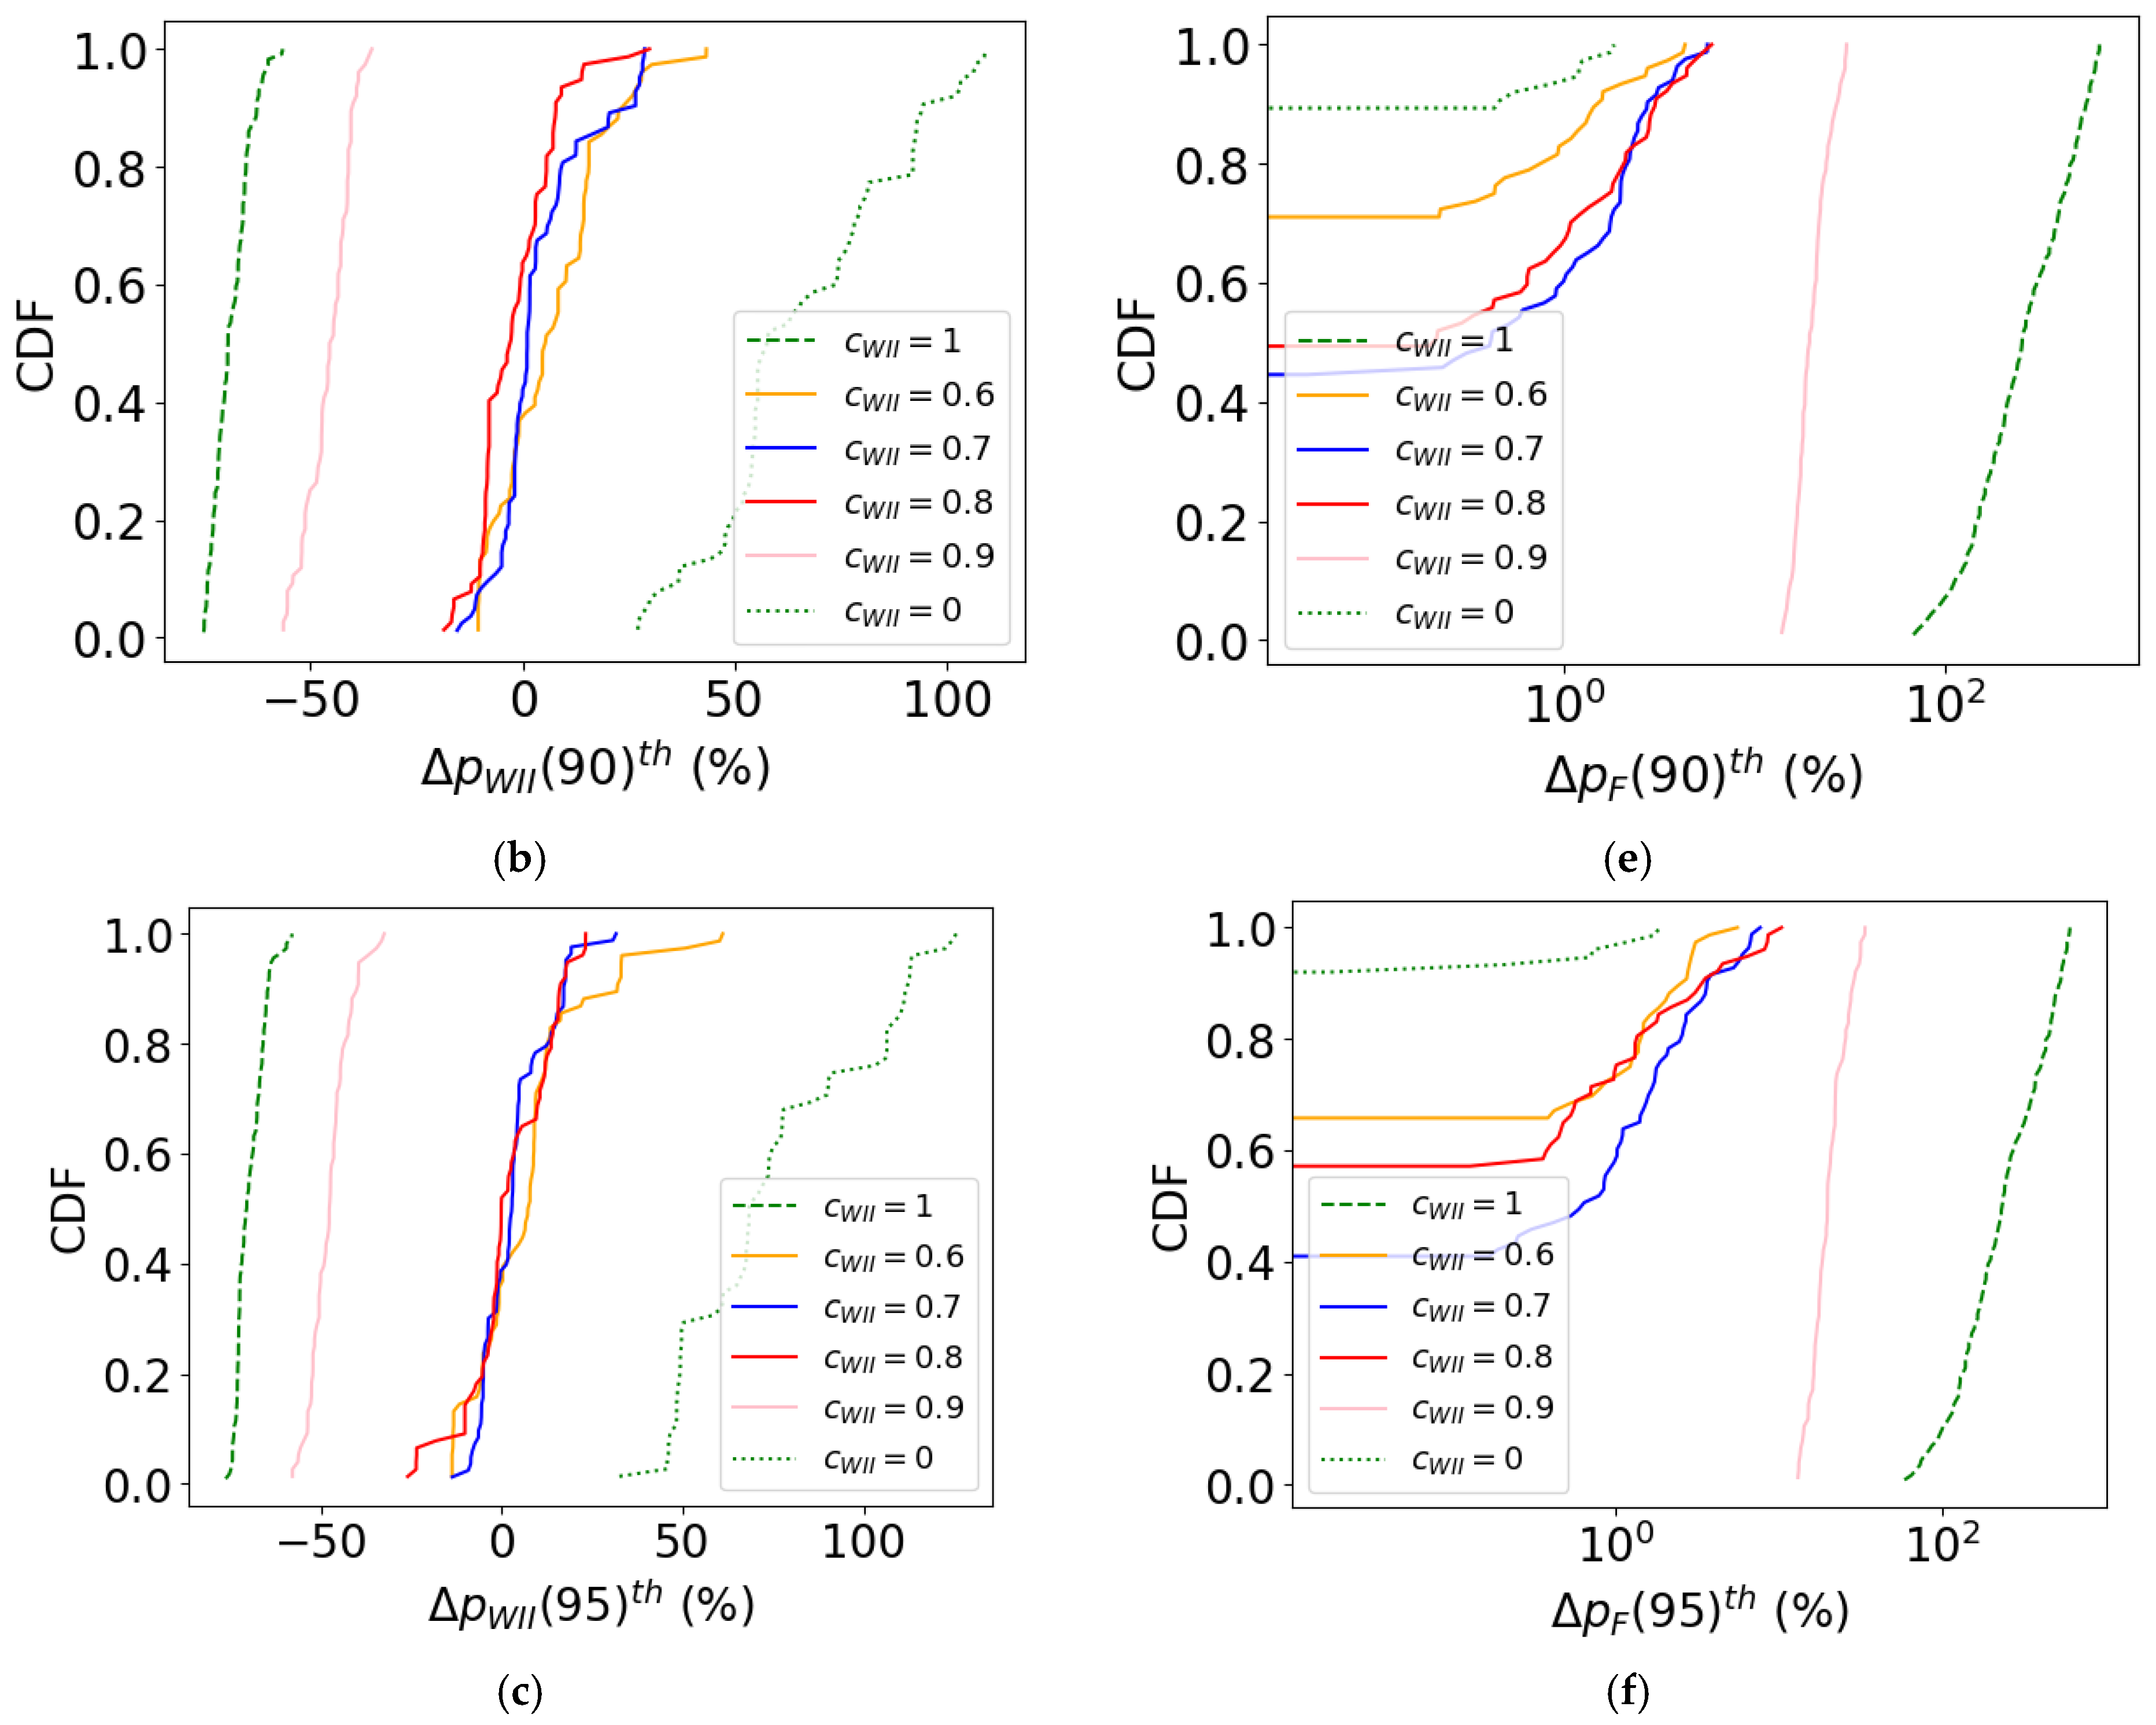
where denotes the BA percentile under study, and Z indicates whether the distribution corresponds to or . Equation (6) shows that a negative percentage signifies a protection gain, as the distribution statistics fall below those of the case. Although this variable represents a relative magnitude, the response to WSN size is complex and nonlinear, serving as an approximation to isolate the effects of sensor count from the protection coefficient. Figure 11 displays CDFs for the percentage variations from Equation (6), covering and distinguishing between WII (Figure 11a–c) and only wildland (Figure 11d–f). The cases of serve as the theoretical maximum limit where sensors saturate candidate sensor locations in WII.
Figure 11.
Cumulative density functions (CDFs) of percentage change in DBA relative to the baseline case across WSNs optimized with different values. Panels (a–c) show the 50th, 90th, and 95th percentiles of detected burnt area in the WII domain (DBAWII)), while (d–f) show the same for the wildland domain (DBAF), plotted on a logarithmic scale.
Figure 11 shows that the optimization is largely insensitive to values below 0.9, as WSN performance in both WII and wildland domains remains close to the no-protection baseline, with overlapping CDFs. However, with , DBAWII percentiles decrease by 40–50%, while wildland percentiles increase by 10–20%, indicating a trade-off. At the extremes, if protection focuses solely on the WII ( = 1), WII improvement relative to the case reaches 60–70%, while wildland suffers unacceptable losses, with BA increasing in the interval 60–600%. The shape of the distribution changes uniformly, with consistent relative changes across both central (50th percentile) and tail (90th, 95th percentile) values.
Overall, the response to is nonlinear, with significant effects appearing as approaches 0.9, supporting the interpretation made in Section 3.1 and Equation (4). This unbalanced proportion on wildland–WII domains can be a typical characteristic in other case studies, particularly considering when this methodology aims to protect extensive wildland–WII scenarios.
4.5. Trade-Offs in the WII–Wildland Protection Independent of WSN Size
The choice of different values for the parameter leads to trade-offs in the monitoring efficiency between the wildland and WII domains. The ability to support informed decision making requires a diagram comprising this information in terms of the prioritization parameter. This diagram explores the different trade-offs for increasing values of from the baseline case , well above the transition governed by Equation (4), shown to happen at in the case study. However, the optimization yields solutions defining Pareto fronts, with each WSN configuration exhibiting different detection performance and network size. Therefore, a general view of the trade-offs must correspond to the dispersion of the performance of solutions (Equation (1)) over the different WSN sizes, respectively, for the wildland and WII domains. For comparison, these values are provided relative to the baseline case .
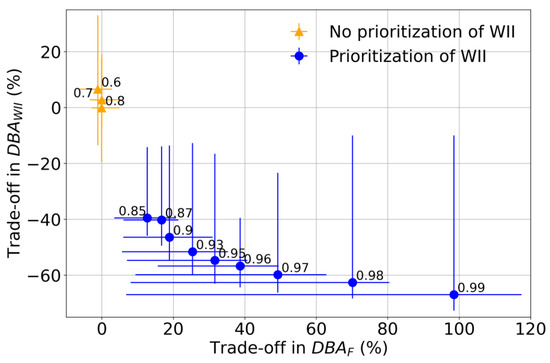
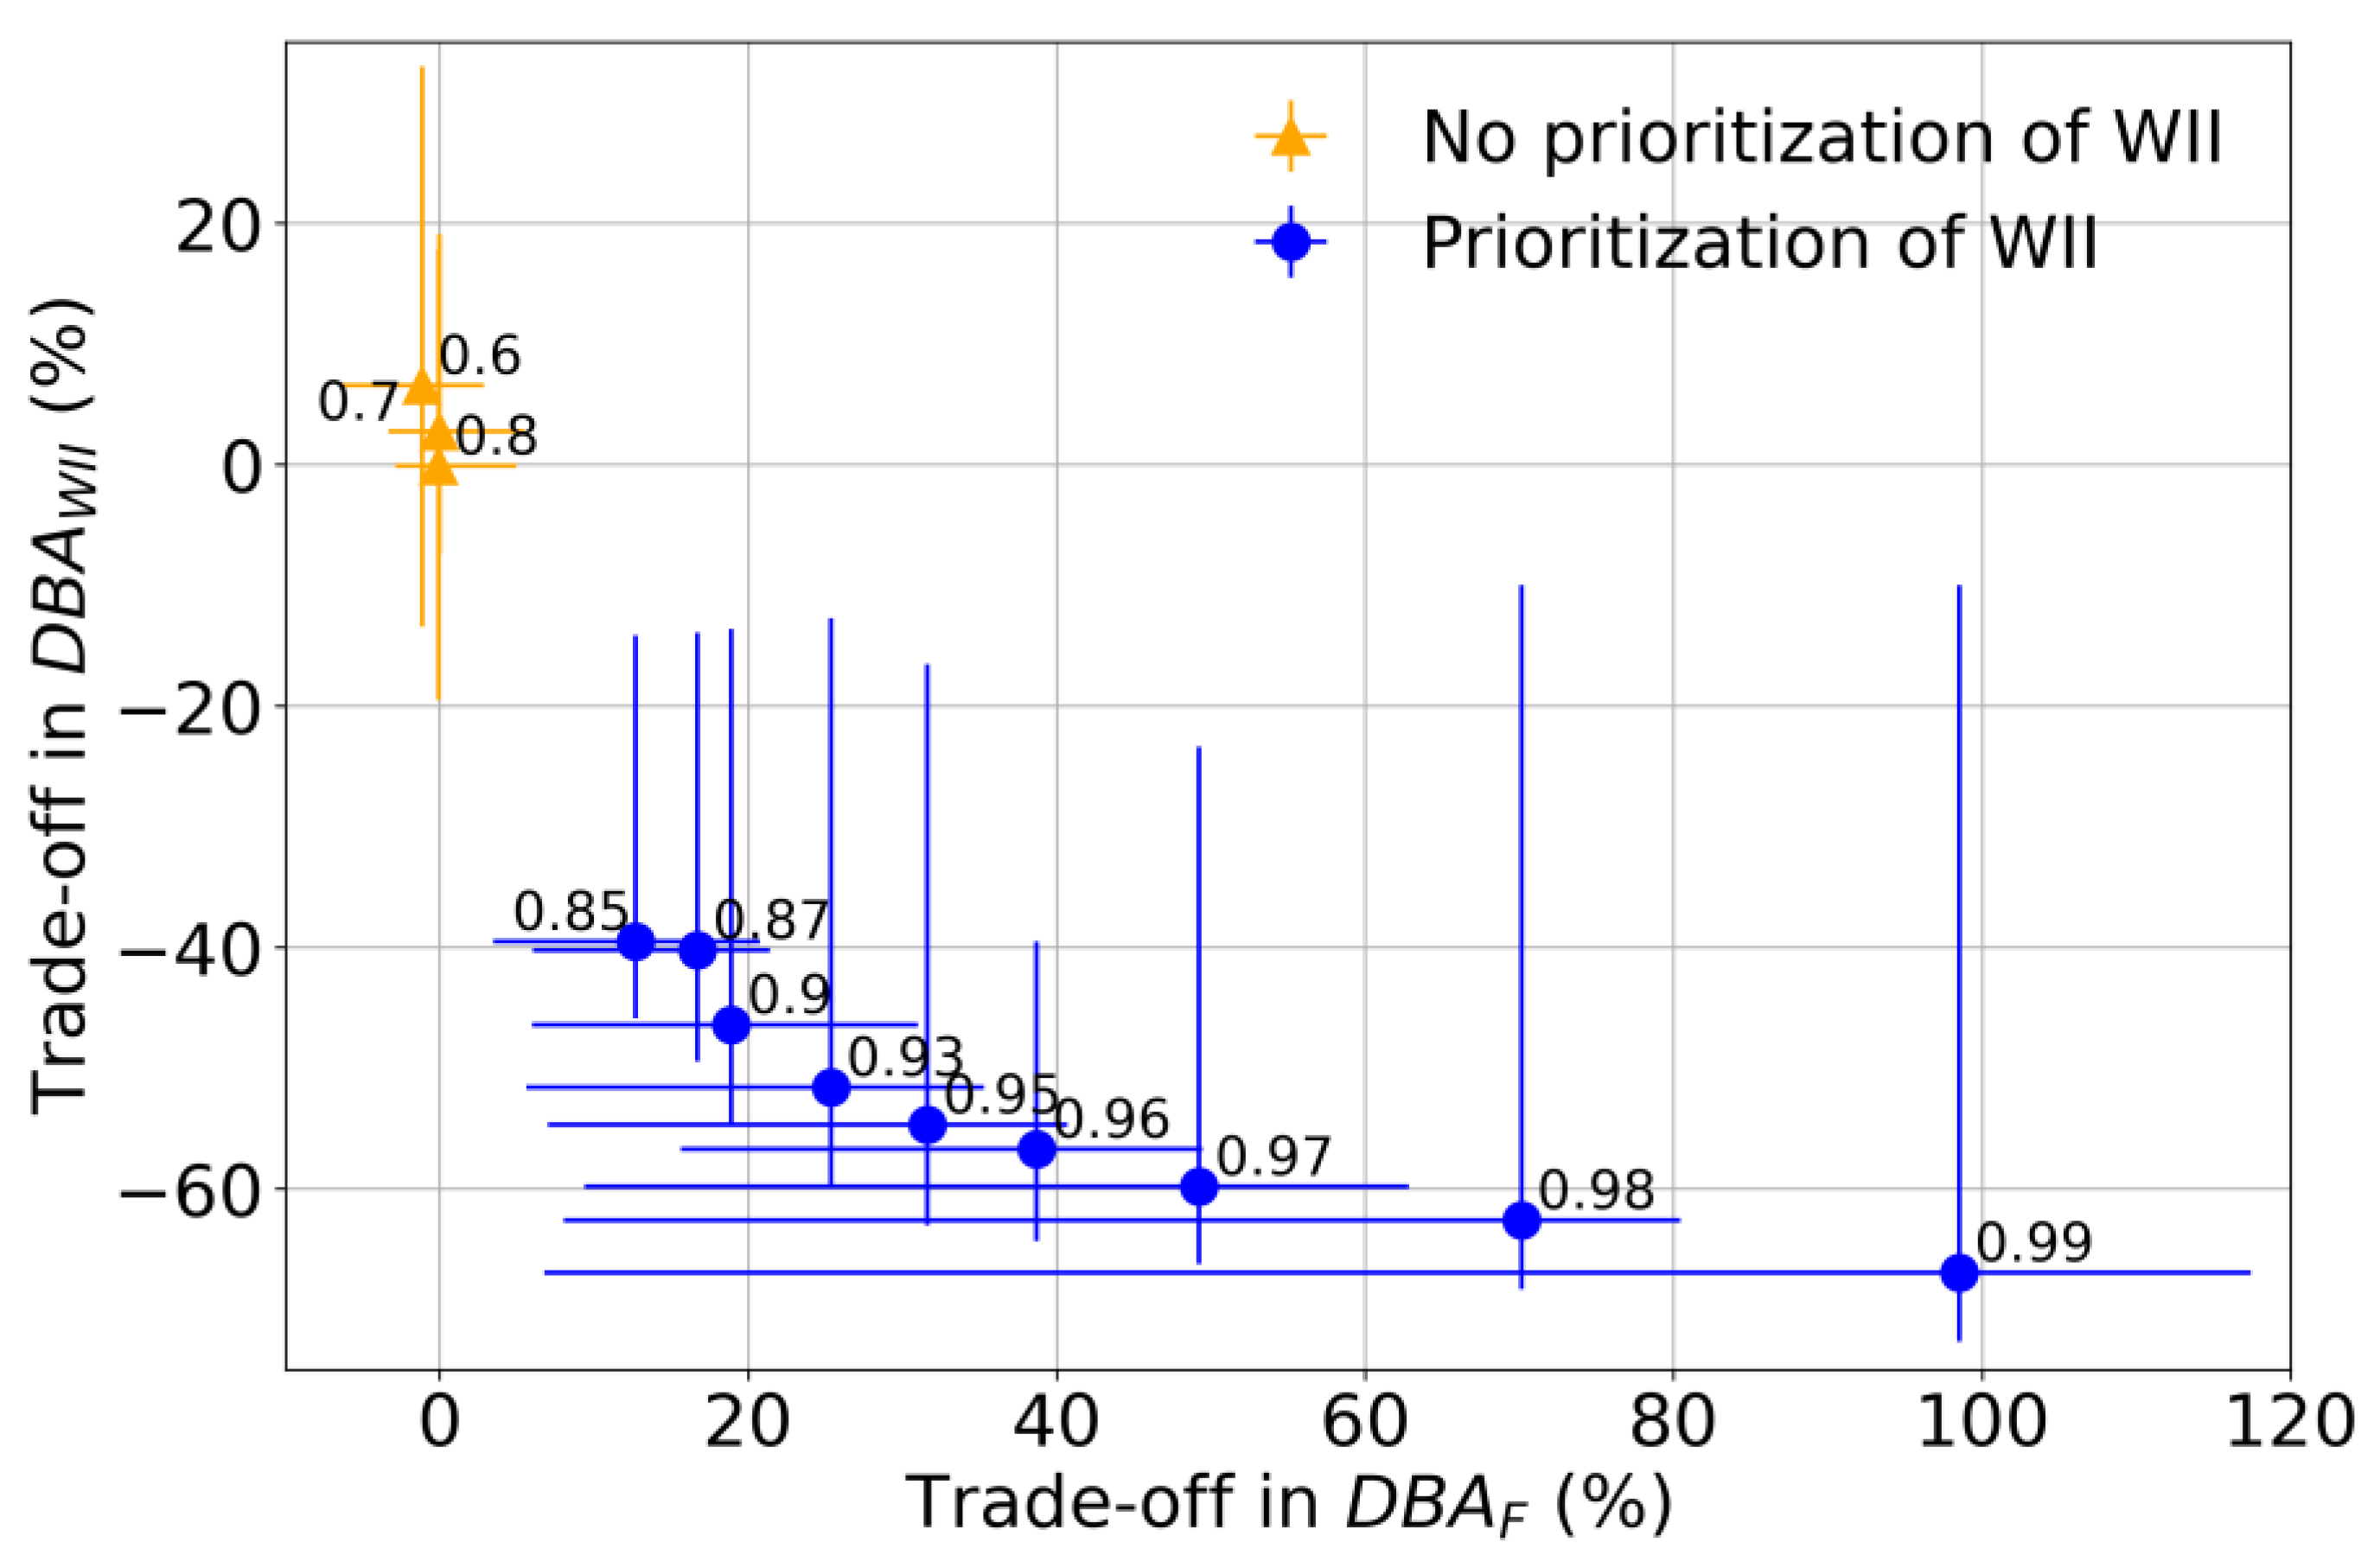
Using Equation (6), we compute the dispersion for the relative variation in DBAWII and DBAF 95th percentiles to the baseline scenario without specific protection over the different WSN sizes. The 95th percentile is an estimator of the expected largest fire detected by the system. The lower it is, the better the early detection. The resulting information is general for each and independent of the number of sensors. Figure 12 displays this diagram for the case study in terms of a scatter plot, with the y-axis representing the trade-offs in the WII, and the x-axis the corresponding to the DBAF. Each point corresponds to a different , indicating the median value of the distribution, and error bars represent the 5% to 95% dispersion interval.
Figure 12.
Scatter plot of trade-offs between WII (y-axis, ) and wildland (x-axis, ) for different values (numbers above points). Each point shows the median percentage change in the 95th percentile relative to the baseline, computed across Pareto front WSN configurations of all sizes using Equation (6). Error bars indicate the 5–95% dispersion.
Each coefficient plotted in Figure 12 considers the entire set of Pareto-optimal WSNs for that specific . For intermediate values, up to , the variation in protection arises from the aforementioned non-Pareto-optimal behavior for the disaggregated distributions of and , but the median centers around 0%. As increases, the trend emerges with increasing protection gains in WII domain that are progressively offset by losses in wildland protection. For , protection in the WII domain ranges (approximately) from 10% to 55%, while the wildland domain experiences a 10% to 30% decrease. Beyond , the WII domain experiences a median 60% improvement, but at a corresponding median 50% decline in wildland protection. Beyond this point, small improvements in corresponds to up to a 120% reduction in wildland protection, with considerable variability due to sensors being concentrated in the WII domain.
4.6. WSN Size Differences for Even Wildland Protection
Section 3.2 noted that in Spain, a wildfire size of 30 ha is considered the threshold for escalating the severity level, mobilizing additional resources, and management hierarchy. Here, we aim to determine the necessary increase in WSN size, for a given optimal WSN, to achieve an equivalent level of protection in terms of as their size-counterpart in the case. The 95th percentile of serves as the benchmark for wildland protection.
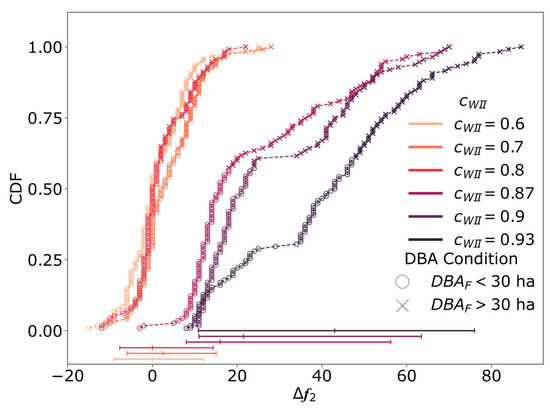
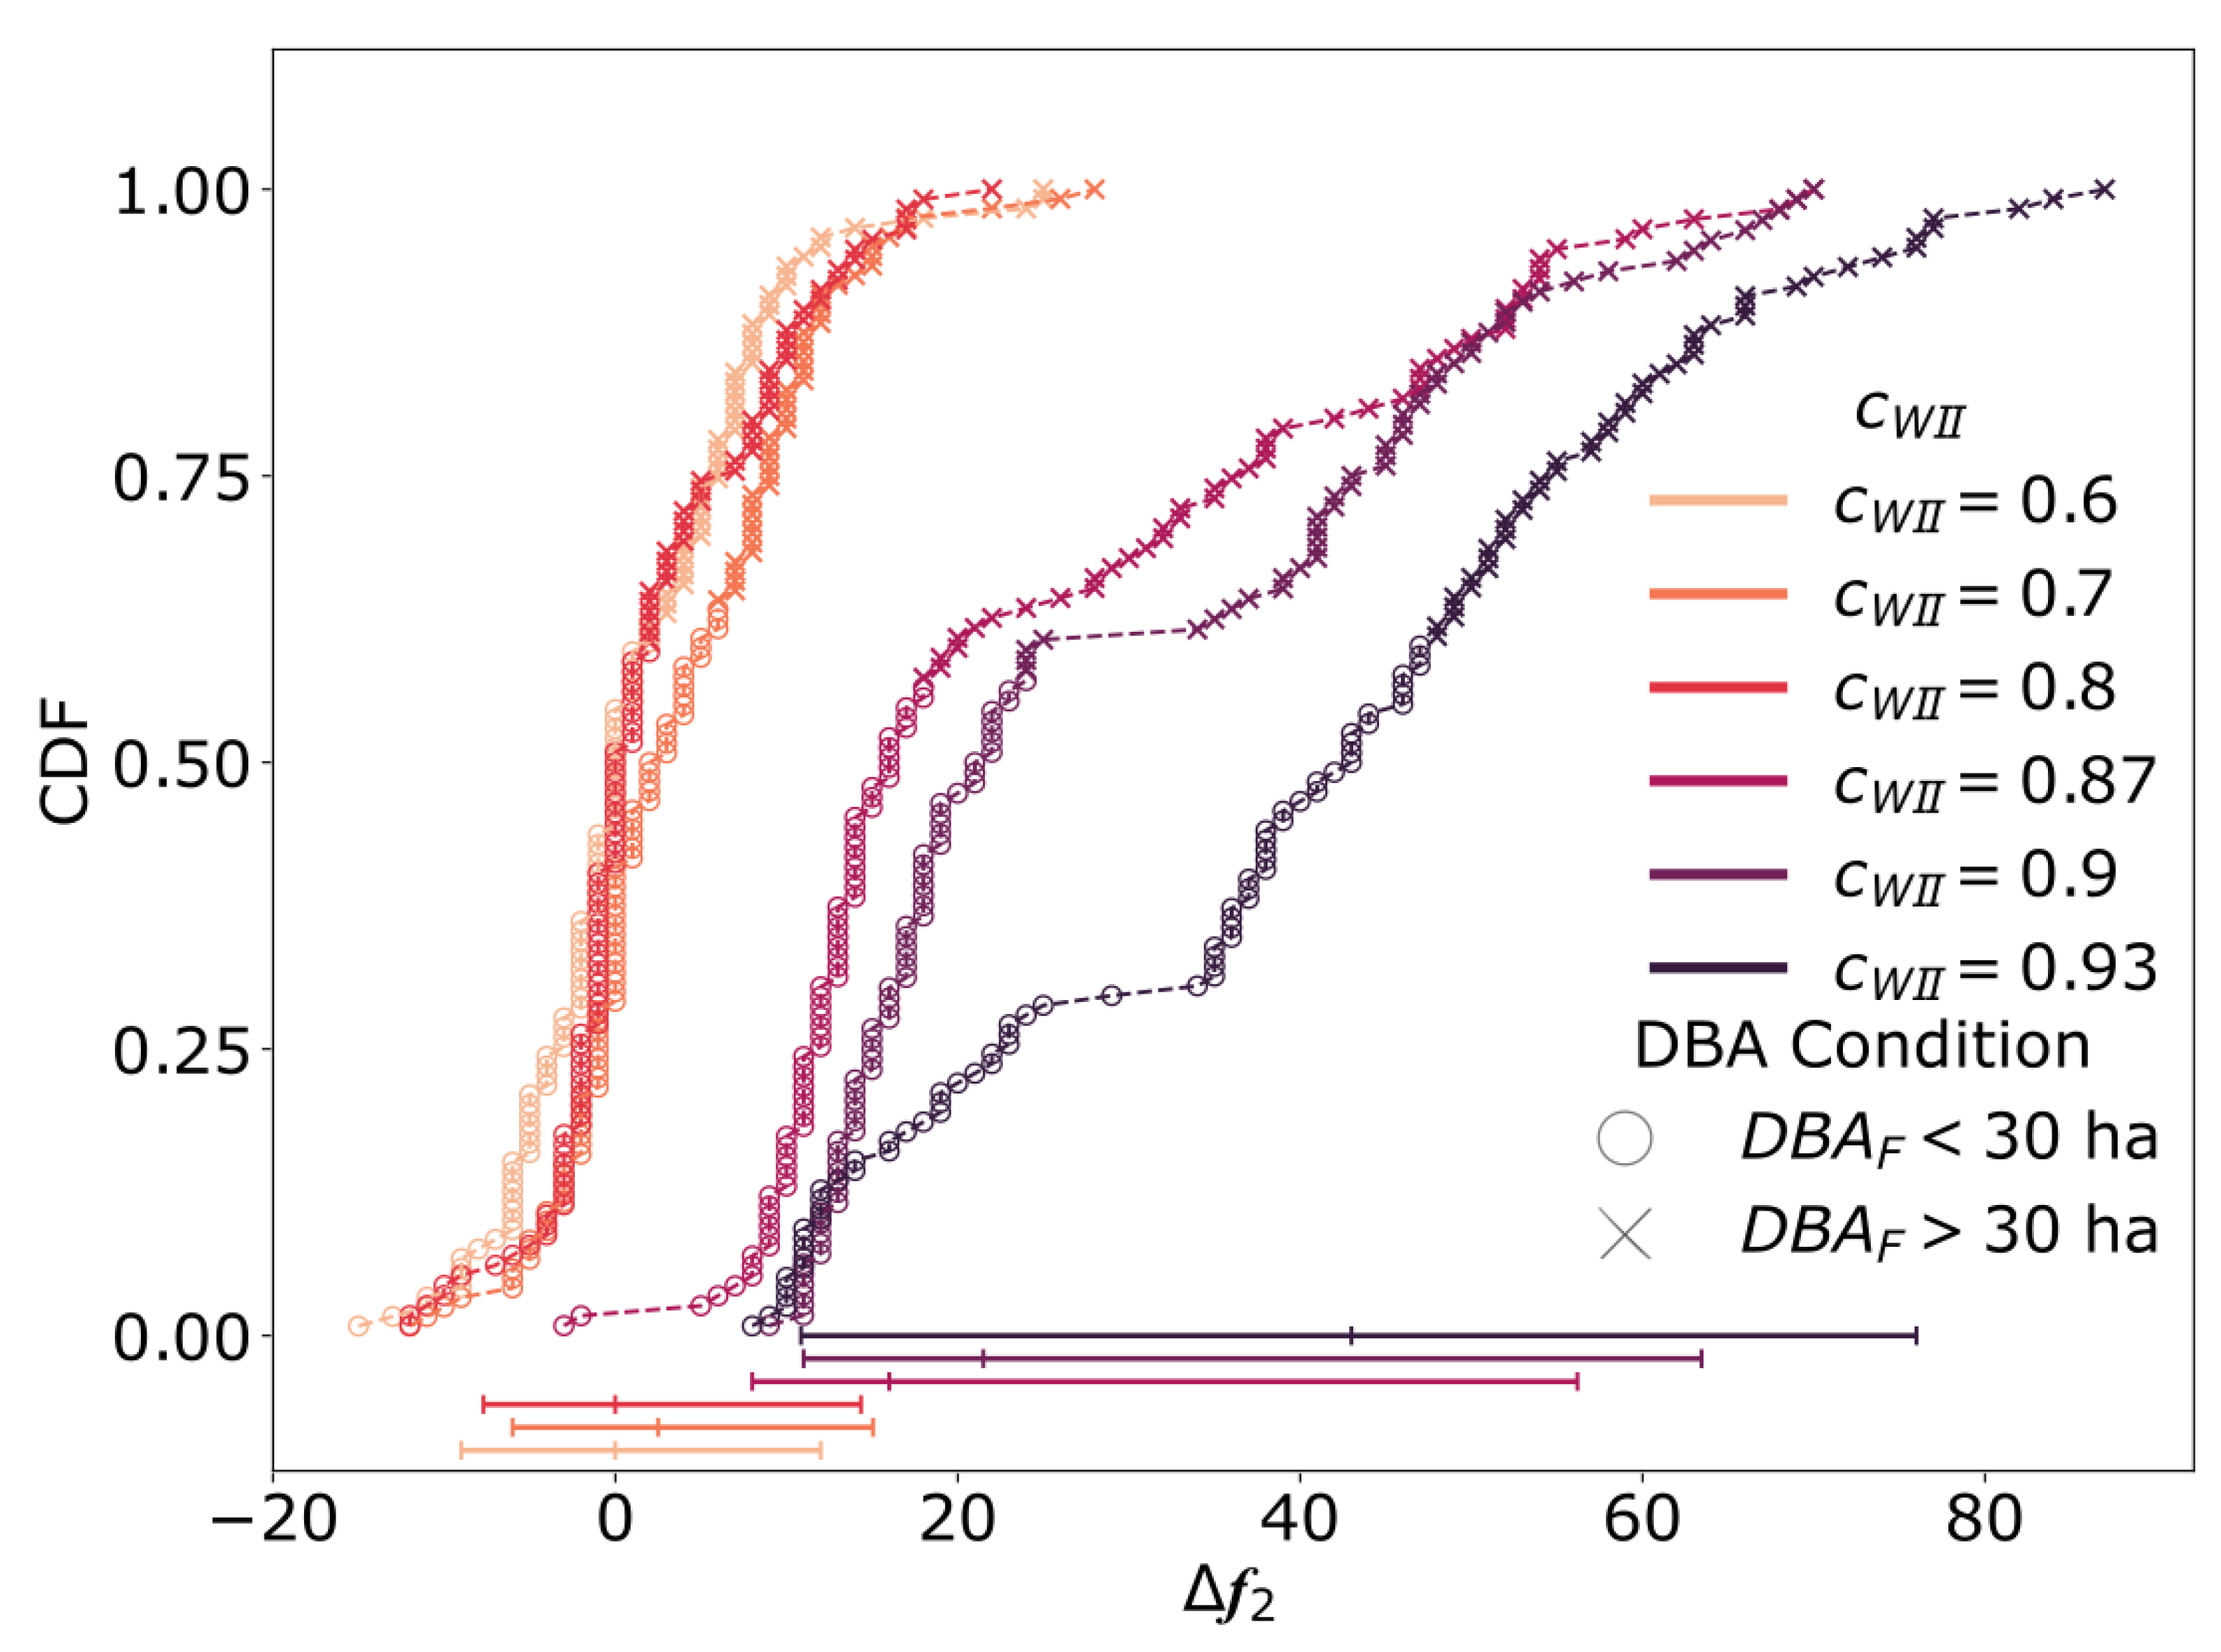
For a given WSN size, we examined the Pareto front to determine the number of sensors required to achieve a 95th percentile level equivalent to that of the no-protection solution, using the initial number of sensors as a reference. Figure 13 shows this difference (), presenting results as CDFs to illustrate the dispersion of the 95th percentile statistic. Horizontal error bars at the bottom of the plot represent the 5%, median, and 95% values. For , these values cluster around zero sensors, as the WII domain is not prioritized enough to create a significant effect. As increases to around 0.9, a sharp transition occurs, with the additional number of sensors required rising rapidly from approximately 20 in 50% of cases to 45 in 50% of cases for .
Figure 13.
CDFs for the increment in number of sensors necessary for to achieve the same degree of protection than their equivalent in size with .
Figure 13 illustrates with a different marker whether a WSN achieves the 30 ha DBA constraint (●) or not (×). In this study, solutions from the bi-objective optimization problem are not constrained; therefore, we simply explore for each Pareto front which solutions fulfill the requirement. We consider that a WSN presents the desired operational performance when 99% of wildfires are detected below the 30 ha threshold, which in the no-protection case is achieved at 130 sensors. Table 5 presents these WSNs for a range of values. Figure 14 illustrates the resulting from incrementing the WSN sizes to enhance wildland protection given the case in Table 4.
Table 5.
Minimum WSN sizes fulfilling 99th for different values and their no-protection case counterpart.
Figure 14.
for several WSN sizes and protection coefficients, highlighting the necessary increment in to achieve wildland protection equivalent to Pareto-optimal WSNs derived with no enhanced WII protection ().
5. Conclusions
This study sees wildland fires affecting industry as a growing concern, with small-to-medium-scale industrial hubs in rural municipalities being particularly vulnerable. Responding to their demand for cost-effective measures, the research explores the design of optimal Wireless Sensor Networks (WSNs) according to their performance and network costs. The proposed optimization approach leverages wildland–industrial interface (WII) geospatial data and simulated wildfire dynamics data. The implemented tool can be easily adapted to specific landscapes through the inclusion of local wildland–industrial interface (WII) boundaries.
Including the wildland domain is essential, as most dangerous wildfires threatening the WII originate beyond its immediate boundaries. The proposed solutions can complement broader municipal protection strategies, extending benefits to the entire community. The methodology demonstrates that, for a fixed amount of resources, different and clearly quantifiable trade-offs emerge—enabling tailored protection strategies aligned with local priorities.
The case study, based on validated WII and fire behavior data, confirms the robustness of the optimizer across distinct land classification classes. Results show the potential of leveraging WSNs to support the management of wildfires in WII contexts. Integrating geospatial information enables WSNs to reduce fire impacts on both wildland and industrial areas, with adjustable prioritization. This approach proves valuable for small-to-medium industrial parks, as illustrated by Cocentaina, Spain—where diversified industry and proximity to fire-prone areas make EWDS especially beneficial. In most domains, WII represents a small portion of the overall fire landscape; as a result, . Our approach to identifying the transition to effective WII mitigation is herein validated as a fast and easy way to fine-tune the prioritization coefficients and .
The results highlight the trade-offs between WII and wildland protection, particularly as the WSN configurations increasingly prioritize industrial areas. For fixed WSN sizes, prioritizing the WII can significantly reduce risks to infrastructure while reducing wildland coverage. These trade-offs, quantified by the CDF distribution percentiles of simulated and , can support stakeholders to make risk-informed decisions on strategies that balance protection across domains.
Future research aims to extend this framework to other geospatial contexts, such as urban–industrial interfaces, and further integrate wildfire dynamics like ember transport and long-range spotting. It is also important to consider fire propagation within industrial fabric and possible domino effects. The framework is easily replicable in scenarios with other interface definitions. We have also shown that the optimizer performs effectively with multi-categorized locations, which can be extended to reflect factors such as limited suppression access or the presence of critical infrastructure—e.g., roads, power lines, trails. Incorporating real-time fire monitoring and expanding deployment cost-effectiveness can further strengthen resilience in vulnerable industrial parks—ensuring the protection of people, economic assets, and ecosystems in wildfire-prone regions.
Author Contributions
J.L.G.-G.: writing—original draft, software, methodology, data curation, conceptualization. E.M.: writing—review and editing, methodology, conceptualization. A.C.: writing—review and editing, methodology, conceptualization. M.K.: writing—review and editing, methodology, conceptualization. R.C.: writing—review and editing, methodology, conceptualization. M.C.: writing—review and editing, methodology, conceptualization. All authors have read and agreed to the published version of the manuscript.
Funding
This work has been partially supported by Grant PID2022-14021 7NB-I00 funded by MCIN/AEI/10.13039/501100011033, and by “ERDF A way of making Europe”.
Institutional Review Board Statement
Not applicable.
Informed Consent Statement
Not applicable.
Data Availability Statement
Simulation data is available in the GitHub repository; https://github.com/juanlu29/fire-sensor-optimizer (accessed on 13 January 2026). WII geospatial mapping used in this study is taken from the online tool introduced in [5].
Acknowledgments
The authors would like to acknowledge the different comments made by the reviewers, which, without any doubt, have significantly contributed to improving the contents of the original manuscript and its scope.
Conflicts of Interest
The authors declare no conflicts of interest.
Abbreviations
WII (wildland–industrial interface), WUI (wildland–urban interface), WHI (wildland–human interface), WSN (Wireless Sensor Network), BA (burnt area), DBA (detected burnt area), CDF (cumulative density function), FTA (fault tree analysis), BN (Bayesian networks), QRA (quantitative risk analysis).
References
- Molina-Terrén, D.M.; Xanthopoulos, G.; Diakakis, M.; Ribeiro, L.; Caballero, D.; Delogu, G.M.; Viegas, D.X.; Silva, C.A.; Cardil, A. Analysis of Forest Fire Fatalities in Southern Europe: Spain, Portugal, Greece and Sardinia (Italy). Int. J. Wildland Fire 2019, 28, 85. [Google Scholar] [CrossRef] [Scilit]
- Hamideh, S.; Sen, P.; Fischer, E. Wildfire Impacts on Education and Healthcare: Paradise, California, after the Camp Fire. Nat. Hazards 2022, 111, 353–387. [Google Scholar] [CrossRef] [Scilit]
- Jones, M.W.; Kelley, D.I.; Burton, C.A.; Di Giuseppe, F.; Barbosa, M.L.F.; Brambleby, E.; Hartley, A.J.; Lombardi, A.; Mataveli, G.; McNorton, J.R.; et al. State of Wildfires 2023–2024. ESSD 2024, 16, 3601–3685. [Google Scholar] [CrossRef] [Scilit]
- Gallagher Re. Gallagher Re Q1 2025 Natural Catastrophe and Climate Report; Gallagher Re: London, UK, 2025; Available online: https://www.ajg.com/gallagherre/news-and-insights/gallagherre-natural-catastrophe-and-climate-report-q1-2025/ (accessed on 13 January 2026).
- Planas, E.; Paugam, R.; Àgueda, A.; Vacca, P.; Pastor, E. Fires at the Wildland-Industrial Interface. Is There an Emerging Problem? Fire Saf. J. 2023, 141, 103906. [Google Scholar] [CrossRef] [Scilit]
- Brignone, M.; Santamato, F.; Ravina, M.; Busini, V.; Panepinto, D. NaTech Database and Methodologies for Its Risk Assessment: A Review. Nat. Hazards 2025, 121, 19565–19590. [Google Scholar] [CrossRef] [Scilit]
- Khakzad, N. A Tutorial on Fire Domino Effect Modeling Using Bayesian Networks. Modelling 2021, 2, 240–258. [Google Scholar] [CrossRef] [Scilit]
- Naderpour, M.; Rizeei, H.M.; Khakzad, N.; Pradhan, B. Forest Fire Induced Natech Risk Assessment: A Survey of Geospatial Technologies. Reliab. Eng. Syst. Saf. 2019, 191, 106558. [Google Scholar] [CrossRef] [Scilit]
- Zarepour, A.; Behnam, B. A Probabilistic Approach to Domino Post-Earthquake Fires in Fuel Storage Facilities. Saf. Reliab. 2025, 1–45. [Google Scholar] [CrossRef] [Scilit]
- Alireza, D.; Nima, K. Natech Risk Assessment with Imprecise Probabilities. Chem. Eng. Trans. 2024, 112, 295–300. [Google Scholar] [CrossRef]
- United Nations Environment Programme. Spreading Like Wildfire—The Rising Threat of Extraordinary Landscape Fires; A UNEP Rapid Response Assessment: Nairobi, Kenya, 2022; Available online: https://www.unep.org/resources/report/spreading-wildfire-rising-threat-extraordinary-landscape-fires (accessed on 13 January 2026).
- Park, H.; Nam, K.; Lim, H. Is Critical Infrastructure Safe from the Wildfires? A Case Study of Wildland-Industrial and -Urban Areas in South Korea. Int. J. Disaster Risk Reduct. 2023, 95, 103849. [Google Scholar] [CrossRef] [Scilit]
- Statistics Canada. Fort McMurray 2016 Wildfire—Economic Impact; Statistics Canada: Ottawa, ON, Canada, 2017; ISBN 978-0-660-07769-7. Available online: https://publications.gc.ca/site/eng/9.833105/publication.html (accessed on 13 January 2026).
- Martínez, C.; León, J.; Bonet, M.; Inzunza, S.; Guerrero, N.; Román, R.; Acevedo, R.; Araya, E. Reporte-incendios-Vina-del-Mar-2024 Version-1 14. Informe de Daños: Incendios 02 y 03 de Febrero de 2024, Viña del Mar (Región de Valparaíso) [Fire Report—Viña del Mar—2024 version 1 14. Damage Report: Fires on 2 and 3 February 2024, Viña del Mar (Valparaíso Region). Centro de Investigación para la Gestión Integrada del Riesgo de Desastres (CIGIDEN); Santiago, Chile. 15 February 2024. Available online: https://www.cigiden.cl/despues-de-la-emergencia-claves-para-una-recuperacion-sostenible-en-zonas-afectadas-por-incendios-en-la-interfaz-urbano-forestal/ (accessed on 13 January 2026).
- 200 Empleos en Riesgo y Millonarias Pérdidas: La Destrucción del Fuego en El Salto, un “Motor” Económico de Valparaíso [200 Jobs at Risk and Millions in Losses: The Destruction Caused by the Fire in El Salto, an Economic ‘Powerhouse’ in Valparaíso]. Emol Noticias (Online Newspaper). Available online: https://www.emol.com/noticias/Economia/2024/02/20/1122330/incendios-valparaiso-el-salto.html (accessed on 24 December 2025).
- Guerrero, F.; Espinoza, L.; Vidal, V.; Carmona, C.; Krecl, P.; Targino, A.C.; Ruggeri, M.F.; Toledo, M. Black Carbon and Particulate Matter Concentrations amid Central Chile’s Extreme Wildfires. Sci. Total Environ. 2024, 951, 175541. [Google Scholar] [CrossRef] [Scilit] [PubMed]
- Joint Research Centre Europe’s Fire Season Is Expanding, New JRC Report Shows. Available online: https://joint-research-centre.ec.europa.eu/jrc-news-and-updates/europes-fire-season-expanding-new-jrc-report-shows-2025-12-05_en (accessed on 22 December 2025).
- European Parliament and Council of the European Union. Directive 2012/18/EU on the Control of Major-Accident Hazards Involving Dangerous Substances 2012; European Parliament and Council of the European Union: Brussels, Belgium, 2012; Available online: https://www.boe.es/doue/2012/197/L00001-00037.pdf (accessed on 13 January 2026).
- Gobierno de España [Government of Spain]. Real Decreto 164/2025, de 4 de Marzo, Por El Que Se Aprueba El Reglamento de Seguridad Contra Incendios En Los Establecimientos Industriales [Royal Decree 164/2025, of 4 March, approving the Fire Safety Regulations for Industrial Establishments.]. 2025. Agencia Estatal Boletín Oficial del Estado [State Agency Official State Gazette]. Available online: https://www.boe.es/diario_boe/txt.php?id=BOE-A-2025-7190 (accessed on 13 January 2026).
- Necci, A.; Krausmann, E. Natech Risk Management, Publications Office of the European Union, Luxembourg. 2022. Available online: https://publications.jrc.ec.europa.eu/repository/handle/JRC129450 (accessed on 13 January 2026).
- European Commission; Joint Research Centre (JRC). RAPID-N: Rapid Natech Risk Assessment Tool. Available online: https://rapidn.jrc.ec.europa.eu/ (accessed on 23 December 2025).
- Federica, R.; Emrys, S.G.; Valerio, C. Quantitative Risk Assessment of Mitigated Natech Scenarios Triggered by Wildfires in the Chemical and Process Industry. Chem. Eng. Trans. 2025, 116, 391–396. [Google Scholar] [CrossRef]
- European Court of Auditors EU. Funding to Tackle Forest Fires—More Preventive Measures, but Insufficient Evidence of Results and Their Long-Term Sustainability; Publications Office of the European Union: Luxembourg, 2025; Available online: https://www.eca.europa.eu/ECAPublications/SR-2025-16/SR-2025-16_EN.pdf (accessed on 13 January 2026).
- United Nations Office for Disaster Risk Reduction. Global Assessment Report on Disaster Risk Reduction 2025: Resilience Pays: Financing and Investing for Our Future; Erscheinungsort nicht ermittelbar; United Nations: New York, NY, USA, 2025; ISBN 978-92-1-157674-0. [Google Scholar]
- OECD; European Union. Managing Risks from Natural Hazards to Hazardous Installations (Natech): A Guide for Senior Leaders in Industry and Public Authorities, Series on Chemical Accidents; OECD Publishing: Paris, France, 2024; Available online: https://www.oecd.org/en/publications/managing-risks-from-natural-hazards-to-hazardous-installations-natech_9bb63229-en.html (accessed on 13 January 2026).
- European Commission Joint Research Centre Wildfire Data Portal. Available online: https://wildfiredataportal.eu/data/wildfire-data-portal/ (accessed on 23 December 2025).
- American Petroleum Institute. Fire Protection in Refineries, 10th ed.; American Petroleum Institute: Washington, DC, USA, 2019; ISBN 978-0-87820-184-2. [Google Scholar]
- Uyttewaal, K.; Prat-Guitart, N.; Ludwig, F.; Kroeze, C.; Langer, E.R. Territories in Transition: How Social Contexts Influence Wildland Fire Adaptive Capacity in Rural Northwestern European Mediterranean Areas. Fire Ecol. 2023, 19, 13. [Google Scholar] [CrossRef] [Scilit]
- Wei, Y.; Gannon, B.; Young, J.; Belval, E.; Thompson, M.; O’Connor, C.; Calkin, D. Estimating WUI Exposure Probability to a Nearby Wildfire. Fire Ecol. 2023, 19, 30. [Google Scholar] [CrossRef] [Scilit]
- Khan, Z.A.; Ullah, F.U.M.; Yar, H.; Ullah, W.; Khan, N.; Kim, M.J.; Baik, S.W. Optimized Cross-Module Attention Network and Medium-Scale Dataset for Effective Fire Detection. Pattern Recognit. 2025, 161, 111273. [Google Scholar] [CrossRef] [Scilit]
- Dilshad, N.; Khan, S.U.; Alghamdi, N.S.; Taleb, T.; Song, J. Toward Efficient Fire Detection in IoT Environment: A Modified Attention Network and Large-Scale Data Set. IEEE Internet Things J. 2024, 11, 13467–13481. [Google Scholar] [CrossRef] [Scilit]
- Kern, H.; Krausmann, E. Wildfires Triggering Natech Events; EUR 30293 EN; Publications Office of the European Union: Luxembourg, 2020; ISBN 978-92-76-20431-2. [Google Scholar]
- Wu, Z.; Hou, L.; Wu, S.; Wu, X.; Liu, F. The Time-to-Failure Assessment of Large Crude Oil Storage Tank Exposed to Pool Fire. Fire Saf. J. 2020, 117, 103192. [Google Scholar] [CrossRef] [Scilit]
- Ricci, F.; Scarponi, G.E.; Pastor, E.; Planas, E.; Cozzani, V. Safety Distances for Storage Tanks to Prevent Fire Damage in Wildland-Industrial Interface. Process Saf. Environ. Prot. 2021, 147, 693–702. [Google Scholar] [CrossRef] [Scilit]
- Ricci, F.; Misuri, A.; Scarponi, G.E.; Cozzani, V.; Demichela, M. Vulnerability Assessment of Industrial Sites to Interface Fires and Wildfires. Reliab. Eng. Syst. Saf. 2024, 243, 109895. [Google Scholar] [CrossRef] [Scilit]
- Johnston, L.M.; Flannigan, M.D. Mapping Canadian Wildland Fire Interface Areas. Int. J. Wildland Fire 2018, 27, 1–14. [Google Scholar] [CrossRef] [Scilit]
- Partners in Protection. FireSmart: Protecting Your Community from Wildfire, 2nd ed.; Vicars, M., Ed.; Partners in Protection: Edmonton, AL, Canada, 2003; ISBN 0-662-34064-7. [Google Scholar]
- Khakzad, N. Modeling Wildfire Spread in Wildland-Industrial Interfaces Using Dynamic Bayesian Network. Reliab. Eng. Syst. Saf. 2019, 189, 165–176. [Google Scholar] [CrossRef] [Scilit]
- Sayarshad, H.R.; Ghorbanloo, R. Evaluating the Resilience of Electrical Power Line Outages Caused by Wildfires. Reliab. Eng. Syst. Saf. 2023, 240, 109588. [Google Scholar] [CrossRef] [Scilit]
- Oliveira, U.; Soares-Filho, B.; Rodrigues, H.; Figueira, D.; Gomes, L.; Leles, W.; Berlinck, C.; Morelli, F.; Bustamante, M.; Ometto, J.; et al. A near Real-Time Web-System for Predicting Fire Spread across the Cerrado Biome. Sci. Rep. 2023, 13, 4829. [Google Scholar] [CrossRef] [Scilit] [PubMed]
- Ager, A.A.; Day, M.A.; Aparício, B.A.; Houtman, R.; Stinchfield, A. Optimizing the Implementation of a Forest Fuel Break Network. PLoS ONE 2023, 18, e0295392. [Google Scholar] [CrossRef] [Scilit]
- Avci, M.G.; Avci, M.; Battarra, M.; Erdoğan, G. The Wildfire Suppression Problem with Multiple Types of Resources. Eur. J. Oper. Res. 2024, 316, 488–502. [Google Scholar] [CrossRef] [Scilit]
- Perello, N.; Trucchia, A.; Baghino, F.; Asif, B.S.; Palmieri, L.; Rebora, N.; Fiorucci, P. Cellular Automata-Based Simulators for the Design of Prescribed Fire Plans: The Case Study of Liguria, Italy. Fire Ecol. 2024, 20, 7. [Google Scholar] [CrossRef] [Scilit]
- Ozkan, O.; Kilic, S. UAV Routing by Simulation-Based Optimization Approaches for Forest Fire Risk Mitigation. Ann. Oper. Res. 2023, 320, 937–973. [Google Scholar] [CrossRef] [Scilit]
- Martín-Fernández, S.; Martínez-Falero, E.; Peribáñez, J.R.; Ezquerra, A. GIS-Based Simulated Annealing Algorithm for the Optimum Location of Fire Stations in the Madrid Region, Spain: Monitoring the Collapse Index. Appl. Sci. 2021, 11, 8414. [Google Scholar] [CrossRef] [Scilit]
- Zhang, F.; Zhao, P.; Thiyagalingam, J.; Kirubarajan, T. Terrain-Influenced Incremental Watchtower Expansion for Wildfire Detection. Sci. Total Environ. 2019, 654, 164–176. [Google Scholar] [CrossRef] [Scilit]
- Azevedo, B.F.; Brito, T.; Lima, J.; Pereira, A.I. Optimum Sensors Allocation for a Forest Fires Monitoring System. Forests 2021, 12, 453. [Google Scholar] [CrossRef] [Scilit]
- Gómez-González, J.L.; Marcoulaki, E.; Cantizano, A.; Konstantinidou, M.; Caro, R.; Castro, M. Simulated Fire Observables as Indicators for Optimizing Wireless Sensor Networks in Wildfire Risk Monitoring. Ecol. Indic. 2025, 175, 113509. [Google Scholar] [CrossRef] [Scilit]
- Skretas, A.; Gyftakis, S.; Marcoulaki, E. A Demonstration of Sustainable Pipeline Routing Optimization Using Detailed Financial and Environmental Assessment. J. Clean. Prod. 2022, 362, 132305. [Google Scholar] [CrossRef] [Scilit]
- Huang, M.S.; Wichmann, B. Machine Learning Estimates on the Impacts of Detection Times on Wildfire Suppression Costs. PLoS ONE 2024, 19, e0313200. [Google Scholar] [CrossRef] [Scilit]
- Florec, V.; Thompson, M.P.; Rodríguez, Y.; Silva, F. Cost of Suppression. In Encyclopedia of Wildfires and Wildland-Urban Interface (WUI) Fires; Manzello, S.L., Ed.; Springer International Publishing: Cham, Switzerland, 2019; pp. 1–11. ISBN 978-3-319-51727-8. [Google Scholar]
- Meier, S.; Elliott, R.J.R.; Strobl, E. The Regional Economic Impact of Wildfires: Evidence from Southern Europe. J. Environ. Econ. Manag. 2023, 118, 102787. [Google Scholar] [CrossRef] [Scilit]
- Thompson, D.K.; Yip, D.A.; Koo, E.; Linn, R.; Marshall, G.; Refai, R.; Schroeder, D. Quantifying Firebrand Production and Transport Using the Acoustic Analysis of In-Fire Cameras. Fire Technol. 2022, 58, 1617–1638. [Google Scholar] [CrossRef] [Scilit]
- Gobierno de Castilla y León [Government of “Castilla y León”]. Plan Especial de Emergencias Por Incendios Forestales de Castilla y León, INFOCAL [Special Emergency Plan for Forest Fire in “Castilla y León”]. Official Gazette of “Castilla y León”, Decree 6/2025 from 27th March. Available online: https://medioambiente.jcyl.es/web/es/medio-natural/infocal.html (accessed on 13 January 2026).
- Blank, J.; Deb, K. Pymoo: Multi-Objective Optimization in Python. IEEE Access 2020, 8, 89497–89509. [Google Scholar] [CrossRef] [Scilit]
- Ministry for the Ecological Transition and the Demographic Challenge (MITECO). General Statistics on Forest Fires (Estadística General de Incendios Forestales, EGIF). Available online: https://www.miteco.gob.es/es/biodiversidad/temas/incendios-forestales/estadisticas-datos.html (accessed on 13 January 2026).
- Martínez Puche, A.; Prieto Cerdán, A.; Rodríguez Gutiérrez, F. Los Sistemas Locales de Empresas y El Desarrollo Territorial: Evolución y Perspectivas Actuales En Un Contexto Globalizado [Local Business Systems and Territorial Development: Evolution and Current Perspectives in a Globalised Context]; Editorial Club Universitario [University Editorial Club] (ECU): Alicante, Spain, 2008; ISBN 978-84-8454-717-4. [Google Scholar]
- Numerosos Efectivos de Bomberos Intervienen En Un Incendio de Una Nave Textil En Cocentaina [Numerous Firefighters Respond to a Fire at a Textile Warehouse in Cocentaina]. “El Nostre Ciutat” (Online Newspaper). 2025. Available online: https://www.elnostreciutat.com/es/numerosos-efectivos-de-bomberos-intervienen-en-un-incendio-de-una-nave-textil-en-cocentaina/ (accessed on 24 October 2025).
- Un Incendio Arrasa Una Industria Textil de Cocentaina [Fire Destroys Textile Factory in Cocentaina. Newspaper]. “El Nostre Ciutat” (Online Newspaper). 2023. Available online: https://www.elperiodic.com/cocentaina/incendio-arrasa-fabrica-textil-cocentaina_908442 (accessed on 24 October 2025).
- Copernicus Program: CORINE Land Cover 2018 (Raster 100 m) [Dataset], European Comission, 6-Yearly—Version 2020_20u1, May 2020. Available online: https://land.copernicus.eu/en/products/corine-land-cover (accessed on 13 January 2026).
- Copernicus Program: Global Dynamic Land Cover (Raster 100 m, Temporal Extent 2015–2019, Version 3) [Dataset], European Comission. Available online: https://land.copernicus.eu/en/products/corine-land-cover (accessed on 13 January 2026).
- OpenStreetMap Contributors. OpenStreetMap [Web Map]. OpenStreetMap Foundation. 2024. Available online: https://www.openstreetmap.org (accessed on 13 January 2026).
- Gómez-González, J.L.; Cantizano, A.; Caro-Carretero, R.; Castro, M. Leveraging National Forestry Data Repositories to Advocate Wildfire Modeling towards Simulation-Driven Risk Assessment. Ecol. Indic. 2024, 158, 111306. [Google Scholar] [CrossRef] [Scilit]
- Rodrigues, M.; Alcasena, F.; Vega-García, C. Modeling Initial Attack Success of Wildfire Suppression in Catalonia, Spain. Sci. Total Environ. 2019, 666, 915–927. [Google Scholar] [CrossRef] [Scilit]
- Hersbach, H.; Bell, B.; Berrisford, P.; Biavati, G.; Horányi, A.; Muñoz Sabater, J.; Nicolas, J.; Peubey, C.; Radu, R.; Rozum, I.; et al. ERA5 Hourly Data on Single Levels from 1940 to Present. Copernicus Climate Change Service (C3S) Climate Data Store (CDS). 2023. Available online: https://cds.climate.copernicus.eu/datasets/reanalysis-era5-single-levels?tab=download (accessed on 13 January 2026).
- European Centre for Medium-Range Weather Forecasts (ECMWF). Fire Danger Indices Historical Data from the Copernicus Emergency Management Service (CEMS) v3.1 (3.1) [Dataset]. Copernicus Climate Change Service (C3S) Climate Data Store (CDS). 2019. Available online: https://ewds.climate.copernicus.eu/datasets/cems-fire-historical-v1?tab=overview (accessed on 13 January 2026).
- Wagenbrenner, N.S.; Forthofer, J.M.; Lamb, B.K.; Shannon, K.S.; Butler, B.W. Downscaling Surface Wind Predictions from Numerical Weather Prediction Models in Complex Terrain with WindNinja. Atmos. Chem. Phys. 2016, 16, 5229–5241. [Google Scholar] [CrossRef] [Scilit]

Disclaimer/Publisher’s Note: The statements, opinions and data contained in all publications are solely those of the individual author(s) and contributor(s) and not of MDPI and/or the editor(s). MDPI and/or the editor(s) disclaim responsibility for any injury to people or property resulting from any ideas, methods, instructions or products referred to in the content. |
© 2026 by the authors. Licensee MDPI, Basel, Switzerland. This article is an open access article distributed under the terms and conditions of the Creative Commons Attribution (CC BY) license.