


Abstract
We investigate laser wakefield electron acceleration in a periodic plasma density profile using 2D PIC simulations with the EPOCH code. The profile of the electron density has the form , where is the steady electron density, is the spatial periodicity in the laser propagation direction and , taking the values 0, , , and , is the modulation parameter. The bubble size varies with the modulated plasma density, thereby influencing the electron acceleration, which occurs within a continuously changing bubble structure. We propose an analytical model to estimate the energies of the accelerated electrons, and evaluate the maximum electron energies at intervals for the five modulated density profiles. We then calculate the dephasing and depletion lengths for these modulated plasma profiles and examine their dependence on . The results show a growth in both lengths with , with depletion being the main limitation in these cases. Additionally, we compute and compare the transverse emittance of the self-injected electron bunches corresponding to the various density profiles at the same simulation time, and other characteristics, like the center energy and energy spread. Emittance is observed to experience a decrease with the increase in the modulation parameter.
1. Introduction
The laser wakefield acceleration (LWFA) mechanism [1] has been extensively studied across various aspects, including the energy gain of accelerated electrons [2,3], and the intrinsic limitations of the process, such as the depletion and dephasing lengths [4,5]. Additionally, the behavior of the plasma bubble under varying parameters has been investigated. The dynamics of electrons trapped within the bubble have been analyzed using Hamiltonian mechanics [6,7], alongside their further self-injection [8], the electron bunch quality [9,10] and the betatron radiation emitted by these accelerated electrons [11,12].
A topic of interest is electron acceleration and the bubble structures formed in plasmas with non-uniform or specifically tailored density profiles. Many studies have introduced both longitudinal and transverse plasma density profiles, such as linear and non-linear up-ramps and down-ramps [13,14,15,16,17], as well as profiles with capillaries used for laser guiding [18,19]. Studies have also focused on continuously varying density profiles, such as longitudinal periodic plasma density structures [20,21,22]. Their primary objective is to enhance electron acceleration by increasing both the maximum energy and flux of the accelerated electrons. To achieve this, these studies employ a quasi-phase-matching (QPM) approach in laser wakefield acceleration (LWFA), which synchronizes the phase velocity of spatial harmonics with the electron velocity [23]. The profiles described in the aforementioned references typically consist of sinusoidal variations with large spatial periods, of the order of several millimeters, comparable to the dephasing length, and exhibit small amplitudes, resembling a slowly varying up-ramp. Other studies with spatial periods of orders of microns, however, show the generation of plasma beat-waves, which can contribute to electron acceleration [24].
In this study, we examine the influence of plasma density modulation on bubble dynamics through 2D Particle-in-Cell (PIC) simulations, with the aim of determining whether such modulations can enhance electron acceleration efficiency or increase the electron bunch emittance. The longitudinal plasma density profile is defined as , where and are constants, and the modulation parameter can be varied. We fix the spatial modulation period at , a value significantly smaller than the characteristic dephasing and pump depletion lengths yet much larger than the plasma wavelength. Reducing this parameter to values comparable to the plasma wavelength would induce strong laser–plasma interactions that destabilize the propagation, leading to a loss of guidance over a short distance.
Our investigation emphasizes the influence of significant variations in the density profile, both in spatial period and amplitude, achieved by tuning the parameter . These variations produce substantial changes in the size and morphology of the bubble, highlighting the critical influence of density modulation on shaping the wakefield structure. Within this dynamic regime, electron self-injection occurs at the rear of the bubble following transverse wave breaking, initiating the acceleration process.
Self-injection is known to depend sensitively on the bubble closure angle [25], which governs the trajectories of sheath electrons at the rear of the cavity. Injection can occur in two distinct configurations. In the case of larger bubbles, typically associated with lower plasma densities, the sheath electrons are directed toward the interior of the bubble upon closure, enabling direct trapping into the accelerating phase. Alternatively, when the sheath electrons are oriented outward, they may first become confined within the bubble sheath and subsequently injected as they are redirected into the wakefield. This injection mechanism is further influenced by longitudinal density gradients. In particular, an increasing density upramp reduces the bubble closure angle as the upramp length grows, thereby modifying the conditions for electron trapping. A similar situation arises in the present periodically modulated density profile. At the beginning of the simulation window, the bubble forms in a region where the plasma density increases over a distance of approximately 25 μm. This positive density gradient favors the injection of electrons initially directed toward the exterior of the bubble. After being captured within the sheath and subsequently injected, these electrons form a more compact bunch compared to those injected directly toward the bubble interior. This effect will be further quantified in the analysis of the electron bunch emittance (Section 5).
We aim to determine the energy gain of electrons in modulated density profiles by deriving their achieved velocity and also present a method that can be generalized to other spatially varying plasma densities in LWFA. Additionally, we investigate how the modulation parameter influences key physical scales such as the depletion and dephasing lengths. We also examine the impact of the density modulation on the emittance of the injected electron bunch. These analyses aim to provide a deeper understanding of electron acceleration mechanisms and bubble dynamics in the presence of non-linear density profiles.
First, it is essential to understand how the plasma density influences the geometry of the bubble. This relationship will be examined in Section 2, where we introduce a transverse density profile designed to ensure both pulse guiding and self-focusing over the acceleration distance and also reduce beam expansions due to depletion over time. This profile is superimposed on the periodically modulated background density but applied only outside the bubble region to avoid affecting the bubble geometry and electron acceleration.
In a plasma with a non-uniform density profile, the size of the bubble is governed by the interplay between the ponderomotive force of the laser pulse and the charge separation force arising from displaced plasma electrons. Therefore, variations in plasma density directly influence both the formation dynamics and the spatial extent of the bubble. The charge separation force scales with the electron displacement from the axis, which is of the order of the bubble radius, since the associated electric field scales as . As a result, this force depends strongly and directly on the local plasma density. Hence, density modulation plays a dominant role in determining the bubble size.
In contrast, variations in the ponderomotive force arise from the evolution of the laser pulse as it undergoes cycles of diffraction and self-focusing. During transverse expansion, the normalized vector potential decreases, reducing the local ponderomotive force; however, this reduction is partially compensated by the larger spatial region over which the force acts. Conversely, during compression, particularly in higher-density regions, the pulse reaches higher values of , resulting in a stronger ponderomotive force that acts over a shorter distance. Since the ponderomotive force scales approximately as , its associated mechanical work scales as , leading to a partial compensation between these opposing effects. As a consequence, the net contribution of ponderomotive force variations to the bubble size remains weaker than that induced by density modulation. In this regime, the bubble dynamics are therefore predominantly controlled by the charge separation force, which acts continuously on the plasma electrons, in contrast to the ponderomotive force, whose influence diminishes once the electrons exit the high-intensity region of the laser. Any local variations in the ponderomotive force are rapidly overridden by the strong, density-dependent charge separation force, especially at larger transverse displacements.
Furthermore, as the pulse depletes and its rear moves forward relative to the front at the etching velocity, it undergoes frontal compression, leading to a flattened and more intense leading edge, contributing to a stable guiding of the pulse. The transverse density profile, discussed earlier, is primarily designed to confine the vertically expanding components of the compressed pulse front, thereby supporting guiding and preserving the integrity of the acceleration structure. We also consider a lower effect on the bubble size variation due to other non-linear effects, like the effects of the self-injected electrons on the fields inside the bubble or the beam loading [26].
In light of these considerations, we regard the effects of pulse compression and expansion on the bubble size, as well as other non-linear effects, as secondary to the influence of plasma density through the charge separation force in modeling the electron acceleration. At lower plasma densities, the reduced charge separation force necessitates a longer time to bring the electrons back to the axis, resulting in a larger bubble. In contrast, at higher densities, the stronger charge separation force pulls the electrons back at a higher velocity, leading to a faster bubble closure and a correspondingly smaller bubble size. Thus, such a modulated density profile will compel a non-negligible continuous expansion and contraction in the bubble dimension, with the bubble radius spanning over intervals of tens of microns. In this case, the acceleration of the electrons is not only determined by the electric field at their position in the bubble, but also by the position of the center of the bubble at a given moment, which also reveals the magnitude of the field. Considering the bubble to be spherical, this makes the electric field dependent only on the distance from the electron to the center of the bubble and on the average charge density, .
In Section 2 we present the simulation set-up and the energies obtained for five modulated densities as well as the bubble features obtained for these profiles. In Section 3 we describe the analytical model proposed for the acceleration of electrons in this modulated density, while in Section 4 we investigate the depletion and dephasing lengths in these profiles and their dependence on . In Section 5, we derive the emittance of the injected electrons and compare it with the five density profiles at the same simulation time.
2. Simulations and Energy Results
We performed 2D PIC simulations in the EPOCH code [27,28] for five density profiles of the type
including one without modulation, , and four with taking the values 0.1, 0.3, 0.5 and 0.7. In all these cases, cm−3 and μm, which is approximately eight times the plasma wavelength for this density ( μm). The value of is sufficient to maintain pulse stability, as lower values may lead to its degradation.
The Gaussian laser parameters were kept constant, the wavelength was μm, the beam spot size was μm, the intensity was and the pulse duration was fs. Helium plasma was used with an ion density , and the number of particles per cell was four electrons and two ions [29], of which the latter are considered immobile. The high laser intensity considered here is consistent with the 10 PW-order laser, available at the ELI-NP facility. The dimensions of the moving simulation window were and , and the number of grid points was in the horizontal direction and in the vertical direction. These parameters define a square simulation cell, preventing artificial elongation of the bubble in any direction. This avoids anisotropic numerical effects that could otherwise distort both the bubble geometry and the internal field structure, while also ensuring the accuracy of the emittance measurements (Section 5).
To ensure laser guidance and mitigate its spreading due to depletion and other non-linear effects, we also set a transversal profile of the type [20], with representing the beam waist. We added this profile to the modulated , only if and symmetrically , where was chosen to be larger than the largest bubble radius at the highest modulation, thus being applied outside the bubble. Hence, the density within the bubble remained purely periodic, ensuring that it did not influence the proposed analytical model or the evaluation of the electron emittance in the modulated cases, while still providing a significant improvement in laser guiding.
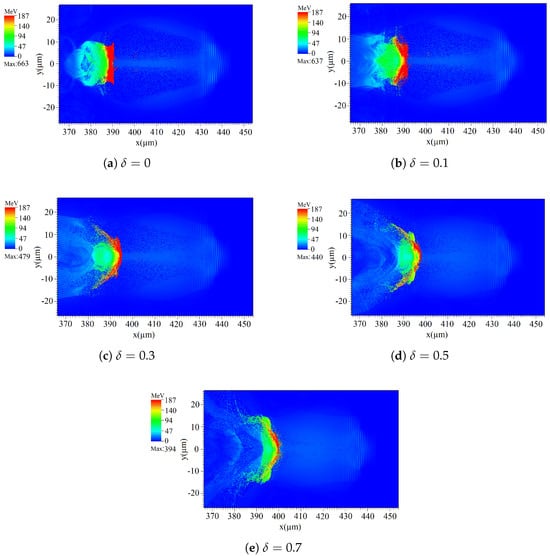
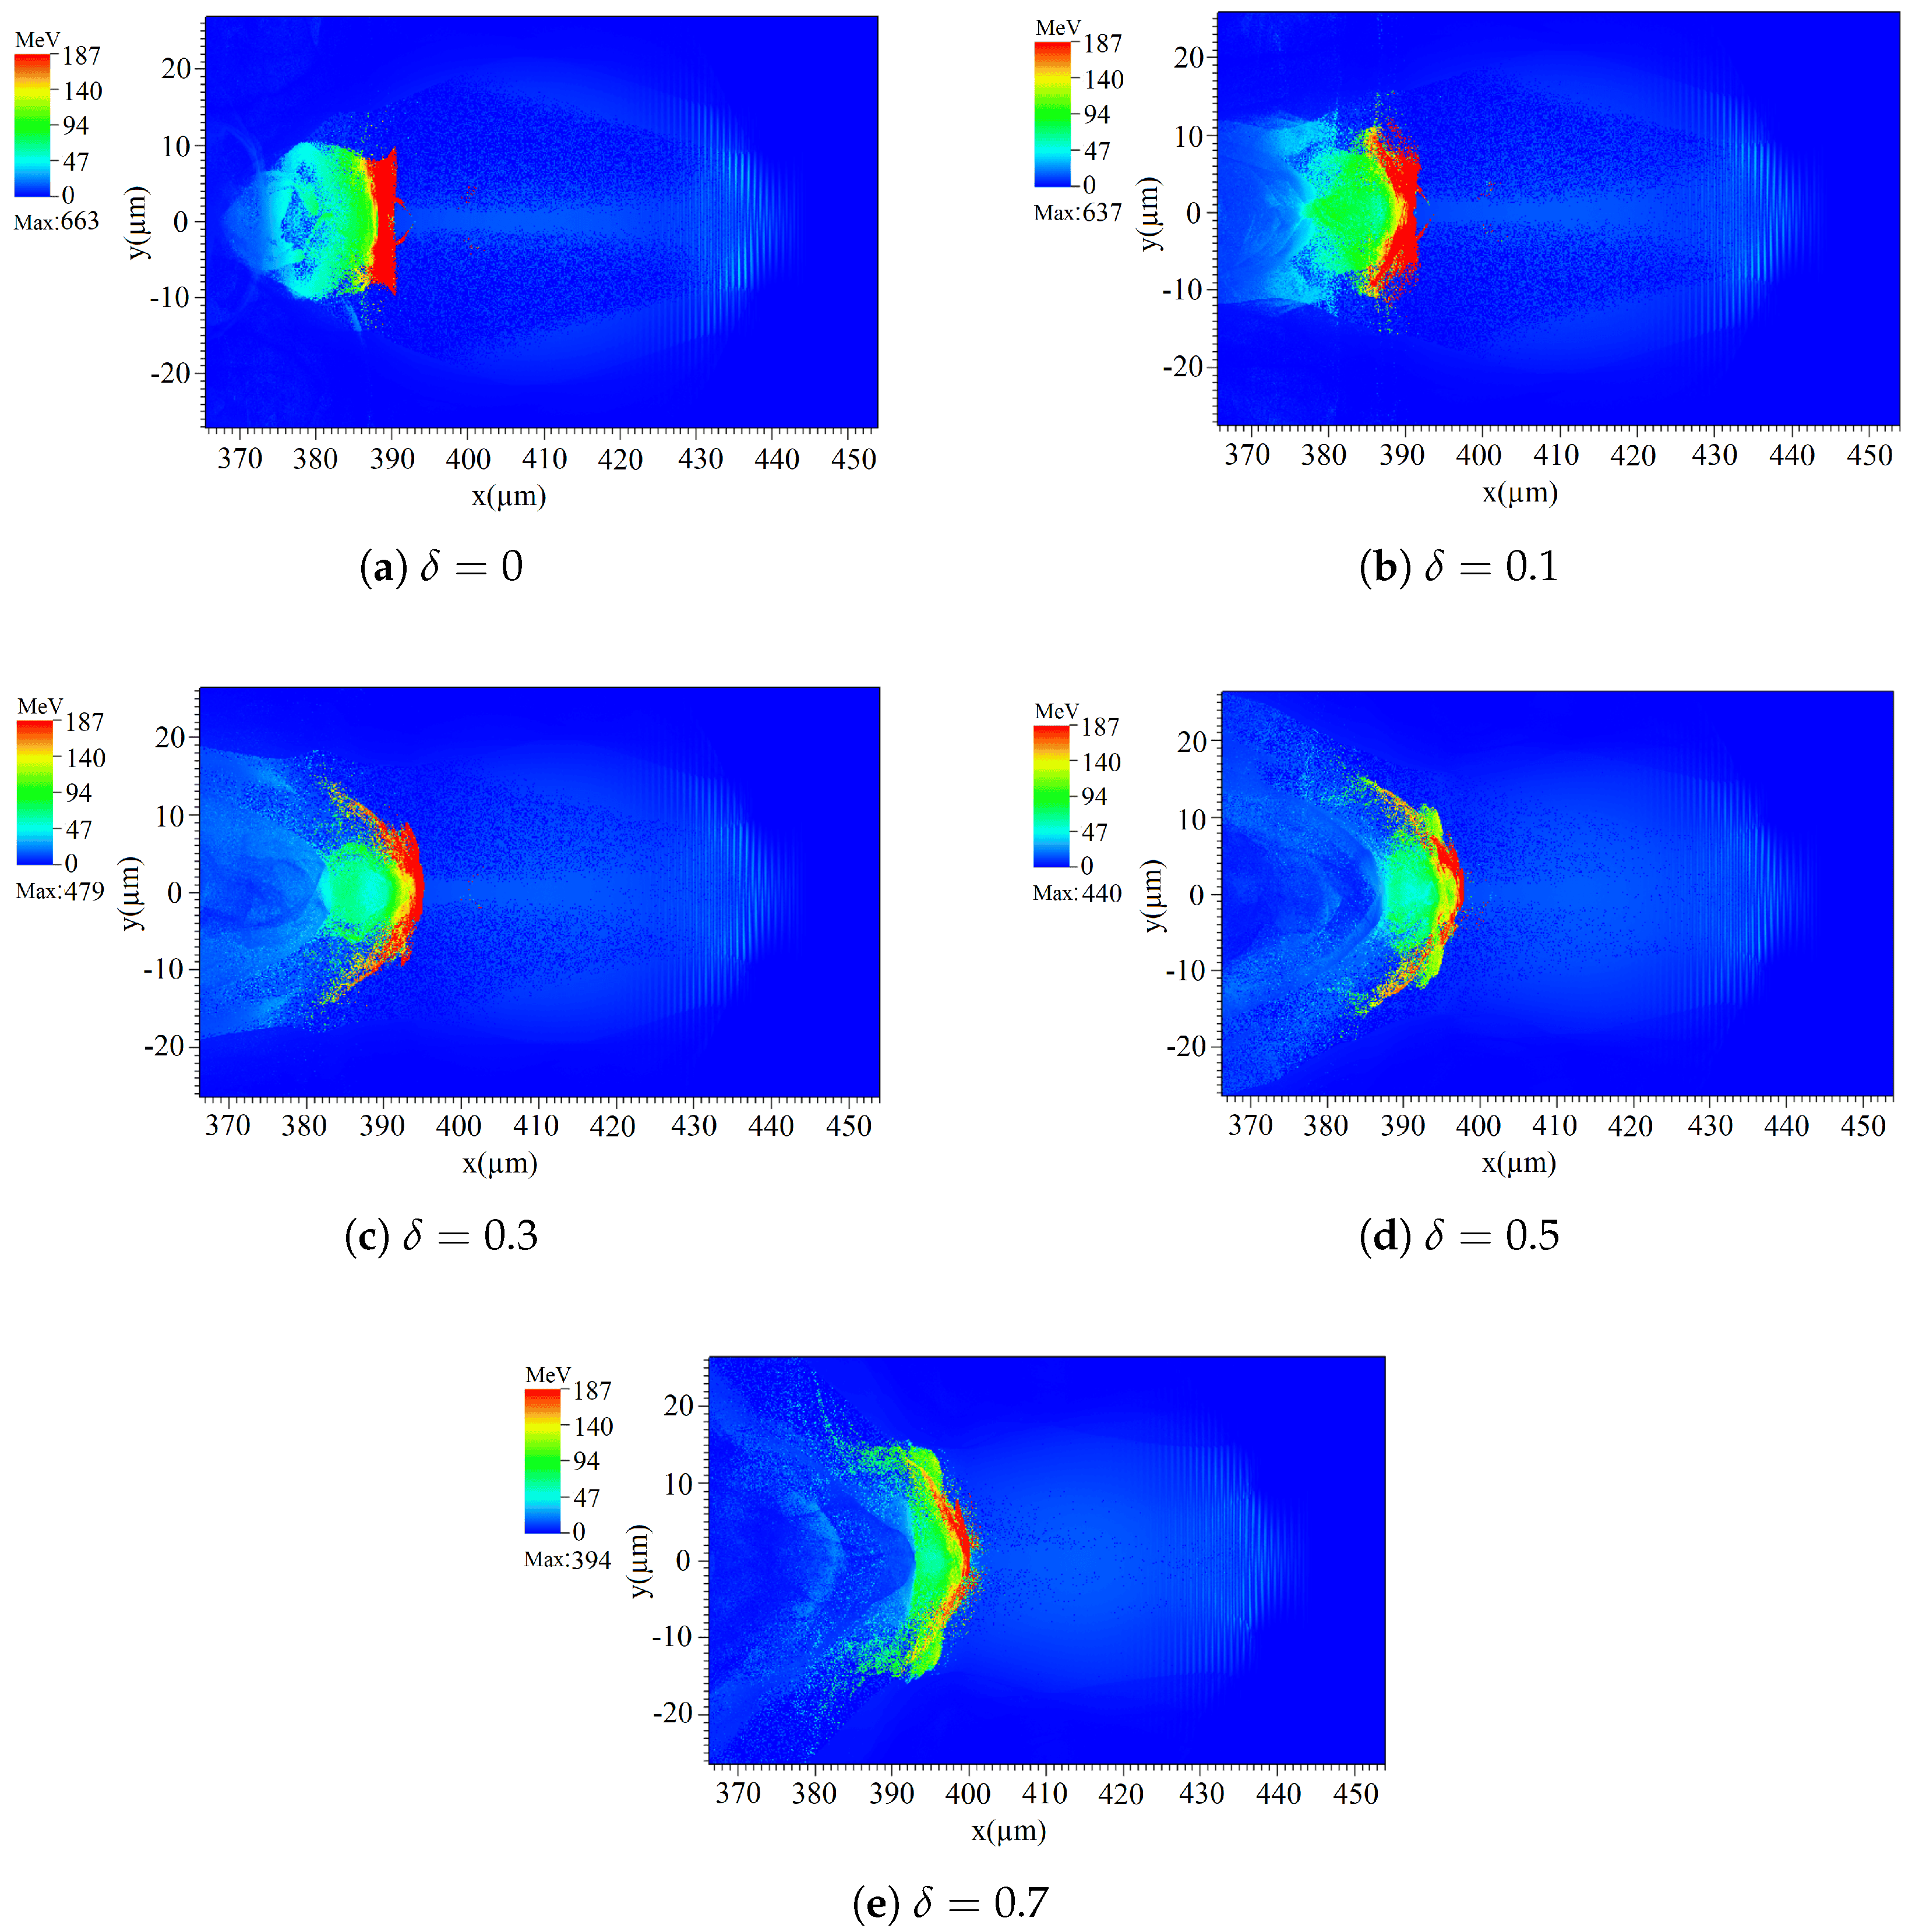
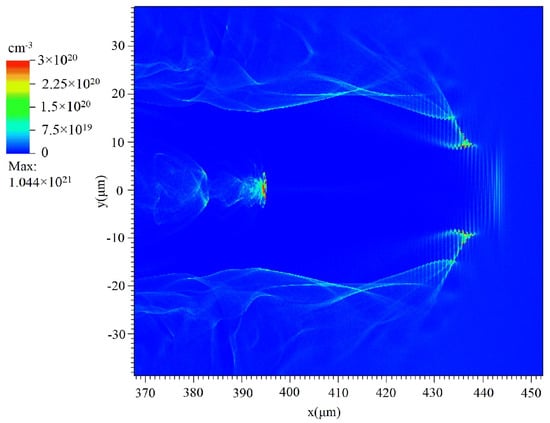
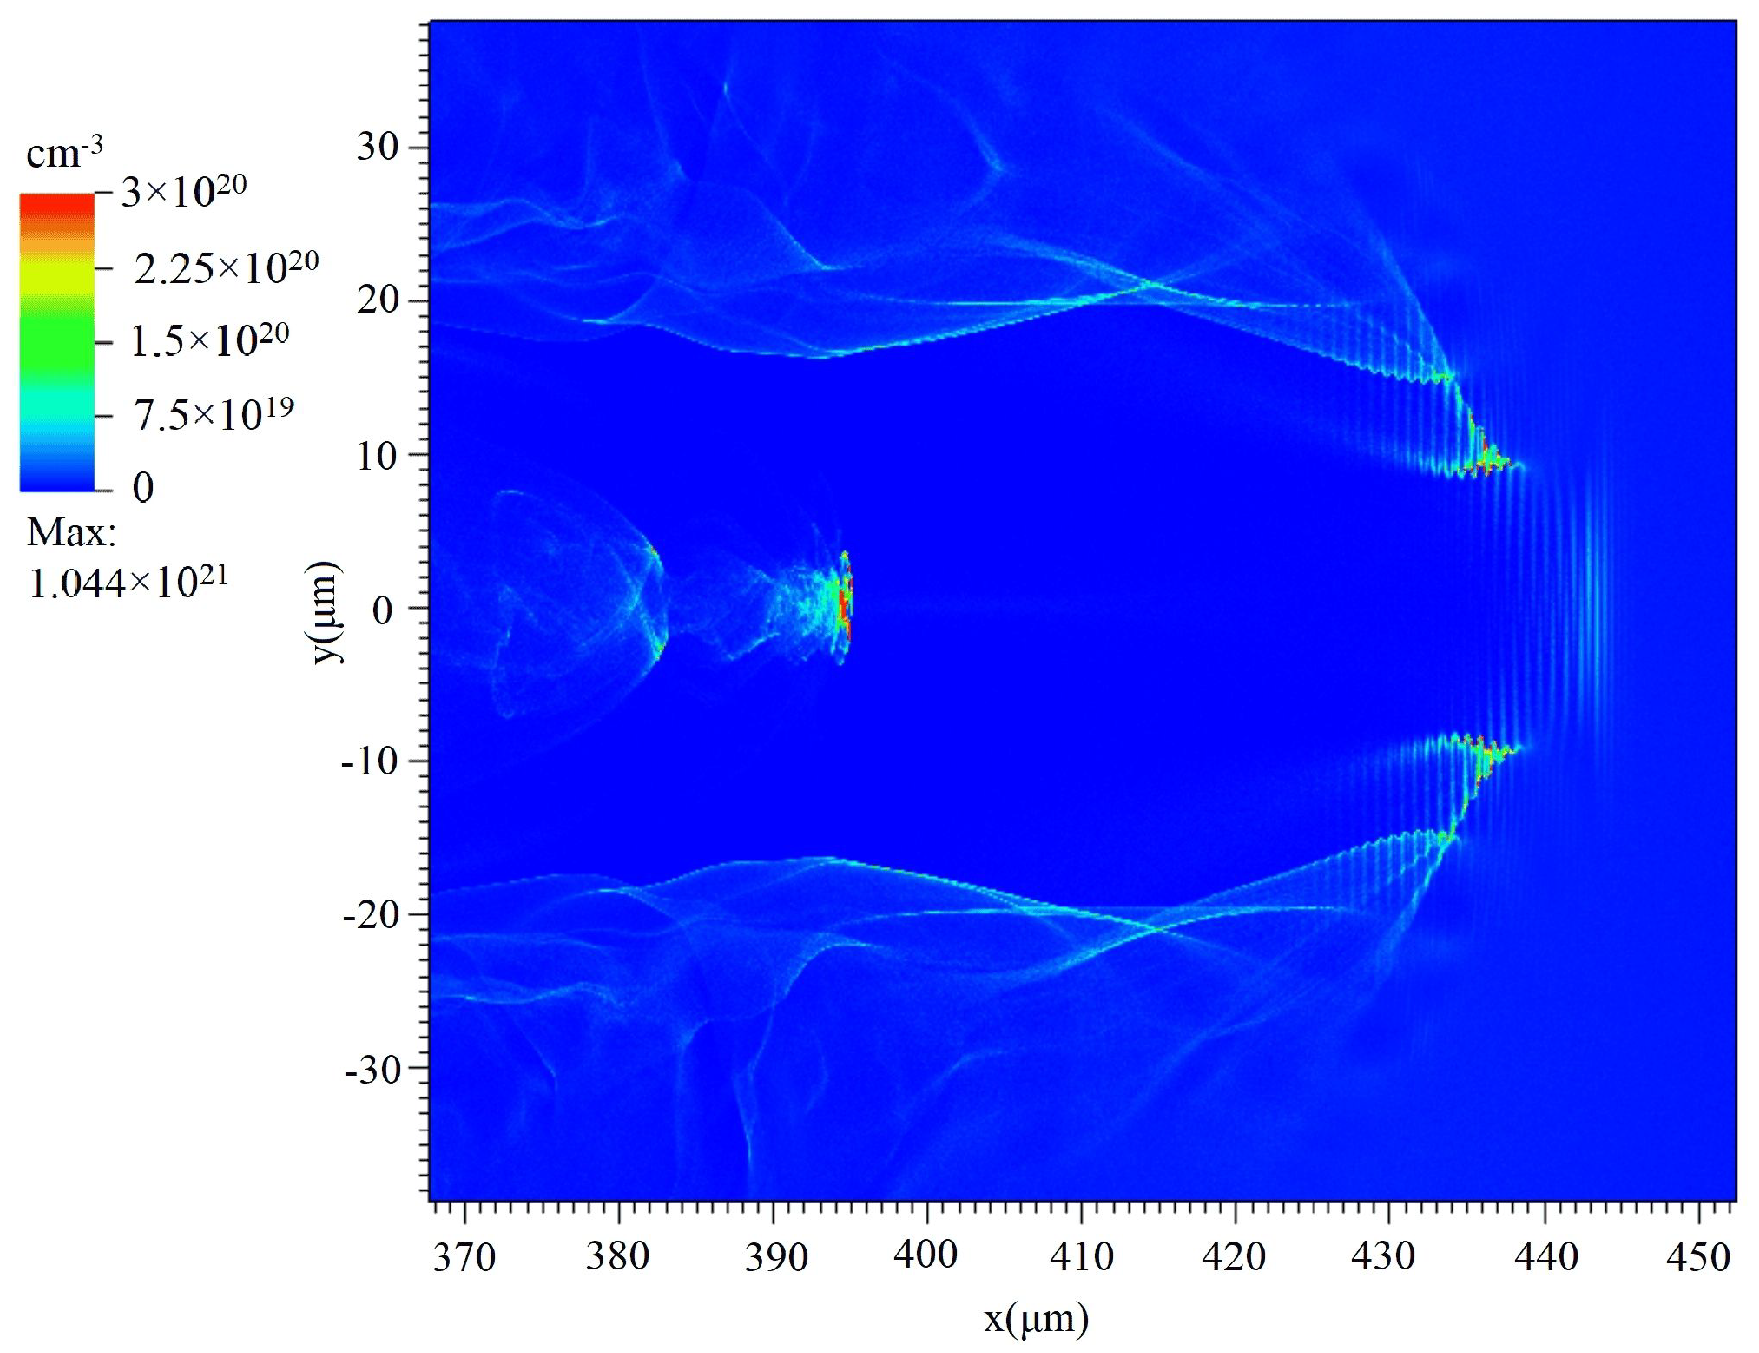
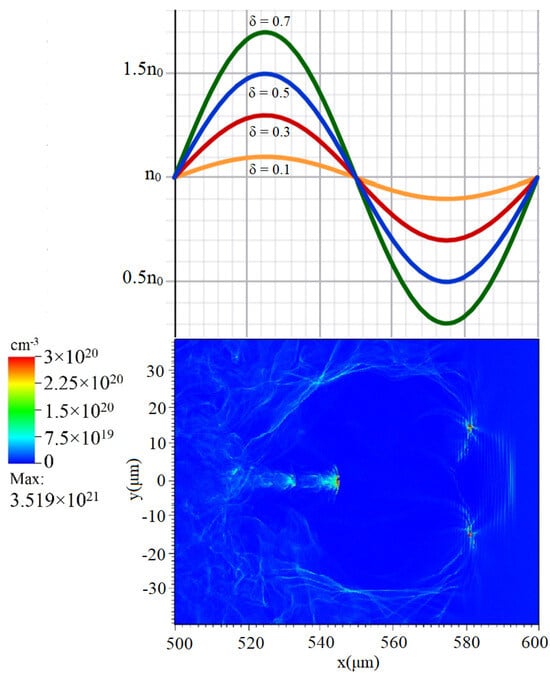
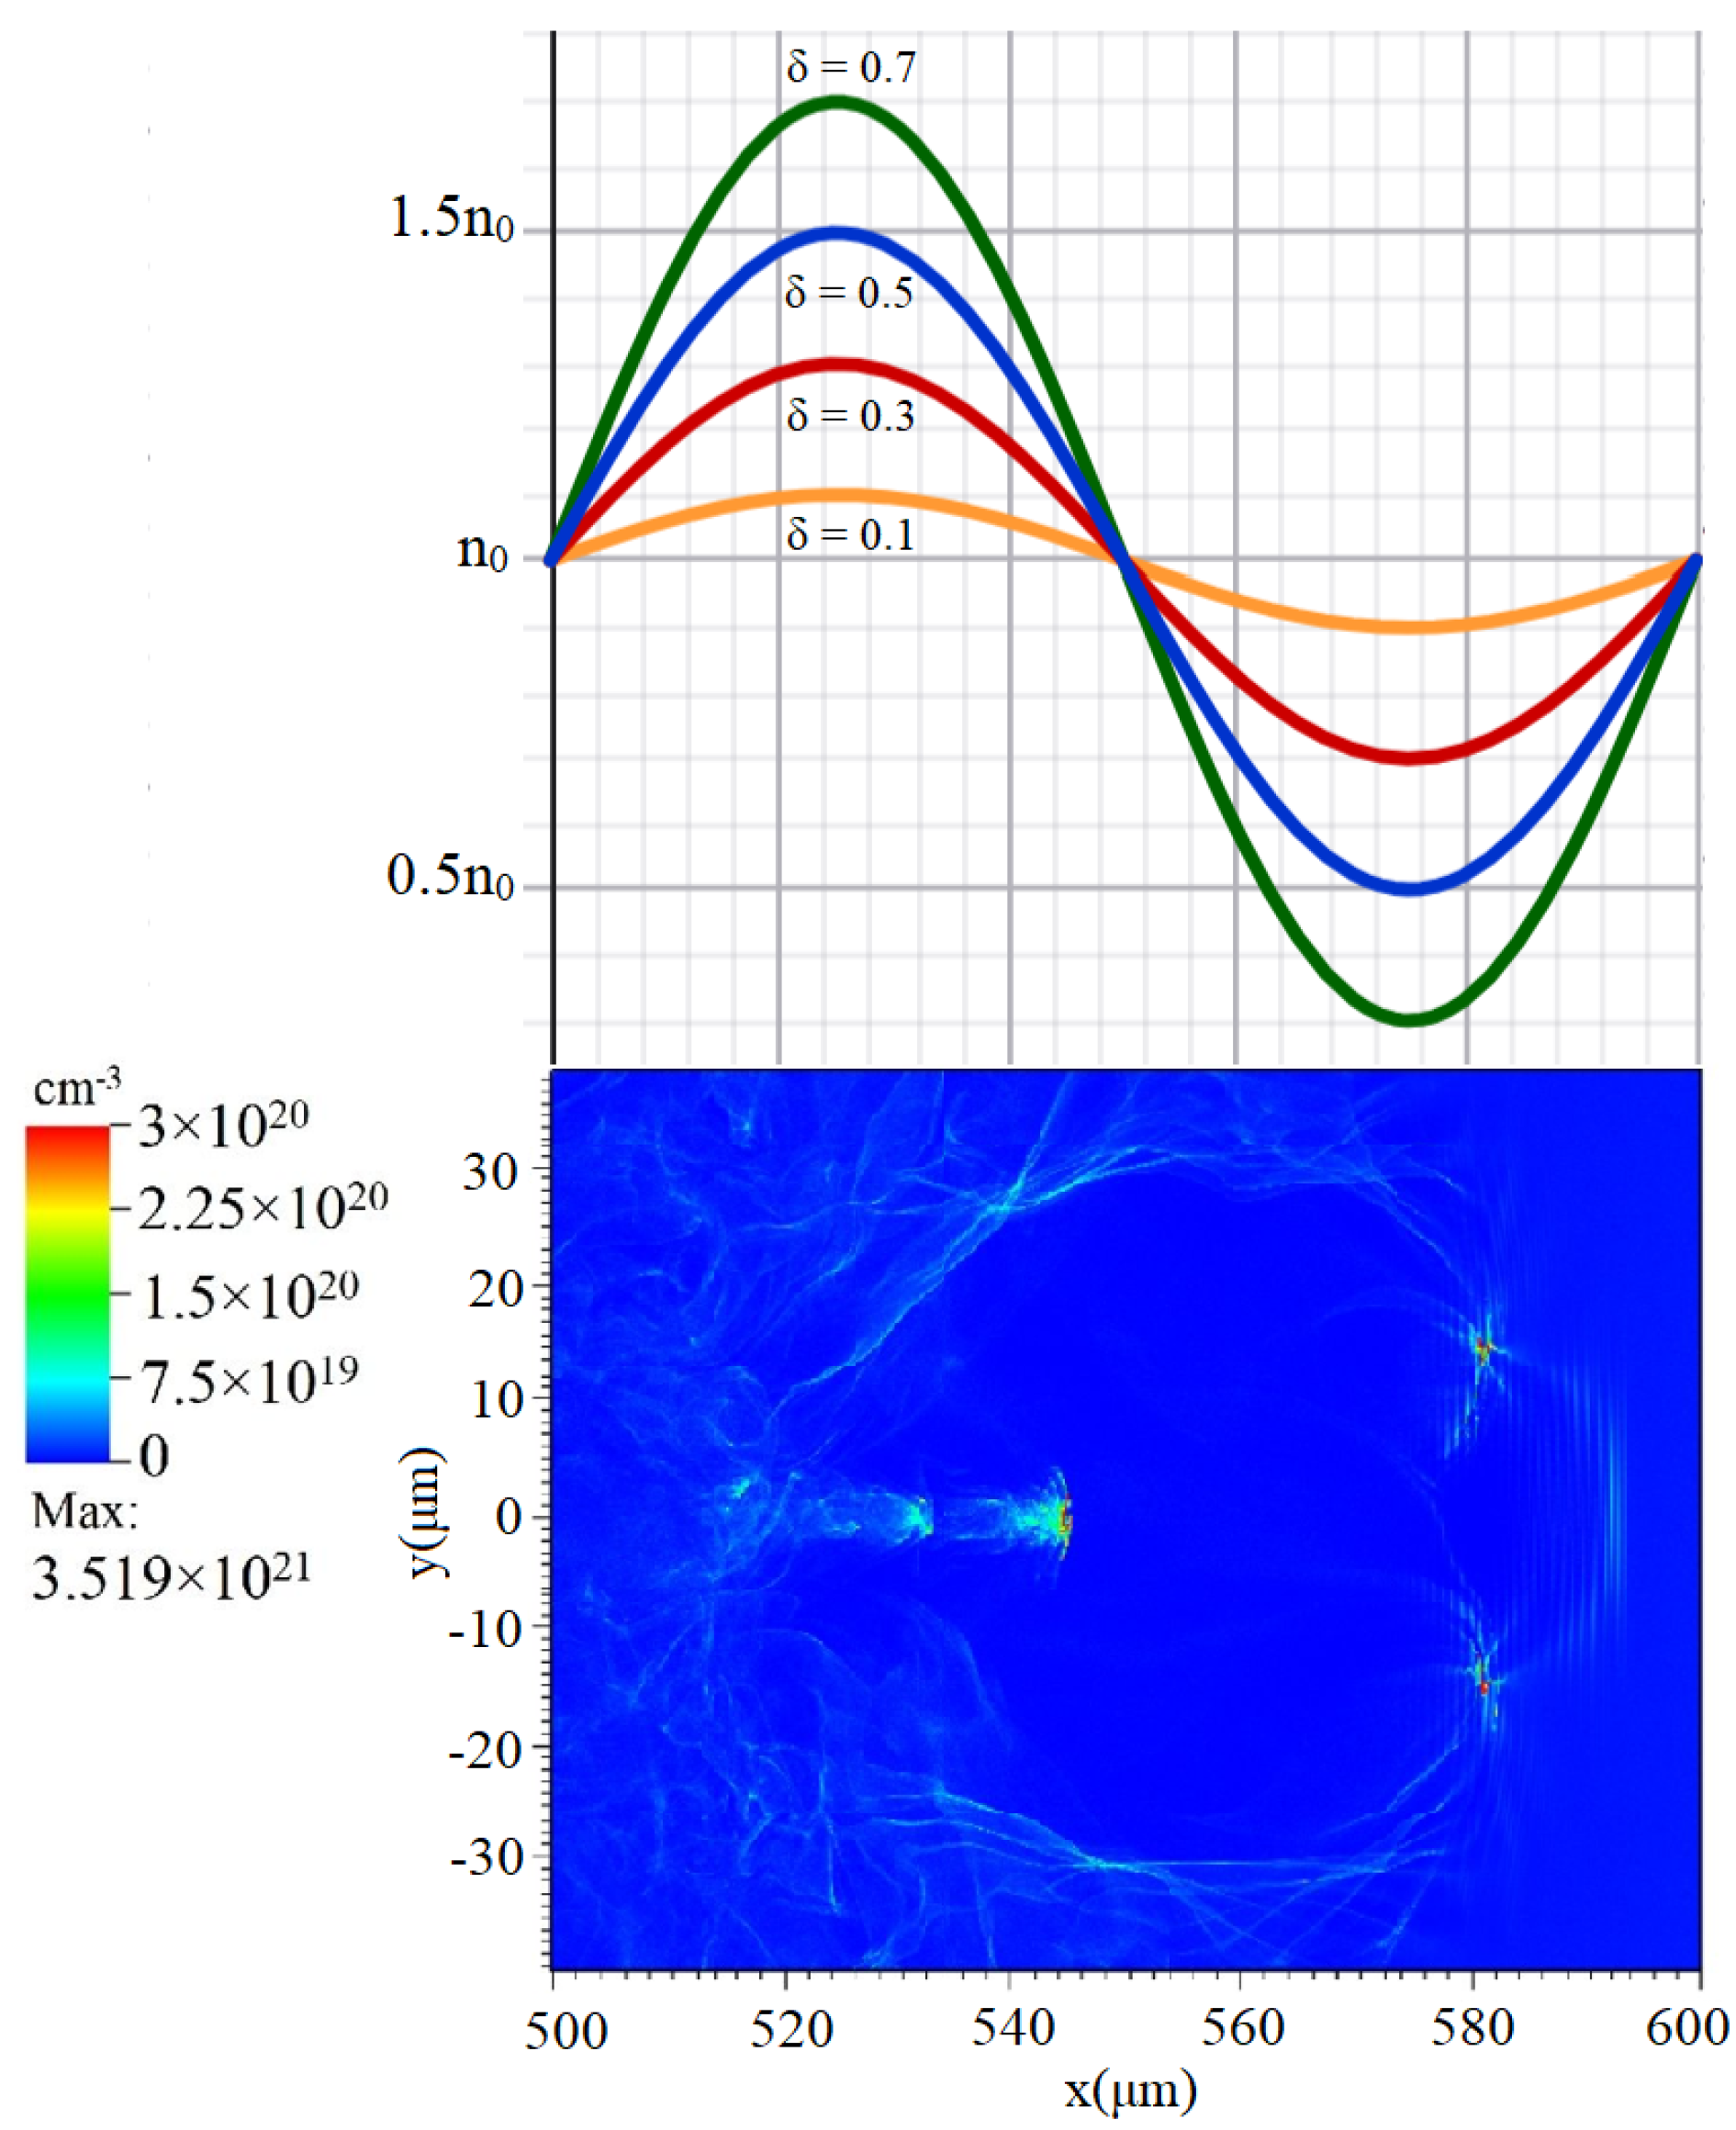
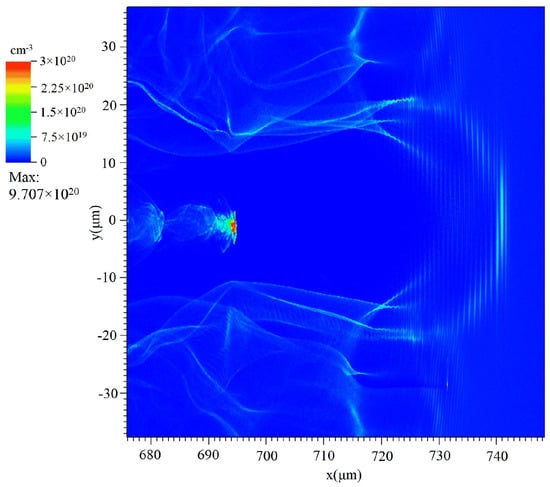
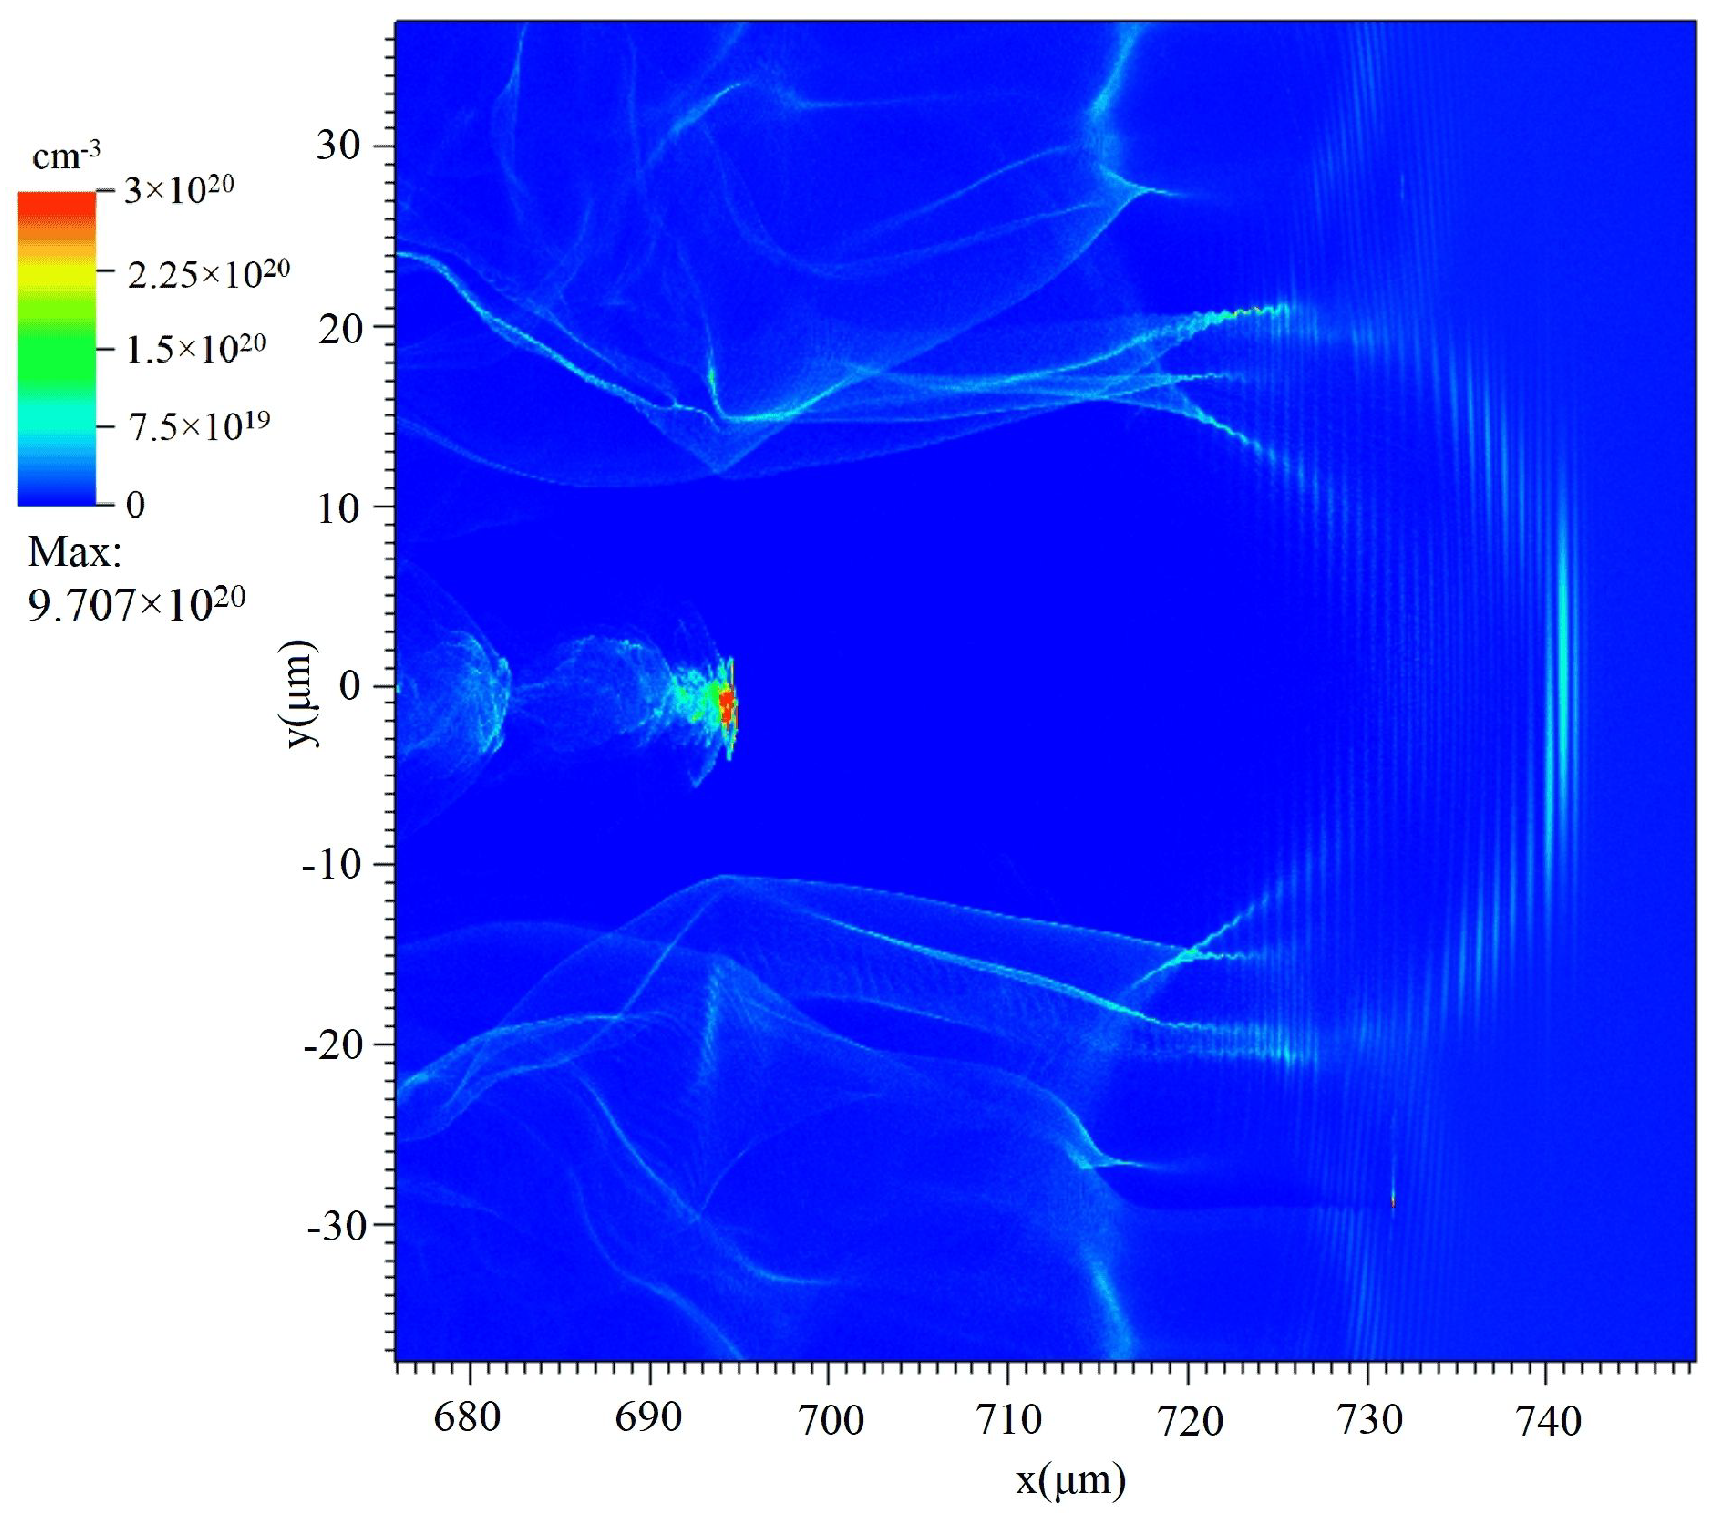
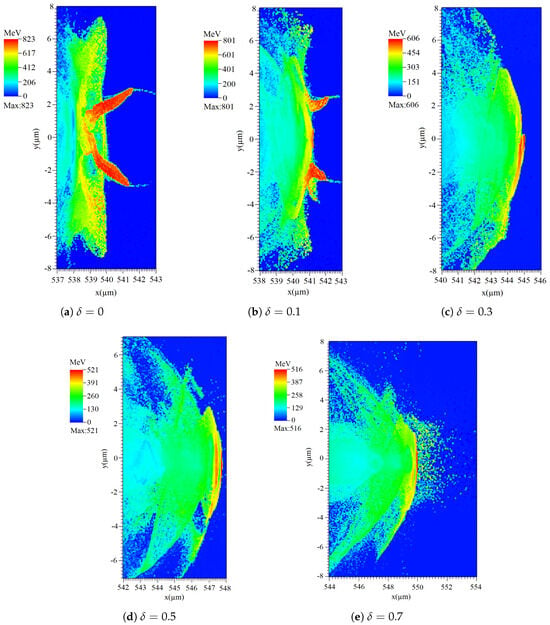
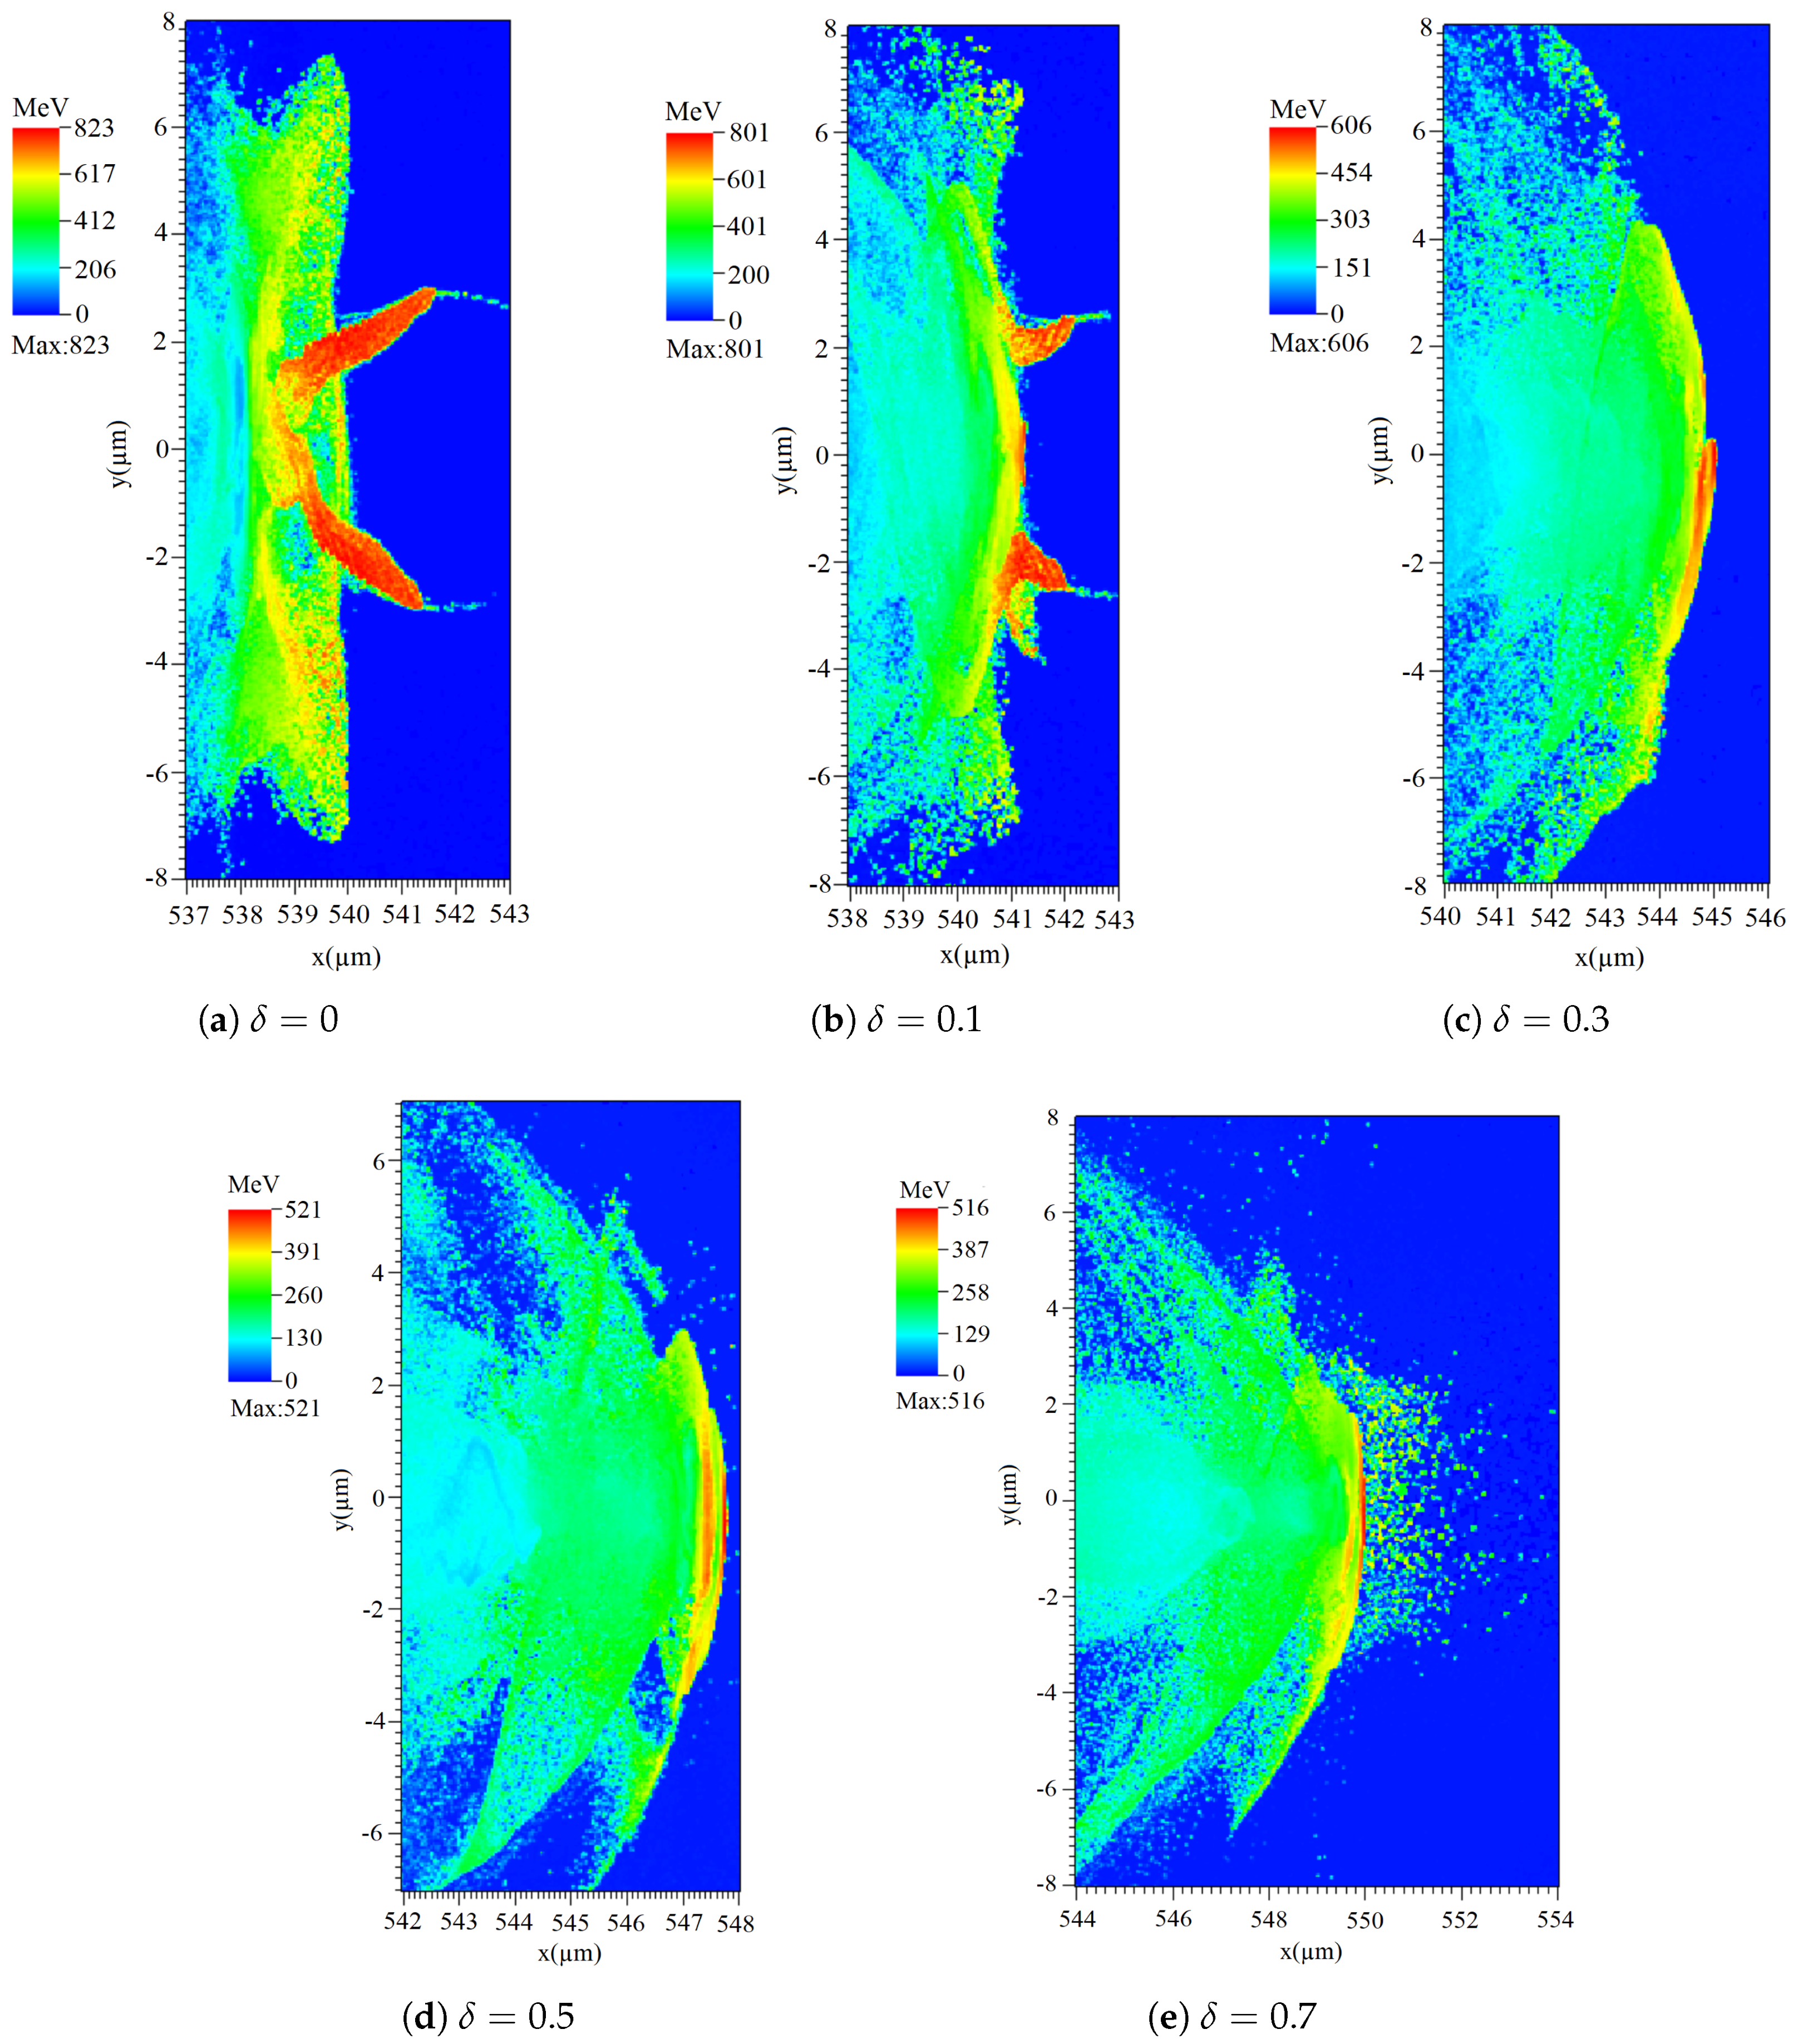
The electron energy distribution maps for all the modulation parameters are shown at the time in Figure 1, while the bubble evolution in time is shown through the electron number density maps, for the case of , at in Figure 2 and at in Figure 3, also containing a graph of the variation in the modulated densities over a period, on the same scale as the one presented in the number density map and in Figure 4 at . The different densities are observed to impact the dimension of the bubble at different points. For the case presented in Figure 3, the bubble is positioned approximately in the interval , meaning that the maximum density is obtained at and the minimum at . This gives a region of decreasing density between them, which is shown in the attached density graph of the figure, and the bubble grows more abruptly around due to a decrease in the charge separation force. The density then grows in the interval .
Figure 1.
The maps of the electron energy distribution at for the five density profiles, (a) , with a maximum electron energy of 663 MeV; (b) , with a maximum energy of 637 MeV; (c) , with a maximum energy of 479 MeV; (d) , reaching the maximum energy at 440 MeV; and (e) , reaching the maximum at 394 MeV. A decrease in energy is observed with the growth in the modulation parameter.
Figure 2.
Electron number density map for at .
Figure 3.
Electron number density map for at t = 2 ps, together with the density modulation profiles over one period. The bubble is continuously reshaped, with a pronounced expansion near , where the density reaches a minimum.
Figure 4.
Electron number density map for the same case of at showing the time-dependent variation in the bubble size driven by the periodic density modulation.
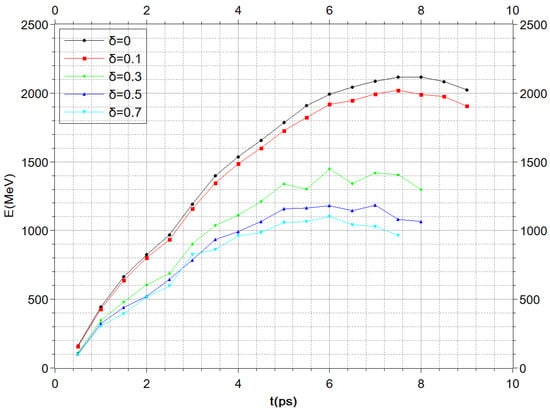
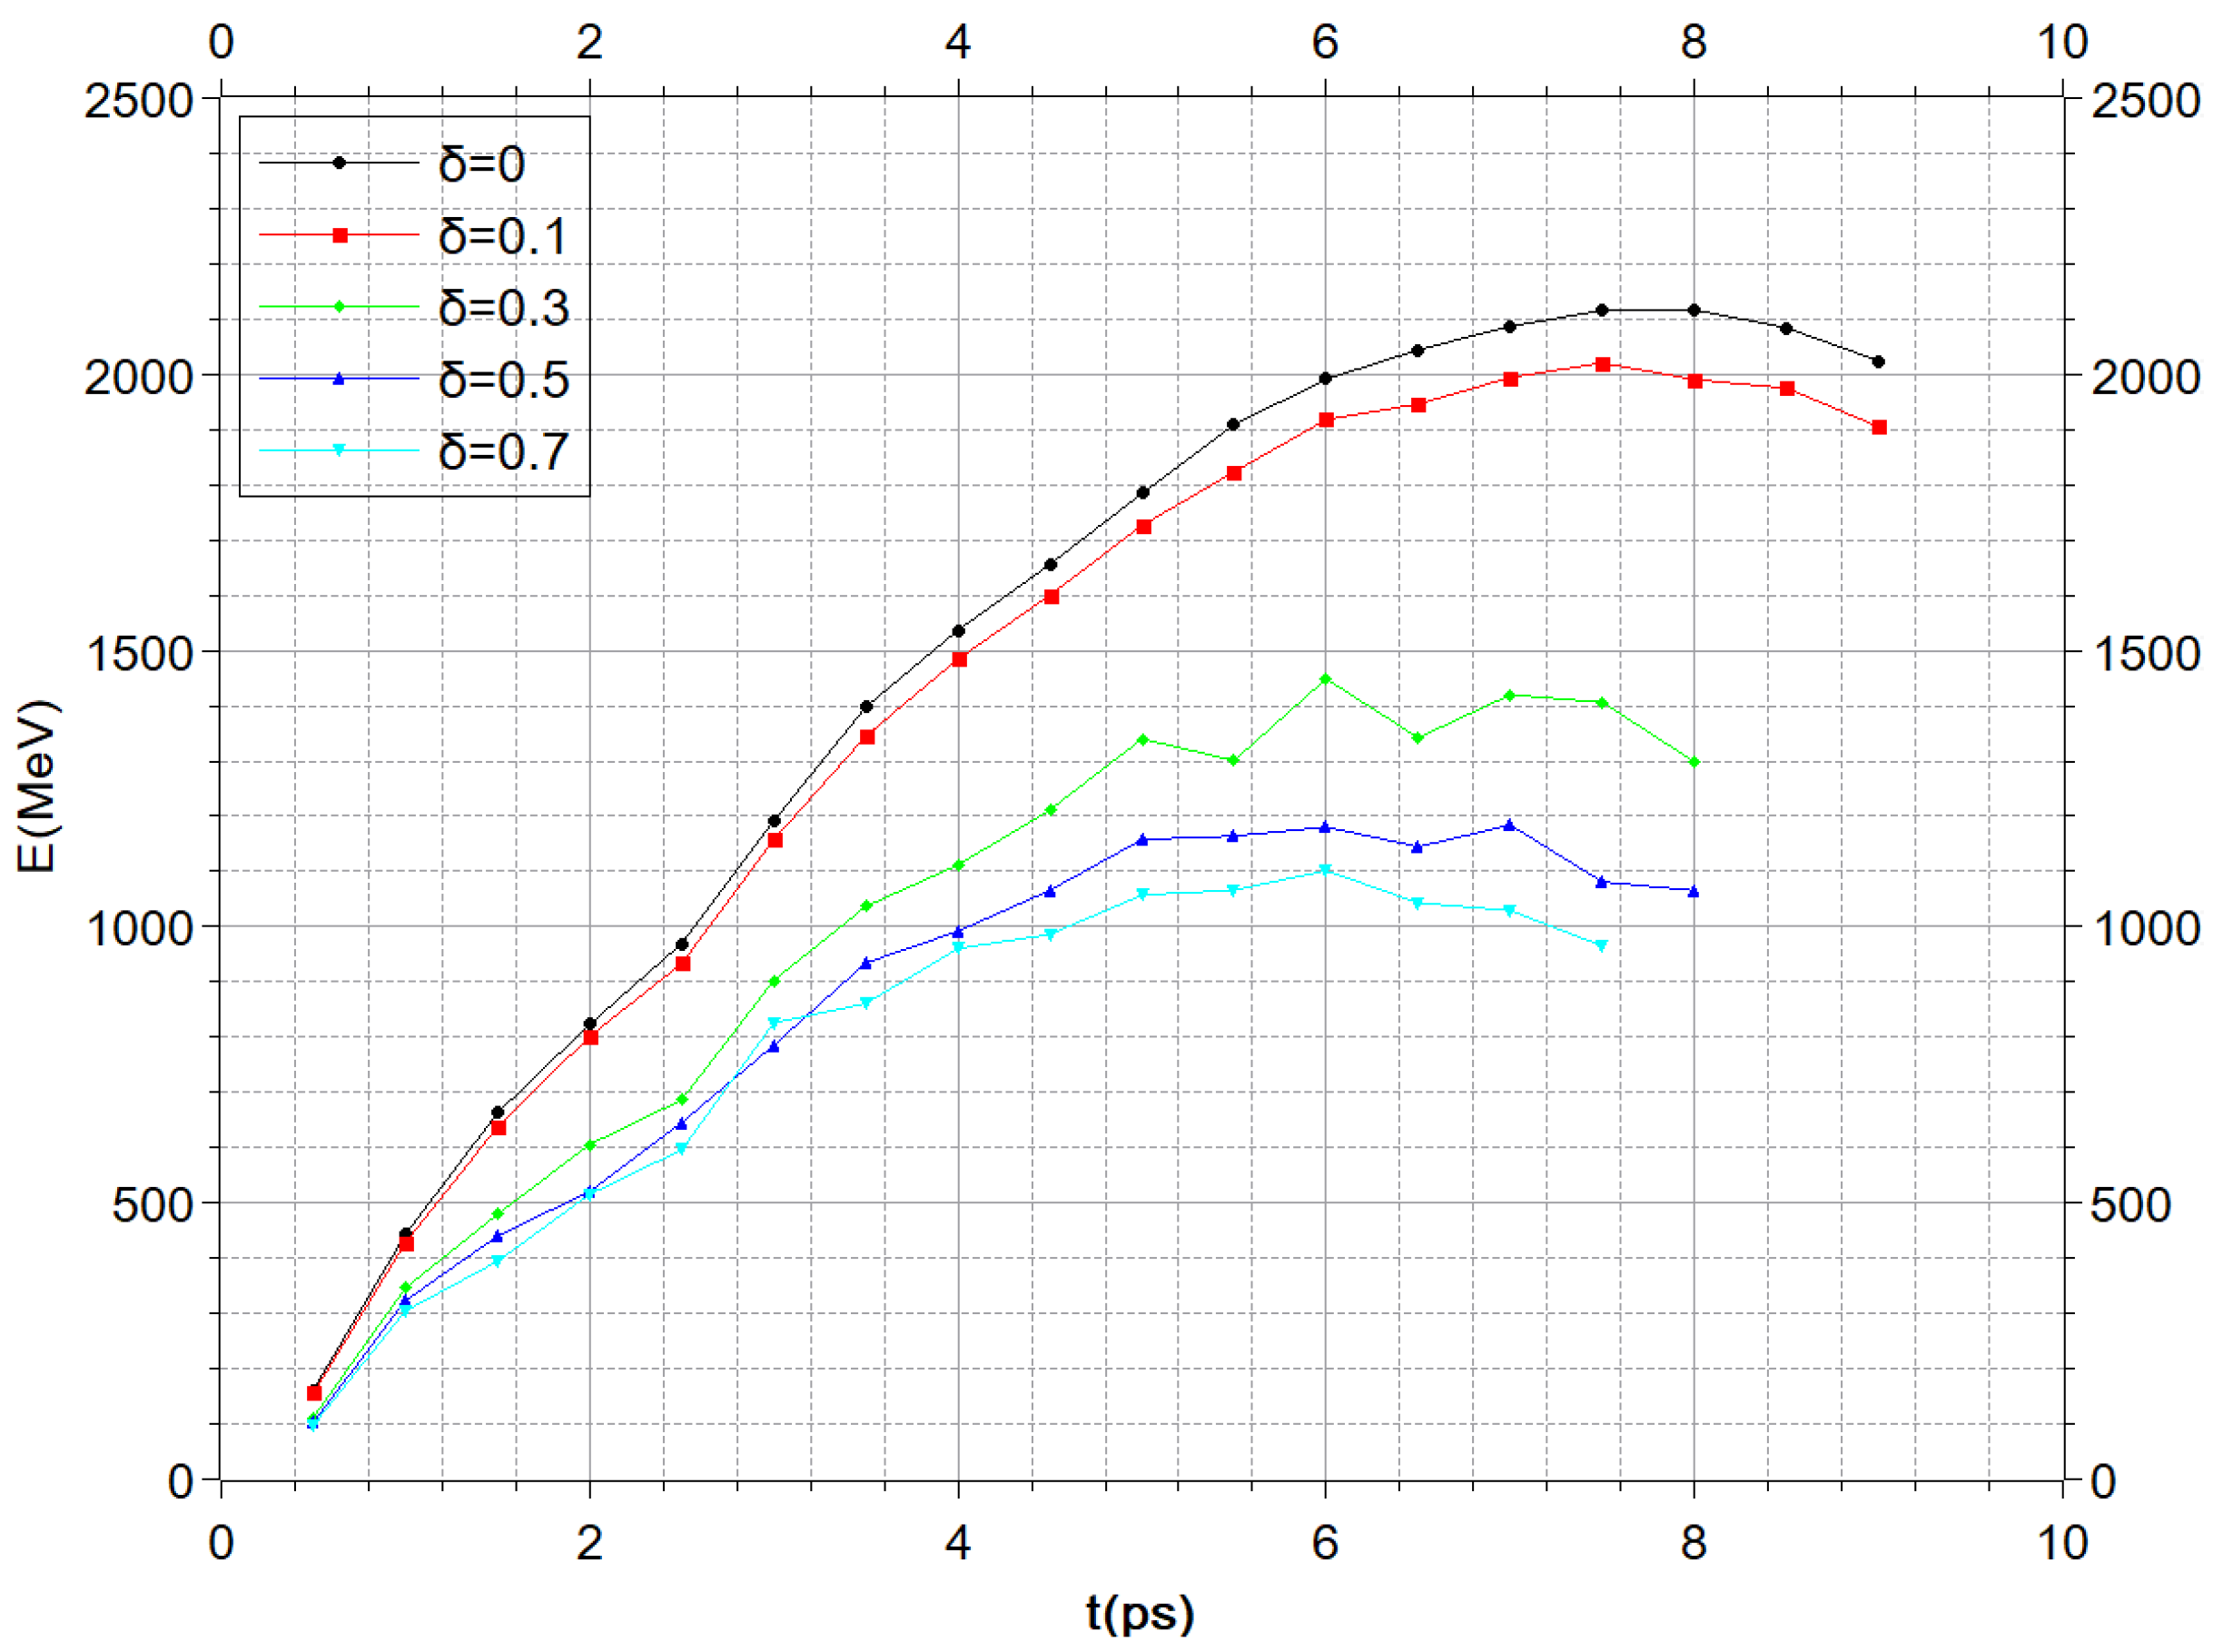
The evolution of the maximum electron energy, measured at intervals for the five plasma density profiles, is presented in Figure 5. As the plasma density variation quantified by the modulation parameter increases, the maximum electron energy correspondingly decreases. Towards the end of the simulated interval, the electron energy enters an oscillatory regime, in which the electron resides between the centers of the largest and smallest bubbles. In this configuration, it experiences alternating accelerating and decelerating fields over short timescales, as will be shown in the following section. In these cases, the overall energy decreases with increasing modulation amplitude. Although the regions of higher plasma density provide stronger acceleration, the low-density ones, where the accelerating fields are weaker, exert a dominant influence on the net energy gain.
Figure 5.
Evolution of the maximum electron energy at intervals of 500 fs. The energy decreases with increasing and exhibits fluctuations at later times, when the electron resides between regions corresponding to the minimum and maximum bubble sizes, particularly for larger .
3. Analytical Model of a Modulated Bubble
We next adopt an analytical approach to derive the electron’s acceleration within a plasma bubble of varying size. As described before, we will consider an ideal bubble with a steady spherical form whose dimensions vary mainly due to the plasma density variations. Other non-linear effects, like the bubble size variation due to laser diffraction and focusing, or the variation in time due to laser depletion, or due to the effect of the electrons self-injected inside it, will be considered less impactful, especially in the first picoseconds of the motion.
Thus, in this ideal set-up, we will firstly focus on the increase in the electron’s longitudinal velocity driven by the electric field of the plasma ions. Due to the transverse betatron oscillations, the electron’s velocity can be decomposed into longitudinal and transverse components:
Starting from the initial Lorentz factor and betatron oscillation amplitude , we derive the Lorentz factor at an arbitrary acceleration distance. The initial transverse velocity of the injected electrons at the bubble formation, evaluated along the horizontal axis, is derived from the betatron oscillation angular frequency
where is the plasma angular frequency. Thus, the initial longitudinal velocity is given by
The electric force increases the electron’s longitudinal momentum according to
where the average force is given by
The longitudinal accelerating electric field within the spherical cavity varies with the distance from its center. For electrons located along the horizontal axis during their oscillation, the transverse momentum is conserved; therefore, we can express
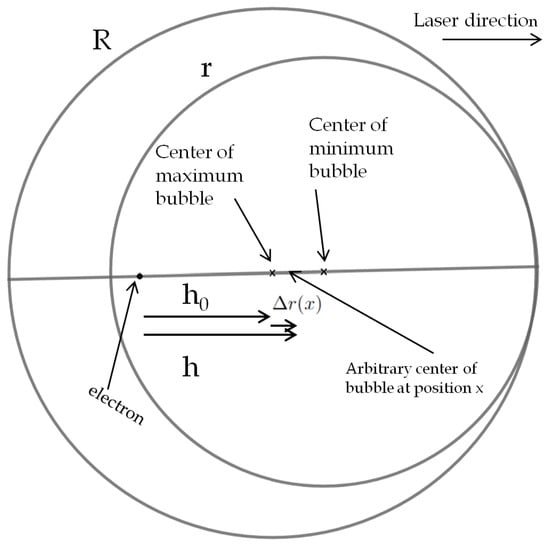
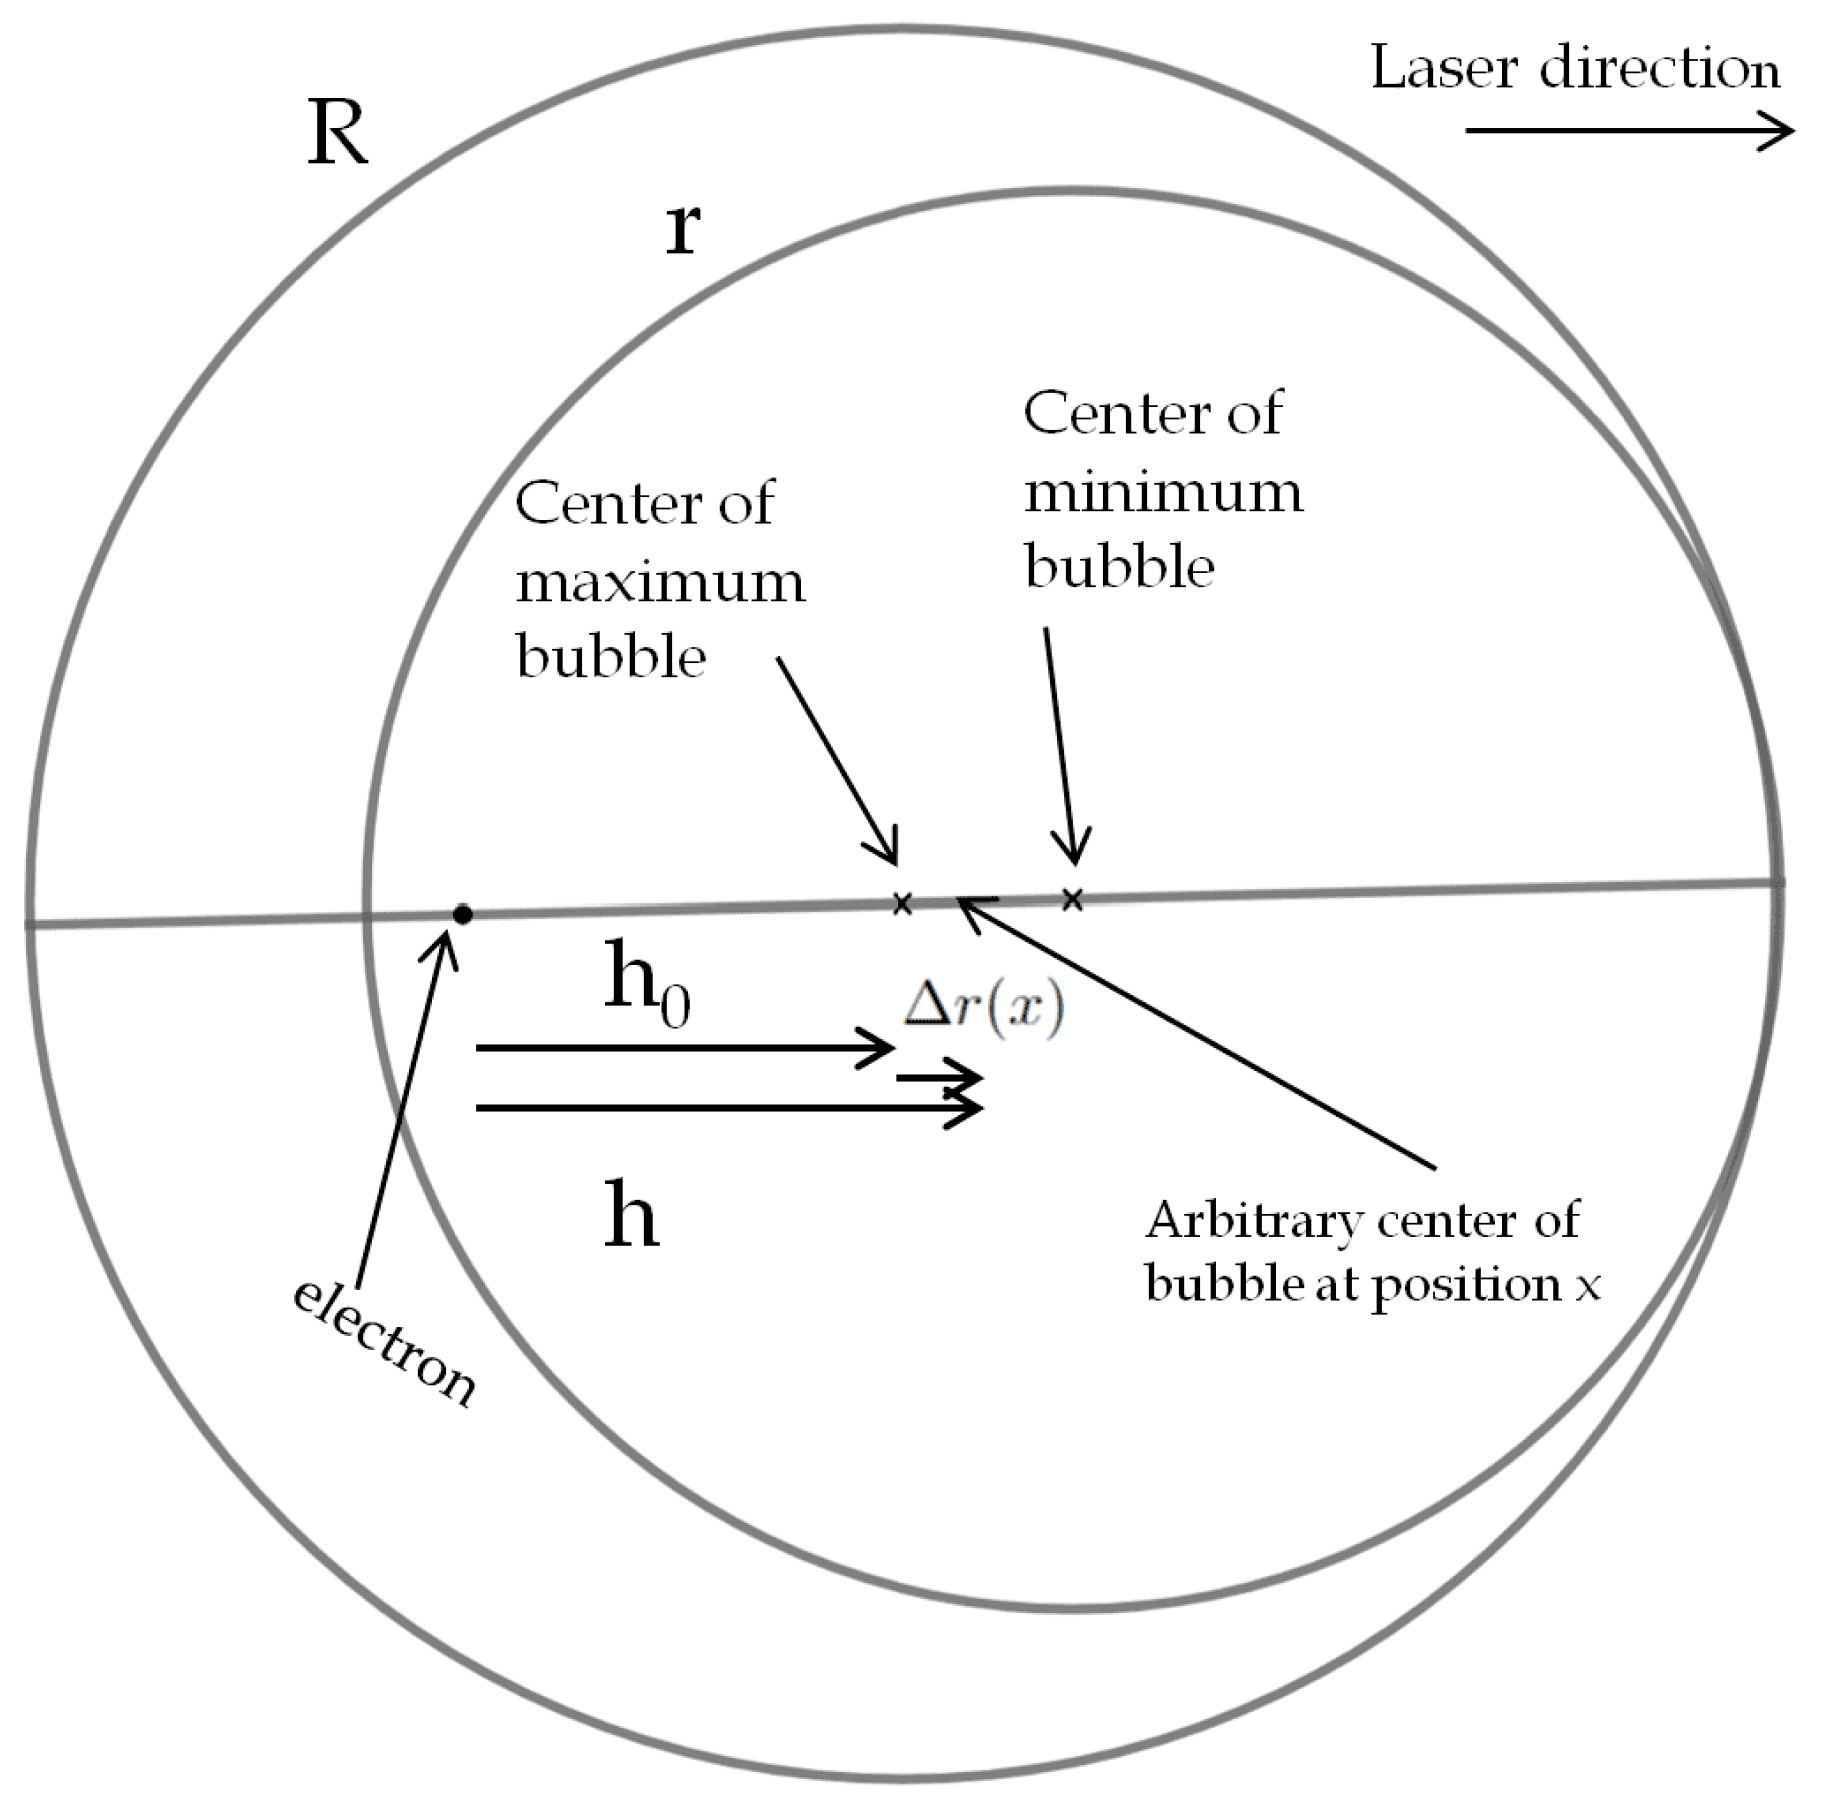
The distance parameters are illustrated in Figure 6, which shows the maximum bubble radius R at the minimum plasma density, the minimum radius r at the maximum plasma density, and the variation range over which the bubble center oscillates. The accelerating field depends solely on the distance between the electrons and the bubble’s center. This distance varies for two reasons: the electron moves closer to the center, and the center itself oscillates due to the periodic variation in the bubble’s size. We define h as the total distance from the bubble center at an arbitrary position to the accelerated electron. The term represents the distance from the center of the largest bubble to the electron, while denotes the displacement of the bubble center from the largest bubble center at position x. Here, x corresponds to the distance measured from the laser interaction origin at the start of the simulation. Thus, the following relation holds:
with .
Figure 6.
Electron positions relative to a bubble of varying size: R denotes the maximum bubble radius corresponding to the minimum plasma density , while r represents the minimum radius at the peak plasma density . Electrons accelerate toward the bubble center, which oscillates between these two extreme positions.
It is important to note that when the electron crosses the center of the largest bubble and moves between the centers corresponding to the maximum and minimum bubble sizes, the formula remains unchanged; only the distance becomes negative. Therefore, both and h should be interpreted as directed (oriented) distances.
This system is solved for by expressing the three velocities as functions of and substituting them into Equation (2), using the average force. We have
We now introduce the dependence of the bubble radius on the plasma density. The relation is given by [30]:
where is the beam waist and the normalized vector potential. Generally, the bubble radius and the beam waist are of comparable sizes, as they provide the distance over which the ponderomotive force acts. However, it is evident that the plasma response to charge separation depends on the density. Consequently, the resulting bubble may have a radius larger than the beam waist, or it may assume an ellipsoidal shape with unequal transverse and longitudinal radii. Using the radius formula, and , the maximum and minimum bubble radii are obtained as
It is also important to specify the x coordinate at which the bubble radius is evaluated. Since the bubble extends over a considerable length where plasma density varies significantly, the bubble center remains influenced by the local density at its position as the laser pulse propagates into new density regions. Therefore, we define the x coordinate for the calculation of the radius as the position of the pulse front, , minus the average of the minimum and maximum bubble radii. Formally, this is expressed as , where . The ionic charge density inside the bubble will be approximated by its average value, expressed as
where the ion density . We also consider the changes in the group velocity small—as observed in Figure 1, where the laser position does not change significantly with the modulation—and, thus, keep its value constant in the calculations. It is also observed that the maximum acceleration distance of the electron is given by , representing the distance traveled until the electron reaches the center of the smallest bubble.
As an example, we determine the aforementioned parameters for the density profile with at and calculate the corresponding electron energy. Here, the electron position in the bubble is given by , calculated by measuring the distance from the electron to the pulse front and then subtracting the maximum bubble radius. This corresponds to the position . The coordinate of the laser front is and using , the position where we calculate the bubble radius will be . The initial conditions are taken when the bubble closes, at a simulation time of with a Lorentz factor of , and the oscillation amplitude is , giving . This means the initial longitudinal velocity is . The initial electron position is given by and , while the position used for calculating the radius is . In both positions, the electron bunch is on the horizontal axis; thus, we can use the transverse momentum conservation, as shown in Equation (7). Since is not a well-defined function due to the oscillatory nature of h, direct integration is not possible. Therefore, we decompose both the field and the integral and obtain the field inside the charged sphere as
To calculate we integrate the electric field over the distance and obtain
It is worth noting that because is measured from the center of the bubble, in the opposite sense with x, which is measured in the laser propagation direction, a minus sign appears when replacing these variables in the integral. Calculating the first two terms gives
while the third term consists of a special integral of a periodic function, whose primitive is also a periodic one. This is solved with the tangent half-angle substitution method (also known as Weierstrass substitution [31]). The function is integrated over a period first by splitting it into two half-periods, and then computing the parts from the initial point to the first period, and from the last period to the final point. Thus, we have
and we integrate it over the number of periods that fit into this interval, giving
where the squared parentheses designate the integer part of the quantity. For the initial part, until the first period, we have
In the interval spanning from the final period to the end of the function, we have
with N representing the number of periods, and the total integral gives
Thus, the last term in the field integral (15) is given by
which gives
Replacing this in Equation (6), the average force gives
and we obtain , which corresponds to a kinetic energy of
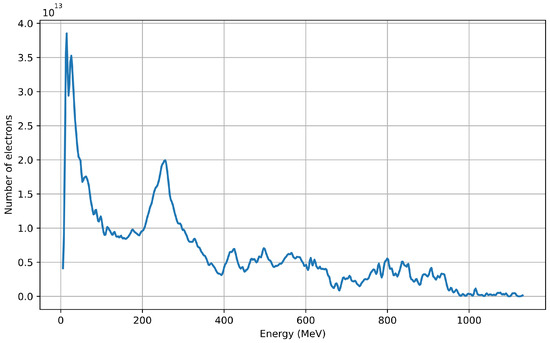
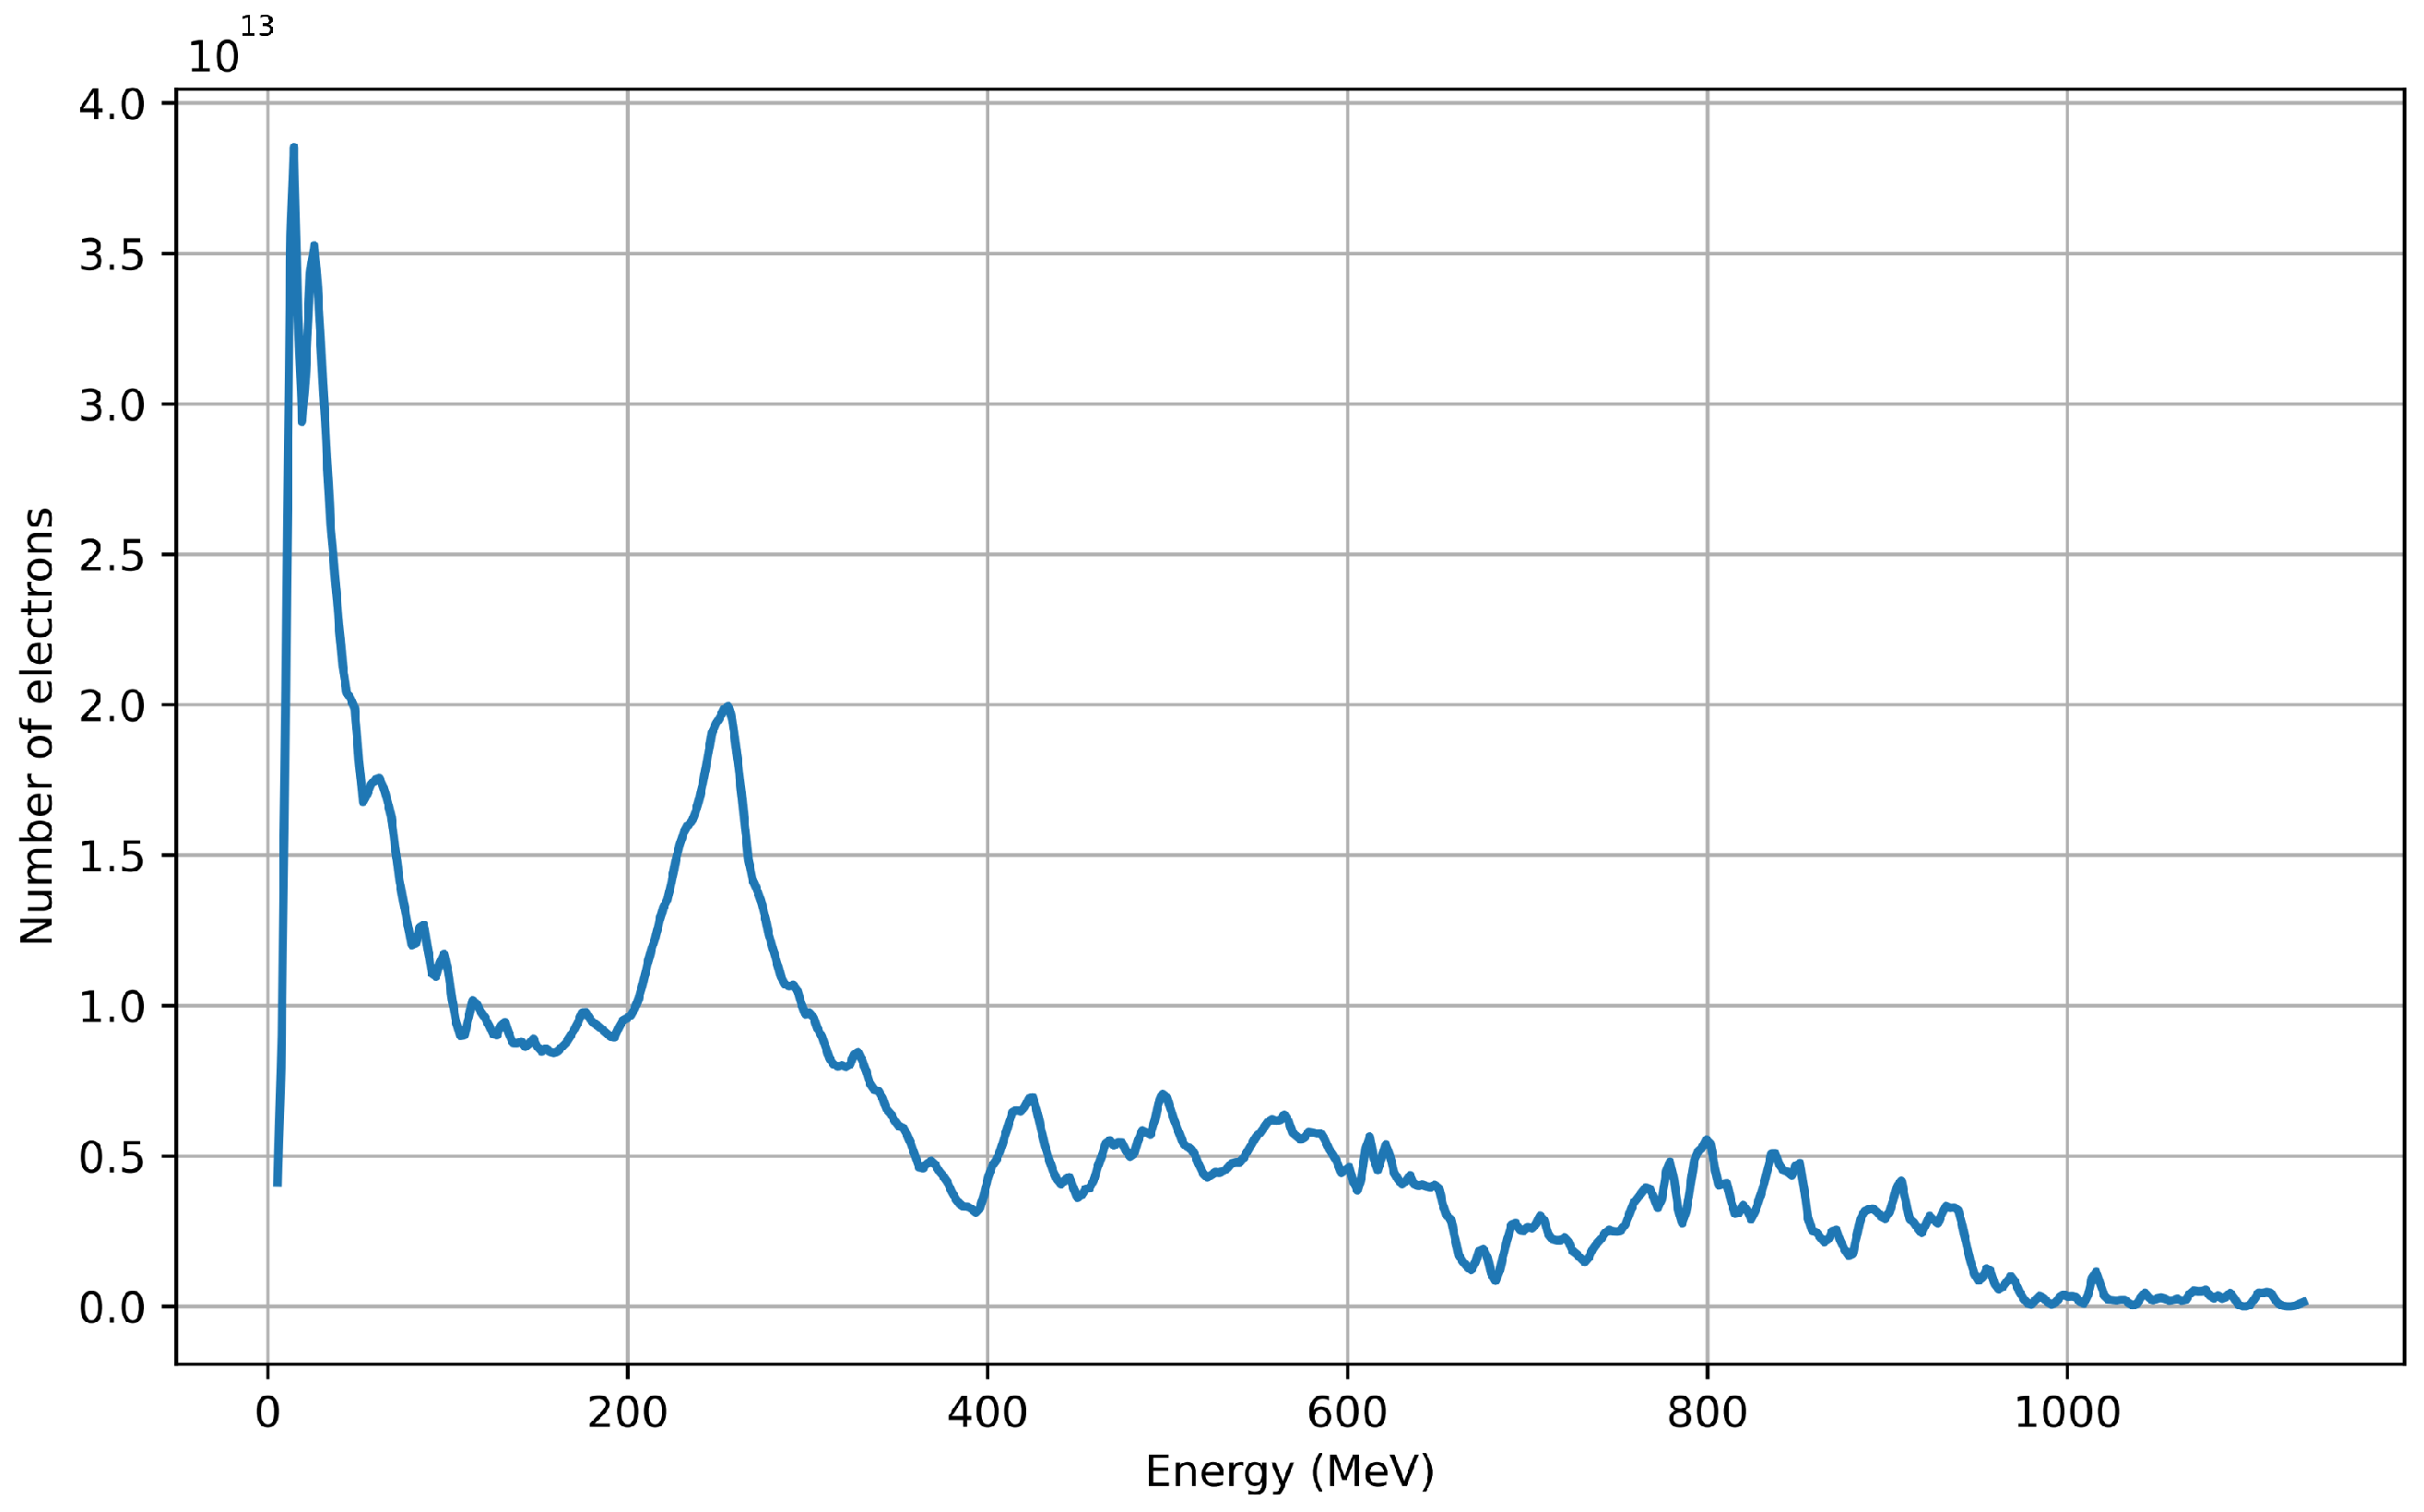
Although the simulation yields a maximum energy of approximately 1.125 GeV, the energy spectrum of the injected electrons at that position—also accounting for particle weighting in the simulation—is shown in Figure 7. This illustrates the entire bunch of injected electrons within the region bounded by and . Electrons injected later are now located near the rear of the bubble, while those injected earlier, at the bubble’s formation—as in the present calculation—are primarily found in the energy range of 700–900 MeV. A smaller group of electrons is positioned ahead of the main bunch, corresponding to higher energies within the spectrum.
Figure 7.
The energy spectrum of the self-injected electrons in the bubble for the profile with , after .
Several limitations are encountered in this analytical approach. These include the assumption that the ponderomotive force of the pulse will experience limited changes through the varying plasma density, and the modeling of the bubble as a perfect sphere, which is in practice closer to an ellipsoid, which is thinner at the rear than at the front, as well as always taking its charge density as the average value. Moreover, during the time necessary for the electrons to close the bubble, the pulse already passes a zone with different densities, which results in more electron layers near the bubble sheath. The energy losses of the electrons due to the radiation reaction force are also considered negligible. Nevertheless, with the idealized assumptions used here, the value obtained for energy is comparable with the results shown by the spectrum of the simulated electrons. Another observation regarding this model is that, using the aforementioned physical approximations, an exact analytic derivation is achievable, which avoids mathematical approximations that appear for a system not solvable analytically. Additionally, while the model is inherently three-dimensional, further limitations may arise when comparing it with the 2D simulated results, which assume invariance over the third direction. Hence, this model provides a foundational framework for further development in the derivation of the electrons’ energy in a bubble with a varying size.
4. Depletion and Dephasing in the Periodic Density Profile
The periodic plasma density profile has effects on the pump depletion length and on the dephasing length. First, we shall analyze the depletion case. In general, the depletion length is given by [5]:
This is obtained since the etching velocity, which gives the rate at which the pulse rear approaches the frontal part, is given by . The depletion length is obtained further from the time necessary for the rear to reach the frontal part of the pulse and gives . The etching velocity varies continuously with the density; thus, it is necessary to perform an average over the whole quantity. Considering also that other non-linear or local effects, mainly due to the modulated density, are less impactful, we obtain the depletion length by taking the average in the Equation (23), and it gives
Computing the same integral again, we have
where denotes the integer part of the fraction. For the case where is an integer multiple of , the first term will become
and for the case of , we have
Using this to estimate the integer part of , we find that Equation (25) is verified for the value
Thus, the depletion length is observed to grow with the modulation parameter, meaning that the portions with lower density, where the etching velocity decreases, have a prevalent effect over the areas with higher density that increase the etching velocity and thus shorten the depletion length.
We will further consider the case of the other limitation of the acceleration mechanism, namely, the dephasing length. This measures the distance traveled until the electron reaches the part of the bubble where more positive charge is behind the electron than in front; thus, the field changes to a decelerating one. This position is approximately in the middle of a bubble for a spherical bubble. We will measure this length until the center of the minimum bubble, which represents a distance of . This length is obtained by taking the bubble traveling with the group velocity over the distance and the electron traveling over at a higher velocity, which is usually approximated to c. Thus, over such an accelerating distance, the general formula for a non-varying plasma density gives
Taking into account the density modulation, we perform the average in the same manner as in the depletion case, giving
Analogously, by approximating first the dephasing length with an integer multiple of , and considering again the case with , we have
and using the integer of , Equation (30) is verified at
One reason this distance exceeds the depletion length is that it is measured up to the point where the electron reaches the center of the smallest bubble. In the region between the centers of the largest and smallest bubbles, the electron encounters oscillating energy values due to the varying electric field; thus, in practice in that area, the electron velocity will have oscillating values.
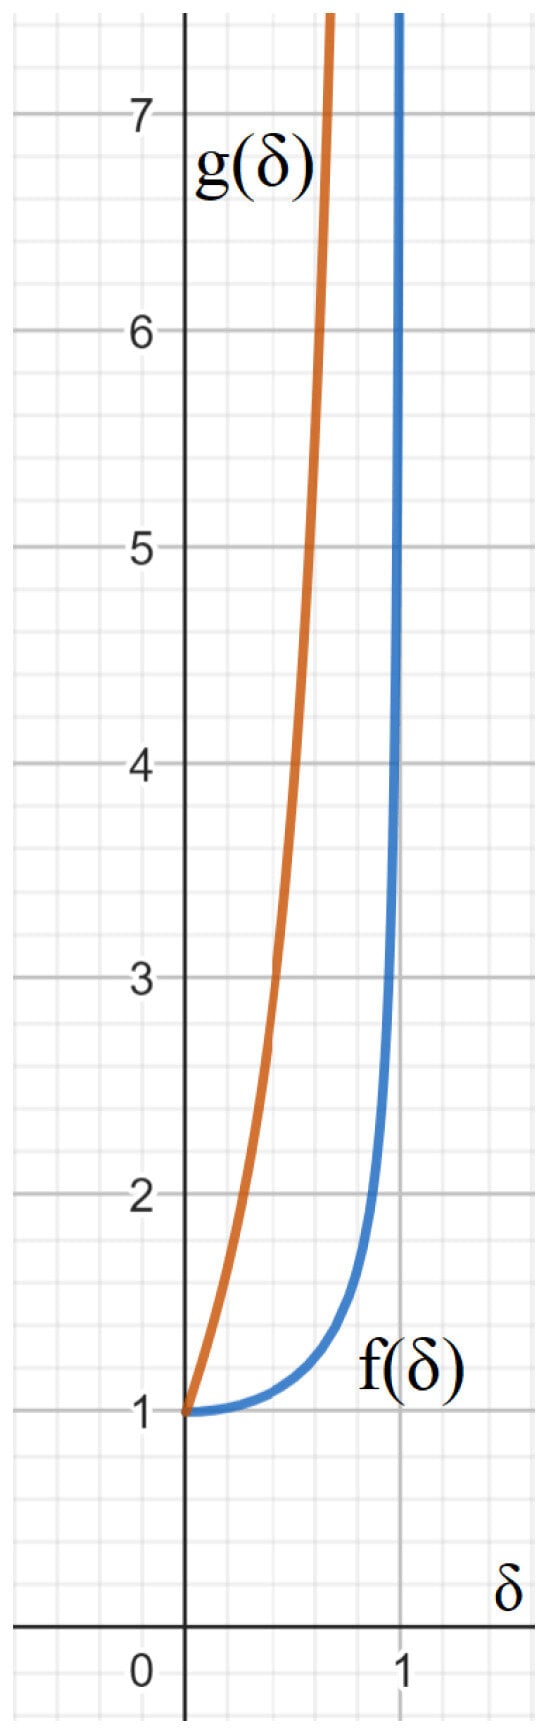
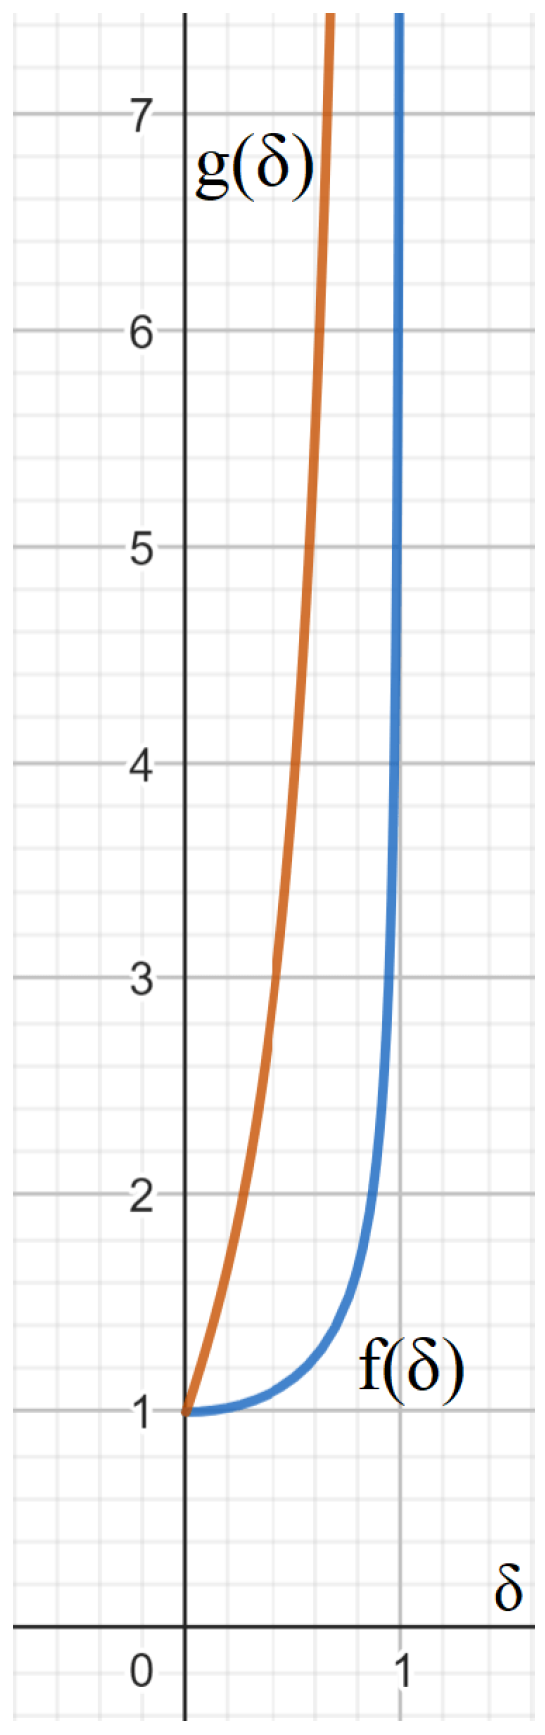
To compare the evolution of the dephasing and depletion lengths, we perform a graphical representation of the functions
which give their dependencies with parameter . In Figure 8 we illustrate the increase in both the depletion and dephasing lengths as parameter grows. For dephasing, the formation of a smaller bubble extends the effective acceleration distance, while a larger corresponds to an increased maximum bubble size. Although as approaches 1, both lengths tend to infinity, and this is physically unattainable as it would imply regions of zero plasma density. Consequently, depletion emerges as the more critical limiting factor in this regime, with the modulated density profile effectively attenuating dephasing. Moreover, the limiting effect on the accelerated electrons of the depletion length is also observed in the energy graph in Figure 5, where the energy starts to decrease after about 6.5–7 , for the case of , which is consistent with the depletion distance calculated above. It is also worth noting that, while we derive the dephasing up to the center of the smallest bubble, after the electron passes the center of the largest bubble, it experiences both accelerating and decelerating fields, resulting in oscillating energy values as shown on the same graph.
Figure 8.
The variation in the function , (blue) on the interval , for the depletion length, as it appears in the integral, and the function (orange) which appears in the formula of the dephasing length. It can be observed that although both lengths increase with , the dephasing length grows faster than the depletion length due to the term .
5. Electron Bunch Emittance
A higher amplitude of betatron oscillations implies an increase in the vertical momentum of the electrons when positioned along the horizontal axis. In this section, we analyze how the vertical emittance [32,33] of the electron bunch varies with different plasma modulation profiles. The vertical emittance is given by
where the momentum components and vertical positions of the electrons in the bunch are averaged.
To derive these, we take into consideration the particle weight, which provides the number of real particles assigned per macroparticle in the simulation. Its expression is given by , where n is the plasma density, is the hypervolume of the cell, and is the number of particles per cell. The average values for a number of N macroelectrons are given by
The results of the above quantities and the emittance in all five simulated densities are presented in Table 1, while the maps of their energy distributions are presented in Figure 9. These results were derived using a code in Python 3.13 to extract the data from the SDF file produced by the PIC code (more computational details are given in the Supplementary Material). The emittance was calculated in all cases at , for the bunches shown in Figure 9 and using boundaries of same dimension with in each case and a horizontal dimension of , which gave the intervals for , for , for , for , and for . The code also filters out the data for low-energy electrons, comprising the background electrons and lower-energy electrons behind the main bunch, thus establishing a threshold for calculating the emittance and the other parameters. Thus, the further parameters will be computed only for these regions of physical interest.
Table 1.
The emittance measured for the five densities and the three averaged parameters used in this formula. It can be observed that a higher modulation factor will result in a more compact electron bunch with a lower emittance.
Figure 9.
Electron bunches for which the emittance is computed across all modulation profiles, at a simulation time of 2.
As can be observed from their distribution, the electron bunch is more compact at higher modulation. One reason for this is the different closing of the bubble at different densities, as previously described (Section 1), resulting in the electrons being more compactly injected at higher density and thus modulation parameter due to their previous trapping in the bubble sheath. It is also worth observing that at the frontal part of the electron bunch, which is closer to the bubble center, the ionic field, which depends on this distance, will be lower, thus accelerating the electrons less. Combining this effect with the fact that along the distance of the plasma density is on a decreasing slope, this will cause the frontal part of the electron bunch to travel slower than the rear, causing a compression of the bunch. During this interval, the bubble center is also approaching the electrons due to the oscillating position of the center, thus further decreasing the field experienced by the electrons in the front compared to those in the rear. This makes the bunch more compact at higher plasma density modulation and decreases the electron bunch emittance. As seen in our results, the emittance experiences a decrease with higher modulation, achieving values characteristic of low-emittance LWFA regimes [34,35,36].
On the other hand, when the density is on an increasing slope, the electrons at the front part experience a higher field as the bunch expands longitudinally; however, this is partially compensated by the fact that closer to the bubble center, the field decreases. Overall, the bunch undergoes a compression in regions where the density decreases and a slight expansion in regions where the density increases. These effects are, however, of smaller impact due to ultrarelativistic effects, which reduce the relative velocity between electrons in the bunch.
The emittance [37] can also be represented as the area in the phase space, divided by , that is occupied by the particles of the electron beam. This area is given by the tilted ellipse that encloses these points and has the equation
Here, and are known as the Courant–Snyder (C-S) parameters [35], and they are obtained from the quantities given by the Equations (35) and (36), as
The first average over the squared distance is observed to have lower values for the modulated density compared to the non-modulated one (Table 1). The average of the ratio of momentum components is observed to decrease for the last three cases, while the last average experiences the same, also comprising negative values for the last two modulated densities.
For our simulated cases, the C-S coefficients were calculated and are given in Table 2. They are related as , and it can be observed that the values increase for and in the last three cases, while will experience its minimum and maximum values at the third and fifth cases, respectively. These show how a higher modulated profile impacts both the emittance of the electron bunch and the averaged quantities in its expression. Thus, this contributes to a broader understanding of the vertical emittance variation in the periodically modulated plasma density profile.
Table 2.
The Courant–Snyder parameters derived for the modulated densities and the obtained emittances.
Besides the emittance, other quantities significant in describing an electron bunch’s characteristics are its center energy , energy spread and its charge. We calculate these using the energy as a function of the momentum components, , as
and we also derive them using the same code. The center energy gives the mean energy of the electrons in the bunch, while the energy spread describes the energy distribution of the electrons compared to the center energy. The values are presented in Table 3, showing a decrease in the center energy and the energy spread with the increase in modulation. The decrease in energy spread is more pronounced in the last two cases, where the emittance is also lower. The electron bunch’s amount of charge also decreases in the last three cases but has increased values due to the high power of the laser and the higher density plasma, which results in more electrons on the bubble sheath, which are further trapped and injected into the bubbles.
Table 3.
The center energy , the energy spread and the charge Q of the electron bunches, measured for the five simulated cases.
Thus, we observe that in this case, a lower emittance is also correlated with a lower energy spread, showing another effect of the modulated density profile.
6. Conclusions
To summarize, we have shown in 2D PIC simulations the characteristics of the laser wakefield acceleration mechanism for a periodic plasma density profile and observed the evolution of the accelerated electrons, as well as proposed an analytical model to describe their velocity evolution and thus their energy. For this purpose, we used a model with a bubble whose center continuously varies with the plasma density and thus influences the ionic field that accelerates the electrons, which depends only on the distance from the electron to the bubble center. Based on these, the dephasing and depletion lengths were calculated for the non-linearly varying density profiles by averaging them, and we analyzed their dependence on the modulation parameter. We also investigated the injected electron bunch emittance for the five densities and computed the values of their vertical emittance. We observed a decrease in the emittance for the growth in modulation as the higher density variations in plasma will make the bunch more compact, in the region with decreasing density. We also measured the center energy and energy spread of the electron bunches, showing more compact energy distributions in the last two cases.
Supplementary Materials
The following supporting information can be downloaded at https://www.mdpi.com/article/10.3390/plasma9020012/s1.
Author Contributions
Conceptualization, R.I. and C.M.T.; methodology, R.I. and C.M.T.; software, R.P.D., E.I.S., and A.C.G.; validation, R.I. and C.M.T.; formal analysis, R.I.; investigation, R.I.; resources, R.P.D., E.I.S., and A.C.G.; data curation, R.I., C.M.T., R.P.D., E.I.S., and A.C.G.; writing—original draft preparation, R.I. and C.M.T.; writing—review and editing, R.I. and C.M.T.; visualization, R.I., C.M.T., R.P.D., E.I.S., and A.C.G.; supervision, R.I. and C.M.T. All authors have read and agreed to the published version of the manuscript.
Funding
This work was supported by the PN 23 21 01 05 contract funded by the Romanian Ministry of Research, Innovation and Digitalization, the ELI-RO-19 project funded by IFA and the IOSIN funds for research infrastructures of national interest.
Data Availability Statement
The data is contained in the manuscript.
Acknowledgments
The authors thank the National University of Science and Technology Politehnica Bucharest for allowing us to use its computational infrastructure for the simulations.
Conflicts of Interest
The authors declare no conflicts of interest.
References
- Tajima, T.; Dawson, J.M. Laser electron accelerator. Phys. Rev. Lett. 1979, 43, 267. [Google Scholar] [CrossRef] [Scilit]
- Lu, W.; Tzoufras, M.; Joshi, C.; Tsung, F.; Mori, W.; Vieira, J.; Fonseca, R.; Silva, L. Generating multi-GeV electron bunches using single stage laser wakefield acceleration in a 3D nonlinear regime. Phys. Rev. Spec. Top.-Accel. Beams 2007, 10, 061301. [Google Scholar] [CrossRef] [Scilit]
- Clayton, C.E.; Ralph, J.; Albert, F.; Fonseca, R.; Glenzer, S.; Joshi, C.; Lu, W.; Marsh, K.; Martins, S.F.; Mori, W.B.; et al. Self-guided laser wakefield acceleration beyond 1 GeV using ionization-induced injection. Phys. Rev. Lett. 2010, 105, 105003. [Google Scholar] [CrossRef] [Scilit]
- Sadler, J.D.; Arran, C.; Li, H.; Flippo, K.A. Overcoming the dephasing limit in multiple-pulse laser wakefield acceleration. Phys. Rev. Accel. Beams 2020, 23, 021303. [Google Scholar] [CrossRef] [Scilit]
- Debus, A.; Pausch, R.; Huebl, A.; Steiniger, K.; Widera, R.; Cowan, T.E.; Schramm, U.; Bussmann, M. Circumventing the dephasing and depletion limits of laser-wakefield acceleration. Phys. Rev. X 2019, 9, 031044. [Google Scholar] [CrossRef] [Scilit]
- Kostyukov, I.; Pukhov, A.; Kiselev, S. Phenomenological theory of laser-plasma interaction in “bubble” regime. Phys. Plasmas 2004, 11, 5256–5264. [Google Scholar] [CrossRef] [Scilit]
- Kalmykov, S.; Yi, S.; Khudik, V.; Shvets, G. Electron self-injection and trapping into an evolving plasma bubble. Phys. Rev. Lett. 2009, 103, 135004. [Google Scholar] [CrossRef] [Scilit] [PubMed]
- Jain, A.; Yoffe, S.R.; Ersfeld, B.; Holt, G.K.; Gupta, D.N.; Jaroszynski, D.A. The effect of laser pulse evolution on down-ramp injection in laser wakefield accelerators. Sci. Rep. 2024, 14, 19127. [Google Scholar] [CrossRef] [Scilit] [PubMed]
- Gopal, K.; Gupta, D.N.; Suk, H. Pulse-length effect on laser wakefield acceleration of electrons by skewed laser pulses. IEEE Trans. Plasma Sci. 2021, 49, 1152–1158. [Google Scholar] [CrossRef] [Scilit]
- Jain, A.; Gupta, D.N. Optimization of electron bunch quality using a chirped laser pulse in laser wakefield acceleration. Phys. Rev. Accel. Beams 2021, 24, 111302. [Google Scholar] [CrossRef] [Scilit]
- Fourmaux, S.; Corde, S.; Phuoc, K.T.; Leguay, P.; Payeur, S.; Lassonde, P.; Gnedyuk, S.; Lebrun, G.; Fourment, C.; Malka, V.; et al. Demonstration of the synchrotron-type spectrum of laser-produced Betatron radiation. New J. Phys. 2011, 13, 033017. [Google Scholar] [CrossRef] [Scilit]
- Cipiccia, S.; Islam, M.R.; Ersfeld, B.; Shanks, R.P.; Brunetti, E.; Vieux, G.; Yang, X.; Issac, R.C.; Wiggins, S.M.; Welsh, G.H.; et al. Gamma-rays from harmonically resonant betatron oscillations in a plasma wake. Nat. Phys. 2011, 7, 867–871. [Google Scholar] [CrossRef] [Scilit]
- Sharma, V.; Thakur, V. Lasers wakefield acceleration in underdense plasma with ripple plasma density profile. J. Opt. 2023, 55, 14–18. [Google Scholar] [CrossRef] [Scilit]
- Ke, L.; Yu, C.; Feng, K.; Qin, Z.; Jiang, K.; Wang, H.; Luan, S.; Yang, X.; Xu, Y.; Leng, Y.; et al. Optimization of electron beams based on plasma-density modulation in a laser-driven wakefield accelerator. Appl. Sci. 2021, 11, 2560. [Google Scholar] [CrossRef] [Scilit]
- Pukhov, A.; Kostyukov, I. Control of laser-wakefield acceleration by the plasma-density profile. Phys. Rev. E—Stat. Nonlinear Soft Matter Phys. 2008, 77, 025401. [Google Scholar] [CrossRef] [Scilit] [PubMed]
- Aniculaesei, C.; Pathak, V.B.; Kim, H.T.; Oh, K.H.; Yoo, B.J.; Brunetti, E.; Jang, Y.H.; Hojbota, C.I.; Shin, J.H.; Jeon, J.H.; et al. Electron energy increase in a laser wakefield accelerator using up-ramp plasma density profiles. Sci. Rep. 2019, 9, 11249. [Google Scholar] [CrossRef] [Scilit]
- Tooley, M.; Ersfeld, B.; Yoffe, S.; Noble, A.; Brunetti, E.; Sheng, Z.; Islam, M.; Jaroszynski, D. Towards attosecond high-energy electron bunches: Controlling self-injection in laser-wakefield accelerators through plasma-density modulation. Phys. Rev. Lett. 2017, 119, 044801. [Google Scholar] [CrossRef] [Scilit] [PubMed]
- Hansson, M.; Senje, L.; Persson, A.; Lundh, O.; Wahlström, C.G.; Desforges, F.; Ju, J.; Audet, T.; Cros, B.; Dobosz Dufrénoy, S.; et al. Enhanced stability of laser wakefield acceleration using dielectric capillary tubes. Phys. Rev. Spec. Top.-Accel. Beams 2014, 17, 031303. [Google Scholar] [CrossRef] [Scilit]
- Paradkar, B.; Cros, B.; Mora, P.; Maynard, G. Numerical modeling of multi-GeV laser wakefield electron acceleration inside a dielectric capillary tube. Phys. Plasmas 2013, 20, 083120. [Google Scholar] [CrossRef] [Scilit]
- Yoon, S.; Palastro, J.; Milchberg, H. Quasi-phase-matched laser wakefield acceleration. Phys. Rev. Lett. 2014, 112, 134803. [Google Scholar] [CrossRef] [Scilit]
- Sedaghat, M.; Amouye Foumani, A.; Niknam, A. Controlling the characteristics of injected and accelerated electron bunch in corrugated plasma channel by temporally asymmetric laser pulses. Sci. Rep. 2022, 12, 8115. [Google Scholar] [CrossRef] [Scilit] [PubMed]
- Gupta, D.; Gopal, K.; Nam, I.; Kulagin, V.; Suk, H. Laser wakefield acceleration of electrons from a density-modulated plasma. Laser Part. Beams 2014, 32, 449–454. [Google Scholar] [CrossRef] [Scilit]
- Sedaghat, M.; Barzegar, S.; Niknam, A. Quasi-phase-matched laser wakefield acceleration of electrons in an axially density-modulated plasma channel. Sci. Rep. 2021, 11, 15207. [Google Scholar] [CrossRef] [Scilit]
- Gupta, D.N.; Nam, I.H.; Suk, H. Laser-driven plasma beat-wave propagation in a density-modulated plasma. Phys. Rev. E—Stat. Nonlinear Soft Matter Phys. 2011, 84, 056403. [Google Scholar] [CrossRef] [Scilit]
- Iovănescu, R.; Daia, R.P.; Sluşanschi, E.I.; Ticoş, C.M. Electron Filament Structures of Injected Electrons in LWFA. IEEE Trans. Plasma Sci. 2025, 53, 780–787. [Google Scholar] [CrossRef] [Scilit]
- Rechatin, C.; Davoine, X.; Lifschitz, A.; Ismail, A.B.; Lim, J.; Lefebvre, E.; Faure, J.; Malka, V. Observation of beam loading in a laser-plasma accelerator. Phys. Rev. Lett. 2009, 103, 194804. [Google Scholar] [CrossRef] [Scilit]
- Arber, T.; Bennett, K.; Brady, C.; Lawrence-Douglas, A.; Ramsay, M.; Sircombe, N.; Gillies, P.; Evans, R.; Schmitz, H.; Bell, A.; et al. Contemporary particle-in-cell approach to laser-plasma modelling. Plasma Phys. Control. Fusion 2015, 57, 113001. [Google Scholar] [CrossRef] [Scilit]
- Bennett, K.; Brady, C.; Schmitz, H.; Ridgers, C.; Arber, T.; Evans, R.; Bell, T. Users Manual for the EPOCH PIC Codes; University of Warwick: Coventry, UK, 2017. [Google Scholar]
- Iovănescu, R.; Daia, R.P.; Slușanschi, E.I.; Ticoș, C.M. Optimisation of particle-in-cell simulations for laser wakefield acceleration. Univ. Politeh. Buchar. Sci. Bull.-Ser. A-Appl. Math. Phys. 2023, 85, 159–166. [Google Scholar]
- Mangles, S. Introduction to Wakefield Acceleration. Available online: https://indico.cern.ch/event/1192266/contributions/5012569/attachments/2543655/4379917/Wakefield_intro.pdf (accessed on 10 August 2024).
- Eberlein, W. The circular function (s). Math. Mag. 1966, 39, 197–201. [Google Scholar] [CrossRef]
- Floettmann, K. Some basic features of the beam emittance. Phys. Rev. Spec. Top. Beams 2003, 6, 034202. [Google Scholar] [CrossRef] [Scilit]
- Kubo, K.; Akemoto, M.; Anderson, S.; Aoki, T.; Araki, S.; Bane, K.; Blum, P.; Corlett, J.; Dobashi, K.; Emma, P.; et al. Extremely low vertical-emittance beam in the Accelerator Test Facility at KEK. Phys. Rev. Lett. 2002, 88, 194801. [Google Scholar] [CrossRef] [Scilit]
- Sears, C.M.; Buck, A.; Schmid, K.; Mikhailova, J.; Krausz, F.; Veisz, L. Emittance and divergence of laser wakefield accelerated electrons. Phys. Rev. Spec. Top. Beams 2010, 13, 092803. [Google Scholar] [CrossRef] [Scilit]
- Weingartner, R.; Raith, S.; Popp, A.; Chou, S.; Wenz, J.; Khrennikov, K.; Heigoldt, M.; Maier, A.R.; Kajumba, N.; Fuchs, M.; et al. Ultralow emittance electron beams from a laser-wakefield accelerator. Phys. Rev. Spec. Top. Beams 2012, 15, 111302. [Google Scholar] [CrossRef] [Scilit]
- Guan, J.; Lei, Q.; Zhong, J.; Liu, L.; Nie, Y.; Xia, G.; Wang, J. Achieving high quality electron beam with ultralow energy spread from mismatched plasma channels. Sci. Rep. 2025, 15, 11774. [Google Scholar] [CrossRef] [Scilit]
- Kneip, S.; McGuffey, C.; Martins, J.L.; Bloom, M.S.; Chvykov, V.; Dollar, F.; Fonseca, R.; Jolly, S.; Kalintchenko, G.; Krushelnick, K.; et al. Characterization of transverse beam emittance of electrons from a laser-plasma wakefield accelerator in the bubble regime using betatron x-ray radiation. Phys. Rev. Spec. Top. Beams 2012, 15, 021302. [Google Scholar] [CrossRef] [Scilit]

Disclaimer/Publisher’s Note: The statements, opinions and data contained in all publications are solely those of the individual author(s) and contributor(s) and not of MDPI and/or the editor(s). MDPI and/or the editor(s) disclaim responsibility for any injury to people or property resulting from any ideas, methods, instructions or products referred to in the content. |
© 2026 by the authors. Licensee MDPI, Basel, Switzerland. This article is an open access article distributed under the terms and conditions of the Creative Commons Attribution (CC BY) license.