


Abstract
The structural response of ceramics to extreme deformation is of significant scientific and technological relevance since such conditions are commonly encountered during both processing and service. In this study, monoclinic zirconia was subjected to high-energy ball milling for extended durations of 80 h and 120 h, followed by annealing at 1000 °C. X-ray diffraction revealed a progressive increase in the tetragonal phase content with milling duration, while subsequent annealing promoted its consolidation alongside the principal monoclinic phase, resulting in a stable biphasic structure. The phase evolution is also evaluated through a Raman spectroscopy analysis and correlated with the morphology, mechanical properties, and surface area analyses. Scanning electron microscopy confirmed the preservation of nanoscale features in the milled and annealed specimens, in contrast to the unmilled sample, which exhibited pronounced grain coarsening. The combined presence of nanostructural stability and biphasic phase constitution underscores the efficacy of high-energy ball milling, in conjunction with thermal treatment, as an effective strategy to tailor the microstructure and phase stability of zirconia ceramics for advanced engineering applications.
1. Introduction
Advanced ceramics have emerged as indispensable materials for applications that demand exceptional mechanical, thermal, and chemical stability under extreme operating environments [1,2,3]. Their widespread integration into aerospace propulsion systems, high-temperature energy conversion devices, cutting tools, and biomedical implants stems from their ability to retain performance over long service lifetimes, where metallic alloys or polymers fail [4,5]. Among these, zirconia (ZrO2) stands out as a material of enduring technological and scientific interest, combining high fracture toughness for a ceramic, excellent wear resistance, low thermal conductivity, and corrosion resistance [6,7,8,9]. These attributes have enabled their deployment in structural components, thermal barrier coatings, solid oxide fuel cells, oxygen sensors, and dental restorations [4,10,11,12].
The versatility of ZrO2 is rooted in its polymorphic nature. At ambient pressure, it exists in three principal crystalline modifications: the monoclinic phase (m-ZrO2), stable from room temperature to ~1170 °C; the tetragonal phase (t-ZrO2), stable up to ~2370 °C; and the cubic phase (c-ZrO2), stable to the melting point at ~2680 °C [13,14]. Transitions between these phases are martensitic in nature and involve volume changes that can generate beneficial transformation toughening or cause detrimental microcracking, depending on the context [13,15]. While phase stability is classically considered a function of temperature and composition (e.g., dopants such as Y2O3 or CeO2), it is now well established that mechanical and microstructural factors, such as grain size, defect density, and internal stresses, play equally critical roles [16,17,18].
Mechanical activation through high-energy ball milling is a particularly effective means of altering the structural state of ZrO2. Repeated fracturing and cold-welding events during milling generate a high density of lattice defects, accumulate significant micro strain, and reduce crystallite sizes to the nanometer regime [19,20]. In many oxide ceramics, such intense mechanical processing can induce disordering, partial amorphization, or even polymorphic transformations without the application of external heat. For zirconia, prolonged milling has been reported to destabilize the monoclinic phase, thereby promoting transitions toward tetragonal or cubic symmetry, depending on the severity of the deformation and the presence of impurities or stabilizers. The resulting microstructures are often highly metastable, with thermodynamic and kinetic characteristics that differ substantially from conventionally processed material [21]. Further, post-processing, such as sintering and densification, is also known to impact the microstructures and properties of ZrO2 powders [22].
Further, annealing such mechanically activated powders offers a means to probe and control the stability of these nonequilibrium states. Upon heating, stored strain energy can be released through recovery and recrystallization, accompanied by defect annihilation and grain coarsening. In zirconia, this process may also involve phase reversion to the equilibrium monoclinic form or further transformation toward higher-symmetry structures, if thermodynamically favored [14]. The interplay between the initial defect structure generated by prolonged milling and the subsequent thermal evolution determines the final phase composition and microstructural features. Despite numerous studies on mechanically induced phase transformations in ZrO2, a comprehensive understanding of how extended mechanical activation interacts with annealing in undoped m-ZrO2, particularly in the regime of extreme deformation, remains incomplete. In our previous work, we reported on the structural and catalytic property evolutions in ball-milled monoclinic ZrO2, and showed that milling the samples for ~40 h initiates the tetragonal phase formation [20]. It would be interesting to see the evolution of the structure with ball milling beyond 40 h, as well as further changes with annealing, which could help understand the behavior of strained crystals at extreme deformation.
This knowledge gap is significant for both fundamental and applied reasons. Fundamentally, ZrO2 represents a model ceramic system for studying the energetics of phase stability under far-from-equilibrium conditions. From an application standpoint, tailoring ZrO2 microstructures through controlled mechanical–thermal processing could enable optimization of properties such as toughness, thermal conductivity, and dimensional stability, all of which are crucial for high-performance components in harsh environments [3,14]. For example, in thermal barrier coatings, controlling the phase composition and defect content directly influences the thermal cycling resistance; in biomedical implants, phase stability impacts long-term reliability in vivo [4,5].
The present work is motivated by the need to elucidate the structural evolution of monoclinic ZrO2 under conditions of prolonged high-energy ball milling followed by systematic annealing. Specifically, the objectives are as follows: firstly, to investigate the extent of crystallite refinement and phase modification in m-ZrO2 subjected to extended milling durations; and, secondly, to examine the recovery, recrystallization, and phase stability of the severely deformed microstructure upon annealing at a high temperature. By correlating microstructural and phase evolution with processing history, this study seeks to provide deeper insight into the synergistic effects of mechanical and thermal processing on ZrO2,, and the outcomes are expected to contribute toward the rational design of ZrO2-based ceramics with controlled defect structures and enhanced functional performance.
2. Materials and Methods
2.1. Materials
Zirconium dioxide (ZrO2, purity of 99.5%) and ethanol (C2H6O, purity of 99.9%) were purchased from M/s Loba Chemie Pvt, Ltd. Mumabi, Maharashtra, India. Chemicals were used without further purification.
2.2. Ball Milling
ZrO2 powder was milled using a Fritsch Pulverisette 6 planetary ball mill equipped with a ZrO2 jar and balls. In each run, 1 g of powder was placed in a 45 mL jar along with 10 g of balls, maintaining a ball-to-powder weight ratio (BPR) of 10:1. About 1 mL of ethanol was added as a process control agent (PCA). The milling was carried out at a rotational speed of 400 rpm for 80 h and 120 h. To avoid excessive heat generation, the operation was executed in cycles of 15 min of milling followed by 5 min of rest throughout the process. The unmilled, 80 h, and 120 h milled samples are termed as 0h-B, 80h-B, and 120h-B, respectively.
2.3. Annealing
A small quantity of the unmilled and milled ZrO2 powder was compacted into pellets using a hydraulic uniaxial pelletizer. Each pellet had a diameter of 12.7 mm and a thickness of approximately 1 mm. The pellets were then subjected to annealing in a furnace (box type) at a temperature of 1000 °C for a duration of 1 h, chosen to enable effective strain relaxation and phase stabilization while remaining below the equilibrium monoclinic-to-tetragonal transformation temperature (~1170 °C) of ZrO2. After completion of the holding period, the furnace was allowed to cool naturally to room temperature. The samples thus received are termed as 0h-A, 80h-A, and 120h-A, as per their milling durations.
2.4. Spark Plasma Sintering
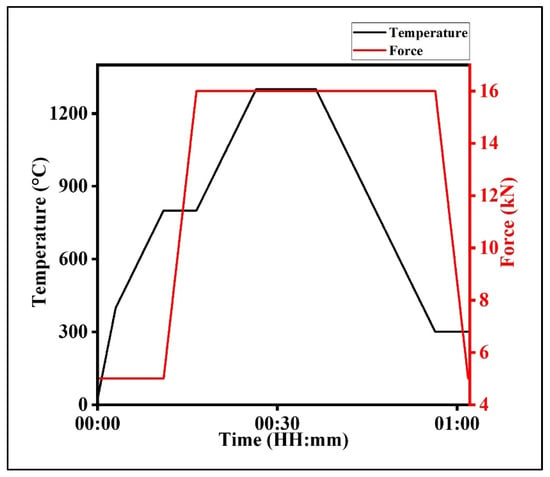
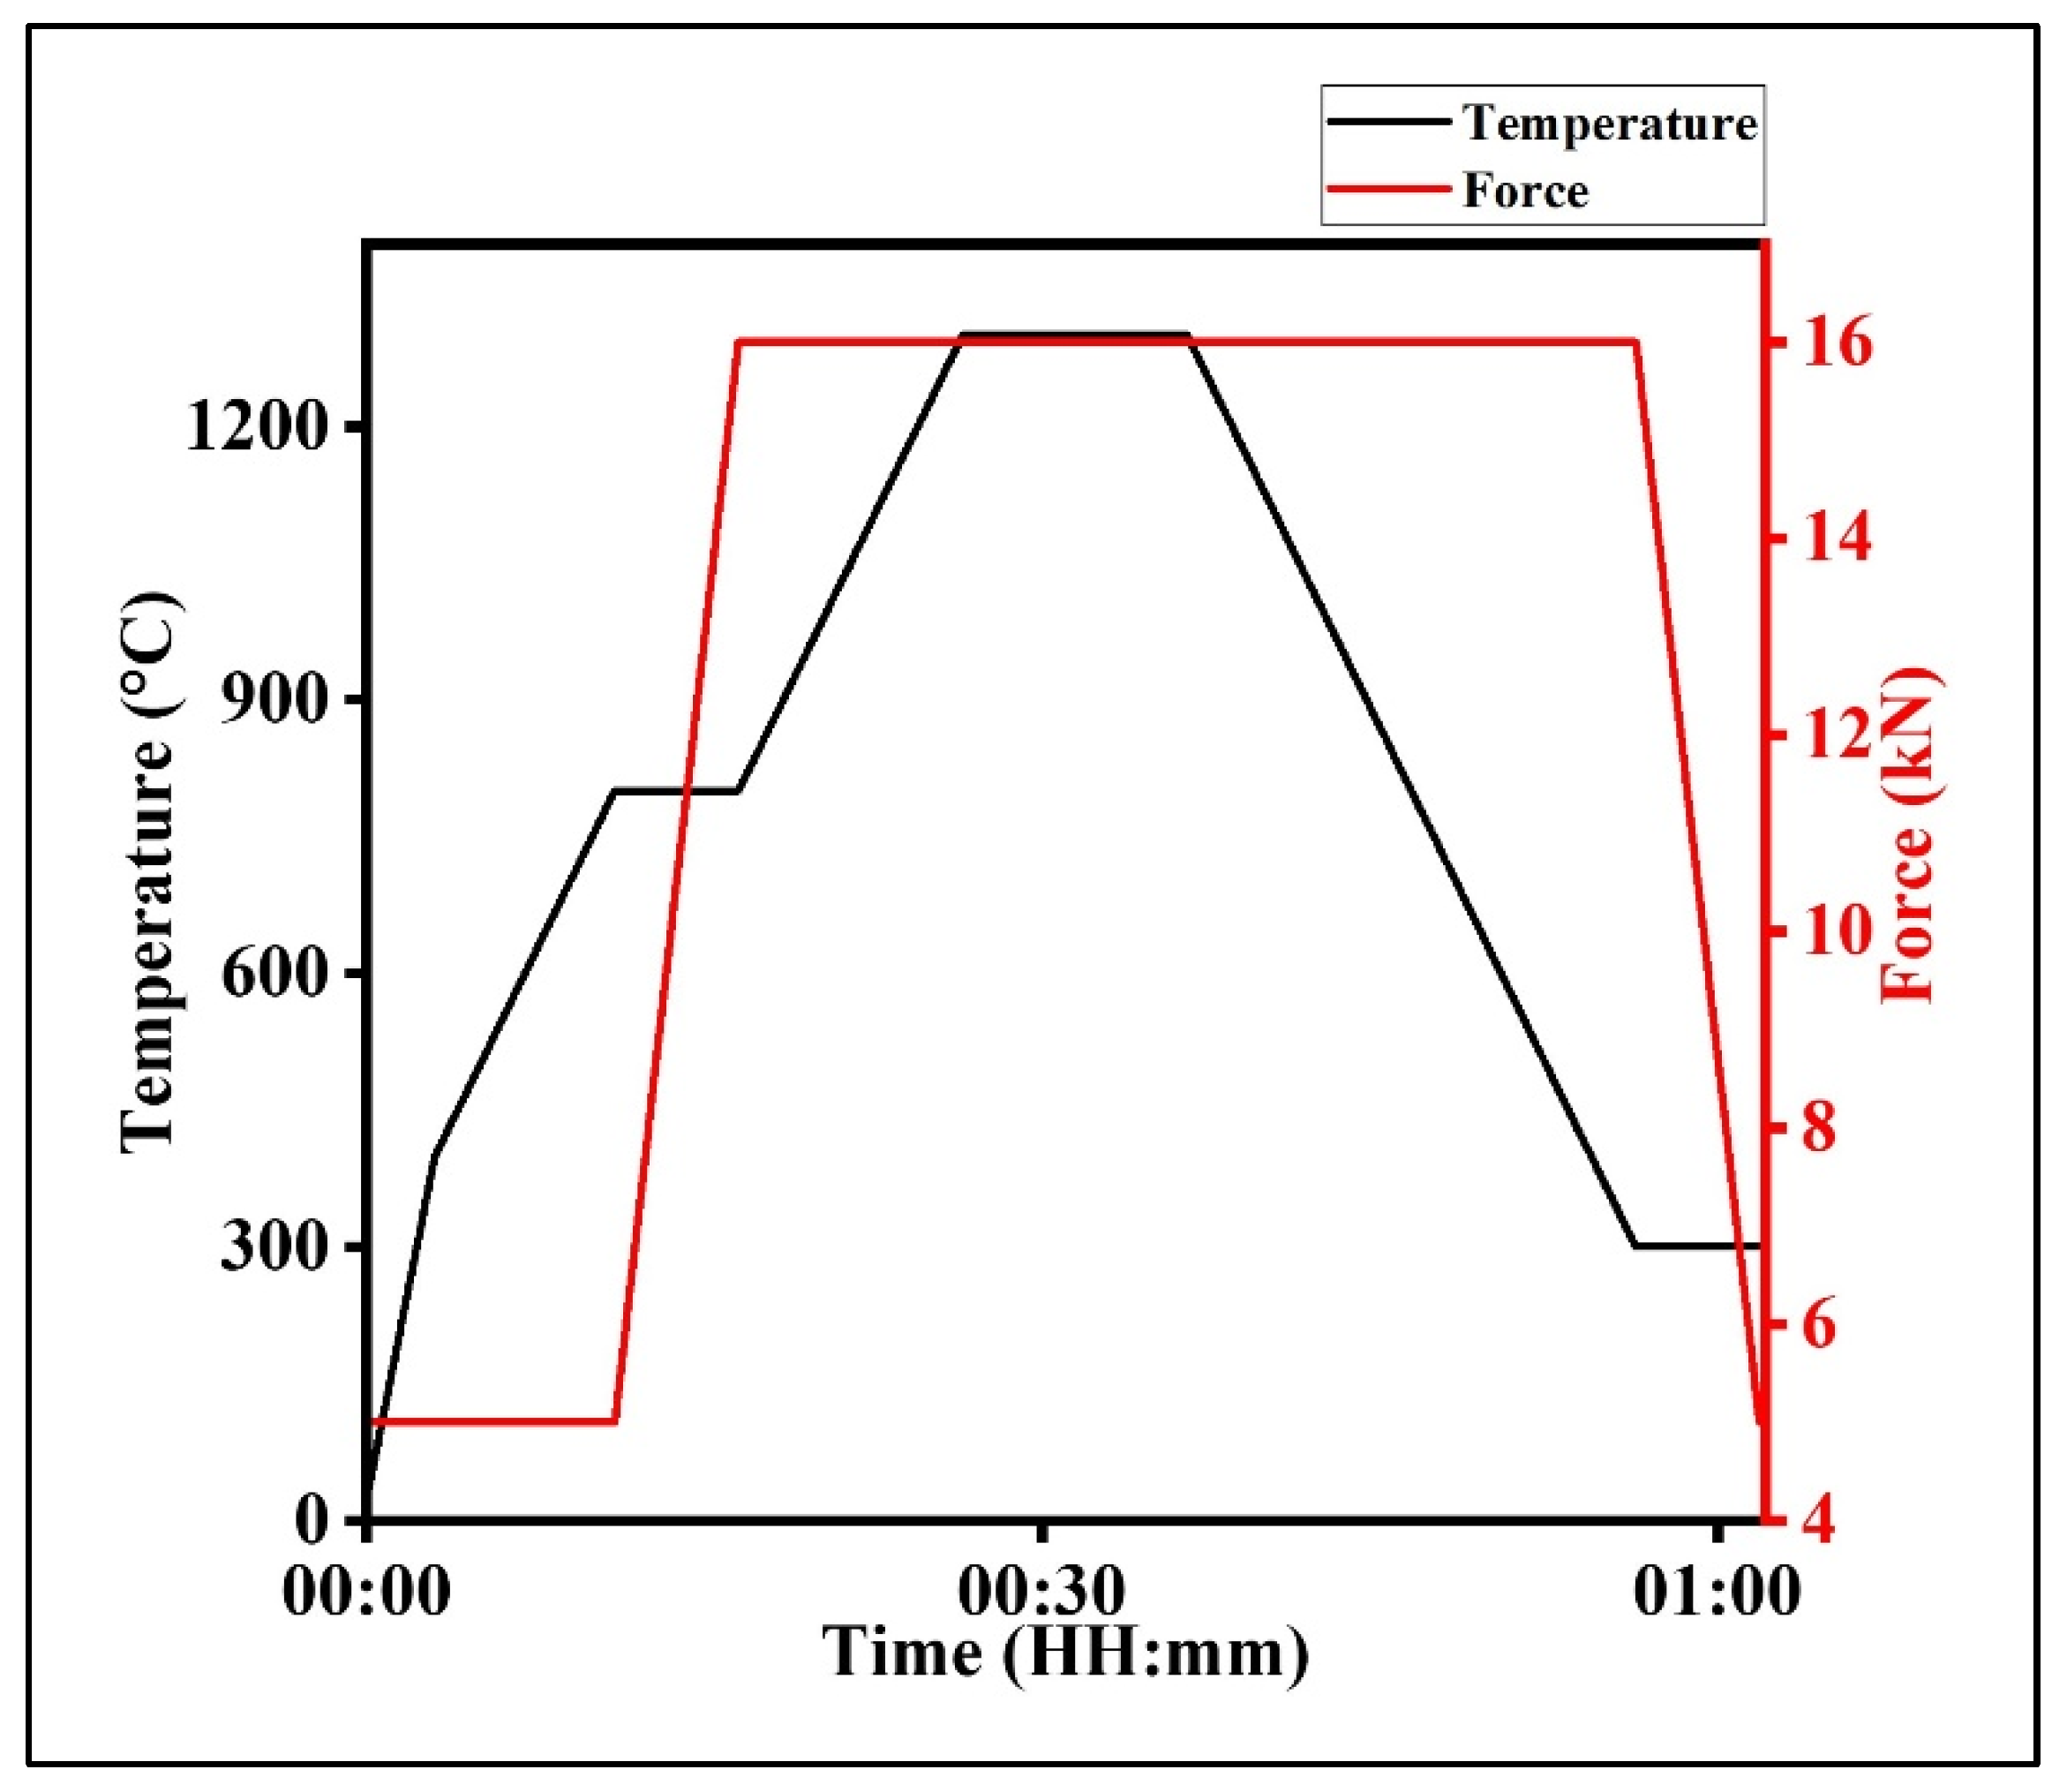
Further, for the evaluation of mechanical properties, the samples 0h-B and 120h-B were consolidated by spark plasma sintering (SPS) using a Dr. Fritsch LSP 45 instrument. For the consolidation, the powder was initially loaded into a 20 mm diameter graphite die lined with graphite foil. Sintering was carried out under a uniaxial pressure of ~50 MPa. The samples were heated at a rate of 50 °C/min, while the pressure was applied at a rate of 2 kN min−1. The uniaxial pressure was applied from 800 °C onwards, as accurate pyrometer alignment becomes unreliable beyond this temperature due to the glow of the graphite die. The SPS temperature–time profile and processing parameters are shown in Figure 1. The sintering was carried out at 1300 °C with a dwell time of 10 min. After the dwell period, the samples were cooled to room temperature at the same rate, with the applied pressure released at the same rate as during loading. The sintered specimens were polished to remove the graphite foil and used for further analysis.
Figure 1.
Spark plasma sintering (SPS) temperature–time profile and processing conditions: maximum temperature 1300 °C, applied load 16 kN, and holding time 10 min.
2.5. Characterization
To assess the phase and microstructural changes in monoclinic ZrO2 by extended ball milling and subsequent annealing, an X-ray diffraction (XRD) analysis was carried out in a Rigaku Ultima IV instrument for a 2θ range of 20–80°, at a scan rate of 1°/min and a step size of 0.02, to identify phase transformation and changes in the crystallite size. A further Rietveld analysis of the samples was carried out using FULLPROF to quantify the microstructural parameters [23]. A scanning electron microscopy (SEM) morphological analysis to examine the evolution of surface morphology and particle size was carried out with a ZEISS Ultra Plus Scanning Electron Microscope, and elemental composition and homogeneity were analyzed with an energy-dispersive spectroscopy (EDS) system made by Oxford Instruments fitted within the SEM. Fourier transform infrared spectroscopy was performed on a JASCO FT/IR-4X at a resolution of 4 cm−1 to identify functional groups. Raman spectroscopy was performed using a Technos Instruments (Jaipur, Rajasthan, India) make Micro Raman spectrometer (IndiRAM CTR-500C) operated with a 532 nm excitation laser. Specific surface area and porosity were determined by the Brunauer–Emmett–Teller (BET) nitrogen adsorption measurements with BELSORP-mini-X. Thermal stability and phase-related thermal events were investigated using simultaneous thermogravimetric analysis (TGA) and differential scanning calorimetry (DSC) with the Hitachi STA-7200 thermal analysis system. The density of the spark plasma sintered specimens was measured using Archimedes’ principle with a Contech analytical balance (accuracy: 0.0001 g) and distilled water as the immersion medium. Hardness measurements were carried out using a MATSUZAWA-MMT–X Vickers microhardness testing instrument using a load of 200 g and a dwell time of 20 s.
3. Results and Discussion
3.1. Understanding Phase Evolution Through XRD Analysis
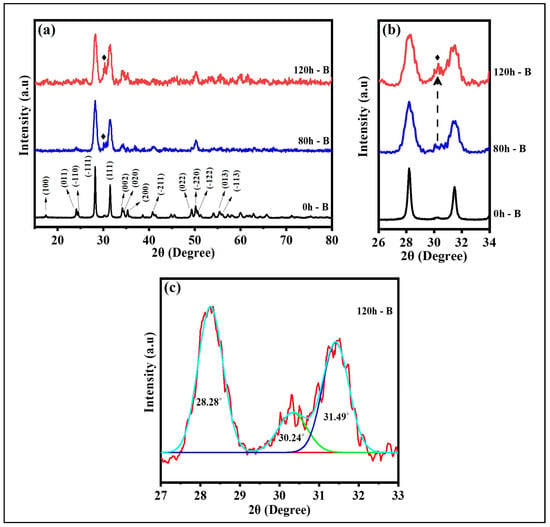
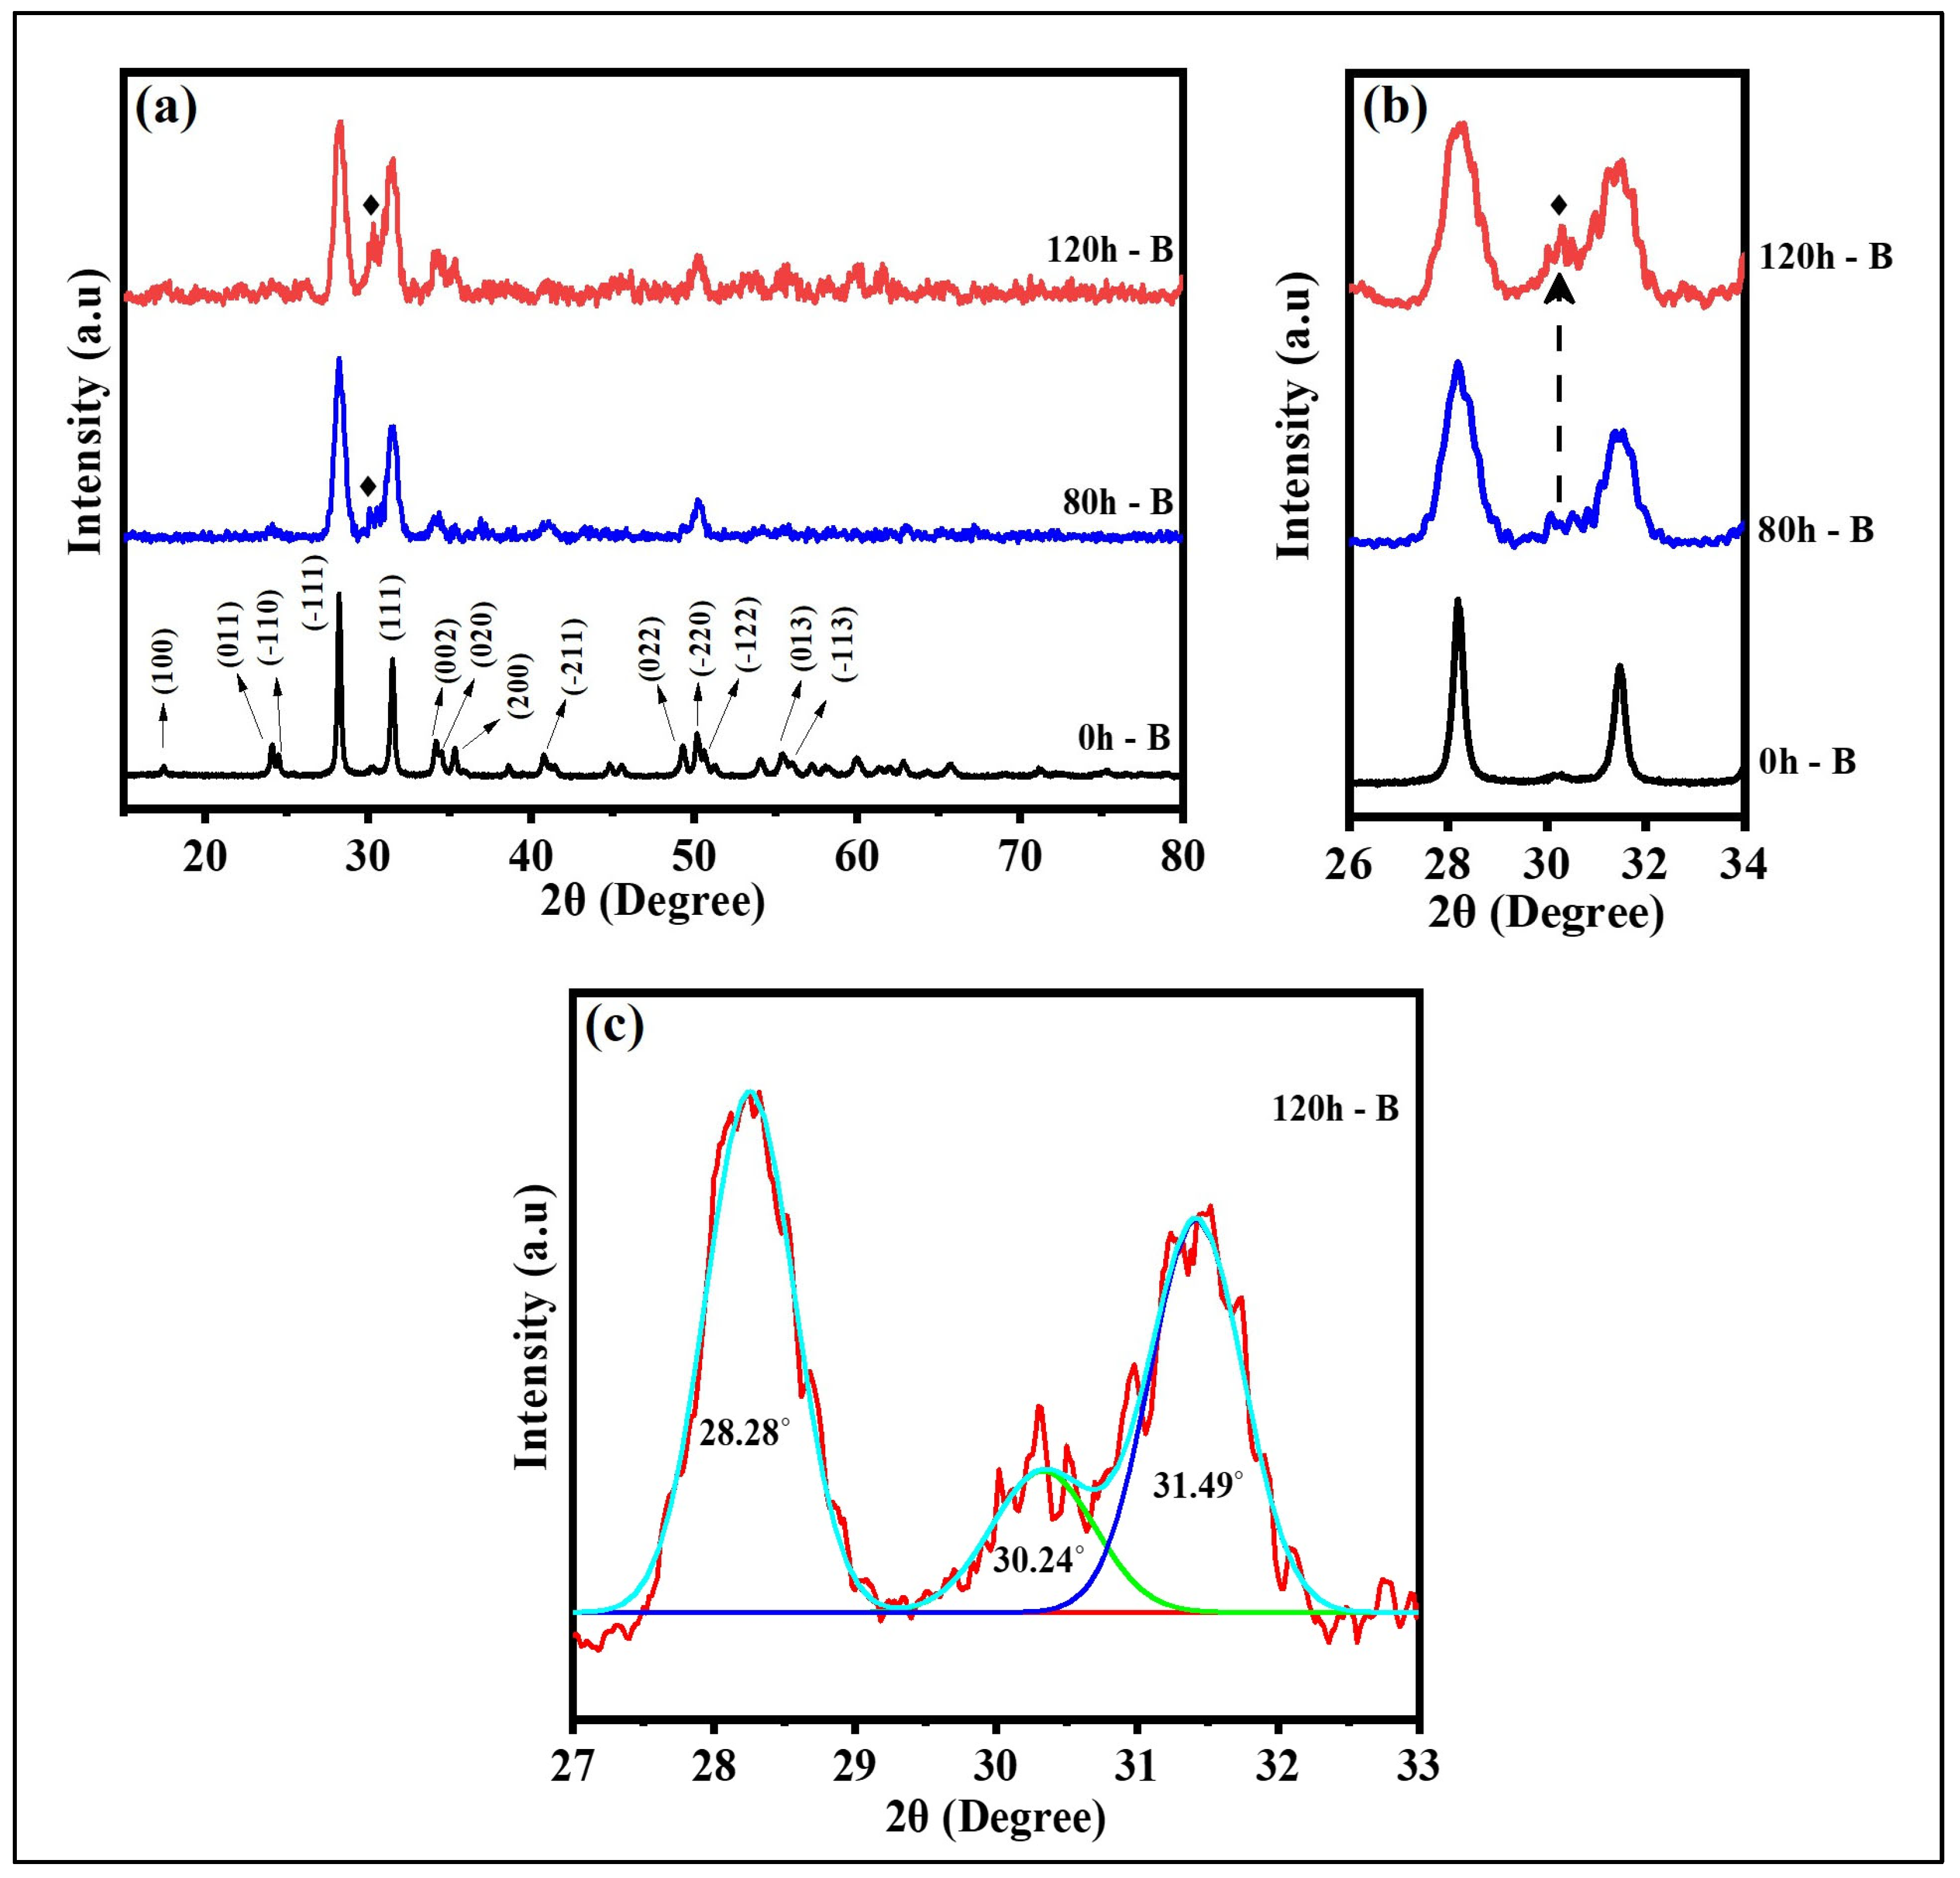
The X-ray diffractograms in Figure 2a illustrate the structural modifications in unmilled and milled ZrO2. The 0h-B sample exhibits sharp and well-defined peaks characteristic of monoclinic ZrO2 (ICDD # 00-036-0420), as shown in Figure 1. After 80 h of ball milling, the diffraction peaks broaden considerably, and the peaks with low intensity start to vanish. Notably, a new peak emerges near ≈30.24° (♦), which was absent in the 0h-B sample, as can be seen clearly in Figure 2b. A comparison with the standard data indicates that this peak corresponds to the tetragonal ZrO2 (ICDD # 00-042-1164) and confirms the nucleation of a tetragonal phase in this sample. With further milling to 120 h (120h-B), this peak becomes relatively more intense, confirming progressive growth of the tetragonal phase fraction with extended milling. The concurrent reduction in intensity and increased peak broadening with milling time is attributed to crystallite size reduction and accumulated lattice strain during extended milling. To resolve overlapping features in the 27–33° region, Gaussian peak fitting was performed, as shown in Figure 2c, which confirmed the coexistence of monoclinic and tetragonal phases. The integrated area of the tetragonal component increases with the milling duration, signifying a milling-driven monoclinic-to-tetragonal transformation.
Figure 2.
(a) XRD of ball-milled ZrO2, along with the unmilled sample. (b) Magnified region from 26° to 34°, highlighting the emergence of tetragonal phase. (c) Multipeak fitting profile in the 120h-B sample.
The crystallite size, calculated using the Scherrer equation, decreases markedly with milling, as expected for severely deformed systems. The 0h-B sample has an average size of ~31 nm, which reduces to ~8 nm and ~6 nm for the 80h-B and 120h-B samples, respectively (calculated for the intense m-ZrO2 peak). At reduced crystallite dimensions, surface energy becomes increasingly dominant, promoting the non-equilibrium process to take place favoring the high-temperature tetragonal phase even at ambient conditions. Moreover, grain-size-dependent studies in ZrO2 have shown that smaller grains lower the driving energy barrier for the tetragonal-to-monoclinic transition and shift phase transformation temperatures in these materials. Further, in addition to the crystallite size reduction, the ball milling process is also expected to be accompanied by increased microstrain, as the ball milling is known to induce a lot of structural defects in the material. The accumulation of lattice strain acts as an internal driving force, altering chemical free energy balance, and could enable the tetragonal nucleation and growth pathways otherwise inaccessible in larger, strain-free grains [24,25]. Thus, it may be inferred that the combined effect of grain refinement and lattice distortion induced by prolonged high-energy milling can synergistically promote the stabilization of the tetragonal phase in ZrO2.
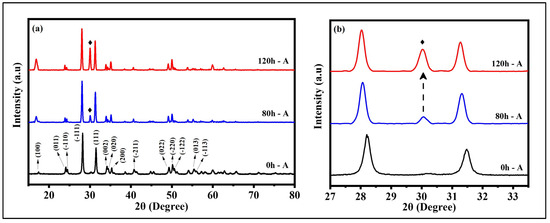
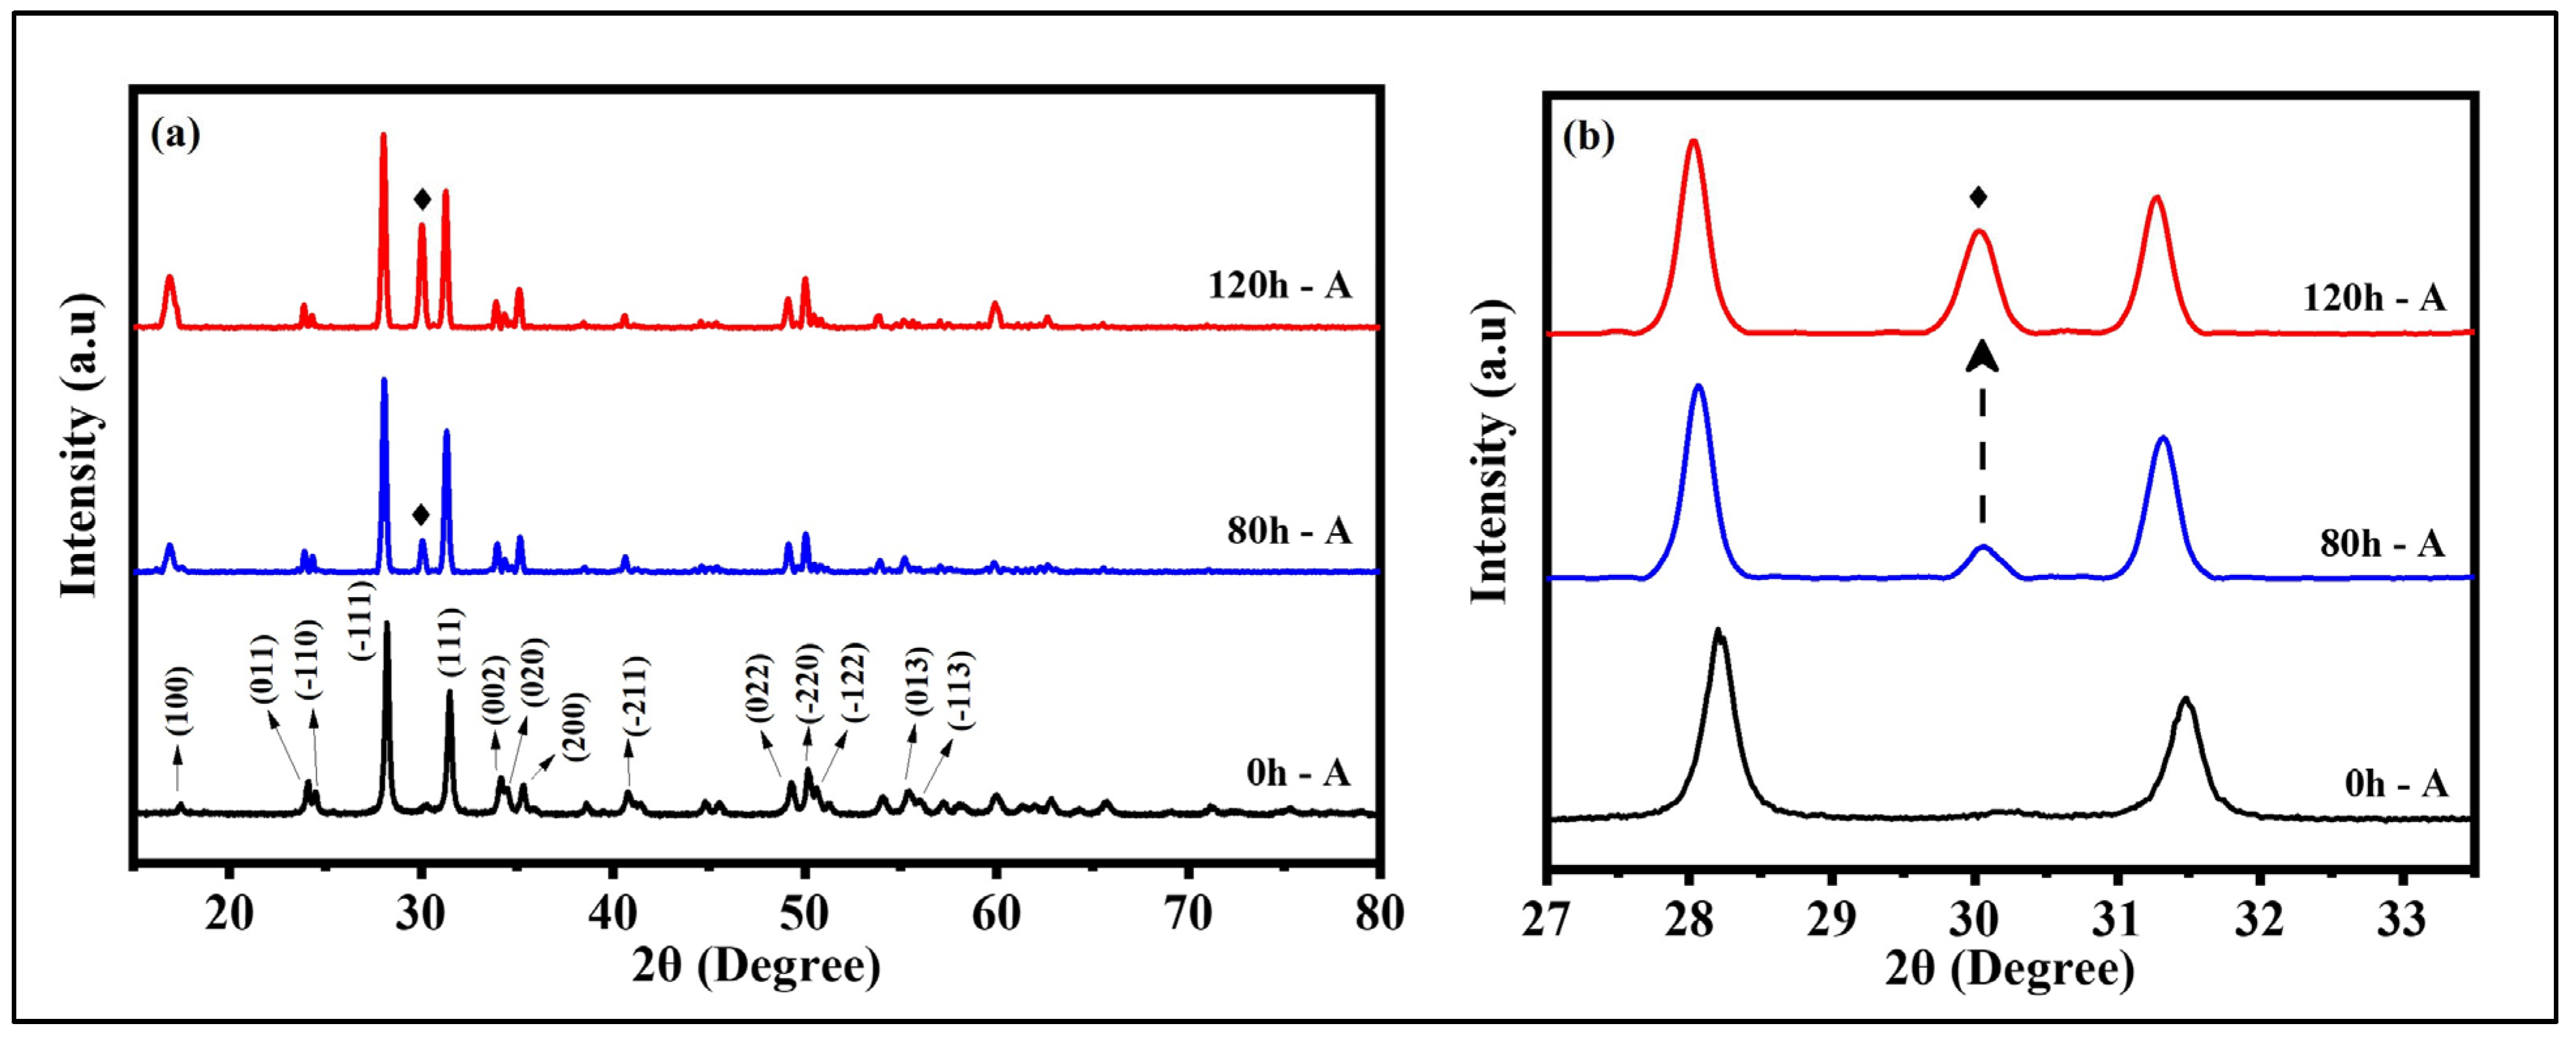
Further, Figure 3 illustrates the X-ray diffractograms of the unmilled and milled samples, followed by annealed ZrO2 powders. In contrast to the unannealed samples, the annealed samples display sharper and more intense reflections, confirming crystallite growth and the relaxation of lattice strain in the case of the milled samples. The dominant diffraction peaks can be indexed to the monoclinic phase of ZrO2, particularly the (111), (−111), (200), and (−220) reflections. Additionally, the previously observed weak reflections corresponding to the tetragonal phases in the 80h-B and 120h-B samples are observed here also, as can be seen with the distinct peak observed near ≈30.04° (♦), as shown in Figure 3b. The relative intensity of the tetragonal phase in the 120h-A sample is higher compared to the 80h-A sample, and a broad hump is observed in the 0h-A sample, indicating the critical role of ball milling in the stabilization of the tetragonal phase. The retention of the tetragonal phase in the 80h-A and 120h-A samples highlights the non-equilibrium nature of the ball milling process, which otherwise would have returned to monoclinic, in the absence of stabilizing dopants.
Figure 3.
(a) XRD of the annealed samples, (b) Magnified image of the annealed XRD data from 27° to 33°.
3.2. Understanding the Phase Evolution Through Raman Spectroscopy
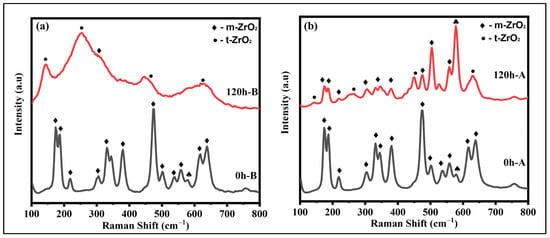
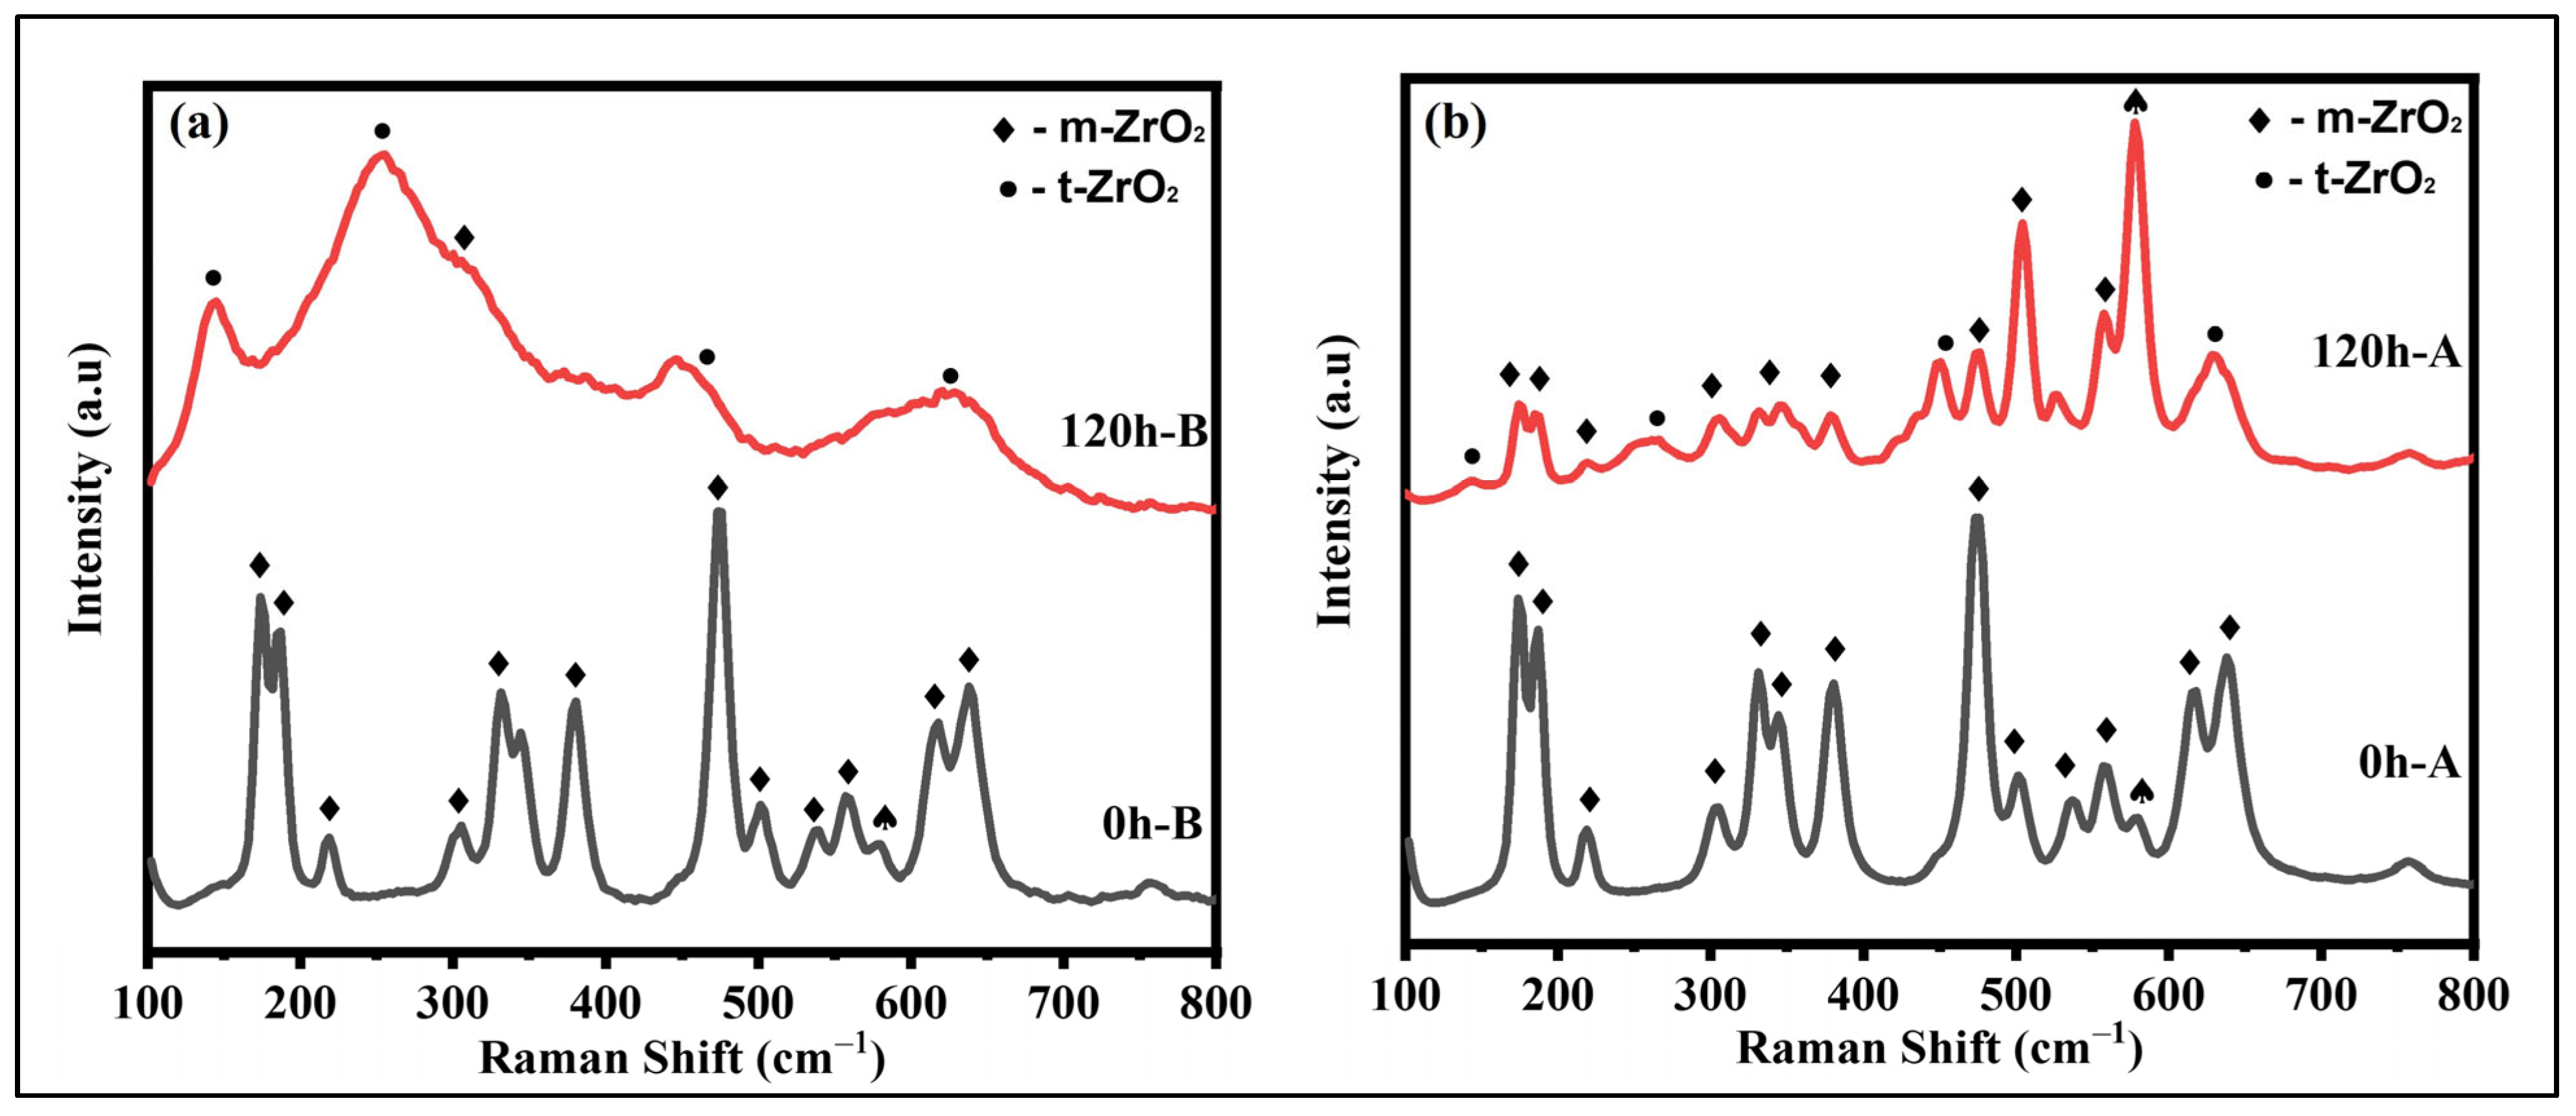
To further assess the phase evolution and to understand the formation and retention of the tetragonal phase, a Raman analysis was carried out on the 0 h and 120 h samples, and the results are shown in Figure 4. As shown in Figure 4a, the 0h-B sample exhibits sharp and intense Raman peaks located at ~178, 190, 306, 335, 381, 475, 560, and 635 cm−1, characteristic of the monoclinic (m-ZrO2—marked with ♦) phase [20,26]. These well-resolved modes and narrow full-width at half maximum (FWHM) values indicate a highly crystalline structure with a minimal lattice disorder, as expected. With extended milling (120h-B), notable modifications occur in the Raman spectra. All vibrational bands become broadened and less intense, accompanied by a systematic red shift toward lower wavelength. The observed overlap of the Raman modes indicates a loss of long-range order, and the increased lattice microstrain indicates nanocrystallinity and partial amorphization. The appearance of weak features near 147, 252, 463, and 624 cm−1 corresponds to the t-ZrO2 phase [26,27] (marked with • in figure), implying a partial monoclinic-to-tetragonal transformation induced by high-energy milling. The result observed is in line with the literature, as reported by Sekulić et al., where a similar trend is observed in a ball-milled ZrO2 sample [28].
Figure 4.
Raman spectra for (a) 0h-B and 120h-B samples and (b) 0h-A and 120h-A samples.
Further, upon annealing the initial sample (0h-A), the spectra in Figure 4b show sharp and intense Raman modes corresponding to the monoclinic phase located in the same position as in the 0h-B sample. Upon annealing of the ball-milled sample (120h-A), the Raman spectra in Figure 4b exhibit a substantial recovery of crystallinity and a sharpening of vibrational modes. The appearance of well-defined peaks near 178, 190, 306, 335, 381, 475, and 560 cm−1 in the 120h-A sample confirms the recrystallization and restoration of the monoclinic structure [20,26], as thermal treatment relaxes internal strain and promotes atomic reordering. However, residual weak features at 145, 252, 463, and 624 cm−1, corresponding to the tetragonal phase [26,27], are still persistent in the 120h-A sample, suggesting incomplete phase reversal and stabilization of a minor fraction of t-ZrO2 even after annealing. Interestingly, an intense Raman band centered at ~579 cm−1 is observed in the 120h-A sample, which cannot be assigned to either the monoclinic or tetragonal phases (marked as ♠). Notably, this feature is also present in the 0h-A and 0h-B samples, indicating its persistence across compositions and processing conditions. A detailed survey of prior studies on ZrO2 suggests that such a mode may be associated with cubic ZrO2 [29]. However, the X-ray diffraction analysis does not indicate the presence of any cubic phase in these samples.
This apparent inconsistency can be rationalized by considering the differing sensitivities of Raman spectroscopy and XRD. While XRD probes long-range crystallographic order, Raman spectroscopy is sensitive to short-range structural environments. Accordingly, it is plausible that a minor fraction of highly disordered or distorted tetragonal microdomains exhibiting cubic-like local symmetry exists below the detection limit of XRD. This behavior is attributed to short-range structural disorder, oxygen vacancy-induced symmetry relaxation, and the presence of nanoscale tetragonal domains approaching cubic symmetry.
3.3. Quantification of Microstructural Parameters Through Rietveld Analysis
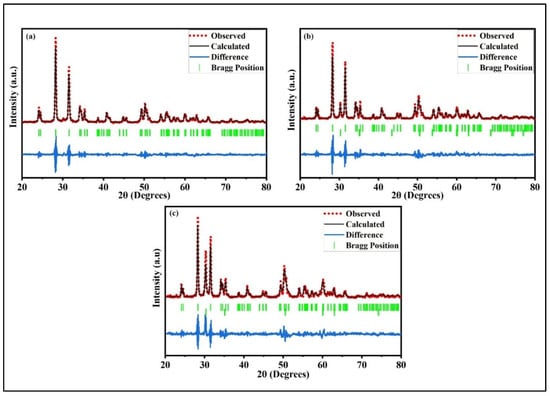
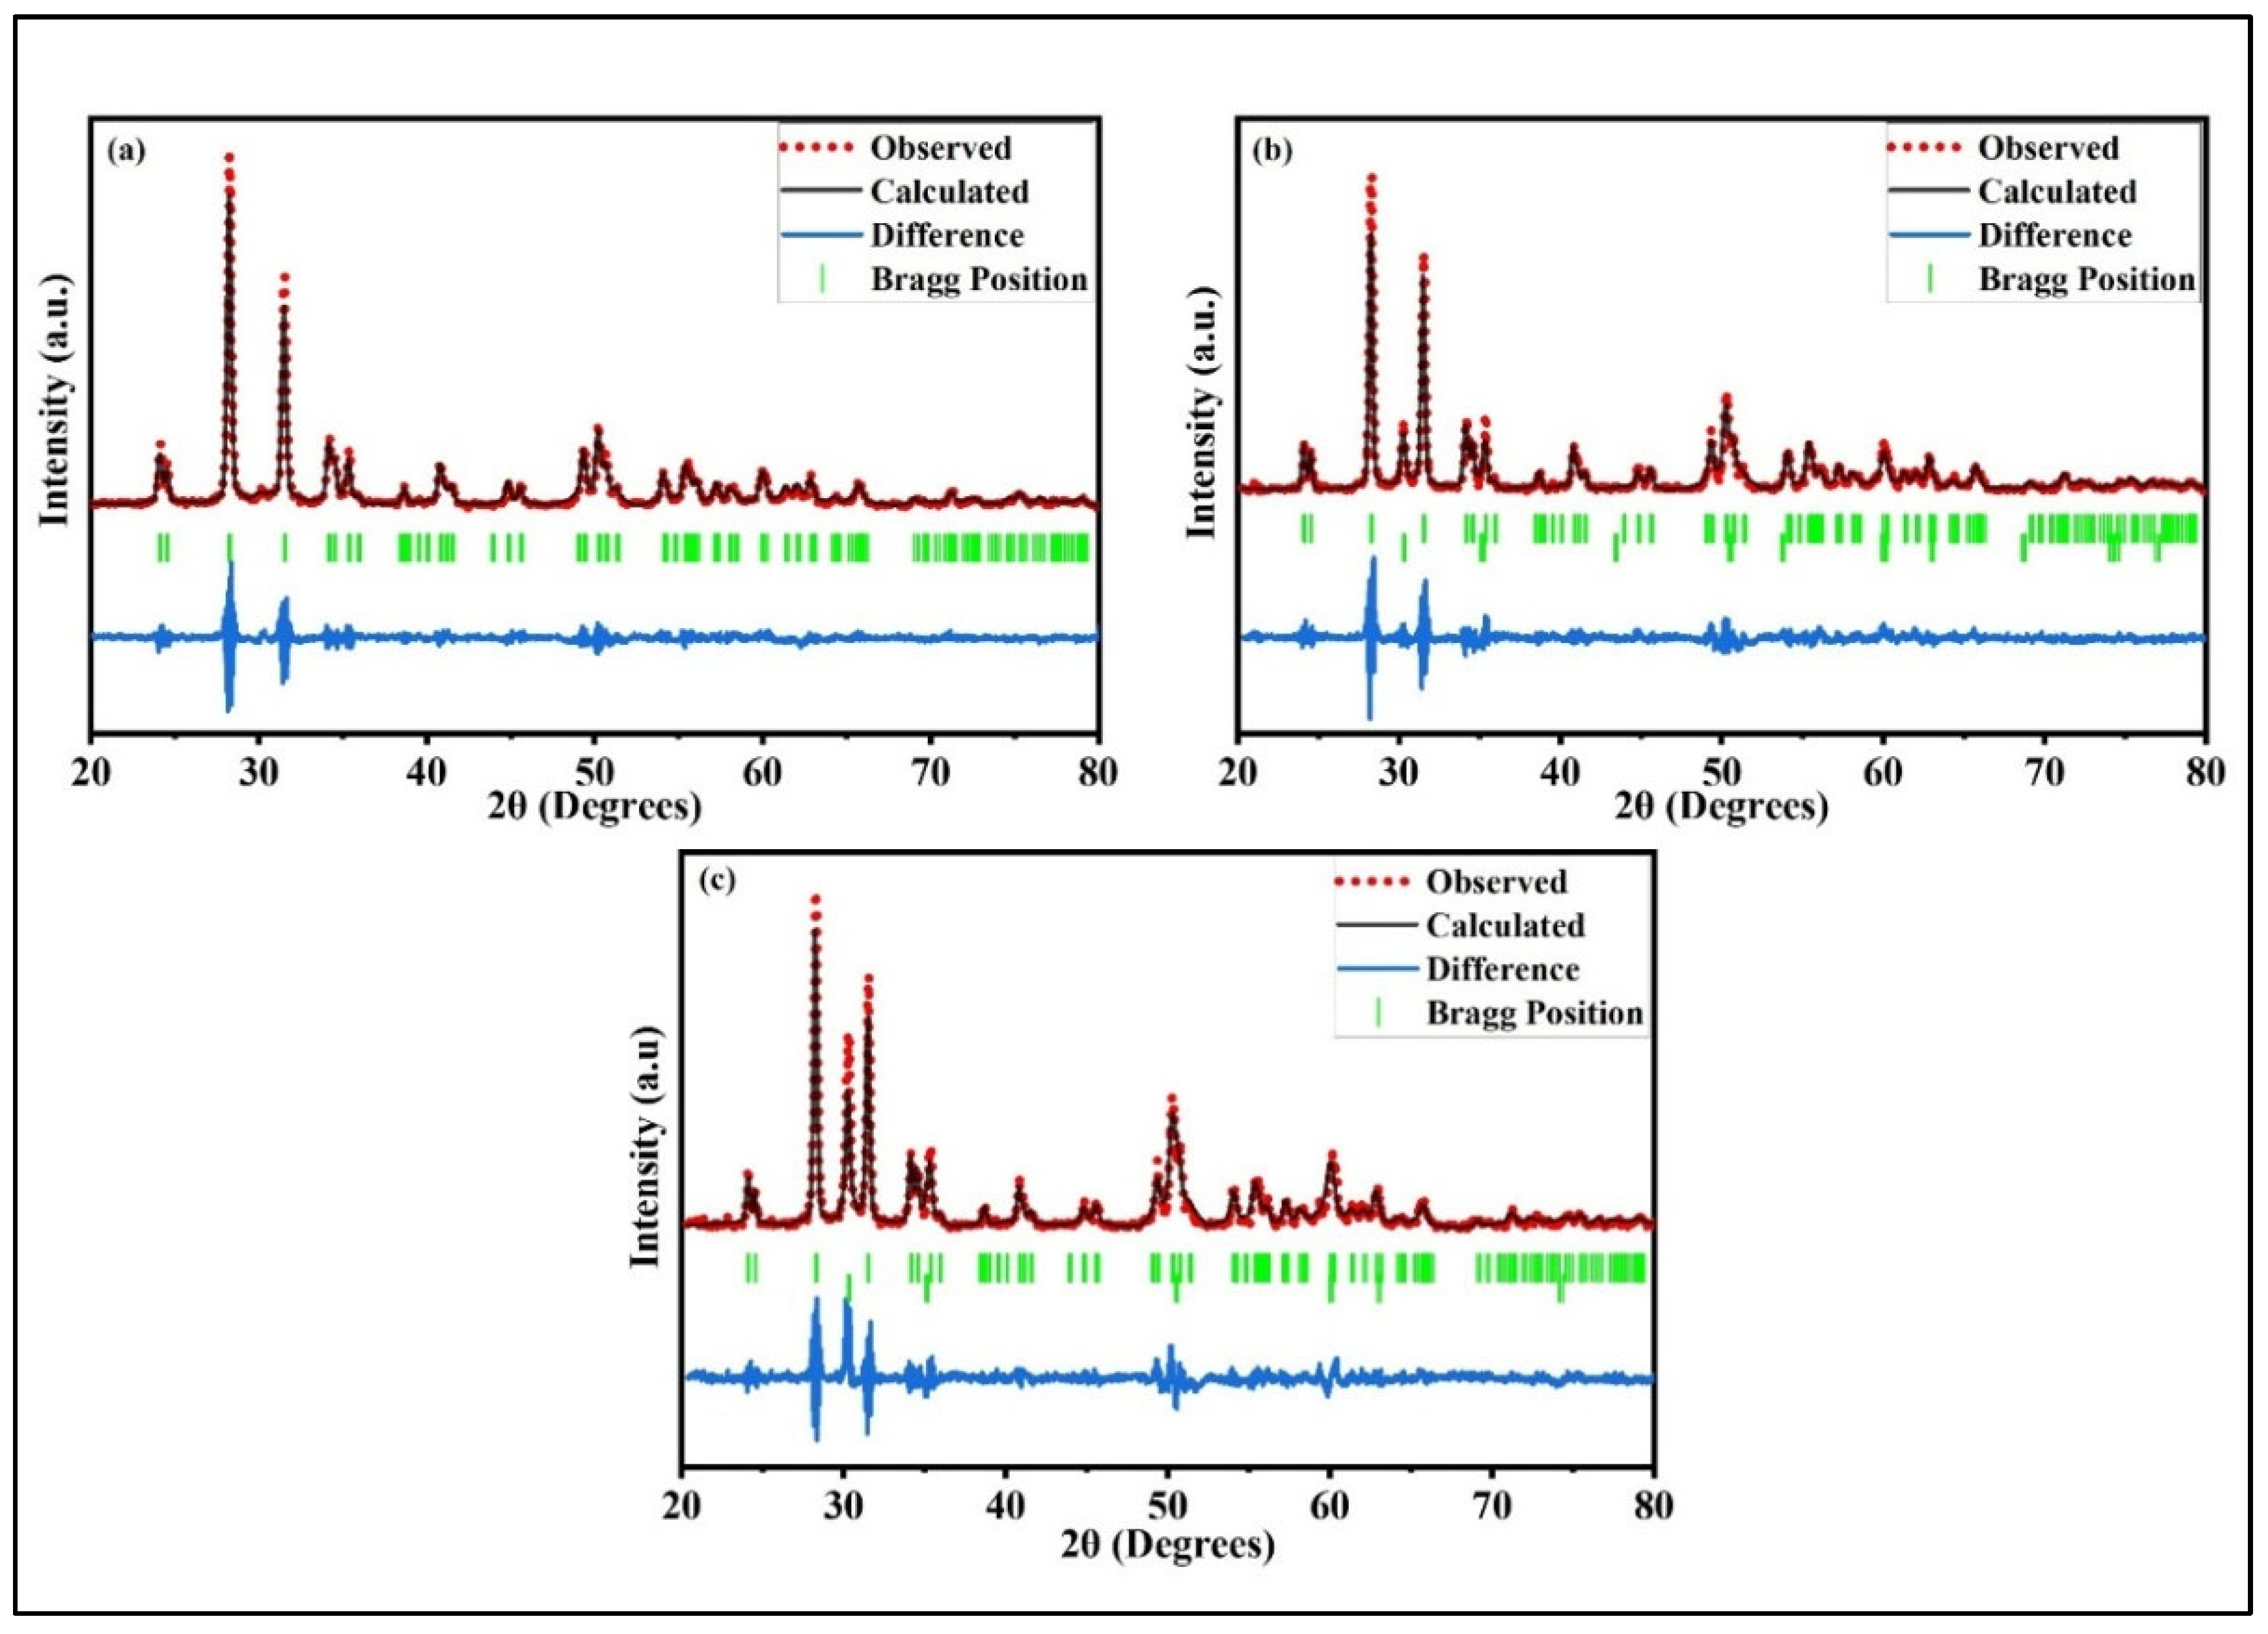
With the confirmation of phases through XRD and Raman analysis, the quantification of the microstructural parameters through a Rietveld analysis of the annealed samples are carried out further, and the results are shown in Figure 5a–c for the 0h-A, 80h-A, and 120h-A samples, respectively. For the 0h-A sample, which shows only the monoclinic phase, the extracted lattice parameters values are a = 5.14 Å, b = 5.19 Å, c = 5.31 Å, and β ≈ 99.15°, which is close to the theoretical values reported for this phase. By contrast, the 80h-A sample, which consists of both the monoclinic and tetragonal phases, the Rietveld analysis shows a phase composition of ~91.87 ± 0.08% for the monoclinic phases and ~8.13 ± 0.05% for the tetragonal phase. Further, for the 120h-A sample, the Rietveld refinement shows a significant rise in the secondary tetragonal phase fraction to ~24.37 ± 0.13%, accompanied by a corresponding decrease in the monoclinic content to ~75.63 ± 0.68%. The refined monoclinic lattice parameters remain nearly unchanged across all samples, while the secondary phase shows a lattice parameter of ~5.11 Å, suggesting strain relaxation and structural equilibration during annealing.
Figure 5.
Rietveld refinement of the XRD pattern of the annealed samples (a) 0h-A, (b) 80h-A, and (c) 120h-A, showing observed, calculated, and difference profiles with Bragg reflection positions.
3.4. Williamson–Hall Analysis for Crystallite Size and Lattice Strain Estimation
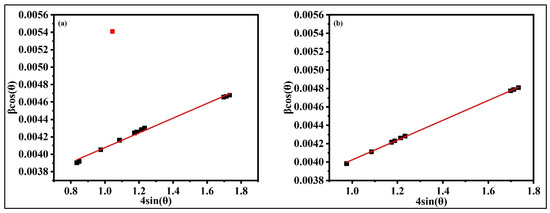
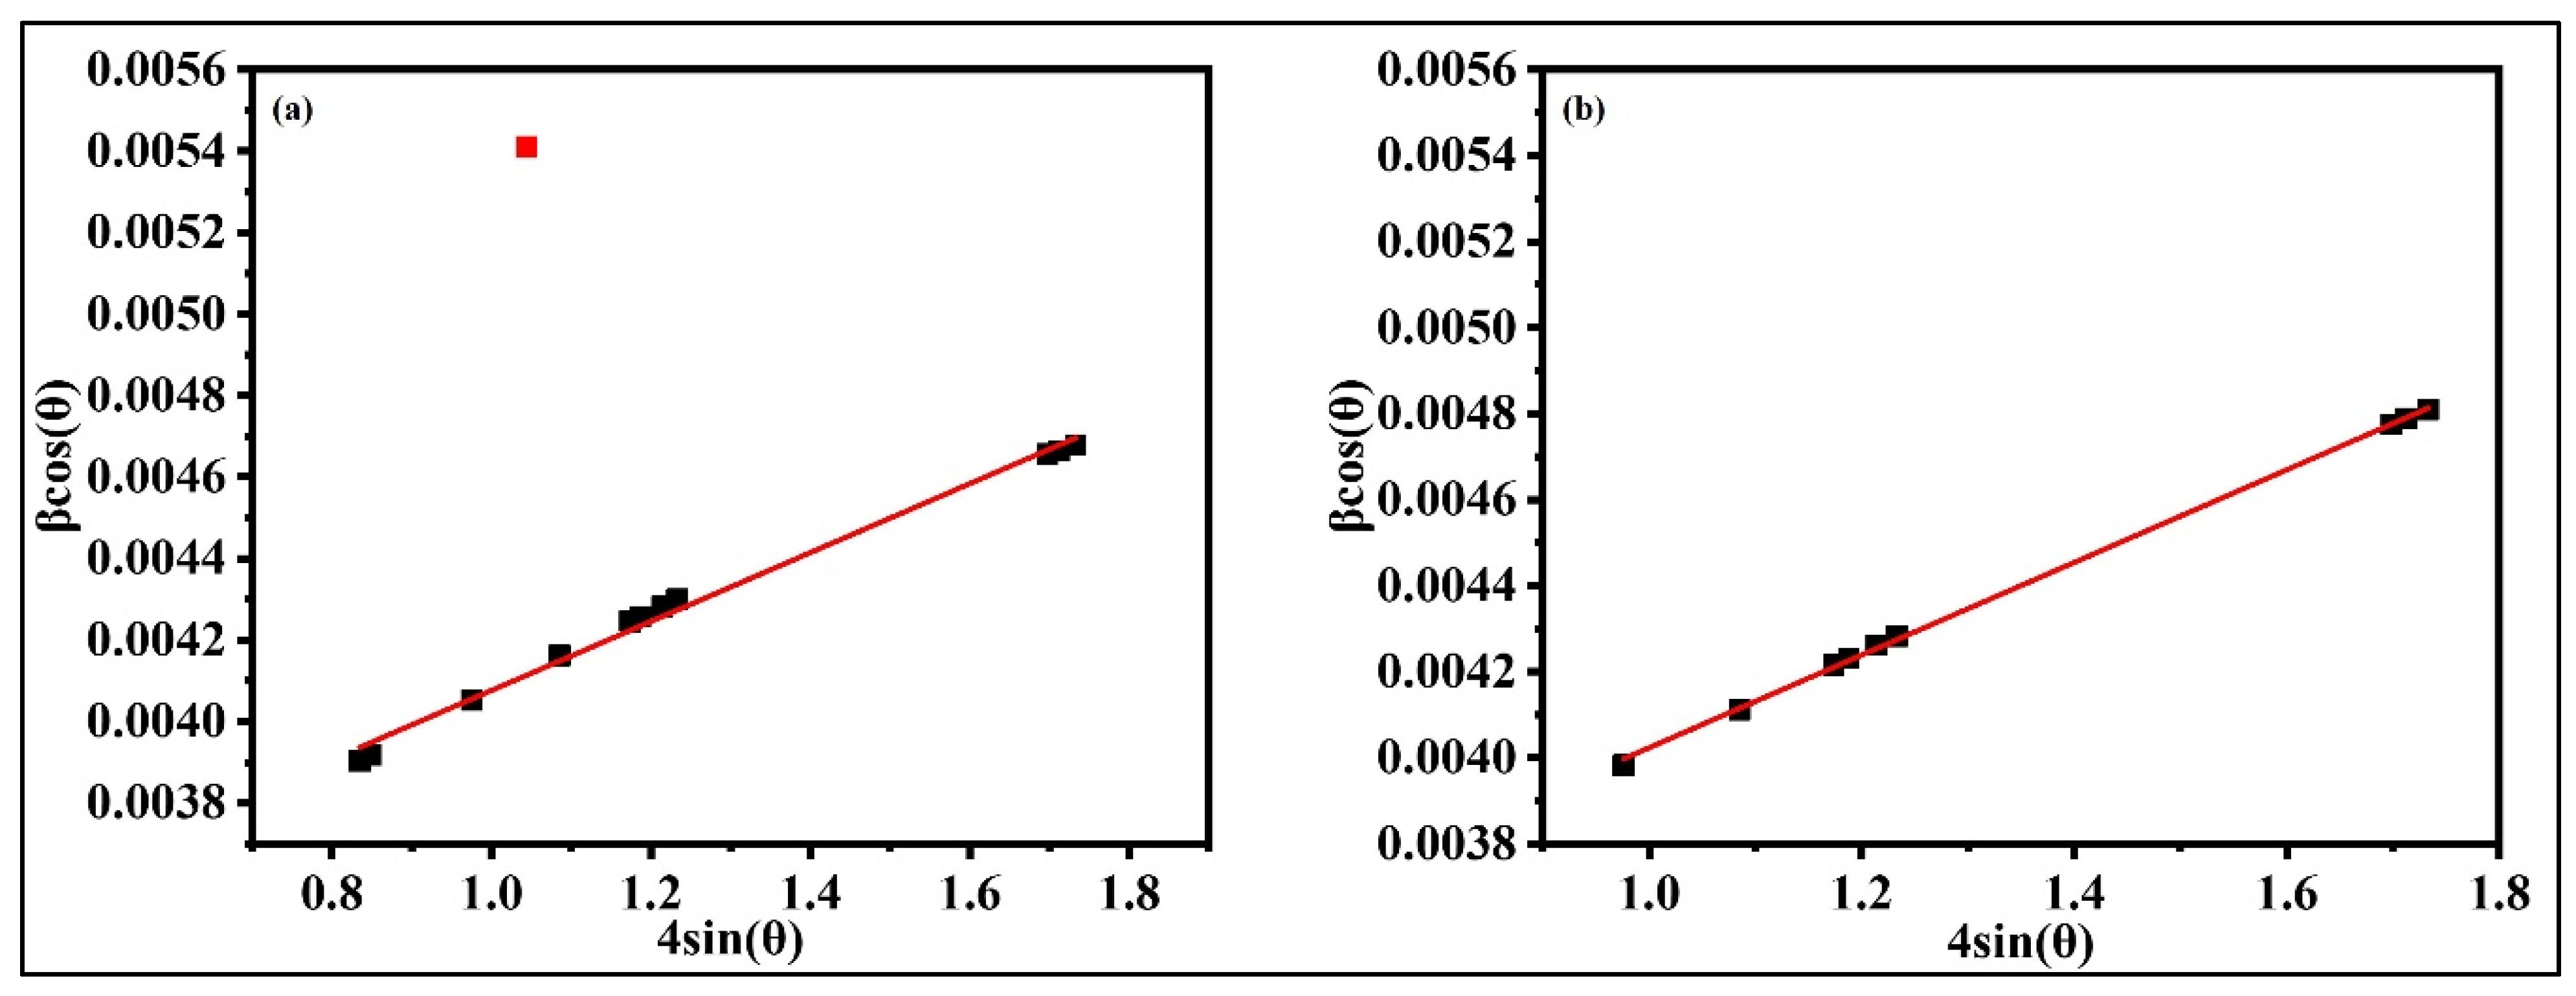
The Williamson–Hall (W-H) analysis of the 80h-A and 120h-A samples is carried out to understand the effect of ball -milling and annealing on the crystallite size and microstrain and the plot is shown in Figure 6. The analysis reveals that the 80h-A specimen exhibits a crystallite size of ~43 ± 0.39 nm with a microstrain of 8.46 × 10⁻⁴, whereas the 120h-A specimen shows a slightly larger crystallite size of ~46.9 ± 0.20 nm and a higher microstrain of 10.8 × 10⁻⁴. After annealing, partial strain relaxation and crystallite growth are expected due to defect recovery and grain coarsening mechanisms; accordingly, the marginally larger crystallite size in the 120h-A sample can be attributed to enhanced thermally-driven growth facilitated by the greater stored deformation energy accumulated during prolonged milling. The higher residual microstrain in the 120h-A sample indicates that complete strain recovery did not occur, suggesting the persistence of lattice distortions arising from accumulated defects and partial stabilization of the tetragonal phase fractions.
Figure 6.
W-H plot for (a) 80h-A and (b) 120h-A samples.
The coexistence of the monoclinic and tetragonal phases suggests that nanoscale grain refinement and the associated surface energy effects induced by high-energy milling provide sufficient stabilization to preserve the tetragonal domains during annealing. Therefore, annealing at 1000 °C reduces strain and enhances crystallinity, implying partial structural retention of the milling-induced polymorph even after annealing at elevated temperatures.
3.5. Microstructural and Chemical Characterization Through Scanning Electron Microscopy Coupled with Energy Dispersive Spectroscopy
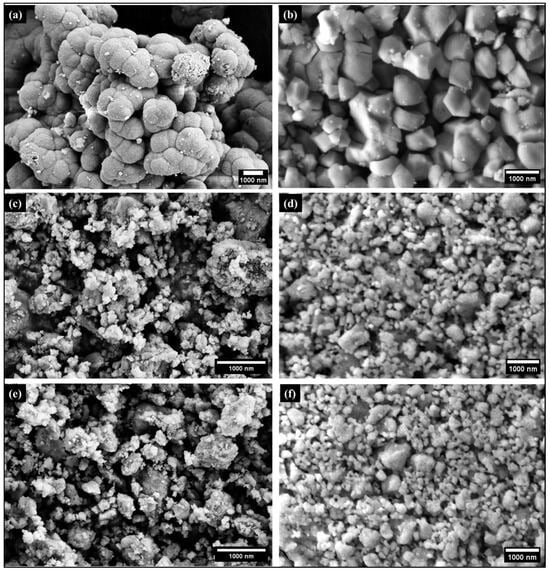
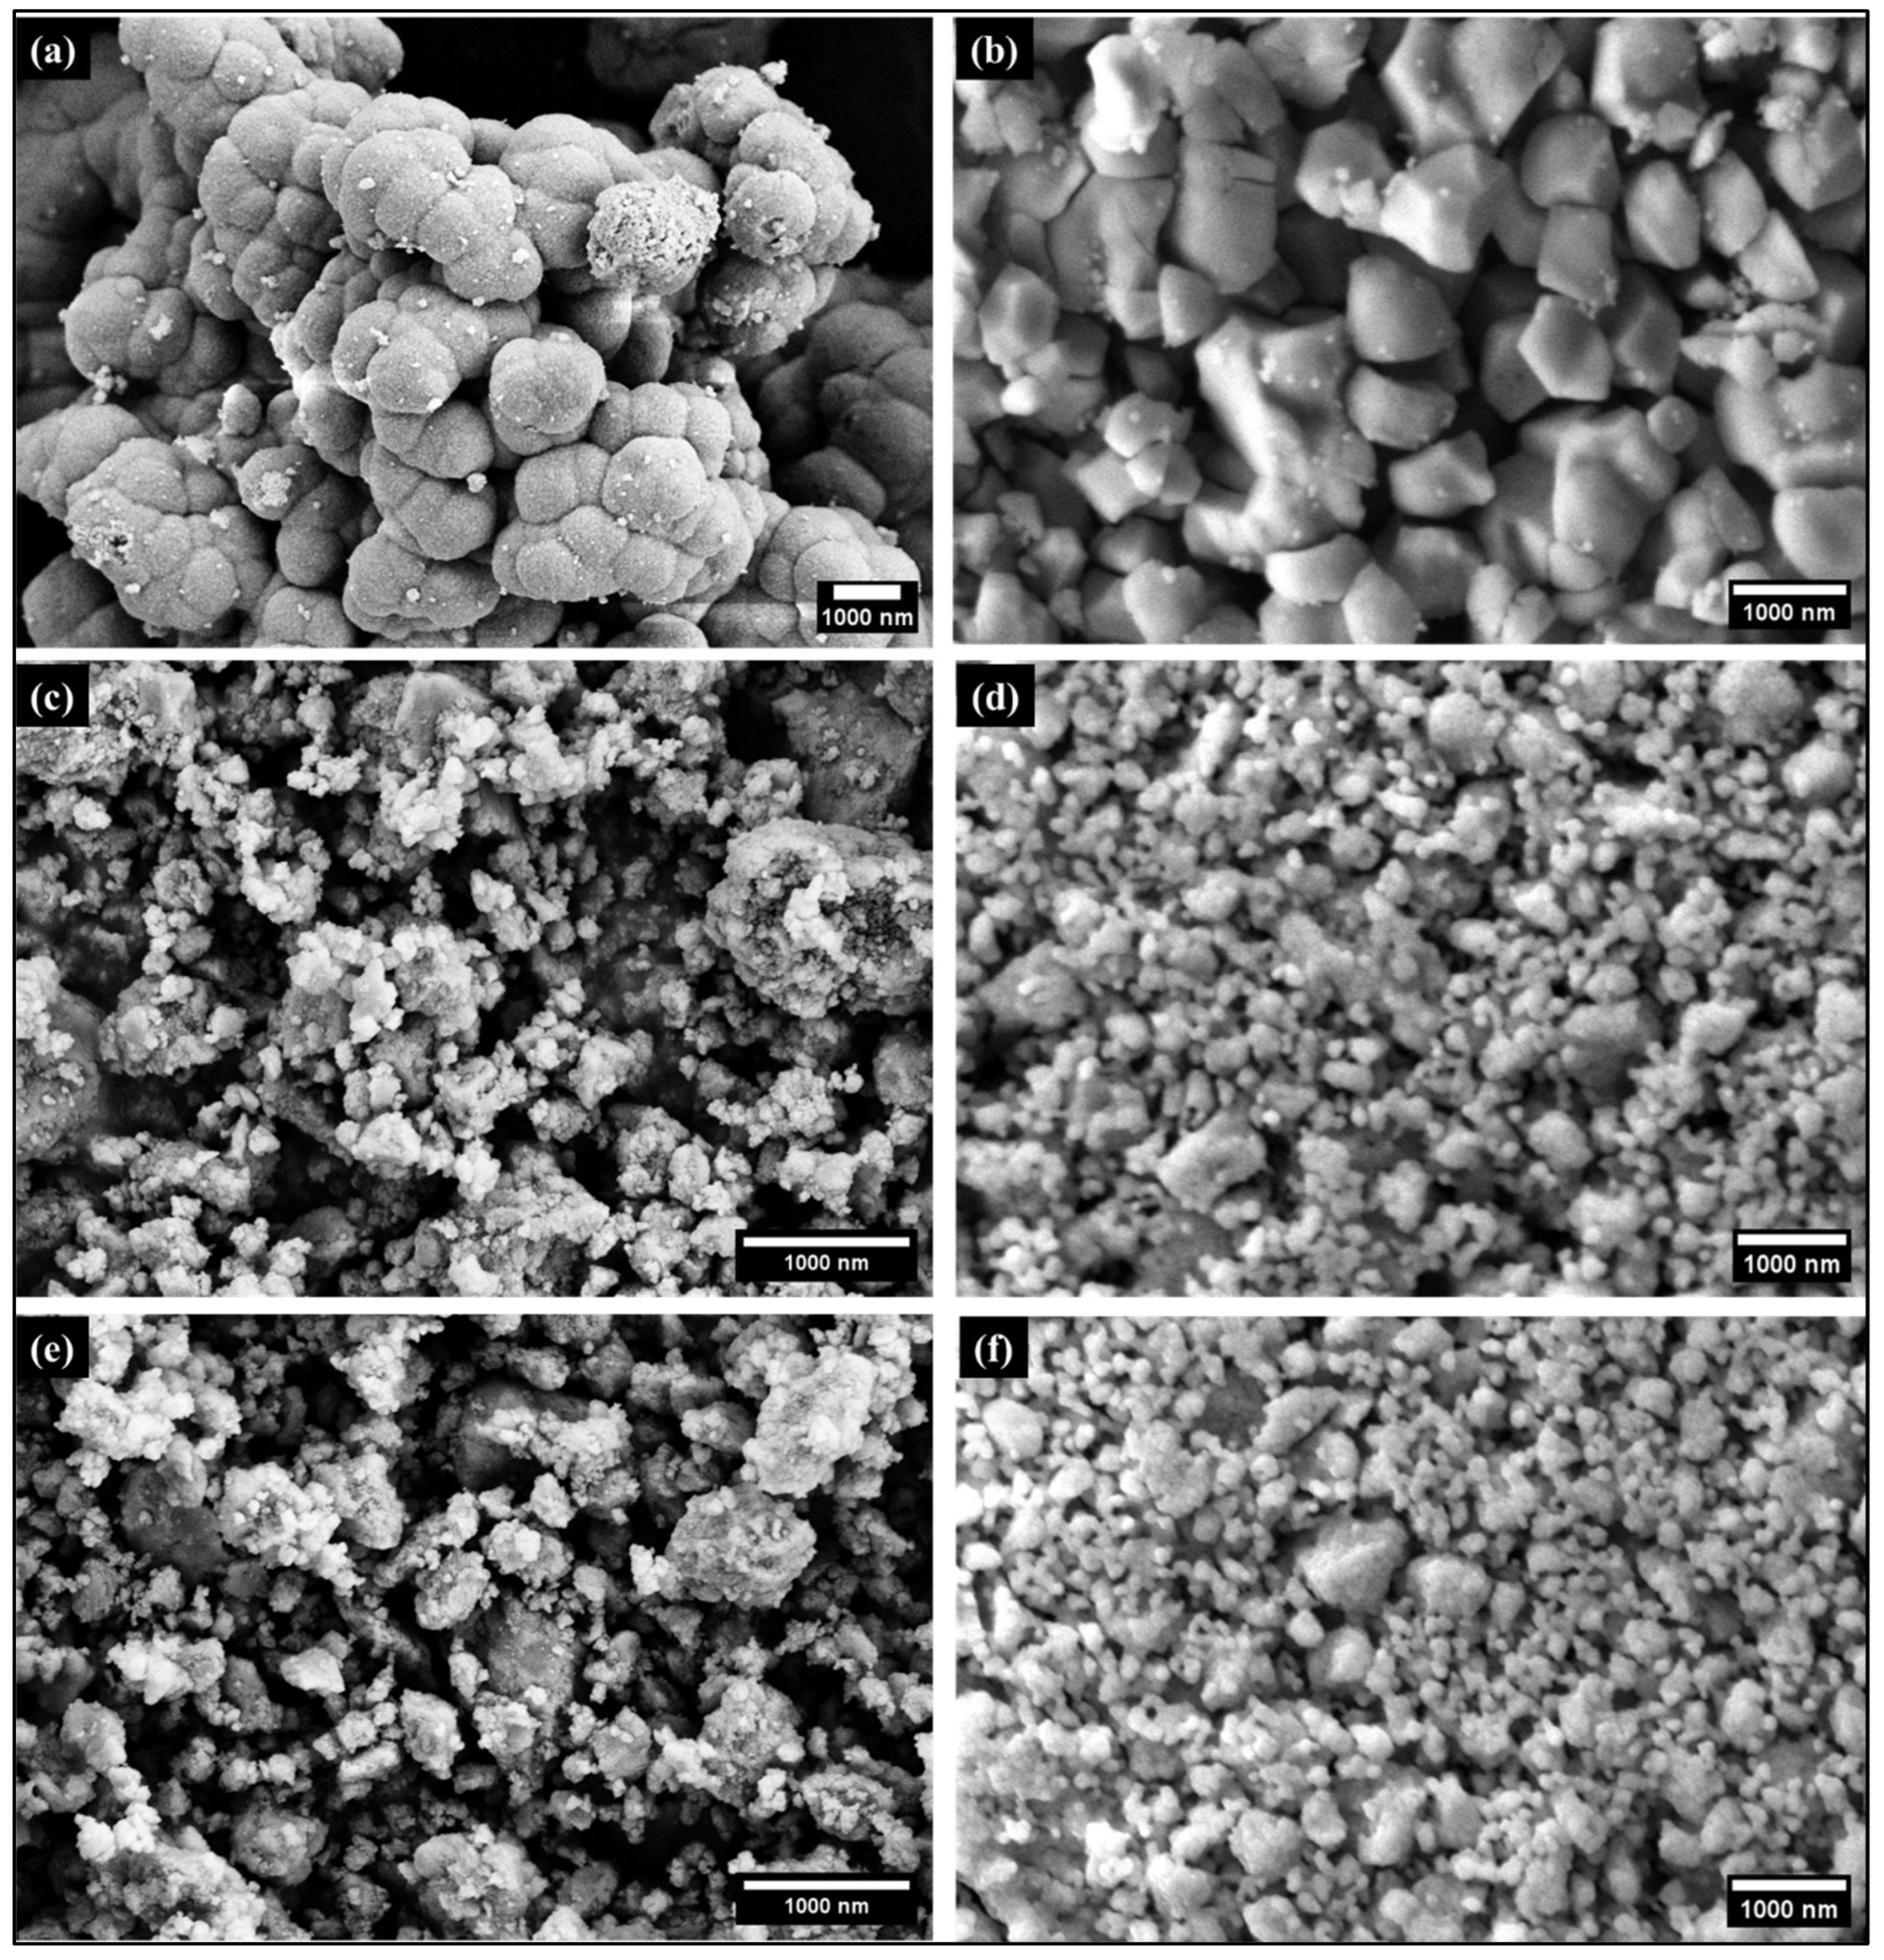
The morphological evolution of the ZrO2 samples under milling and annealing treatments are assessed through SEM investigations, as reported in Figure 7a–f. Figure 7a shows the micrograph of the initial 0h-B sample, wherein large, agglomerated clusters with a rounded morphology are observed with a typical particle size of 1–3 μm. Figure 7b shows the 0h-A sample, where the well-defined faceted grains are due to annealing induced recrystallization, and grain growth is clearly observed. Further, Figure 7c shows the SEM micrograph for the 80h-B sample, where fine and irregular particles with clearly reduced particle sizes, and a developed porous structure is also observed. The annealing of the same sample, i.e., 80h-A, as shown in Figure 7d, hints at a partial densification with reduced porosity but retention of nanoscale features. Further milling for 120 h, as shown in Figure 7e for the 120h-B sample, shows a refined powder particle in ultrafine fragments with a highly irregular morphology and agglomeration, similar to the 80h-B sample. Further annealing of the same sample, as shown in Figure 7f for 120h-A sample, indicates that annealing promotes grain coarsening and compaction, yielding a more uniform microstructure compared to the purely milled counterpart but similar to the 80h-A sample. In summary, SEM micrographs indicate that high-energy ball milling significantly refines the particle size and increases porosity, whereas annealing enhances structural homogeneity and crystallinity through grain growth and partial densification.
Figure 7.
SEM images of 0 h ((a)—ball-milled and (b)—annealed), 80 h ((c)—ball-milled and (d)—annealed), and 120 h ((e)—ball-milled and (f)—annealed) ZrO2 samples.
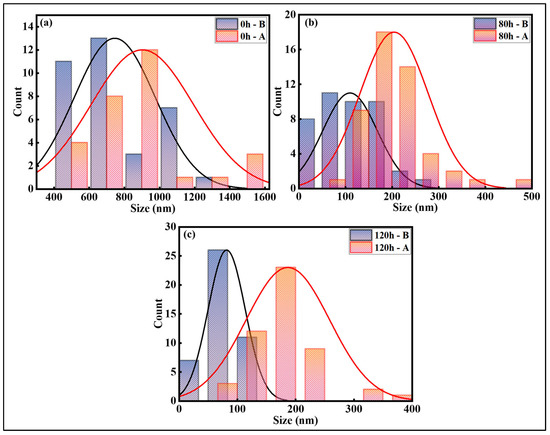
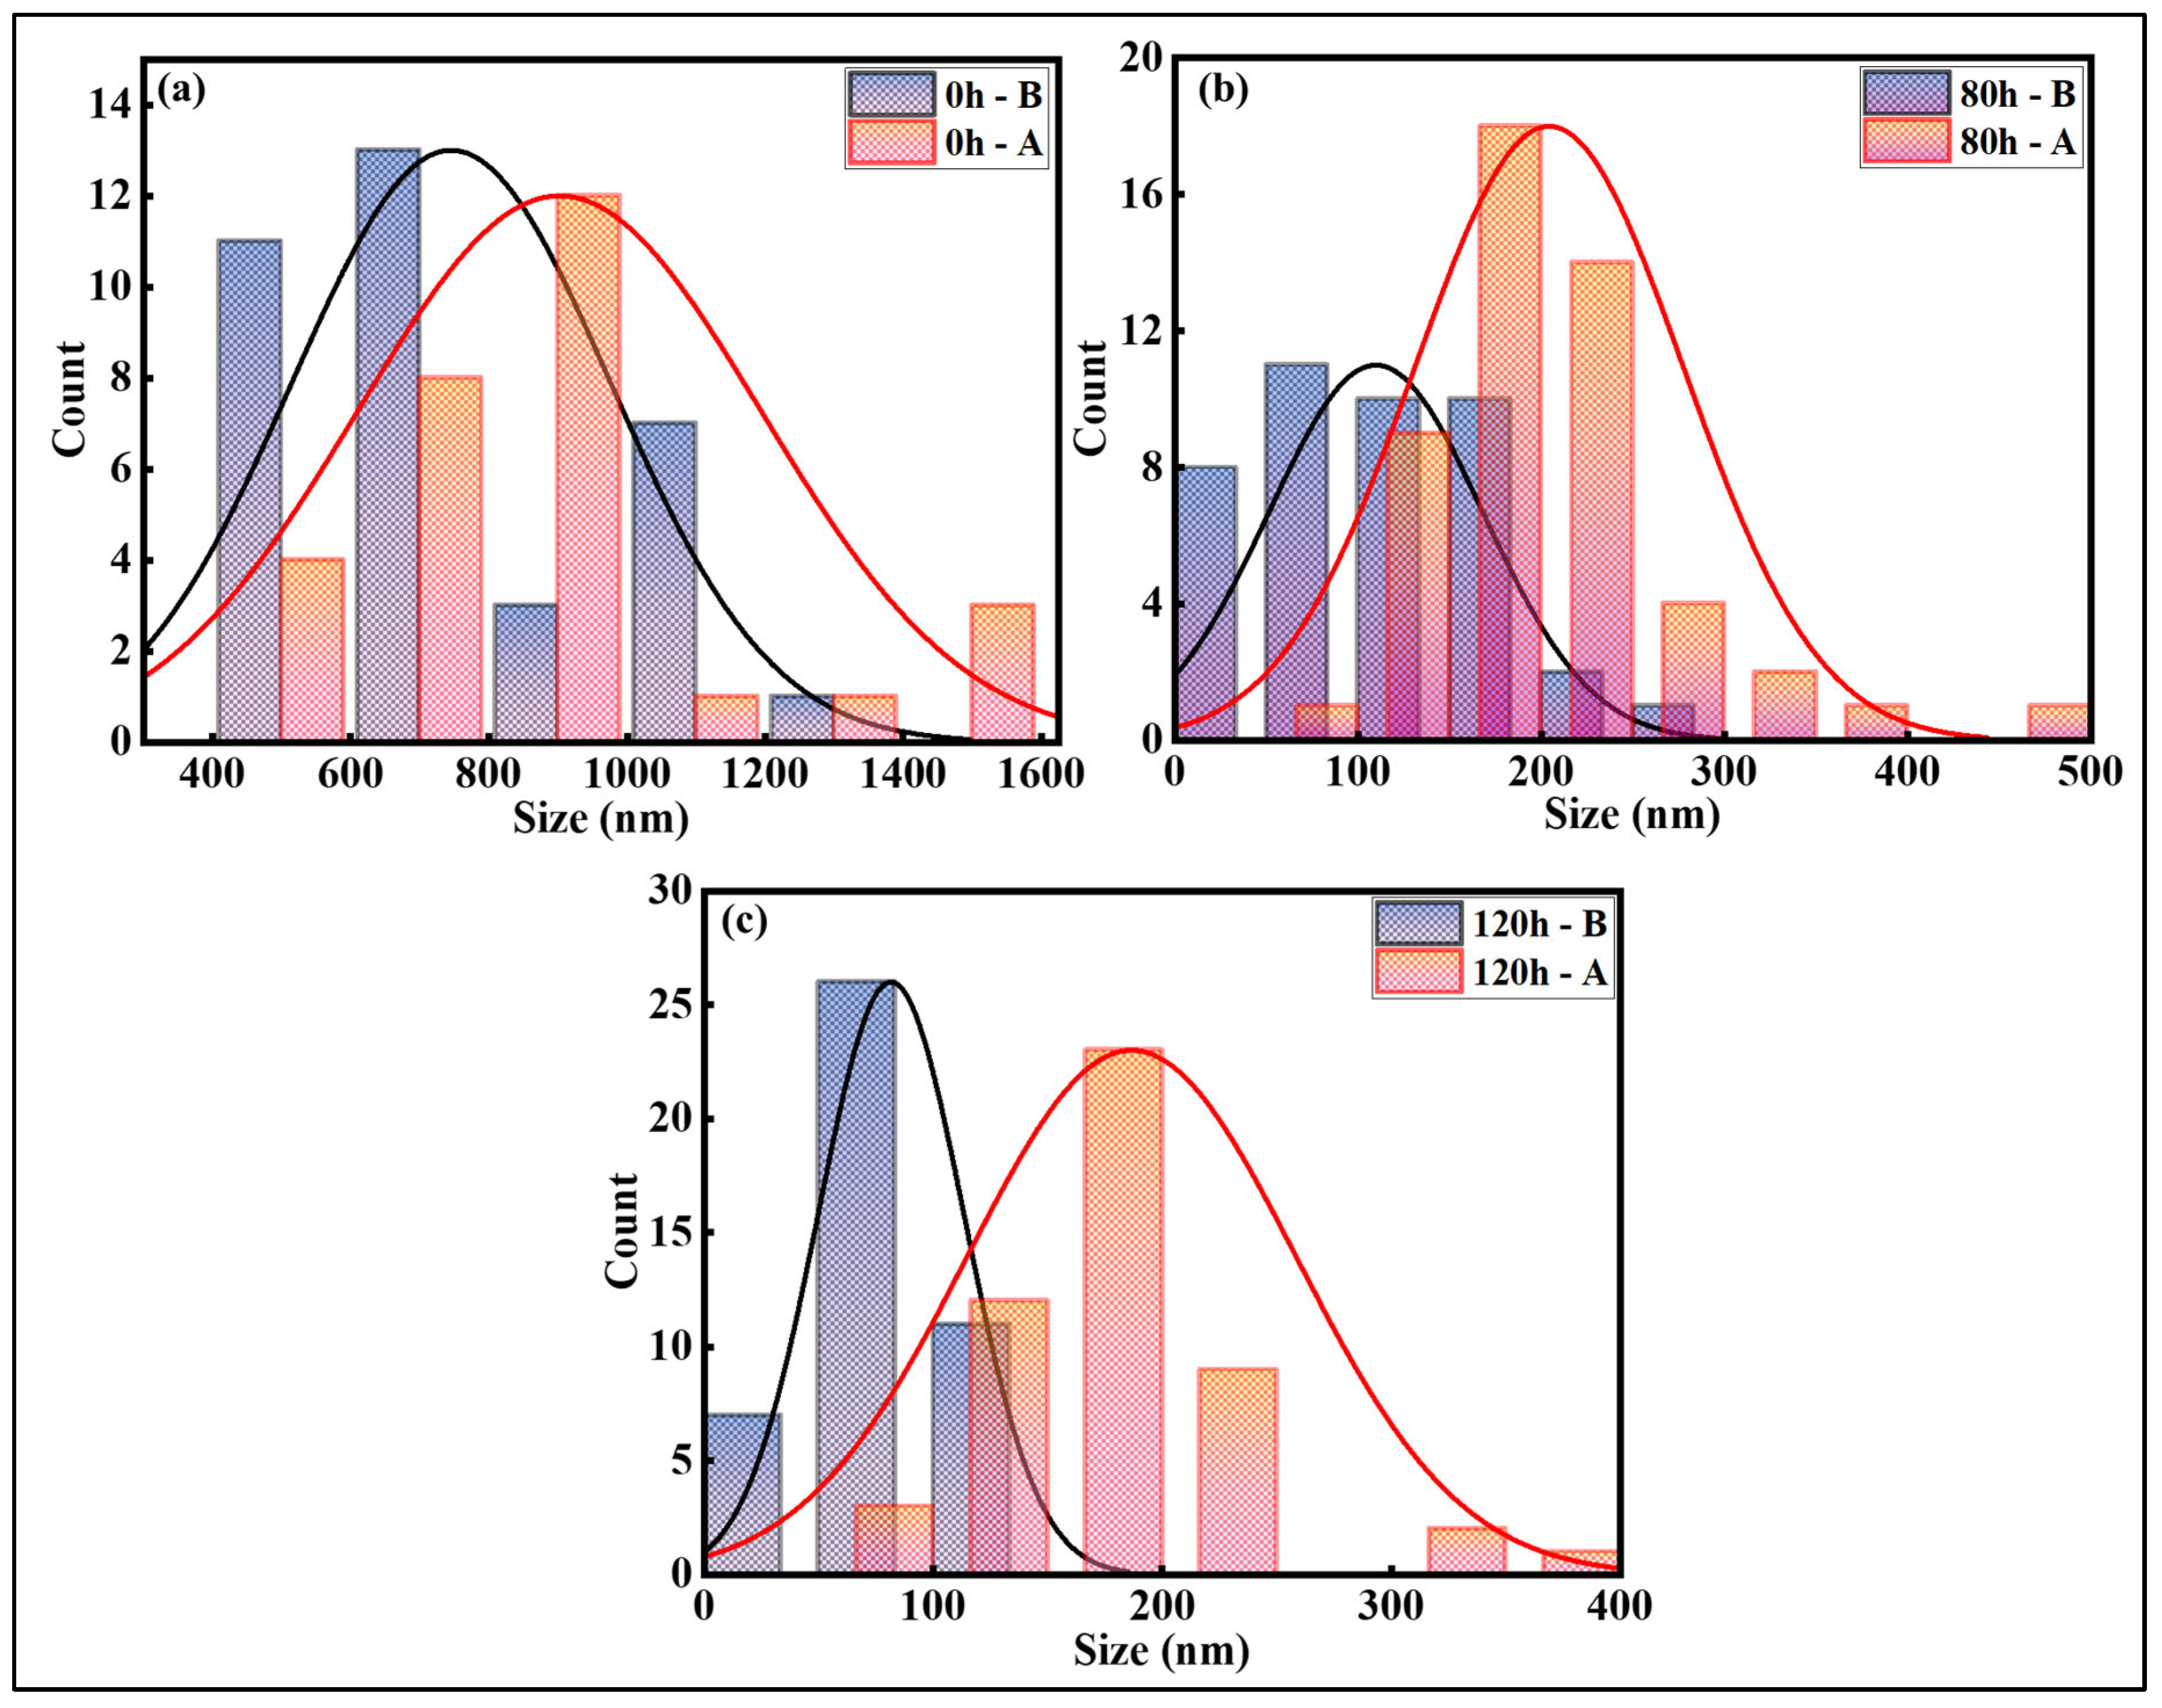
The interesting observation here is that, despite a strained microstructure, the ball-milled samples have retained their nanoscale features even after annealing at a high temperature. Particle size distribution was evaluated from SEM micrographs for the 0 h, 80 h, and 120 h samples, as shown in Figure 8, revealing a pronounced refinement with increasing milling duration relative to the initial powder 0h-B sample, which exhibits a mean particle size of 745 ± 230 nm (402–1250 nm), which increases to 902 ± 290 nm (417–1590 nm) after annealing (0h-A). Prolonged ball milling leads to a substantial reduction in particle size, with the 80h-B sample exhibiting a mean size of 109.6 ± 58 nm (12–262 nm), which increases moderately to 204.2 ± 73 nm (77–486 nm) after annealing (80h-A). A similar trend is observed for the 120 h samples, where the finest particle size distribution is obtained for 120h-B, with a mean size of 81.5 ± 32 nm (14–149 nm), while annealing results in limited coarsening to 186.5 ± 72 nm (83–402 nm) in 120h-A. Despite the annealing-induced growth, the particle sizes remain within the nanoscale regime and in line with the W-H analysis. Additionally, the tetragonal phase is also dependent on the sizes of the crystallites and, hence, a further increase in the annealing temperature may transform it to the monoclinic phase. Further, as the ball milling is expected to increase the oxygen content during milling, it also may be playing a role here, as the reports suggest that oxygen-related defect structures (oxygen vacancies) and their redistribution, together with grain boundary energy effects, play a key role in enabling the coexistence of the tetragonal and monoclinic ZrO2 phases, especially with high temperature annealing involved [30]. This has important implications for the mechanical properties and durability of the materials in applications such as environmental or thermal barrier coatings.
Figure 8.
Analysis of particle size distribution for (a) 0h-B and 0h-A, (b) 80h-B and 80h-A, and (c) 120h-B and 120h-A samples from SEM micrographs.
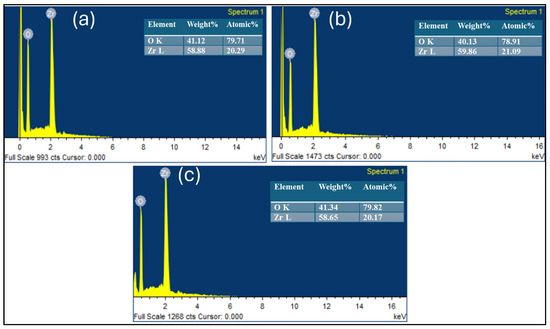
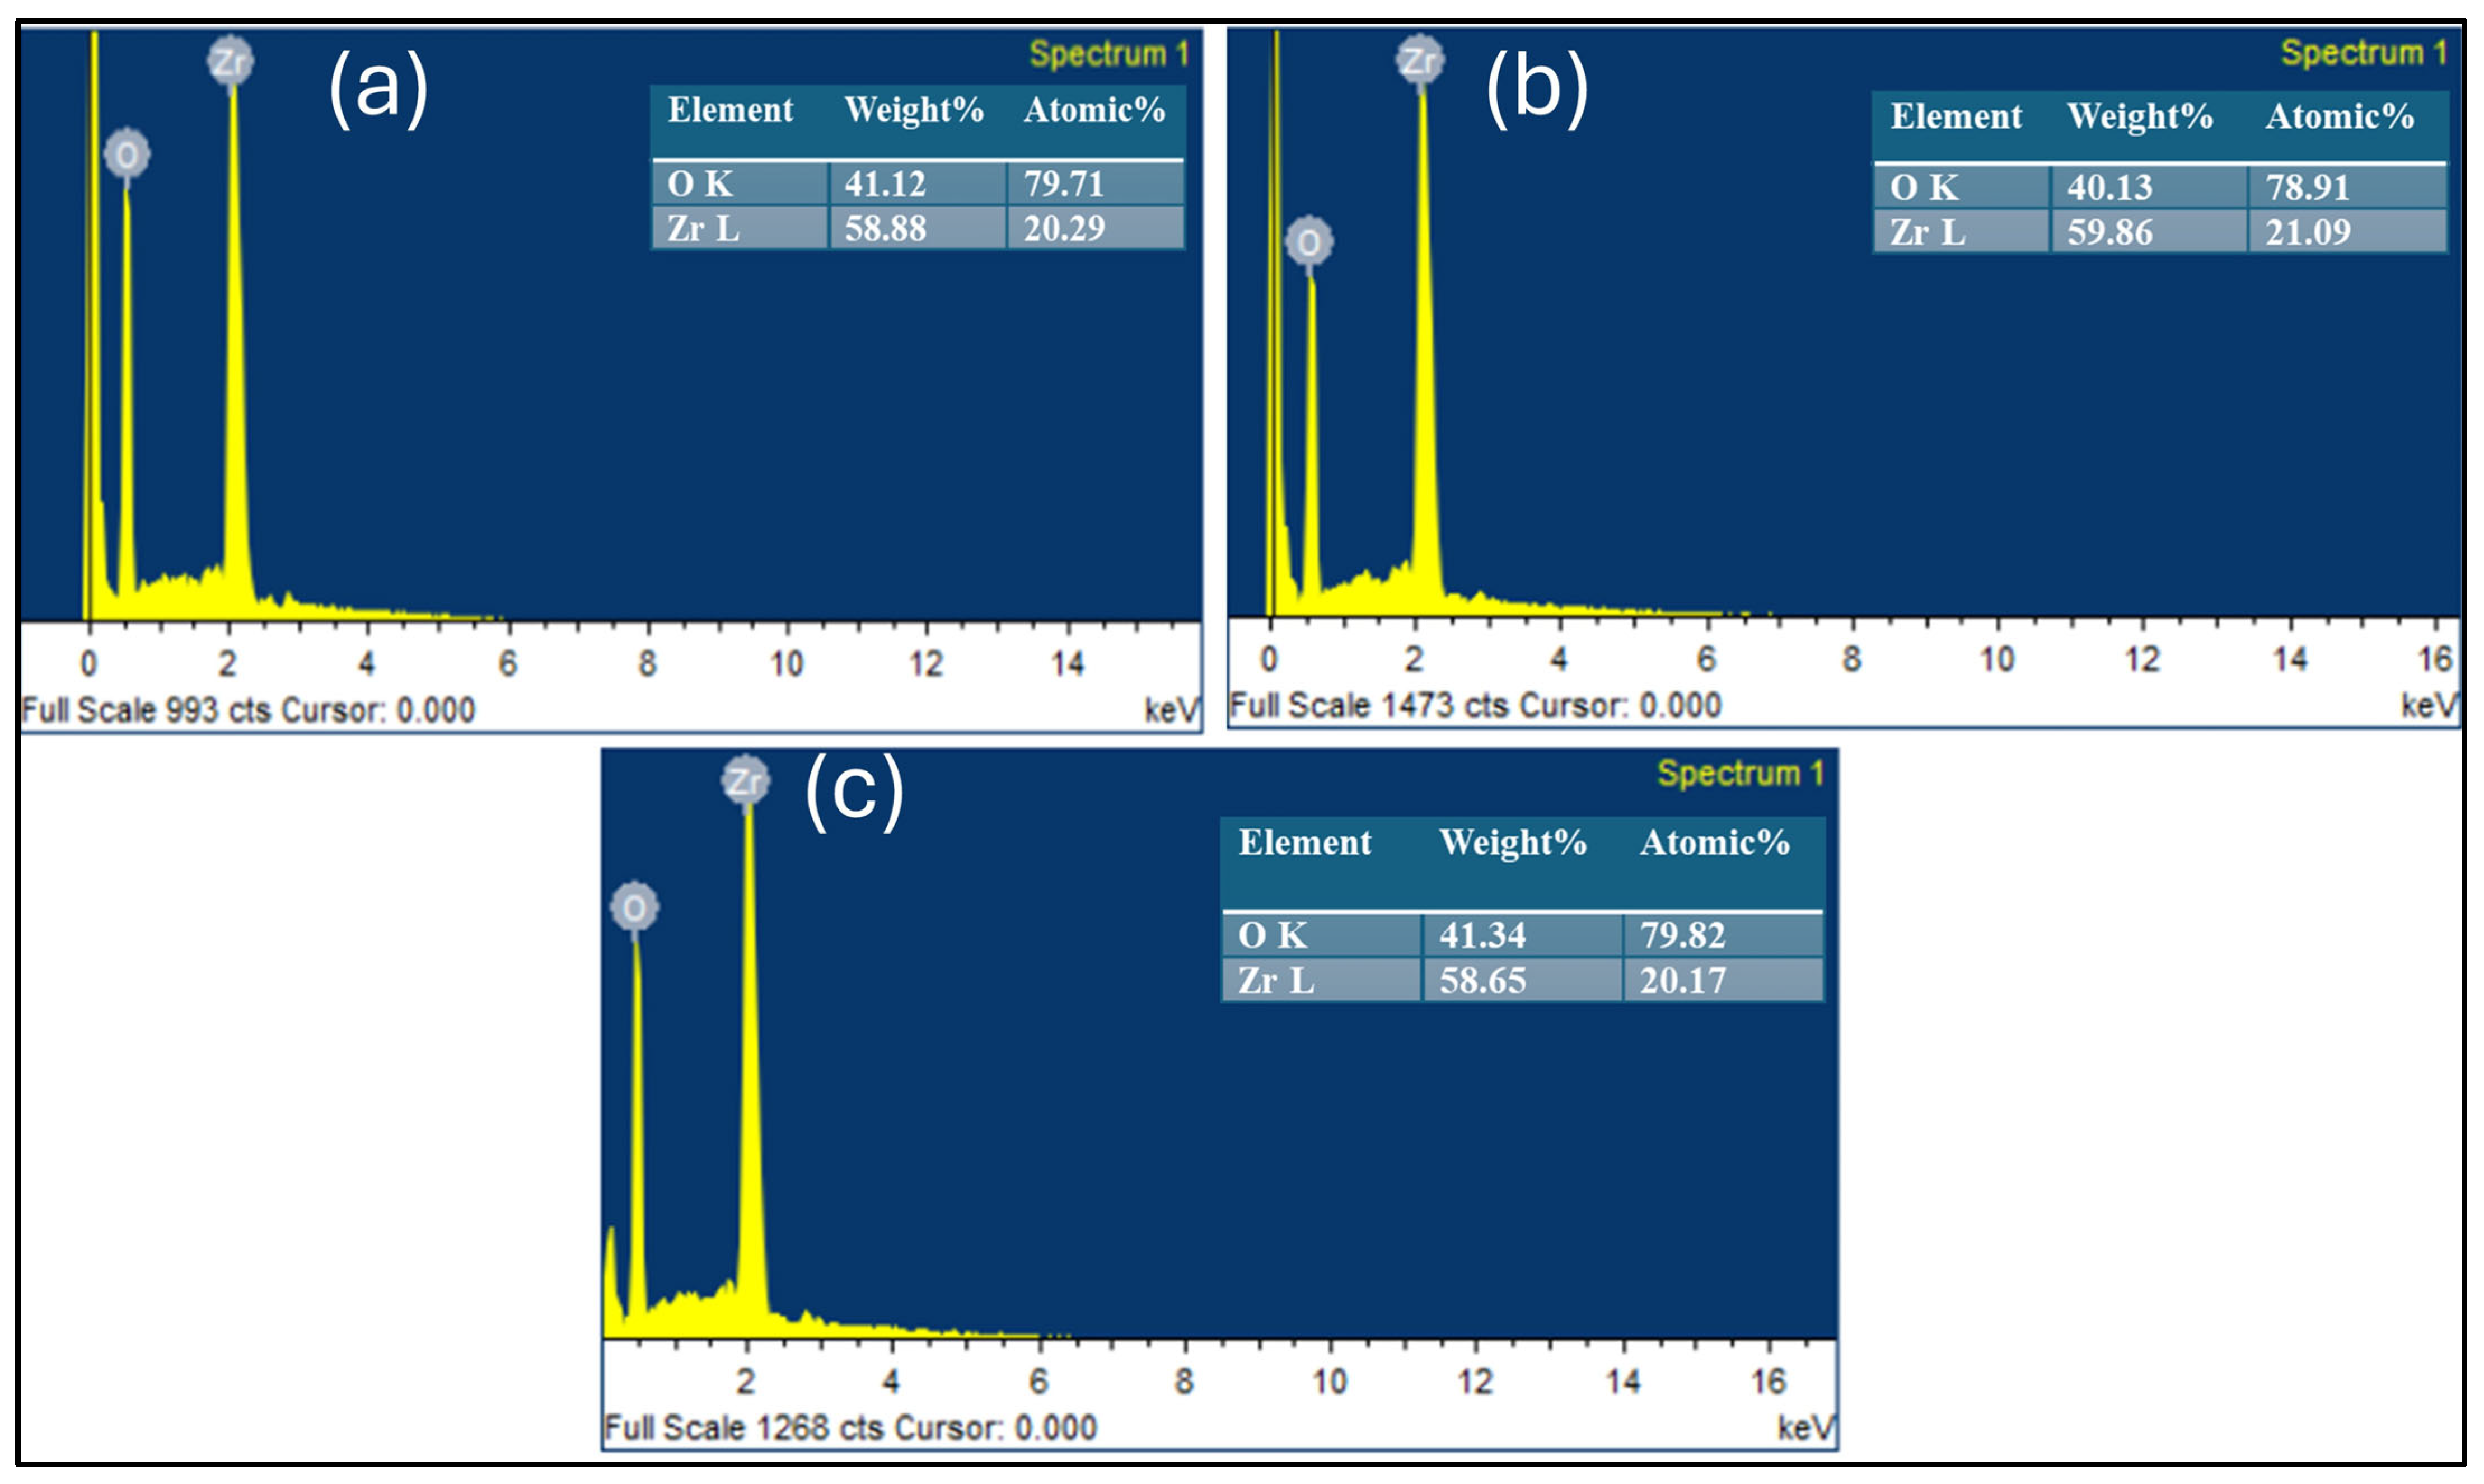
Further, an EDS analysis of the sample was carried out to assess the chemical compositional changes associated with milling and annealing, as shown in Figure 9a–c for the 0h-A, 80h-A, and 120h-A samples, respectively. All the samples show the presence of Zr and O, and no other trace elemental impurity is observed. No distinct difference between the sample stoichiometry is observed for the samples, suggesting annealing including homogenization of the samples.
Figure 9.
Energy Dispersive X-ray Spectrum for (a) 0h-A, (b) 80h-A, and (c) 120h-A samples.
3.6. Quantitative Evaluation of Surface Area and Porosity via BET–BJH
Further morphological analysis of the unmilled and milled samples was carried out through specific surface area (BET method) and pore structure analysis (BJH method), and the results are shown in Table 1.
Table 1.
Comparison of the BET surface area, total pore volume, and average pore diameter for the 0h-B, 80h-B, and 120h-B samples.
The BET analysis shows an increase in the surface area for the milled samples in comparison to the unmilled samples. The 0h-B sample shows a surface area of 5.1002 m2g−1, which increases to 22.276 m2g−1 and 23.229 m2g−1 for the 80h-B and 120h-B samples, respectively. Recalling the earlier reports by our group on the same material, it was reported that the surface area increased rapidly to a maximum of 30.29 m2g−1 after 20 h of ball milling, followed by a slight decrease to 27.87 m2g−1 at 40 h of ball milling [20], indicating that the surface area either saturates or decreases beyond a certain milling duration. The present study reflects this behavior, as prolonged milling for 80 h and 120 h yields surface areas which are almost saturated, which could be due to the competing cold welding and fracturing phenomenon during the ball milling. This trend aligns with the SEM observations, in which fine fragments produced in the 80h-B and 120h-B samples form agglomerated, porous clusters rather than remaining as discrete particles. The pore characteristics further support this, as the 0h-B sample shows a low pore volume of 0.035 cm3g−1 and a large pore diameter of 13.906 nm, while milling increases the pore volume to 0.092753 cm3g−1 (80h-B) and 0.086308 cm3g−1 (120h-B), with corresponding pore diameters reducing to 8.3275 nm and 7.4312 nm. Overall, the combined BET–BJH and SEM results indicate that, although milling enhances crystallite refinement and porosity, the surface area eventually stabilizes due to agglomeration and pore-structure consolidation at extended milling times.
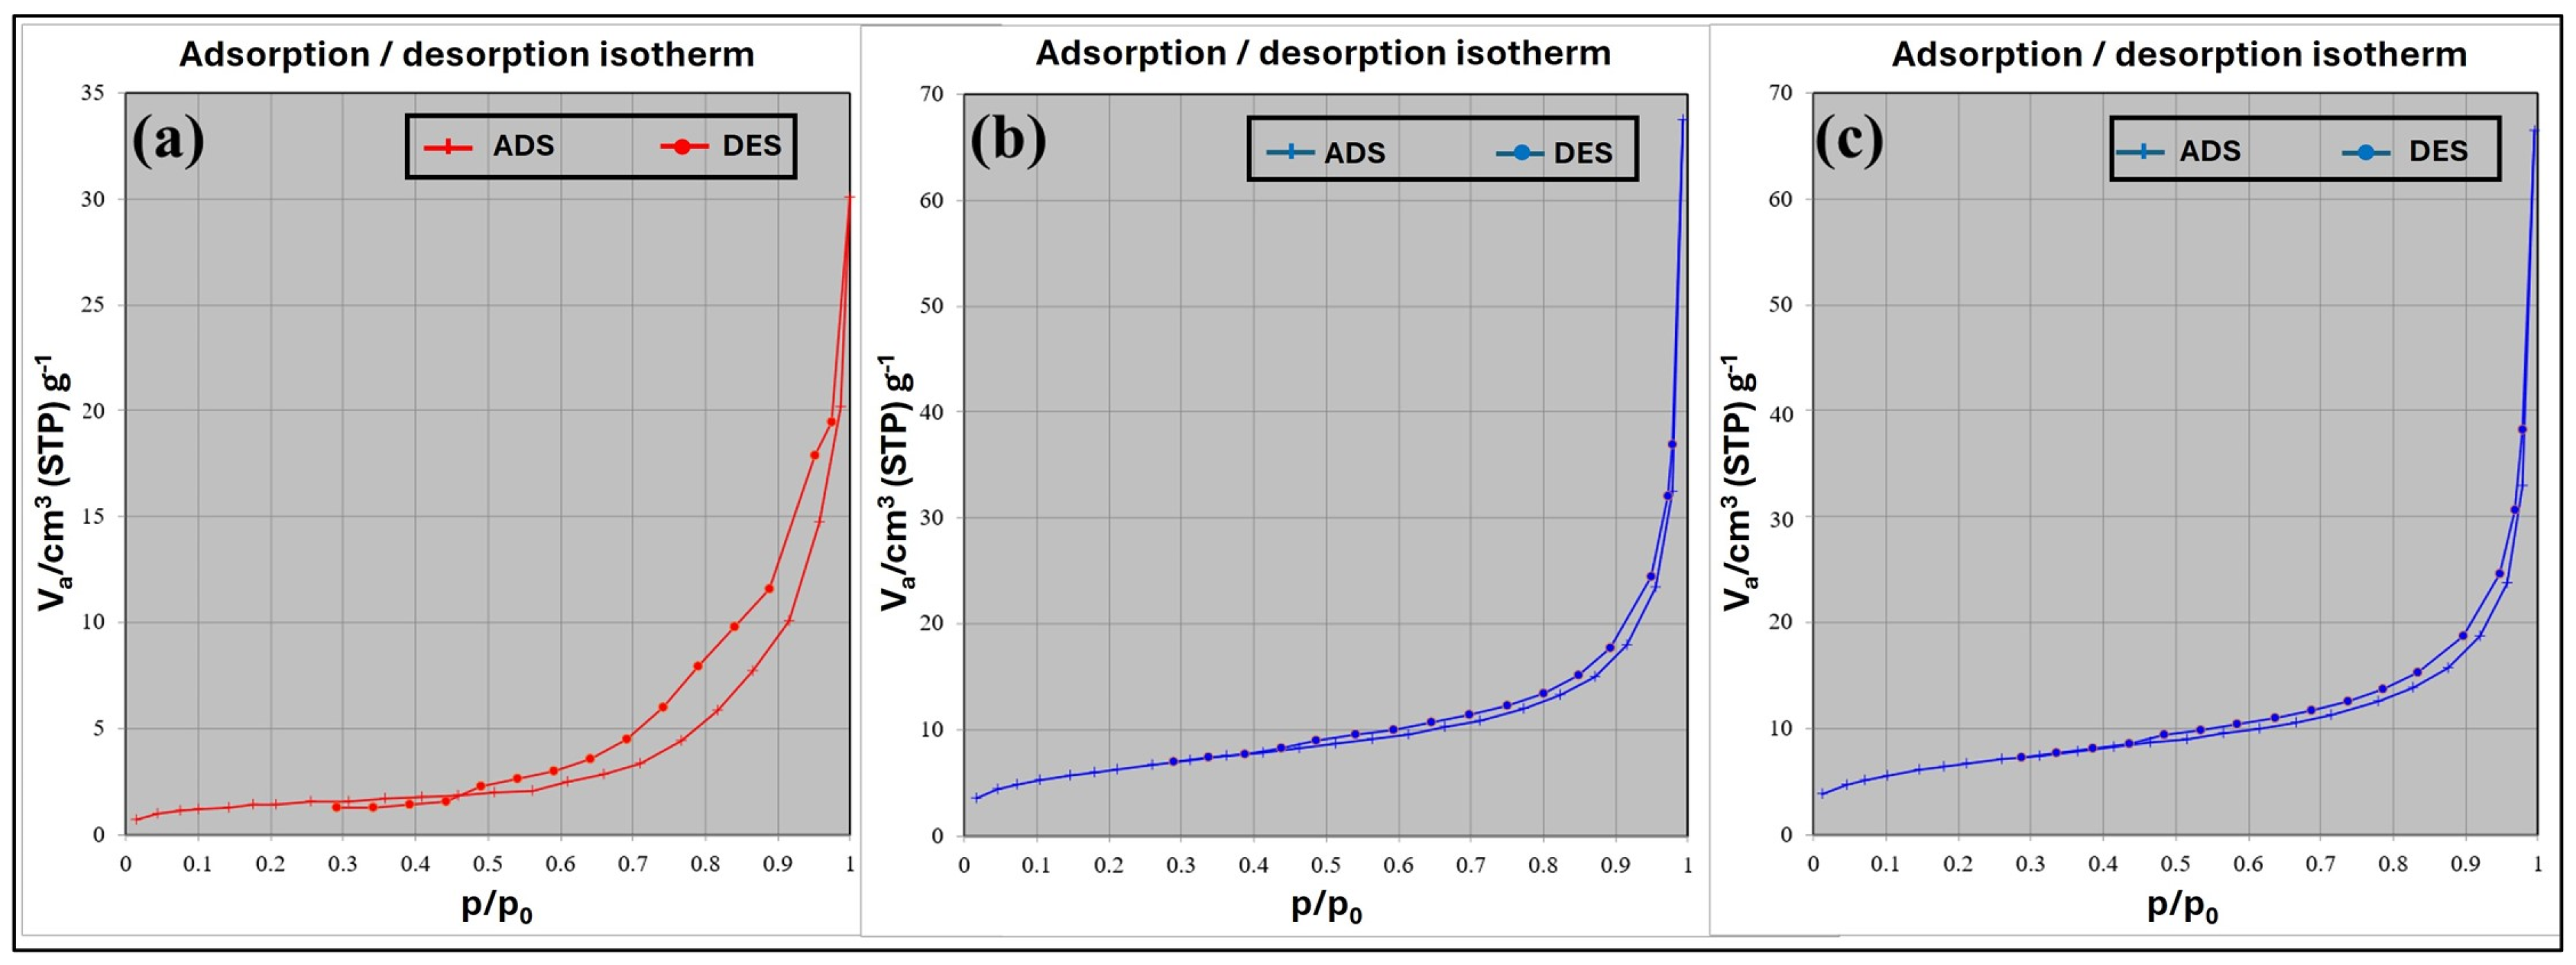
Further, the BET–BJH adsorption–desorption isotherms, as shown in Figure 10a, shows that the 0h-B sample exhibits the widest hysteresis loop, indicating dominant interparticle mesoporosity. After 80 h of milling, the hysteresis loop narrows significantly, as shown in Figure 10b, suggesting pore densification and partial closure due to efficient particle rearrangement. With further milling to 120 h, the hysteresis loop widens again, as shown in Figure 10c, which can be attributed to the agglomeration of ultrafine particles that generate secondary inter-agglomerate mesopores, without a corresponding increase in the BET surface area [31].
Figure 10.
N2 adsorption–desorption isotherms used for the BET surface area and the BJH pore size analysis of (a) 0h-B, (b) 80h-B, and (c) 120h-B samples.
3.7. Chemical Bonding and Functional Group Studies via FTIR Spectroscopy
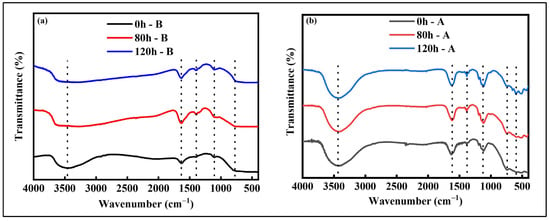
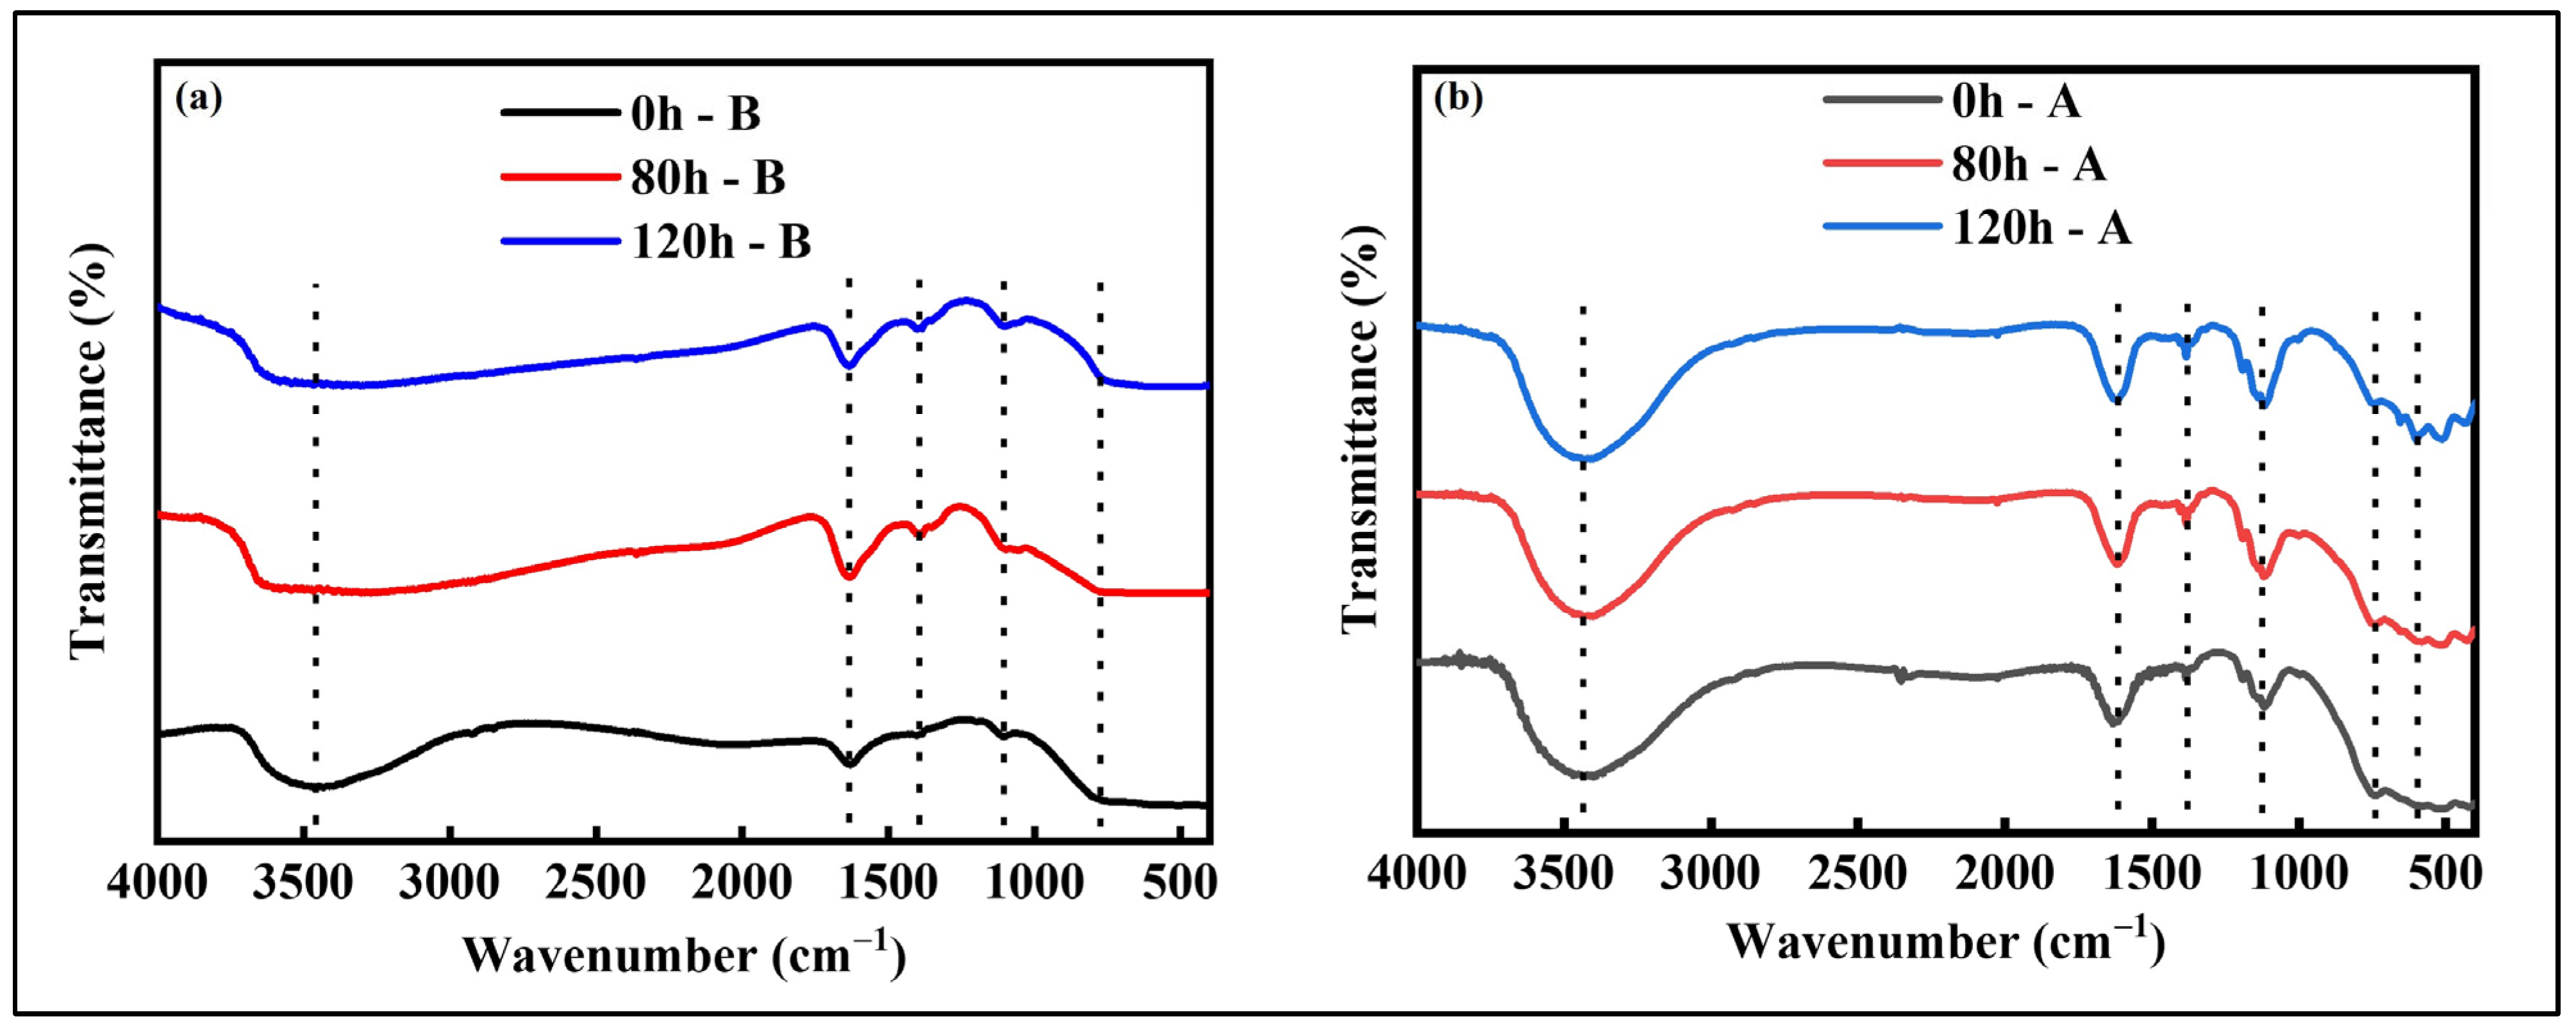
The vibrational characteristics of the ZrO2 samples subjected to milling and annealing treatments are examined through FTIR spectroscopy, and are presented in Figure 11a,b. Figure 11a shows that the FTIR spectra of the initial and ball-milled samples exhibit broad absorption features associated with surface hydroxyl groups and lattice vibrations. A band at 3450 cm−1 corresponds to OH stretching [32], while the 1630 cm−1 band is assigned to the H–O–H bending vibration of adsorbed water. Additional weaker absorptions at 1389 cm−1 and 1103 cm−1 indicate residual carbonate or lattice overtones. In the low-frequency region, characteristic of Zr–O vibrations, a broad absorption with a weak shoulder at 773 cm−1 reflects the monoclinic phase [33]. The overall broadness of these features signifies microstrain, disorder, and nanoscale crystallite dimensions introduced during ball milling.
Figure 11.
FTIR spectra for (a) initial (0h-B) and ball-milled samples (80h-B and 120h-B) and (b) annealed (0h-A, 80h-A, and 120h-A) samples.
Upon annealing, the spectra shown in Figure 11b exhibit sharper and more intense OH-related bands at 3437 cm−1 and 1617 cm−1 [32], signifying structural relaxation and removal of loosely bound surface water. New, sharper absorptions emerge at 1376 cm−1 and 1194 cm−1 due to Zr–O stretching vibration [34], and 1118 cm−1, confirming improved ordering. In the fingerprint region, well-resolved bands appear for the 120h-A sample at 734 cm−1, indicating the presence of the monoclinic phase of ZrO2 [33], at 650 cm−1 and 596 cm−1, indicating the presence of the tetragonal phase of ZrO2 [33], and at 507 cm−1 and 435 cm−1, clearly evidencing the coexistence of monoclinic and tetragonal phases. The sharpening and resolution of these vibrations after annealing reflect recrystallization, grain growth, and relaxation of milling-induced strain.
3.8. Understanding Thermal Stability and Phase Transitions Through TGA/DSC Analysis
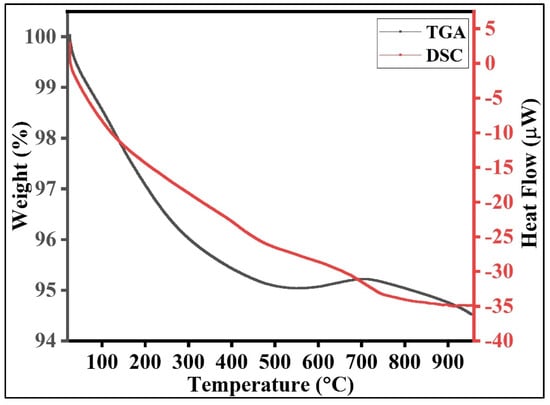
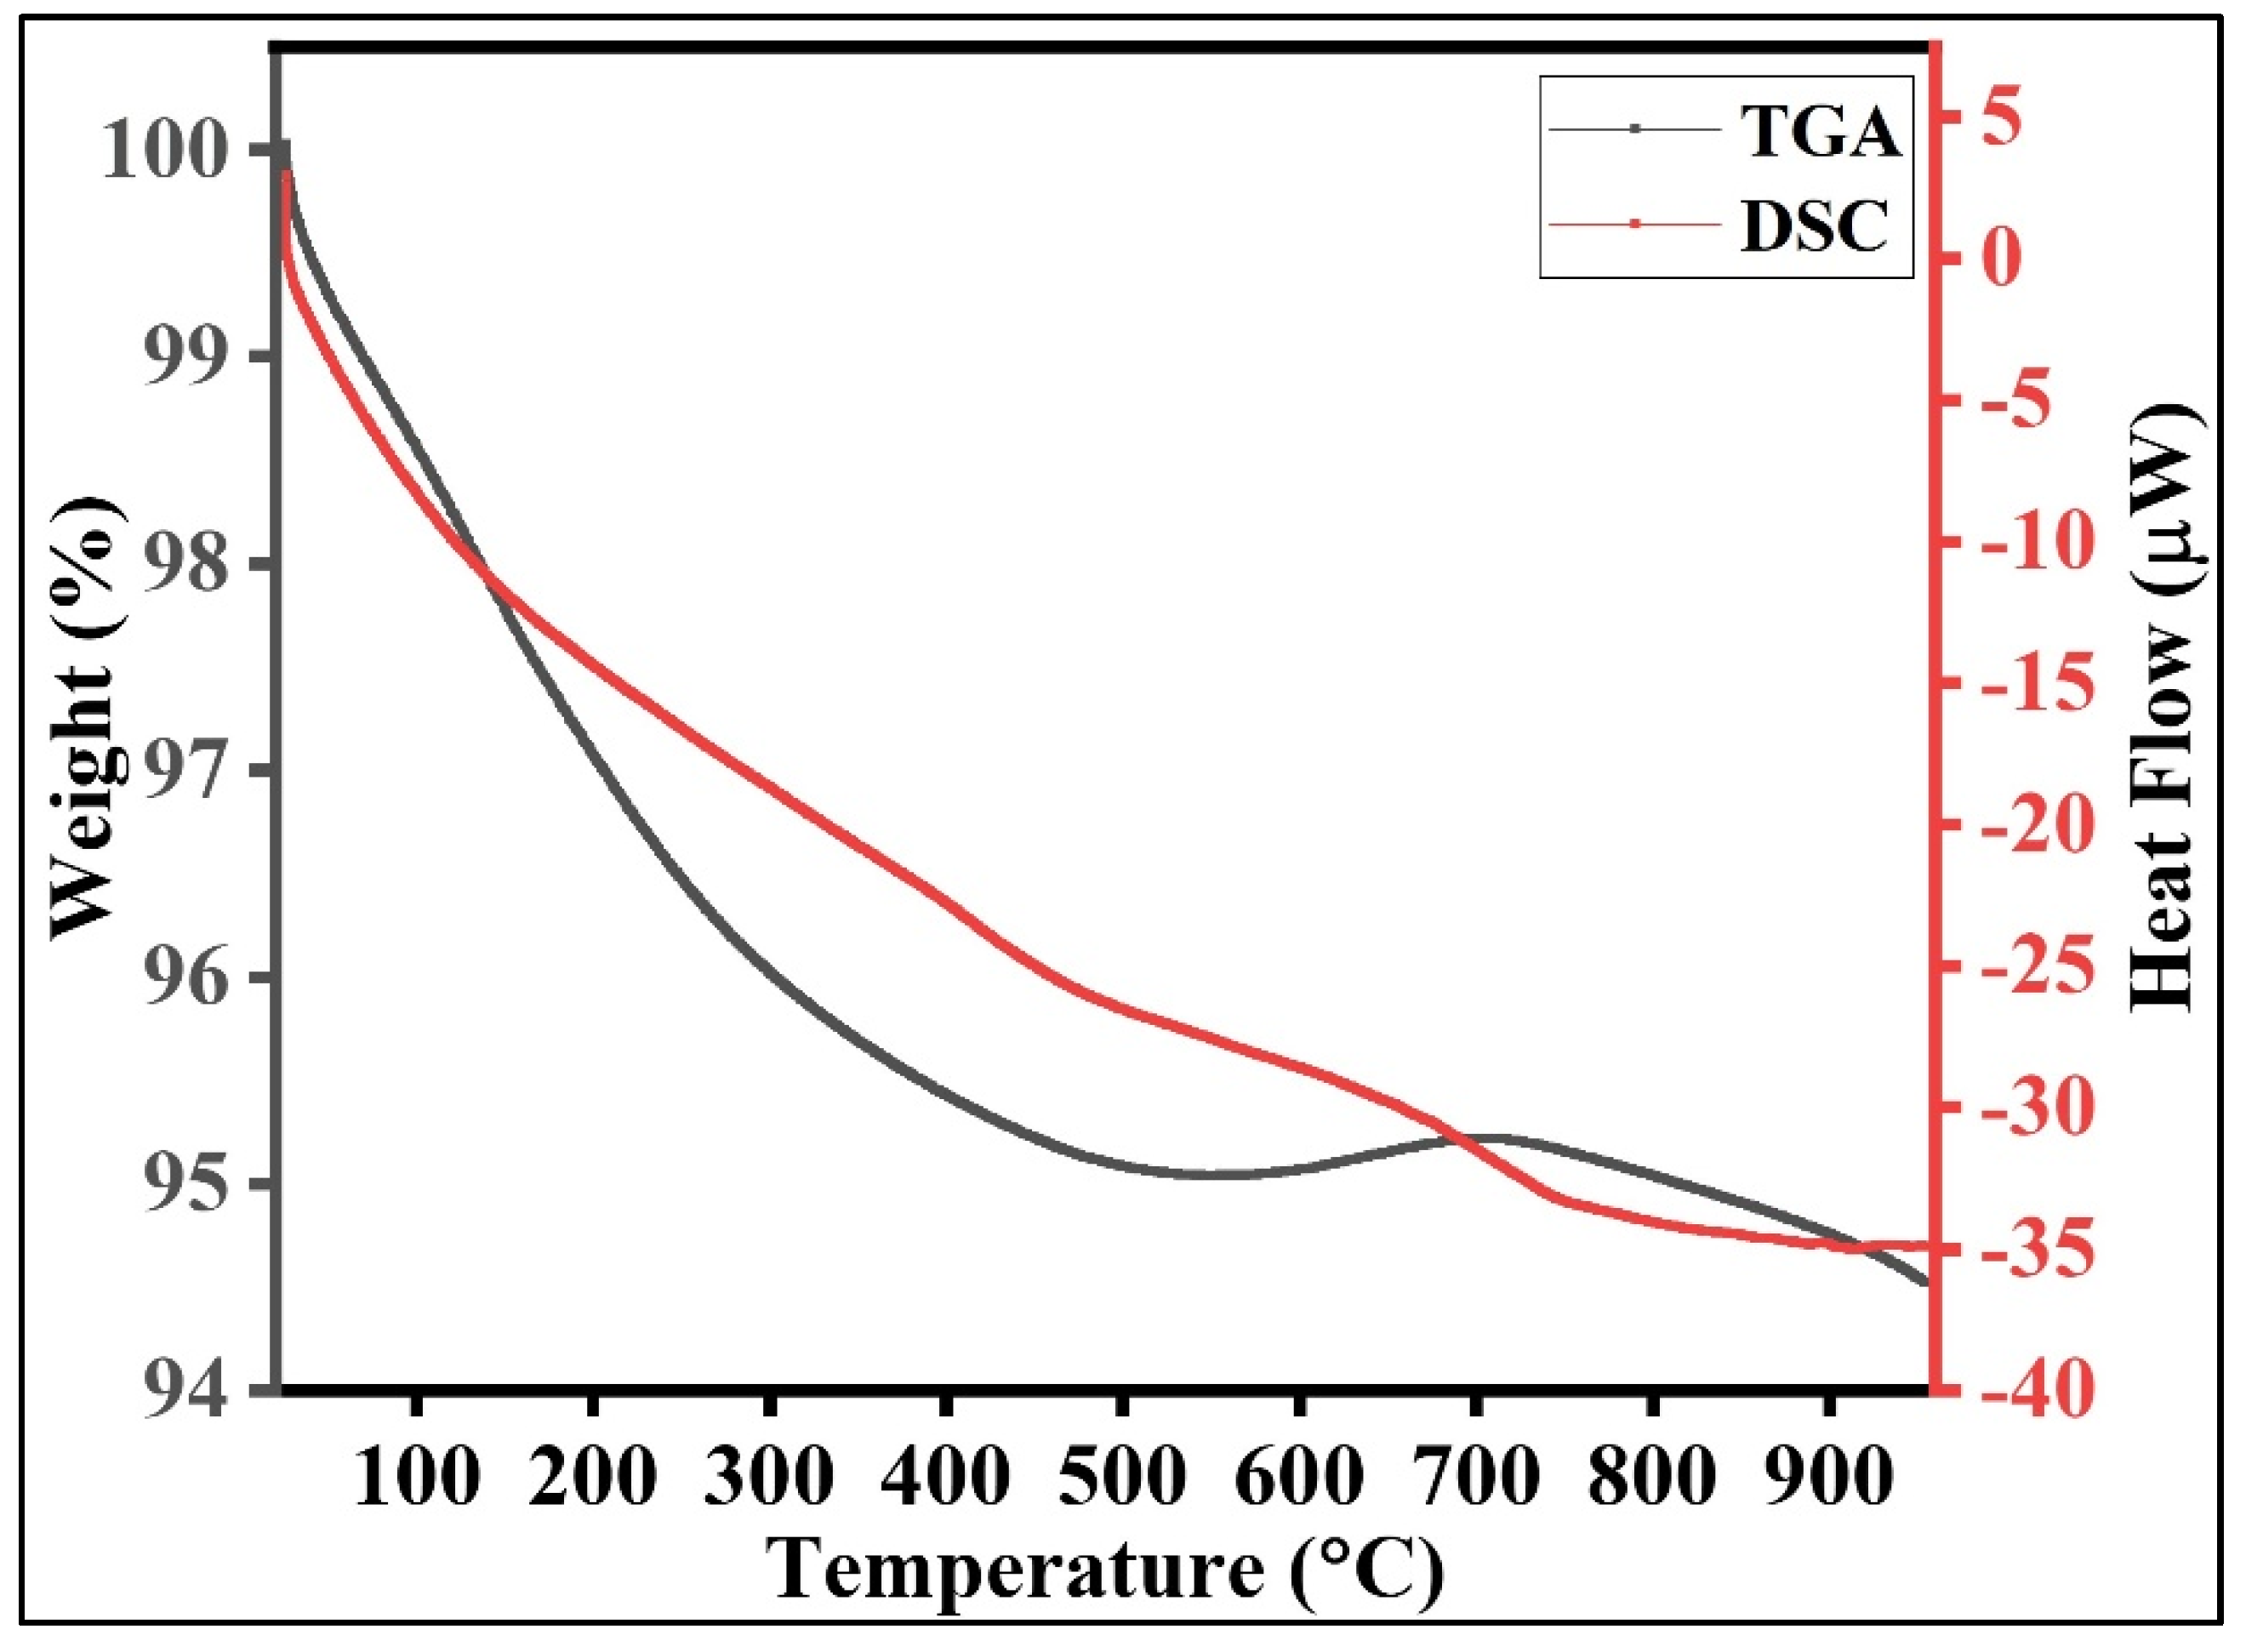
To observe the sample’s high-temperature stability, a TGA/DSC analysis was performed for the 120h-B sample, as shown in Figure 12. The enhanced surface area and defect density of the milled powder promote moisture adsorption, leading to low-temperature mass loss. Therefore, the initial weight loss below ~200 °C is attributed to the removal of physically adsorbed moisture and residual surface hydroxyl groups introduced during prolonged milling [35]. The progressive mass reduction between 200 °C and 600 °C is associated with the elimination of chemically bound hydroxyl groups and the relaxation of milling-induced lattice defects [36]. A minor mass fluctuation (~0.2 wt%) is observed between 600 °C and 700 °C; however, no corresponding DSC signal is detected in this region. Considering the thermodynamic stability of ZrO2 at these temperatures, this variation is attributed to instrumental uncertainty, and no additional physicochemical process is expected. Above ~750 °C, the sample exhibits gradual mass stabilization with no pronounced endothermic or exothermic peaks, indicating the absence of abrupt phase transitions within the investigated temperature range. Overall, the total mass loss up to 950 °C is ~5%, primarily due to desorption of moisture and defect-related species introduced during prolonged ball milling. The absence of detectable endothermic or exothermic events in the DSC thermogram up to 950 °C indicates suppression of the tetragonal–monoclinic transformation, confirming thermodynamic and kinetic stabilization of the biphasic microstructure within the investigated temperature regime.
Figure 12.
TGA/DSC curve of the 120h-B sample.
3.9. Evaluating Mechanical Strength Through Vickers Hardness Measurement
Further to the evaluation of microstructural parameters, a preliminary mechanical property analysis is performed using Vickers microhardness measurements. The measurements were carried out on the SPS consolidated samples, and a moderate densification under the chosen processing conditions is observed, with relative densities of ~64.95% and ~52.72% of the theoretical density observed for the 0h-B and 120h-B samples, respectively.
The hardness measurements indicated that the 0h-B specimen has an average hardness of 551 ± 82 HV (~5.5 ± 0.8 GPa), whereas the 120h-B sample showed a significantly higher hardness of 989 ± 71 HV (~9.7 ± 0.7 GPa), despite a relatively lower densification. This enhanced hardness of the 120h ball-milled sample can be attributed to grain refinement, which leads to Hall–Petch strengthening and the presence of a tetragonal phase fraction, which may lead to transformation toughening [37]. Further, prolonged high-energy ball milling results in severe lattice distortion and substantial lattice strain owing to enhanced defect density and stored energy, leading to hardened particles. It is presumed that these microstructural strengthening effects outweigh the softening typically expected from low density, thus leading to higher hardness in the 120h-B sample.
The observed hardness values are in line with the literature reported values of hardness for sintered stabilized ZrO2, which varies between ~5.4 and 8.8 GPa [38]. The observed hardness value is slightly higher here for the 120h-B sample, which is owing to the reasons discussed above, and is sparsely reported the literature for extended milling durations and extreme microstructural states, limiting a direct comparison with the existing literature. Further enhancement in mechanical properties can be achieved with optimization of the SPS process conditions and the addition of additives, such as reduced graphene oxide and graphene, which are known to enhance the hardness due to reinforcement effects and to help in near-full densification, as reported in the literature [39,40].
Hardness in oxide ceramics is intrinsically governed by processing-induced microstructural evolution, including grain size refinement, densification behavior, phase constitution, and defect chemistry. Processing routes that promote fine-grained, near theoretical density microstructures with controlled lattice distortion typically enhance hardness through grain boundary strengthening and solid solution effects. Conversely, grain coarsening, residual porosity, and microcrack formation during thermal treatment can significantly deteriorate the measured hardness and mechanical reliability. Here, the synergistic influence of microstructural refinement and secondary phase fraction appears to govern the mechanical response of the ball-milled samples, thereby critically determining their suitability for structural and functional applications. These findings suggest that ball milling serves as an effective microstructural engineering strategy to tailor phase distribution and to optimize the associated mechanical properties.
4. Conclusions
The present study establishes the critical role of mechanical activation and thermal treatment in governing the phase stability and microstructural evolution of ZrO2 as analyzed through spectroscopy and microscopy tools. Chief conclusions drawn from the analysis are as follows:
- High-energy ball milling induces crystallite refinement, microstrain, and partial phase transformation from monoclinic to tetragonal, which is progressively increased with milling duration.
- Annealing at 1000 °C relieves strain while stabilizing the tetragonal phase, with higher retention observed in the 120 h milled samples. The results are evidenced through XRD analysis, and a Raman analysis corroborated the same.
- Raman results also revealed the presence of cubic-like distorted tetragonal domains, which are not detected by XRD due to their limited long-range order and are attributed to local structural disorder and oxygen vacancy-induced symmetry relaxation.
- SEM reveals nanoparticle formation during milling and faceted grain development after annealing, while nanoscale features are preserved in the milled–annealed samples, unlike the unmilled counterpart. Quantification of the microstructure is carried out through image analysis, and the results resonate the same.
- A surface area analysis through the BET method indicated saturation of surface area after prolonged milling, indicating the saturation between fracturing and cold-welding during milling.
- A thermal analysis indicated no phase transformation at the investigated temperature region and confirmed thermodynamic and kinetic stabilization of the biphasic microstructure. This biphasic structure is expected to impart enhanced stability, highlighting the potential of the milling–annealing synergy for tailoring ZrO2 microstructures.
- Compared to our previous work [20] using 40 h milling, the present study demonstrates saturation in both crystallite size and surface area upon prolonged milling up to 120 h. It further advances the understanding of phase evolution in ball-milled ZrO2 during annealing, providing clear evidence for tetragonal phase formation, with a higher tetragonal fraction in the 120 h milled sample relative to the 80 h counterpart. Additionally, the presence of locally cubic-like distorted tetragonal domains is identified, which are not resolved by XRD but are captured via Raman spectroscopy.
Author Contributions
M.K.M. performed the experiments, analyzed the data, and drafted the manuscript. S.J.S. assisted in the experimental work, participated in the discussions, and edited the manuscript. A.R. supported with the experimental characterization facilities. G.S.C. provided the resources, participated in the discussion, and edited the manuscript. M.S. helped in analyzing the data and provided valuable inputs with the discussions. T.S. provided the resources for the Raman analysis of the samples and helped analyzing the data, participated in the discussions, and edited the manuscript. R.K.G. coordinated and oversaw the entire project, helped with resources, and edited the manuscript. All authors have read and agreed to the published version of the manuscript.
Funding
This research received no external funding.
Institutional Review Board Statement
Not applicable.
Informed Consent Statement
Not applicable.
Data Availability Statement
The original contributions presented in this study are included in the article. Further inquiries can be directed to the corresponding author.
Acknowledgments
Author M.K.M. thanks the Manipal Academy of Higher Education for supporting this work with M.Sc. seed money grant. R.K.G. thanks the Manipal Academy of Higher Education for providing experimental and characterization facilities. The authors acknowledge UGC-DAE CSR, BARC Mumbai, for the SPS facility and sincerely thank Sudhindra Rayaprol and Som Datta Kaushik for their support. All authors thank their respective institutes for facilitating this research.
Conflicts of Interest
Author Tarun Sharda was employed by the company Technos Instruments. The remaining authors declare that the research was conducted in the absence of any commercial or financial relationships that could be construed as a potential conflict of interest.
References
- Randhawa, K.S. Advanced Ceramics in Energy Storage Applications: Batteries to Hydrogen Energy. J. Energy Storage 2024, 98, 113122. [Google Scholar] [CrossRef] [Scilit]
- Zong, X.; Wu, S.; Lin, K.; Zhang, J.; Li, Y.; Lu, D.; Deng, X.; Lu, S.; Qiu, J.; Shao, Y.; et al. Advanced Ceramics with Integrated Structures and Functions: Machine Learning Prediction and Experimental Verification. Ceram. Int. 2024, 50, 24126–24138. [Google Scholar] [CrossRef] [Scilit]
- Valizadeh Harzand, F.; Samandizade, E.; Yazdani Dizicheh, A.; Nematollahzadeh, A. Ceramic Coatings for Extreme Environments and Energy Systems: A Review. Synth. Sinter. 2025, 5, 136–150. [Google Scholar] [CrossRef] [Scilit]
- Thanigachalam, M.; Subramanian, A.V.M. Fabrication, Microstructure and Properties of Advanced Ceramic-Reinforced Composites for Dental Implants: A Review. Biomater. Transl. 2023, 4, 151–165. [Google Scholar]
- Bai, R.; Sun, Q.; He, Y.; Peng, L.; Zhang, Y.; Zhang, L.; Lu, W.; Deng, J.; Zhuang, Z.; Yu, T.; et al. Ceramic Toughening Strategies for Biomedical Applications. Front. Bioeng. Biotechnol. 2022, 10, 840372. [Google Scholar] [CrossRef] [Scilit] [PubMed]
- Abd-Elwahed, M.S.; Ibrahim, A.F.; Reda, M.M. Effects of ZrO2 Nanoparticle Content on Microstructure and Wear Behavior of Titanium Matrix Composite. J. Mater. Res. Technol. 2020, 9, 8528–8534. [Google Scholar] [CrossRef] [Scilit]
- Zoli, L.; Servadei, F.; Bassi, G.; Rossi, A.; Montesi, M.; Vinci, A.; Sciti, D.; Panseri, S. From Outer Space to inside the Body: Ultra-High Temperature Ceramic Matrix Composites for Biomedical Applications. J. Eur. Ceram. Soc. 2024, 44, 729–737. [Google Scholar] [CrossRef] [Scilit]
- Ayode Otitoju, T.; Ugochukwu Okoye, P.; Chen, G.; Li, Y.; Onyeka Okoye, M.; Li, S. Advanced Ceramic Components: Materials, Fabrication, and Applications. J. Ind. Eng. Chem. 2020, 85, 34–65. [Google Scholar] [CrossRef] [Scilit]
- Jitwirachot, K.; Rungsiyakull, P.; Holloway, J.A.; Jia-Mahasap, W. Wear Behavior of Different Generations of Zirconia: Present Literature. Int. J. Dent. 2022, 2022, 9341616. [Google Scholar] [CrossRef] [Scilit]
- Petchmark, M.; Ruangpornvisuti, V. Hydrogen Adsorption on C-ZrO2(111), t-ZrO2(101), and m-ZrO2(111) Surfaces and Their Oxygen-Vacancy Defect for Hydrogen Sensing and Storage: A First-Principles Investigation. Mater. Lett. 2021, 301, 130243. [Google Scholar] [CrossRef] [Scilit]
- Erdem Yılmaz, Ö. Performance Assessment of ZrO2 Nanofibrous Oxygen Sensor. Çukurova Üniversitesi Mühendislik Fakültesi Derg. 2021, 36, 979–987. [Google Scholar] [CrossRef] [Scilit]
- Arifin, N.A.; Afifi, A.A.; Samreen, A.; Hafriz, R.S.R.M.; Muchtar, A. Characteristic and Challenges of Scandia Stabilized Zirconia as Solid Oxide Fuel Cell Material—In Depth Review. Solid State Ion. 2023, 399, 116302. [Google Scholar] [CrossRef] [Scilit]
- Gutierrez-Sanchez, C.D.; Dorantes-Rosales, H.; Balmori-Ramírez, H.; Téllez-Jurado, L. Phase Transformation Kinetics of Zirconia Nanoparticles: Comparative Study of Acidic or Basic Medium in Sol-Gel Synthesis. Ceram. Int. 2025, 51, 36426–36437. [Google Scholar] [CrossRef] [Scilit]
- Song, X.; Ding, Y.; Zhang, J.; Jiang, C.; Liu, Z.; Lin, C.; Zheng, W.; Zeng, Y. Thermophysical and Mechanical Properties of Cubic, Tetragonal and Monoclinic ZrO2. J. Mater. Res. Technol. 2023, 23, 648–655. [Google Scholar] [CrossRef] [Scilit]
- Zhou, G.; Jin, P.; Wang, Y.; Pei, G.; Wu, J.; Wang, Z. X-Ray Diffraction Analysis of the Yttria Stabilized Zirconia Powder by Mechanical Alloying and Sintering. Ceram. Int. 2020, 46, 9691–9697. [Google Scholar] [CrossRef] [Scilit]
- Wang, J.; Chen, M.; Sun, J.; Hu, M.; Lu, X.; Shu, C.; Zhang, H.; Wang, Y. Phase Stability and Thermophysical Properties of CeO2-Re2O3 (ReEu, Gd, Dy, Y, Er, Yb) Co-Stabilised Zirconia. Ceram. Int. 2023, 49, 21634–21644. [Google Scholar] [CrossRef] [Scilit]
- Matsui, K.; Hosoi, K.; Feng, B.; Yoshida, H.; Ikuhara, Y. Ultrahigh Toughness Zirconia Ceramics. Proc. Natl. Acad. Sci. USA 2023, 120, e2304498120. [Google Scholar] [CrossRef] [Scilit]
- Arcila, L.V.C.; de Carvalho Ramos, N.; Campos, T.M.B.; Dapieve, K.S.; Valandro, L.F.; de Melo, R.M.; Bottino, M.A. Mechanical Behavior and Microstructural Characterization of Different Zirconia Polycrystals in Different Thicknesses. J. Adv. Prosthodont. 2021, 13, 385–395. [Google Scholar] [CrossRef] [Scilit]
- Suryanarayana, C. Mechanical Alloying and Milling. Prog. Mater. Sci. 2001, 46, 1–184. [Google Scholar] [CrossRef] [Scilit]
- Shetty, S.J.; Kumar Munchikana, M.; George, A.; Rajendran, A.; Gurumurthy, S.C.; Vairavel, P.; Sharda, T.; Gururaj, R.K. Ball Milling-Induced Evolution of Structural, Optical, and Catalytic Properties in Nanocrystalline ZrO2. Mater. Res. Express 2025, 12, 125012. [Google Scholar] [CrossRef] [Scilit]
- Mosavari, M.; Khajehhaghverdi, A.; Mehdinavaz Aghdam, R. Nano-ZrO2: A Review on Synthesis Methodologies. Inorg. Chem. Commun. 2023, 157, 111293. [Google Scholar] [CrossRef] [Scilit]
- Srdić, V.V.; Winterer, M.; Hahn, H. Sintering Behavior of Nanocrystalline Zirconia Prepared by Chemical Vapor Synthesis. J. Am. Ceram. Soc. 2000, 83, 729–736. [Google Scholar] [CrossRef] [Scilit]
- Rodriguez-Carvajal, J.; Gonzalez-Platas, J.; Katcho, N.A. Magnetic Structure Determination and Refinement Using FullProf. Acta Crystallogr. Sect. B 2025, 81, 302–317. [Google Scholar] [CrossRef] [Scilit]
- Arafati, A.; Borhani, E.; Nourbakhsh, S.M.S.; Abdoos, H. Synthesis and Characterization of Tetragonal/Monoclinic Mixed Phases Nanozirconia Powders. Ceram. Int. 2019, 45, 12975–12982. [Google Scholar] [CrossRef] [Scilit]
- Chen, M.H.; Thomas, J.C.; Natarajan, A.R.; Van Der Ven, A. Effects of Strain on the Stability of Tetragonal ZrO2. Phys. Rev. B 2016, 94, 054108. [Google Scholar] [CrossRef] [Scilit]
- Yi, M.; Zhang, Y.; Xu, J.; Deng, D.; Mao, Z.; Meng, X.; Shi, X.; Zhao, B. Surface-Enhanced Raman Scattering Activity of ZrO2 Nanoparticles: Effect of Tetragonal and Monoclinic Phases. Nanomaterials 2021, 11, 2162. [Google Scholar] [CrossRef] [Scilit]
- Thakur, M.; Vij, A.; Singh, F.; Rangra, V.S. Spectroscopic Studies of Metastable Tetragonal ZrO2 Nanocrystals. Spectrochim. Acta A Mol. Biomol. Spectrosc. 2024, 305, 123495. [Google Scholar] [CrossRef] [Scilit]
- Sekulić, A.; Furic, K.; Stubicarb, M. Raman Study of Phase Transitions in Pure and Alloyed Zirconia Induced by Ball-Milling and a Laser Beam. J. Mol. Struct. 1997, 410, 275–279. [Google Scholar] [CrossRef] [Scilit]
- Gazzoli, D.; Mattei, G.; Valigi, M. Raman and X-Ray Investigations of the Incorporation of Ca2+ and Cd2+ in the ZrO2 Structure. J. Raman Spectrosc. 2007, 38, 824–831. [Google Scholar] [CrossRef] [Scilit]
- Asgarani, M.K.; Saidi, A.; Abbasi, M.H. Role of Oxygen Vacancy and Grain Boundary Energy in Stability of Tetragonal and Cubic Pure Zirconia Powders. Powder Metall. 2011, 54, 127–132. [Google Scholar] [CrossRef] [Scilit]
- Sydorchuk, V.; Levytska, S.; Kiziun, O.; Vasylechko, L.; Simkovicova, K.; Valtera, S.; Billinghurts, B.E.; Vajda, S.; Olszowka, J.E. Combined Hydrothermal and Mechanochemical Control of Structural Modifications of Zirconium Dioxide for Catalytic Applications. RSC Mechanochem. 2025, 2, 209–223. [Google Scholar] [CrossRef] [Scilit]
- Singh, A.K.; Nakate, U.T. Microwave Synthesis, Characterization, and Photoluminescence Properties of Nanocrystalline Zirconia. Sci. World J. 2014, 2014, 349457. [Google Scholar] [CrossRef] [Scilit]
- Heshmatpour, F.; Aghakhanpour, R.B. Synthesis and Characterization of Nanocrystalline Zirconia Powder by Simple Sol–Gel Method with Glucose and Fructose as Organic Additives. Powder Technol. 2011, 205, 193–200. [Google Scholar] [CrossRef] [Scilit]
- Sidhu, G.K.; Kaushik, A.K.; Rana, S.; Bhansali, S.; Kumar, R. Photoluminescence Quenching of Zirconia Nanoparticle by Surface Modification. Appl. Surf. Sci. 2015, 334, 216–221. [Google Scholar] [CrossRef] [Scilit]
- Deshmane, V.G.; Adewuyi, Y.G. Synthesis of Thermally Stable, High Surface Area, Nanocrystalline Mesoporous Tetragonal Zirconium Dioxide (ZrO2): Effects of Different Process Parameters. Microporous Mesoporous Mater. 2012, 148, 88–100. [Google Scholar] [CrossRef] [Scilit]
- Septiyaningrum, R.; Amin, A.K.; Trisunaryanti, W.; Wijaya, K. Synthesis of SO4/ZrO2 Catalyst and Its Application in the Conversion of Ethanol to Diethyl Ether. Iran. J. Catal. 2022, 12, 439–450. [Google Scholar] [CrossRef]
- Hannink, R.H.J.; Kelly, P.M.; Muddle, B.C. Transformation Toughening in Zirconia-Containing Ceramics. J. Am. Ceram. Soc. 2000, 83, 461–487. [Google Scholar] [CrossRef] [Scilit]
- Din, S.-U.; Kaleem, A. Vickers Hardness Study of Zirconia Partially Stabilized with Lanthanide Group Oxides. Mater. Chem. Phys. 1998, 53, 48–54. [Google Scholar] [CrossRef] [Scilit]
- Su, X.; Fu, M.; An, G.; Jiao, Z.; Tian, Q.; Wei, J. Fabrication of ZrO2/RGO Nanocomposites by Flash Sintering under AC Electric Fields. J. Am. Ceram. Soc. 2021, 104, 6079–6085. [Google Scholar] [CrossRef] [Scilit]
- Zou, H.; Zhang, Y.; Liu, L.; Shi, L.; Li, W. The Toughening Mechanism and Mechanical Properties of Graphene-Reinforced Zirconia Ceramics by Microwave Sintering. Adv. Appl. Ceram. 2018, 117, 420–426. [Google Scholar] [CrossRef] [Scilit]

Disclaimer/Publisher’s Note: The statements, opinions and data contained in all publications are solely those of the individual author(s) and contributor(s) and not of MDPI and/or the editor(s). MDPI and/or the editor(s) disclaim responsibility for any injury to people or property resulting from any ideas, methods, instructions or products referred to in the content. |
© 2026 by the authors. Licensee MDPI, Basel, Switzerland. This article is an open access article distributed under the terms and conditions of the Creative Commons Attribution (CC BY) license.