2. Computational Details and Model Description
The deposition conditions used in the simulations, adopted from the experimental results, are summarized in
Table 1.
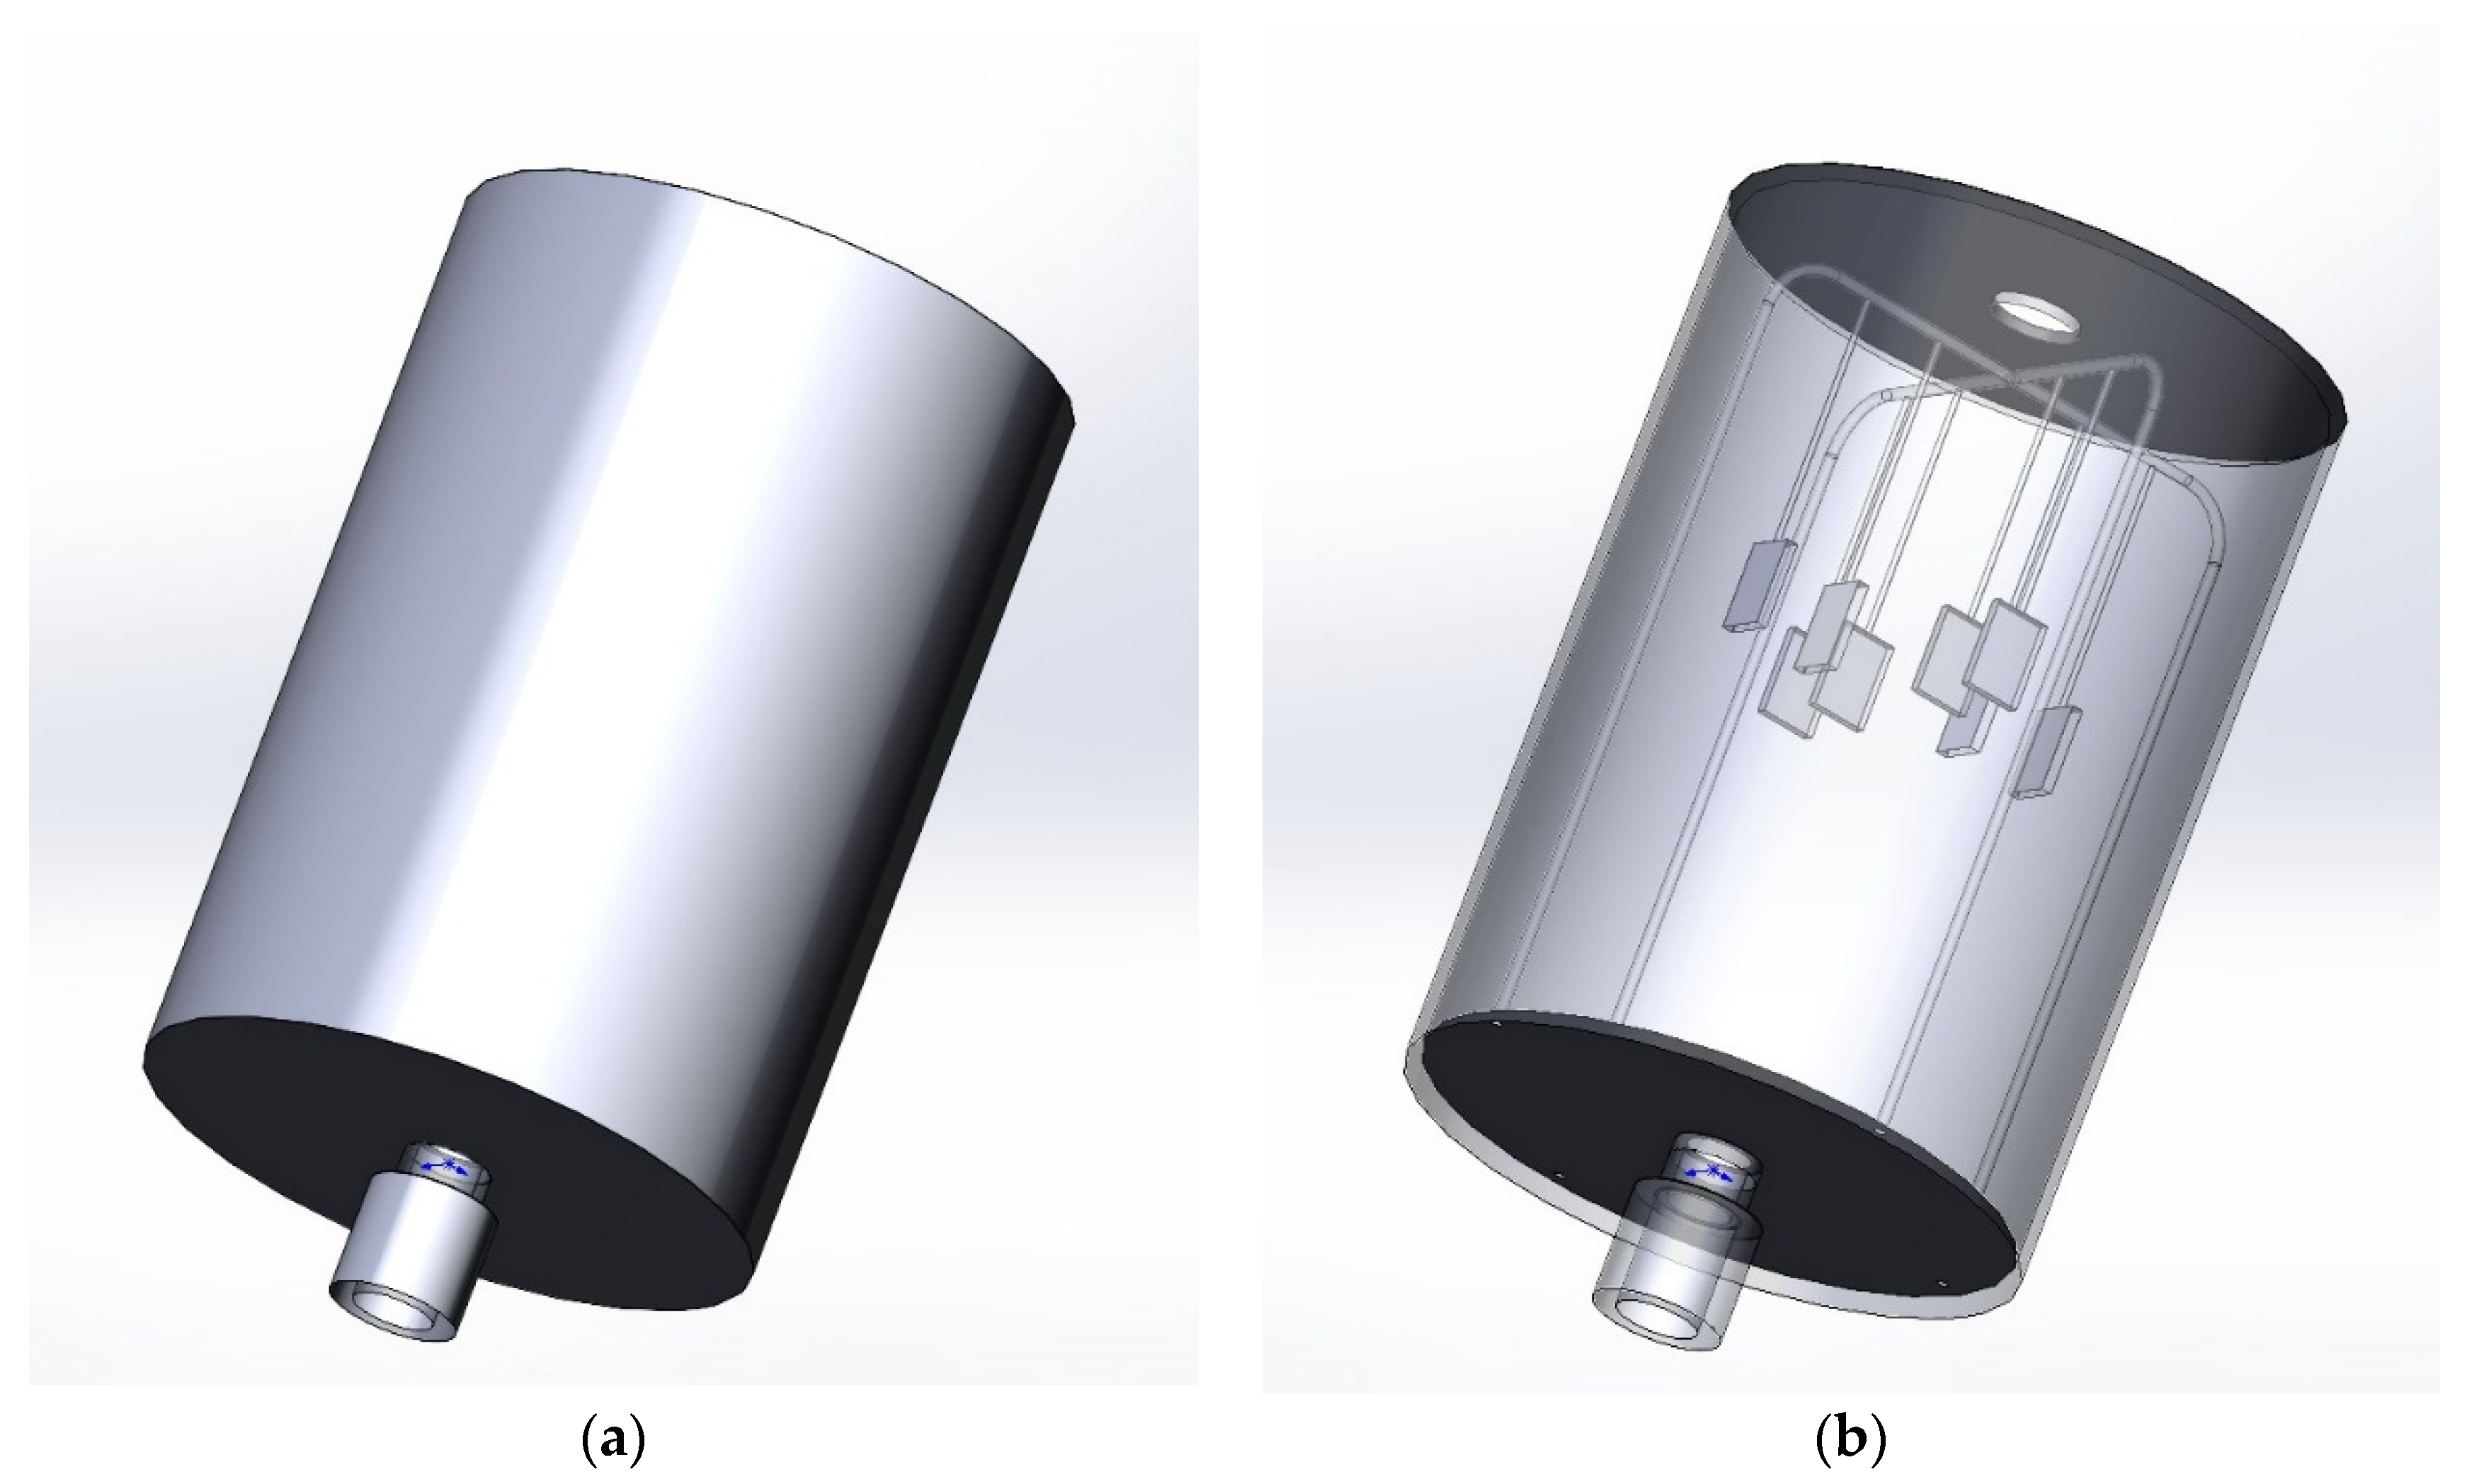
The CVD reactor model was developed using the COMSOL Multiphysics software package. A 3D model of the reaction zone is presented in
Figure 1, and the main reactor parameters are summarized in
Table 2.
Since the actual reactor consists of a cylindrical tube, the mathematical model was developed using a 2D axisymmetric formulation to reduce the required computational resources.
To determine the appropriate set of physics modules in COMSOL Multiphysics, a preliminary assessment of the gas flow characteristics and reaction kinetics was conducted. This evaluation was performed by calculating a series of dimensionless numbers (similarity criteria) for the process under study. These criteria allow for the assessment of the flow regime (Reynolds number,
Re), gas rarefaction (Knudsen number,
Kn), the ratio of convective to diffusive mass transport (Péclet number,
Pe), the impact of natural convection (Grashof number,
Gr), and the rate-limiting steps of the occurring reactions (Damköhler number,
Da) (
Table 3).
The calculation of the similarity criteria is demonstrated step-by-step using operating condition No. 13 (
Table 1) as an example. By definition, the Reynolds number (
Re) characterizes the ratio of inertial forces to viscous forces in the system, as expressed by Equation (1):
where
ρ is the fluid density, kg/m3;
V is the flow velocity, m/s;
D is the characteristic length of the system, m (reactor diameter);
μ is the dynamic viscosity of the mixture, Pa·s.
The gas density was calculated using the ideal gas equation of state (2):
where:
P is the system pressure, Pa;
Mmix is the mass-averaged molar mass of the mixture (calculated from the mole fractions of the components), kg/mol;
R is the universal gas constant, J/(mol·K);
T is the process temperature, K.
The flow velocity
V (m/s) was calculated as the ratio of the volumetric gas mixture flow rate (converted from standard to operating conditions) to the cross-sectional area of the reactor using Equation (3):
where:
Pstd is the pressure at standard conditions, Pa;
Tstd is the temperature at standard conditions, K;
P is the operating pressure, Pa;
T is the operating temperature, K;
Qstd is the volumetric flow rate of the gas mixture at standard conditions, m3/s;
Q is the operating volumetric flow rate of the gas mixture, m3/s;
D is the characteristic length (reactor diameter), m;
r2 is the square of the reactor radius.
Since hydrogen is the predominant component across all operating conditions, the mixture’s dynamic viscosity
μ (4) was approximated as 1.84 × 10
−5 Pa·s. This value represents the viscosity of pure hydrogen at 550 °C, extrapolated using the Sutherland constant (
S) for hydrogen at 273 K [
13,
14]. Since the contribution of the heavier components (TMAB, WF
6) would only increase rather than decrease
μ, estimating the viscosity based on the least viscous and lightest component of the mixture (hydrogen) can be considered a conservative approach.
where:
μ0 is the reference viscosity of hydrogen at 273 K, Pa·s;
S is the Sutherland constant for hydrogen (96.67 K at T0 = 273 K);
T0 is the reference temperature (273 K) corresponding to the selected constant S, K;
T is the operating temperature (corresponding to 550 °C), K.
The obtained value of Re = 9.9 is significantly lower than the critical threshold for turbulent flow (Re > 2300), indicating that the gas flow regime is laminar.
The Knudsen number,
Kn (5), characterizes the degree of gas rarefaction in our system. From a practical perspective, this is necessary to evaluate the validity of treating the medium as a continuum, where classical hydrodynamic principles and the Navier–Stokes equations apply.
where:
λ is the mean free path of the molecules, m;
D is the characteristic length (reactor diameter), m.
The mean free path of the molecules, λ, was calculated using Equation (6):
where:
KB is the Boltzmann constant, J/K;
T is the deposition process temperature, K;
is the effective mass-averaged molecular diameter of the mixture (WF6/TMAB/H2), m;
P is the pressure, Pa.
Given that Kn = 0.00024, the medium should be treated as a continuum, since the mean free path of the molecules is several orders of magnitude smaller than the characteristic length (reactor diameter, D = 0.1 m).
The Péclet number,
Pe, characterizes the mass transport regime by describing the ratio of the bulk gas flow (convection) to the thermal motion of the molecules (diffusion). Since the studied system consists of three main components—WF
6, TMAB, and H
2—the Péclet numbers for each component were calculated using Equations (7)–(9):
where:
V is the gas flow velocity, m/s;
D is the characteristic length (reactor diameter), m;
// is the mutual diffusion coefficient, m2/s.
Since the hydrogen volume fraction in the gas mixture exceeds 60% across all operating conditions, the mutual diffusion coefficients
DAB were calculated for the H
2–H
2 (self-diffusion), WF
6–H
2, and TMAB–H
2 pairs. Since reference diffusion coefficients for WF6 and TMAB in hydrogen are unavailable, they were estimated using data from analogous systems at 273 K and 1 atm (
Table 4). For example, the WF
6–H
2 diffusion coefficient was derived by scaling SF
6–H
2 data based on reduced mass [
15]. The diffusion coefficient for the TMAB–H
2 pair was estimated by analogy with n-butane in hydrogen, taking into account the similar molecular diameter (~5–6 Å) [
15].
To accurately account for the temperature and pressure of the investigated process, a scaling method was applied to the selected diffusion coefficients from
Table 4. The scaling factor was calculated using Equation (10):
where:
T is the operating process temperature, K;
T0 is the temperature corresponding to the known diffusion coefficient, K;
P0 is the pressure corresponding to the known diffusion coefficient, Pa;
P is the operating process pressure, Pa.
The exponent 1.75, applied to the ratio of the operating temperature to the reference diffusion temperature (Δ
T), was introduced for a more accurate scaling of the diffusion coefficient, which exhibits a nonlinear temperature dependence. In accordance with the classical work of Fuller et al. [
16] and more recent studies [
17,
18], the power-law exponent of 1.75 adequately describes the temperature dependence of the diffusion coefficient for the majority of real gases.
The scaling of the diffusion coefficients for the H
2–H
2, WF
6–H
2, and TMAB–H
2 pairs was carried out using Equations (11)–(13), respectively:
The Péclet numbers (Pe) calculated for operating condition 13 using Equations (7)–(9) indicate that both diffusive and convective mass transport must be accounted for in the simulations.
The Grashof number (
Gr) characterizes the effect of natural convection on mass transport. On average, across operating conditions 1–13 (
Table 1), the inlet gas mixture temperature is 60 °C, which is nearly an order of magnitude lower than the reactor temperature (550 °C). At first glance, such a substantial temperature difference between the incoming flow and the steady-state reactor environment should definitively point to significant natural convection and the potential formation of cold zones near the gas inlet. However, it is important to note that approximately 0.05 m of the gas delivery line feeding the mixture into the reactor is also located within the hot zone. Under conditions of relatively low flow velocities (
V = 0.07–0.3 m/s) and reduced pressure, the incoming gas flow has sufficient time to heat up to the operating temperature, entering the reaction zone already preheated without inducing radial temperature gradients. To substantiate this point, the number of transfer units (
NTU) was calculated for the parameters of condition 13 (
Table 1) in the “hot” section of the gas line with a length
Lline = 0.05 m and a diameter
Dline = 0.02 m. The calculation was performed for hydrogen (H
2), as it is the most abundant (>60% by volume for condition 13) and highest-heat-capacity component of the mixture [
19]. The heavier components (WF
6, TMAB) possess significantly lower heat capacities and heat up more rapidly [
19,
20].
The
NTU represents the ratio of the heat exchanger capacity to the heat capacity rate of the gas flow and is calculated using Equation (14):
where:
h is the heat transfer coefficient, W/(m2·K);
A is the inner surface area of the gas line, m2;
m is the mass flow rate of the gas, kg/s;
Cp is the specific heat capacity of the gas, J/(kg·K).
The heat transfer coefficient
h was calculated using Equation (15). The thermal conductivity of H
2 (
θ = 0.253 W/(m·K)) was determined at a temperature of 578 K, representing the arithmetic mean between the gas inlet temperature (333 K) and the gas line wall temperature (823 K). The Nusselt number (
Nu), which characterizes the effectiveness of heat transfer from the wall, was taken as a constant for laminar flow in a circular pipe with a constant wall temperature (
Nu = 3.66) [
21].
where:
Nu is the Nusselt number;
θ is the thermal conductivity of H2 at 578 K, W/(m·K);
Dline is the diameter of the gas line, m.
The physical significance of the calculated NTU (Equation (14)) is that, theoretically, the gas mixture passing through the “hot” section of the gas line Lline has enough time to equilibrate with the tube wall temperature nearly 24 times over. Consequently, the Grashof number (Gr) for the investigated process will approach zero throughout the entire experiment. This implies that the effects of natural convection are negligible and can be safely omitted when modeling the process.
To identify the rate-limiting steps using the Damköhler number (
Da), the chemical reactions driving the process must first be analyzed. A major challenge in modeling the deposition of W–C–B compounds is accurately describing the heterogeneous reactions within the boundary layer adjacent to the heated substrate and reactor walls. In our previous work [
12], we proposed a mechanism that outlines the gas-phase formation of tungsten carbides and borides using global reaction equations. According to this reaction scheme, WF
6 is reduced by hydrogen (H
2) to deposit solid tungsten, yielding hydrogen fluoride (HF) gas as a byproduct, which is continuously purged from the reaction zone by the gas stream (Reaction 16). Concurrently, TMAB and its thermal decomposition products act as the carbon and boron sources for the synthesis of tungsten carbides and borides (17 (schematic, non-stoichiometric equation), 18, 19).
Reaction (16) has been extensively studied and is a fundamental component of the well-established fluoride-based tungsten CVD process [
22,
23,
24,
25]. Typically, the reduction of WF
6 is conducted in a kinetically controlled regime, which ensures uniform layer thickness across the substrate and excellent coating conformality. However, the primary focus of the modeled process lies in the formation mechanisms of tungsten carbides and borides. It is known that TMAB begins to actively decompose into trimethylamine and borane at temperatures as low as 200 °C, with the decomposition reaching near completion by 370 °C [
26]. Consequently, the preceding
NTU calculation (Equation (14)) confirms that TMAB decomposes into borane (BH
3) and trimethylamine ((CH
3)
3N) within the incoming gas stream prior to entering the reaction zone. Subsequently, acting as distinct reactive species, trimethylamine and its thermal degradation products serve as the carbon source for the formation of tungsten carbide phases, while borane provides the boron for the deposition of tungsten borides on the substrate surface. Given that both species undergo rapid decomposition on the substrate at the operating temperatures of the investigated process [
26,
27], it is reasonable to assume that the intrinsic deposition rates of boron and carbon exceed the rate of reactant delivery to the surface. Consequently, unlike the deposition of pure tungsten from WF
6, the formation of tungsten carbides and borides is likely diffusion-limited. For our model, this implies that the deposition of W–C–B compounds may operate under a mixed kinetic-diffusion control regime. Consequently, unlike the Péclet (
Pe) number calculation, which relied on a simplified three-component system (WF
6, H
2, and TMAB), an accurate determination of the rate-limiting steps requires calculating the Damköhler (
Da) numbers for all primary heterogeneous reactions taking place in the system: the reduction of WF
6 and the formation of tungsten borides (W
xB
y) and carbides (W
xC
y).
The Damköhler number (Da) defines the ratio of the surface chemical reaction rate to the rate of reactant mass transfer via diffusion. The Damköhler number for the reduction of WF6 by hydrogen was calculated using Equation (20). To estimate the reaction rate (Rreac), the experimentally observed average layer growth rate (Vg = 1 µm/h) was divided by the molar volume of the respective component (Vm). To evaluate the diffusion rate (Rdiff), the diffusion coefficient (DWF6) was determined using a scaling method for known temperature ranges or related systems—analogous to the procedure described earlier (10)—and was defined according to Equation (12).
For the WF
6 reduction reaction (Equation 16), operating under the flow rates specified for Regime 13 (
Table 1), the Damköhler number (
Da) is given by Equation (20):
where:
Rreac is the surface chemical reaction rate, mol/(m2∙s);
Rdiff is the diffusion rate (diffusive flux), mol/(m2∙s);
Vg is the layer growth rate, m/s;
Vm is the molar volume of component, m3/mol;
is the diffusion coefficient of WF6, m2/s;
C0 is the bulk concentration, mol/m3;
D/2 is the characteristic dimension (corresponding to the reactor radius as the characteristic diffusion length from the center of the flow to the wall), m.
A Damköhler number (Da) below 1 confirms that reaction (16) is kinetically limited.
Next we calculate the Damköhler number (
Da) for the formation reactions of tungsten borides. The previously mentioned high reactivity of BH
3 stems from its electron-deficient nature (acting as a strong Lewis acid) and its strong tendency to acquire electron density. This occurs either through dimerization or rapid chemisorption onto active metal surfaces—in a CVD context, the hot substrates and heated walls of the reaction zone. Since BH
3 is practically unable to dimerize at elevated temperatures [
27], the d-electron-rich tungsten surface acts as an ideal Lewis base. Lewis acid–base interactions are virtually barrierless processes in which the metal’s surface electrons rapidly fill the vacant boron orbital, forming a strong W–B chemisorption bond. In turn, the released hydrogen participates in the subsequent reduction of WF
6, facilitating the removal of fluorine from the reaction zone as HF. For the process under consideration, this implies that the activation barrier for boron chemisorption from BH
3 onto the tungsten surface approaches zero. Consequently, according to the Arrhenius equation, the reaction rate is limited solely by the molecular collision frequency. Thus, collision theory can be employed to estimate this rate. The surface kinetic rate constant for BH
3,
, is calculated using Equation (21):
where:
γ is the reactive sticking probability upon collision (conservatively assumed to be 0.1 [
25]);
is the mean thermal velocity of BH3 molecules, m/s.
The mass transport rate of the species was estimated using the mass transfer coefficient
(Equation 22):
where:
is the diffusion coefficient of BH3, scaled from based on molecular weight (estimative molecular weight scaling), m2/s;
D/2 is the characteristic dimension (radius) of the reactor, m.
The Damköhler number (
Da) was calculated using Equation (23):
A Damköhler number (Da) greater than 1 indicates that boron deposition occurs in a diffusion-limited regime. Consequently, the surface concentration of BH3 was assumed to be zero in the model. It is important to address the aforementioned simplification regarding the diffusion coefficient . Admittedly, scaling the diffusion coefficient between such dissimilar molecules as tungsten hexafluoride and borane may introduce a systematic error, potentially underestimating the true diffusion coefficient of borane. Nevertheless, Equation (23) indicates that the chemisorption rate of BH3 onto the tungsten surface is so rapid that even a several-fold increase in the mass transfer coefficient () would not alter the qualitative conclusion regarding the rate-limiting step. Thus, in the absence of experimental reference data, scaling the diffusion coefficient according to Graham’s law yields sufficiently robust conclusions for engineering modeling of this specific process.
Unlike BH
3, trimethylamine (TMA, (CH
3)
3N) is a more stable, valence-saturated molecule. However, at 550 °C, its stability is drastically reduced compared to standard conditions. At elevated temperatures, the C–H bonds within the methyl groups weaken. Furthermore, transition metals are effective catalysts for dehydrogenation reactions [
28,
29,
30]. Consequently, once the tungsten surface catalytically abstracts the first hydrogen atom, the TMA molecule transforms into highly reactive radicals and rapidly decomposes at the substrate into atomic hydrogen, nitrogen, and carbon [
30]. According to temperature-programmed reaction spectroscopy (TPRS) data on tungsten [
30], the decomposition of alkylamines is accompanied by H
2 evolution in the 325–550 K range (with distinct peaks near 350 K and 450 K). For (CH
3)
3N at low surface exposures, complete and irreversible degradation yielding H
2 and N
2 is observed. Therefore, at 550 °C (823 K), the heterogeneous decomposition step of TMA can be treated as virtually instantaneous relative to its mass transport rate to the reaction zone. Thus, estimating the Damköhler number (
Da) for TMA via collision theory—analogous to the BH
3 calculation—is a reasonable approach for the modeled process. The surface kinetic rate constant,
Ks(TMA), was calculated using Equation (24), mirroring Equation (21):
where:
γ is the reactive sticking probability upon collision (conservatively assumed to be 0.1 [
25]);
is the mean thermal velocity of TMA (trimethylamine) molecules, m/s.
The mass transfer coefficient for TMA,
βTMA, is given by Equation (25):
where:
is the diffusion coefficient of trimethylamine, scaled from based on molecular weight (estimative molecular weight scaling), m2/s
D/2 is the characteristic dimension (radius) of the reactor, m.
The Damköhler number (
Da) for TMA is calculated using Equation (26):
A Damköhler number (
Da) greater than 1 indicates that carbon deposition and the subsequent formation of tungsten carbides are similarly governed by mass transport limitations—specifically, the diffusion rate of precursor molecules from the bulk gas to the deposition surface. The close proximity of the calculated Damköhler values,
and
, establishes a condition for the simultaneous, stoichiometric delivery of boron and carbon to the surface. This ratio is inherently dictated by the composition of the precursor TMAB molecule (C:B = 3:1). Consequently, at high TMAB flow rates, this can lead to surface carbon supersaturation, allowing tungsten carbides to suppress the synthesis of other phases. This effect was observed experimentally, as evidenced by the shift in the phase composition of the deposited layers under operating regimes 11–13 [
12].
It is worth noting the experimental absence of boron or tungsten nitrides, which is consequently reflected in the computational deposition model. Upon the adsorption of TMA onto the tungsten-coated substrate, as previously discussed, the tungsten surface actively dehydrogenates the TMA molecules, converting them into surface-bound, highly unstable radicals that rapidly decompose into constituent carbon, nitrogen, and hydrogen atoms [
30]. Examples of these intermediates include the dimethylaminomethyl (CH
2N(CH
3)
2) and dimethylamino ((CH
3)
2N) radicals [
28,
30]. A similar phenomenon is observed for other amines (such as methylamine, ethylamine, and triethylamine) [
30,
31], which undergo active dissociation on heated transition metal surfaces. It is highly probable that during TMA decomposition, nitrogen does not enter the gas phase as free atoms but rather remains on the metal surface as chemisorbed species, N
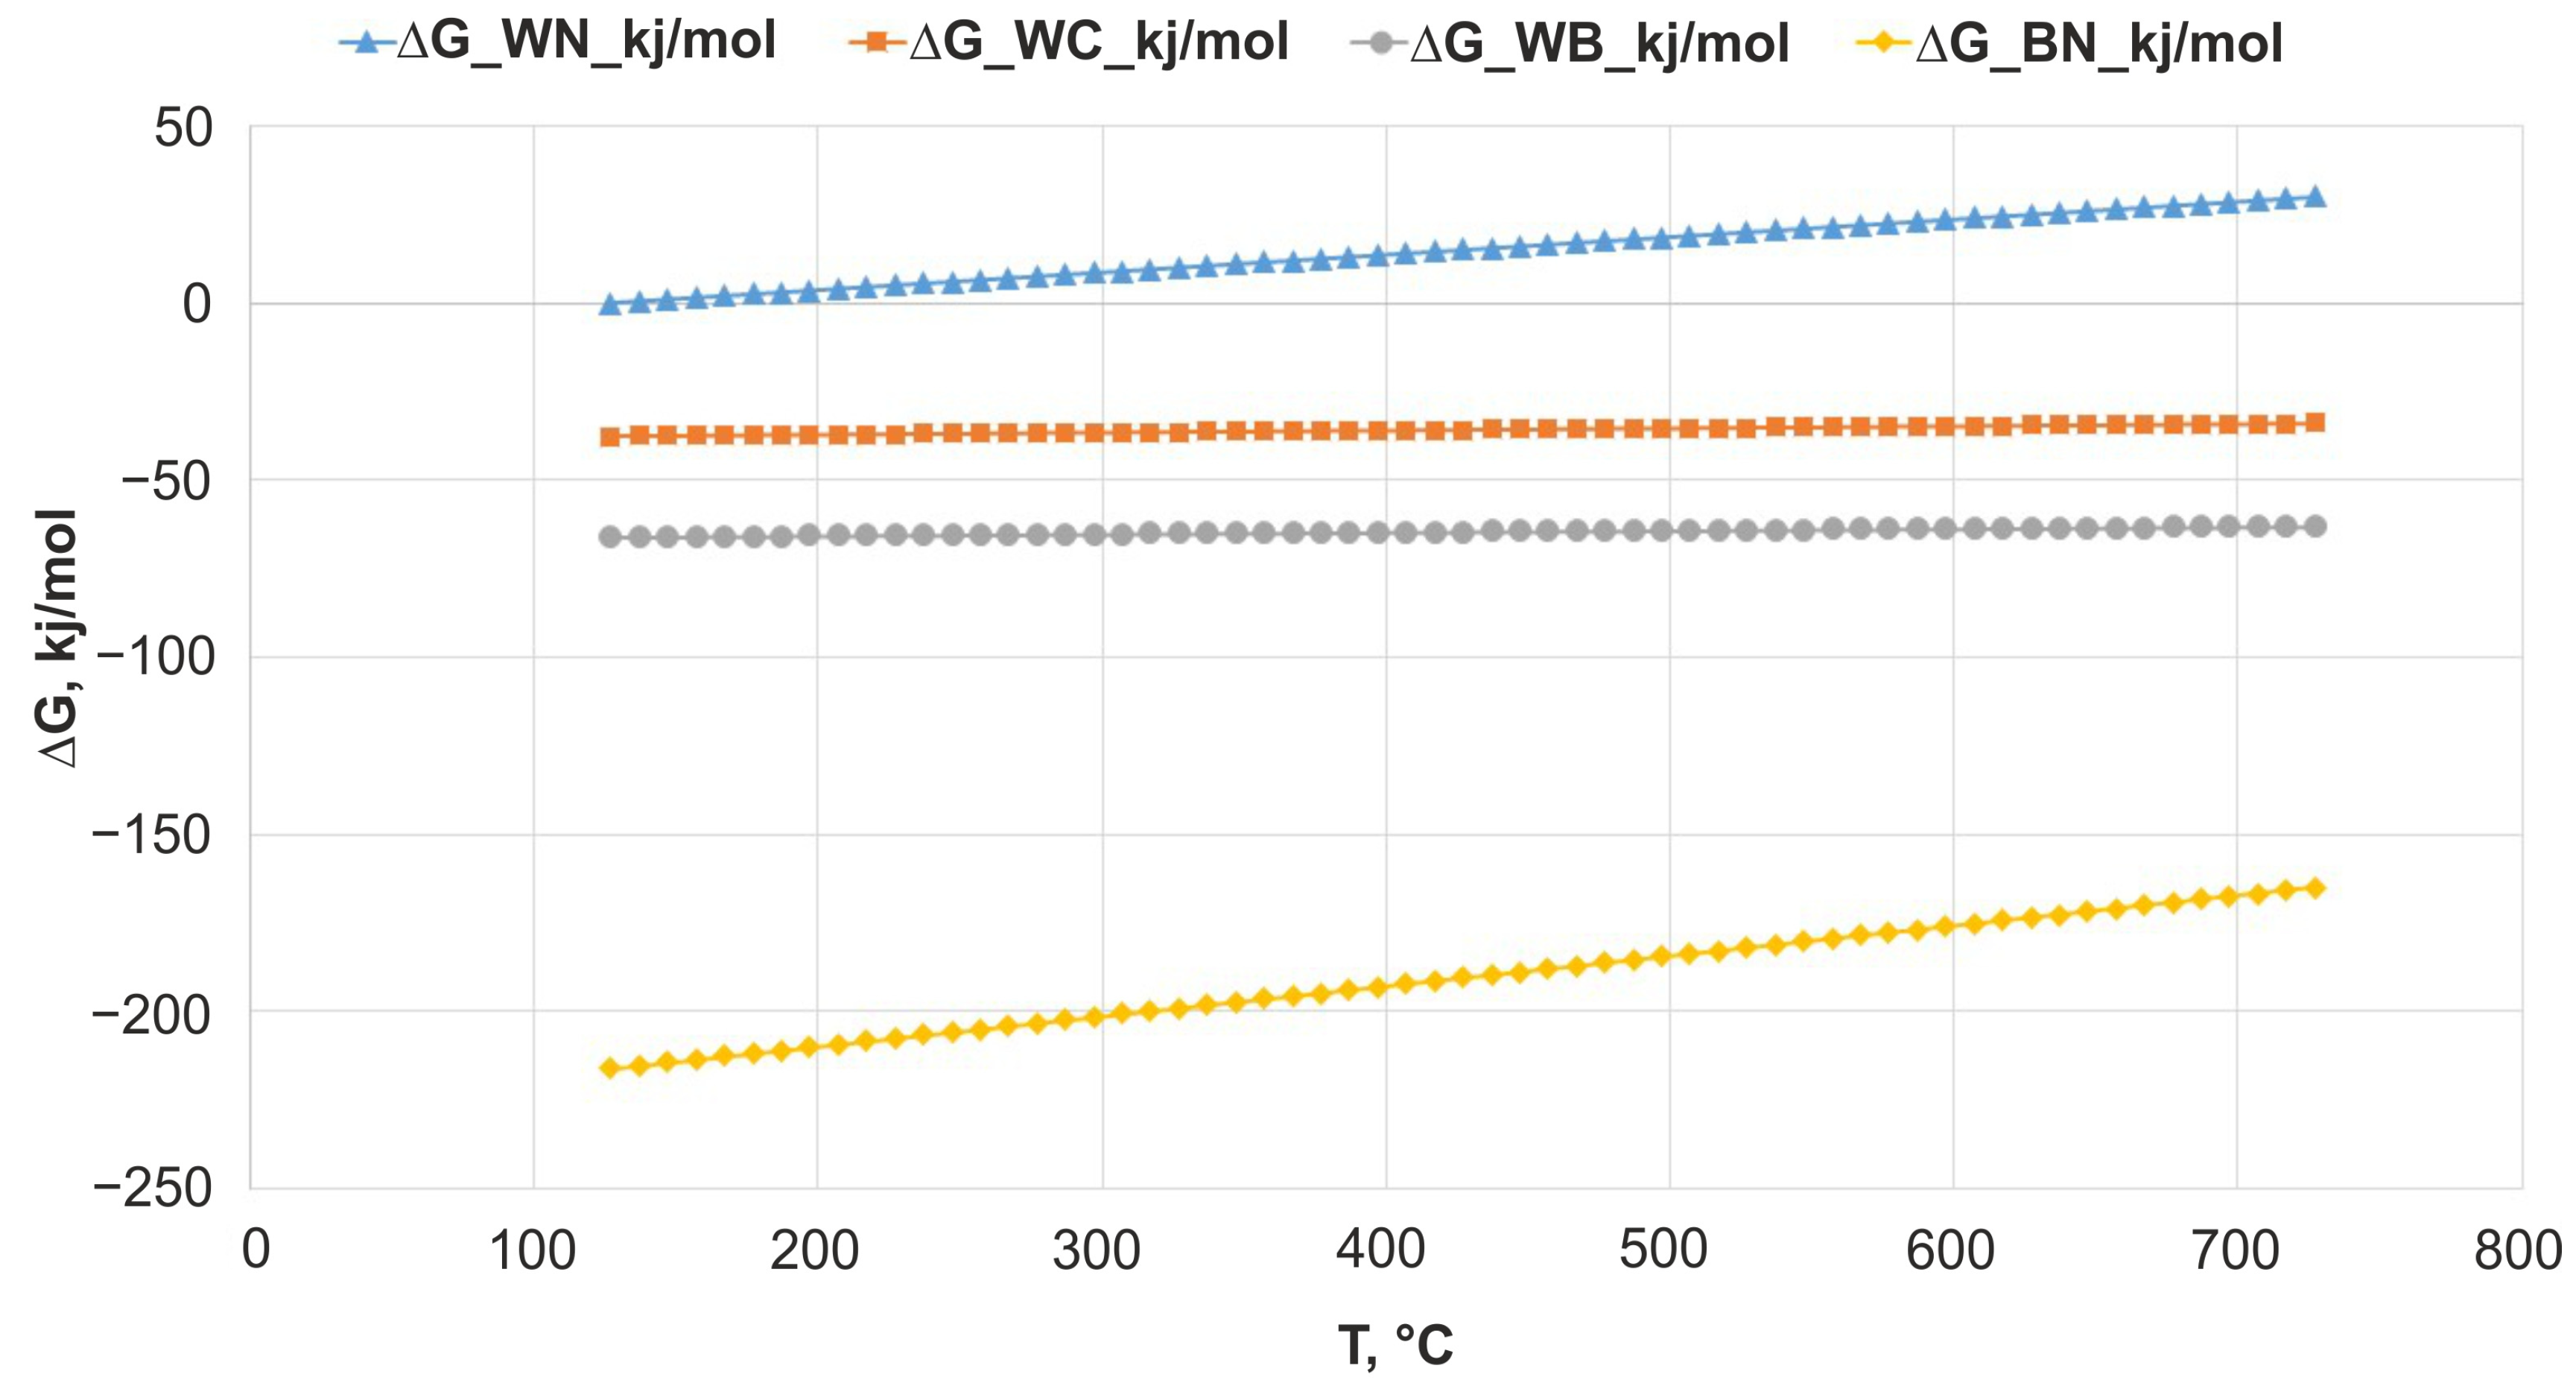
(ads). Given that the formation of tungsten carbides and borides is thermodynamically more favored than that of tungsten nitrides (
Figure 2), these surface-bound nitrogen atoms undergo recombination via the Langmuir–Hinshelwood mechanism, subsequently desorbing as N
2 molecules (N
(ads) + N
(ads) → N
2). Alternatively, they may participate in surface reactions with adsorbed hydrogen (H
(ads)) and carbon (C
(ads)) atoms, forming volatile HCN or NH
3 molecules, which are then swept out of the reaction zone alongside the HF flow. At the same time, the experimental X-ray diffraction (XRD) patterns also show a complete absence of boron nitride (BN) [
12]. Although its formation is thermodynamically favored (
Figure 2), under the employed experimental conditions, BN precipitation is likely suppressed by the competitive formation kinetics of other phases, primarily tungsten borides. The strong chemical affinity between tungsten and boron, coupled with the aforementioned barrierless growth mechanism, leads to the rapid incorporation of boron into the W–B matrix. The nucleation of a distinct BN phase would require either diffusion-driven segregation or significantly higher deposition temperatures [
32,
33,
34]. It is also worth noting that the XRD patterns of the deposited samples revealed the presence of the
β-W phase [
12]. This phase is characterized b y a broad homogeneity range and is known to be stabilized by small-radius interstitial atoms, such as nitrogen [
35]. This interstitial incorporation of nitrogen may serve as an additional reason for the apparent absence of discrete nitride phases.
Based on the previously calculated similarity criteria for all regimes of the modeled process (
Table 3), a well-substantiated decision was made regarding the required set of computational modules within the COMSOL Multiphysics environment.
Given the laminar nature of the gas stream, the Laminar Flow module was employed to describe its behavior within the reactor. The calculated Knudsen number (Kn) indicated a continuum flow regime; consequently, the Transport of Concentrated Species interface was selected to model mass transport mechanisms. Although preliminary estimates suggested a low probability of significant temperature gradients at the specified flow rates, the Heat Transfer in Fluids interface was incorporated into the multiphysics model. This inclusion allowed for the accurate application of heat exchange boundary conditions, thereby preventing non-physical temperature artifacts (fictitious local overheating) near the reactor edges. Because TMAB decomposes into borane (BH3) and TMA prior to entering the reactor, the Chemistry module accounted exclusively for the heterogeneous reactions governing the deposition of tungsten, boron, and carbon onto the substrate.
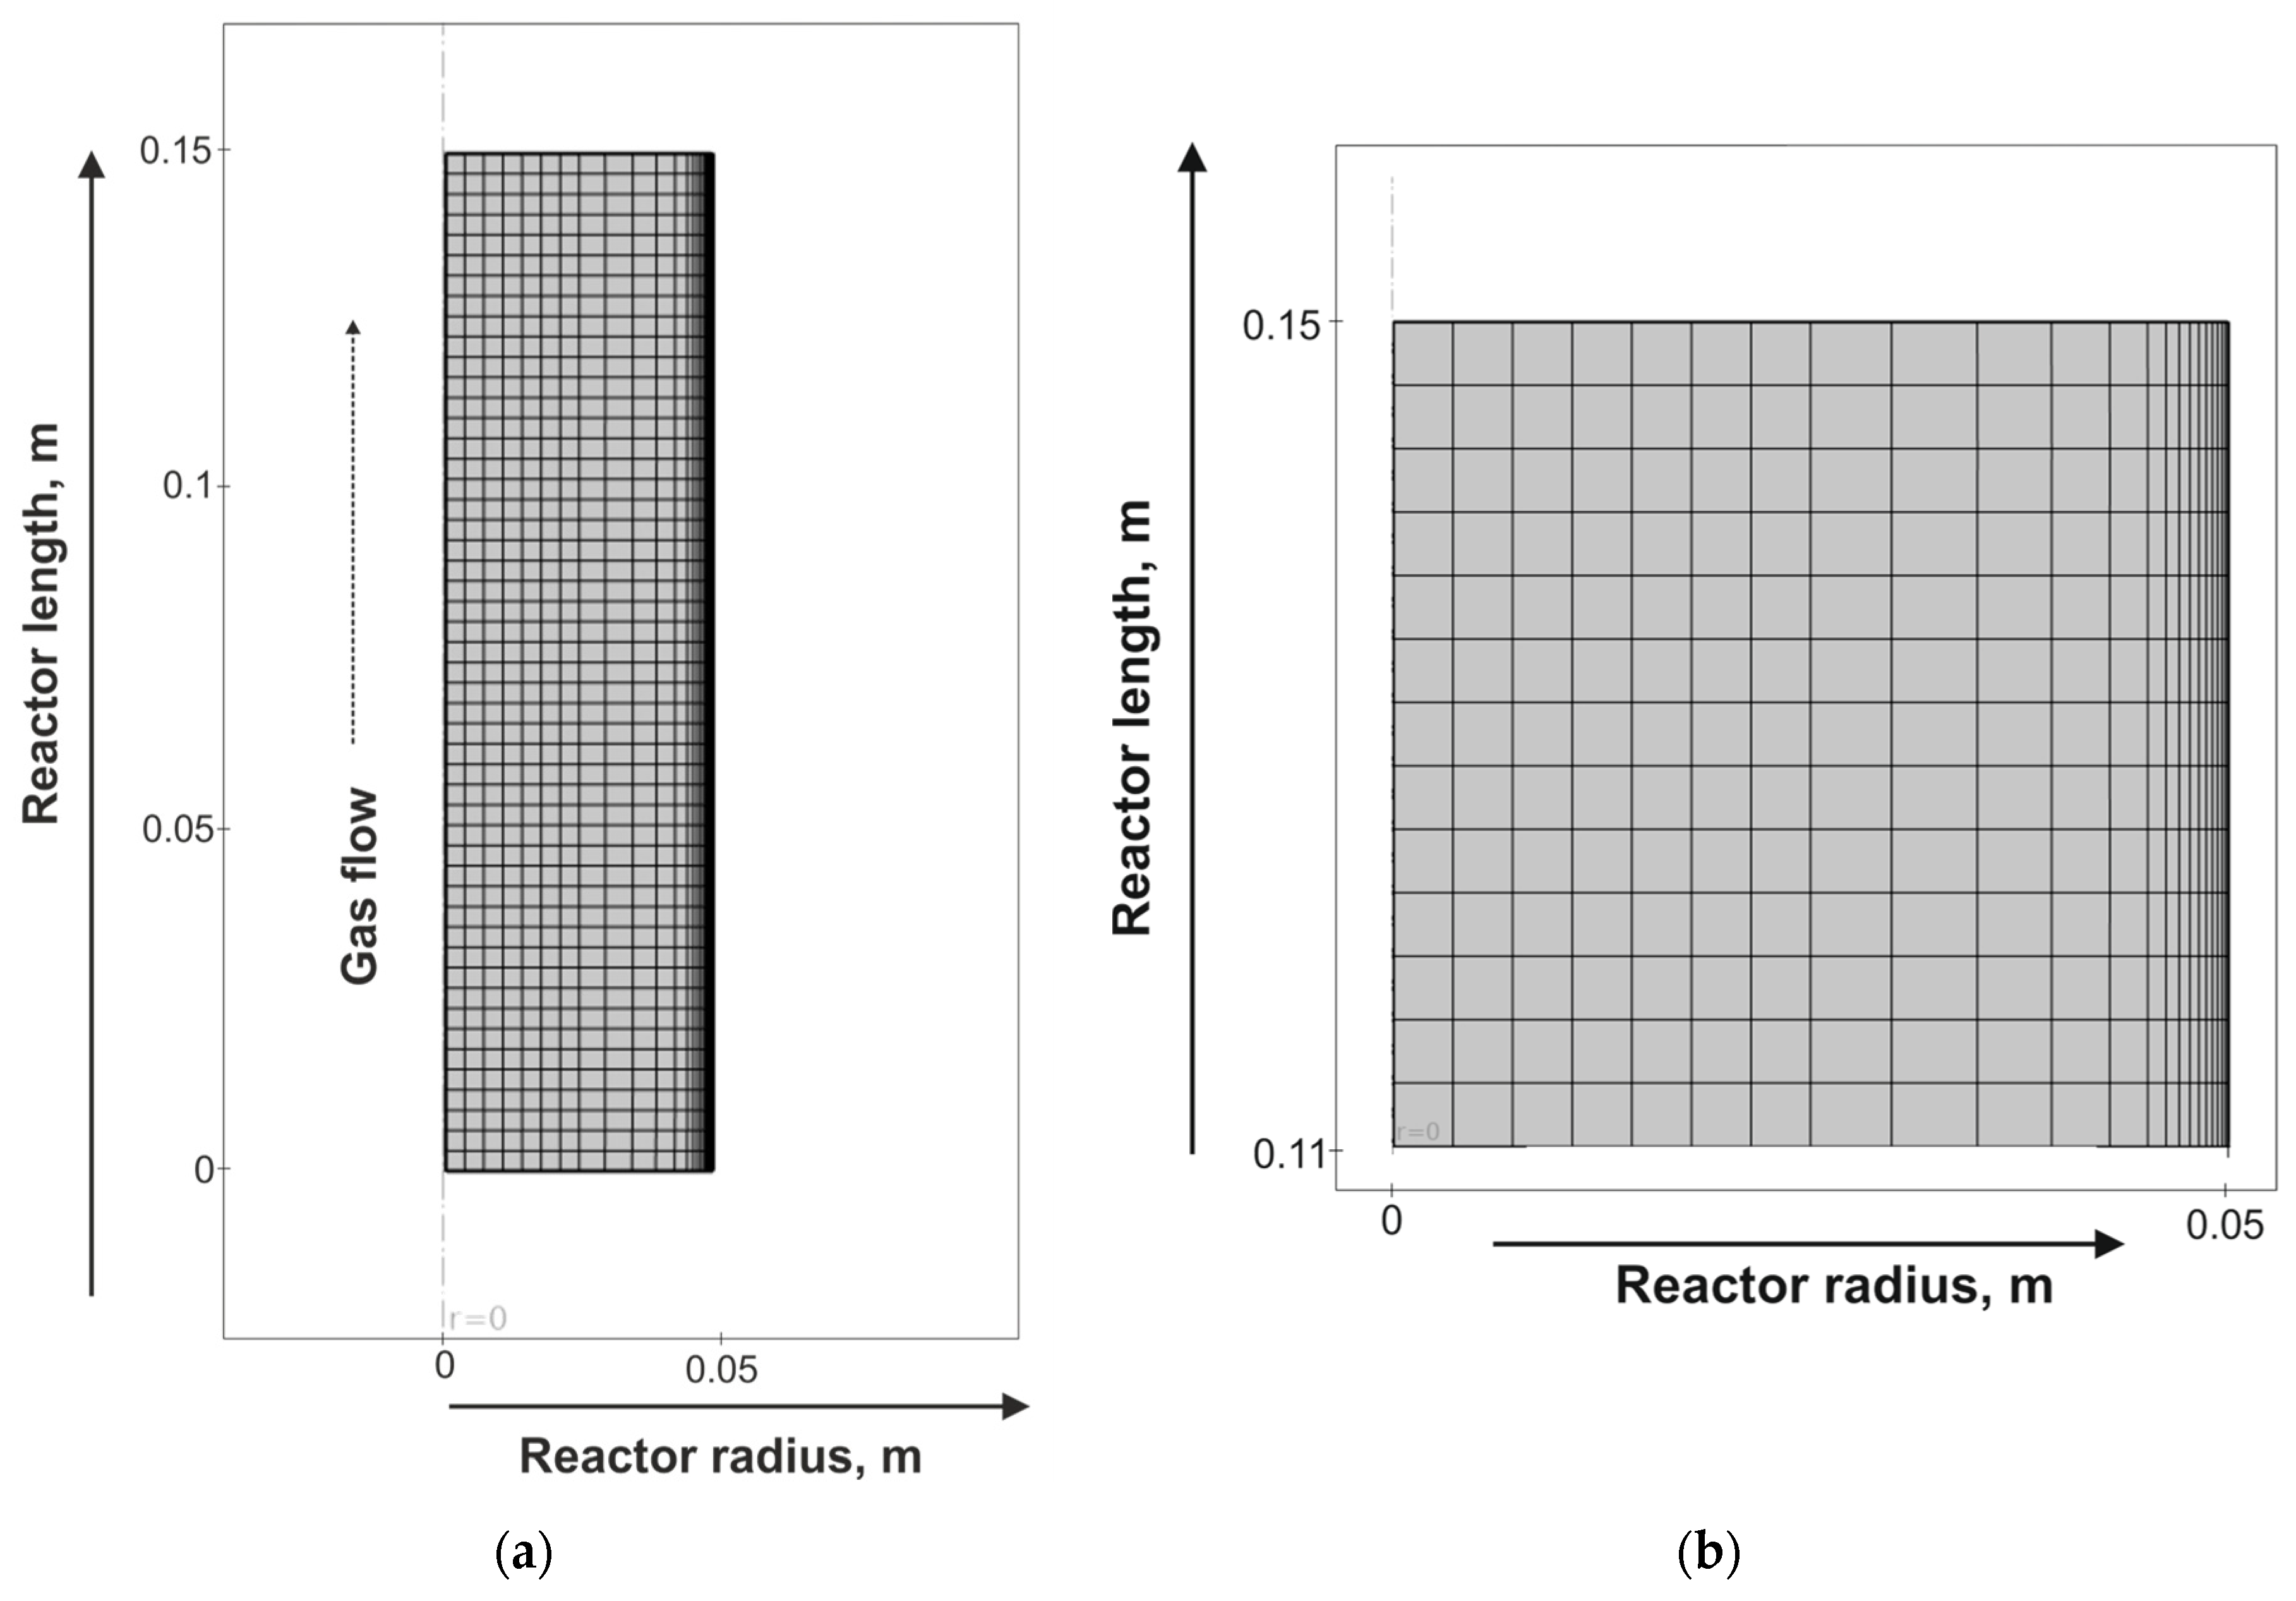
As previously stated, the model was developed using a 2D axisymmetric geometry (
Figure 3). The deposition process was simulated on the hot wall, which represents a longitudinal section of the entire reactor. This geometry is exceptionally well-suited for evaluating the nature of species transport and capturing the probable depletion of diffusion-limited precursor fluxes as the gas mixture progresses toward the reactor outlet. The computational mesh (
Figure 3) was generated using the Extra fine quality setting, yielding 1100 elements. To accurately resolve the transport phenomena within the boundary layer adjacent to the reactor wall (which acts as the deposition surface in the model), boundary layer mesh refinement was applied (
Figure 3b). A grid independence study revealed that doubling the number of elements resulted in less than a 1% change in the calculated deposition rate. This confirms that the solution is mesh-independent and demonstrates the adequacy of the chosen element count.
Because the gas medium is concentrated (Knudsen number,
Kn < 0.001) and several reactions are diffusion-limited, the No slip boundary condition was applied within the Laminar Flow module. This condition assumes that the gas velocity is zero exactly at the solid reactor wall. Such an assumption is physically sound for low-velocity viscous flows and ensures the accurate calculation of both velocity profiles and precursor concentration gradients within the boundary layer. At the reactor entrance, the Inlet velocity boundary condition was assigned to define the incoming gas stream velocity. This parameter was specified for each operating regime (1–13) according to the data provided in
Table 1. For the Outlet boundary condition, which characterizes the gas exiting the reactor, the operating process pressure was set to 667 Pa (5 Torr). Additionally, the Suppress backflow feature was enabled; this function corrects the pressure field at the outlet to prevent non-physical vortices and gas recirculation into the reactor, thereby improving the stability of the numerical solver. The reference pressure was set to 0 Pa, and the physical flow model was defined as Compressible flow, which is essential for accurately accounting for gas mixture density variations along the reactor at the low operating pressures of the process.
In the Heat Transfer in Fluids interface, a constant temperature boundary condition of 823 K (550 °C) was applied to the reactor walls. Due to the high thermal conductivity of the hydrogen carrier gas and the calculated Number of Transfer Units (Equation (14)) for the pre-heating zone, the incoming gas mixture reaches thermal equilibrium with the walls almost instantaneously upon entry. The heat generated by the heterogeneous surface reactions was estimated to be negligible compared to the convective heat flux. Consequently, the heat transfer simulation confirms that the main reaction zone operates under virtually isothermal conditions at 550 °C. The reference temperature for the model was set to a standard room temperature of 293 K (20 °C).
In the Transport of Concentrated Species interface, which governs mass transport, the Fick’s law diffusion model was selected. The diffusion coefficients assigned to the reactants corresponded to the values calculated previously for the similarity criteria. Consequently, this interface solves the transport equations in terms of mass fractions rather than molar concentrations. Because the sum of all mass fractions is strictly constrained to unity, this approach inherently ensures total mass conservation throughout the computational domain and minimizes numerical errors when calculating the gas mixture density and species concentrations within the reaction zone. For the diffusion-limited precursors (TMA and BH
3, where
Da > 1), a Mass fraction = 0 boundary condition was applied at the hot reactor wall. This reflects the high rate of the dissociation reaction and the complete decomposition of these molecules upon heterogeneous interaction. Conversely, for the kinetically controlled WF
6 reduction reaction (
Da < 1), a General inward flux boundary condition was utilized. In this case, the mass flux was governed by a first-order kinetic rate equation. Because direct measurements of the kinetic parameters for the reduction reaction under the investigated process conditions are absent from the literature, the surface reaction rate constant (
Ks) for WF
6 reduction was determined via back-calculation from the experimentally observed coating growth rate of
Vg = 1 µm/h. The key boundary conditions defined for the depositing species are summarized in
Table 5.
Because the primary objective of this study is the optimization of macroscopic transport processes and precursor distribution, direct modeling of multiphase crystallization which would require Density Functional Theory (DFT) or CALPHAD calculations falls outside the scope of this CFD model. Instead, the phase composition was estimated based on the local molar ratio of the precursors at the deposition surface. This approach provides a highly reliable first-order approximation for predicting the phase composition of the deposited layers across various synthesis regimes. To determine the stoichiometry of the precursor fluxes, three primary reactions (Equations (27)–(29)) were defined within the Chemistry node, characterizing the global mechanism of solid-phase deposition from the gas stream:
Table 6 lists all components of the computational system and their assigned properties based on their state of matter.
The coupled system of modules was resolved using a segregated solver. The solution procedure was divided into three segregated steps, computed sequentially: fluid flow, mass fractions, and heat transfer. The study type was defined as Stationary.
3. Results and Discussion
To verify the model, the calculated molar ratios of the precursors reaching the substrate surface were compared with the phase composition of the coatings obtained experimentally under identical deposition regimes [
12]. A comparative analysis of the modeled stoichiometric ratios of boron and carbon to tungsten is presented in
Table 7.
In Series 2 (Regimes 5–10), which experimentally yielded the most balanced phase composition (a two-phase W + WB mixture), the model predicts a B/W ratio in the range of 0.2–1.0. On average, this is lower than the 1:1 stoichiometric ratio of WB. This apparent discrepancy can be attributed to differences in the kinetics of the surface reactions. The decomposition of BH
3 on the tungsten surface is a virtually barrierless process [
30] with a high probability of boron incorporation into the tungsten lattice. In contrast, the reduction of WF
6 proceeds through a series of intermediate stages (WF
x) and is kinetically limited [
37,
38]. Consequently, the actual deposition efficiency of tungsten into the coating may be somewhat lower than the model predicts, shifting the empirical solid-phase stoichiometry toward boron enrichment. This explains why the formation of stoichiometric WB within the tungsten matrix is observed experimentally even when the modeled B/W flux ratio is less than 1.
In Series 1 (Regimes 1–4), the calculated B/W ratios (0.8–3.6) are conducive to the formation of higher borides; experimentally, the W
2B
5,
β-W, and pure W phases were indeed detected. Notably, the modeled C/W ratio is substantially higher than in Series 2. This correlates directly with the experimental emergence of the
β-W phase. As previously discussed, the metastable
β-W phase, characterized by an A15-type crystal structure, which is stabilized by small interstitial impurity atoms [
35]. Our model reveals a significant excess of carbon and nitrogen (from TMAB decomposition) relative to the tungsten flux. This impurity excess likely drives the stabilization of the
β-W phase, thereby hindering further boride formation.
In Series 3 (Regimes 11–13), a drastic shift in the experimental phase composition toward tungsten carbides (WC, W2C) was observed. The model accounts for this transition through the exceptionally high C/W ratios (9.3–21.8) calculated for these regimes. Although the modeled B/W ratios (3.1–7.0) are theoretically sufficient to yield higher borides, such as W2B5 or even WB4, the severe carbon overabundance drives the competitive formation of thermodynamically stable carbides, effectively blocking boride nucleation. It is highly probable that the elevated concentration of carbonaceous species on the surface shields the active sites required for boron adsorption, thereby switching the dominant reaction pathway from boridation to carburization.
Thus, the developed model adequately captures the competitive nature of phase formation within the W–C–B system. It can be utilized to predict the boundaries of phase regions and to determine the optimal precursor flow rates required to achieve a targeted phase composition in the deposited coating. To further substantiate the proposed processing window, the calculated stoichiometric ratios were correlated with the established equilibrium thermodynamic data. While a complete ternary W-C-B phase diagram for the low-temperature regime (550 °C) is currently absent in the literature, the binary subsystems provide a reliable comparative baseline. According to the classical W-B phase diagram assessed by Duschanek and Rogl [
39], and the W-C system assessed by Kurlov and Gusev [
40], the calculated local atomic ratios align well with the observed solid phases.
At low TMAB flow rates, the calculated B/W ratios correspond to the thermodynamic regions where pure W, W2B, and WB coexist in equilibrium. Conversely, the drastic increase in the C/W ratio at higher precursor feeds shifts the local surface stoichiometry deep into the stability domain of tungsten carbides, thereby explaining the experimentally observed suppression of borides and the phase transition to carbide-dominated coatings. Although low-temperature CVD is a non-equilibrium kinetic process, this correlation between the kinetically modeled gas-phase/surface stoichiometry and the thermodynamic phase diagrams validates the predictive capability of the established processing window.
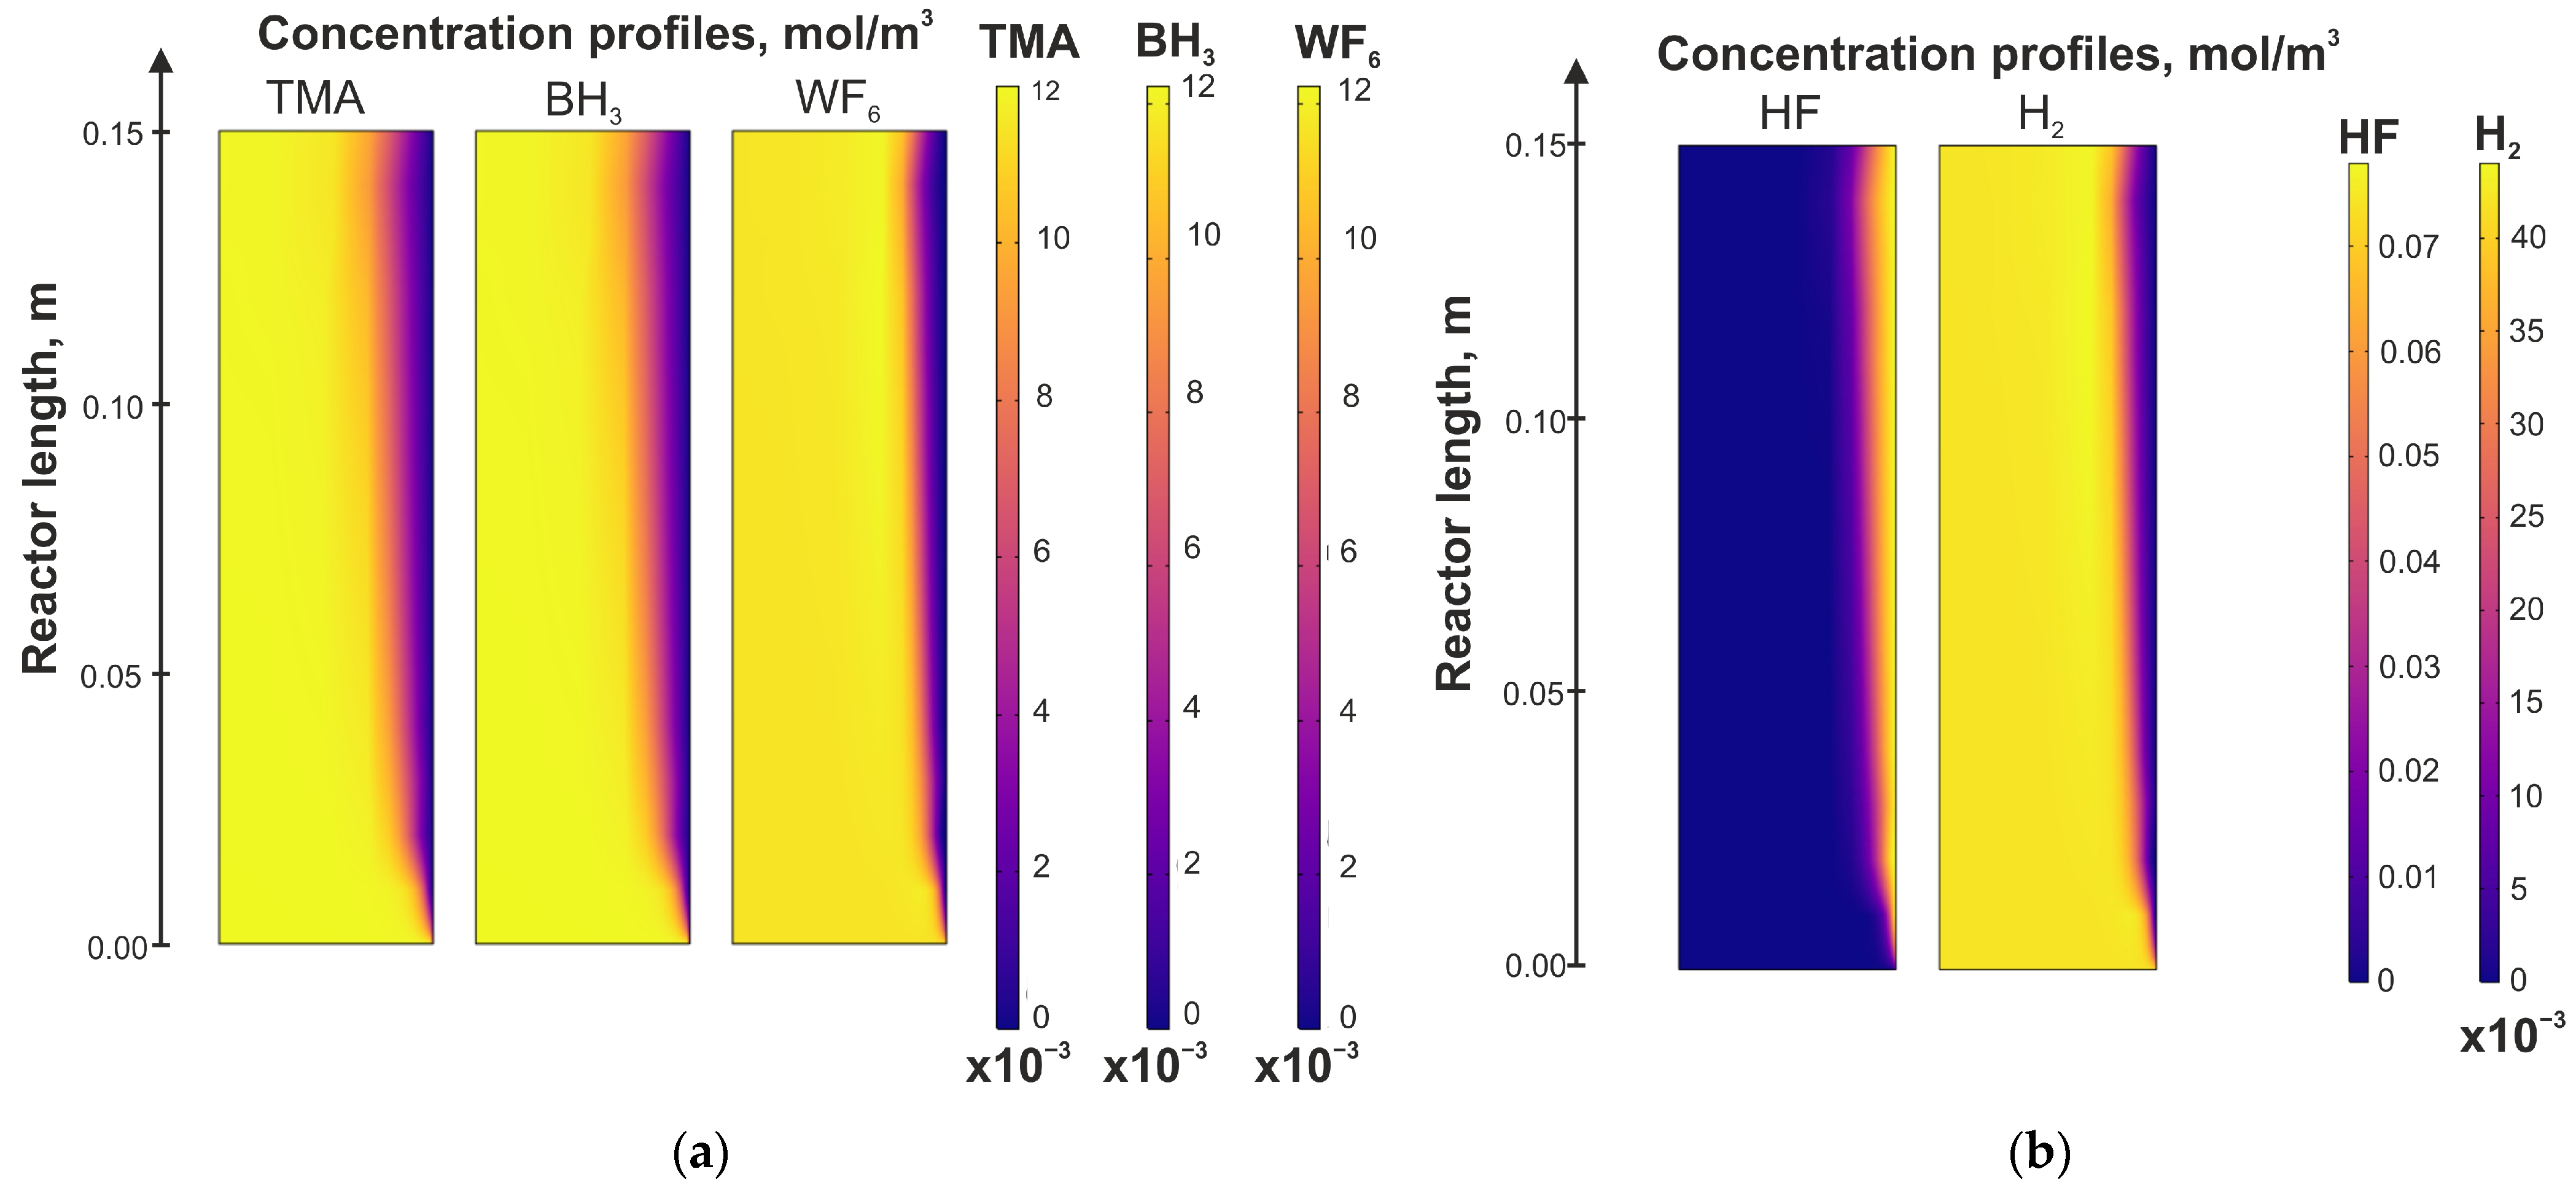
Figure 4 illustrates the molar concentration distributions of the precursors (WF
6, BH
3, TMA, and H
2) and the reaction product (HF) within the reaction volume, using Regime 13 as a representative example.
As is evident from the concentration profiles, the reactant depletion zone gradually expands as the gas mixture progresses along the reactor (from bottom to top). The nature of this depletion varies among the components because precursor consumption is governed both by the kinetics of their interactions with each other and the heated surfaces, as well as by mass diffusion. While this phenomenon may influence the local stoichiometry of the coating (
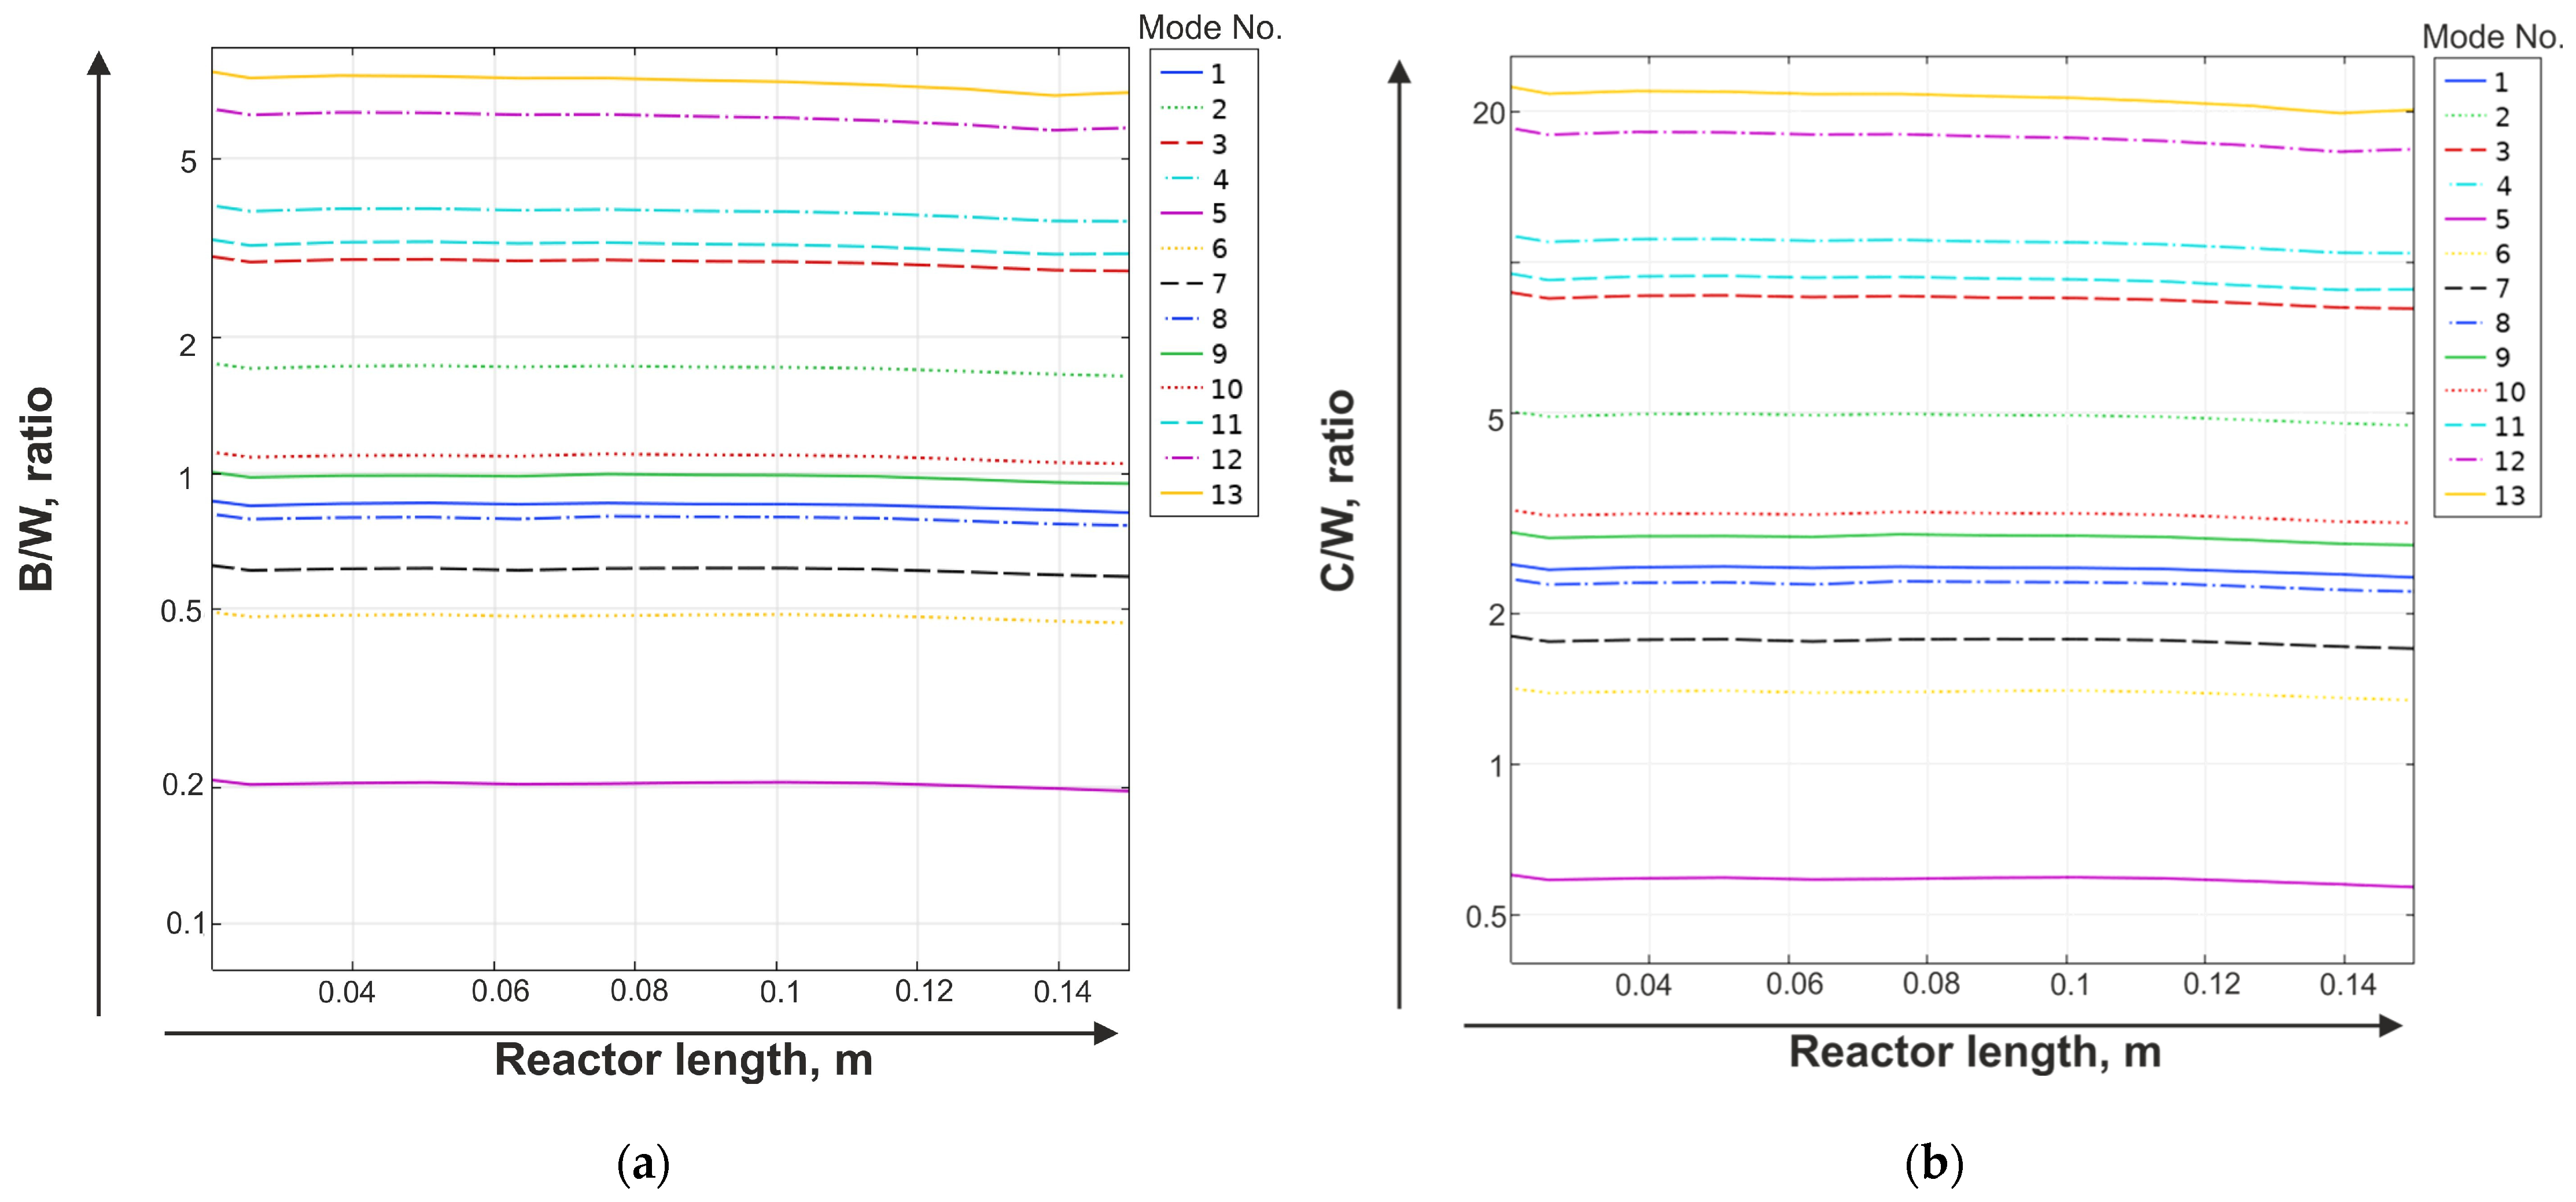
Figure 5), the samples in the actual experiment were positioned in the central region of the reactor (from 0.07 to 0.09 m), where the effects of diffusion-driven depletion are minimal.
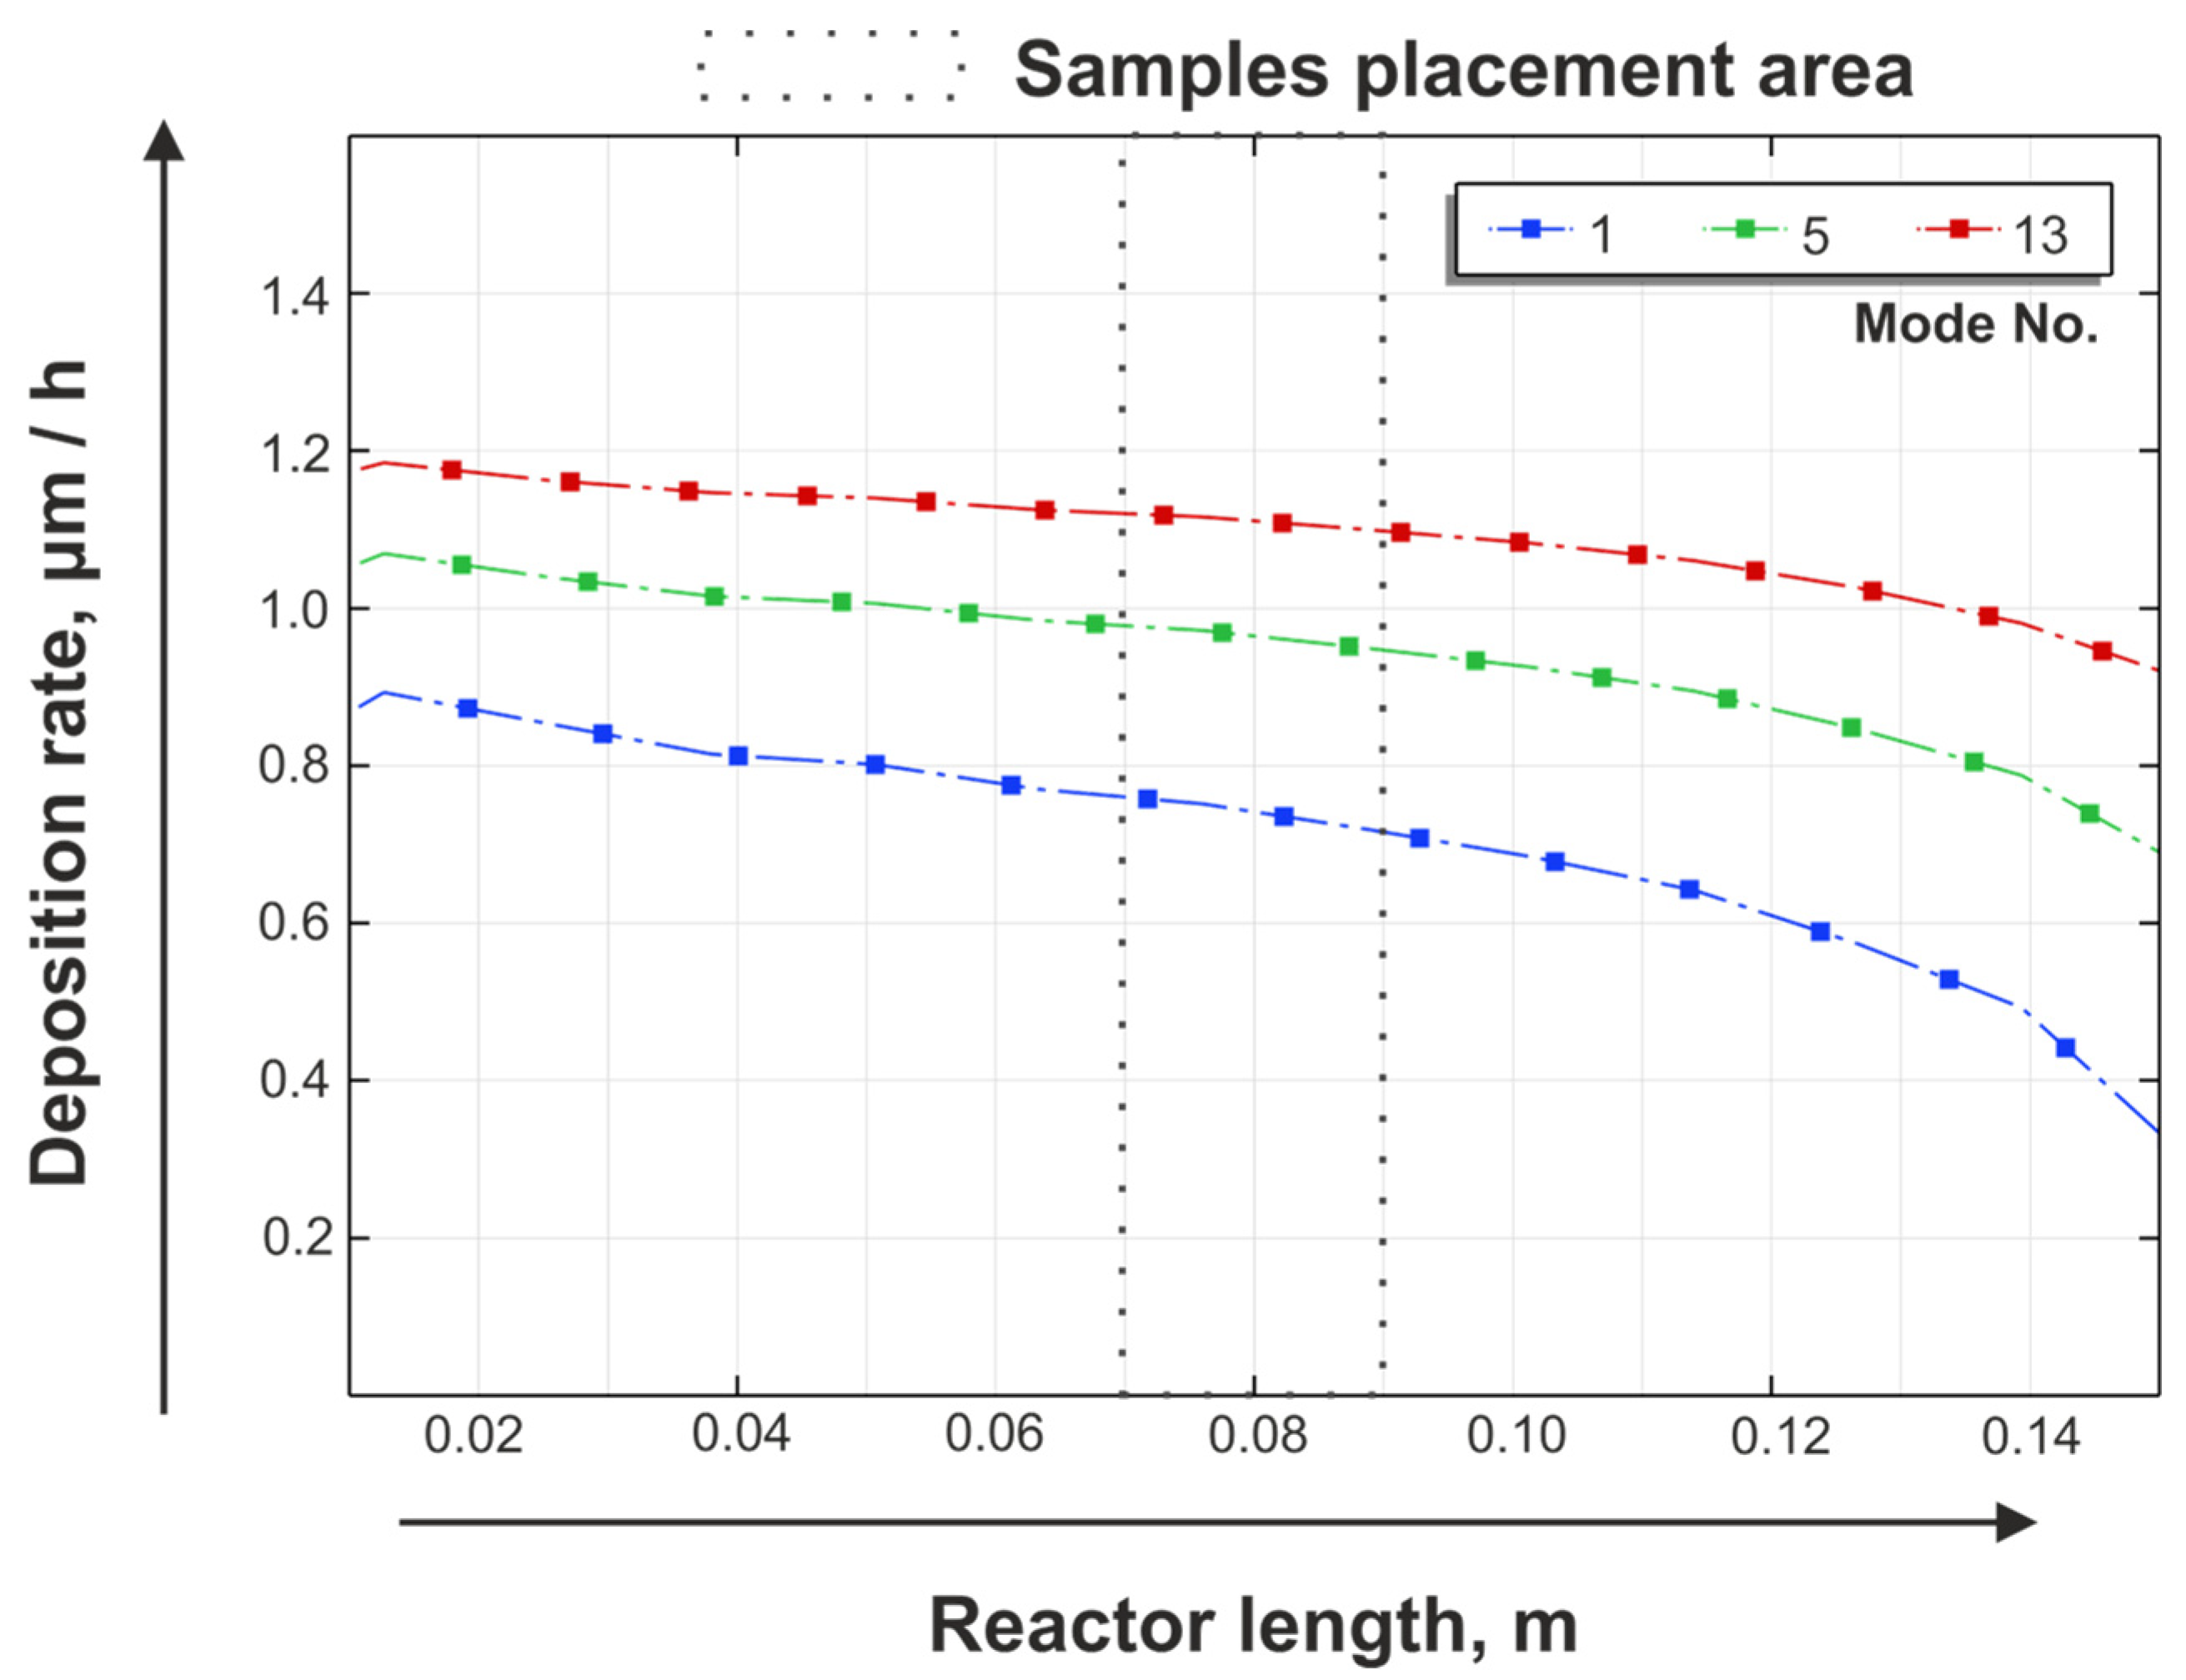
To quantify this observation and provide an independent validation of the coupled transport model across the entire experimental parametric space, the axial profiles of the calculated deposition rate along the reactor wall were extracted for three representative bounding conditions: Regime 1 (minimum precursor flows), Regime 5 (intermediate), and Regime 13 (maximum precursor flows). These profiles are presented in
Figure 6. Due to precursor depletion, a gradual decrease in the deposition flux is observed along the full reactor length, most notably in Regime 1. However, the model predicts a stable plateau within the sample placement zone (0.07–0.09 m, highlighted in
Figure 6). Within this zone, the deposition rate variation is only 3–6% across all evaluated regimes. This spatial uniformity agrees well with the uniform coating thickness observed experimentally, providing robust independent validation of the transport modules.
Additionally, the concentration profile of HF (
Figure 4) is noteworthy, as it accumulates in the boundary layer toward the reactor outlet. A high local concentration of HF may exert an etching effect on the forming coating and shift the reduction reaction equilibrium to the left—thereby suppressing tungsten deposition according to Le Chatelier’s principle via the poisoning of active surface sites by adsorbed fluorine atoms [
22]. However, within the framework of this model, which assumes that the deposition reactions are irreversible and proceed to completion, this effect was not accounted for.
The disparity in depletion rates causes the B/W and C/W ratios to trend downward along the length of the reactor. To achieve compositionally uniform coatings on extended substrates, it is essential to establish flow regimes that minimize the boundary layer thickness and equalize the reactant distribution profile.
Both experimental and modeled data make it possible to distinguish three characteristic regimes of phase formation in the W–C–B system, which are dictated by the local precursor ratios at the substrate surface:
Regime 1. Formation of the β-W phase. This regime is observed at low precursor flow rates (Q(WF6) = 1 L/h and Q(TMAB) < 0.6 L/h). At these flow rates, the calculated B/W ratio is relatively high (0.8–3.6), which should theoretically promote the formation of borides. However, the low absolute flux of WF6 significantly reduces the tungsten growth rate. This causes a shift in surface kinetics: carbon and nitrogen-bearing species from TMAB decomposition are kinetically trapped by the growing metal layer, stabilizing the metastable β-W structure. Consequently, this regime suffers from kinetic starvation, where impurity-driven stabilization overrides thermodynamic phase equilibrium.
Regime 2. Competitive growth of borides. This regime is established at an increased tungsten precursor flow rate (Q(WF6) = 3 L/h) and a moderate TMAB feed rate (Q(TMAB) = 0.14–0.68 L/h). Under these conditions, the tungsten flux is sufficient to suppress the influence of N and C impurities, while the B/W ratio is maintained in the range of 0.2–1.0. The key driving factor in this regime is the kinetic advantage of boron adsorption over that of carbon. Although the C/W ratio can exceed unity (0.6–3.2)—which would conventionally indicate favorable conditions for tungsten carbide growth—the formation of strong W–B bonds is kinetically more favorable due to the barrierless adsorption of BH3 species. Consequently, the formation of tungsten monoboride (WB) predominates, thereby suppressing the formation of both β-W and tungsten carbides.
Regime 3. Dominance of carbides. This regime emerges at high TMAB flow rates
Q(TMAB) > 1.7 L/h. In this regime, the calculated C/W ratio reaches critical values (>9), generating a vast excess of carbon at the surface. It is likely that the high carbon concentration saturates the active surface sites, thereby blocking the adsorption of boron-bearing precursors. Thermodynamically, tungsten carbides (WC, W
2C) are stable phases, and their formation becomes the predominant reaction pathway under conditions of high carbon activity. Furthermore, the pronounced carbon excess correlates with the experimentally observed grain refinement and a tendency toward structural amorphization of the coating. A similar phenomenon has been reported in studies investigating tungsten carbide [
41,
42,
43].
Since the CVD synthesis of tungsten carbides has been extensively studied and is typically performed using more readily available carbon sources such as methane (CH
4), propane (C
3H
8), or acetylene (C
2H
2) [
44,
45,
46,
47], the formation of tungsten carbides from WF
6 and TMAB offers limited practical utility. Conversely, of paramount interest is the feasibility of synthesizing the stable tungsten boride (WB) phase at relatively low temperatures (550 °C). To accurately delineate the boundaries of the processing window and determine the optimal deposition regimes for tungsten borides from the WF
6–TMAB mixture, a multi-objective optimization problem was solved.
The inlet precursor flow rates were selected as the control variables (Equation (30)):
where:
X is the vector of process control variables;
Q(WF6) is the tungsten hexafluoride flow rate, L/h;
Q(TMAB) is the TMAB flow rate, L/h.
The optimization criteria were established based on the model-derived B/W and C/W ratios (
Table 8).
The optimization problem was formulated as the minimization of a quadratic loss function,
L(X), which limits the deviation of the coating composition from the stoichiometry of the target WB phase, taking into account two primary conditions: the B/W and C/W ratios at the substrate. Since we previously established that both BH
3 (as the boron source) and TMA (as the carbon source) are similarly diffusion-limited in the gas phase, this dictates that the B and C proportions at the substrate will be governed by the stoichiometric ratio of the gaseous precursor (TMAB), i.e., B:C ≈ 1:3. Thus, via its first term, Equation (31) penalizes the system for deviating from the optimal stoichiometric ratio for the WB phase (1:1), while the second term imposes a penalty for deviating from the stoichiometric carbon ratio, which is intrinsically dictated by the nature of the precursor. Consequently, the objective function minimizes the variance relative to the target stoichiometric balance point (31).
where:
; is the elemental ratio at the substrate;
, are the weighting factors for the B/W and C/W ratios (set to 1, as both are considered equally important).
The optimization was performed subject to a lower-bound constraint on the tungsten precursor flow rate in order to bypass the formation region of the metastable
β-W phase (32), which, according to experimental observations, undergoes impurity-driven stabilization at low tungsten deposition rates.
The lower bound of the search space for the WF6 flow rate was set to Qcrit = 2.0 L/h. This value was derived from experimental data: at Q(WF6) ≤ 1.0 L/h, the undesirable metastable β-W phase was detected in the as-deposited coatings, whereas no such formation was observed at Q(WF6) ≥ 3.0 L/h. The value Qcrit = 2.0 L/h was selected as the midpoint of this uncertainty interval, thereby providing a safety margin relative to the observed lower boundary for the stable growth of β-W-free tungsten boride phases.
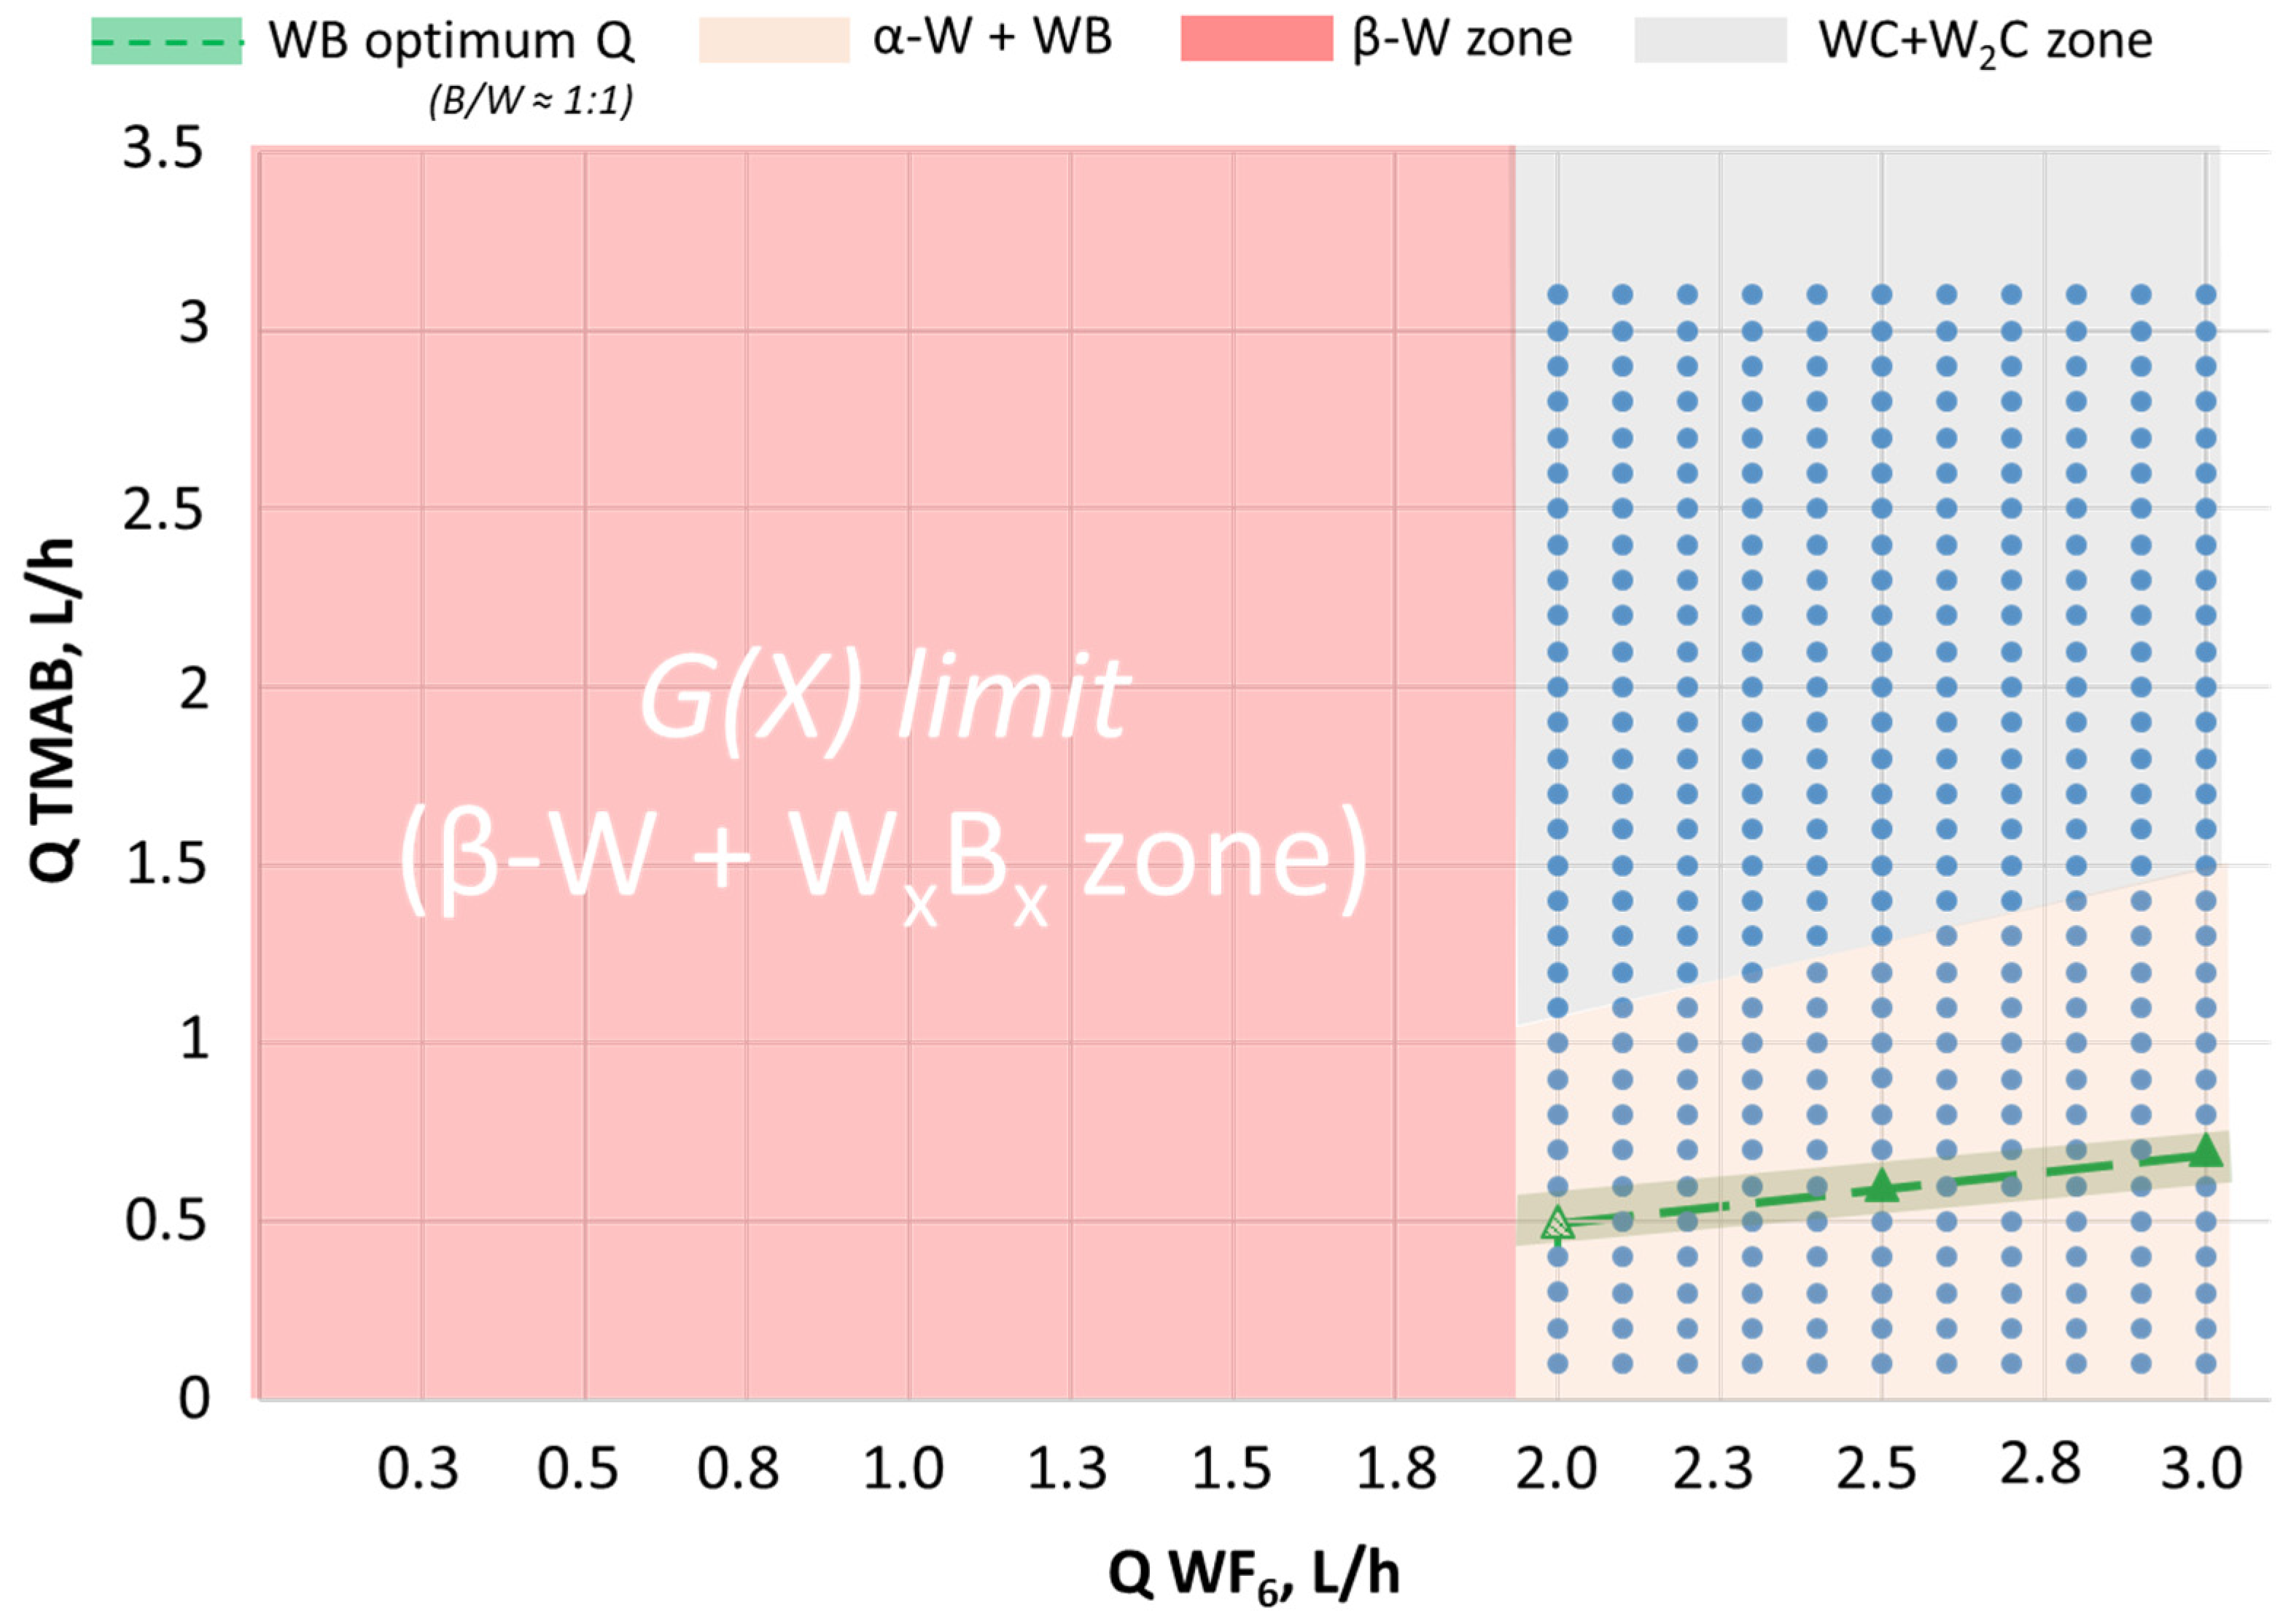
The optimization problem was solved using the Parametric Sweep study in the COMSOL Multiphysics software package across the following parameter ranges: Q(WF6) = 2–3 L/h and Q(TMAB) = 0.1–3.2 L/h.
A graphical interpretation of the optimization problem solution is presented as a CVD phase diagram in
Figure 7.
Analysis of the response surface of the objective function L(X) revealed that the global minimum (optimal value) is attained at the parameter values of Q(WF6) = 2 L/h and Q(TMAB) = 0.48 L/h. At this point, the calculated B/W ratio is ≈1, and the C/W ratio is minimized (≈3.1), which corresponds to the conditions most conducive to the formation of the WB phase. A cluster of near-optimal solutions (local minima, indicated in green) is observed within the range of Q(WF6) = 2–3.0 L/h and Q(TMAB) = 0.48–0.69 L/h. This specific range is therefore recommended as the processing window for tungsten boride (WB) deposition, as it ensures robustness against flow fluctuations while preserving the target phase composition.



 ,
,