


Abstract
Valorizing construction and demolition waste (CDW) via alkaline activation enables low-carbon binders. This study assesses binary geopolymers formulated with recycled brick powder (PLR) and recycled concrete powder (PCR) in seven precursor ratios (0–100% PCR), activated with a ternary NaOH/Na2SiO3/KOH solution (silicate modulus Ms ≈ 3.2) at L/B = 0.15, and cured for 7, 14, and 28 days. Compressive strength (fc), X-ray diffraction (XRD), Fourier transform infrared spectroscopy (FTIR), and scanning electron microscopy with energy-dispersive X-ray spectroscopy (SEM-EDS) were used to link microstructure–phases–properties. A local maximum in fc at ~30% PCR (16.2 MPa at 28 d) was observed versus 0% PCR (14.2 MPa) and ≥50% PCR (13.8 → 10.1 MPa at 28 d). XRD indicated a reduction in inherited crystalline phases and an increased amorphous fraction at ~30% PCR; FTIR (normalized peak position and FWHM of the T–O–Si band, not absolute intensity) suggested higher network extension; SEM-EDS (local/semiquantitative) showed a moderate rise in Ca that supports C-A-S-H domains bridging the N-A-S-H network. At a high PCR, excess Ca simplified mineralogy (quartz/portlandite dominance), promoted competitive routes (C-S-H/carbonation), reintroduced microdefects, and reduced fc. A theoretical oxide balance per mix identified a compositional window where Ca/(Si + Al) ≈ 0.35–0.45 coincides with the mechanical optimum and with XRD/FTIR tracers. Overall, a ~30% PCR window maximizes co-reticulation of N-A-S-H/C-A-S-H and densification without compromising aluminosilicate continuity, providing transferrable design and process-control criteria for CDW-based geopolymer binders.
1. Introduction
The construction sector faces mounting pressure to adopt innovative, sustainable solutions while managing the steadily growing volume of waste it generates [1]. Construction and demolition waste (CDW) arises from debris as well as poor planning and handling practices; because of its chemical nature, it is not amenable to aerobic/anaerobic digestion, composting, or simple chemical degradation, which often leads to informal disposal and environmental liabilities. In 2018, global generation averaged ~604 kg·capita−1·year−1 and is projected to rise by ~60% by 2050, intensifying soil and water contamination and greenhouse-gas emissions [2,3,4].
In Peru, construction is a major source of solid waste. In the province of Lima alone, 3,881,000 t of municipal solid waste was reported in 2020 (+7.4% vs. 2019), while the La Libertad region recorded a 3.8% annual growth in building activity between 2013 and 2022, reflecting expansion driven by housing/infrastructure demand and self-construction [5,6]. This context increases CDW flows and strains management capacity, prompting the need for recycling and valorization strategies that integrate CDW into material value chains [7]. The legal framework—Law No. 1278 and its Regulation (Supreme Decree No. 014-2017-MINAM)—mandates minimization, segregation, material/energy recovery, and traceability; the National Integrated Solid Waste Management Plan (PLANRES), together with municipal ordinances, promotes extended producer responsibility (EPR) and standardized, safe handling, enabling controlled use of CDW in construction materials [8,9,10].
Valorizing CDW in construction materials reduces disposal footprints and the extraction of non-renewable raw materials (the sector consumes ≈ 3 billion tons of primary resources per year), thus enabling circular-economy schemes [11,12]. The literature has explored supplementary cementitious materials (silica fume, fly ash, quicklime, ceramic wastes, palm-oil by-products) with reported effects on strength, durability, and waste-management cost [4]. In La Libertad, 58.8% of housing uses brick/cement block, so recycled brick powder (PLR) and recycled concrete powder (PCR) are significant local CDW fractions [13].
Within CDW, PLR—rich in Si and Al—has been used as a partial cement replacement, often improving mechanical behavior around ≈15% substitution; some studies report no significant losses when ≈15% PLR is combined with ≈30% recycled aggregates [14,15,16]. PCR—rich in Ca—is the most abundant waste globally, but its structural reuse is typically limited by abrasion resistance, lower bulk density, and higher absorption, restricting it to non-structural applications [17,18].
Geopolymers arise as lower-carbon inorganic binders relative to Portland cement: alkaline activation of aluminosilicates forms N-A-S-H networks, and in the presence of Ca, C-A-S-H domains that may coexist, achieving competitive mechanical performance and durability [19,20,21]. Favorable results are generally reported for curing temperatures ≥ 60 °C and low liquid-to-binder ratios (L/B), consistent with the dissolution → condensation → gelation/crystallization sequence (Si–O–Al bonds) [22,23,24,25,26].
Activator chemistry is critical. The Na2SiO3/NaOH ratio, the silica modulus (Ms = SiO2/Na2O), NaOH molarity, and the use of KOH regulate workability, network extent, and strength; even solid activators (Na2CO3, Na2SiO3·5H2O) offer operational advantages in some systems [27,28,29,30,31,32,33,34,35,36]. In ceramic–cement systems (PLR/ceramic tiles), curing at 80–90 °C with 8–14 M NaOH has delivered 40–60 MPa, with strong dependence on precursor fineness and porosity [37,38]. For PCR as a single precursor, strengths < 10–27 MPa are common unless co-activated with metakaolin or clinker and cured at ~70 °C; limitations are linked to unfavorable compositional ratios (low SiO2/(Al2O3 + CaO)) and secondary carbonation [38,39]. By contrast, binary PLR + PCR mixes often exhibit synergy at low–intermediate PCR fractions: the matrix densifies and strength increases, whereas high PCR fractions dilute reactive aluminosilicates and penalize performance (optima have been reported near ≈ 10–20% depending on batch, activator, and curing) [40,41,42].
Despite progress, two gaps persist: (i) inconsistent process variables (activator, L/B, curing) impede cross-study comparison and isolation of the pure %PCR effect; and (ii) scale decoupling remains common—mechanical data often lack the multi-technique support (XRD/FTIR/SEM-EDS) required for convergent mechanistic arguments [14,15,16,17,18,25,26,27,28,29,30,31,32,33,34]. Against this backdrop, the present work evaluates the effect of the PCR/PLR fraction while keeping constant a ternary activator NaOH/Na2SiO3/KOH (Ms ≈ 3.2) and L/B = 0.15, and triangulates compressive strength, XRD (amorphicity index/FWHM), FTIR (position/FWHM of the T–O–Si band—without making claims on absolute intensities), and SEM-EDS (Ca at.% as a local tracer). We hypothesize an intermediate optimum %PCR wherein moderate Ca enables C-A-S-H/N-A-S-H co-reticulation, maximizing densification and load-bearing capacity; outside that window, excess Ca2+ simplifies mineralogy (quartz/portlandite), triggers competing routes (C-S-H, carbonation), and reintroduces micro-defects [35,36,37,38,39,40,41,42,43,44]. In addition, a theoretical oxide balance per mix (Si–Al–Ca) is incorporated to quantify Ca/(Si + Al) as a design metric aligned with the observed optimum.
Objective and contribution. Our objective is to map 0–100% PCR in PLR–PCR pastes under fixed activator and curing conditions, and to demonstrate that ~30% PCR maximizes compressive strength by enabling C-A-S-H/N-A-S-H synergy, supported by independent tracers (XRD amorphicity/FWHM, FTIR Δν/FWHM of T–O–Si, SEM-EDS Ca at.%). Contributions include (i) isolation of the net %PCR effect, (ii) multi-technique triangulation for mechanism, (iii) a compositional metric (Ca/(Si + Al)) that reproduces the optimum window, and (iv) a reproducible methodology (25 × 50 mm geometry, L/B, activator, statistical protocol) transferable to other CDW families [1,2,3,4,5,35,36,37,38,39,40,41,42,43,44,45].
2. Materials and Methods
2.1. Raw Materials
Recycled concrete powder (PCR) and recycled brick powder (PLR) were collected from construction and demolition waste in Trujillo, Peru, and used as aluminosilicate precursors. Powders were oven-dried at 105 °C for 24 h, milled, and sieved to <37 µm (400 mesh) to minimize granulometry effects on early reactivity. The oxide chemistry (wt%) is reported in Table 1 (SiO2–Al2O3–CaO dominate; PCR is richer in Ca whereas PLR is richer in Si–Al).
Table 1.
Chemical characterization (oxides, % by mass) of PCR and PLR.
Beyond chemistry, we quantified physical attributes that govern early reactivity and packing: particle size distribution (PSD; D10/D50/D90 by laser diffraction), fineness (Blaine and BET), skeletal density (He pycnometry), and residual moisture. Methods, instruments, calibration standards, dispersion media, and settings are detailed in SI Table S1. Briefly, PLR exhibits a finer PSD and higher specific surface than PCR, consistent with a larger reactive aluminosilicate surface. PSD measurements were performed on oven-dried powders (105 °C, 24 h) dispersed in isopropanol with controlled sonication to limit agglomeration and spurious hydration/carbonation of PCR.
2.2. Alkaline Activator
A ternary activator was formulated at mass fractions 0.10:0.60:0.30 (NaOH:Na2SiO3:KOH). Reagents: NaOH flakes/pellets, ≥98% (ACS, Macron Fine Chemicals—Avantor Performance Materials, S.A. de C.V., Ecatepec de Morelos, Mexico); KOH pellets, ≥90% (ACS, Macron); commercial sodium silicate solution with silica modulus Ms = SiO2/Na2O ≈ 3.2 ± 0.1 (reference density ~1.38 g mL−1 at 20 °C). Deionized water was used throughout. Preparation: NaOH and KOH were dissolved separately in DI water, cooled to 23–25 °C, and combined with the Na2SiO3 solution under stirring to the target volume; the activator was homogenized for 5 min and rested ≥15 min to stabilize temperature and entrained bubbles before mixing with the powders. Design references (constant across mixes): mass ratio Na2SiO3/NaOH ≈ 6.0; silicate modulus Ms ≈ 3.2 ± 0.1. Informative only—no calculations depend on these conversions: nominal equivalents NaOH ≈ 8–9 M; KOH ≈ 4–5 M; global SiO2/Na2O ≈ 1.6–1.7.
2.3. Mix Design and Specimen Preparation
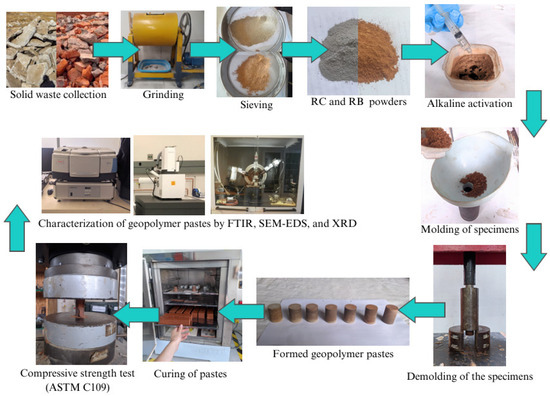
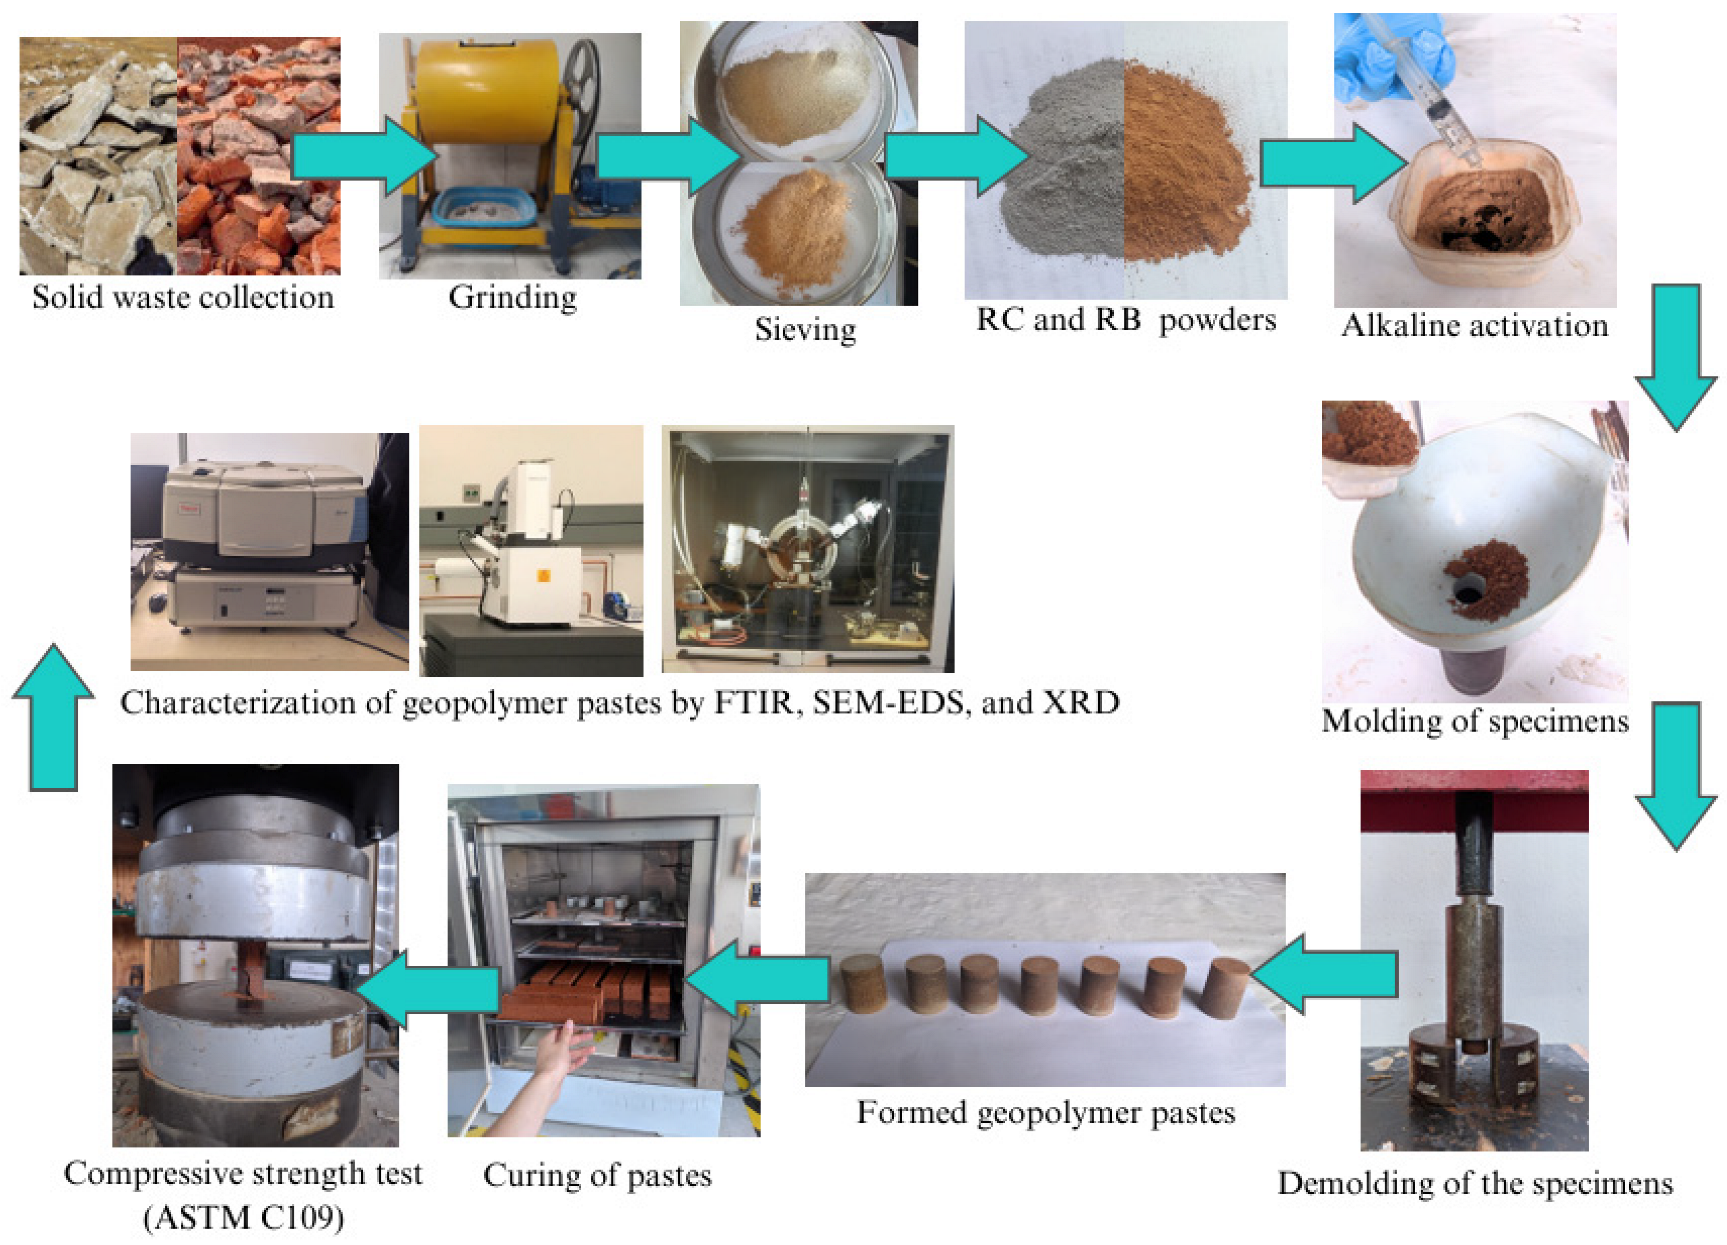
Seven binary formulations were produced by substituting PLR with PCR at 0, 10, 30, 50, 70, 90, and 100% of total precursor mass (PLR completes to 100%). The liquid-to-binder ratio (L/B) was fixed at 0.15 for all mixes. A batch size of 1000 g of precursor was used in every composition; activator mass was 150 g (split as 15 g NaOH, 90 g Na2SiO3, 45 g KOH). The full matrix is shown in Table 2. Mixing and molding: Dry powders (PCR + PLR) were pre-blended for 2 min. The activator was added and mixed for 3 min at low–medium speed in a Hobart paste mixer ((Hobart Corporation, Troy, OH, USA). Pastes were cast in steel cylindrical molds 25 mm diameter × 50 mm height, by uniaxial compaction (~500 psi). Demolding occurred at 24 h. Curing: A pre-cure at 40 °C for 72 h was applied in a ventilated oven, followed by storage at laboratory conditions (23–25 °C, RH 50–60%) until test ages (7, 14, 28 d). The overall experimental workflow is summarized in Figure 1.
Table 2.
Binary PCR/PLR mix matrix (L/B = 0.15).
Figure 1.
Experimental procedure workflow: conditioning of PCRs/PLRs → activator preparation → mixing → molding/compaction → pre-curing at 40 °C for 72 h → curing to 7/14/28 days → characterization (fc, XRD, FTIR, SEM–EDS).
2.4. Compressive Strength Testing
Compressive strength (fc) was measured in a universal testing machine Tecnotest Modena F060/EV (Modena, Italia) with parallel platens and verified alignment. Displacement control was set to 1.0 mm min−1. For each mix and age (7, 14, 28 d), n = 5 cylinders were tested. Results are reported as mean ± standard deviation (SD). The loading protocol and alignment criteria followed the principles of ASTM C109/C109M-24 (Standard Test Method for Compressive Strength of Hydraulic Cement Mortars; ASTM International: West Conshohocken, PA, USA), adapted to 25 × 50 mm cylinders.
2.5. X-Ray Diffraction (XRD)
Phase identification was performed on a Bruker D8 Advance powder diffractometer (Bruker AXS GmbH, Karlsruhe, Germany) (Cu Kα, λ = 1.5406 Å, 40 kV, 40 mA), θ–2θ geometry, 5–80° 2θ, step 0.020°, counting time 1.0 s/step, with sample spinning. Powders were finely ground and mounted on low-background silicon holders (Si-zero). A semi-quantitative Rietveld refinement was used to estimate the residual amorphous fraction.
Amorphicity index and peak metrics. To avoid statements based on absolute intensities, an amorphicity index was computed from the background-subtracted broad hump (≈18–38° 2θ) combined with FWHM metrics of the principal envelope; values were normalized within pattern. Quartz (≈26.7° 2θ) and portlandite (≈36.6° 2θ) peak intensities (I_Q, I_Pr) were tracked as qualitative markers only, not used for absolute-intensity comparisons.
2.6. Fourier Transform Infrared Spectroscopy (FTIR)
Spectra were acquired in ATR mode with a diamond crystal (Thermo Scientific Nicolet iS50—Shimadzu Corporation, Kyoto, Japan) over 4000–400 cm−1, at 4 cm−1 resolution, with 32 co-added scans per spectrum. A fresh background was recorded before each measurement and the ATR crystal was cleaned between samples. Prior to metric extraction, spectra were vector (unit-norm) normalized. Comparisons across mixtures are based on within-spectrum indicators and band-shape metrics of the T–O–Si envelope (≈1200–900 cm−1): (i) the centroid () as an effective band position, and (ii) the full width at half maximum (FWHM) obtained by assisted local fitting (Gaussian–Lorentzian/Voigt) with second-derivative verification of band limits. Additionally—and always within the same spectrum—we computed area fractions of the T–O–Si envelope relative to the total 4000–400 cm−1 area; no external reference band was used to claim between-sample intensity changes. Samples were dried at 60 °C for 24 h prior to analysis to limit physically adsorbed water.
2.7. Scanning Electron Microscopy and EDS (SEM–EDS)
Microstructure and local chemistry were examined with a Thermo Scientific Axia ChemiSEM (Thermo Fisher Scientific, Waltham, MA, USA) under high-vacuum, uncoated conditions (no conductive metallization). Secondary-electron (SE, 5 kV) imaging was used for topography and backscattered-electron (BSE, 15 kV) imaging for compositional contrast; working distance was 9–12 mm. Surfaces were freshly fractured from 28-day specimens and gently cleaned with dry air to remove loose particles. To mitigate charging, low beam current, frame averaging, and short dwell times were used. For each mixture, ≥5 representative fields (covering dense matrix and interparticle regions while avoiding large pores/edges) were imaged and analyzed at magnifications typically between 500× and 10,000×.
EDS was acquired at 15 kV (WD ≈ 10 mm) with real-time integration. Quantification followed the standard flow without standards (ZAF/φ(ρz)), with calibration/drift verified at the beginning and mid-run. Results are reported as atomic percentages. In this work, area-averaged Ca (at.%) (representative fields, masking open pores and unreacted inclusions) is used exclusively as a local tracer of matrix enrichment and not as an overall material composition. Mean ± SD is reported per mixture.
2.8. Statistical Treatment and QA/QC
Compressive strength: n = 5 specimens per mix and age (7, 14, 28 d).
FTIR: n = 3 independent spectra per mix. SEM-EDS: n ≥ 5 representative fields per mix. Assumption checks included normality (Shapiro–Wilk) and homoscedasticity (Levene or Brown–Forsythe). When applicable, one-way ANOVA was performed at α = 0.05, reporting effect size (η2 or ε2). For correlation analyses (see Section 3.6), we used Pearson’s r (two-tailed; n = 6 mixes: 0, 10, 30, 50, 70, 100% PCR, i.e., the subset with comparable multi-technique coverage) with 95% confidence intervals obtained via Fisher-z. Competing linear vs. quadratic models were compared using R2 and Akaike Information Criterion (AIC); sensitivity analyses were conducted by excluding points > 3 SD to probe robustness.
To ensure valid cross-mix comparisons, the XRD amorphicity index and FTIR network indicators were computed as within-pattern/spectrum normalized descriptors (position/width metrics and internal ratios), thus avoiding claims based on absolute ATR intensity. In SEM-EDS, area-averaged Ca (at.%) from representative fields is used strictly as a local tracer of Ca enrichment in the reacted matrix, and not as a bulk composition measurement. Instrument QA/QC: XRD was verified with NIST SRM 640d (Si); FTIR with a polystyrene film (band position/shape check); SEM-EDS included periodic energy calibration and drift checks; UTM platen parallelism/alignment was verified prior to testing.
3. Results
3.1. Compressive Strength
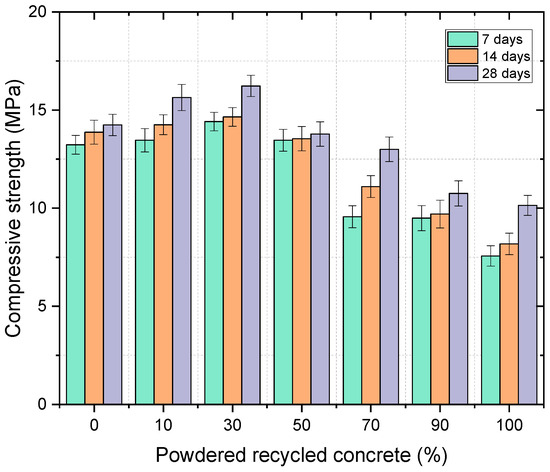
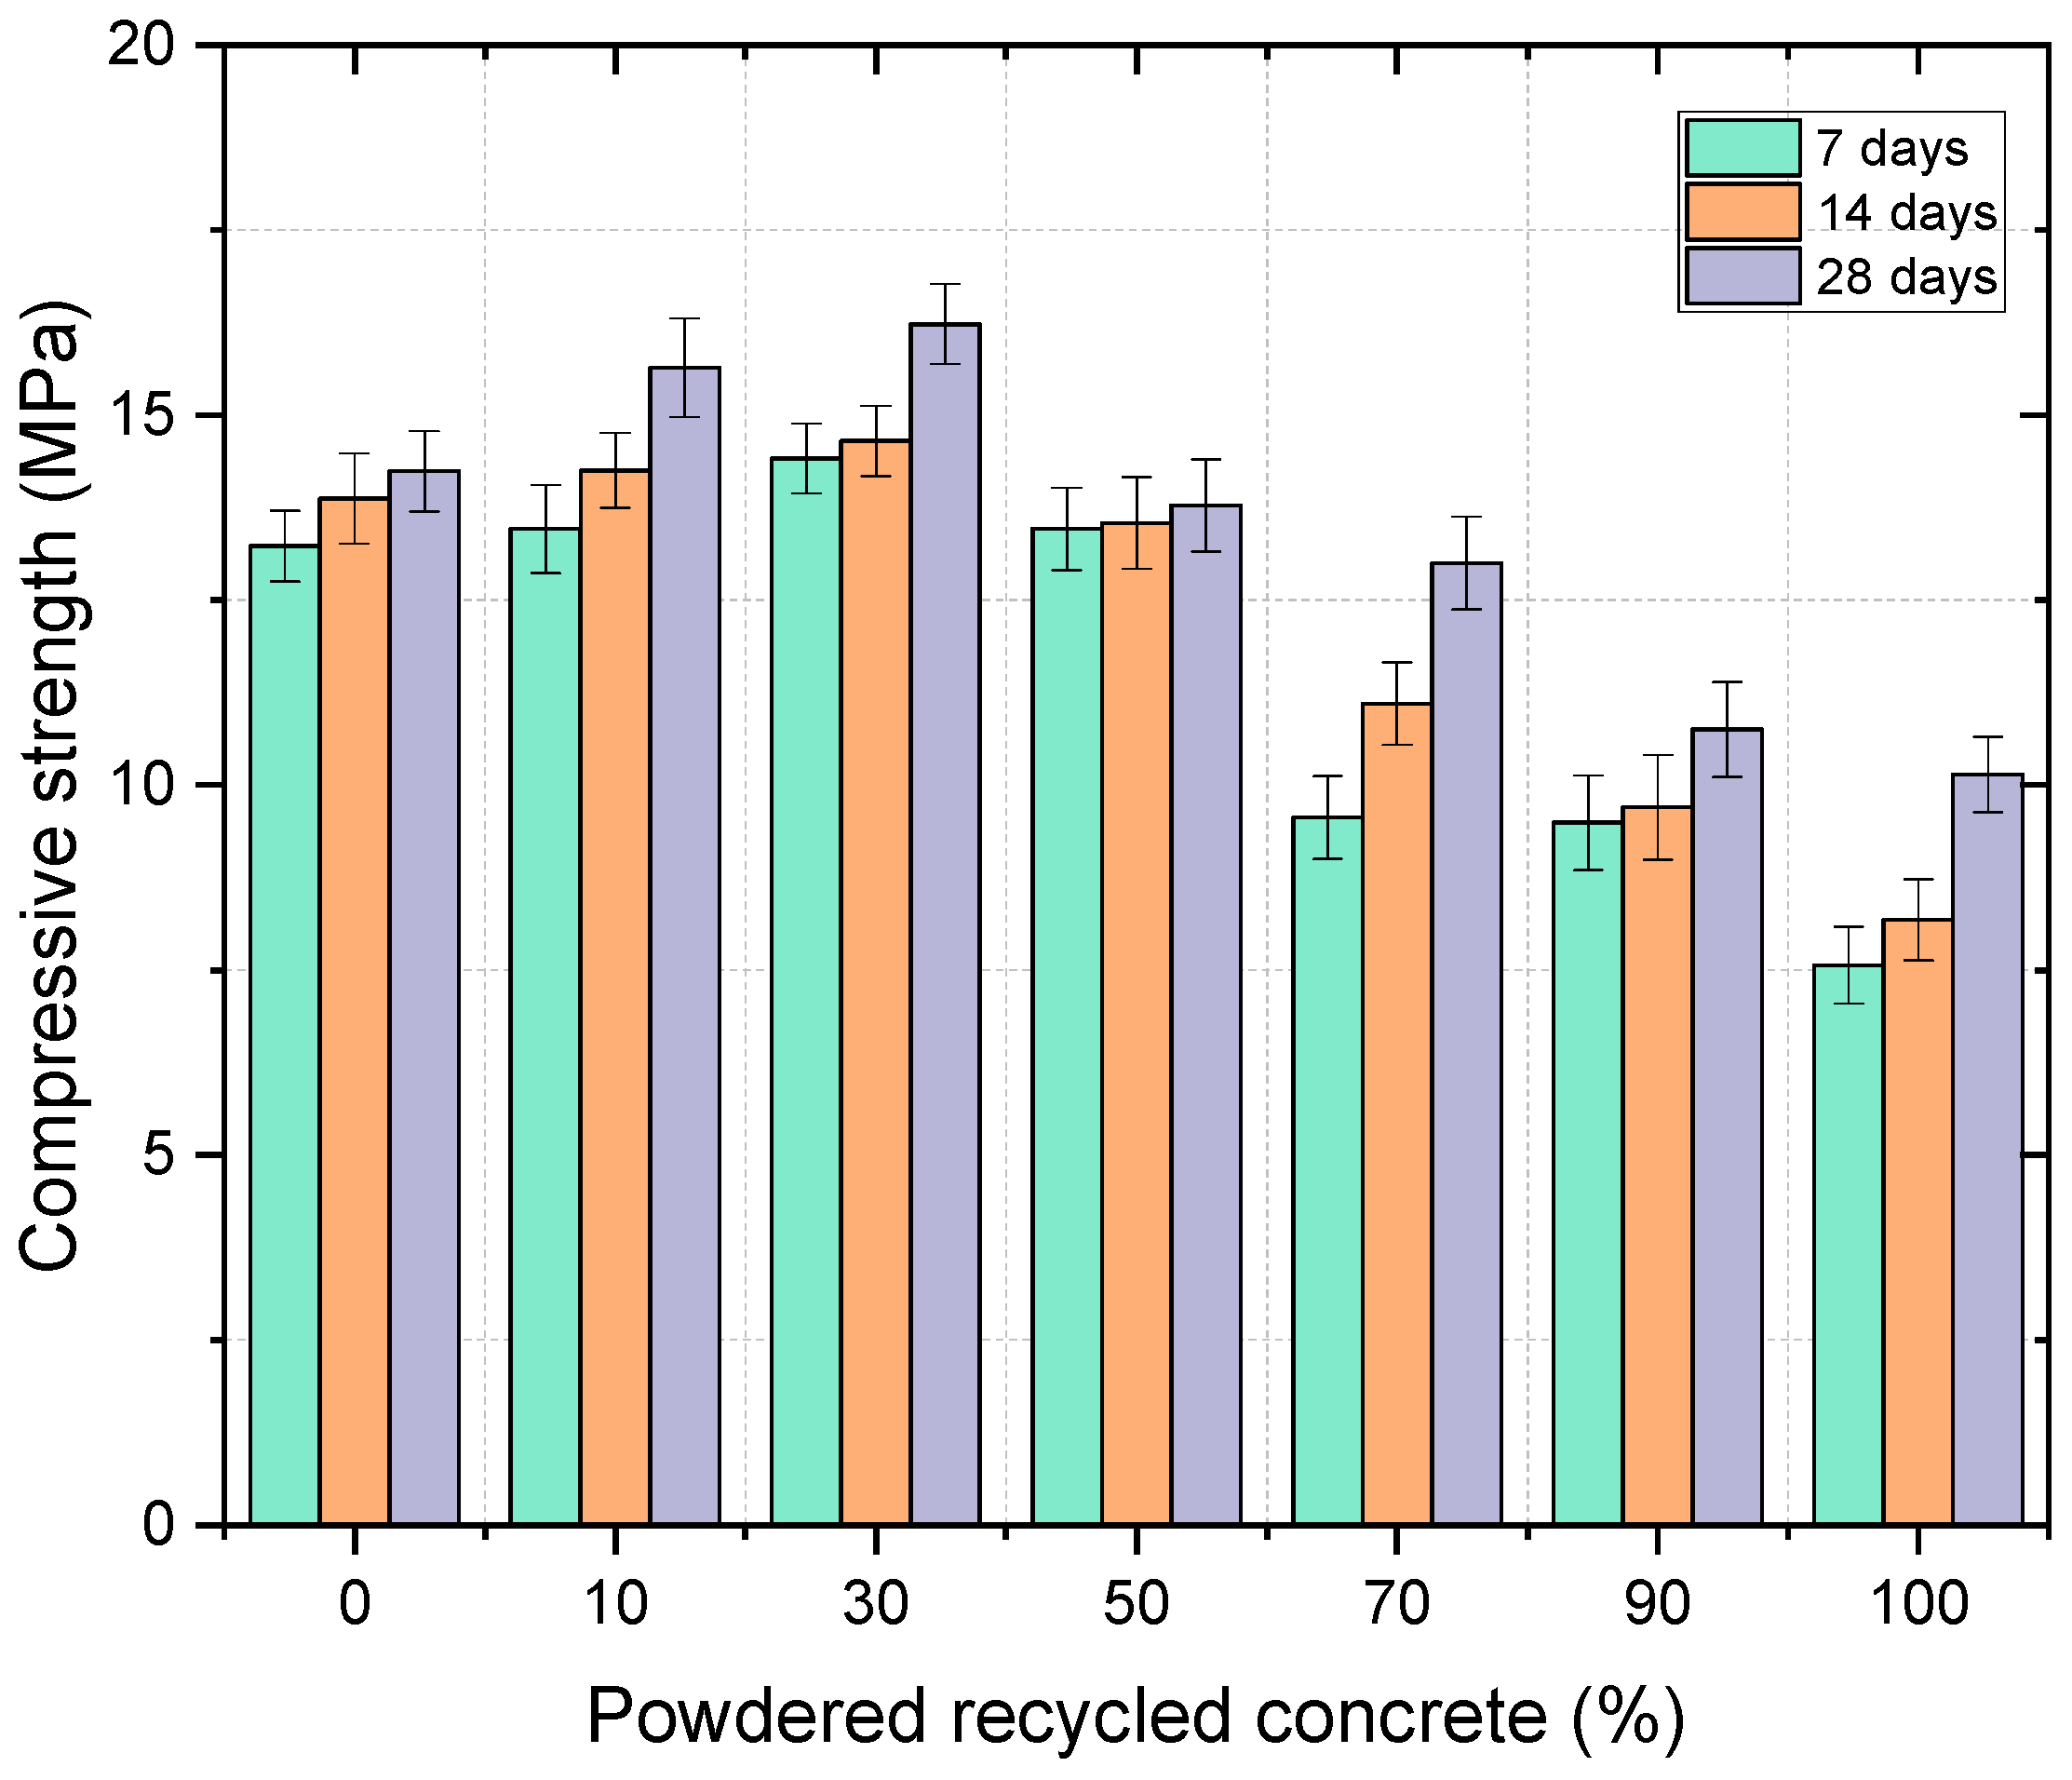
Figure 2 reports compressive strength (fc) at 7, 14, and 28 d for PLR–PCR pastes spanning 0–100% PCR. The response is non-linear: strength rises from 0 → 30% PCR and declines for ≥50% PCR. At 28 d, means were 14.2 MPa (0%), 15.6 MPa (10%), 16.2 MPa (30%, local maximum), 13.8 MPa (50%), 10.8 MPa (70%), and 10.1 MPa (100%). The 7/14 d data preserve the same ordering (see SI Table S2 for raw values, descriptive statistics, and ANOVA). Error bars (SD) reflect the typical dispersion of alkaline-activated pastes tested at L/B = 0.15 with constant activator chemistry.
Figure 2.
Compressive strength.
3.2. XRD—Composition Effect at 28 d
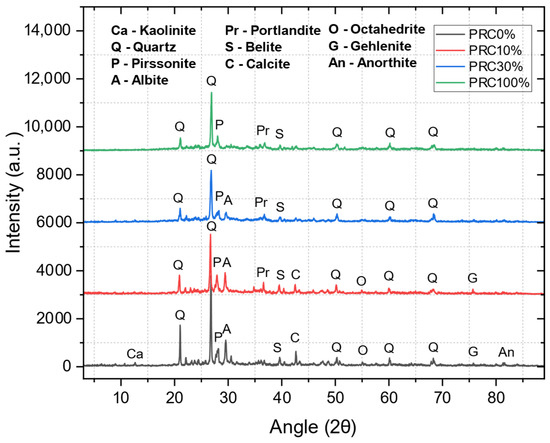
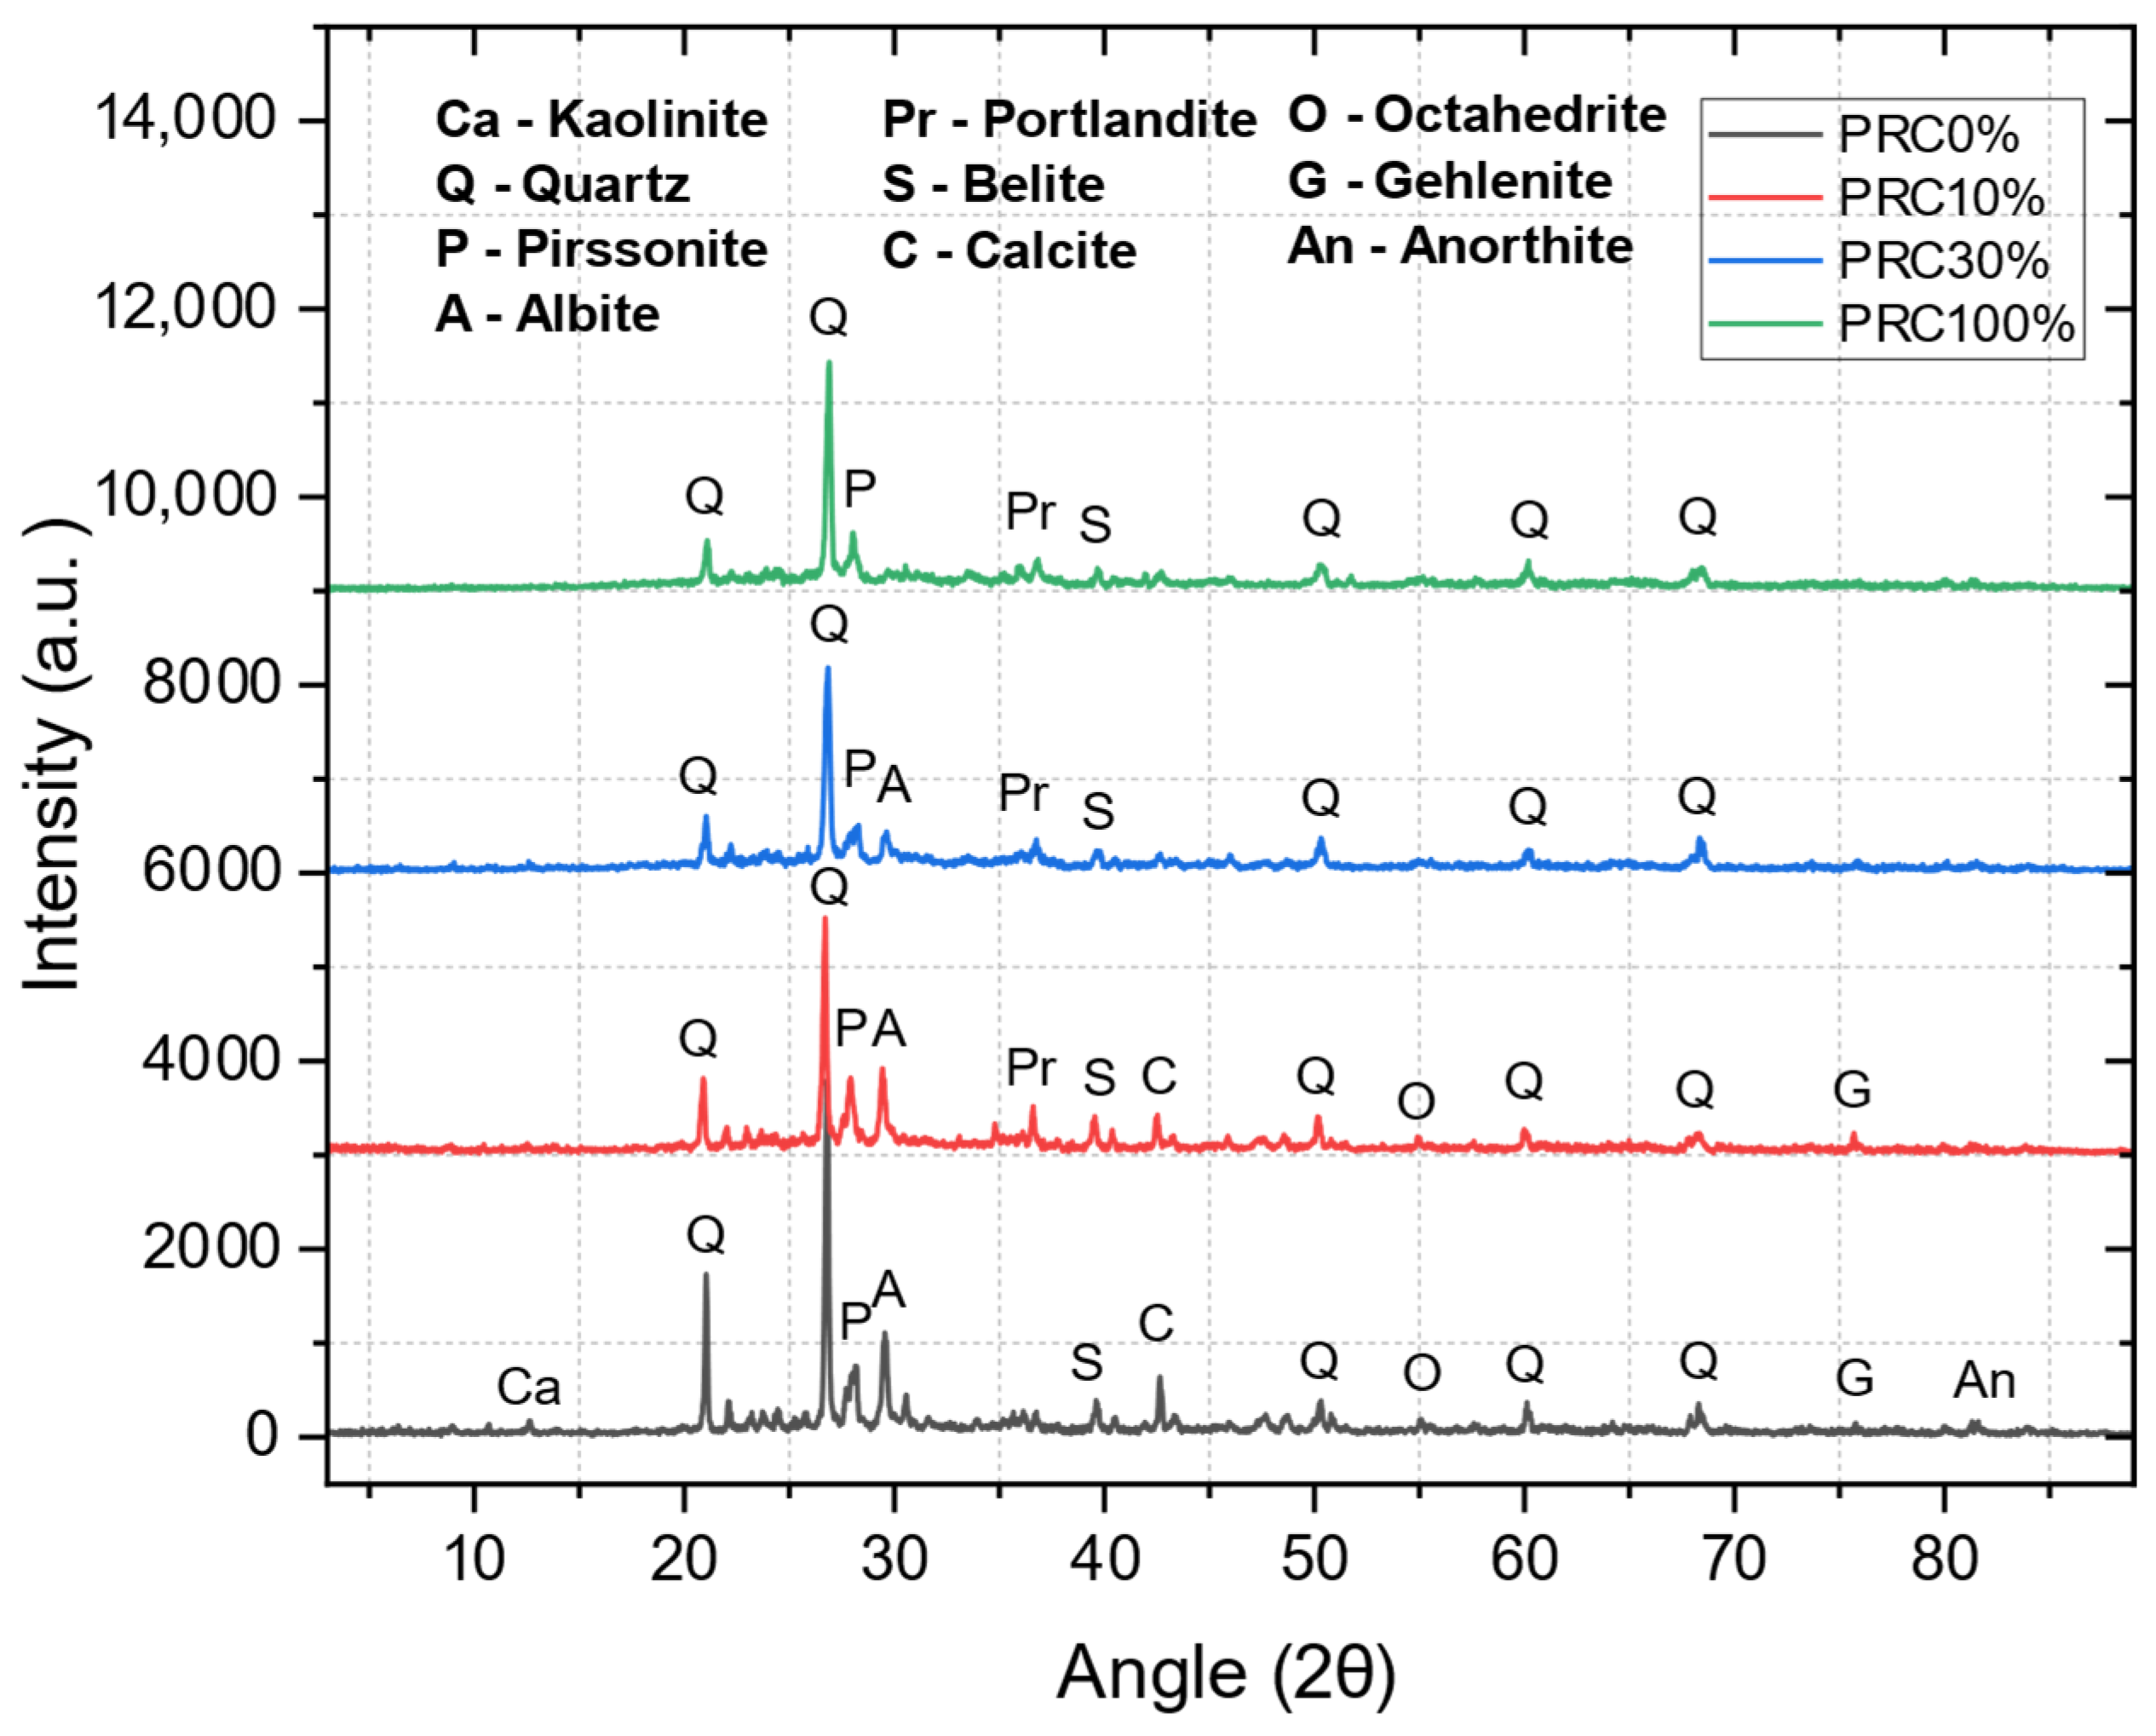
Figure 3 compares 28 d XRD patterns for 0, 10, 30, and 100% PCR. 0% PCR (PLR only): broad crystalline set (kaolinite, quartz, albite, belite, calcite, octahedrite, gehlenite, anorthite), with quartz dominant near 26.7° 2θ. 10–30% PCR: portlandite emerges at ≈36.6° 2θ; several PLR-derived reflections (e.g., albite at 29.54° 2θ) diminish in relative prominence; the amorphous hump (≈18–38° 2θ) becomes more pronounced. 100% PCR: simplified pattern dominated by quartz/portlandite, indicating Ca-rich products and a limited aluminosilicate network [46,47,48,49,50,51,52]. An amorphicity index (background-subtracted area at 18–38° 2θ plus the FWHM of the main hump, normalized within pattern) increases from 0 → 30% PCR and decreases thereafter, mirroring fc.
Figure 3.
XRD of pastes with different compositions at 28 days.
3.3. XRD—Curing Age (7 vs. 28 d, 30% PCR)
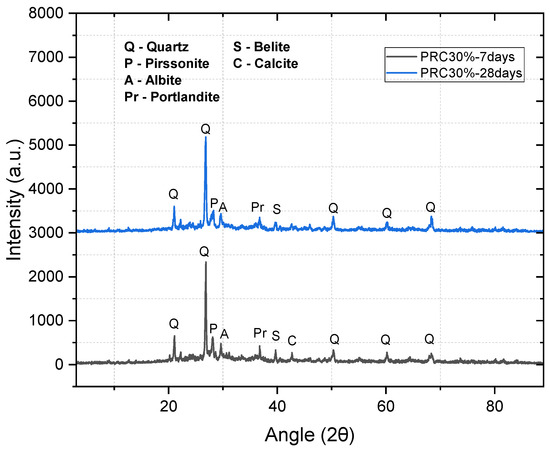
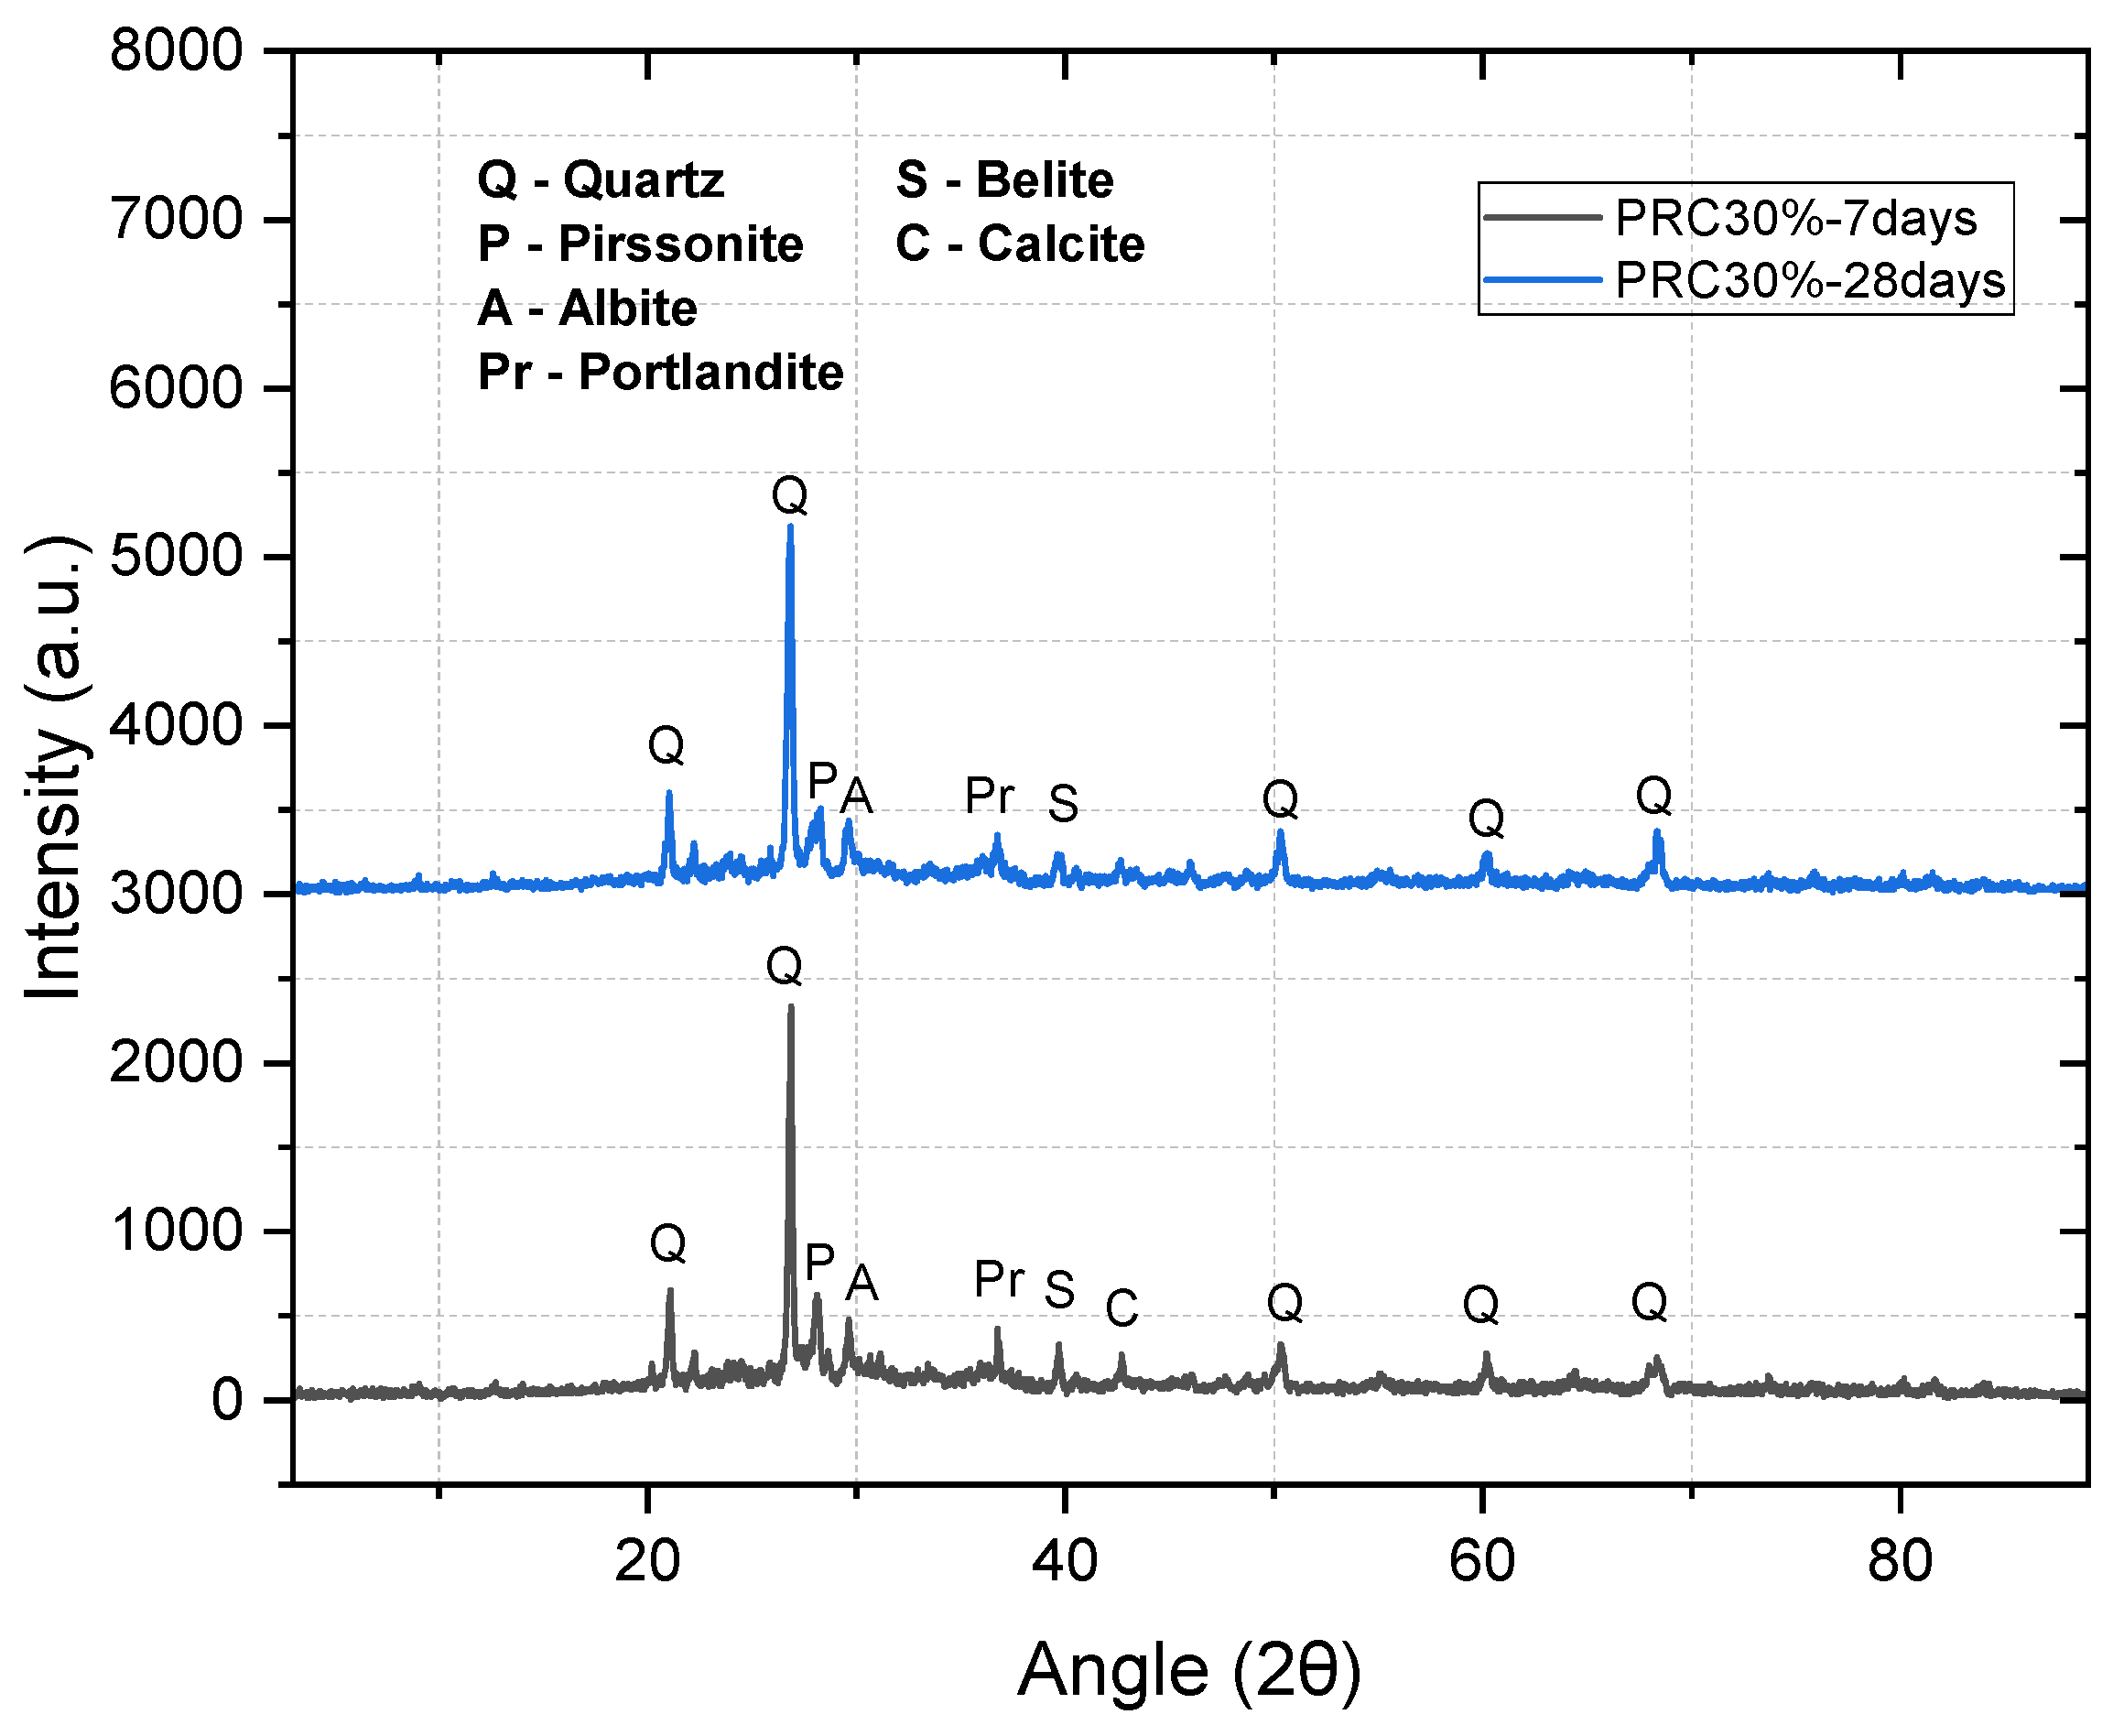
Figure 4 (30% PCR) shows stable peak positions (quartz, albite, portlandite, belite, calcite) and a slight decrease in portlandite/belite intensities by 28 d, consistent with continued reaction and growth of the amorphous fraction. The amorphous-hump FWHM broadens modestly with age, indicating extended gel formation within the aluminosilicate framework.
Figure 4.
XRD comparison of pastes at different curing ages.
3.4. SEM–EDS—Microstructure and Local Chemistry (28 d)
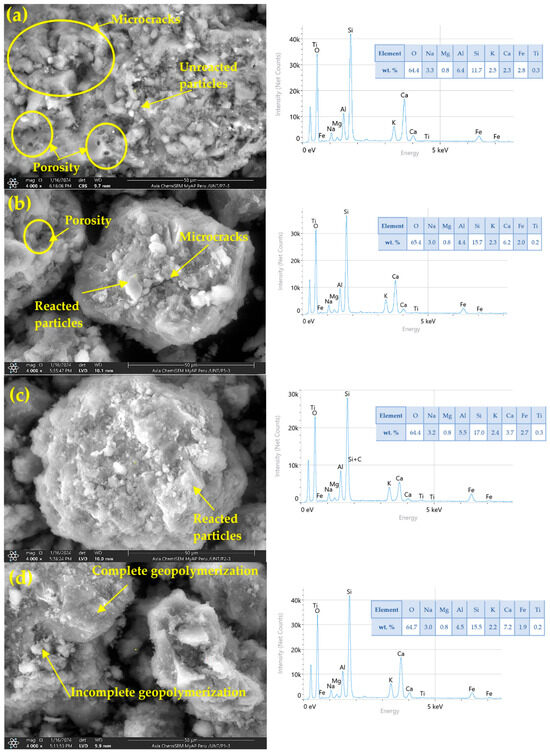
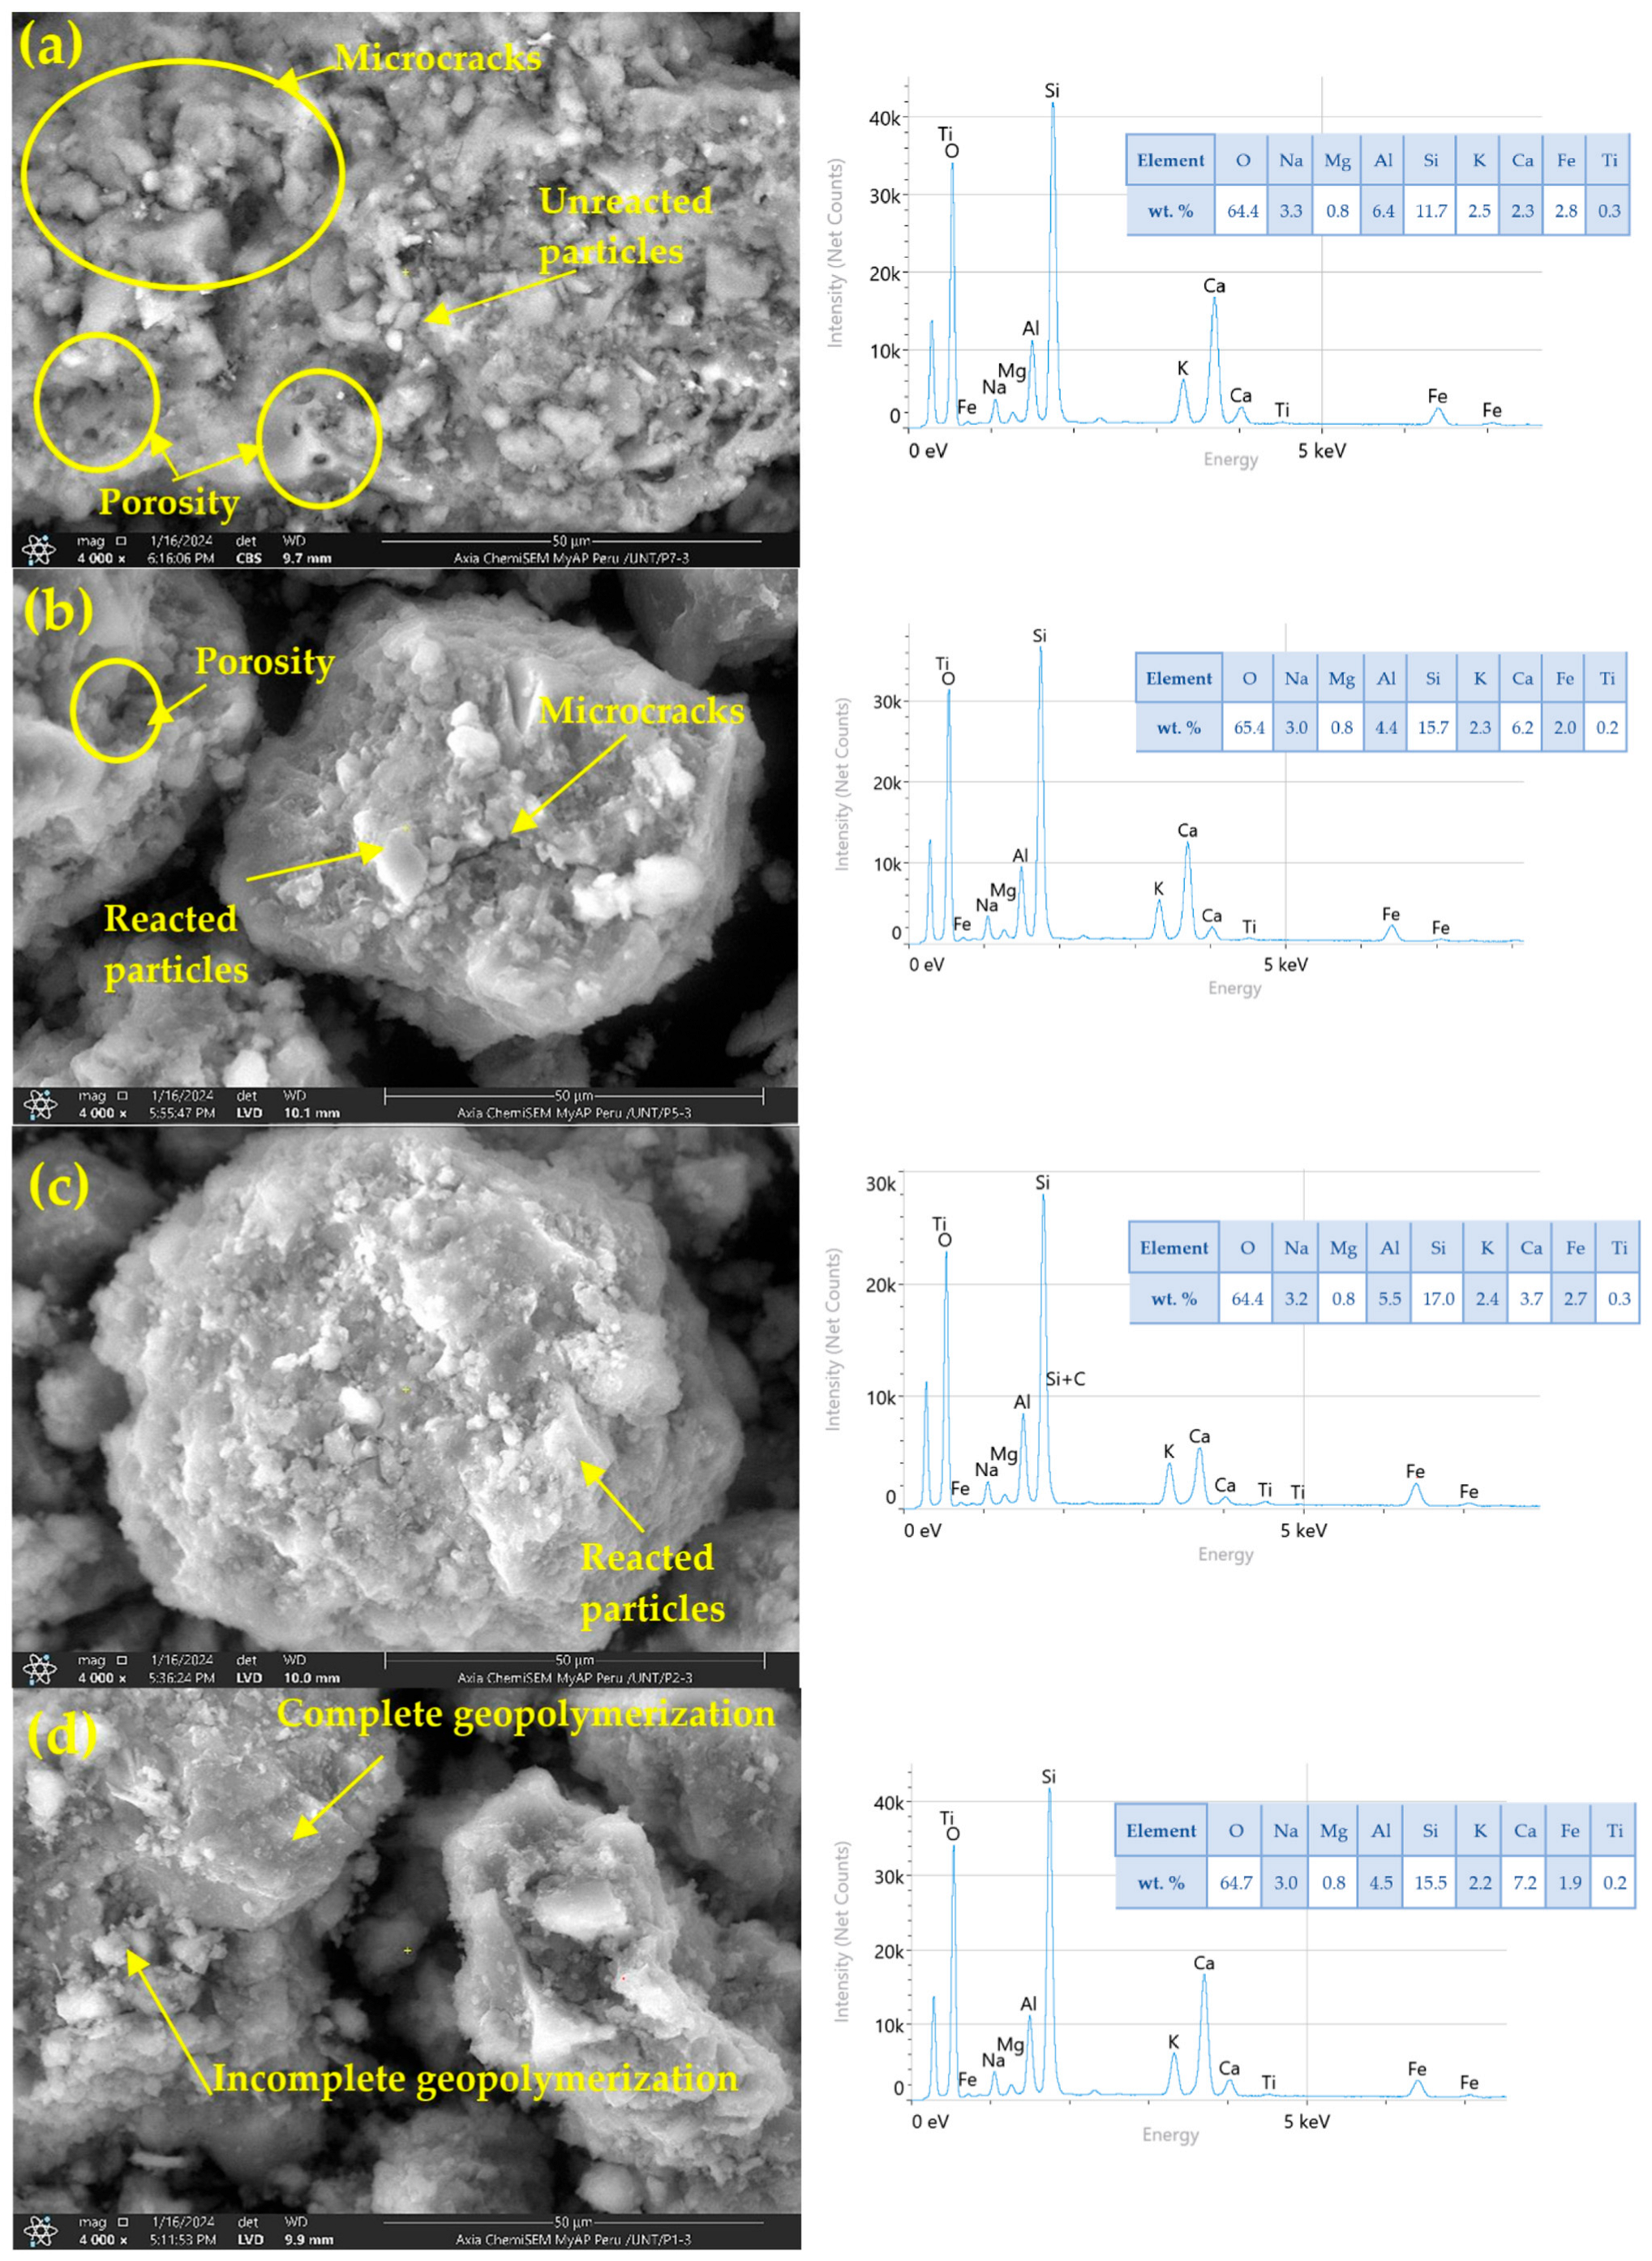
Figure 5 compares 28 d microstructures. 0% PCR: visible porosity and microcracks; unreacted particles. EDS is Si–Al-dominated (N-A-S-H matrix) with low Ca. 10% PCR: reduced microcracking and tighter packing; EDS shows a small Ca increase. 30% PCR: dense matrix with minimal defectology; EDS shows higher Ca (at.%) than at 0–10%, compatible with C-A-S-H domains coexisting with N-A-S-H. 100% PCR: heterogeneous texture with reintroduced pores/microcracks; elevated Ca and lower relative Al–Si signal, consistent with an interrupted aluminosilicate network. EDS is used semi-quantitatively as a local tracer of Ca enrichment (area-averaged fields), not as a bulk composition measurement [53,54,55,56].
Figure 5.
SEM-EDS of pastes with different compositions at 28 days: (a) 0% PCR, (b) 10% PCR, (c) 30% PCR, and (d) 100% PCR.
3.5. FTIR—Network Signatures (28 d; 7–28 d at 30% PCR)
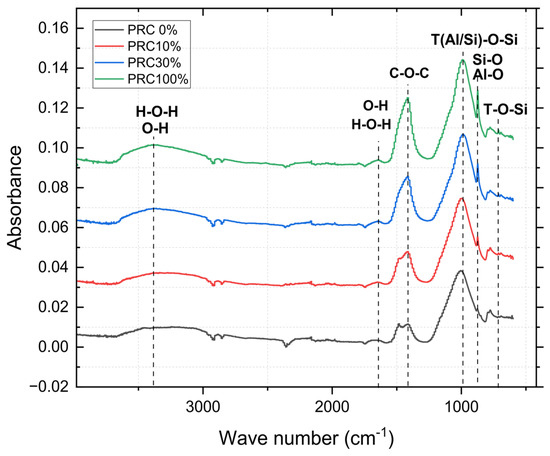
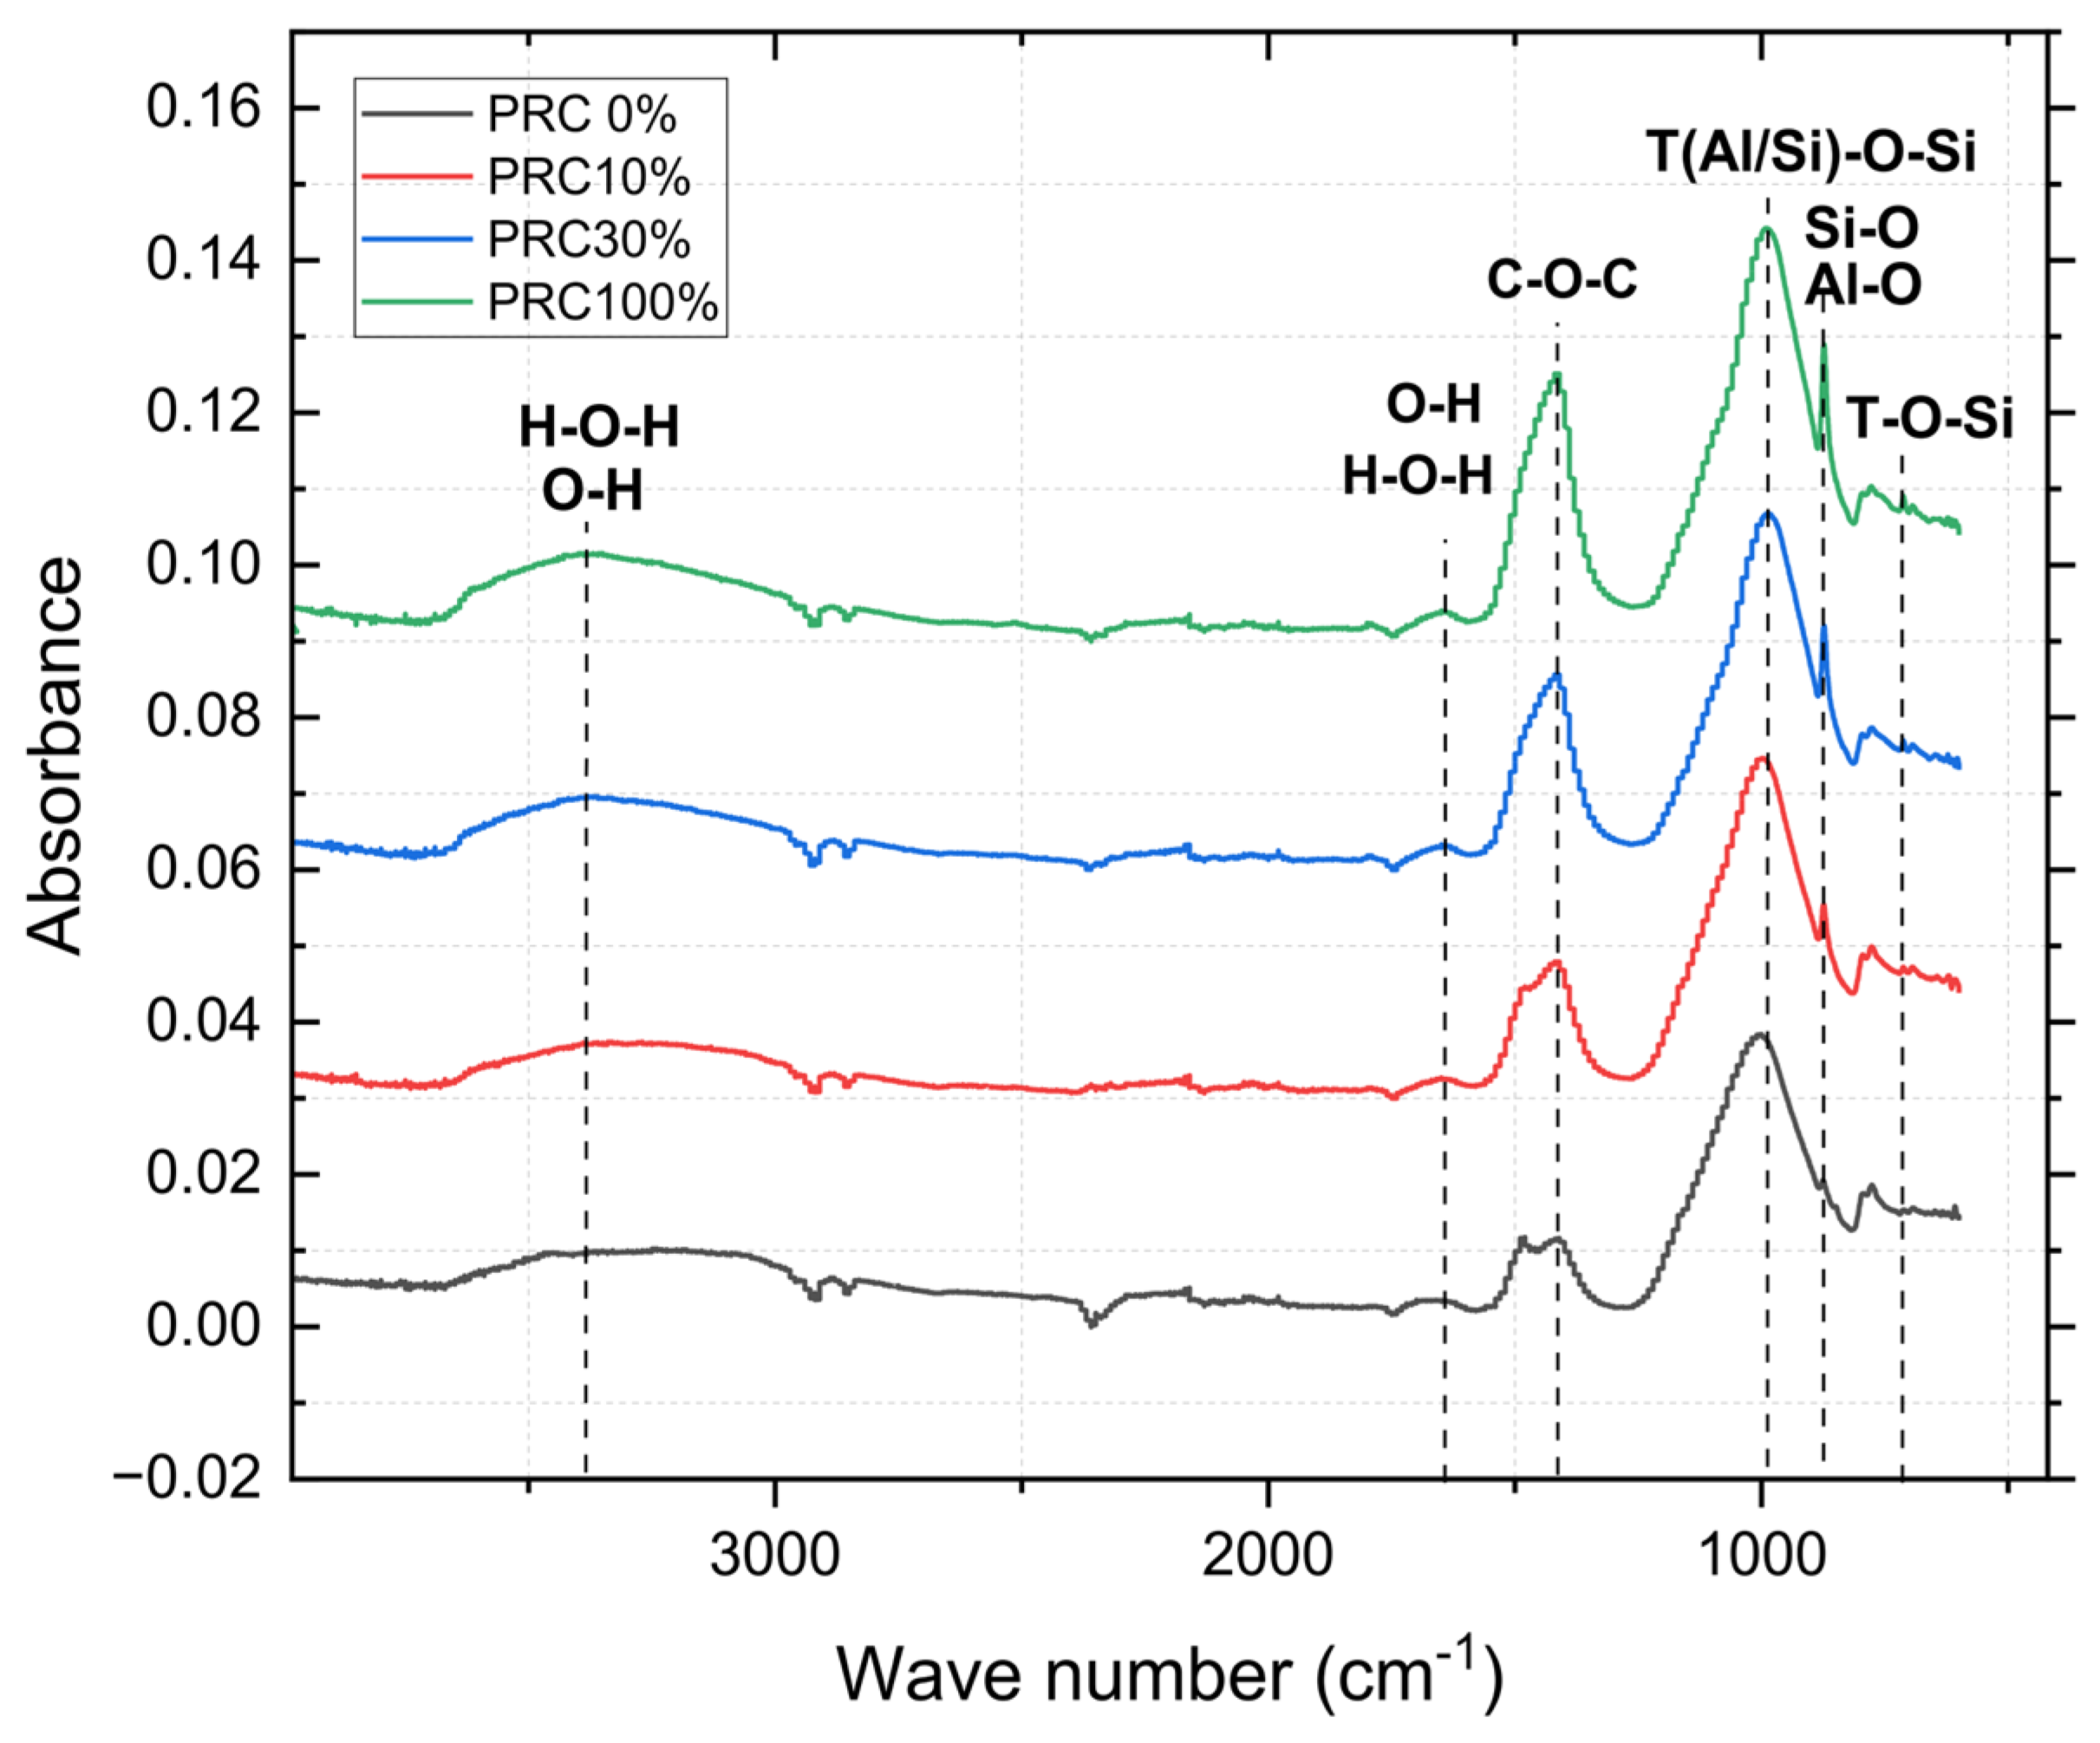
Overview at 28 days (0, 10, 30, 100% PCR). After within-spectrum normalization, the T–O–Si envelope (≈1200–900 cm−1) exhibits a centroid downshift ( to lower wavenumbers) and a slight FWHM broadening at 10–30% PCR relative to 0% PCR (Figure 6). These two features are consistent with a more extended and compositionally heterogeneous aluminosilicate network (greater prevalence of Si–O–(Si/Al) linkages). At 100% PCR, the T–O–Si envelope remains detectable but with comparatively narrower traits, while the carbonate region (≈1460–1380 cm−1) becomes more prominent, in line with higher Ca availability and secondary carbonation.
Figure 6.
FTIR of pastes with different compositions at 28 days.
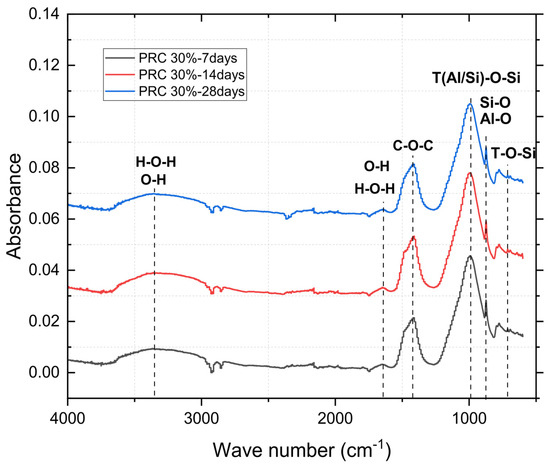
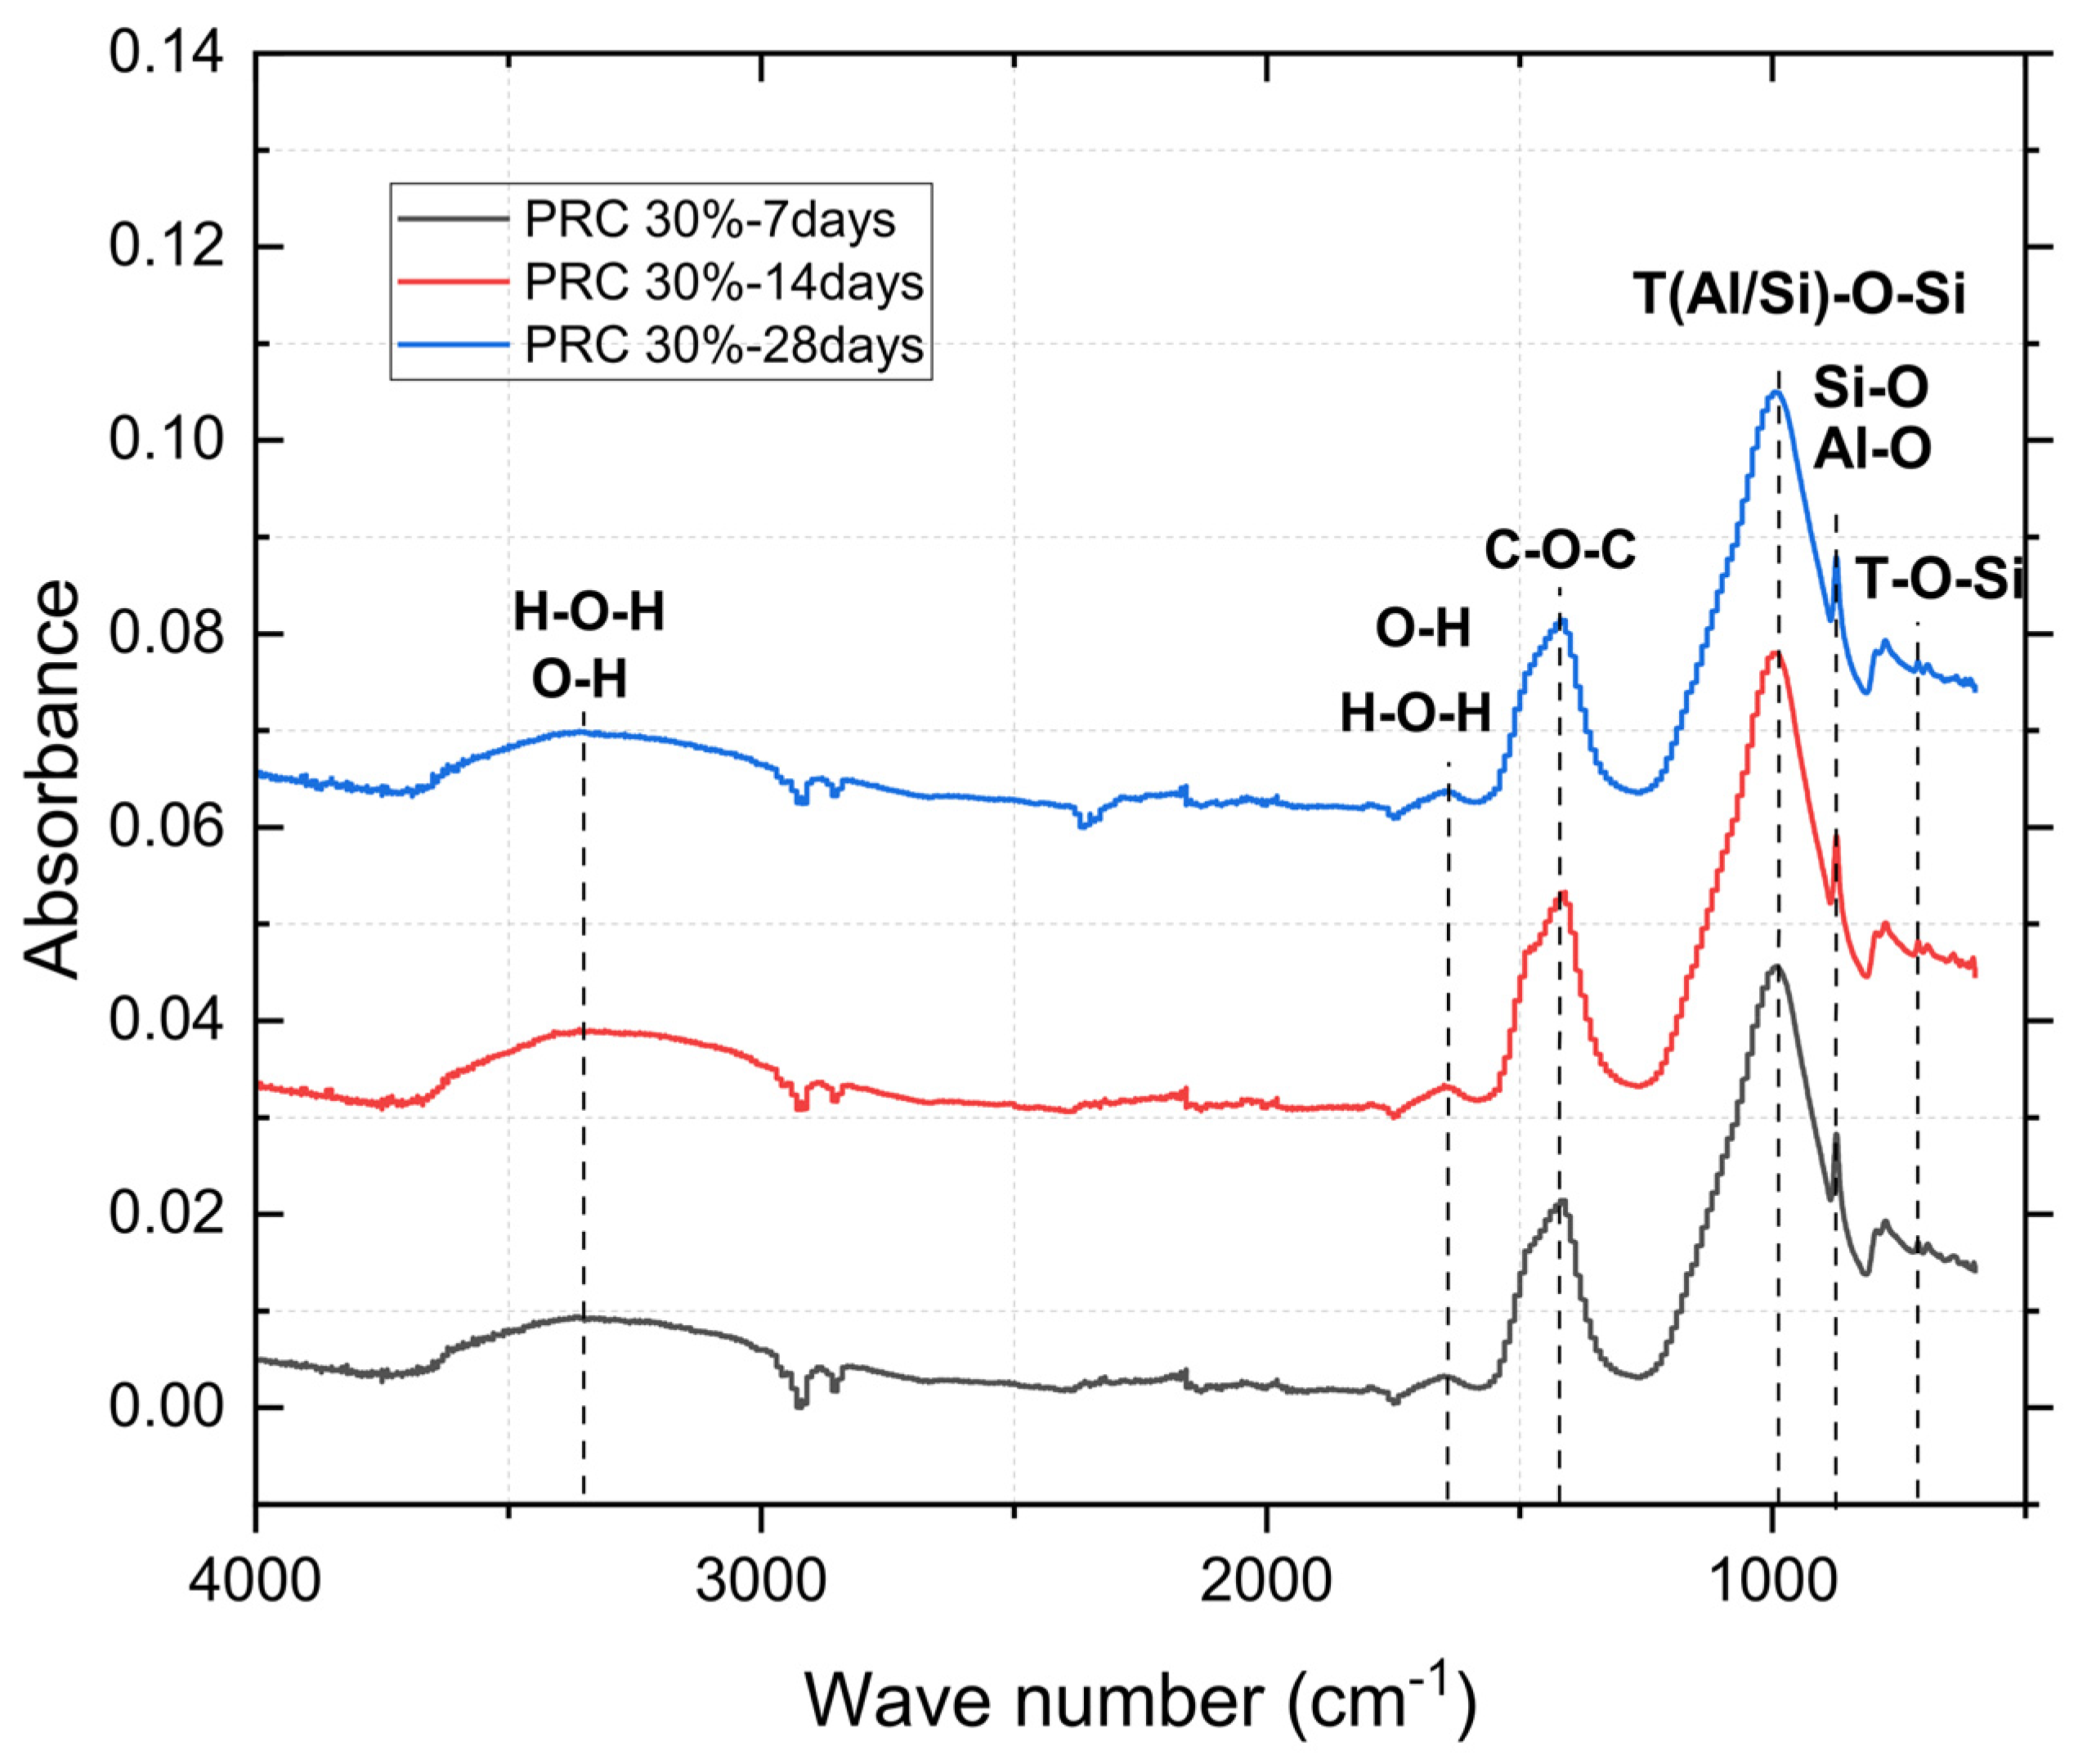
Age evolution at 30% PCR (7 → 14 → 28 d). A progressive downshift of and a modest FWHM broadening are observed in the T–O–Si region under the applied curing schedule, supporting ongoing condensation and network maturation over time (Figure 7) [57].
Figure 7.
FTIR of pastes at different curing ages.
Processing and comparison criteria. All between-mixture statements are drawn from band position (centroid, ), band width (FWHM), and within-spectrum ratios computed inside the 1200–900 cm−1 window; no absolute ATR intensity comparisons across samples are used. Crosslinks with mechanical and microstructural indicators are discussed in Section 3.6. Overall, the FTIR trends at intermediate PCR fractions are coherent with the mechanical optimum near 30% PCR and with the N-A-S-H/C-A-S-H co-reticulation scenario inferred from XRD (amorphicity changes) and SEM-EDS (moderate Ca enrichment) [42,58,59,60,61,62,63,64,65,66,67]. All conclusions are supported by position (), width (FWHM) and internal ratios of the spectrum at 1200–900 cm−1, consistent with the methodological approach of Section 2.6.
3.6. Property–Structure Correlations (28 d)
To integrate mechanical response with intensity-independent structural descriptors, we correlated (28 d) against three metrics: (i) a pattern-internal XRD amorphicity index, (ii) a normalized FTIR T–O–Si indicator derived from band position (centroid, ) and width (FWHM) within 1200–900 cm−1 after within-spectrum normalization, and (iii) area-averaged Ca (at.%) from SEM–EDS as a local tracer (not a bulk composition). Statistics used Pearson’s (two-tailed), mixes (0, 10, 30, 50, 70, 100% PCR), with 95% CIs by Fisher-. Linear and quadratic models were compared via /AIC, with sensitivity analyses excluding points SD; assumptions and QA/QC follow Section 2.8.
- vs. XRD amorphicity index. , , 95% CI ; linear fit ; a quadratic term yields a marginal gain ().
- vs. FTIR (normalized T–O–Si indicator). , ; linear ; the quadratic model adds only minor improvement.
- vs. Ca (at.%) by SEM–EDS (local). , , 95% CI . A quadratic model markedly improves the fit (), revealing an intermediate Ca optimum (consistent with PCR) and performance losses at the extremes (0% and 100% PCR).
Overall, strength increases with higher amorphicity (XRD) and with the T–O–Si evolution (FTIR)—both proxies of network extension/densification—while Ca (at.%) acts as a non-monotonic driver: moderate Ca promotes C-A-S-H/N-A-S-H co-reticulation and improved load-bearing connectivity; excess Ca simplifies mineralogy (quartz/portlandite), favors C–S–H/carbonation pathways, reintroduces microdefects, and reduces . These convergent trends align with the mechanical optimum near 30% PCR and the microstructural model (Figure 8).
Figure 8.
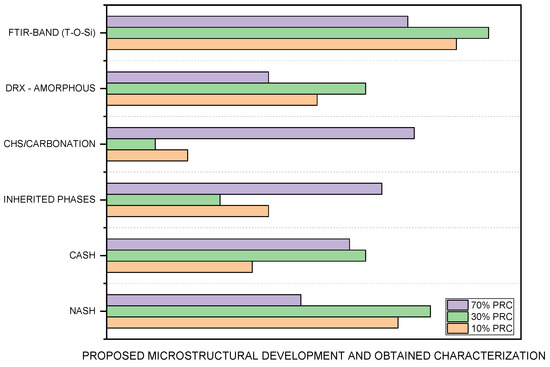
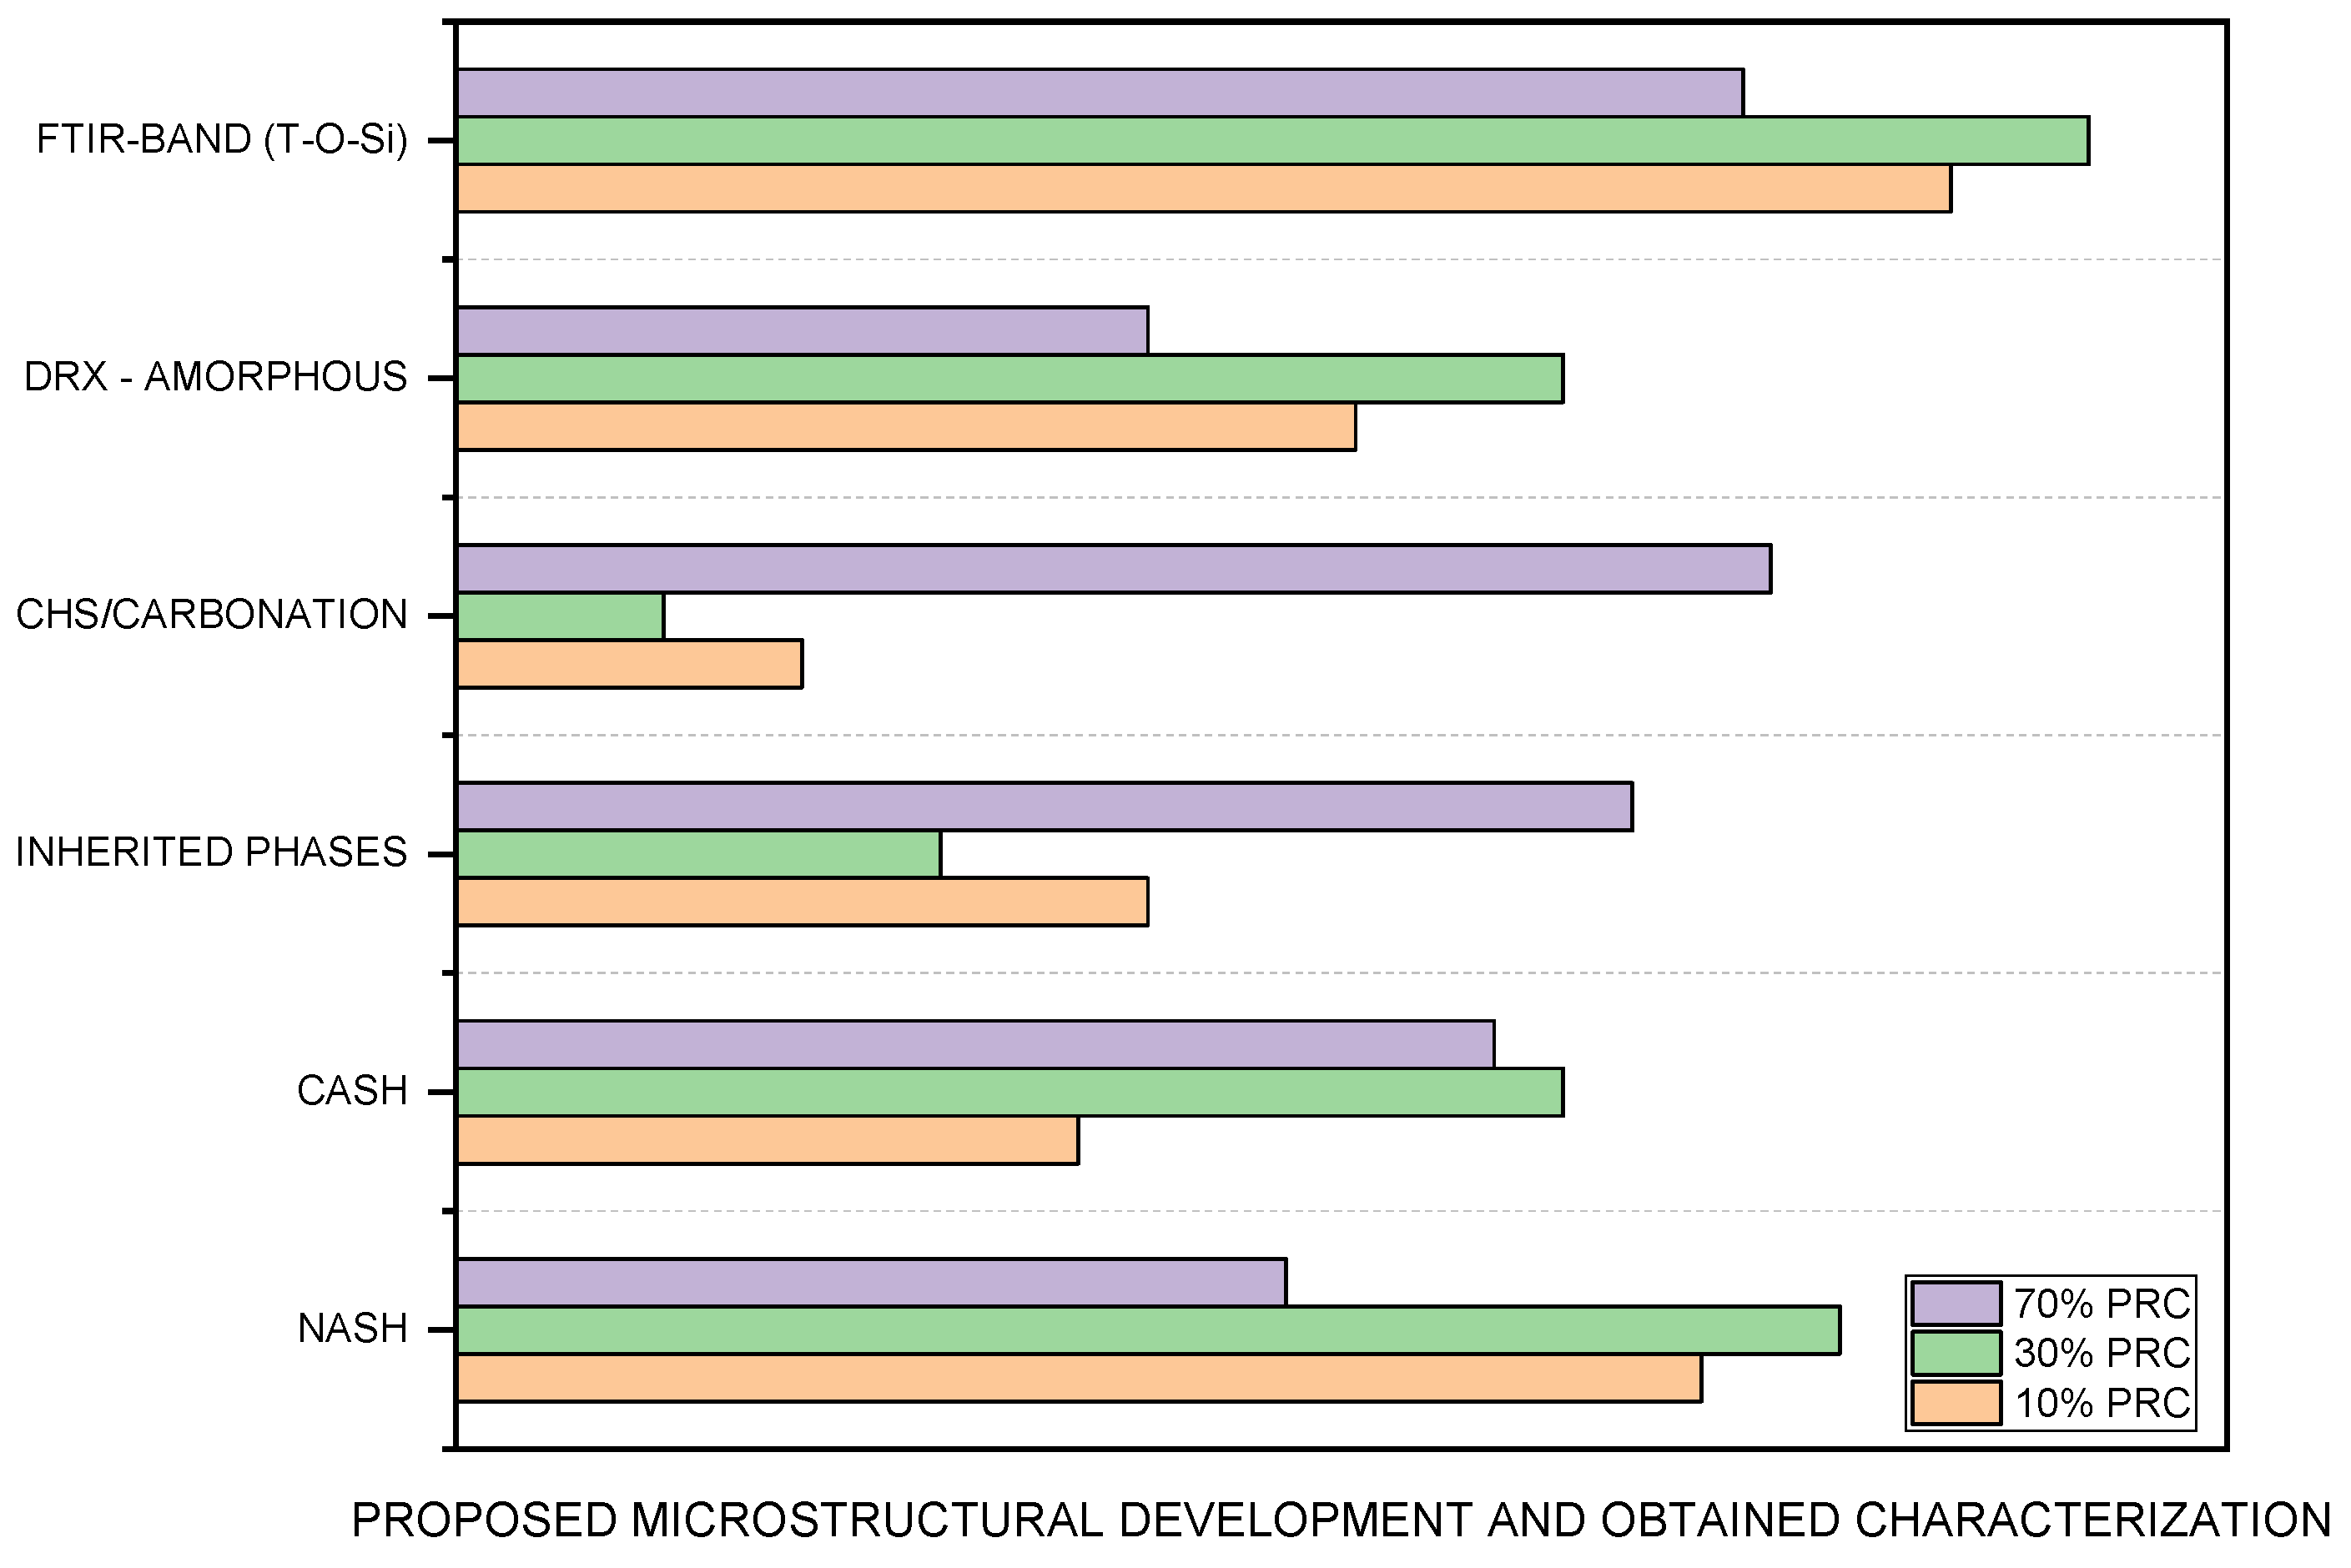
Normalized microstructural and characterization synthesis for PLR–PCR pastes at three PCR levels (10% = orange, 30% = green, 70% = purple). Categories (from top to bottom): FTIR (T–O–Si, normalized position/FWHM), XRD (relative amorphicity, 18–38° 2θ + FWHM, normalized), C–S–H/carbonation, inherited phases (quartz/portlandite), C-A-S-H, N-A-S-H. Bar lengths are normalized (0–1 per indicator) to show trends (not absolute intensities): 30% PCR maximizes amorphicity and T–O–Si with a balanced N-A-S-H/C-A-S-H lattice (highest fc); 70% PCR increases C–S–H/carbonation and inherited phases (lowest fc); 10% PCR preserves N-A-S-H with nascent C-A-S-H. Notes: (i) FTIR bars are based on band position shift/FWHM (spectrum-normalized). (ii) XRD bars use hump area/FWHM in 18–38° 2θ (pattern-normalized). (iii) The “C–S–H/carbonation” and “Inherited phases” categories summarize semi-quantitative evidence (e.g., portlandite/quartz prominence, carbonate signatures) and local Ca enrichment trends from SEM–EDS; they are conceptual tracers, not bulk composition. (iv)—bar heights are scaled qualitatively to match the tendencies in Section 3.2, Section 3.3, Section 3.4 and Section 3.5.
3.7. Theoretical Oxide Balance Per Mix (Si–Al–Ca)
Using Table 1 oxides and Table 2 proportions, a theoretical Si–Al–Ca balance was computed for each mix (normalized to Si + Al + Ca in the precursor mass; activator oxygen not counted). Table 3 reports Si, Al, Ca (relative fractions) and the derived Ca/(Si + Al) index. The 30% PCR mix falls within Ca/(Si + Al) ≈ 0.35–0.45, coincident with the maxima of fc, the XRD amorphicity index, and the FTIR T–O–Si indicator. For ≥ 50% PCR, Ca/(Si + Al) exceeds that interval, aligning with pattern simplification (quartz/portlandite) and reduced strength. This compositional metric therefore defines a design window consistent with the observed optimum.
3.8. Visual Synthesis of Tracers
Figure 8 displays a horizontal bar chart that integrates six indicators across three compositions of PCR (10%, 30%, 70%). The categories on the vertical axis are: N-A-S-H, C-A-S-H, Inherited phases (quartz/portlandite), C–S–H/carbonation, XRD—Relative amorphicity (18–38° 2θ hump/FWHM), and FTIR band (T–O–Si, position/FWHM normalized). For each category, three bars compare the 10% PCR (orange), 30% PCR (green) and 70% PCR (purple) states. Bar lengths are normalized (0–1) within each indicator (qualitative scaling), so they illustrate trends observed in Section 3.2, Section 3.3, Section 3.4 and Section 3.5 rather than absolute intensities. Consistent with the results, 30% PCR (green) shows higher relative amorphicity (XRD) and stronger T–O–Si evolution (FTIR, position/FWHM), together with balanced N-A-S-H/C-A-S-H, whereas 70% PCR (purple) shows higher C–S–H/carbonation and inherited phases, and 10% PCR (orange) retains dominant N-A-S-H with limited C-A-S-H. The mechanistic implications are discussed in Section 4.8.
4. Discussion
4.1. Dominant Mechanism and the ≈30% PCR Optimum
The compressive strength (fc)–composition curve exhibits a local maximum at ≈30% PCR and decreases for substitutions ≥ 50%. This response is explained by co-reticulation between N-A-S-H domains (sourced from the aluminosilicate stock of PLR) and C-A-S-H domains (nucleated by Ca from PCR). Within the intermediate window, Ca is sufficient to bridge and densify the N-A-S-H network; beyond that threshold, excess Ca2+ and dilution of reactive Si–Al species activate competing routes (C–S–H and/or secondary carbonation), disrupt network continuity, and reduce fc. This framework is consistent with prior reports on ceramic–cement systems derived from CDW and with Figure 8, which synthesizes the micro/mesostructural tracers by PCR level.
4.2. Diffractometric Evidence: Mineralogical Simplification and Relative Amorphicity
At 28 days, XRD shows that PLR (0% PCR) retains a broad crystalline palette; with 10–30% PCR, portlandite (~36.6° 2θ) appears and the relative prominence of PLR phases (e.g., albite ~29.54° 2θ) diminishes, suggesting consumption/dilution of crystalline aluminosilicates and growth of the amorphous fraction associated with reaction gels. At 100% PCR, the pattern simplifies (quartz/portlandite dominant), indicating Ca predominance and a smaller aluminosilicate contribution. To avoid inferences from absolute intensities, we use a relative amorphicity index (area of the 18–38° 2θ hump + FWHM, normalized within each pattern), which maximizes at 30% PCR, in line with the mechanical peak.
4.3. Spectroscopic Evidence (FTIR): Normalized Δ/FWHM Descriptors
After within-spectrum normalization, the T–O–Si envelope (≈1200–900 cm−1) exhibits a centroid shift () to lower wavenumbers and a moderate FWHM broadening at 10–30% PCR relative to 0% PCR—features consistent with greater network extent/heterogeneity of the aluminosilicate gel. At 100% PCR, carbonate features (~1460–1380 cm−1) become more evident, in line with secondary carbonation in Ca-rich matrices. The 7 → 14 → 28 d evolution at 30% PCR shows a progressive downshift and slight FWHM broadening under the applied curing schedule, supporting ongoing condensation. All comparisons rely on position/width metrics and within-spectrum ratios; no claims are made from absolute intensity (Figure 6 and Figure 7).
4.4. Microstructure (SEM–EDS): Intermediate Densification and High-PCR Heterogeneity
SEM (28 d) reveals a transition from a porous/microcracked matrix (0% PCR) to a compact microstructure (10–30% PCR) and, again, to heterogeneity with reintroduced defects (100% PCR). EDS is used locally (representative fields, at.%) as a tracer of Ca enrichment, not as a bulk composition measurement: the increase in Ca (0 → 30% PCR) supports C-A-S-H nucleation/bridging; at 100% PCR, higher Ca with a lower relative Al–Si share is consistent with reduced co-continuity and lower fc (Figure 5).
4.5. Quantitative Integration: fc–Tracer Correlations (28 d)
To provide intensity-independent evidence of network development, fc was correlated with (i) a normalized XRD amorphicity index, (ii) a normalized FTIR T–O–Si indicator derived from band position (centroid, ) and width (FWHM) within 1200–900 cm−1, and (iii) Ca (at.%) from SEM–EDS (local tracer). Significant associations were obtained:
fc vs. XRD amorphicity: r ≈ 0.97, p ≈ 0.001; linear R2 ≈ 0.95; quadratic adds marginal gain.
fc vs. FTIR (T–O–Si, normalized): r ≈ 0.90, p ≈ 0.015; linear R2 ≈ 0.86–0.90.
fc vs. Ca (at.%): non-linear relation; a quadratic model (R2 ≈ 0.93) reveals an intermediate Ca optimum (≈30% PCR) and performance losses at the extremes (0% and 100% PCR).
4.6. Theoretical Oxide Balance and the Ca/(Si + Al) Metric
The per-mix theoretical balance (Table 3) shows that Ca/(Si + Al) ≈ 0.35–0.45 coincides with (i) the mechanical optimum (~30% PCR), (ii) the relative maximum in XRD amorphicity, and (iii) the most favorable evolution of T–O–Si (FTIR). Outside this window, dilution of reactive aluminosilicates and stronger carbonation explain the drop in fc.
4.7. Kinetics and Curing
The 40 °C/72 h pre-curing accelerates dissolution–condensation and early gel formation; subsequent room-temperature curing enables network maturation/reorganization, as reflected by the 7 → 14 → 28 d increase in fc and by FTIR metrics (/FWHM).
4.8. Design and Quality-Control Implications
The results delineate a design window centered at ≈30% PCR. For scale-up: (i) keep L/B = 0.15 and Ms ≈ 3.2; (ii) ensure fineness < 75 μm and control inherited phases in incoming lots; (iii) adopt fast tracers (normalized XRD amorphicity and FTIR T–O–Si descriptors) as process controls; and (iv) verify Ca (at.%) by EDS at reception to maintain the Ca/Si–Al balance that enables co-reticulation (see Figure 8).
4.9. Limitations and Future Work
Activator chemistry and L/B were fixed to isolate the %PCR effect; granulometry and mineralogy of the CDW sources were not varied. A more direct confirmation of co-reticulation would benefit from absolute quantification (e.g., KBr-FTIR with an internal standard, 29Si/27Al NMR, selective fractionation) and from mapping Ms/molarity, granulometry/mineralogy, and curing windows; future work should also address durability (sulfates, chlorides, wet–dry cycles).
5. Conclusions
Mechanical optimum at ≈30% PCR. With NaOH/Na2SiO3/KOH (Ms ≈ 3.2) and L/B = 0.15, PLR–PCR pastes reached fc(28 d) = 16.2 MPa at 30% PCR, higher than 0% PCR (14.2 MPa) and decreasing systematically for ≥50% (e.g., 13.8–10.1 MPa).
Mechanism (N-A-S-H/C-A-S-H co-reticulation). Ca from PCR nucleates C-A-S-H that bridges/densifies the N-A-S-H network, maximizing connectivity at intermediate fractions; excess Ca2+ dilutes reactive Si–Al, promotes C–S–H/carbonation, and penalizes fc (see Figure 8).
Multi-technique convergence.
- −
- XRD (28 d): reduced prominence of PLR crystalline phases and a relative maximum in amorphicity (18–38° 2θ + FWHM, normalized) at 30% PCR.
- −
- FTIR (28 d): /FWHM (normalized) of T–O–Si indicate a more extended network at 30% PCR; carbonates are more evident at high PCR.
- −
- SEM–EDS (28 d): densification at 10–30% PCR; heterogeneity/defect reintroduction at 100% PCR; Ca (at.%) used as a local tracer.
Quantitative associations (28 d). fc correlates positively with the XRD amorphicity index (r ≈ 0.97, p ≈ 0.001) and with the FTIR T–O–Si indicator (r ≈ 0.90, p ≈ 0.015); fc vs. Ca (at.%) follows a non-linear trend (best quadratic fit, R2 ≈ 0.93) with an intermediate optimum.
Compositional metric. The per-mix theoretical balance places Ca/(Si + Al) ≈ 0.35–0.45 in the vicinity of the mechanical optimum and of the XRD/FTIR relative maxima; outside that window, the network simplifies and carbonation increases.
Formulation and control implications. For reproducibility and scale-up: preserve L/B and Ms, ensure fineness, and control inherited phases; use XRD amorphicity and FTIR T–O–Si as rapid tracers; verify Ca (at.%) by EDS at reception to maintain the Ca/Si–Al balance enabling co-reticulation.
Scope/limitations and future work. The %PCR effect was isolated by fixing activator and L/B; future research should map Ms/molarity, granulometry/mineralogy, and curing windows, and include durability. For direct confirmation of co-reticulation, consider KBr-FTIR with a reference band and 29Si/27Al NMR.
Supplementary Materials
The following supporting information can be downloaded at https://www.mdpi.com/article/10.3390/ceramics9020019/s1, Table S1. Powder properties (PSD D10/D50/D90, Blaine/BET, skeletal density, residual moisture, instruments and settings); Table S2. Compressive strength raw data by specimen and curing age (n = 5 per mix and age); Table S3. Compressive strength summary (mean ± SD) by mix and age; Table S4. Correlation statistics and model fits (fc vs. XRD amorphicity; FTIR T–O–Si indicator; Ca (at.%) by SEM–EDS).
Author Contributions
Methodology, J.C.R.-S.; Formal analysis, J.C.R.-S. and C.V.-B.; Investigation, O.G.-A. and A.C.-C.; Data curation, A.V.-A.; Writing—original draft, O.G.-A. and A.C.-C.; Writing—review and editing, A.V.-A.; Supervision, C.V.-B.; Project administration, A.V.-A. All authors have read and agreed to the published version of the manuscript.
Funding
This research was funded by Canon Projects of the National University of Trujillo. PIC No. 02-2022—Emblematic Modality and PIC No. 01-2022—Modality 01—VI Call for Proposals.
Data Availability Statement
The original contributions presented in this study are included in the article/Supplementary Materials. Further inquiries can be directed to the corresponding author.
Acknowledgments
To the National University of Trujillo, through the CANON-2022 Competitive Fund Projects. “Alkaline activation of pastes and mortars from construction debris and calcareous organic remains for their reuse: a green alternative to the problem of construction waste pollution” and “Ecological reinforcement based on sansevieria trifasciata fibers for polyester matrices and alkaline cement mortars: an environmentally friendly and socially promoting alternative” financed the equipment necessary for the results of this research article.
Conflicts of Interest
The authors declare no conflicts of interest.
Abbreviations
The following abbreviations are used in this manuscript:
| RCD | Construction and Demolition Waste (Spanish acronym). |
| CDW | Construction and Demolition Waste (English equivalent of RCD). |
| PCR | Recycled Concrete Powder. |
| PLR | Recycled Brick Powder. |
| BCR | Recycled Ceramic Tiles (when citing tile-based literature). |
| MK | Metakaolin |
| NaOH | Sodium hydroxide. |
| KOH | Potassium hydroxide. |
| Na2SiO3 | Sodium silicate (commercial solution). |
| Ms | Silica modulus of sodium silicate (Ms = SiO2/Na2O). |
| L/B or l/a | Liquid-to-binder ratio (liquid/binder). |
| N-A-S-H | Sodium aluminosilicate hydrate (sodium aluminosilicate gel). |
| C-A-S-H | Calcium aluminosilicate hydrate (calcium aluminosilicate gel). |
| C-S-H | Calcium silicate hydrate (calcium silicate gel). |
| fc | Compressive strength (MPa). |
| SD | Standard deviation. |
| FWHM | Full width at half maximum (in XRD). |
| I_Q (26.7°) | Intensity of the quartz peak around 26.7° 2θ. |
| I_Pr (36.6°) | Intensity of the portlandite peak around 36.6° 2θ. |
| d | Days (curing age, e.g., 7, 14, 28 d). |
| MPa | Megapascal (unit of stress). |
References
- Iqbal, S.; Naz, T.; Naseem, M. Challenges and opportunities linked with waste management under global perspective: A mini review. J. Qual. Assur. Appl. Sci. 2021, 1, 9–13. [Google Scholar]
- Olofinnade, O.M.; Manda, I.; Ede, A.N. Management of construction & demolition waste: Barriers and strategies to achieving good waste practice for developing countries. IOP Conf. Ser. Mater. Sci. Eng. 2021, 1036, 012045. [Google Scholar]
- Akhtar, A.; Sarmah, A.K. Construction and demolition waste generation and properties of recycled aggregate concrete: A global perspective. J. Clean. Prod. 2018, 262, 262–281. [Google Scholar] [CrossRef] [Scilit]
- Oliveira, J.D.; Schreiber, D.; Jahno, V.D. Circular Economy and Buildings as Material Banks in Mitigation of Environmental Impacts from Construction and Demolition Waste. Sustainability 2024, 16, 5022. [Google Scholar] [CrossRef] [Scilit]
- INEI. Perú: Anuario de Estadísticas Ambientales 2021; INEI: Lima, Peru, 2021.
- BCRP. Caracterización del Departamento de la Libertad; BCRP: Trujillo, Perú, 2023.
- Omer, M.M.; Rahman, R.A.; Almutairi, S. Construction waste recycling: Enhancement strategies and organization size. Phys. Chem. Earth Parts A/B/C 2022, 126, 103114. [Google Scholar] [CrossRef] [Scilit]
- Congreso de la República del Perú. Ley General de Residuos Sólidos, Ley N° 1278. 2000. Available online: https://www.minam.gob.pe/disposiciones/decreto-legislativo-n-1278/# (accessed on 10 January 2026).
- Ministerio del Ambiente del Perú. Reglamento de la Ley General de Residuos Sólidos, Decreto Supremo N° 014-2017-MINAM. 2017. Available online: https://www.minam.gob.pe/disposiciones/decreto-supremo-n-014-2017-minam/ (accessed on 10 January 2026).
- Ministerio del Ambiente del Perú. Plan Nacional de Gestión Integral de Residuos Sólidos (PLANRES). 2016. Available online: https://www.gob.pe/institucion/minam/informes-publicaciones/2634-plan-nacional-de-gestion-integral-de-residuos-solidos-2016-2024 (accessed on 10 January 2026).
- Torgal, F.P.; Labrincha, J.A. The future of construction materials research and the seventh UN Millennium development goal: A few insights. Constr. Build. Mater. 2013, 40, 729–737. [Google Scholar] [CrossRef] [Scilit]
- Saghafi, M.; Teshnizi, Z. Recycling value of building materials in building assessment systems. Energy Build. 2011, 43, 3181–3188. [Google Scholar] [CrossRef] [Scilit]
- INEI. Características de las Viviendas Particulares y los Hogares, Acceso a Servicios Básicos; INEI: Lima, Peru, 2018.
- He, Z.; Shen, A.; Wu, H.; Wang, W.; Wang, L.; Yao, C.; Wu, J. Research progress on recycled clay brick waste as an alternative to cement for sustainable construction materials. Constr. Build. Mater. 2021, 274, 122113. [Google Scholar] [CrossRef] [Scilit]
- Khan, M.N.A.; Liaqat, N.; Ahmed, I.; Basit, A.; Umar, M.; Khan, M.A. Effect of brick dust on strength and workability of concrete. IOP Conf. Ser. Mater. Sci. Eng. 2018, 414, 012005. [Google Scholar] [CrossRef] [Scilit]
- Letelier, V.; Ortega, J.M.; Muñoz, P.; Tarela, E.; Moriconi, G. Influence of waste brick powder in the mechanical properties of recycled aggregate concrete. Sustainability 2018, 10, 1037. [Google Scholar] [CrossRef] [Scilit]
- Fanijo, E.O.; Kolawole, J.T.; Babafemi, A.J.; Liu, J. A comprehensive review on the use of recycled concrete aggregate for pavement construction: Properties, performance, and sustainability. Clean. Mater. 2023, 9, 100199. [Google Scholar] [CrossRef] [Scilit]
- Ren, X.; Zhang, L. Experimental study of geopolymer concrete produced from waste concrete. J. Mater. Civ. Eng. 2019, 31, 1–14. [Google Scholar] [CrossRef] [Scilit]
- Cong, P.; Cheng, Y. Advances in geopolymer materials: A comprehensive review. J. Traffic Transp. Eng. (Engl. Ed.) 2021, 8, 283–314. [Google Scholar] [CrossRef] [Scilit]
- Madirisha, M.M.; Dada, O.R.; Ikotun, B.D. Chemical fundamentals of geopolymers in sustainable construction. Mater. Today Sustain. 2024, 27, 100842. [Google Scholar] [CrossRef] [Scilit]
- Allahverdi, A.; Kani, E.N. Construction wastes as raw materials for geopolymer binders. Int. J. Civ. Eng. 2009, 7, 154–160. [Google Scholar]
- Gálvez-Martos, J.L.; Styles, D.; Schoenberger, H.; Zeschmar-Lahl, B. Construction and demolition waste best management practice in Europe. Resour. Conserv. Recycl. 2018, 136, 166–178. [Google Scholar] [CrossRef] [Scilit]
- Komnitsas, K.; Zaharaki, D.; Vlachou, A.; Bartzas, G.; Galetakis, M. Effect of synthesis parameters on the quality of construction and demolition wastes (CDW) geopolymers. Adv. Powder Technol. 2015, 26, 368–376. [Google Scholar] [CrossRef] [Scilit]
- Hwang, C.-L.; Yehualaw, M.D.; Vo, D.H.; Huynh, T.P. Development of high strength alkali-activated pastes containing high volumes of waste brick and ceramic powders. Constr. Build. Mater. 2019, 218, 519–529. [Google Scholar] [CrossRef] [Scilit]
- Mohammed, B.S.; Haruna, S.; Wahab, M.M.A.; Liew, M.S.; Haruna, A. Mechanical and microstructural properties of high calcium fly ash one-part geopolymer cement made with granular activator. Heliyon 2019, 5, e02255. [Google Scholar] [CrossRef] [Scilit]
- Panizza, M.; Natali, M.; Garbin, E.; Tamburini, S.; Secco, M. Assessment of geopolymers with Construction and Demolition Waste (CDW) aggregates as a building material. Constr. Build. Mater. 2018, 181, 119–133. [Google Scholar] [CrossRef] [Scilit]
- Tchakouté, H.K.; Rüscher, C.H.; Kong, S.; Kamseu, E.; Leonelli, C. Thermal behavior of metakaolin-based geopolymer cements using sodium waterglass from rice husk ash and waste glass as alternative activators. Waste Biomass Valoriz. 2017, 8, 573–584. [Google Scholar] [CrossRef] [Scilit]
- Dong, M.; Elchalakani, M.; Karrech, A. Development of high strength one-part geopolymer mortar using sodium metasilicate. Constr. Build. Mater. 2020, 236, 117611. [Google Scholar] [CrossRef] [Scilit]
- Hadi, M.N.S.; Zhang, H.; Parkinson, S. Optimum mix design of geopolymer pastes and concretes cured in ambient condition based on compressive strength, setting time and workability. J. Build. Eng. 2019, 23, 301–313. [Google Scholar] [CrossRef] [Scilit]
- Ma, C.; Zhao, B.; Guo, S.; Long, G.; Xie, Y. Properties and characterization of green one-part geopolymer activated by composite activators. J. Clean. Prod. 2019, 220, 188–199. [Google Scholar] [CrossRef] [Scilit]
- Singh, B.; Ishwarya, G.; Gupta, M.; Bhattacharyya, S.K. Geopolymer concrete: A review of some recent developments. Constr. Build. Mater. 2015, 85, 78–90. [Google Scholar] [CrossRef] [Scilit]
- Askarian, M.; Tao, Z.; Adam, G.; Samali, B. Mechanical properties of ambient cured one-part hybrid OPC-geopolymer concrete. Constr. Build. Mater. 2018, 186, 330–337. [Google Scholar] [CrossRef] [Scilit]
- Umniati, B.S.; Risdanareni, P.; Zulfikar, F.T.; Zein, Z. Workability enhancement of geopolymer concrete through the use of retarder. AIP Conf. Proc. 2017, 1887, 020033. [Google Scholar]
- Liang, G.; Zhu, H.; Zhang, Z.; Wu, Q.; Du, J. Investigation of the waterproof property of alkali-activated metakaolin geopolymer added with rice husk ash. J. Clean. Prod. 2019, 230, 603–612. [Google Scholar] [CrossRef] [Scilit]
- Saha, S.; Rajasekaran, C. Enhancement of the properties of fly ash based geopolymer paste by incorporating ground granulated blast furnace slag. Constr. Build. Mater. 2017, 146, 615–620. [Google Scholar] [CrossRef] [Scilit]
- Zaharaki, D.; Galetakis, M.; Komnitsas, K. Valorization of construction and demolition (C&D) and industrial wastes through alkali activation. Constr. Build. Mater. 2016, 121, 686–693. [Google Scholar] [CrossRef] [Scilit]
- Robayo-Salazar, R.A.; Rivera, J.F.; de Gutiérrez, R.M. Alkali-activated building materials made with recycled construction and demolition wastes. Constr. Build. Mater. 2017, 149, 130–138. [Google Scholar] [CrossRef] [Scilit]
- Allahverdi, A.; Kani, E.N. Use of construction and demolition waste (CDW) for alkali-activated or geopolymer cements. In Handbook of Recycled Concrete and Demolition Waste; Woodhead Publishing: Cambridge, UK, 2013. [Google Scholar]
- Ouda, S.; Gharieb, M. Development of the properties of brick geopolymer pastes using concrete waste incorporating dolomite aggregate. J. Build. Eng. 2020, 27, 100919. [Google Scholar] [CrossRef] [Scilit]
- Ouda, S.; Abdel-Aal, K.L. Effect of concrete waste on compressive strength and microstructure development of ceramic geopolymer pastes. Trans. Indian Ceram. Soc. 2019, 78, 146–154. [Google Scholar] [CrossRef] [Scilit]
- Zwaida, J.; Dulaimi, A.; Mashaan, N.; Mydin, M.A.O. Geopolymers: The green alternative to traditional materials for engineering applications. Infrastructures 2023, 8, 98. [Google Scholar] [CrossRef] [Scilit]
- Qian, J.; Song, M. Study on influence of limestone powder on the fresh and hardened properties of early age metakaolin based geopolymer. In Calcined Clays for Sustainable Concrete; Scrivener, K., Favier, A., Eds.; RILEM Bookseries; Springer: Dordrecht, The Netherlands, 2015; Volume 10, pp. 415–422. [Google Scholar]
- Yang, J.; Li, D.; Fang, Y. Effect of synthetic CaO-Al2O3-SiO2-H2O on the early-stage performance of alkali-activated slag. Constr. Build. Mater. 2018, 167, 65–72. [Google Scholar] [CrossRef] [Scilit]
- Yip, K.; Provis, J.L.; Lukey, G.C.; van Deventer, J.S.J. Carbonate mineral addition to metakaolin-based geopolymers. Cem. Concr. Compos. 2008, 30, 979–985. [Google Scholar] [CrossRef] [Scilit]
- Ahmari, S.; Ren, X.; Toufigh, V.; Zhang, L. Production of geopolymeric binder from blended waste concrete powder and fly ash. Constr. Build. Mater. 2012, 35, 718–729. [Google Scholar] [CrossRef] [Scilit]
- Vafaei, M.; Allahverdi, A. Influence of calcium aluminate cement on geopolymerization of natural pozzolan. Constr. Build. Mater. 2016, 114, 290–296. [Google Scholar] [CrossRef] [Scilit]
- Kar, A. Characterizations of Concretes with Alkali-Activated Binder and Correlating Their Properties from Micro- to Specimen Level. Ph.D. Dissertation, West Virginia University, Morgantown, WV, USA, 2013. [Google Scholar]
- Xue, C.; Shen, A.; Guo, Y.; He, T. Utilization of construction waste composite powder materials as cementitious materials in small-scale prefabricated concrete. Adv. Mater. Sci. Eng. 2016, 2016, 8947935. [Google Scholar] [CrossRef] [Scilit]
- Oh, J.E.; Jun, Y.; Jeong, Y. Characterization of geopolymers from compositionally and physically different Class F fly ashes. Cem. Concr. Compos. 2014, 50, 16–26. [Google Scholar] [CrossRef] [Scilit]
- Castillo, H.; Collado, H.; Droguett, T.; Sánchez, S.; Vesely, M.; Garrido, P.; Palma, S. Factors affecting the compressive strength of geopolymers: A review. Minerals 2021, 11, 1317. [Google Scholar] [CrossRef] [Scilit]
- Sonnier, R.; El Hage, R.; Hage, P.; Beaino, S.; Seif, S. Novel foaming-agent free insulating geopolymer based on industrial fly ash and rice husk. Molecules 2022, 27, 531. [Google Scholar] [CrossRef] [Scilit]
- Zhang, Y.; Sun, W.; Chen, Q.; Chen, L. Synthesis and heavy metal immobilization behaviors of slag based geopolymer. J. Hazard. Mater. 2007, 143, 206–213. [Google Scholar] [CrossRef] [Scilit]
- Mahmoodi, O.; Siad, H.; Lachemi, M.; Dadsetan, S.; Sahmaran, M. Development of normal and very high strength geopolymer binders based on concrete waste at ambient environment. J. Clean. Prod. 2021, 279, 123436. [Google Scholar] [CrossRef] [Scilit]
- van Deventer, J.S.J.; Provis, J.L.; Duxson, P.; Lukey, G.C. Reaction mechanisms in the geopolymeric conversion of inorganic waste to useful products. J. Hazard. Mater. 2007, 139, 506–513. [Google Scholar] [CrossRef] [Scilit]
- Mejía, J.M.; de Gutiérrez, R.M.; Montes, C. Rice husk ash and spent diatomaceous earth as a source of silica to fabricate a geopolymeric binary binder. J. Clean. Prod. 2016, 118, 133–139. [Google Scholar] [CrossRef] [Scilit]
- Chindaprasirt, P.; Jaturapitakkul, C.; Chalee, W.; Rattanasak, U. Comparative study on the characteristics of fly ash and bottom ash geopolymers. Waste Manag. 2009, 29, 539–543. [Google Scholar] [CrossRef] [Scilit]
- Duxson, P.; Fernández-Jiménez, A.; Provis, J.L.; Lukey, G.C.; Palomo, A.; van Deventer, J.S.J. Geopolymer technology: The current state of the art. J. Mater. Sci. 2007, 42, 2917–2933. [Google Scholar] [CrossRef] [Scilit]
- Iftikhar, S.; Rashid, K.; Haq, E.U.; Zafar, I.; Alqahtani, F.K.; Khan, M.I. Synthesis and characterization of sustainable geopolymer green clay bricks: An alternative to burnt clay brick. Constr. Build. Mater. 2020, 259, 119659. [Google Scholar] [CrossRef] [Scilit]
- Bih, N.; Mahamat, A.; Chinweze, C.; Ayeni, O.; Hounkpe, J.B.; Onwualu, P.; Boakye, E. The Effect of Bone Ash on the Physio-Chemical and Mechanical Properties of Clay Ceramic Bricks. Buildings 2022, 12, 336. [Google Scholar] [CrossRef] [Scilit]
- Li, X.; Wanner, A.; Hesse, C.; Friesen, S.; Dengler, J. Clinker-free cement based on calcined clay, slag, portlandite, anhydrite, and C-S-H seeding: An SCM-based low-carbon cementitious binder approach. Constr. Build. Mater. 2024, 442, 137546. [Google Scholar] [CrossRef] [Scilit]
- Heller-Kallai, L.; Lapides, I. Reactions of kaolinites and metakaolinites with NaOH—Comparison of different samples (Part 1). Appl. Clay Sci. 2007, 35, 99–107. [Google Scholar] [CrossRef] [Scilit]
- Tuyan, M.; Andiç-Çakir, Ö.; Ramyar, K. Effect of alkali activator concentration and curing condition on strength and microstructure of waste clay brick powder-based geopolymer. Compos. Part B Eng. 2018, 135, 242–252. [Google Scholar] [CrossRef] [Scilit]
- Khater, H. Effect of Calcium on Geopolymerization of Aluminosilicate Wastes. J. Mater. Civ. Eng. 2012, 24, 92–101. [Google Scholar] [CrossRef] [Scilit]
- Santos, V.H.J.M.D.; Pontin, D.; Ponzi, G.G.D.; de Guimarães e Stepanha, A.S.; Martel, R.B.; Schütz, M.K.; Einloft, S.M.O.; Vecchia, F.D. Application of Fourier Transform Infrared Spectroscopy (FTIR) Coupled with Multivariate Regression for Calcium Carbonate (CaCO3) Quantification in Cement. Constr. Build. Mater. 2021, 313, 125413. [Google Scholar] [CrossRef] [Scilit]
- Hajimohammadi, A.; Provis, J.L.; Deventer, J.V. One-Part Geopolymer Mixes from Geothermal Silica and Sodium Aluminate. Ind. Eng. Chem. Res. 2008, 47, 9396–9405. [Google Scholar] [CrossRef] [Scilit]
- Somna, K.; Jaturapitakkul, C.; Kajitvichyanukul, P.; Chindaprasirt, P. NaOH-activated ground fly ash geopolymer cured at ambient temperature. Fuel 2011, 90, 2118–2124. [Google Scholar] [CrossRef] [Scilit]
- Razeghi, H.R.; Safaee, F.; Geranghadr, A.; Ghadir, P.; Javadi, A.A. Investigating accelerated carbonation for alkali activated slag stabilized sandy soil. Geotech. Geol. Eng. 2024, 42, 575–592. [Google Scholar] [CrossRef] [Scilit]

Disclaimer/Publisher’s Note: The statements, opinions and data contained in all publications are solely those of the individual author(s) and contributor(s) and not of MDPI and/or the editor(s). MDPI and/or the editor(s) disclaim responsibility for any injury to people or property resulting from any ideas, methods, instructions or products referred to in the content. |
© 2026 by the authors. Licensee MDPI, Basel, Switzerland. This article is an open access article distributed under the terms and conditions of the Creative Commons Attribution (CC BY) license.