


Abstract
This work elucidates the growth of lithium nickel cobalt manganese oxide (NCM)/lithium lanthanum zirconate (LLZO)/zinc ferrite (ZFO) films using X-ray diffraction (XRD), Rutherford backscattering (RBS), electron probe microanalysis (EPMA) and X-ray absorption spectroscopy (XAS). Prior to deposition of LLZO and NCM/LLZO, ZFO films (deposition times: 25 (NLZ25) and 100 min (NLZ100)) were deposited on silicon (100) substrates using radio frequency (RF) sputtering at a base pressure of 5.0 × 10⁻⁶ Torr. LLZO was deposited for 90 min at RF power of 40 W. Thereafter, an NCM layer was deposited on these bilayer structures for 100 min (RF power—35 W). Obtained trilayer structures were annealed at 900 °C for 1 h. XRD shows ZFO is able to attain crystalline phase of spinel structure for both NLZ25 and NLZ100. In the trilayer structures onsets of some impurity phases are observed. RBS analysis reveals that for NLZ25, NCM, LLZO, and ZFO layers have thicknesses of approximately 30, 60, and 70 nm. For NLZ100, the corresponding layer thicknesses are 40, 90, and 200 nm, respectively. The significant change in ZFO thickness is attributed to the longer deposition duration for later cases. The O K-edge near-edge X-ray absorption fine structure (NEXAFS) spectra of grown trilayer structures exhibit spectral features associated with ZFO, LLZO and NCM. The pre-edge region in the O K-edge NEXAFS spectra is strongly influenced by the interaction of ions from various layers in these structures. La M-edge NEXAFS spectra exhibit characteristic spectral features of La ions in LLZO and show the presence of La3+ in respective layers.
1. Introduction
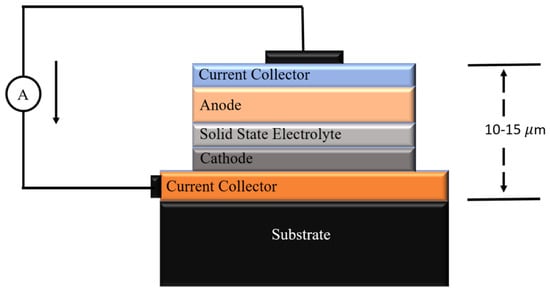
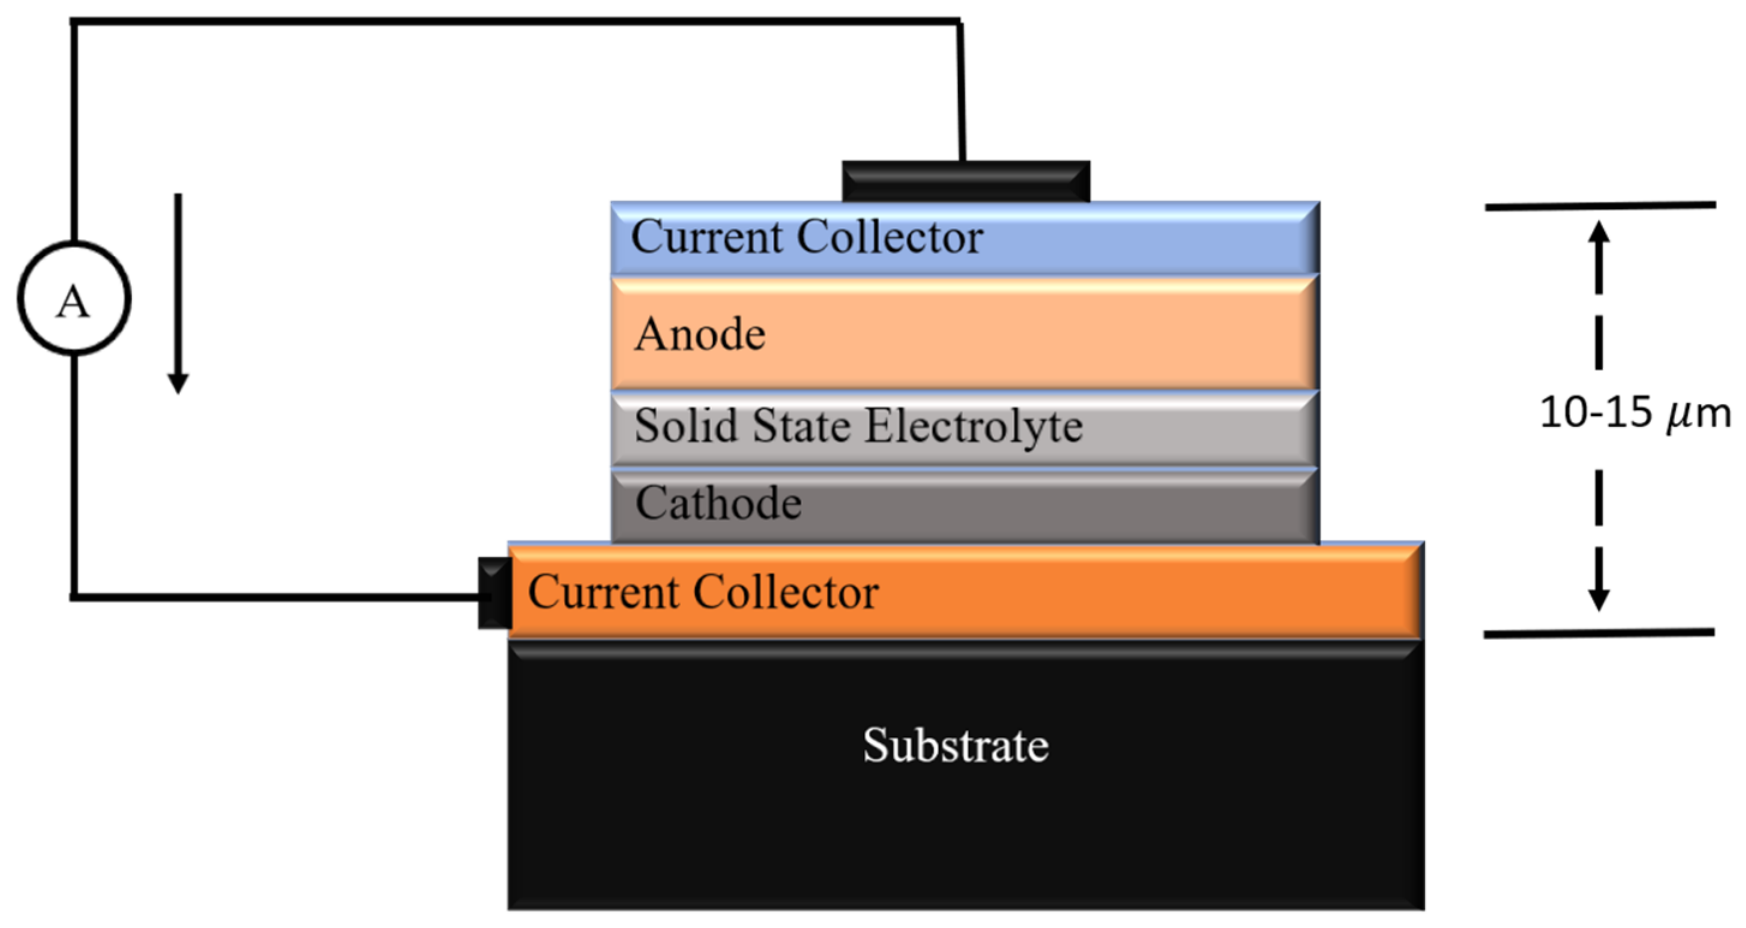
With increasing energy demand and the need to ensure safety alongside the miniaturization of energy storage devices, a significant shift in research activities has been seen towards the growth of multilayer structures for developing rechargeable thin-film batteries [1,2]. As can be seen from Figure 1, the growth of a layered structure of anode, electrolyte and cathode is extremely important [3].
Figure 1.
Schematic of a thin-film battery showing various components and its approximate thickness.
The growth of these multilayer structures involves the appropriate selection of the anode layer, stabilization of the electrolyte layer on the anode, and stoichiometric deposition of the cathode layer onto the electrolyte. Therefore, studies on growth behavior of such structures based on lithium lanthanum zirconate (LLZO) as an electrolyte are underway. The earliest reported porous/dense/porous LLZO structure utilized calcium- and niobium-doped LLZO as an electrolyte. This structure was fabricated using a scalable tape casting and roll-to-roll technique [4]. Using the radio frequency (RF) sputtering technique, a trilayer structure of LiMn1.5Ni0.5O4/Li0.33La0.552TiO3/Li4Ti5O12 was deposited (RF power 80W at base pressure 1 × 10⁻⁶ Torr) on a silicon (Si 111) substrate [5].
Another approach involves developing a Li-rich nickel cobalt manganese (LiNi0.8Co0.1Mn0.1O2, NCM811) thin-film cathode by RF sputtering on an ITO-coated stainless-steel substrate, followed by annealing at 600 °C. RF-sputtered Li-rich NCM811 cathodes were fabricated with lithium-phosphorus-oxynitride as a solid-state electrolyte for thin-film architecture [6]. Another example of a multilayer thin-film battery structure is one using tiny ceramic fibers from aluminum-containing material Al-doped LLZO (Li6.28La3Zr2Al0.24O12), fabricated using the electrospinning technique and then sintered at 800 °C for 3 h to harden them into a ceramic filler that provides Li-ion transport pathways. This membrane was deposited using a solution casting (doctor blade) method; in this method, three layers were cast onto a polyethylene plastic film substrate, with a bottom layer of pure poly(vinylidene fluoride)/poly(ethylene carbonate)/lithium bis(trifluoromethanesulfonyl)imide/succinonitrile (PVDF/PEC/LiTFSI/SN), a middle layer of Al-LLZO filler at 20 wt.% in the same polymer matrix and a top layer with 10 wt.% Al-LLZO yield, with a cold-pressed thickness of 184 µm. This cell was then assembled with NCM811 as a cathode material [7]. Therefore, these studies reflect significant progress in the multilayer structures for fabrication of thin-film batteries by taking suitable materials as anodes, electrolytes and cathodes. In recent years, several studies have reported the use of ferrite-based materials as anode electrodes for rechargeable Li-ion batteries [8,9,10], with zinc ferrite (ZFO) emerging as a promising material [11,12,13]. For the development of thin-film batteries, ZFO may offer an additional advantage as it can be deposited as a thin film with controlled stoichiometry using various physical vapor deposition techniques. Apart from this, there are reports which show the emergence of LLZO as one of the most promising solid-state electrolytes for solid-state lithium-ion batteries (LIBs) [14]. The cubic garnet phase of LLZO supports the Li-ion conduction, which makes it applicable for advanced energy storage applications. Also, the growth of garnet-structured films on spinel substrates is well reported [15,16,17]. These reports may help to stabilize garnet structure LLZO on spinel ZFO. As a cathode material, layered lithium nickel cobalt manganese oxide (NCM) is studied because of its high specific capacity, excellent energy density and good electrochemical stability [18]. Integration of NCM with LLZO to form a multilayer thin-film battery can emerge as an effective strategy to improve electrochemical performance in solid-state energy storage systems. RF sputtering is considered suitable for growing oxide thin films [2,19,20]. Glancing angle X-ray diffraction (GI-XRD) is considered suitable for getting information on the structural quality of different layers of multilayer structures [21]. Rutherford backscattering spectroscopy (RBS) is suitable for determining the thickness and composition of different layers [22,23]. X-ray absorption spectroscopy (XAS) probes the local electronic/atomic structure of these structures [24,25]. Hence, this work investigates the growth of NCM811/LLZO/ZFO multilayer structures on silicon substrates using RF sputtering by characterizing them with XRD, Raman, RBS and XAS studies.
2. Materials and Methods
2.1. Deposition of Trilayer Structure
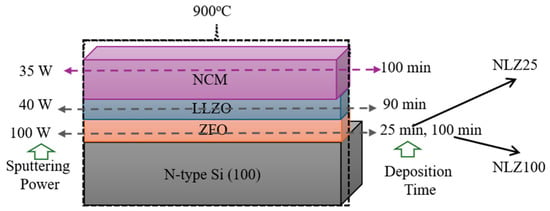
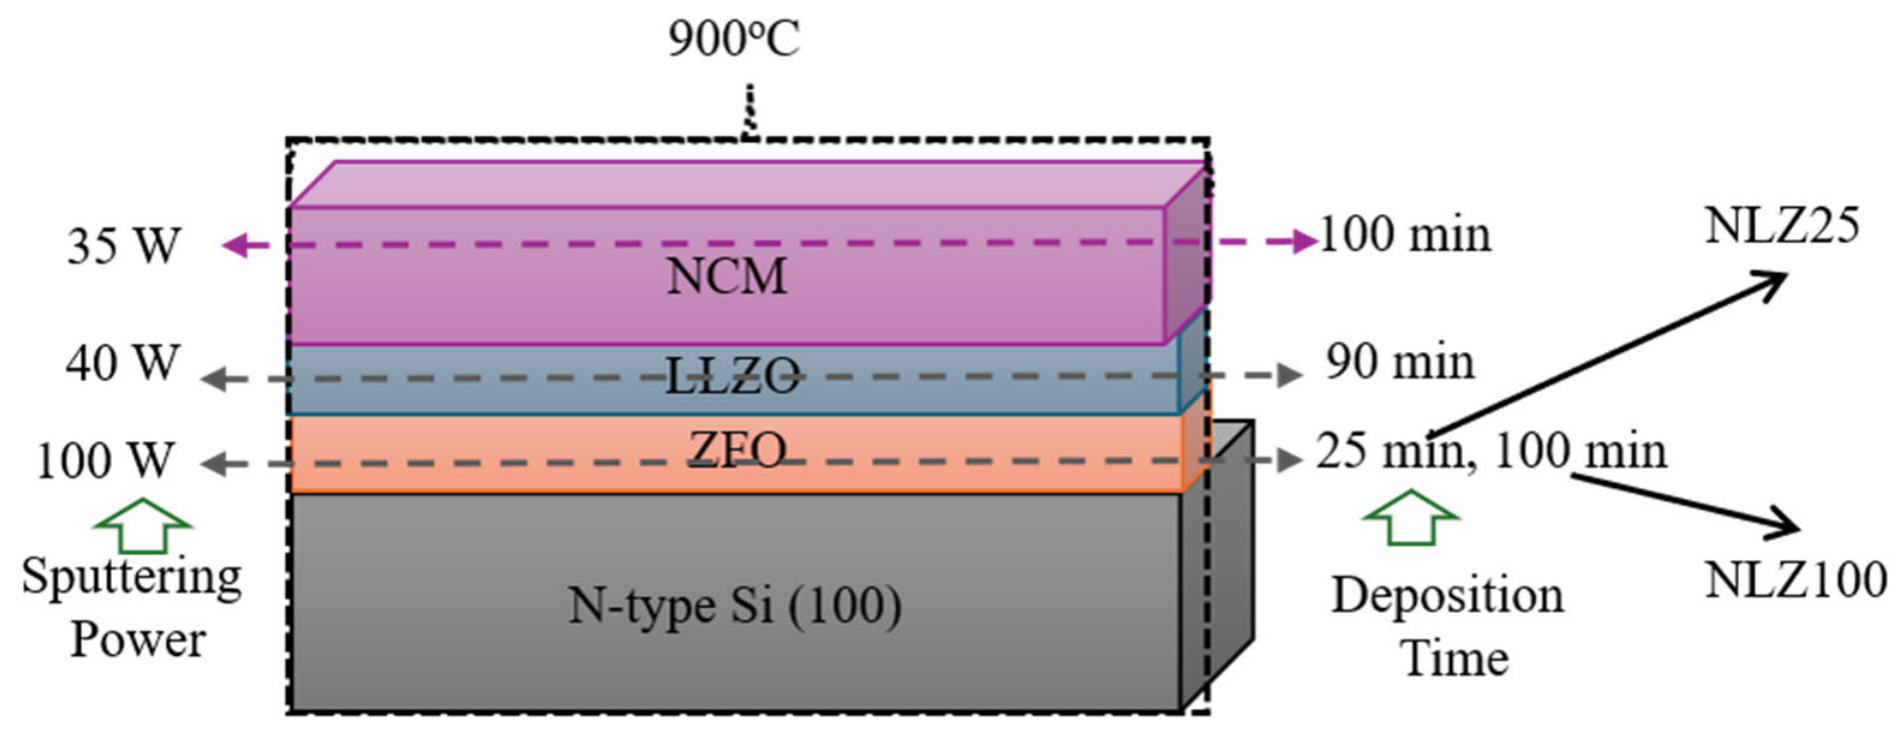
Firstly, ZFO thin films were grown on Si (100) substrates. Base pressure and target-to-substrate distance for deposition were 5 × 10⁻⁶ Torr and 5 cm, respectively, at room temperature. During deposition, O2 pressure was maintained at 40 mTorr [26]. Deposition power was 100 W, and deposition durations were 25 min and 100 min. ZFO/Si was considered as a substrate for further deposition. LLZO was deposited onto the ZFO/Si for 90 min at RF power of 40 W. The base pressure was maintained at 3.0 × 10⁻⁵ Torr for deposition along with the argon (Ar) flow by maintaining chamber pressure of ~8 mTorr.
For the fabrication of the multilayer structure, LLZO/ZFO/Si structures were taken as substrates for further deposition. A procured target of NCM was used for deposition. The NCM layer was deposited on these bilayer structures for 100 min at RF power of 35 W. The base pressure was 3.0 × 10⁻⁵ Torr. Deposition was carried out in presence of Ar gas by maintaining a pressure of 10 mTorr. The obtained trilayer structures were annealed at 900 °C for 1 h. These structures are termed as NLZ25 and NLZ100 based on the deposition time of ZFO layers (Figure 2).
Figure 2.
Deposition sequence and deposition conditions for growth of NLZ25 and NLZ100 structures.
2.2. Characterization Details
XRD measurements were performed using D/MAX (Rigaku, Tokyo, Japan, X-ray diffractometer) having wavelength Cu Kα, λ = 1.54148 Å. These measurements were carried out in grazing incidence mode, which enables minimization of the substrate contribution. The glancing angle was kept at 0.4° during the measurement [27].
X-ray absorption spectroscopic measurements were performed at KIST (Korea Institute of Science and Technology) beamlines of Pohang Accelerator Laboratory (PAL), Pohang, Republic of Korea. Near-edge X-ray absorption fine structure (NEXAFS) measurements for the deposited trilayer structure were carried out at 10D XAS KIST beamline. All spectra were collected at room temperature in vacuum around 1.5 × 10⁻⁸ Torr in total electron yield (TEY) mode [28]. The collected spectra were normalized with respect to the incident photon flux. X-ray absorption near edge structure (XANES) measurements were performed at 1D KIST-PAL beamline in fluorescence mode.
RBS measurements were carried out using an α-particle beam from the 1.7 MV pelletron accelerator using an NEC pelletron 6SDH-2 accelerator (depth resolution ~ 10 nm) at KIST, Republic of Korea. RBS simulation was done using the Rutherford Universal Manipulation Program (RUMP) software (version 0.950) [29,30].
The Raman spectra were measured using a Micro Raman Spectrometer (Renishaw plc, Old Town, Wotton-under-Edge, Gloucestershire, GL 12 7 DW, UK) using a solid-state laser of wavelength 514.5 nm having a resolution of ±1 cm−1. The laser power used for the analysis was 10 mW.
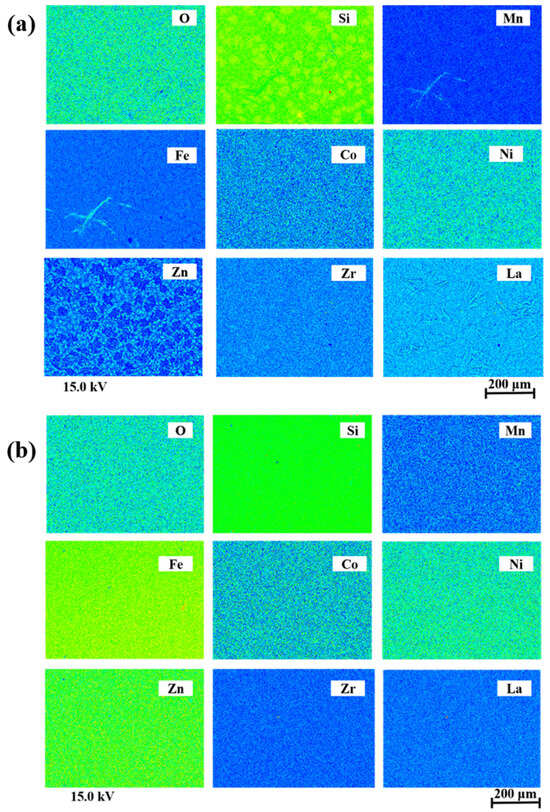
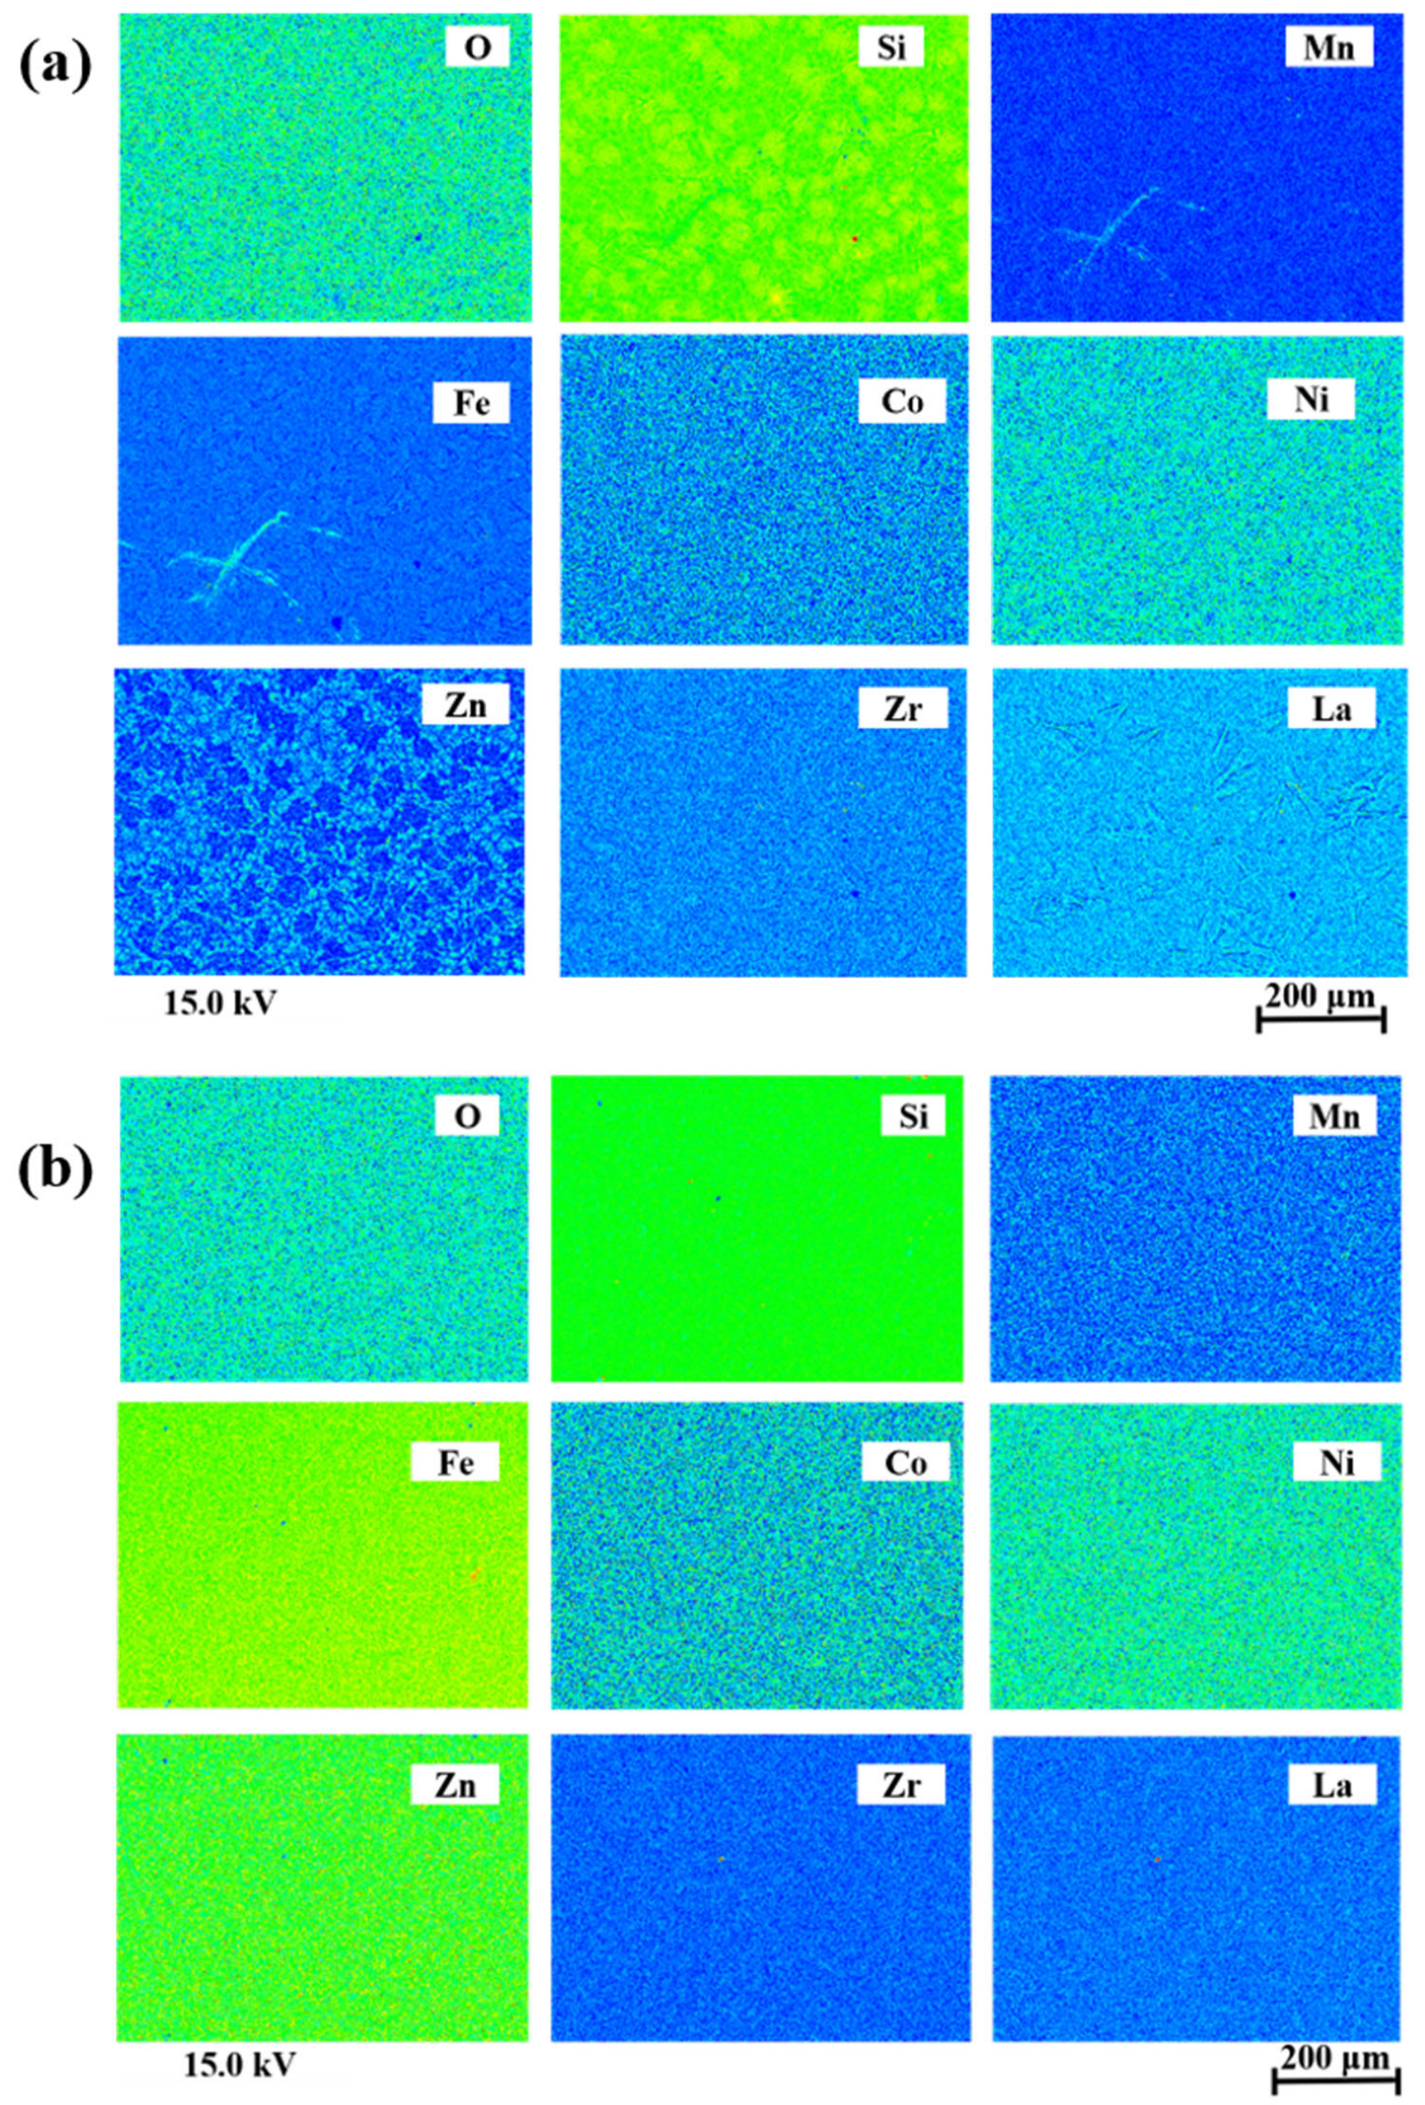
The elemental composition and microstructure of the grown trilayer structure were examined using electron probe microanalysis (EPMA). The analysis was performed using an EPMA-1720 HT system (SHIMADZU, Kyoto, Japan). For the characterization of the deposited films, an accelerating voltage of 15 kV was used to obtain the elemental and microstructural information. Inductively coupled plasma mass spectrometry (ICP-MS) was performed at the Central Research Facility (CRF), Indian Institute of Technology Delhi, using an Agilent 7900 ICP-MS equipped with Ultra High Matrix Introduction (UHMI, Agilent Technologies, Santa Clara, CA, USA). The analysis was performed under both helium collision-cell and no-gas conditions diluted in conc. HCl and HNO3.
3. Results and Discussion
3.1. Structural Study
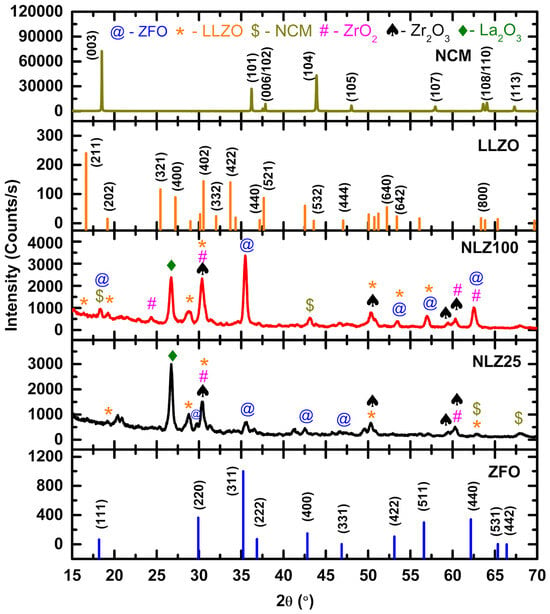
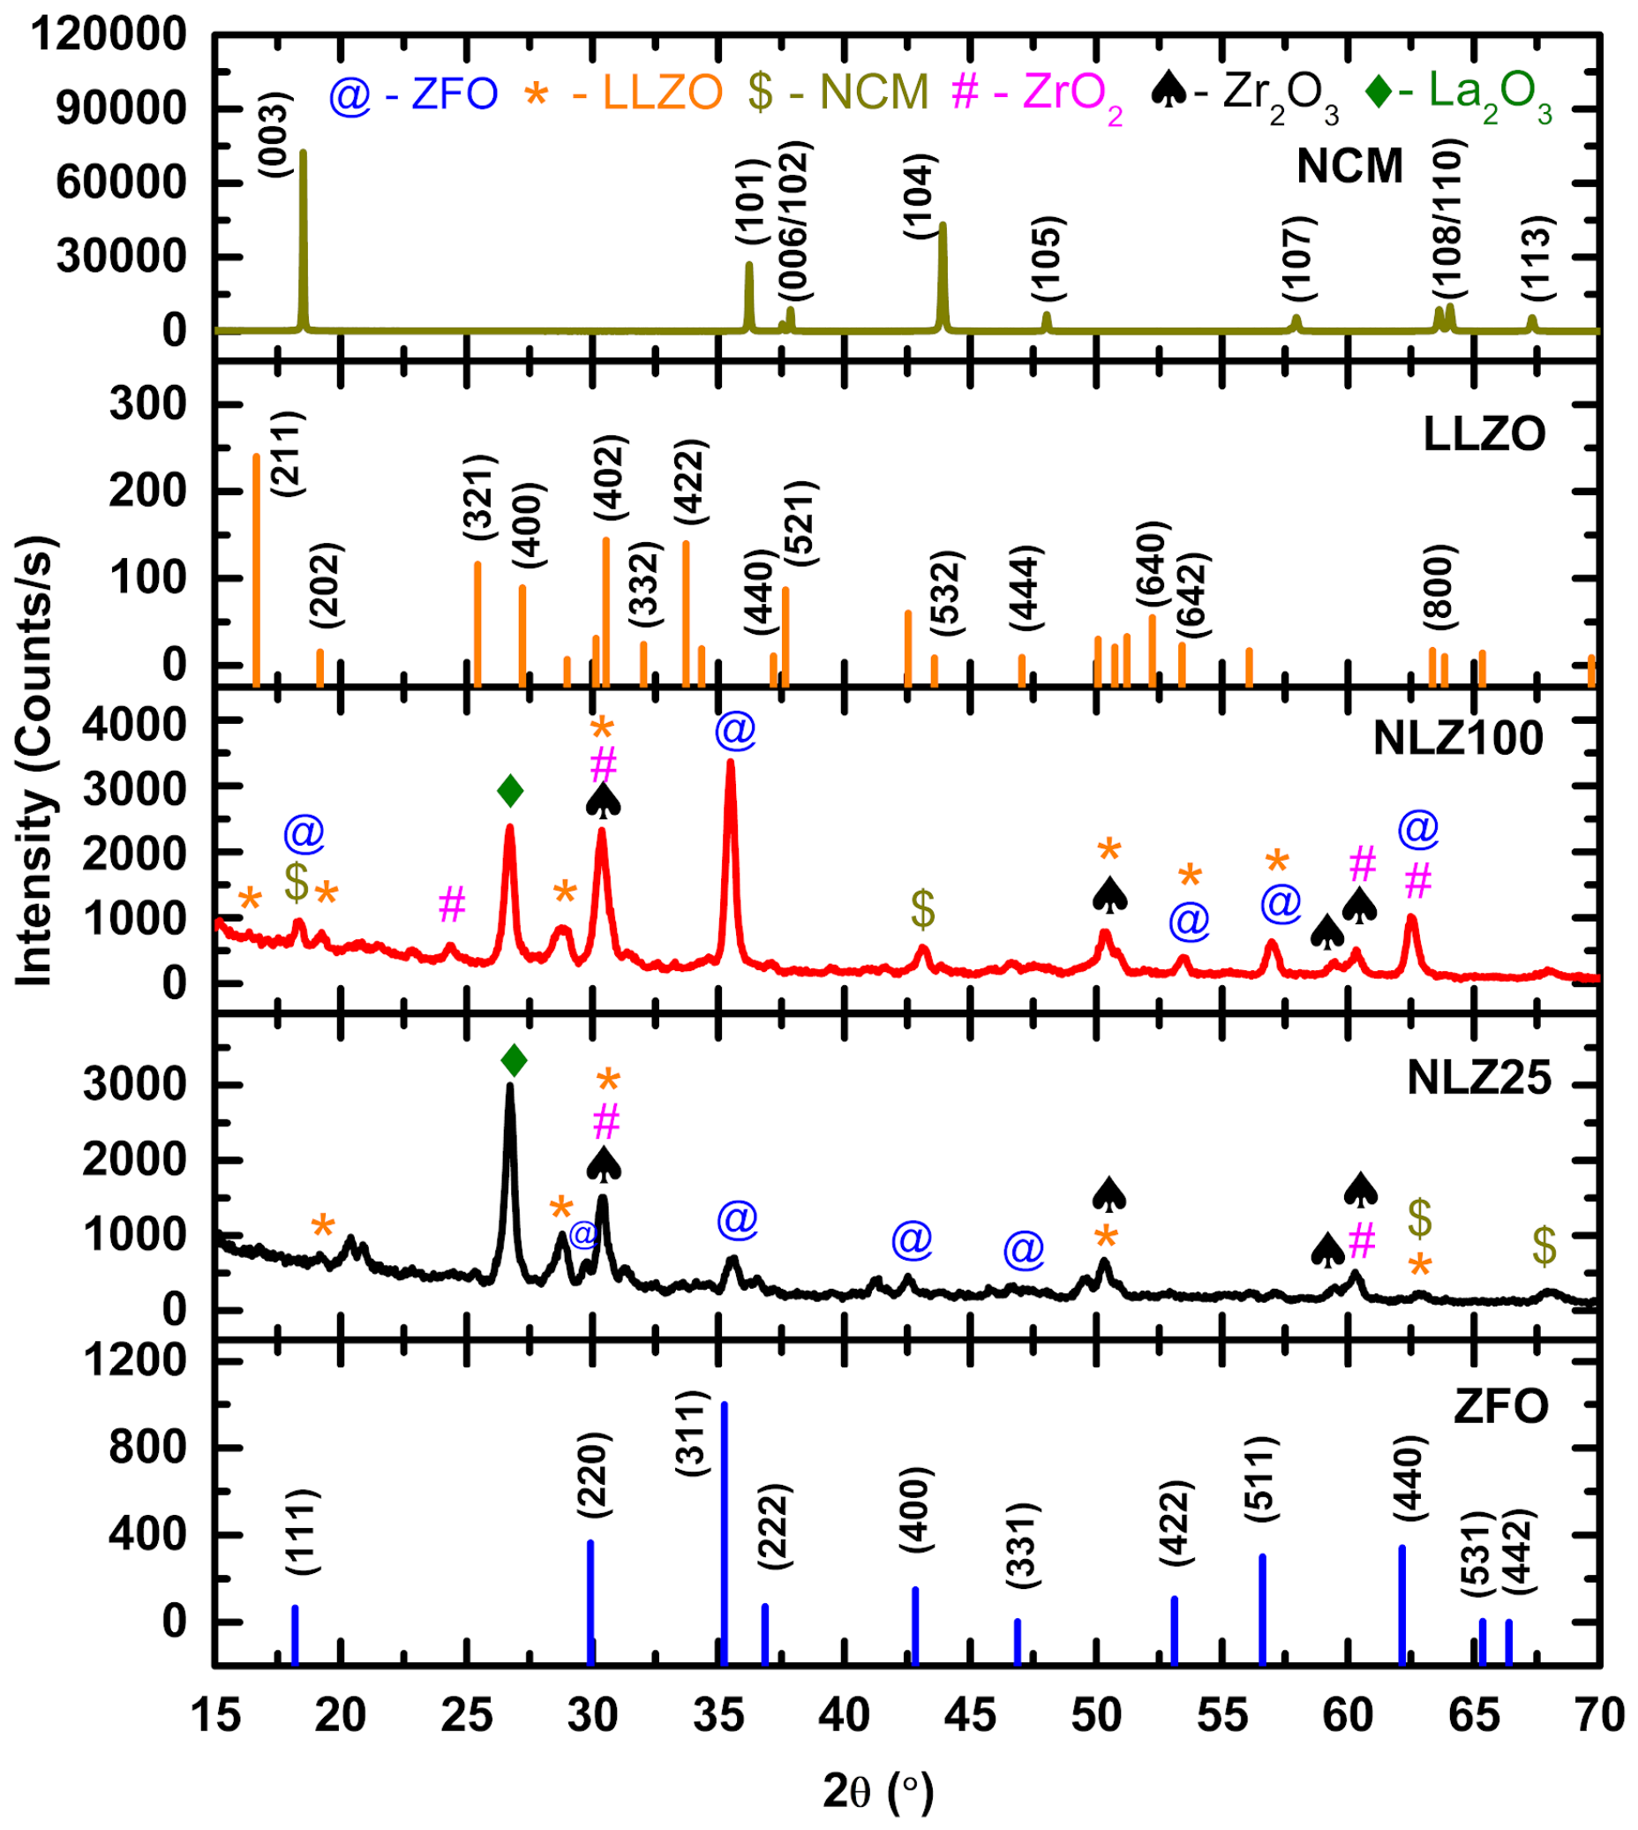
Figure 3 shows the XRD patterns of NLZ25 and NLZ100 structures along with the JCPDS patterns of ZFO (JCPDS # 01-070-6490) [31], LLZO (JCPDS # 97-023-9128) [32] and NCM (JCPDS # 09-0063) [33]. In the pattern, diffraction peaks are observed near 30°, 35°, 43°, 53°, 57° and 63°. These peaks come from the (220), (311), (400), (422), (511) and (440) planes of cubic spinel ZFO. Therefore, this shows that the ZFO layer in both the trilayer structures has attained the pure crystalline phase despite the significant difference in the deposition duration. In the patterns of both the trilayer structures, the XRD peak corresponding to the peak at around 18° in the JCPDS pattern of LLZO is not observed. However, some peaks in the XRD patterns, identified using *, @ and $, match those of the JCPDS patterns of LLZO and ZFO and the XRD pattern of NCM [34]. Apart from this, some other peaks marked with the symbols #, ♠ and ♦ are assigned to impurity phases corresponding to ZrO2 [35], Zr2O3 [36] or La2O3 [37]. The presence of sharp and intense diffraction peaks indicates crystallization of all phases and may be associated with post-deposition high-temperature annealing of the trilayer structure. The coexistence of LLZO diffraction peaks with those of ZrO2, Zr2O3 and La2O3 suggests that the LLZO phase is partially modified during the thermal treatment rather than completely decomposing into its oxides.
Figure 3.
XRD patterns of NLZ25 and NLZ100 trilayer structures grown on a Si substrate along with JCPDS patterns of LLZO and ZFO and XRD pattern of NCM [reprinted with permission from reference no. 18—open access].
Therefore, XRD analysis reveals that LLZO and NCM form in a mixed phase on top of the crystalline phase of ZFO. A comparison between both the trilayer structures shows that ZFO grown for 100 min exhibits higher XRD peak intensity and sharper peaks compared to that grown for 25 min. This indicates improvement in crystallinity with deposition time for the ZFO layer.
3.2. Raman Study
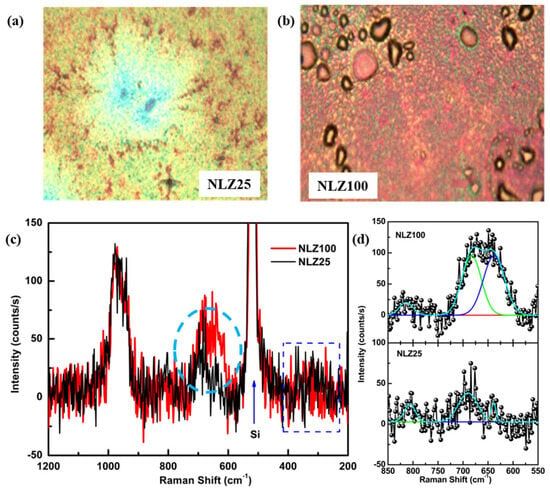
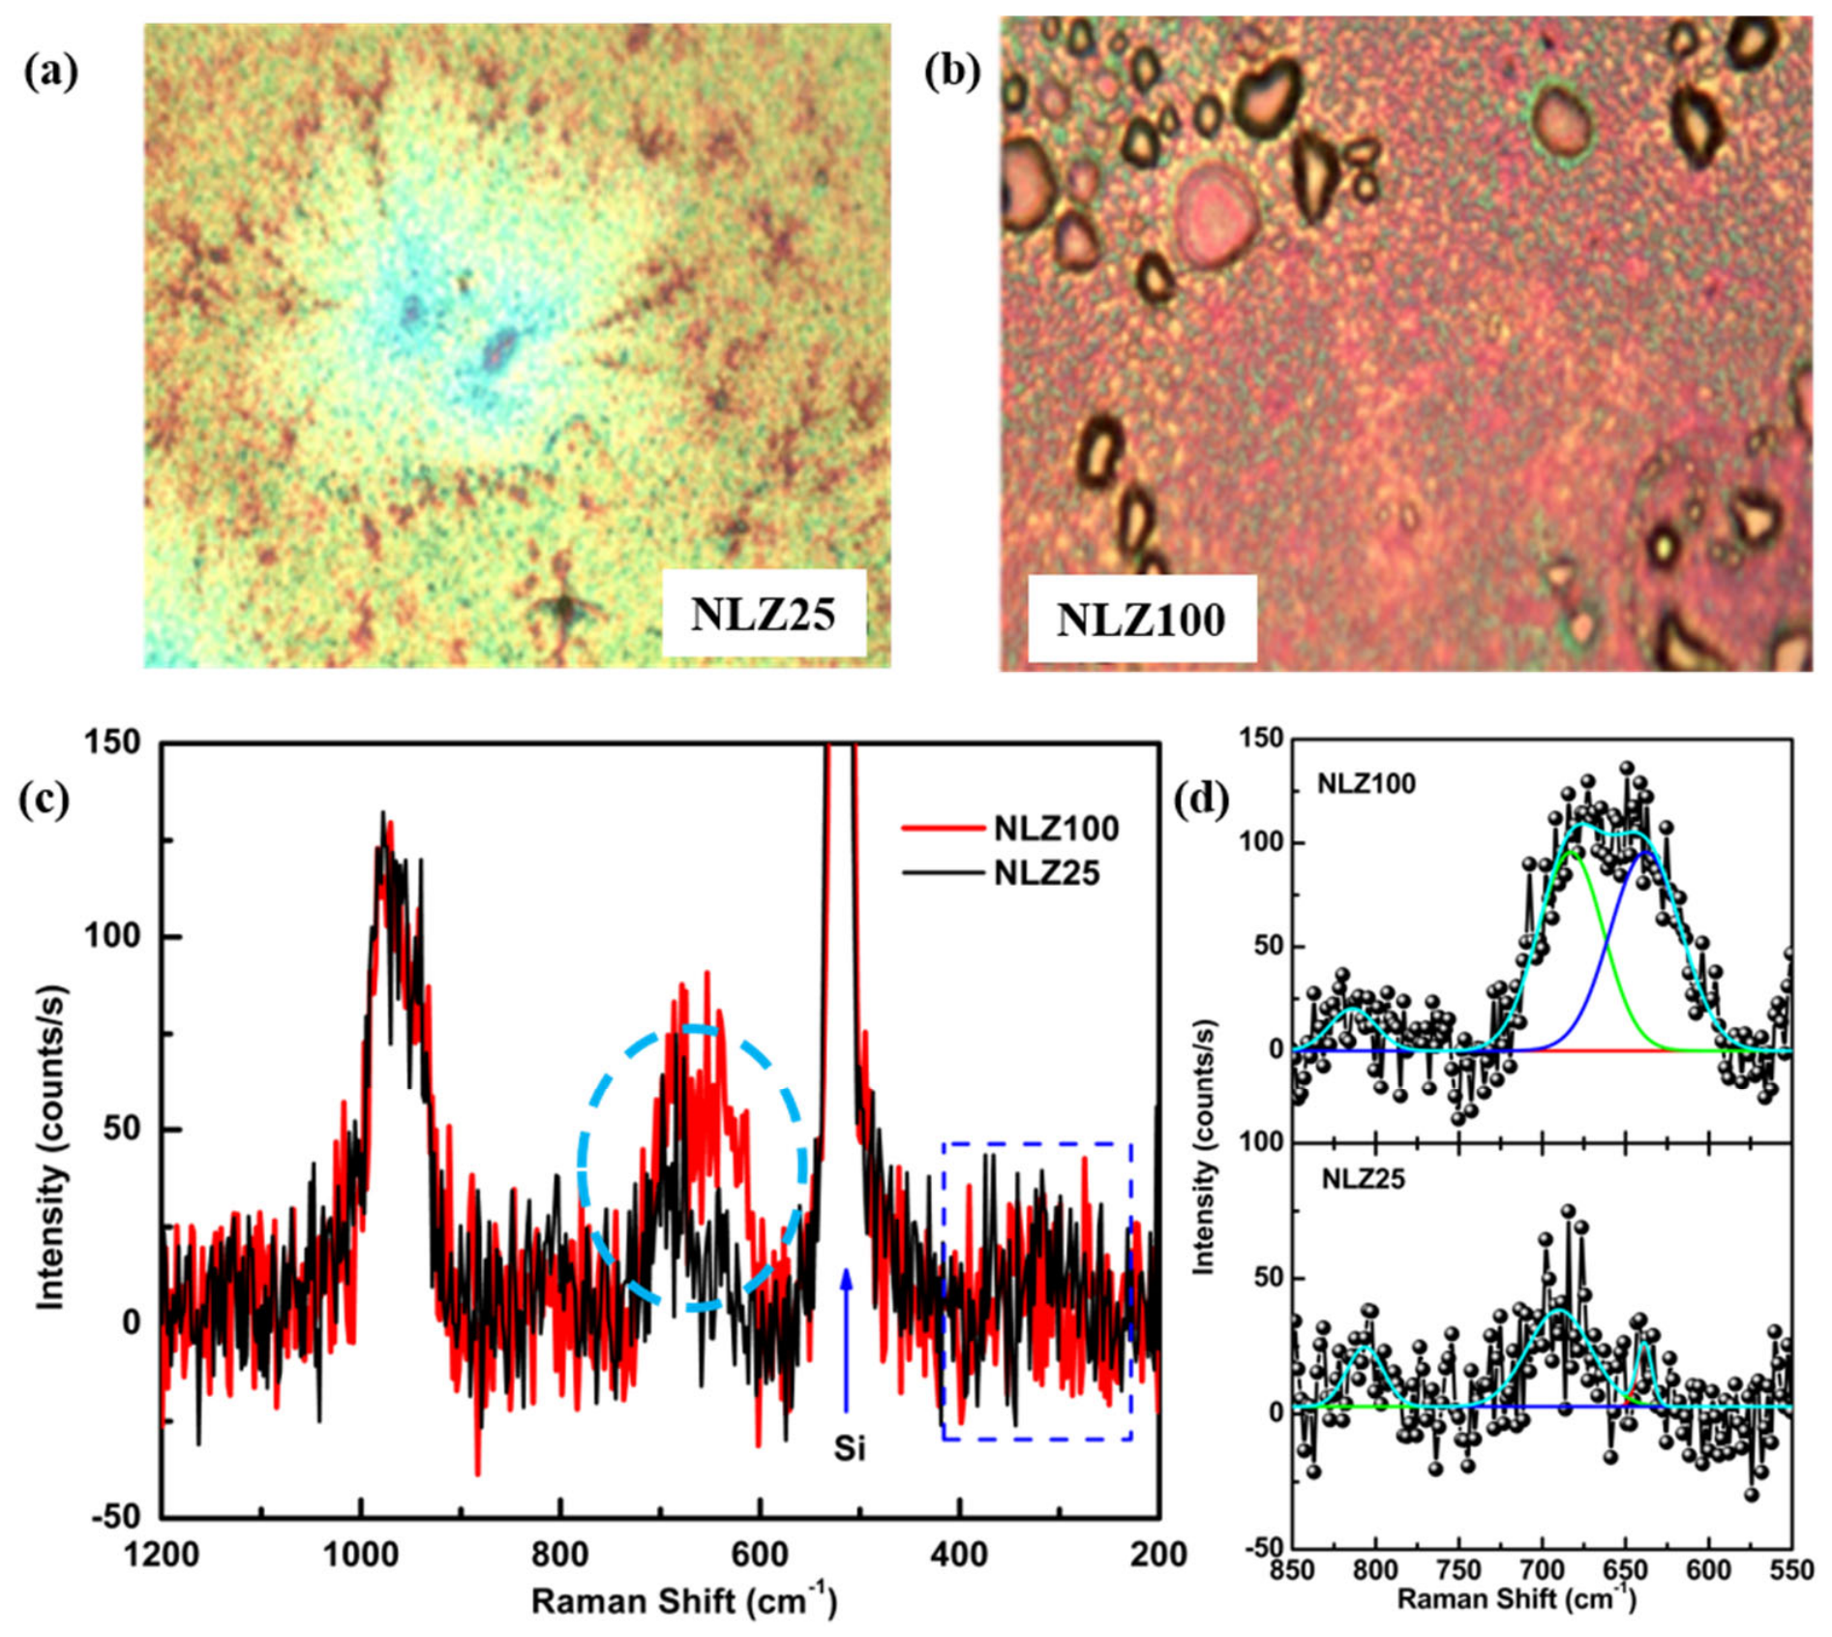
Optical micrographs of the surfaces of NLZ25 and NLZ100 trilayer structures used for recording Raman spectra are shown in Figure 4a,b. Obtained Raman spectra for these structures are shown in Figure 4c. Both trilayer structures exhibit a strong Raman band near 520 cm−1, which is due to the Si substrate [38]. In the spectra of both NLZ25 and NLZ100, weak band-like features (shown by rectangular regions) are observed in the range of 200 to 400 cm−1. Presence of these band-like features may be associated with the several weak Raman bands observed corresponding to ZFO [39,40,41] (Table S1), LLZO [42,43] (Table S2) and NCM [44,45] (Table S3) phases in these trilayer structures. The broad feature (shown by circular region) in the wavenumber range of 600–700 cm−1 can also be seen in the Raman spectra of NLZ25 and NLZ100. Such broad bands are not only the characteristics of spinel ZFO [39] but are also observed in the Raman spectra of LLZO [46]. Additionally, this broad band observed for NLZ25 is significantly different from NLZ100. NLZ100 has a thicker ZFO layer (100 min) and exhibits slightly higher Raman intensity and broader bands in the 600–700 cm−1 region. Thus, this behavior indicates greater contribution from the ferrite layer and enhanced structural ordering owing to longer deposition duration of the ZFO layer (Figure 4c). As mentioned earlier, this broad feature also has contributions from the LLZO and NCM layer as well as the ZFO layer; hence, the broad encircled Raman bands for NLZ25 and NLZ100 were deconvoluted to identify the individual Raman bands (Figure 4d). The Raman bands are observed at approximately 639 ± 2, 690 ± 2 and 807 ± 2 cm−1 for NLZ25 and 638 ± 2, 683 ± 2 and 814 ± 2 cm−1 for NLZ100. The Raman band around 638 ± 2 cm−1 is ascribed to contribution from the ZFO layer (Table S1) whereas the band around 683 ± 2 cm−1 is associated with the LLZO layer (Table S2).
Figure 4.
Optical images of (a) NLZ25 and (b) NLZ100 and (c) Raman spectra and (d) the deconvoluted spectra of NLZ25 and NLZ100 trilayer structures.
3.3. Electron Probe Microanalyser (EPMA) and Inductively Coupled Plasma Mass Spectrometry (ICP-MS) Analysis
EPMA mapping results of NLZ25 (Figure 5a) and NLZ100 (Figure 5b) trilayer structures are shown in Figure 5. These results show a distribution of the constituent elements across both NLZ25 and NLZ100 trilayer structures. The atomic and mass % of elements present in these trilayer structures are shown in Table 1. For NLZ25, Si is the dominant element, while Fe and La are detected (Table 1). Meanwhile, for NLZ100 elements Fe, Zn, and La are detected along with Si, confirming the presence of the respective functional layers (Table 1). The higher relative Fe and Zn contents in NLZ100 compared with NLZ25 can be attributed to the longer ZFO deposition time, leading to greater incorporation of the ferrite layer.
Figure 5.
EPMA mapping results of (a) NLZ25 and (b) NLZ100 trilayer structures.
Table 1.
Atomic and mass % of elements present in NLZ25 and NLZ100 trilayer structures.
The predominance of Si in the EPMA spectra is due to the contribution from Si substrate. Since the deposited layers are relatively thin, the EPMA beam can reach the underlying Si substrate, resulting in a strong Si signal. The lower Si contribution in NLZ100 may be related to its thicker ZFO layer deposited for a longer duration.
To further investigate the presence of lithium in the NLZ100, the ICP-MS technique was utilized [47] (Section S1). The corresponding lithium concentration for diluted and undiluted samples (Table S4) was estimated to be 3.76–4.53 mg/kg. Overall, the ICP-MS results demonstrate the presence of lithium in the NLZ100 even after annealing at 900 °C.
3.4. Rutherford Backscattering Spectroscopy (RBS) Study
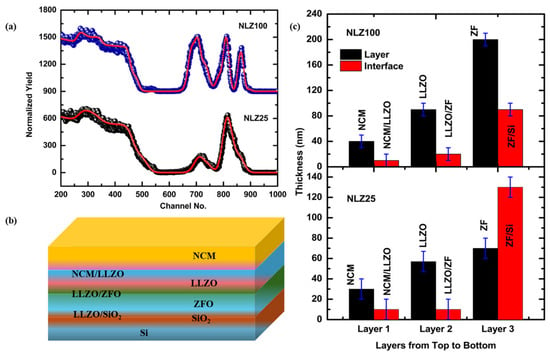
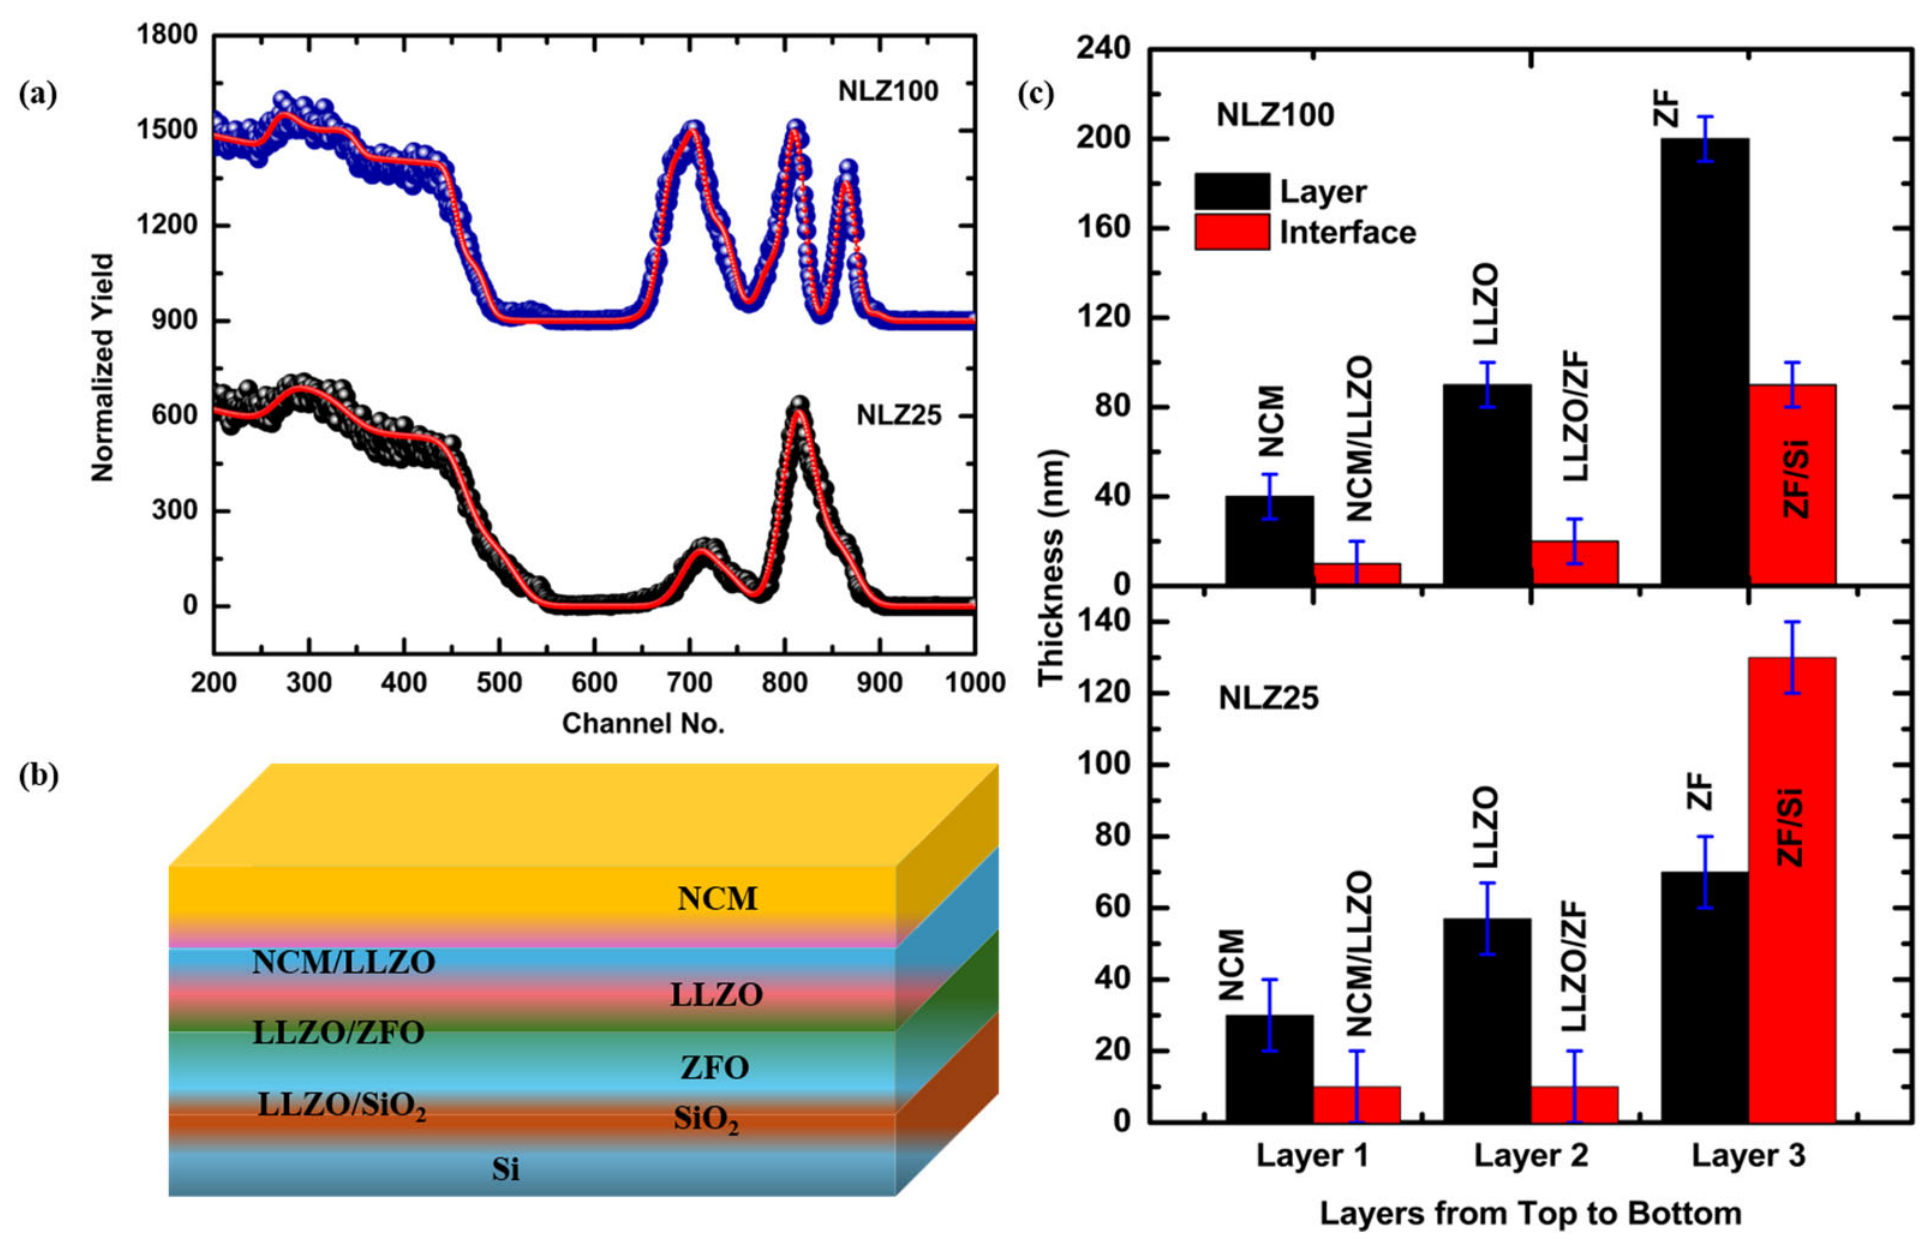
The EPMA visualizes O, Ni, Co, Mn, Fe, La, and Zr ions in both trilayer structures; however, significant atomic and mass % values could not be obtained for all elements (Table 1). Therefore, the presence of various elements is further confirmed by measuring the RBS spectra of NLZ25 and NLZ100 trilayer structures. Spectra for both trilayer structures exhibit signals corresponding to Ni, Co, Mn, La, Zr, Zn, Fe, and O ions that confirm the presence of the respective elements in the NLZ25 (Figure S1) and NLZ100 (Figure S2). To get information on the composition of various layers, RBS spectra of NLZ25 and NLZ100 (Figure 6a) are simulated using a model shown in Figure 6b. Both the experimental and simulated data points correlate well with each other, showing the validity of the proposed model in this work. The compositions of the ZFO layer are Zn0.1Fe0.8O3 and Zn0.85Fe1.9O3 for NLZ25 and NLZ100 (Table S5). As ICP-MS shows the presence of Li, Li is included in all layers even though it does not influence the RBS fitting. Considering Li presence in the LLZO and NCM layers, their compositions are Li2.1La0.5Zr5O3 and Li0.81Ni0.7Mn0.05Co0.01O3 for NLZ25 (Table S5). Compositions of the LLZO and NCM layers for the NLZ100 trilayer structure are Li3.9La0.5Zr1.5O4 and Li0.84Ni0.7Mn0.1Co0.05O1 (Table S5). Non-stoichiometry of the composition is observed because of the interfacial layer adjacent to each layer (Table S5). RBS simulation also provides an opportunity to estimate the thickness of layers (Table S5). The thicknesses of the various layers are shown in Figure 6c. The thickness of the NCM layer is around 30 ± 10 and 40 ± 10 nm for NLZ25 and NLZ100, respectively; however, the LLZO layer thicknesses are 57 ± 10 and 90 ± 10 nm for the corresponding structures (Table S5). For NLZ25, the thickness of the ZFO layer is 70 ± 10 nm; however, it is 200 ± 10 nm for NLZ100. This difference in the thickness of the ZFO layer is due to the difference in deposition durations for both structures.
Figure 6.
(a) Simulated RBS spectra for NLZ25 and NLZ100 trilayer structures, (b) model considered for simulating RBS spectra and (c) the thickness of NCM, LLZO and ZFO layers for NLZ25 and NLZ100.
3.5. Near-Edge X-Ray Absorption Fine Structure (NEXAFS) Measurements
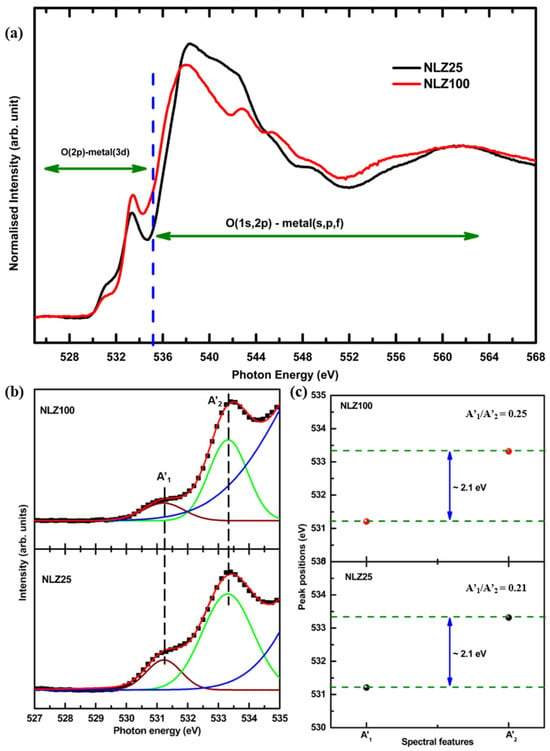
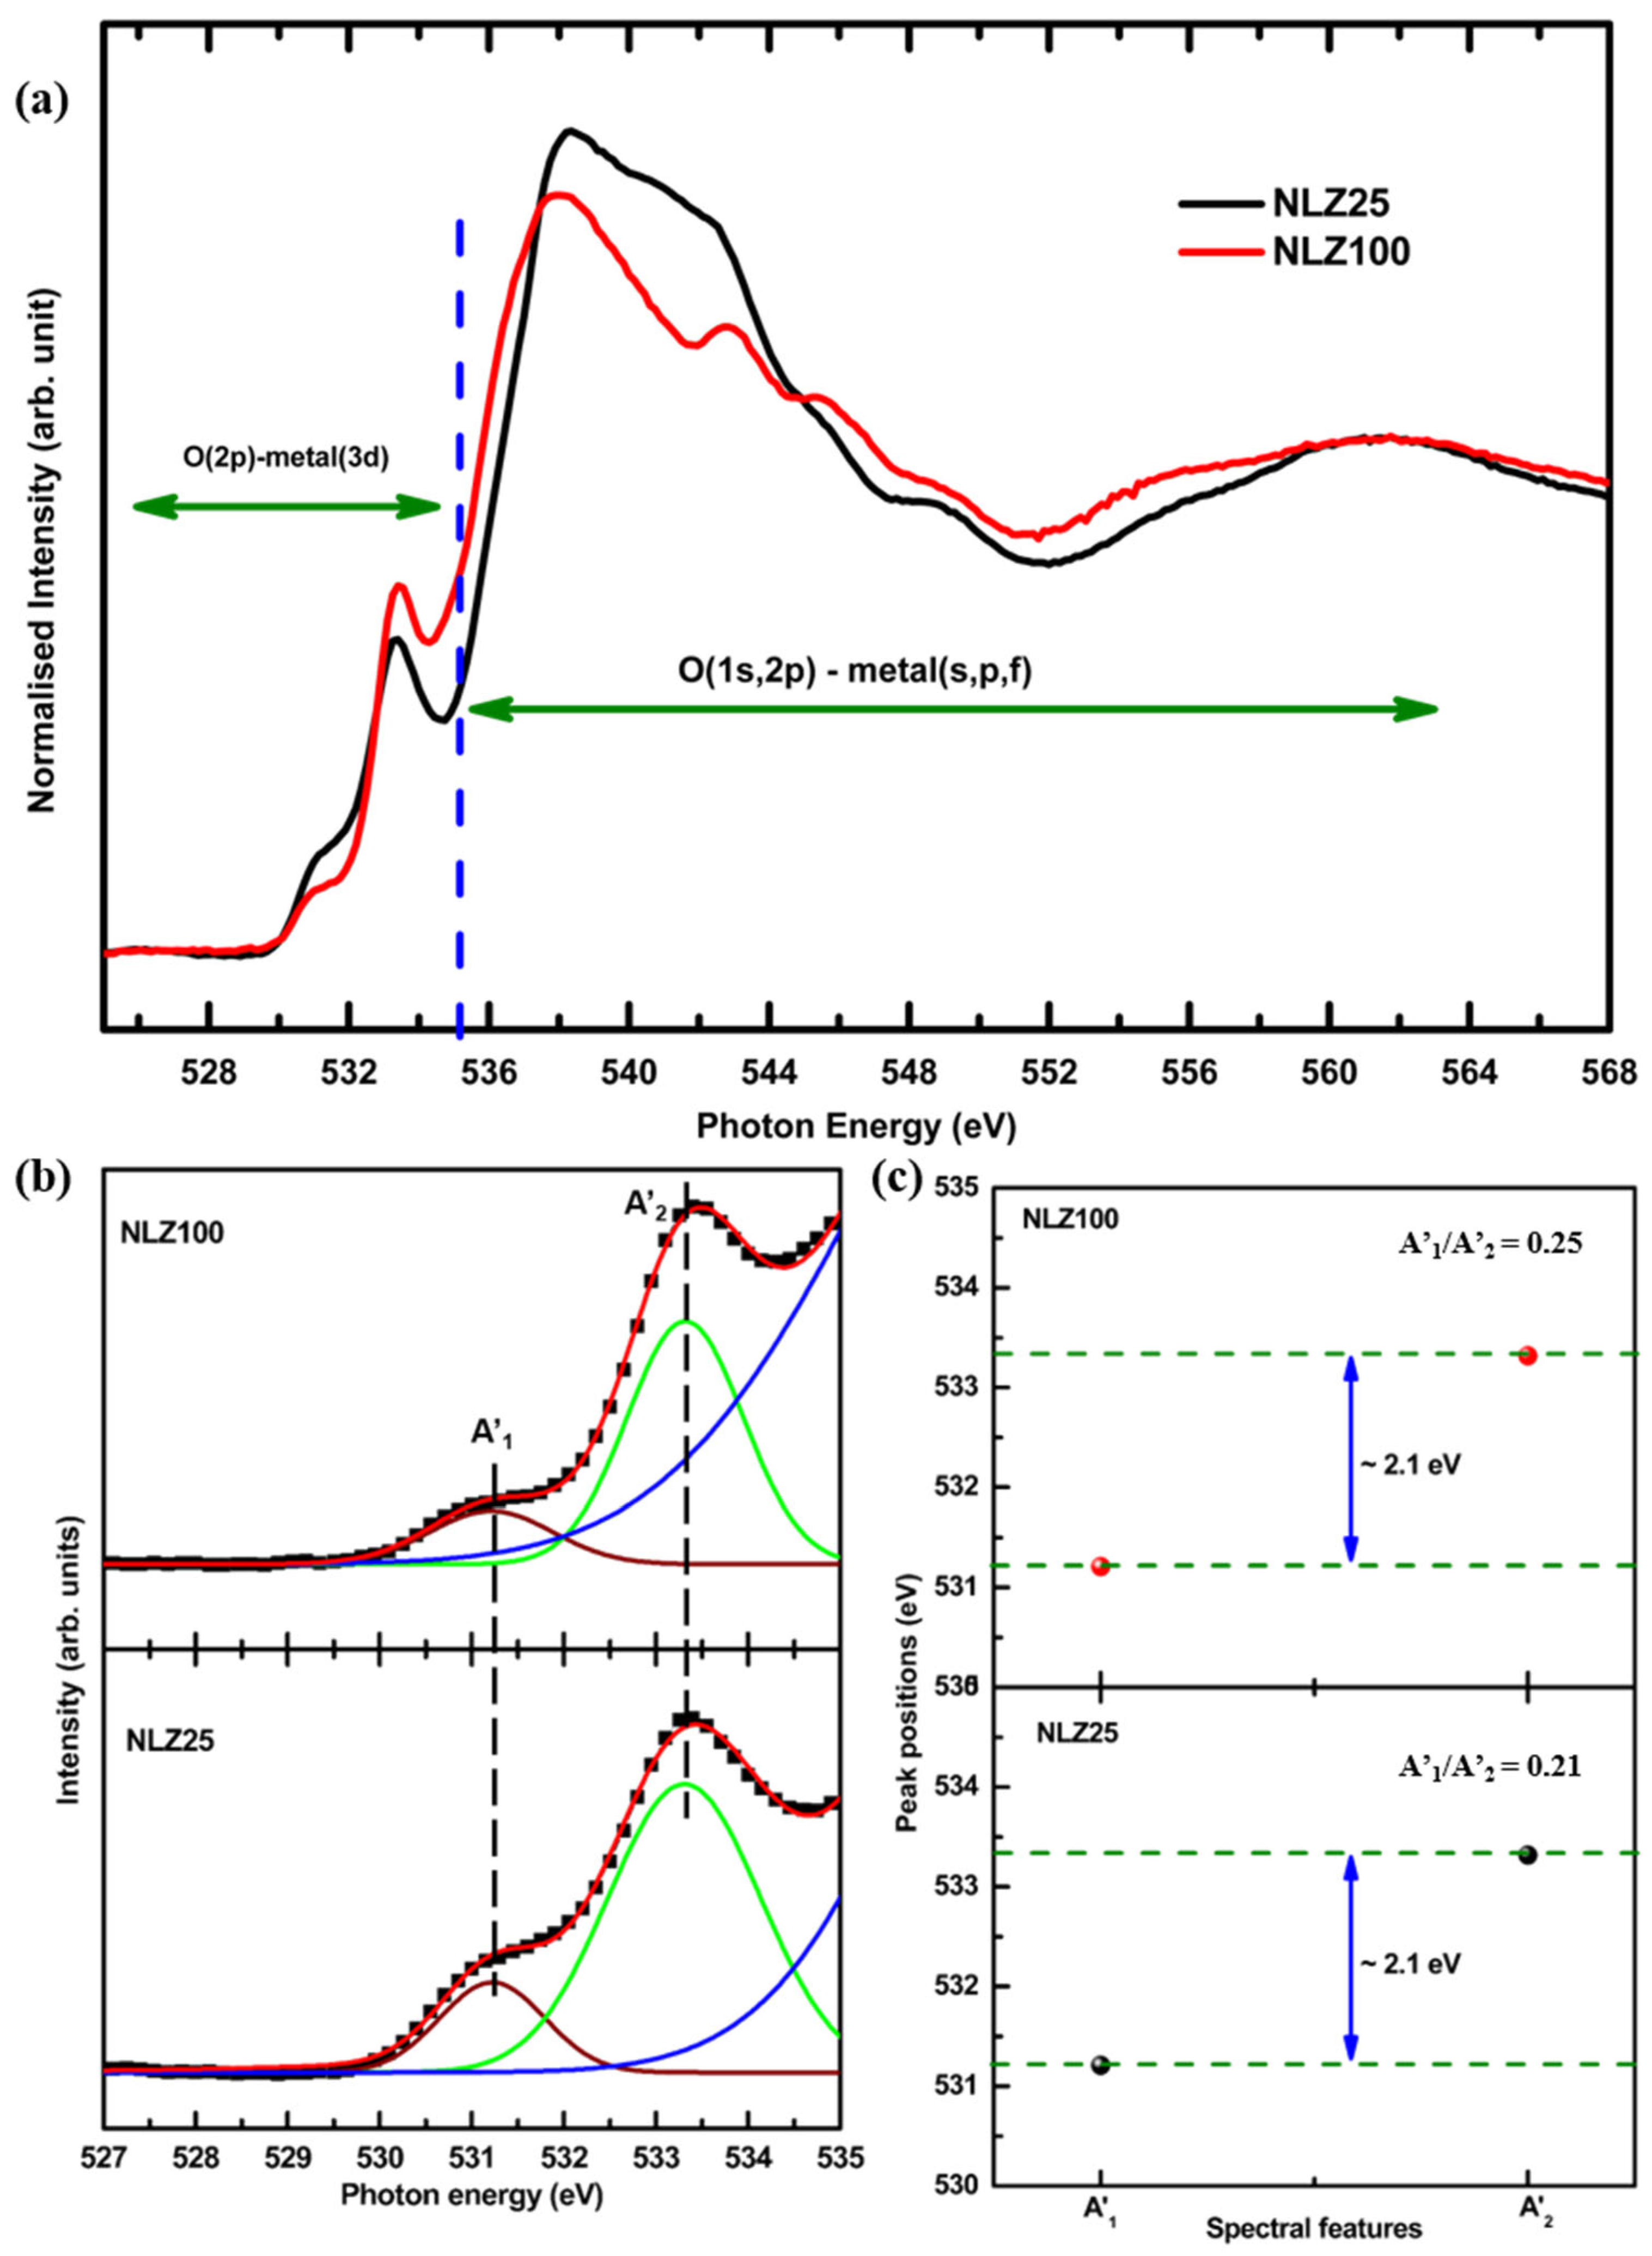
Figure 7a shows the O K-edge spectra of the NLZ25 and NLZ100 trilayer structures. The O K-edge spectra exhibit several characteristic absorption features originating from electronic transitions involving the O 1s core electrons to unoccupied O 2p states. The low-energy absorption features are primarily associated with hybridization between O 2p and transition-metal 3d states, reflecting the electronic interaction between oxygen and the neighboring metal cations (525–535 eV). At higher photon energies, the spectral contributions are associated with O 2p hybridization with metal 4s/4p-derived states and extended unoccupied electronic bands (536–568 eV) [48]. The O K-edge NEXAFS spectra of grown structures exhibit spectral features that may have contributions from ZFO [48], LLZO [49] and NCM [18,50] layers.
Figure 7.
(a) O K-edge NEXAFS spectra, (b) deconvoluted pre-edge region and (c) variation in peak positions of A’1 and A’2 spectral features of O K-edge NEXAFS spectra of NLZ25 and NLZ100 trilayer structures.
A significant change in the pre-edge region is observed (Figure 7a). This may be due to a change in metal–oxygen interactions. For quantitative information, the pre-edge region of the O K-edge spectra is deconvoluted (Figure 7b). The difference between these spectral features (A’1 and A’2) is around 2.1 eV for both trilayer structures (Figure 7c). Though this shows no change, area ratios of spectral features A1′ and A2′ for NLZ25 and NLZ100 are 0.21 and 0.25, respectively. Therefore, such a change in area ratio is associated with strengthening of metal–oxygen interaction owing to improved crystallization of the ZFO layer in the NLZ100 structure.
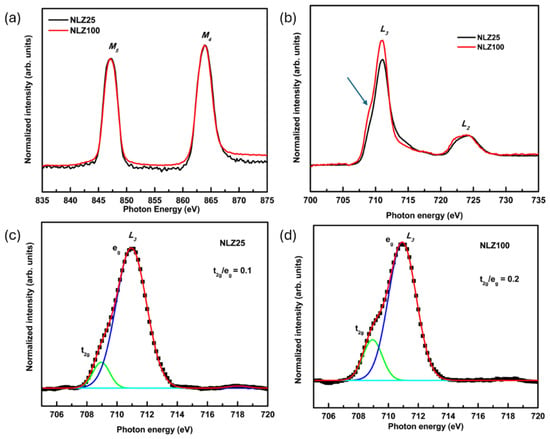
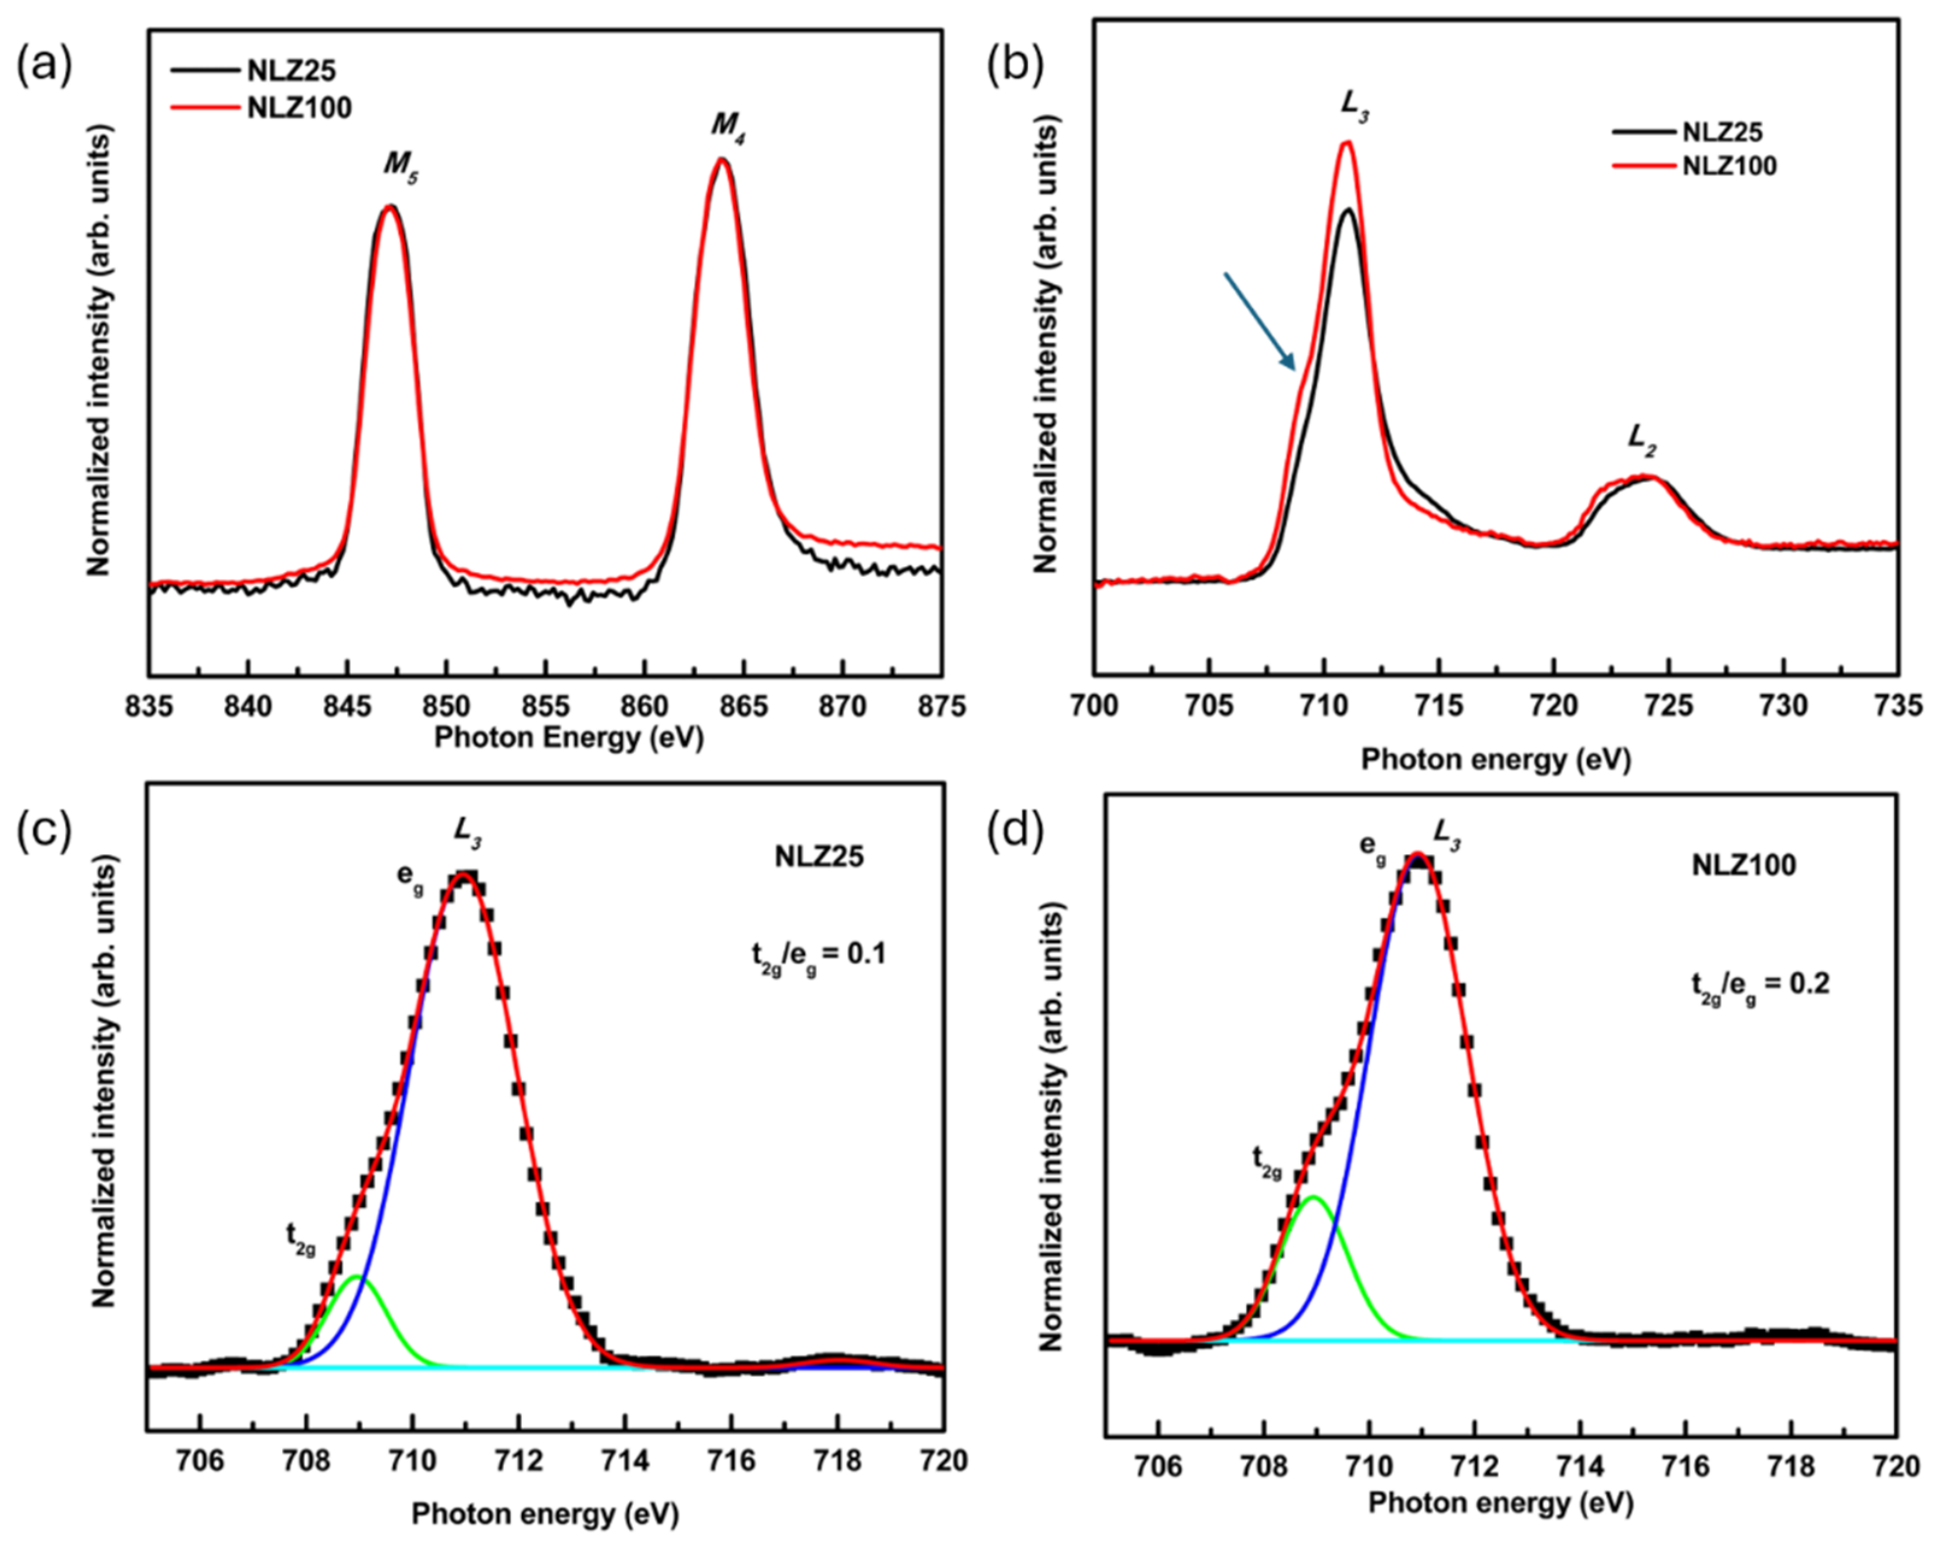
The La M-edge spectra of the NLZ100 and NLZ25 trilayer structures are shown in Figure 8a. These spectra exhibit spectral features centered at 847 and 863 eV that are associated with M5 and M4-edges. In both trilayer structures, the presence of these spectral features at an energy difference of ~16 eV is characteristic of the +3 oxidation state of La ions in LLZO thin films [51] and similar oxides [52]. Therefore, La ions have 3+ oxidation state in LLZO layers of both NLZ25 and NLZ100 trilayer structures.
Figure 8.
(a) La M-edge and (b) Fe L-edge NEXAFS spectra of NLZ25 and NLZ100 along with the deconvoluted Fe L3-edge spectral feature for (c) NLZ25 and (d) NLZ100 trilayer structures.
The spectra at the Fe L-edge show well-defined features (Figure 8b), which are assigned to the L3 (2p3/2 to 3d) and L2 (2p1/2 to 3d) transitions. These features are very sensitive to the Fe oxidation state. Spectral features appeared at 711 and 724 eV, indicating the presence of Fe3+ in both structures [48]. Spectral features corresponding to L3 symmetry states exhibit a significant change in the shoulder-like feature (shown by the arrow); therefore, this feature is deconvoluted for NLZ25 (Figure 8c) and NLZ100 (Figure 8d). Deconvoluted features are characterized by t2g and eg symmetry states [53]. The difference between the photon energies of these spectral features is around 2 eV for both trilayer structures. However, the area ratio corresponding to these states is 0.1 and 0.2 for NLZ25 and NLZ100, respectively. The increase in this ratio for NLZ100 may be due to bulk ZFO-like character owing to the larger thickness (~200 nm) of the ZFO layer.
3.6. X-Ray Absorption near Edge Structure (XANES) Measurements
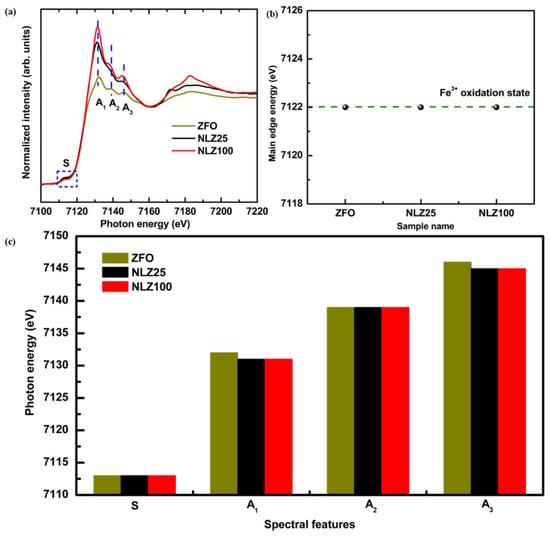
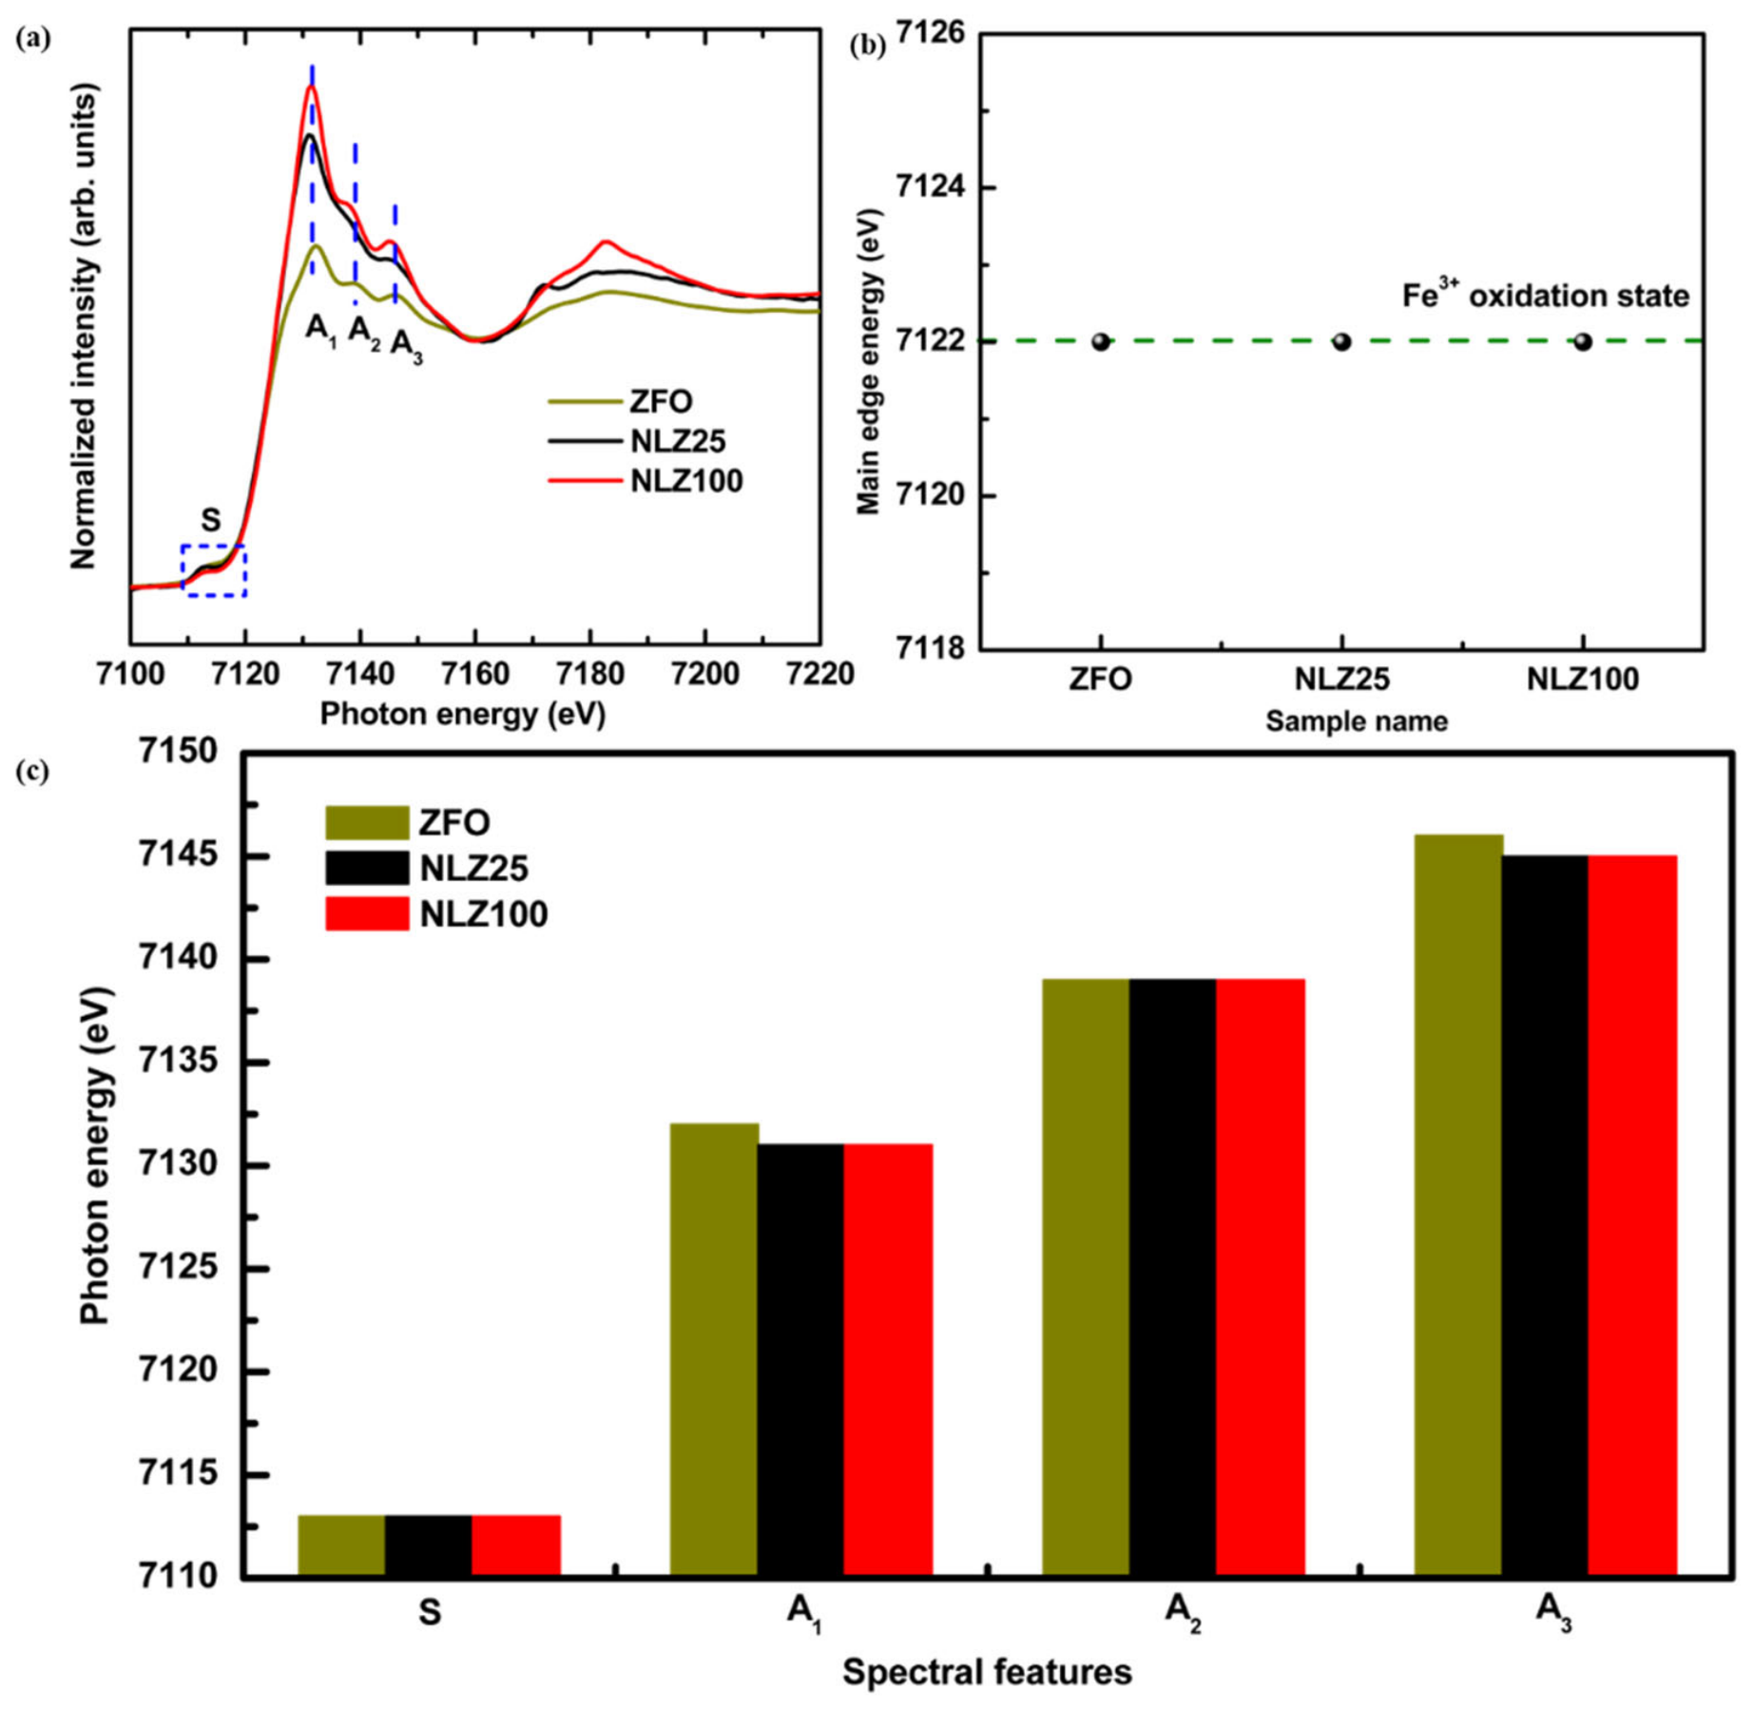
The Fe K-edge XANES spectra of the ZFO reference and NLZ25 and NLZ100 trilayer structures are shown in Figure 9a. The main edge energy (estimated from half of the step height) of NLZ25 and NLZ100 is consistent with ZFO (i.e., 7122 eV) (Figure 9b). This envisages the presence of the 3+ oxidation state of Fe in the ZFO layer of both trilayer structures. This indicates that increasing the ZFO deposition duration from 25 to 100 min does not signify a change in the average Fe oxidation state. All spectra exhibit the characteristic Fe K-edge absorption features, denoted as A1, A2 and A3 in the trilayer structures and ZFO reference. All spectra also exhibit an S feature, which corresponds to the pre-edge feature and arises mainly from Fe 1s to 3d transitions [54]. A visual inspection of these pre- and post-edge spectral features shows that all spectra are almost analogous except for the significant change in the intensities of features. Therefore, these spectral features are deconvoluted (Figure S3), and estimated photon energies for each spectral feature (S, A1, A2, and A3) are shown in Figure 9c. Photon energy values show that the pre-edge spectral feature, S, shows an almost similar value (7113 eV) for reference ZFO, NLZ25 and NLZ100.
Figure 9.
(a) Fe K-edge XANES spectra, (b) main edge energy and (c) photon energies for spectral features (S, A1, A2 and A3) of Fe K-edge XANES spectra of NLZ25 and NLZ100 trilayer structures along with reference ZFO.
The edge positions of post-edge spectral features A1, A2, and A3 are 7131, 7139 and 7145 eV for NLZ25 and 7131, 7139 and 7145 eV for NLZ100. However, these features appear at 7132, 7139 and 7146 eV for the ZFO reference [55]. Therefore, the photon energies for these spectral features show a difference of approximately 1 eV in the Fe K-edge XANES spectra for trilayer structures with respect to the ZFO reference (Figure 9c). This difference may be due to local coordination changes in the ZFO layer of NLZ25 and NLZ100 with respect to the reference ZFO. This is also evident from the significant enhancement of the intensity of spectral feature A1 (Figure 9a). Significant differences in the intensity are also observed for spectral features A1 and A3 (Figure 9a).
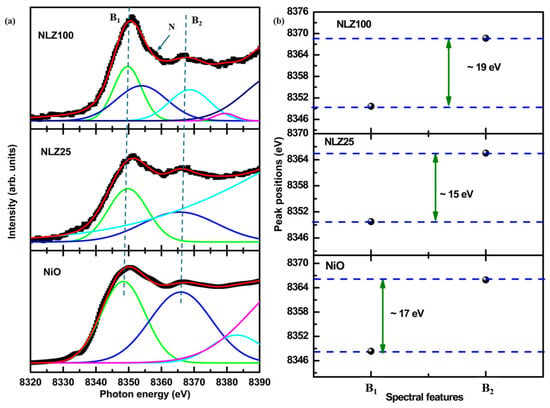
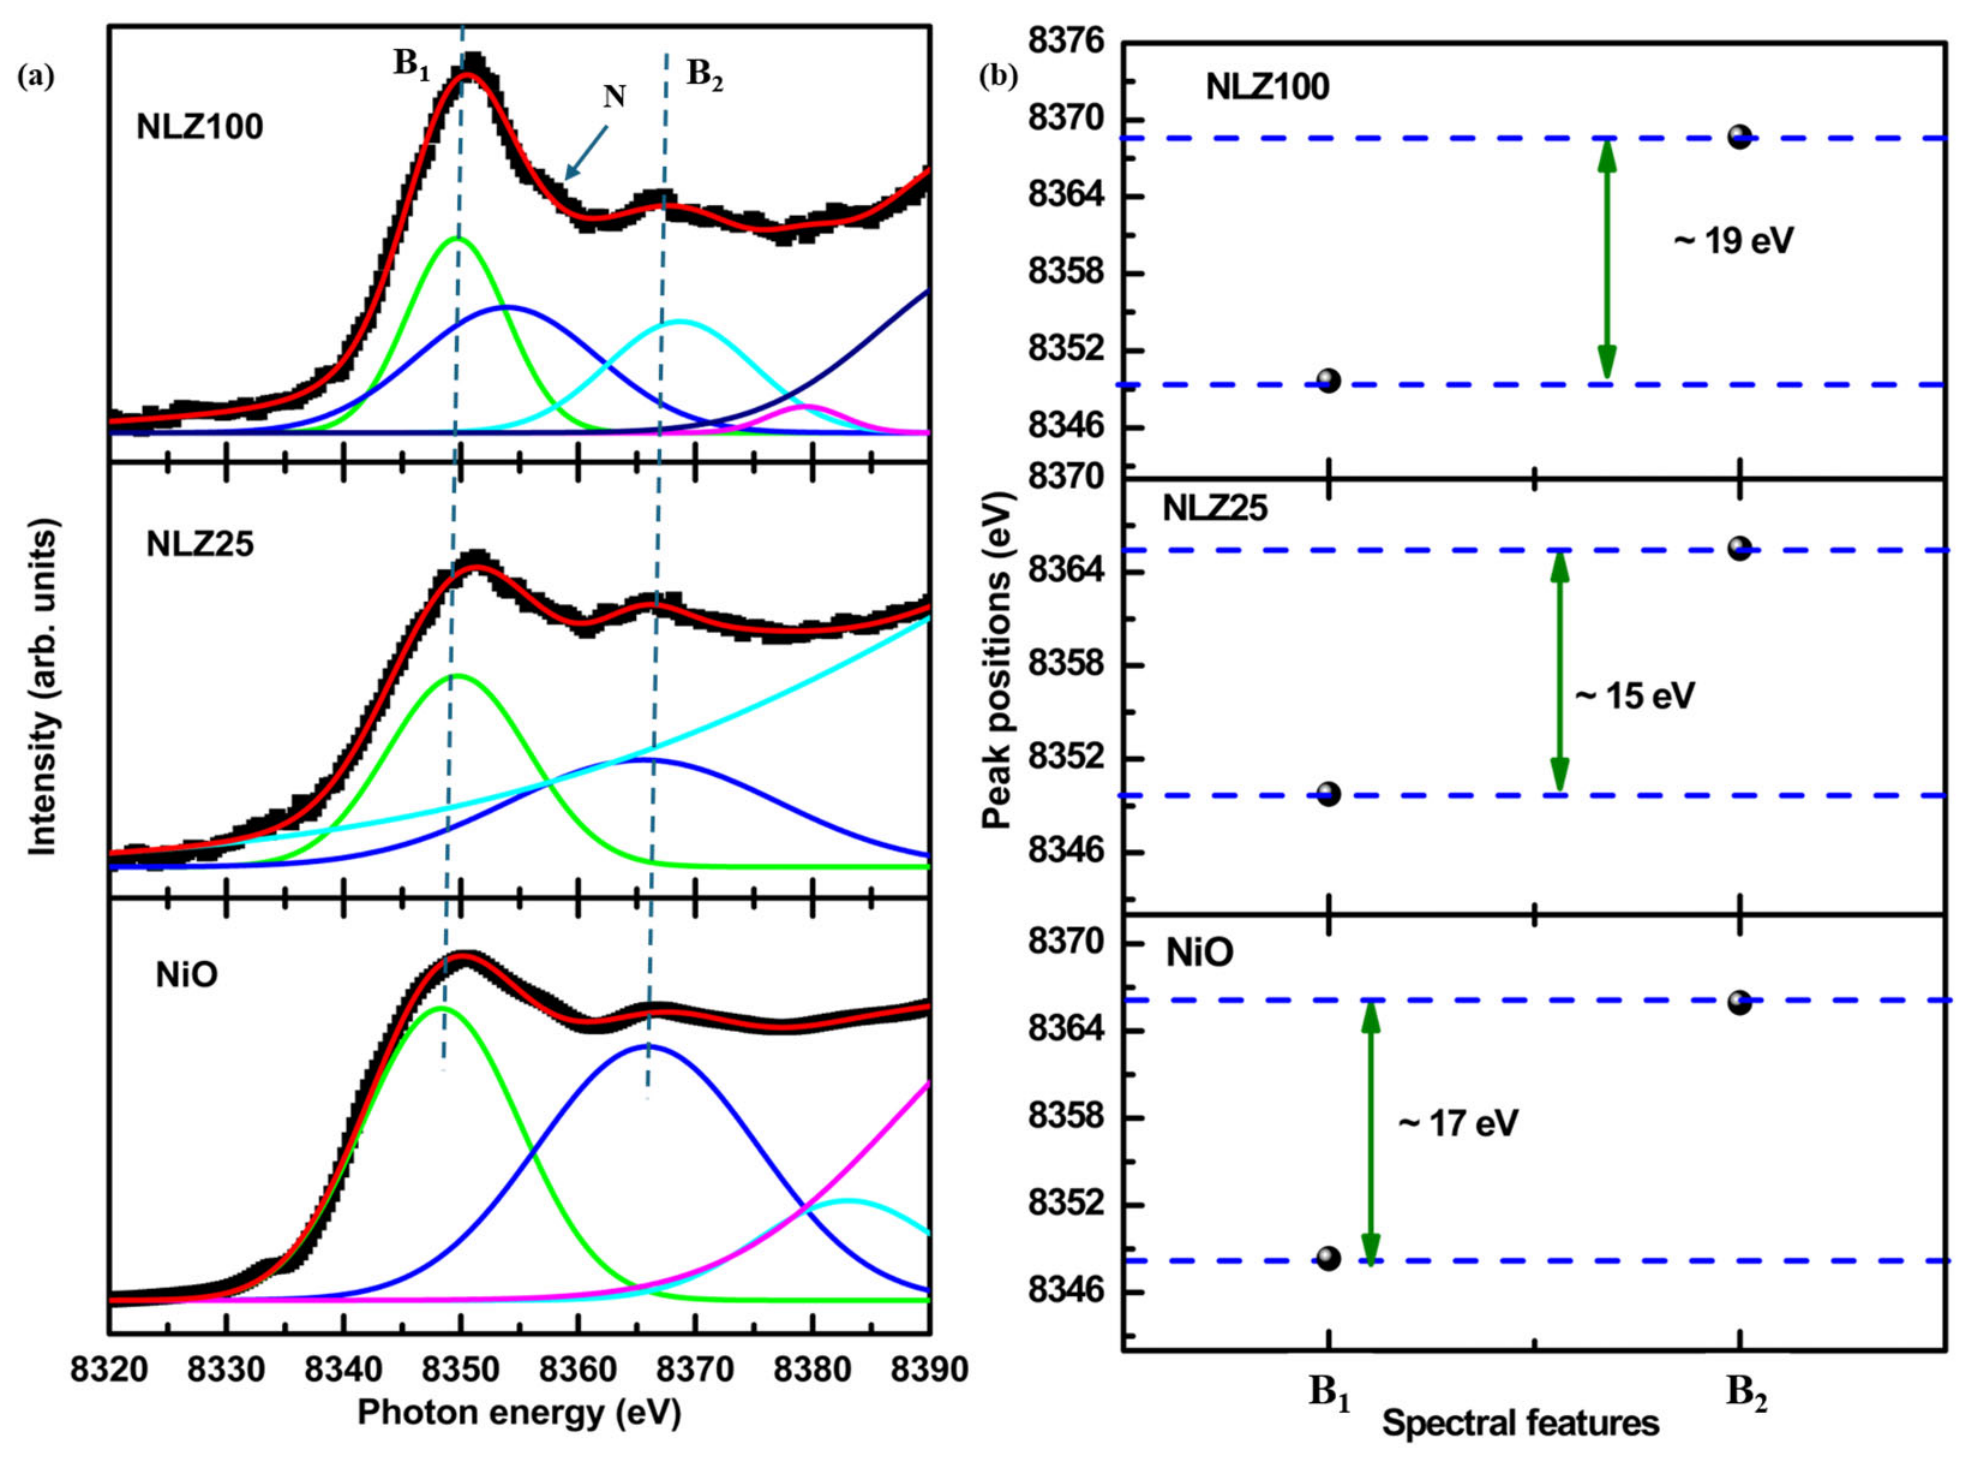
To further elucidate the nature of Ni ions in the NLZ25 and NLZ100 trilayer structures, Ni K-edge XANES spectra are measured (Figure S4). The main edges corresponding to NLZ25 and NLZ100 are 8346.2 and 8347.2 eV, respectively, which are higher than those of NiO (8345.2 eV) [56]. This shows that the oxidation state of Ni ions in the NCM layer for both trilayer structures is higher than that of 2+ and is in correlation with previous studies on NCM oxides [57]. Since Ni K-edge XANES spectra also exhibit spectral features B1 and B2 after the main edge, these spectra are deconvoluted to get quantitative information on the behavior of these spectral features in the two trilayer structures. Figure 10a depicts the deconvoluted spectra of NLZ25 and NLZ100 along with the reference NiO. NLZ25 and NLZ100 exhibit a spectral feature at 8351 eV (B1) for NLZ25 and NLZ100 [50] (Figure 10a). This feature corresponds to the dipole allowed 1s−4p transition [58,59]. Other spectral features, B2 for NLZ25 and NLZ100, can be seen around 8366 eV. The difference between these spectral features (B1 and B2) is around 15 eV for NLZ25 and around 19 eV for NLZ100 (Figure 10b). However, this difference is 17 eV for NiO, whereas the energy ratios of spectral features B1 and B2 for NLZ25 and NLZ100 are around 1, respectively. Additionally, an additional feature (N) can be seen for NLZ100, indicating rearrangement of the local atomic structure (Figure 10a). This is also evident from the change in the area ratio of B1 and B2 (B1/B2), which is 1.36 and 1.18 for NLZ25 and NLZ100, respectively.
Figure 10.
(a) Deconvoluted Ni K-edge XANES spectra of NLZ25 and NLZ100 trilayer structures along with NiO; (b) spectral features B1 and B2 and their differences for these trilayer structures.
4. Conclusions
In this work, NCM/LLZO/ZFO structures for two different thicknesses of ZFO layers were successfully grown on Si substrates using RF sputtering. XRD studies reveal the presence of a crystalline cubic spinel phase of zinc ferrite in both trilayer structures. This shows the ZFO layer remains in its single crystalline phase despite the significant differences in deposition duration for this layer. Other layers such as LLZO and NCM in the trilayer structure exhibit the presence of impurity phases. Li ions in the trilayer structure are detected using inductively coupled plasma mass spectrometry. Electron probe microanalyser mapping visualizes presence of Ni, Co, Mn, La, Zr, Zn, Fe and O elements in both trilayer structures that are also confirmed by Rutherford backscattering spectroscopy. This spectroscopic technique further infers that those different layers (ZFO, LLZO and NCM) are non-stoichiometric in both trilayer structures. Non-stoichiometry in these layers arises because of interface mixing and diffusion of ions towards adjacent layers. The O K-edge NEXAFS spectra of grown structures exhibit spectral features associated with ZFO, LLZO and NCM. The La M-edge NEXAFS spectra further envisage the presence of the La3+ oxidation state in the LLZO layer of both trilayer structures. The Fe L-edge and Fe K-edge XAS measurements indicate the presence of Fe3+ in the ZFO layer of both trilayer structures. Ni K-edge XAS measurements for both trilayer structures show onsets of mixed oxidation states of Ni ions in NCM layers. Slight changes in the post-edge spectral features for both Fe K-edge and Ni K-edge spectra for both trilayer structures show onsets of local atomic structure modification of respective layers with change in deposition duration of ZFO layer.
Supplementary Materials
The following supporting information can be downloaded at https://www.mdpi.com/article/10.3390/ceramics9110122/s1. Section S1: Inductively coupled plasma mass spectrometry (ICP-MS) analysis. Figure S1: RBS spectra of NLZ25 showing the presence of all elements specific to ZFO, LLZO and NCM layers. Figure S2: RBS spectra of NLZ100 showing the presence of all elements specific to ZFO, LLZO and NCM layers. Figure S3: Deconvoluted Fe K-edge XANES spectra for the NLZ100 trilayer structure. Figure S4: Ni K-edge XANES spectra of NLZ25, NLZ100 trilayer structures alongwith NiO reference. Table S1. Raman bands and their assignments for ZFO. Table S2. Raman bands and their assignments corresponding to LLZO. Table S3. Raman bands and their assignments for NCM. Table S4. ICP-MS analysis of NLZ100. Table S5. Composition and thickness of NLZ25 and NLZ100.
Author Contributions
N.: Data curation, investigation, methodology, writing—original draft. S.K.: Investigation, methodology, supervision, writing—review and editing. W.C.L.: Formal analysis, methodology, visualization. H.B.: Formal analysis, writing—review and editing. B.-H.L.: Formal analysis, methodology, visualization. S.L.: Formal analysis, funding acquisition, methodology, writing—review and editing. K.H.C.: Funding acquisition, project administration, validation, visualization. J.P.S.: Conceptualization, investigation, methodology, project administration, supervision, writing—review and editing. All authors have read and agreed to the published version of the manuscript.
Funding
This research was funded by MANAV RACHNA UNIVERSITY, grant number: MRU/Research-Fellowship (RF)/2023/2063; ANUSANDHAN NATIONAL RESEARCH FOUNDATION (ANRF), grant number: RJF2021/000115; KOREA INSTITUTE OF SCIENCE AND TECHNOLOGY, Seoul, Korea, grant number: 26V0071; and MINISTRY OF TRADE, INDUSTRY & ENERGY (MOTIE), Korea, by the Industrial Strategic Technology Development Program (RS-2024-00443105) and Development of Free-Standing Carbon Nanotube Membrane Manufacturing Technology with Large Area, High Transmittance program.
Data Availability Statement
The raw data supporting the conclusions of this article will be made available by the authors on request.
Acknowledgments
The authors sincerely acknowledge the University Instrumentation Centre (UIC), Manav Rachna University, Faridabad, and IIT Delhi CRF for providing measurement facilities.
Conflicts of Interest
The authors declare no conflicts of interest.
References
- Jafarpour, S.; Naghshara, H.; Zarenezhad, H. Reactive co-sputtered Li-Nb-O thin films with tunable ionic conductivity and dielectric properties for energy storage applications. Sci. Rep. 2026, 15, 37921. [Google Scholar] [CrossRef] [Scilit] [PubMed]
- Singh, J.P. Materials towards the development of Li rechargeable thin film battery. Prabha Mater. Sci. Lett. 2023, 2, 26–40. [Google Scholar] [CrossRef] [Scilit]
- Ukoba, K.; Jen, T.C. Thin Films in Battery Technologies. In Shaping Tomorrow: Thin Films and 3D Printing in the Fourth Industrial Revolution 2: Applications, 1st ed.; Springer Nature: Cham, Switzerland, 2025; pp. 119–146. [Google Scholar]
- Hitz, T.; McOwen, D.W.; Zhang, L.; Ma, Z.; Fu, Z.; Wen, Y.; Yong, G.; Dai, J.; Hamann, T.R.; Hu, L.; et al. High-rate lithium cycling in a scalable trilayer Li-garnet-electrolyte architecture. Mater. Today 2019, 22, 50–57. [Google Scholar] [CrossRef] [Scilit]
- Subash, S.; Udhayakumar, S.; Murmu, P.P.; Rubanov, S.; Bharathi, K.K. Insight into engineering the LMNO/LLTO/LTO thin-film solid-state micro batteries: Structural understandings and electrochemical evaluation. Electrochim. Acta 2025, 540, 147113. [Google Scholar] [CrossRef] [Scilit]
- Aribia, A.; Sastre, J.; Chen, X.; Futscher, M.H.; Rumpel, M.; Priebe, A.; Döbeli, M.; Osenciat, N.; Tiwari, A.N.; Romanyuk, Y.E. Unlocking stable multi-electron cycling in NMC811 thin-films between 1.5-4.7 V. Adv. Energy Mater. 2022, 12, 2201750. [Google Scholar] [CrossRef] [Scilit]
- Mengesha, T.H.; Beshahwured, S.L.; Wu, S.H.; Wu, Y.S.; Jose, R.; Lue, S.J.; Yang, C.C. Freestanding trilayer hybrid solid electrolyte with electrospun interconnected Al-LLZO nanofibers for solid-state lithium-metal batteries. ACS Appl. Energy Mater. 2021, 4, 14554–14574. [Google Scholar] [CrossRef] [Scilit]
- Ali, H.; Nawaz, H.; Shahzad, N.; Perveen, T.; Maqbool, M.; Kanwal, S.; Ali, S.D.; Abbas, S.M.; Shahzad, M.I. Exploring nano-ferrites as promising anode materials for lithium-ion batteries. J. Energy Storage 2025, 135, 118242. [Google Scholar] [CrossRef] [Scilit]
- Thieu, Q.Q.V.; Kidanu, W.G.; Nguyen, H.D.; Nguyen, T.L.T.; Le, M.L.P.; Nguyen, V.H.; Nguyen, D.Q.; Tran, N.T.; Nguyen, X.V.; Kim, I.T.; et al. Spinel Ni-ferrite advanced high-capacity anode for Li-ion batteries prepared via coprecipitation route. Ceram. Int. 2022, 48, 31470–31477. [Google Scholar] [CrossRef] [Scilit]
- Singh, V.; Latwal, M.; Neha; Lim, W.C.; Sharma, A.; Pandey, G.; Devnani, H.; Kumar, S.; Dung, D.D.; Kumar, S.; et al. Growth perspective, applications and advanced characterisation strategies for spinel magnetic oxide nanostructures: The case of MgFe2O4. Nanoscale Adv. 2026; in revision. [PubMed]
- Shaterian, M. ZnFe2O4 nanostructures as negative electrode materials for lithium-ion batteries: A review. Monatsh. Chem. 2026, 157, 541–561. [Google Scholar] [CrossRef] [Scilit]
- Hussain, M.; Hussain, A.; Hussain, A.; Shah, W.A.; Wang, S.; Abbas, S.M.; Son, Y.; Khan, M.T. Superior anode performance in lithium-ion batteries with optimized cobalt-doped zinc ferrite. Electrochem. Commun. 2026, 188, 108170. [Google Scholar] [CrossRef] [Scilit]
- Ashraf, H.; Karahan, B.D. A sustainable route for turning metallurgical wastes into modified zinc ferrite used as anode in lithium-ion batteries. Mater. Chem. Phys. 2026, 352, 132012. [Google Scholar] [CrossRef] [Scilit]
- Ayalew, K.H.; Palaniyandy, N.; Mathe, M.K.; Msomi, P.F. Garnet-type LLZO electrolytes for solid-state lithium batteries: Interfaces, conductivity, in-situ processing, and industrial prospects. Chem. Eng. J. 2025, 524, 168098. [Google Scholar] [CrossRef] [Scilit]
- Furuya, A.; Sasaki, A.I.; Morimura, H.; Kagami, O.; Tanabe, T. Magnetooptical and crystalline properties of sputtered garnet ferrite film on spinel ferrite buffer layer. Jpn. J. Appl. Phys. 2016, 55, 09SD01. [Google Scholar] [CrossRef] [Scilit]
- Furuya, A.; Yoshikawa, H.; Ohkubo, T.; Yamamoto, M.; Tailhades, P.; Bouet, L.; Despax, C.; Presmanes, L.; Rousset, A. Magneto-optical properties of a sputtered Bi-substituted Dy iron garnet-ferrite/spinel-ferrite bilayer. J. Magn. Magn. Mater. 1999, 193, 143–147. [Google Scholar] [CrossRef] [Scilit]
- Zhong, Z.; Zhang, H.; Tang, X.; Jing, Y.; Bai, F.; Liu, S. Microstructure and magnetic properties of CoFe2O4 thin films deposited on Si substrates with an Fe3O4 under-layer. Sci. China Phys. Mech. Astron. 2011, 54, 1235–1238. [Google Scholar] [CrossRef] [Scilit]
- Singh, J.P.; Park, J.P.; Chase, K.H.; Ahn, D.; Lee, S. Soft X-ray absorption spectroscopic investigation of Li(Ni0.8Co0.1Mn0.1)O2 cathode materials. Nanomaterials 2020, 10, 759. [Google Scholar] [CrossRef] [Scilit] [PubMed]
- Swami, S.K.; Barman, B.; Kumar, A.; Dutta, V. Multilayer and thin transparent conducting oxide fabrication using RF magnetron sputtering on flexible substrates. Org. Mater. 2023, 5, 59–65. [Google Scholar] [CrossRef] [Scilit]
- Singh, J.P.; Paidi, A.K.; Lee, S. Growth strategies of Li7La3Zr2O12 electrolytes for Li-ion thin film battery. Chem. Eng. J. Adv. 2023, 16, 100532. [Google Scholar] [CrossRef] [Scilit]
- Segmüller, A.; Noyan, I.C.; Speriosu, V.S. X-ray diffraction studies of thin films and multilayer structures. Prog. Cryst. Growth Charact. 1989, 18, 21–66. [Google Scholar] [CrossRef] [Scilit]
- Shallenberger, J.R.; Cole, D.A.; Novak, S.W.; Moore, R.L.; Edgell, M.J.; Smith, S.P.; Hitzman, C.J.; Kirchhoff, J.F.; Principe, E.; Biswas, S.; et al. Oxide thickness determination by XPS, AES, SIMS, RBS and TEM. In Proceedings of the 1998 International Conference on Ion Implantation Technology. Proceedings, Kyoto, Japan, 22–26 June 1998; IEEE: Piscataway, NJ, USA, 1998; Volume 1, pp. 79–82. [Google Scholar]
- Gorzalski, A.S.; Donley, C.; Coronell, O. Elemental composition of membrane foulant layers using EDS, XPS, and RBS. J. Membr. Sci. 2017, 522, 31–44. [Google Scholar] [CrossRef] [Scilit]
- Jayapalan, R.R.; Kumaravelu, T.A.; Vayssieres, L.; Dong, C.L. X-ray absorption spectroscopy perspective on electronic structure and catalysis of metal oxide heteronanostructures. Nanoscale 2026, 18, 14153–14181. [Google Scholar] [CrossRef] [Scilit] [PubMed]
- Singh, J.P.; Kumar, M.; Lim, W.C.; Gautam, S.; Kandasami, A.; Lee, S.; Chae, K.H. Probing local electronic structure of amorphous MgO thin films by angle dependent soft X-ray absorption spectroscopy: Impact of heavy ions. Trans. Electr. Electron. Mater. 2025, 26, 18–28. [Google Scholar] [CrossRef] [Scilit]
- Singh, J.P.; Chae, K.H. UV-Vis spectroscopic and NEXAFS studies of polycrystalline zinc ferrite films. Phys. Status Solidi A 2019, 216, 1800997. [Google Scholar] [CrossRef] [Scilit]
- Subramanian, M.; Thakur, P.; Gautam, S.; Chae, K.H.; Tanemura, M.; Hihara, T.; Vijayalakshmi, S.; Soga, T.; Kim, S.S.; Asokan, K.; et al. Investigations on the structural, optical and electronic properties of Nd doped ZnO thin films. J. Phys. D Appl. Phys. 2009, 42, 105410. [Google Scholar] [CrossRef] [Scilit]
- Hwang, H.N.; Kim, H.S.; Kim, B.; Hwang, C.C.; Moon, S.W.; Chung, S.M.; Jeon, C.; Park, C.Y.; Chae, K.H.; Choi, W.K. Construction of a soft X-ray beamline at the PLS. Nucl. Instrum. Methods Phys. Res. A 2007, 581, 850–855. [Google Scholar] [CrossRef] [Scilit]
- Yang, Q. A realistic PC-program for RBS simulation and data analysis. Nucl. Instrum. Methods Phys. Res. B 1994, 90, 602–605. [Google Scholar] [CrossRef] [Scilit]
- Climent-Font, A.; Wätjen, U.; Bax, H. Quantitative RBS analysis using RUMP. On the accuracy of the He stopping in Si. Nucl. Instrum. Methods Phys. Res. B 1992, 71, 81–86. [Google Scholar] [CrossRef] [Scilit]
- Li, L.; Jianhua, W.; Fang, H. Fabrication of ZnFe2O4@g-C3N4 for enhanced photo-Fenton effect and visible light-driven organic dye degradation. Sci. Rep. 2025, 15, 21707. [Google Scholar] [CrossRef] [Scilit] [PubMed]
- Tang, F.; Min, G.; Yang, T.; Zheng, J.; Chen, Y.; Na, B. Effects of Fe/Mo co-doping on the structure and ionic conductivity of garnet-type Li7La3Zr2O12 solid-state electrolyte. J. Power Sources 2026, 674, 239762. [Google Scholar] [CrossRef] [Scilit]
- Xi, X.; Fan, Y.; Liu, Y.; Chen, Z.; Zou, J.; Zhu, S. Enhanced cyclic stability of NCM-622 cathode by Ti3+ doped TiO2 coating. J. Alloys Compd. 2021, 872, 159664. [Google Scholar] [CrossRef] [Scilit]
- Singh, J.P.; Paidi, A.K.; Chae, K.H.; Lee, S.; Ahn, D. Synchrotron radiation based X-ray techniques for analysis of cathodes in Li rechargeable batteries. RSC Adv. 2022, 12, 20360. [Google Scholar] [CrossRef] [Scilit] [PubMed]
- Maurya, A.; Singh, D.; Mishra, N.; Singh, A.; Ojha, A.K. Tailoring the electrochemical response of ZrO2 with Co doping and rGO integration for supercapacitor device applications. Synth. Met. 2026, 321, 118272. [Google Scholar] [CrossRef] [Scilit]
- Qayyum, M.; Shahid, S.; Mansoor, S.; Faizan, M.; Javed, M.; Zidan, A.; Bahadur, A.; Iqbal, S.; Mahmood, S.; Farouk, A.E.; et al. Revolutionizing fingerprint detection: Ce3+ doped SiO2-Zr2O3:Sr2+ nanocomposites with enhanced luminescence and selectivity. J. Fluoresc. 2025, 35, 6947–6961. [Google Scholar] [CrossRef] [Scilit] [PubMed]
- Abish, S.; Sivakumar, S.; Vineeth, J.; Lalu, S.; Sukumar, N. Solar-assisted photodegradation performance of co-precipitated La2O3 nanoparticles and the effect of calcination temperature on structural and optical properties. Mater. Res. Innov. 2026, 30, 517–532. [Google Scholar] [CrossRef] [Scilit]
- Kazmi, J.; Kazmi, J.; Abbas, A.; Raza, S.R.A.; Sabtain, A.; Jalil, A.; Mohamed, M.A.; Naqi, M.; Song, H. Defect-programmed band alignment enables self-powered silicon photodiodes. Mater. Today Energy 2026, 60, 102352. [Google Scholar] [CrossRef] [Scilit]
- Singh, J.P.; Srivastava, R.C.; Agrawal, H.M.; Kishan, R. Micro-Raman investigation of nanosized zinc ferrite: Effect of crystallite size and fluence of irradiation. J. Raman Spectrosc. 2011, 42, 1510–1517. [Google Scholar] [CrossRef] [Scilit]
- Yadav, B.S.; Vishwakarma, A.K.; Singh, A.K.; Kumar, N. Oxygen vacancies induced ferromagnetism in RF-sputtered and hydrothermally annealed zinc ferrite (ZnFe2O4) thin films. Vacuum 2023, 207, 111617. [Google Scholar] [CrossRef] [Scilit]
- Josepha, J.; Tangsali, R.B.; Pillai, V.P.M.; Choudhary, R.J.; Phase, D.M.; Ganeshan, V. Microstructure and magnetic properties of patterned nanocrystalline zinc ferrite thin film fabricated by pulse laser deposition. Mater. Res. Bull. 2014, 61, 475–480. [Google Scholar] [CrossRef] [Scilit]
- Kumar, P.J.; Nishimura, K.; Senna, M.; Düvel, A.; Heitjans, P.; Kawaguchi, T.; Sakamoto, N.; Wakiya, N.; Suzuki, H. A novel low-temperature solid-state route for nanostructured cubic garnet Li7La3Zr2O12 and its application to Li-ion battery. RSC Adv. 2016, 6, 62656. [Google Scholar] [CrossRef] [Scilit]
- Tietz, F.; Wegener, T.; Gerhards, M.T.; Giarola, M.; Mariotto, G. Synthesis and Raman micro-spectroscopy investigation of Li7La3Zr2O12. Solid State Ion. 2013, 230, 77–82. [Google Scholar] [CrossRef] [Scilit]
- Flores, E.; Novák, P.; Aschauer, U.; Berg, E.J. Cation Ordering and Redox Chemistry of Layered Ni-Rich LixNi1−2yCoyMnyO2: An Operando Raman Spectroscopy Study. Chem. Mater. 2020, 32, 186–194. [Google Scholar] [CrossRef] [Scilit]
- Li, X.; Chang, K.; Abbas, S.M.; El-Tawil, R.S. Silver Nanocoating of LiNi0.8Co0.1Mn0.1O2 Cathode Material for Lithium-Ion Batteries. Micromachines 2023, 14, 907. [Google Scholar] [CrossRef] [Scilit] [PubMed]
- Dabaki, Y.; Kassem, M.; Delaizir, G.; Sammoury, A.; Leroy, G.; Poupin, C.; Bokova, M.; Bychkov, E. The garnet Al-LLZO lithium-ion conductor processed by spark plasma sintering: Phase formation and ionic conductivity. Ceram. Int. 2025, 51, 18816–18826. [Google Scholar] [CrossRef] [Scilit]
- Wang, S.; Li, P.; Zheng, Q.; Su, Q. Evaluation of microwave-assisted acid digestion ICP-OES/MS method for determining major and impurity elements in lithium nickel cobalt manganese oxide (NCM) materials. Microchem. J. 2026, 224, 117735. [Google Scholar] [CrossRef] [Scilit]
- Garg, S.; Charak, R.; Chawla, V.; Goyal, N.; Chae, K.H.; Gautam, S. Probing annealing-induced electronic structure in zinc ferrite nanoparticles: X-ray photoemission and absorption spectroscopy study. Vacuum 2026, 248, 115231. [Google Scholar] [CrossRef] [Scilit]
- Feng, J.; Gao, Z.; Sheng, L.; Hao, Z.; Wang, F.R. Progress and perspective of interface design in garnet electrolyte-based all-solid-state batteries. Carbon Energy 2021, 3, 385–409. [Google Scholar] [CrossRef] [Scilit]
- Ni, L.; Chen, H.; Guo, S.; Dai, A.; Gao, J.; Yu, L.; Mei, Y.; Wang, H.; Long, Z.; Wen, J.; et al. Enabling Structure/Interface Regulation for High Performance Ni rich cathodes. Adv. Funct. Mater. 2023, 33, 2307126. [Google Scholar] [CrossRef] [Scilit]
- Anjali; Lim, W.C.; Kim, S.H.; Sharma, A.; Moditma; Lee, S.; Shin, H.J.; Chae, K.H.; Singh, J.P. Lithium lanthanum zirconate thin films investigated using spectroscopic and microscopic techniques. Radiat. Eff. Defects Solids 2025, 180, 906–916. [Google Scholar] [CrossRef] [Scilit]
- Wang, J.; Chen, Z.; Huang, H.; Cui, J.; Zhang, W.; Fu, Z.; Peng, R.; Yan, W.; Lu, Y. Realizing semiconductivity by a large bandgap tuning in Bi4Ti3O12 via inserting La1-xSrxMnO3 perovskite layers. Appl. Phys. Lett. 2017, 110, 212102. [Google Scholar] [CrossRef] [Scilit]
- Sorgenfrei, F.; Alouani, M.; Schött, J.; Jönsson, H.J.M.; Eriksson, O.; Thunström, P. Theory of X-ray absorption spectroscopy for ferrites. Phys. Rev. B. 2024, 109, 115126. [Google Scholar] [CrossRef] [Scilit]
- Westre, T.E.; Kennepohl, P.; DeWitt, J.G.; Hedman, B.; Hodgson, K.O.; Solomon, E.I. A multiplet analysis of Fe K-edge 1s→ 3d pre-edge features of iron complexes. J. Am. Chem. Soc. 1997, 119, 6297–6314. [Google Scholar] [CrossRef] [Scilit]
- Nakashima, S.; Fujita, K.; Tanaka, K.; Hirao, K.; Yamamoto, T.; Tanaka, I. First-principles XANES simulations of spinel zinc ferrite with a disordered cation distribution. Phys. Rev. B-Condens. Matter Mater. Phys. 2007, 75, 174443. [Google Scholar] [CrossRef] [Scilit]
- Woolley, R.J.; Illy, B.N.; Ryan, M.P.; Skinner, S.J. In situ determination of the nickel oxidation state in La2NiO4+δand La4Ni3O10−δ using X-ray absorption near-edge structure. J. Mater. Chem. 2011, 21, 18592–18596. [Google Scholar] [CrossRef] [Scilit]
- Paidi, A.K.; Singh, J.P.; Kwon, J.; Paidi, V.K.; Kwon, I.S.; Lee, S.; Lee, K.S.; Lim, J.; Chae, K.H.; Lim, J.; et al. Correlating charge heterogeneity and first-cycle irreversible capacity loss in lithium-ion batteries. J. Mater. Chem. A 2026, 14, 2723–2734. [Google Scholar] [CrossRef] [Scilit]
- Kondrakov, A.O.; Geßwein, H.; Galdina, K.; De Biasi, L.; Meded, V.; Filatova, E.O.; Schumacher, G.; Wenzel, W.; Hartmann, P.; Brezesinski, T.; et al. Charge-transfer-induced lattice collapse in Ni-rich NCM cathode materials during delithiation. J. Phys. Chem. C 2017, 121, 24381–24388. [Google Scholar] [CrossRef] [Scilit]
- Tsai, Y.W.; Hwang, B.J.; Ceder, G.; Sheu, H.S.; Liu, D.G.; Lee, J.F. In-situ X-ray absorption spectroscopic study on variation of electronic transitions and local structure of LiNi1/3Co1/3Mn1/3O2 cathode material during electrochemical cycling. Chem. Mater. 2005, 17, 3191–3199. [Google Scholar] [CrossRef] [Scilit]

Disclaimer/Publisher’s Note: The statements, opinions and data contained in all publications are solely those of the individual author(s) and contributor(s) and not of MDPI and/or the editor(s). MDPI and/or the editor(s) disclaim responsibility for any injury to people or property resulting from any ideas, methods, instructions or products referred to in the content. |
© 2026 by the authors. Licensee MDPI, Basel, Switzerland. This article is an open access article distributed under the terms and conditions of the Creative Commons Attribution (CC BY) license.