


Abstract
A Dendrochronological study of teak (Tectona grandis) was conducted at two sites in northern Chhattisgarh, central India, and resulted in the development of two tree-ring width chronologies. We examined the relationships between tree-ring chronologies and gridded monthly and daily climate variables (mean temperature, total precipitation and drought indices) as well as monthly soil moisture. We performed spatial correlations using monthly climate data and used the nearest climate grid point for daily climate correlations. Both chronologies showed negative correlations with temperature and positive correlations with soil moisture, rainfall, and drought indices. These relationships highlight the dominant role of soil moisture availability in influencing teak growth in the monsoon-dominated climate of Chhattisgarh. Based on this relationship, we reconstructed average soil moisture from February to October, extending the gridded soil moisture record by 62 years (1920–1981 CE). This reconstruction represents the first tree-ring-based long-term soil moisture record from central India. Our findings provide a comprehensive hydroclimatic perspective for a region lacking historical tree-ring data and demonstrate the potential of teak as a proxy for investigating long-term soil moisture variability. Further research using older samples from this species will enhance understanding of past climate variability and hydroclimatic changes in central India.
1. Introduction
The Indian summer monsoon (ISM) governs the precipitation pattern in most parts of India. The Indian Summer Monsoon (ISM) is a seasonal wind system driven by land–sea thermal contrast, controlling most of India’s rainfall. Its variability has a strong impact on agriculture, water resources and health. The monsoon results from the seasonal migration of the ITCZ and Coriolis-driven wind reversal, producing southwest summer and northeast winter monsoons [1]. The variability of the ISM not only influences human systems but also strongly affects natural ecosystems. Environmental factors associated with ISM, such as high precipitation (>2500 mm), the number of rainy days and enhanced soil moisture conditions, contribute to the rich diversity and complexity of tropical evergreen forests [2,3]. Tropical forests are known to significantly impact various global environmental conditions and serve as repositories of terrestrial and soil carbon. They store 68% of the worldwide forest carbon stock in the form of vegetation biomass (45–55%) and soil carbon (10–30%) [4,5]. Studies have reported that the tropical forests of central India act as carbon reservoirs with the potential to mitigate climate change [3,6]. Studies have been carried out in India to understand the impact of palaeoclimatic variability based on dendrochronological analysis of several conifer taxa, which are mostly confined to the Himalayan region [7,8] and broadleaved taxa such as toon (Toona ciliata) in subtropical parts of the eastern Himalaya [9] and teak (Tectona grandis) from central and southern India [7].
Teak is a well-distributed deciduous tree that grows in various parts of central and peninsular India, forming clear and datable annual growth rings to study multiple aspects of Dendrochronology [10]. Teak tree rings are distinguished by their pore sizes. Each annual ring consists of a prominent earlywood vessel, and its decreased size in the latewood distinguishes the yearly growth rings in teak [11,12]. The transition from latewood to earlywood is delineated, as it marks the end of one growing season and the beginning of the next. Studies on tree rings in tropical regions consider teak trees as one of the most relevant taxa. The first-ever teak tree-ring chronology was developed in Java [13]. Studies on teak have been conducted in various regions of the globe, including the Indian subcontinent, to investigate the climatic influence on its growth and to reconstruct past climates [7,14,15]. Studies on teak have been conducted in central and peninsular India on ring width [10,16,17,18,19,20,21,22,23,24,25], stable isotope [26,27,28,29,30], mean vessel area [31] and atmospheric 14C variability on ring width [32] of teak. Recent studies have also demonstrated the dendroclimatic potential of teak in the northeastern region of India [33,34]. Despite the high dendrochronological potential of teak, researchers have analyzed only one site in the Chhattisgarh region of central India to examine the relationships between teak tree-ring stable isotopes (oxygen and carbon) and climate [26,27,30].
In India, teak, although it occurs in dry localities, is subject to great heat and drought in the hot season, reaching its largest dimensions in a fairly moist, warm, tropical climate with well-drained, deep alluvial soil. In the Indian Peninsula region, teak appears to thrive best with a normal rainfall varying from 1200 to 3800 mm and experiences in places with absolute maximum shade temperatures up to about 47 °C [35]. Drought, precipitation and soil moisture have a significant influence on teak growth, while the variations in climate and soil characteristics can have a substantial effect on its wood productivity [36]. The development of teak is also affected by soil moisture, due to its susceptibility to poor drainage conditions, as well as its quality and distribution being dependent on the soil moisture characteristics. Soil moisture records are crucial to understanding climate change and variability in the water cycle, particularly in a warming climate [37]. It also affects the hydrological and climatological cycle by partitioning the net radiation and exerting the net heat flux [38]. It directly impacts the weather of the area and long-term climatic processes [39,40,41,42], changing the values of surface albedo, soil layer thermal properties and evapotranspiration [43,44]. Soil moisture plays an important role in understanding drought variability [45,46,47], highlighting its importance in forested and agricultural areas. Furthermore, changes in rainfall patterns increase soil erosion, while rising temperatures cause soil to release more carbon dioxide. These processes degrade soil quality and can lead to desert–like conditions. Drought conditions in the forest cause widespread tree mortality and the release of large amounts of carbon into the atmosphere. Even moderate reductions in rainfall can trigger these responses, underscoring the susceptibility of forests to climate change [48].
Long-term soil moisture influences numerous environmental and climatic processes. It plays a crucial role in drought and flood forecasting, agricultural monitoring, water resource management and long-term planning for natural resources. In this study, we use long-term soil moisture variability to understand how drought affects tree growth patterns. However, soil moisture records remain short and incomplete in most regions of the world. To address this gap, we reconstructed soil moisture data beyond the existing instrumental records using teak tree rings from Chhattisgarh, central India. We analyzed the impact of soil moisture on teak, the most widely distributed tree species in the region, to evaluate its potential for understanding carbon budget variability in tropical forests. The specific objectives of this study are as follows: (i) to identify the dominant climatic factors and soil moisture conditions that limit the radial growth of teak in northern Chhattisgarh, (ii) to assess the synchrony of monthly and daily climatic influences on teak radial growth and (iii) to reconstruct and evaluate soil moisture variability in northern Chhattisgarh. We present a new chronology of teak tree-ring widths from a region in central India where researchers have not previously conducted dendrochronological studies.
2. Materials and Methods
2.1. Study Area
We conducted this study at two localities in the state of Chhattisgarh, central India. Chhattisgarh lies between 17°46′ N to 24°5′ N Latitude and from 80°15′ E to 84°20′ E Longitude. Approximately 45% of its geographical area is covered by dense forests. The state comprises three major physiographic zones: the northern hilly region, the central Chhattisgarh plain and the southern Bastar plateau [49]. The northern hilly region occupies the north part of Chhattisgarh and includes parts of the Maikal and Hazaribagh hill ranges of central India. It comprises pediments and pediplains, structural and denudational plateaus, hills and Valleys and structural plains composed of Gondwana rocks. The region spans portions of the Ganges, Brahmani and Mahanadi River basins. The central Chhattisgarh plain forms part of the Mahanadi basin and constitutes a fan-shaped structural-erosional basin covering ~75,000 km2. The Chhuri and Raigarh hills surround it to the north, the Lormi and Pendra plateaus, the Dhalli-Rajhara hills to the south, the Maikal range to the west and the Raipur upland to the southeast. Part of the Narmada and Godavari basins also occurs in this plain. The southern Bastar Plateau lies in southern Chhattisgarh, primarily within the Godavari Basin. The features include hilly terrain and dense reserve forests [49].
The region experiences a subtropical climate characterized by hot summers (March to mid-June) and mild winters (November–February). May is the hottest month, with a mean daily maximum temperature reaching up to 46 °C, whereas January is the coldest month, with a mean daily minimum temperature of around 10.2 °C [50]. The region receives an average annual rainfall of approximately 1400 mm, nearly 80% of which occurs during the southwest monsoon season (June–September) [51]. The monsoon generally begins in the second week of June and continues until the second week of October [52].
2.2. Sample Details and Collection
Shorea robusta Gaertn. f. (Sal) and Tectona grandis Linn.f. (Teak) are the two dominant forest tree species in Chhattisgarh [26,27,28,29,30,53,54,55]. Sal belongs to the family Dipterocarpaceae, whereas teak belongs to the family Verbenaceae. In this study, we preferred teak over Sal because its ring-porous wood forms well-defined annual rings that are easier to crossdate and show consistent responses to climatic variables, particularly rainfall and soil moisture [34]. In contrast, Sal has diffuse-porous wood with irregular and asymmetric rings, resulting in weaker and less reliable climate signals [56]. Teak is widely distributed and extensively managed for commercial purposes, with forest management practices involving periodic harvesting and replanting across various localities of Chhattisgarh. Teak exhibits a distinct separation between sapwood and heartwood. The sapwood is white to pale yellow, while the heartwood is light golden brown when freshly cut, darkening to brown or deep brown upon exposure, often with darker streaks. Heartwood color and markings vary by locality. Teak is moderately hard and heavy, with an air-dry specific gravity of 0.51 to 0.77. It is generally straight-grained, though trees from drier regions may show irregular grain, and the texture is coarse and uneven.
We collected teak tree cores from the northern hilly region of Chhattisgarh to analyze their annual growth rings. Samples were obtained from both living trees and felled logs at two sites: Barighat Beat (BGB) and Rangora Beat (RGB) (Figure 1). Tree-ring core samples were collected using an increment borer of 10 mm diameter and at breast height (~1.3 m above ground), as this height facilitates the use of body weight and manual rotation, making sample extraction more efficient [57,58]. The BGB site (latitude: 22°22′20″ N; longitude: 81°54′57″ E, elevation: 380 m a.s.l.) lies in the Tendva range of the Kota Corporation Forest Division, ~31 km northwest of Bilaspur city. We collected 28 increment cores from 15 trees growing on black soil in the forest compartment RF/165. According to forest department records, the area has no naturally occurring teak; all the trees were planted in 1977. Some trees were felled during 2022, which provided an opportunity to collect an additional 10 cross-sections. Whereas the RGB site (latitude: 21°21′41″ N; longitude: 82°34′39″ E, elevation: 310 m a.s.l.) comprises naturally growing teak trees and lies within the Baloda Bazar Forest Division and Kashdol subdivision, ~185 km from Bilaspur. We collected 33 increment cores from 17 trees growing on black soil in forest compartments RF/276 and RF/278, along with 10 cross-sections from felled trees during 2021–2022. We manually obtained the cross sections using a hand saw (Figure 2).
Figure 1.
Map showing tree-ring sampling sites, BGB (Berighat Beat) and RGB (Rangora Beat) from northern Chhattisgarh, along with the climate grid location of IMD (Indian Meteorological Department). The nearest climate grid points from the sample site are marked as Grid #5 for site BGB and Grid #9 for site RGB. To identify each IMD climate grid, the first (Grid #1) and the last (Grid #17) grid numbers are also marked.
Figure 2.
(a) A teak (Tectona grandis) tree growing in the forest of Chhattisgarh, (b) leftover tree stumps of teak tree, (c) collection of tree core samples of the teak tree using increment borer and (d) collection of a cross-section of the teak tree from the already felled tree.
2.3. Data Acquisition and Tree-Ring Chronology Development
The tree core samples were air-dried and then mounted on the wooden mounts. The cross-sections were cut into small sections from different radii for observation under the microscope. We sanded all the samples with progressively finer sandpapers (120, 240, 400, 600 and 800 grit) to make the growth rings visible under the microscope. Each tree-ring of the samples was cross-dated using skeleton plotting techniques [59] to assign the calendar year of its formation. The ring width measurement of each ring was measured using the Velmex measurement system and Measure J2X version 4.2 with a precision of 0.001 mm [60,61]. The quality of the measurements and assigned calendar dates of the tree rings were verified using the COFECHA program [62] and in the C-Dendro computer software version 9.6 [63]. We discarded the samples with low correlation to the master series to improve the results and ensure error-free cross-dating. Fifty-four cores from 25 trees at the BGB site and fifty-seven cores from 27 trees at the RGB site, all showing strong standard signals based on mean series correlation with the master, were selected for further study. We standardized the tree-ring width time series of both sites using the Friedman variable-span super-smoother to remove non-climatic trends related to age, size and stand dynamics [58]. The method of Friedman variable-span super-smoother effectively models growth curves of perturbed tree-ring series that do not evolve homogeneously over time [64]. We applied a power transformation to both series before standardization to stabilize variance [65]. We then developed two tree-ring chronologies using the bi-weight average. Finally, we calculated tree-ring chronology statistics for both sites, including standard deviation (SD), mean sensitivity (MS) and expressed population signal (EPS). The standardization was carried out in the computer program ARSTAN [66].
2.4. Climate, Drought and Soil-Moisture Records
Various climate variables are necessary to assess the influence of climate on radial growth and to facilitate possible climate reconstruction beyond the existing instrumental data. Climate datasets covering larger spatial extents, such as gridded datasets, are more suitable for assessing regional climate variability [67,68]. Thus, helping to derive the regional climate’s influence on the radial growth of trees. Therefore, for the present study, we procured daily gridded temperature and rainfall records covering 18.5° N to 23.5° N and 80.5° E to 83.5° E, consisting of 17 grids with a spatial resolution of 1 × 1-degree latitude and longitude from the Indian Meteorological Department, IMD [69,70]. The temperature and rainfall datasets cover the period from 1951 to 2023 CE (73 years). We converted the daily datasets into average monthly temperature and total monthly rainfall for each of the 17 grids. We performed the data extraction and calculations using the Climate Data Operator (CDO) computer program [71].
Additionally, we considered other climatic variables to supplement the relationship with radial growth data. We calculated a drought index dataset, the Standardized Precipitation Evapotranspiration Index for 1 month (SPEI-1) [72], for each of the 17 grids (Figure 1) using gridded monthly rainfall and temperature records from IMD. The SPEI, a multiscale drought index, is generally used to determine the onset, duration and magnitude of drought conditions relative to normal conditions. We calculated SPEI based on the Hargreaves method, using rainfall, potential evapotranspiration and minimum and maximum temperature. We performed these calculations in the R Environment version 4.2.1 [73] using the package “SPEI.” We also used global gridded soil moisture data from the Famine Early Warning Systems Network (FEWS NET) Land Data Assimilation System (FLDAS) [74] at 0.1 × 0.1-degree resolution. This soil moisture dataset, available from 1982 to 2018 CE, was hosted on KNMI Climate Explorer (https://climexp.knmi.nl/, accessed on 1 December 2024). We extracted the data for Chhattisgarh by masking the state boundary, which provided data points for 1177 grids [74] (Figure S1). We performed the data extraction in the R Environment version 4.2.1 [73] using the package “raster.”
2.5. Climate, Drought and Soil Moisture Response on Radial Growth of Teak
We performed climate growth analyses using simple Pearson correlation between monthly climate variables (temperature and rainfall) and SPEI–1 for the 17 individual IMD climate grids (Figure 1). After establishing spatial correlations with monthly climate data from October of the previous year through December of the current year, we further assessed the daily climatic response for the grid closest to the sampling site. This step allowed us to evaluate the response observed in the monthly climate analysis. We carried out the daily climate response analysis using the daily_response() function from the package “dendroTools” [75,76] in the R Environment version 4.2.1 [73]. In this analysis, we calculated correlation coefficients for window widths ranging from 21 to 365 days, using the shortest window of 21 days to assess the day-wise effect of climate on tree growth. For the monthly response, we calculated Pearson correlation coefficients between ring width and climatic variables for each month and for consecutive periods of 2 to 12 months. In the daily response analysis, we computed correlations for the current and previous year to identify the most significant daily time span and season affecting tree growth. Details of the daily_response() function are provided in Jevšenak (2019) [76]. We conducted correlation analyses for the periods 1979–2022 CE at the BGB site and 1952–2022 CE at the RGB site. For the soil moisture data, we performed monthly correlation analyses from January to December for all 1177 FLDAS soil moisture grid points. We calculated correlations between soil moisture and tree-ring chronologies of BGB and RGB sites for the period 1982–2018 CE.
2.6. Reconstruction Methodology
We selected significant climatic variables for reconstruction based on correlation function analysis. We reconstructed the target climate variable using transfer function analysis with a simple linear regression model [57], where the standard tree-ring chronology served as the predictor and seasonal climate as the predictand. We evaluated the reliability of the calibration model using calibration–validation statistics calculated through a “leave-one-out” validation approach [77]. In this approach, we removed one observation from the calibration set and repeated cross-validation at each step to reconstruct the omitted observations. We calculated various calibration verification statistics, including the coefficient of determination (R2), the adjusted coefficient of determination (adjusted R2), the Fisher test (F), the reduction in error (RE) and the root mean square error (RMSE), among others [57,78]. We further validated our reconstruction by comparing it with long-term climate datasets, including regional mean temperature for Chhattisgarh from CRU (1920–2022 CE) [79], rainfall data from the Chhattisgarh meteorological subdivision (1920–2022 CE) [80] and tree-ring-based monsoon rainfall reconstructions from a nearby region (1920–1997 CE) [18]. We conducted temporal comparisons for both the annual and 10-year low-pass filtered time series and calculated correlation values.
3. Results
3.1. Tree-Ring Features and Chronologies
The teak samples collected from the study sites displayed clear annual rings and were differentiated based on the distribution of the pore size. False rings were observed in a few samples. Additionally, missing rings were observed in some samples. Cross-dating was successfully performed on 54 samples from the BGB site and 57 samples from the RGB site. Both sites exhibited a high level of inter-series correlation with their master series, which were 0.569 for BGB and 0.532 for RGB. Two tree-ring chronologies were developed based on the successfully cross-dated samples from both sites. The chronological time span for the BGB site is from 1978 to 2022 CE (45 years), while the RGB site’s chronology extends from 1920 to 2022 CE (103 years) (Figure 3). These chronologies demonstrated moderate standard deviation and high mean sensitivity. No significant first-order autocorrelation (BGB, 0.039 and RGB, −0.015) was observed, allowing for the use of standard chronologies in further analysis. The EPS [81] values for the BGB and RGB sites were 0.973 and 0.937, respectively. The tree-ring chronology statistics of both sites are presented in Table 1. The correlation between the two chronologies during the common period (1978–2022 CE) was 0.212 (n = 45, p > 0.05).
Figure 3.
Tree-ring chronologies of teak from two sites, BGB and RGB. The BGB tree-ring chronology extends from 1978 to 2022 CE, and the RBG tree-ring chronology extends from 1920 to 2022 CE.
Table 1.
Tree-ring chronology statistics of teak from Chhattisgarh, Central India.
3.2. Response of Climate, Drought and Soil Moisture on Tree Growth
The spatial correlation of the monthly climate data (average temperature and total rainfall) across 17 grids, along with the SPEI–1 index and the tree-ring chronology of sites BGB and RGB, is illustrated in Figures S2–S5 for the BGB site and Figures S6–S9 for the RGB site (Table 2). At the BGB site, the tree-ring chronology shows a negative correlation with average gridded temperatures from June to August and a positive correlation with rainfall and the SPEI–1 index from June to October of the current year (Figure 4). For the RGB site, the tree-ring chronology similarly demonstrates a negative correlation with average gridded temperatures from April to July. In the case of rainfall and SPEI–1, the correlations are positive with May and June of the current year (Figure 5). The correlation analysis between gridded soil moisture data across the Chhattisgarh region and the tree-ring chronologies from our study sites revealed a positive association (Figure 4 and Figure 5). The BGB tree-ring chronology showed a positive correlation with the average soil moisture levels from April to December (Figure 4). Additionally, the average soil moisture from February to October showed a significant and strong positive correlation with the RGB tree-ring chronology (Figure 5).
Table 2.
Correlation coefficient of growth of teak with monthly and daily gridded climate data.
Figure 4.
Spatial correlation of significant (p <0.05) climatic variables (a) June–August average temperature, (b) July–October total rainfall, (c) July–October average SPEI–1 and (d) January–December average soil moisture with tree-ring chronology of BGB. The correlation time period for (a–c) is from 1982 to 2022 CE, and for (d) it is from 1979 to 2018 CE. The correlation between climatic variables and the tree-ring chronology of BGB, carried out for individual months, is shown in Supplementary Figures S2–S5. The tree-ring sampling site of BGB is shown as (yellow * mark).
Figure 5.
Spatial correlation of significant (p <0.05) climatic variables (a) April–July average temperature, (b) May–June total rainfall, (c) May–June average SPEI–1 and (d) February–October average soil moisture with tree-ring chronology of RGB. The correlation time period for (a–c) is from 1952 to 2022 CE, and for (d) it is from 1982 to 2018 CE. The correlation between climatic variables and the tree-ring chronology of RGB, carried out for individual months, is shown in Supplementary Figures S6–S9. The tree-ring sampling site of RGB is shown as (yellow * mark).
The correlation between daily climatic variables and tree-ring chronologies aligns well with the correlations observed using monthly climate data. The analysis of tree-ring chronologies from this study shows a positive association with daily rainfall and the SPEI–1; and a negative association with temperature (Figures S10–S15). Specifically, the correlation between daily temperature and the tree-ring chronology of the BGB is −0.402 for the period from 20 June to 10 August, using a window width of 52 days (Figure 6). In contrast, the correlations for daily rainfall and SPEI–1 are 0.534 and 0.509, respectively (Figure 6). The optimal time period for these correlations is from 8 July to 5 October, with a window width of 90 days. For the tree-ring chronology of the RGB, the daily temperature correlation is −0.463 from 20 April to 8 July, within a window width of 80 days (Figure 7). The daily rainfall and SPEI–1 correlation for this timeframe is 0.381 and 0.402, respectively. The optimal period here is from 4 May to 2 July, with a window width of 60 days (Table 2).
Figure 6.
Heatmap showing the influence of daily climate (a) temperature, (b) rainfall and (c) SPEI–1 on radial growth of teak for site BGB. The day of the year on the x-axis represents the starting day of the year and subsequent days of the respective window width. The white areas in all (a–c) are due to the removal of insignificant calculations (remove_insignificant) argument in the daily_response() was set to TRUE). The temporal pattern of the daily climate growth relationship for site BGB is also in Supplementary Figures S10–S12.
Figure 7.
Heatmap showing the influence of daily climate (a) temperature, (b) rainfall and (c) SPEI–1 on radial growth of teak for site RGB. The day of the year on the x-axis represents the starting day of the year and subsequent days of the respective window width. The white areas in all (a–c) are due to the removal of insignificant calculations (remove_insignificant) argument in the daily_response() was set to TRUE). The temporal pattern of the daily climate growth relationship for site BGB is also in Supplementary Figures S13–S15.
3.3. Soil Moisture Reconstruction
The correlation between soil moisture and the RGB tree-ring chronology is higher and more consistent than that of the BGB chronology (Figure 4 and Figure 5). Therefore, we selected the RGB standard tree-ring chronology for February–October soil moisture reconstruction. The transfer function model explained 30.3% of the variance in soil moisture and an adjusted R-squared of 28% during the calibration period (1982–2018 CE). A positive reduction in error (RE = 0.21) confirmed the model’s predictive skill. The root mean square error (RMSE = 0.0072) was slightly higher than the standard error of estimate (0.0070) during the calibration period (1982–2014 CE). The Durbin–Watson statistic (2.12) indicated no autocorrelation in the regression residuals. A positive product mean test (1.50) demonstrated the significant accuracy of the tree-ring-based estimates. In contrast, the sign test (23 positive and 10 negative) confirmed a good fit between predicted and observed values. Furthermore, the F–statistic value (13.47) supported the robustness of the reconstruction model. All these statistical results verified the reliability and stability of the transfer function model. Based on this robust model, we reconstructed the average soil moisture for February to October over the period extending back to 1920 CE (Figure 8). The reconstructed soil moisture captured several significant drought years such as 1921, 1940, 1950, 1952, 1954, 1958, 1973, 1980, 1992, 2009 and 2018 (Figure 8). The reconstructed record also captured droughts occurring between 2000 and 2018, specifically in 2000, 2003, 2009, 2012, 2016 and 2018, with the 2009 drought identified as the most intense in this region. The validation of our soil moisture reconstruction with temperature [79], rainfall [80] and reconstructed rainfall [18] (Figure 9) shows a significant negative correlation between average April–June temperature and reconstructed soil moisture (annual: −0.437; 10-year low-pass: −0.468). In contrast, reconstructed soil moisture showed significant positive correlations with total April–June rainfall in the Chhattisgarh meteorological subdivision (annual: 0.316; 10-year low-pass: 0.338) (Figure 9). The positive relationship between reconstructed soil moisture and tree-ring-based monsoon rainfall reconstruction from Shah et al. (2007) [18] was also observed, and the correlation strengthened when using 10-year low-pass filtered data (0.361) compared to the annual series (0.196).
Figure 8.
Reconstruction of February–October average soil moisture from 1920 to 2022 CE for Chhattisgarh based on the tree-ring chronology of site RGB.
Figure 9.
Comparison of the soil moisture reconstruction from the present study with (a) regional mean temperature covering Chhattisgarh based on CRU datasets [79] for 1920–2022 CE, (b) rainfall of Chhattisgarh meteorological subdivision from IMD [80] for 1920–2022 CE and (c) tree-ring-based monsoon season’s rainfall reconstruction from the adjoining region [18] for 1920–1997 CE. The left panel of the figure is a comparison of the annual time series, and the right panel is for the 10-year low-pass filter time series data. The (*) marked values are significant for 95% CL.
4. Discussion
The correlation between the BGB and RGB tree-ring chronology is relatively low, likely due to the spatial separation of the sites and differences in local climatological settings. In addition, the occurrence of false rings in some samples may reflect physiological disturbances in tree growth, which can obscure the common climate signal [10]. Furthermore, the BGB tree-ring chronology is derived from a plantation plot, whereas the RGB chronology represents naturally grown trees. Differences in stand structure, management history and growth conditions between plantation and natural forests may further weaken the correlation between the two chronologies.
The response of climatic variables, drought and soil moisture used in the present study on radial growth of teak suggests that drought and soil moisture availability are primary limiting factors for teak growth in this region, as demonstrated by the negative response to temperature and the positive association with rainfall during the growing season. The direct impact of soil moisture on the tree growth further supports this interpretation. Previous studies on tree rings in teak across India have shown similar positive responses to rainfall [18,21,30] and drought [22], particularly during the southwest monsoon season. The positive correlations of SPEI–1 with teak growth in this study provide further evidence that moisture availability significantly affects the radial growth of teak trees. Furthermore, the overall analysis using daily climate data reinforces the climate responses observed with monthly climate data regarding teak tree growth in the study region. Notably, the daily climatic responses showed higher correlations compared to those determined from monthly data. Additionally, the specific dates that significantly influence the radial growth of teak trees were identified through the daily climatic analysis.
The role of temperature as a factor influencing teak tree growth is highlighted by the correlation between average temperature and the radial growth of teak. Extremely high temperatures reduce teak growth by increasing evapotranspiration and evaporation. The elevated evapotranspiration decreases photosynthesis and stomatal conductance [34,82,83]. Consequently, teak trees consume stored food faster than it can be replenished, leading to moisture stress during growth [20,34,84]. Due to regional variations in environmental variables (such as temperature and precipitation) at both sites, slight differences in the results are observed. At the RGB site, the correlation between temperature and the SPEI–1 is stronger than that with precipitation. This suggests that the radial growth of teak from 29 March to 14 July is primarily influenced by high rates of evapotranspiration from the soil caused by elevated temperatures. During the summer monsoon season, soil replenishment leads to no significant radial growth at this site. In contrast, conditions at the BGB site are different. Here, the radial growth of teak is more strongly correlated with precipitation and the SPEI rather than temperature, indicating that growth in this region is primarily limited by moisture availability. The RGB site is topographically steeper than the BGB site, which contributes to moisture stress in the root zone and negatively impacts teak growth. Local factors, along with ecological parameters such as the position of trees, competition among trees and other metabolic activities, can further constrain the trees’ growth responses to increased moisture conditions [19,85]. Consistent discrepancies in the teak tree growth have been observed across different sites in Madhya Pradesh, Central India, particularly between the higher elevation sites of Bori and Sajpur and the low-lying plain area of Edugurapalli. It was observed that the Bori chronology fails to capture monsoon and annual rainfall signals, in contrast to the Sajpur and Edugurapalli chronologies. This highlights their variable responses to environmental factors such as the moisture index, temperature and precipitation [19]. Furthermore, multiple studies have confirmed that teak cambial activity differs significantly across various localities or forests [30,86]. In Thailand and Myanmar, teak growth is positively correlated with rainfall from March to May and from May to July [86,87,88,89,90,91,92,93,94]. Additionally, Indonesian teak has shown a significant positive relationship with growth during the transition from dry to wet seasons [95].
Previous studies across central and peninsular India have firmly established the dendroclimatic potential of teak. Bhattacharyya et al. (1992) [10] analyzed a teak tree-ring width chronology from Dahanu, Maharashtra, spanning the period from 1764 to 1985 CE, and demonstrated its potential for drought reconstruction in peninsular India. Similarly, Shah et al. (2007) [18] developed a 163-year (1835–1997 CE) chronology from Hoshangabad, central India, and reported a strong positive correlation between teak tree-ring width and southwest monsoon rainfall, enabling the reconstruction of June–September precipitation back to 1835 CE. Most dendroclimatic studies on teak from central and peninsular India have identified moisture availability as the dominant limiting factor for radial growth. Borgaonkar et al. (2007) [16] developed teak chronologies from Tolawada (1654–2001 CE), Bori (1884–2001 CE) and Narangatharai (1481–2003 CE) and found significant positive correlations with pre-monsoon and monsoon rainfall. Their study emphasized that soil moisture at the root zone, rather than direct rainfall, governs teak growth, making the moisture index a more realistic indicator of growth conditions. Ram et al. (2008) [20] constructed three teak chronologies from Sajpur (1919–2000 CE), Bori (1857–2001 CE) and Edugurapalli (1827–2000 CE) in central India and observed strong positive correlations between the moisture index, rainfall and teak growth during the monsoon and annual periods. They found no significant influence of temperature on growth, supporting earlier findings by Borgaonkar et al. (2007) [16] that highlighted the critical role of root zone moisture in sustaining teak growth. Further evidence from Allapalli, Maharashtra, indicated that teak growth correlated more strongly with the Palmer Drought Severity Index during the winter season (October–March) than with precipitation or temperature [21,23]. The study also identified low-growth years associated with El Niño events, suggesting that winter soil moisture availability primarily controls growth in this region.
The studies from the southern and central Indian region [17,22,24] found a moderate negative relationship between teak growth and summer temperature but a strong positive response to monsoon rainfall, indicating reduced summer rainfall and intensified monsoon precipitation. Stable isotope studies [28,29] further strengthened these findings. They also highlighted the roles of relative humidity and soil moisture in controlling teak radial growth. These climatic influences were linked to the seasonal migration of the ITCZ, suggesting that teak tree-ring width and δ18O records can serve as valuable archives for reconstructing past monsoon variability. Overall, previous research consistently demonstrates that teak growth across central and peninsular India is primarily limited by moisture availability, influenced by rainfall variability, soil moisture dynamics and large-scale climatic oscillations such as ENSO and the ITCZ movement.
Drought event years marked in reconstructed soil moisture align closely with those documented in previous studies from this region: 1921 [96]; 1950, 1952, 1954, 1958 and 1973 [97]; and 1980 [98]. This consistency validates the reliability of our reconstruction. Previous studies [96,99,100,101] attributed the 2009 drought to excessive surface heating [102], which resulted in soil moisture depletion, reduced precipitation and increased evapotranspiration [103]. Two extended periods of rainfall deficit during the peak monsoon season further exacerbated this event in central India [104]. The first prolonged dry spell occurred in June, caused by desert air intrusion from western Asia into central India [105]. The second dry period happened in July and August as Madden–Julian Oscillation activity over the eastern Pacific generated convectively coupled planetary-scale equatorial Rossby waves. These waves propagated westward into the ISM domain, interacting with intra-seasonal oscillations, which prolonged the suppressed convection phase [104]. As a result, these atmospheric processes created a significant dry spell during the ISM, leading to a seasonal rainfall deficit of approximately 21.6% [105]. The alignment of these reconstructed drought years with independent meteorological and historical evidence emphasizes the robustness of the soil moisture reconstruction and its potential to identify past hydroclimatic extremes in central India.
The summer monsoon season replenishes soil moisture across this region; however, high evapotranspiration rates driven by positive temperature anomalies often deplete soil moisture rapidly, contributing to drought development. Rapid soil moisture loss thus emerges as a primary cause of drought in this region. The 2018 drought was the most severe hydrological drought during the monsoon period from 2015 to 2018 [96]. This event primarily affected eastern and northeastern India, with broader implications for the central regions of the country. The drought sequence began in 2015 following deficient monsoon precipitation in both 2014 and 2015. Initially, the 2015 drought affected the Indo-Gangetic Plain and northeastern India, persisting into 2016 and extending across Maharashtra and parts of central India. The strong positive Niño 3.4 anomaly during 2015–2016 [106] significantly altered global weather patterns and acted as the dominant driver of widespread drought across India, including central India. The reconstructed record also captured the 2000 drought, which ranked among the most severe meteorological droughts in India. This event began in September 2000, peaked in June 2003 and subsided by September 2003 [96,107]. The drought was triggered by a substantial rainfall deficit during the southwest monsoon season [108,109], severely impacting the central, western and northwestern regions of the country. These findings collectively indicate that both local factors, such as soil moisture dynamics and evapotranspiration, and large-scale climatic drivers, including El Niño–Southern Oscillation (ENSO) events, play critical roles in shaping drought patterns in central India. Rainfall deficits during the southwest monsoon season likely caused the recent droughts identified in the reconstructed soil moisture record. The long-term climate trend indicates that mean monsoon temperature anomalies were negative before 1980 but have become positive and continued to increase since then [110]. Located along the Tropic of Cancer, Chhattisgarh experiences some of the highest temperatures in India, with April to June being the hottest months.
Rising atmospheric temperatures in this region can be attributed to anthropogenic warming, increased sea surface temperatures and changes in large-scale atmospheric circulation [111]. These factors intensify pre-monsoon heating, often resulting in heatwave conditions. Elevated temperatures combined with rainfall deficits accelerate soil moisture depletion, which in turn amplifies drought severity. Reduced soil moisture exerts negative feedback on evapotranspiration, limiting the supply of humidity to the lower atmosphere. This suppression of moisture exchange results in a drier, more stagnant atmosphere, further weakening monsoon precipitation [111]. Because soil moisture–precipitation interactions are inherently local and depend on regional climatic and meteorological conditions, their effects can vary significantly across different areas [111]. Over recent decades, rising temperatures have progressively dried the atmosphere, intensifying the frequency and severity of droughts across central India [112,113]. These findings suggest that the combined effects of anthropogenic warming, monsoon rainfall variability and soil–atmosphere feedbacks contribute to the observed increase in drought intensity in the region.
Anthropogenic impacts on the global water cycle have intensified extreme precipitation events worldwide. Studies examining the dependence of soil moisture on precipitation highlight the dynamic interplay between precipitation extremes and soil moisture anomalies [114]. In India, seasonal variability in soil moisture–precipitation feedbacks reflects the complex interactions between land and atmosphere, as well as the partitioning of energy fluxes into latent heat components. Using the convective triggering potential and low-level humidity index framework, Huggannavar and Indu (2020) [115] identified a dominant dry regime in central and western India, as well as a wet regime in southern India. Their study revealed that central India experiences a dry regime during the pre-monsoon season, while south India maintains a wet advantage. However, during the southwest monsoon, atmospheric processes driven by large-scale advective moisture dominate, causing the central India dry regime to retreat, whereas the northwestern dry regime persists. Chawang et al. (2022) [116] utilized the Noah-MP land surface model to assess the impact of various precipitation input products, including IMERG, CHIRPS, GDAS, MERRA2 and MERRA2–C, on soil moisture and soil temperature simulations across diverse soil types in India. Their results demonstrated that the temporal resolution of precipitation forcing had a greater influence on model accuracy than the spatial resolution, particularly when the spatial scale of the domain and the precipitation input were comparable in size. Collectively, these studies suggest that anthropogenic climate change, regional precipitation variability and local land–atmosphere feedbacks have a significant impact on soil moisture dynamics in India. Understanding these interactions is critical for assessing drought risks and predicting hydroclimatic extremes in central and southern India.
Elevated temperatures during the pre-monsoon to early monsoon period increase soil temperatures, which in turn enhance evapotranspiration and reduce soil moisture, explaining the observed negative association between April–June temperature and reconstructed soil moisture (Figure 9). In contrast, the positive association between reconstructed soil moisture and rainfall (Figure 9) indicates that increased pre-monsoon precipitation replenishes soil moisture depleted during the preceding hot and dry months, thereby providing essential water for teak trees. This restored soil moisture breaks cambial dormancy and initiates new radial growth. This replenishment facilitates the breaking of cambial dormancy and initiates new radial growth. The positive relationship between reconstructed soil moisture and tree-ring-based monsoon rainfall reconstructions from Shah et al. (2007) [18] further supports these findings. The correlation is stronger in the 10-year low-pass filtered data than in the annual series, underscoring the importance of long-term rainfall variability in sustaining soil moisture. Moreover, climate change influences soil formation and evolution by altering organic matter availability, temperature and water regimes [117]. Therefore, maintaining long-term soil moisture records is crucial for planning and implementing sustainable management strategies for both natural and plantation teak forests.
5. Conclusions
Based on the monthly and daily climatic response of tree-ring chronologies of teak (Tectona grandis) from the northern region of Chhattisgarh, central India, it was observed that the radial growth of teak is influenced by moisture availability. Correlation analysis between daily climatic variables and tree-ring chronology aligns with the analysis conducted using monthly climate data. This study successfully reconstructed soil moisture data for an additional 62 years (1920–1981 CE), extending beyond the existing soil moisture records of Chhattisgarh. The reconstructed soil moisture record is consistent with the existing database of drought records from central India. This reconstruction, conducted in a monsoon-dominated region, highlights the potential of teak tree rings to study long-term soil moisture variability in central India and assess the hydroclimatic dynamics of the area. Future studies involving older teak samples could extend this reconstruction further, enhancing our understanding of the long-term effects of climate change on the hydrodynamics of the region, which could benefit agricultural productivity and human settlements. Tree rings preserve clear records of past climate extremes, including droughts and floods. These records enable the identification of long-term environmental trends that influence crop productivity and water availability. Such insights can support communities and policymakers in developing more resilient land-use strategies and climate-adaptive infrastructure. Moreover, understanding how past climate variability shaped human settlement patterns provides valuable context for anticipating future challenges and promoting more sustainable planning and resource management.
Supplementary Materials
The following supporting information can be downloaded at: https://www.mdpi.com/article/10.3390/quat9010008/s1, Figure S1: Map of Chhattisgarh showing soil moisture grid points (grids 1 to 1177) of the FLDAS [74] along with teak tree-ring sampling sites, BBG and RGB; Figure S2: Spatial correlation of average temperature with tree-ring chronology of BGB for 1978–2022 CE from the previous October (O*) to the current December (D) along with the most significantly correlated season, i.e., average June–August (JA). The tree-ring sampling site of BGB is shown as (yellow * mark in the last figure, i.e., bottom right corner); Figure S3: Spatial correlation of monthly rainfall with tree-ring chronology of BGB for 1978–2022 CE from the previous October (O*) to the current December (D) along with the most significantly correlated season, i.e., total July–October (JO). The tree-ring sampling site of BGB is shown as (yellow * mark in the last figure, i.e., bottom right corner); Figure S4: Spatial correlation of monthly SPEI-1 with tree-ring chronology of BGB for 1978–2022 CE from the previous October (O*) to the current December (D) along with the most significantly correlated season, i.e., average July–October (JO). The tree-ring sampling site of BGB is shown as (yellow * mark in the last figure, i.e., bottom right corner); Figure S5: Spatial correlation of monthly soil moisture with tree-ring chronology of BGB for 1978–2022 CE from January (J) to December (D) of the current year along with the most significantly correlated season, i.e., average January–December (JD). The tree-ring sampling site of BGB is shown as (yellow * mark in the last figure, i.e., bottom center); Figure S6: Spatial correlation of average temperature with tree-ring chronology of RGB for 1952–2022 CE from the previous October (O*) to the current December (D) along with the most significantly correlated season, i.e., average April–July (AJ). The tree-ring sampling site of BGB is shown as (yellow * mark in the last figure, i.e., bottom right corner); Figure S7: Spatial correlation of total rainfall with tree-ring chronology of RGB for 1952–2022 CE from the previous October (O*) to the current December (D) along with the most significantly correlated season, i.e., total May–June (MJ). The tree-ring sampling site of RGB is shown as (yellow * mark in the last figure, i.e., bottom right corner); Figure S8: Spatial correlation of SPEI-1 with tree-ring chronology of RGB for 1952–2022 CE from the previous October (O*) to the current December (D) along with the most significantly correlated season, i.e., total May–June (MJ). The tree-ring sampling site of RGB is shown as (yellow * mark in the last figure, i.e., bottom right corner); Figure S9: Spatial correlation of monthly soil moisture with tree-ring chronology of BGB for 1978–2022 CE from January (J) to December (D) of the current year along with the most significantly correlated season, i.e., average February–October (FO). The tree-ring sampling site of BGB is shown as (yellow * mark in the last figure, i.e., bottom center); Figure S10: Response of the daily temperature of the nearest grids of the tree-ring sampling site with tree-ring chronology of BGB for 1979–2022 CE using daily_response() function in the dendroTools package [75] in R environment [73]. The upper panel graph highlights the optimal window with the highest significant negative correlation (−0.438, p < 0.05), and the lower panel shows a heatmap of the temporal relationships; Figure S11: Response of the daily rainfall of the nearest grids of the tree-ring sampling site with tree-ring chronology of BGB for 1979–2022 CE using daily_response() function in the dendroTools package [75] in R environment [73]. The upper panel graph highlights the optimal window with the highest significant positive correlation (0.534, p < 0.05), and the lower panel shows a heatmap of the temporal relationships; Figure S12: Response of the daily SPEI-1 of the nearest grids of the tree-ring sampling site with tree-ring chronology of BGB for 1978–2022 CE using daily_response() function in the dendroTools package [75] in R environment [73]. The upper panel graph highlights the optimal window with the highest significant positive correlation (0.509, p < 0.05), and the lower panel shows a heatmap of the temporal relationships; Figure S13: Response of the daily temperature of the nearest grids of the tree-ring sampling site with tree-ring chronology of RGB for 1952–2022 CE using daily_response() function in the dendroTools package [75] in R environment [73]. The upper panel graph highlights the optimal window with the highest significant negative correlation (−0.463, p < 0.05), and the lower panel shows a heatmap of the temporal relationships; Figure S14: Response of the daily rainfall of the nearest grids of the tree-ring sampling site with tree-ring chronology of RGB for 1952–2022 CE using daily_response() function in the dendroTools package [75] in R environment [73]. The upper panel graph highlights the optimal window with the highest significant positive correlation (0.381, p < 0.05), and the lower panel shows a heatmap of the temporal relationships; Figure S15: Response of the daily SPEI-1 of the nearest grids of the tree-ring sampling site with tree-ring chronology of RGB for 1952–2022 CE using daily_response() function in the dendroTools package [75] in R environment [73]. The upper panel graph highlights the optimal window with the highest significant positive correlation (0.402, p < 0.05), and the lower panel shows a heatmap of the temporal relationships.
Author Contributions
Conceptualization, S.K.S. and N.M.; methodology, S.K.S. and D.; software, S.K.S. and D.; validation, S.K.S. and N.M.; formal analysis, S.K.S., N.M. and D.; investigation, S.K.S.; resources, S.K.S.; data curation, S.K.S. and D.; writing—original draft preparation, S.K.S., D., N.M. and M.S.; writing—review and editing, S.K.S., D., N.M. and M.S.; visualization, S.K.S.; supervision, S.K.S. and M.S.; project administration, S.K.S. All authors have read and agreed to the published version of the manuscript.
Funding
Funding was received by the lead author (Deeksha) through the Department of Science and Technology, New Delhi, India, under a DST INSPIRE fellowship (IF 190790) to pursue a Ph.D.
Data Availability Statement
The data that support the findings of this study are available from the corresponding author upon request.
Acknowledgments
The authors thank the Director, Birbal Sahni Institute of Palaeosciences, Lucknow, for encouraging and granting permission to publish this work. This work was carried out under Project 8—QLDP (Quaternary Lake Drilling Project) of Birbal Sahni Institute of Palaeosciences, Lucknow, India (BSIP/RDCC/44/2025–26). The Department of Science and Technology, New Delhi, supported the author Deeksha under the DST–INSPIRE Fellowship (project number IF 190790). Authors (S.K.S. and Deeksha) also thank the Chhattisgarh Forest Department officials for permitting us to collect tree core samples. Author SKS would like to extend his special thanks to Sunil Bacchan, SDO, Bilaspur Circle, for providing the necessary help from the forest department and additional support when he was in Chhattisgarh. The authors (Deeksha and S.K.S.) would also like to thank forest officials Vaibhav Sahu, Mukesh Bhardwaj, Govinda Verma and Jagdeesh Rathiya for accompanying us in the field area of the BGB site. The authors (Deeksha and S.K.S.) also thank forest official Rakesh Choubey, SDO, and Vijayant Tiwari, RFO, Balodabazaar circle, for providing necessary help and permission, and Lalit Kumar Som for providing help and accompanying them in the field area of the RGB site. The author (S.K.S.) would like to thank Shashi Tandon and Krishna Tandon for the informative and necessary help provided during the fieldwork period. The authors thank the Indian Meteorological Department (IMD), Pune, for providing the gridded climate data. Author SKS thanks Jernej Jevšenak for providing the R code to analyze the daily response of SPEI with tree-ring data. The author, Deeksha, would like to thank the Department Head, Department of Geology, CAS, Lucknow University, for his encouragement and support. The authors are indebted to all three anonymous reviewers for their critical comments and detailed insights to improve the manuscript.
Conflicts of Interest
The authors declare no conflicts of interest.
References
- Krishnamurthy, V.; Kinter, J.L. The Indian Monsoon and its Relation to Global Climate Variability. In Global Climate; Rodó, X., Comín, F.A., Eds.; Springer: Berlin/Heidelberg, Germany, 2003; pp. 186–236. [Google Scholar] [CrossRef] [Scilit]
- Swamy, S.L. Estimation of Net Primary Productivity (NPP) in an Indian Tropical Evergreen Forest Using Remote Sensing Data. Ph.D. Thesis, Jawaharlal Nehru Technology University, Hyderabad, India, 1998. [Google Scholar]
- Thakur, T.K.; Patel, D.K.; Dutta, J.; Kumar, A.; Kaushik, S.; Bijalwan, A.; Fnais, M.S.; Abdelrahman, K.; Ansari, M.J. Assessment of decadal land use dynamics of upper catchment area of Narmada River, the lifeline of Central India. J. King Saud Univ. Sci. 2020, 33, 101322. [Google Scholar] [CrossRef] [Scilit]
- Pan, Y.; Birdsey, R.A.; Fang, J.; Houghton, R.; Kauppi, P.E.; Kurz, W.A.; Phillips, O.L.; Shvidenko, A.; Lewis, S.L.; Canadell, J.G.; et al. A large and persistent carbon sink in the world’s forests. Science 2011, 333, 988–993. [Google Scholar] [CrossRef] [Scilit]
- IPCC. Climate Change and Land: An IPCC Special Report on Climate Change, Desertification, Land Degradation, Sustainable Land Management, Food Security, and Greenhouse Gas Fluxes in Terrestrial Ecosystems; Intergovernmental Panel on Climate Change (IPCC): Geneva, Switzerland, 2019. [Google Scholar]
- Swamy, S.L.; Darro, H.; Mishra, A.; Lal, R.; Kumar, A.; Thakur, T.K. Carbon stock dynamics in a disturbed tropical forest ecosystem of Central India: Strategies for achieving carbon neutrality. Ecol. Indic. 2023, 154, 110775. [Google Scholar] [CrossRef] [Scilit]
- Bhattacharyya, A.; Shah, S.K. Tree-ring studies in India past appraisal, present status and future prospects. IAWA J. 2009, 30, 361–370. [Google Scholar] [CrossRef] [Scilit]
- Shah, S.K.; Bhattacharyya, A.; Mehrotra, N. Tree–ring studies from eastern Himalaya: Prospects and challenges. Himal. Res. J. 2014, 2, 76–87. [Google Scholar]
- Shah, S.K.; Mehrotra, N. Tree–ring studies of Toona ciliata from subtropical wet hill forests of Kalimpong, eastern Himalaya. Dendrochronologia 2017, 46, 46–55. [Google Scholar] [CrossRef] [Scilit]
- Bhattacharyya, A.; Yadav, R.R.; Borgaonkar, H.P.; Pant, G. Growth-ring analysis of Indian tropical trees: Dendroclimatic potential. Curr. Sci. 1992, 62, 736–741. [Google Scholar]
- Cardoso, S.; Sousa, V.B.; Quilhó, T.; Pereira, H. Anatomical variation of teakwood from unmanaged mature plantations in East Timor. J. Wood Sci. 2015, 61, 326–333. [Google Scholar] [CrossRef] [Scilit]
- Tripati, S.; Shukla, S.R.; Shashikala, S.; Sardar, A. Teak (Tectona grandis L.f.): A preferred timber for shipbuilding in India as evidenced from shipwreckes. Curr. Sci. 2016, 110, 2160–2165. [Google Scholar] [CrossRef] [Scilit]
- Berlage, H.P. Over het verband tusschen de dikte der jaarringen van djatiboomen (Tectona grandis L. f.) en den regenval op Java. Tectona 1931, 24, 939–953. [Google Scholar]
- Worbes, M. One hundred years of tree-ring research in the tropics: A brief history and an outlook to future challenges. Dendrochronologia 2002, 20, 217–231. [Google Scholar] [CrossRef] [Scilit]
- Pumijumnong, N. Dendrochronology in Southeast Asia. Trees 2013, 27, 343–358. [Google Scholar] [CrossRef] [Scilit]
- Borgaonkar, H.P.; Sikder, A.B.; Ram, S.; Kumar, K.R.; Pant, G.B. Dendroclimatological investigation of high altitude Himalayan conifers and tropical teak in India. Korean J. Quat. Res. 2007, 21, 15–25. [Google Scholar]
- Borgaonkar, H.P.; Sikder, A.B.; Ram, S.; Pant, G.B. El Niño and related monsoon drought signals in 523-year-long ring width records of teak (Tectona grandis L.F.) trees from south India. Palaeogeogr. Palaeoclimatol. Palaeoecol. 2010, 285, 74–84. [Google Scholar] [CrossRef] [Scilit]
- Shah, S.K.; Bhattacharyya, A.; Chaudhary, V. Reconstruction of June-September precipitation based on teak (Tectona grandis L.) from Hoshangabad, Madhya Pradesh, India. Dendrochronologia 2007, 25, 57–64. [Google Scholar] [CrossRef] [Scilit]
- Ram, S.; Borgaonkar, H.P.; Munot, A.A.; Sikder, A.B. Tree-ring variation in teak (Tectona grandis L.) from Allapalli, Maharashtra in relation to moisture and Palmer Drought Severity Index. J. Earth Syst. Sci. 2011, 120, 713–721. [Google Scholar] [CrossRef] [Scilit]
- Ram, S.; Borgaonkar, H.P.; Sikder, A.B. Tree-ring analysis of teak (Tectona grandis L. F.) in central India and its relationship with rainfall and moisture index. J. Earth Syst. Sci. 2008, 117, 637–645. [Google Scholar] [CrossRef] [Scilit]
- Ram, S.; Borgaonkar, H.P.; Sikder, A.B. Varying strength of the relationship between tree-rings and summer month moisture index (April–September) over Central India: A case study. Quat. Int. 2010, 212, 70–75. [Google Scholar] [CrossRef] [Scilit]
- Sinha, S.K.; Deepak, M.S.; Rao, R.V.; Borgaonkar, H.P. Dendroclimatic analysis of teak (Tectona grandis L. f.) annual rings from two locations of peninsular India. Curr. Sci. 2011, 100, 84–87. [Google Scholar]
- Ram, S. On the recent strengthening of the relationship between Palmer Drought Severity Index and teak (Tectona grandis L. F.) tree-ring width chronology from Maharashtra, India: A case study. Quat. Int. 2012, 248, 92–97. [Google Scholar] [CrossRef] [Scilit]
- Sengupta, S.; Borgaonkar, H.; Joy, R.M.; Ram, S. Monsoon climate response in Indian teak (Tectona grandis L.f.) along a transect from coast to inland. Theor. Appl. Climatol. 2018, 134, 1197–1205. [Google Scholar] [CrossRef] [Scilit]
- Sengupta, S.; Borgaonkar, H.; Datye, A.; Gajbe, A. Deciphering climate response variation along the Western Ghats of India archived in teak ring width. Theor. Appl. Climatol. 2023, 154, 847–861. [Google Scholar] [CrossRef] [Scilit]
- Managave, S.R.; Sheshshayee, M.S.; Borgaonkar, H.P.; Ramesh, R. Intra-annual oxygen isotope variations in central Indian teak cellulose: Possibility of improved resolution for past monsoon reconstruction. Curr. Sci. 2010, 98, 930–937. [Google Scholar]
- Managave, S.R.; Sheshshayee, M.S.; Borgaonkar, H.P.; Ramesh, R. Past break monsoon conditions detectable by high resolution intra-annual δ18O analysis of teak rings. Geophys. Res. Lett. 2010, 37, L05702. [Google Scholar] [CrossRef] [Scilit]
- Managave, S.R.; Sheshshayee, M.S.; Bhattacharyya, A.; Ramesh, R. Intra-annual variations of teak cellulose δ18O in Kerala, India: Implications to the reconstruction of past summer and winter monsoon rains. Clim. Dyn. 2011, 37, 555–567. [Google Scholar] [CrossRef] [Scilit]
- Managave, S.R.; Sheshshayee, M.S.; Ramesh, R.; Borgaonkar, H.P.; Shah, S.K.; Bhattacharyya, A. Response of cellulose oxygen isotope values of teak trees in differing monsoon environments to monsoon rainfall. Dendrochronologia 2011, 29, 89–97. [Google Scholar] [CrossRef] [Scilit]
- Managave, S.R.; Shimla, P.; Borgaonkar, H.P.; Bhattacharyya, A.; Ramesh, R. Regional differences in the carbon isotopic compositions of teak from two monsoonal regimes of India. Dendrochronologia 2017, 44, 203–210. [Google Scholar] [CrossRef] [Scilit]
- Bhattacharyya, A.; Eckstein, D.; Shah, S.K.; Chaudhary, V. Analyses of climatic changes around Perambikulum, South India, based on early wood mean vessel area of teak. Curr. Sci. 2007, 93, 1159–1164. [Google Scholar]
- Chakraborty, S.; Dutta, K.; Bhattacharyya, A.; Nigam, M.; Schuur, E.aG.; Shah, S.K. Atmospheric 14C Variability Recorded in Tree Rings from Peninsular India: Implications for Fossil Fuel CO2 Emission and Atmospheric Transport. Radiocarbon 2008, 50, 321–330. [Google Scholar] [CrossRef] [Scilit]
- Upadhyay, K.K.; Shah, S.K.; Roy, A.; Mehrotra, N.; Tripathi, S.K. Dendrochronological potential of Tectona grandis, Pinus kesiya and Quercus serrata from Mizoram, Northeast India. Indian J. Ecol. 2019, 46, 722–728. [Google Scholar]
- Upadhyay, K.K.; Shah, S.K.; Roy, A.; Tripathi, S.K. Dendroclimatology of teak indicates prevailing climatic conditions of tropical moist forests in India. Ecol. Indic. 2021, 129, 107888. [Google Scholar] [CrossRef] [Scilit]
- Troup, R.S. The Silviculture of Indian Trees; Clarendon Press: Oxford, UK, 1920; p. 600. [Google Scholar]
- Asigbaase, M.; Annan, M.; Adusu, D.; Abugre, S.; Nsor, C.A.; Kumi, S.; Acheamfour, S.A. Teak-Soil Interaction: Teak (Tectona grandis) Plantations Impact and are Impacted by Soil Properties and Fertility in Southwestern Ghana. Appl. Environ. Soil Sci. 2024, 2024, 7931830. [Google Scholar] [CrossRef] [Scilit]
- Hu, Y.; Wang, G.; Wei, X.; Zhou, F.; Kattel, G.; Amankwah, S.O.Y.; Hagan, D.F.T.; Duan, Z. Reconstructing long-term global satellite-based soil moisture data using deep learning method. Front. Earth Sci. 2023, 11, 1130853. [Google Scholar] [CrossRef] [Scilit]
- Seneviratne, S.I.; Corti, T.; Davin, E.L.; Hirschi, M.; Jaeger, E.B.; Lehner, I.; Orlowsky, B.; Teuling, A.J. Investigating soil moisture–climate interactions in a changing climate: A review. Earth-Sci. Rev. 2010, 99, 125–161. [Google Scholar] [CrossRef] [Scilit]
- Jung, M.; Reichstein, M.; Ciais, P.; Seneviratne, S.I.; Sheffield, J.; Goulden, M.L.; Bonan, G.; Cescatti, A.; Chen, J.; De Jeu, R.; et al. Recent decline in the global land evapotranspiration trend due to limited moisture supply. Nature 2010, 467, 951–954. [Google Scholar] [CrossRef] [Scilit]
- Mittelbach, H.; Lehner, I.; Seneviratne, S.I. Comparison of four soil moisture sensor types under field conditions in Switzerland. J. Hydrol. 2012, 430, 39–49. [Google Scholar] [CrossRef] [Scilit]
- Yang, K.; Wang, C.; Bao, H. Contribution of soil moisture variability to summer precipitation in the Northern Hemisphere. J. Geophys. Res. Atmos. 2016, 121, 108–124. [Google Scholar] [CrossRef] [Scilit]
- Sang, Y.; Ren, H.-L.; Shi, X.; Xu, X.; Chen, H. Improvement of soil moisture simulation in Eurasia by the Beijing climate centre climate system model from CMIP5 to CMIP6. Adv. Atmos. Sci. 2021, 38, 237–252. [Google Scholar] [CrossRef] [Scilit]
- Cook, B.I.; Bonan, G.B.; Levis, S. Soil moisture feedbacks to precipitation in southern Africa. J. Climatol. 2006, 19, 4198–4206. [Google Scholar] [CrossRef] [Scilit]
- Guan, X.; Huang, J.; Guo, N.; Bi, J.; Wang, G. Variability of soil moisture and its relationship with surface albedo and soil thermal parameters over the Loess Plateau. Adv. Atmos. Sci. 2009, 26, 692–700. [Google Scholar] [CrossRef] [Scilit]
- Zhang, G.; Su, X.; Ayantobo, O.O.; Feng, K. Drought monitoring and evaluation using ESA CCI and GLDAS-Noah soil moisture datasets across China. Theor. Appl. Climatol. 2021, 144, 1407–1418. [Google Scholar] [CrossRef] [Scilit]
- Liu, Q.; Zhang, J.; Zhang, H.; Yao, F.; Bai, Y.; Zhang, S.; Meng, X.; Liu, Q. Evaluating the performance of eight drought indices for capturing soil moisture dynamics in various vegetation regions over China. Sci. Total Environ. 2021, 789, 147803. [Google Scholar] [CrossRef] [Scilit]
- Lu, Z.; Peng, S.; Slette, I.; Cheng, G.; Li, X.; Chen, A. Soil moisture seasonality alters vegetation response to drought in the Mongolian Plateau. Environ. Res. Lett. 2021, 16, 014050. [Google Scholar] [CrossRef] [Scilit]
- Phillips, O.L.; Aragão, L.E.O.C.; Lewis, S.L.; Fisher, J.B.; Lloyd, J.; López-González, G.; Malhi, Y.; Monteagudo, A.; Peacock, J.; Quesada, C.A.; et al. Drought sensitivity of the Amazon rainforest. Science 2009, 323, 1344–1347. [Google Scholar] [CrossRef] [Scilit]
- Singh, R.; Chaudhari, S.K.; Kundu, D.K.; Sengar, S.S.; Kumar, A. Soils of Chhattisgarh: Characteristics and Water Management Options; Research Bulletin 34; Water Technology Centre for Eastern Region (WTCER): Bhubaneswar, India, 2006. [Google Scholar]
- Central Ground Water Board (2020–21) Government of India Ministry of Jal Shakti Department of Water Resources, River Development & Ganga Rejuvenation Central Ground Water Board, Central Ground Water Board Bhujal Bhawan, NH-4, Faridabad, Haryana 121001. Available online: www.cgwb.gov.in (accessed on 20 December 2024).
- Meshram, S.G.; Singh, V.P.; Meshram, C. Long-term trend and variability of precipitation in Chhattisgarh State, India. Theor. Appl. Climatol. 2017, 129, 729–744. [Google Scholar] [CrossRef] [Scilit]
- Sarkar, H.; Soni, S.; Ahmad, I.; Verma, M.K. Assessment of Agricultural Drought in Upper Seonath Sub-Basin of Chhattisgarh (India) Using Remote Sensing and GIS-Based Indices. J. Indian Soc. Remote Sens. 2020, 48, 921–933. [Google Scholar] [CrossRef] [Scilit]
- Indian Forest Department Report, Forest Survey of India; Ministry of Environment Forest and Climate Change: New Delhi, India, 2021.
- Churpal, D.; Gauraha, A.K.; Pathak, H.; Tuteja, S.S. Economically and traditionally important nontimber forest products (NTFPs) of Chhattisgarh. J. Pharmacogn. Phytochem. 2021, 10, 89–92. [Google Scholar]
- Mishra, A.K.; Sharma, S.C.; Prasad, N. Shorea robusta-NRG based multipurpose Tree. Just Agric. 2021, 7, 2582–8223. [Google Scholar]
- Baral, S.; Gaire, N.P.; Giri, A.; Maraseni, T.; Basnyat, B.; Paudel, A.; Kunwar, R.; Rayamajhi, S.; Basnet, S.; Sharma, S.K.; et al. Growth dynamics of Shorea robusta Gaertn in relation to climate change: A case study from tropical region of Nepal. Trees 2022, 36, 1425–1436. [Google Scholar] [CrossRef] [Scilit]
- Fritts, H.C. Tree Rings and Climate; Academic Press: New York, NY, USA, 1976; p. 568. [Google Scholar]
- Speer, J.H. Fundamentals of Tree-Ring Research; University of Arizona Press: Tucson, AZ, USA, 2010; p. 368. [Google Scholar]
- Stokes, M.A.; Smiley, T.L. An Introduction to Tree Ring Dating; University of Chicago Press: Chicago, IL, USA, 1968; p. 73. [Google Scholar]
- Voor Tech Consulting. Measure J2X. 2008. Available online: https://www.voortech.com/projectj2x (accessed on 3 April 2015).
- Velmex Inc. Velmex Measurement System. 2009. Available online: https://www.velmex.com (accessed on 3 April 2015).
- Holmes, R.L. Computer assisted quality control in tree ring dating and measuring. Tree-Ring Bull. 1983, 43, 69–78. [Google Scholar]
- Larsson, L. CDendro & CooRecorder Program Package, Version 9.8.1. 2005. Available online: https://www.cybis.se/forfun/dendro (accessed on 20 October 2021).
- Friedman, J.H. A Variable Span Smoother; Stanford University Technical Report LCS 5; Department of Statistics: Berkeley, CA, USA, 1984. [Google Scholar]
- Cook, E.; Peters, K. Calculating unbiased tree-ring indices for the study of climatic and environmental change. Holocene 1997, 7, 361–370. [Google Scholar] [CrossRef] [Scilit]
- Cook, E.R. A Time Series Analysis Approach to Tree Ring Standardization. Ph.D. Thesis, The University of Arizona, Tucson, AZ, USA, 1985. [Google Scholar]
- Blankenau, P.A.; Kilic, A.; Allen, R. An evaluation of gridded weather data sets for the purpose of estimating reference evapotranspiration in the United States. Agric. Water Manag. 2020, 242, 106376. [Google Scholar] [CrossRef] [Scilit]
- Lawal, I.M.; Bertram, D.; White, C.J.; Jagaba, A.H.; Hassan, I.; Shuaibu, A. Multi-Criteria Performance Evaluation of Gridded Precipitation and Temperature Products in Data-Sparse Regions. Atmosphere 2021, 12, 1597. [Google Scholar] [CrossRef] [Scilit]
- Rajeevan, M.; Bhate, J.; Jaswal, A.K. Analysis of variability and trends of extreme rainfall events over India using 104 years of gridded daily rainfall data. Geophys. Res. Lett. 2008, 35, L18707. [Google Scholar] [CrossRef] [Scilit]
- Srivastava, A.K.; Rajeevan, M.; Kshirsagar, S.R. Development of High Resolution Daily Gridded Temperature Data Set (1969-2005) for the Indian Region. Atmos. Sci. Lett. 2009, 10, 249–254. [Google Scholar] [CrossRef] [Scilit]
- Schulzweida, U. CDO User Guide, Version 2.3.0; Zenodo: Geneva, Switzerland, 2023. [CrossRef]
- Vicente-Serrano, S.M.; Beguería, S.; López-Moreno, J.I. A Multiscalar Drought Index Sensitive to Global Warming: The Standardized Precipitation Evapotranspiration Index. J. Clim. 2010, 23, 1696–1718. [Google Scholar] [CrossRef] [Scilit]
- R Core Team. R: A Language and Environment for Statistical Computing; R Foundation for Statistical Computing: Vienna, Austria, 2023; Available online: https://www.R-project.org (accessed on 20 October 2024).
- McNally, A.; Arsenault, K.; Kumar, S.; Shukla, S.; Peterson, P.; Wang, S.; Funk, C.; Peters-Lidard, C.D.; Verdin, J.P. A land data assimilation system for sub-Saharan Africa food and water security applications. Sci. Data 2017, 4, 170012. [Google Scholar] [CrossRef] [Scilit]
- Jevšenak, J.; Levanič, T. dendroTools: R package for studying linear and nonlinear responses between tree-rings and daily environmental data. Dendrochronologia 2018, 48, 32–39. [Google Scholar] [CrossRef] [Scilit]
- Jevšenak, J. Daily climate data reveal stronger climate-growth relationships for an extended European tree-ring network. Quat. Sci. Rev. 2019, 221, 105868. [Google Scholar] [CrossRef] [Scilit]
- Michaelsen, J. Cross-validation in statistical climate forecast models. J. Appl. Meteorol. Climatol. 1987, 26, 1589–1600. [Google Scholar] [CrossRef] [Scilit]
- Weisberg, R. Applied Linear Regression; John Wiley and Sons: New York, NY, USA, 1985; p. 370. [Google Scholar]
- Harris, I.; Osborn, T.J.; Jones, P.; Lister, D. Version 4 of the CRU TS monthly high-resolution gridded multivariate climate dataset. Sci. Data 2020, 7, 109. [Google Scholar] [CrossRef] [Scilit] [PubMed]
- Parthasarathy, B.; Kumar, K.R.; Munot, A.A. Homogeneous Indian Monsoon Rainfall: Variability and prediction. Proc. Indian Acad. Sci.—Earth Planet. Sci. 1993, 102, 121–155. [Google Scholar] [CrossRef] [Scilit]
- Wigley, T.M.L.; Briffa, K.R.; Jones, P.D. On the average value of correlated time series, with application in dendroclimatology and hydrometeorology. J. Appl. Meteorol. Climatol. 1984, 23, 201–213. [Google Scholar] [CrossRef] [Scilit]
- Kirschbaum, M.U.F.; McMillan, A.M.S. Warming and elevated CO2 have opposing influences on transpiration. What is more important? Curr. For. Rep. 2018, 4, 51–71. [Google Scholar] [CrossRef] [Scilit]
- Siddiq, Z.; Tomlinson, K.W.; Zhu, S.; Cao, K. Does fluctuation of meteorological conditions across years influence stand transpiration of Tectona grandis plantation? Ecohydrology 2019, 12, e2116. [Google Scholar] [CrossRef] [Scilit]
- Ugulino, B.; De F Latorraca, J.V.; Filho, M.T. Tree-ring growth response of teak (Tectona grandis L.f.) to climatic variables in central-west region of Brazil. Sci. For. 2014, 42, 473–482. [Google Scholar]
- Ramesh, R.; Bhattacharya, S.K.; Pant, G.B. Climatic significance of δD variations in a tropical tree species from India. Nature 1989, 337, 149–150. [Google Scholar] [CrossRef] [Scilit]
- Pumijumnong, N. Teak Tree Ring Widths: Ecology and Climatology Research in Northwest Thailand. Sci. Technol. Dev. 2012, 31, 165–174. [Google Scholar]
- Pumijumnong, N.; Eckstein, D.; Sass, U. Tree-ring research on Tectona grandis in northern Thailand. IAWA J. 1995, 16, 385–392. [Google Scholar] [CrossRef] [Scilit]
- Pumijumnong, N.; Eckstein, D.; Sass, U. Reconstruction of rainfall in northern Thailand from tree-ring series of teak. In Proceedings of the IGBPPAGES/PEP-II Symposium on Paleoclimate and Environment Variability in Austral-Asian Transect During the Past 2000 Years, Nagoya, Japan, 28 November–1 December 1995; pp. 186–191. [Google Scholar]
- Borgaonkar, H.P.; Pumijumnong, N.; Buckley, B.M.; Taesumrith, O.; Chutiwat, S. Tree-ring analysis of teak (Tectona grandis) ring width chronology from Mae Na, Thailand. Palaeobotanist 2001, 50, 41–44. [Google Scholar] [CrossRef] [Scilit]
- Buckley, B.M.; Tongjit, O.; Pumijumnong, N.; Poonsri, R. Dendrometer band studies on Tectona grandis in northern Thailand. Palaeobotanist 2001, 50, 83–87. [Google Scholar] [CrossRef] [Scilit]
- Pumijumnong, N.; Eckstein, D.; Park, W.K. Teak tree-ring chronologies in Myanmar-a first attempt. Palaeobotanist 2001, 50, 35–40. [Google Scholar] [CrossRef] [Scilit]
- Kyaw, N.N. Site Influence on Growth and Phenotype of Teak (Tectona grandis Linn. f.) in Natural Forests of Myanmar. Ph.D. Thesis, University of Göttingen, Göttingen, Germany, 2003. [Google Scholar]
- Palakit, K. Dendroclimatological Studies of Teak (Tectona grandis L.): A Case Study in Mae Hong Son Province, Thailand. Master’s Thesis, Mahidol University, Nakorn Pathom, Thailand, 2004. [Google Scholar]
- Preechamart, S.; Pumijumnong, N.; Payomrat, P.; Buajan, S. Variation in Climate Signals in Teak Tree-Ring Chronologies in Two Different Growth Areas. Forests 2018, 9, 772. [Google Scholar] [CrossRef] [Scilit]
- Jacoby, G.C.; D’Arrigo, R. Teak (Tectona grandis L.f.), a tropical species of large-scale dendroclimatic potential. Dendrochronologia 1990, 8, 83–98. [Google Scholar]
- Mishra, V. Long-term (1870–2018) drought reconstruction in context of surface water security in India. J. Hydrol. 2019, 580, 124228. [Google Scholar] [CrossRef] [Scilit]
- Dyson, T.; Maharatna, A. Bihar Famine, 1966–1967 and Maharashtra Drought, 1970–1973: The Demographic Consequences. Econ. Political Wkly. 1992, 27, 1325–1332. [Google Scholar]
- Bidinger, P.D.; Walker, T.S.; Sarkar, B.; Murthy, A.R.; Babu, P. Consequences of Mid-1980s Drought: Longitudinal Evidence from Mahbubnagar. Econ. Political Wkly. 1991, 26, 105–114. [Google Scholar]
- Varikoden, H.; Revadekar, J.V.; Choudhary, Y.; Preethi, B. Droughts of Indian summer monsoon associated with El Niño and Non-El Niño years. Int. J. Climatol. 2015, 35, 1916–1925. [Google Scholar] [CrossRef] [Scilit]
- Preethi, B.; Mujumdar, M.; Kripalani, R.H.; Prabhu, A.; Krishnan, R. Recent trends and tele-connections among South and East Asian summer monsoons in a warming environment. Clim. Dyn. 2017, 48, 2489–2505. [Google Scholar] [CrossRef] [Scilit]
- Kumar, P. Extreme droughts and corresponding Summer Monsoon: A Case Study of 2009 Indian Drought. Mausam 2023, 74, 83–104. [Google Scholar] [CrossRef] [Scilit]
- Das, P.K. The Monsoons; National Book Trust of India: New Delhi, India, 1995; p. 162. [Google Scholar]
- Preethi, B.; Revadekar, J.V.; Kripalani, R.H. Anomalous behaviour of the Indian summer monsoon 2009. J. Earth Syst. Sci. 2011, 120, 783–794. [Google Scholar] [CrossRef] [Scilit]
- Neena, J.M.; Suhas, E.; Goswami, B.N. Leading role of internal dynamics in the 2009 Indian summer monsoon drought. J. Geophys. Res. 2011, 116, d13103. [Google Scholar] [CrossRef] [Scilit]
- Krishnamurti, T.N.; Thomas, A.; Simon, A.; Kumar, V. Desert Air Incursions, an Overlooked Aspect, for the Dry Spells of the Indian Summer Monsoon. J. Atmos. Sci. 2010, 67, 3423–3441. [Google Scholar] [CrossRef] [Scilit]
- Blunden, J.; Arndt, D.S. State of the Climate in 2015. Bull. Am. Meteorol. Soc. 2016, 97, Si-S275. [Google Scholar] [CrossRef] [Scilit]
- Gupta, A.K.; Tyagi, P.; Sehgal, V.K. Drought disaster challenges and mitigation in India: Strategic appraisal. Curr. Sci. 2011, 100, 1795–1805. [Google Scholar]
- Bhat, G.S. The Indian drought of 2002-A sub-seasonal phenomenon? Q. J. R. Meteorol. Soc. 2006, 132, 2583–2602. [Google Scholar] [CrossRef] [Scilit]
- Shah, T.; Kishore, A.; Hemant, P. Will the impact of the 2009 drought be different from 2002? Econ. Political Wkly. 2009, 37, 11–14. [Google Scholar]
- Rajeev, A.; Mahto, S.S.; Mishra, V. Climate warming and summer monsoon breaks drive compound dry and hot extremes in India. iScience 2022, 25, 105377. [Google Scholar] [CrossRef] [Scilit]
- Yang, L.; Sun, G.; Zhi, L.; Zhao, J. Negative soil moisture-precipitation feedback in dry and wet regions. Sci. Rep. 2018, 8, 4026. [Google Scholar] [CrossRef] [Scilit]
- Pal, I.; Al-Tabbaa, A. Regional changes in extreme monsoon rainfall deficit and excess in India. Dyn. Atmos. Ocean. 2009, 49, 206–214. [Google Scholar] [CrossRef] [Scilit]
- Kumar, K.N.; Rajeevan, M.; Pai, D.S.; Srivastava, A.K.; Preethi, B. On the observed variability of monsoon droughts over India. Weather. Clim. Extrem. 2013, 1, 42–50. [Google Scholar] [CrossRef] [Scilit]
- Manoj, A.J.; Guntu, R.K.; Agarwal, A. Spatiotemporal dependence of soil moisture and precipitation over India. J. Hydrol. 2022, 610, 127898. [Google Scholar] [CrossRef] [Scilit]
- Huggannavar, V.; Indu, J. Seasonal variability of soil moisture-precipitation feedbacks over India. J. Hydrol. 2020, 589, 125181. [Google Scholar] [CrossRef] [Scilit]
- Chawang, N.M.; Sakuru, S.K.V.S.; Sampelli, A.; Jella, S.; Rao, K.G.; Ramana, M.V. Estimation of soil moisture and soil temperature over India using the Noah multi-parameterisation land surface model. Model. Earth Syst. Environ. 2022, 9, 1873–1889. [Google Scholar] [CrossRef] [Scilit]
- De Souza, L.V.C.; Da Silva, J.E.C.; Azevedo, T.L.B.; Mascarenhas, A.R.P.; Arias, L.A.U.; Pereira, B.L.C.; Oliveira, A.C. Wood Quality of Young Tectona grandis L. f. Trees and Its Relationship with Genetic Material and Planting Site in Mato Grosso, Brazil. Forests 2024, 15, 860. [Google Scholar] [CrossRef] [Scilit]
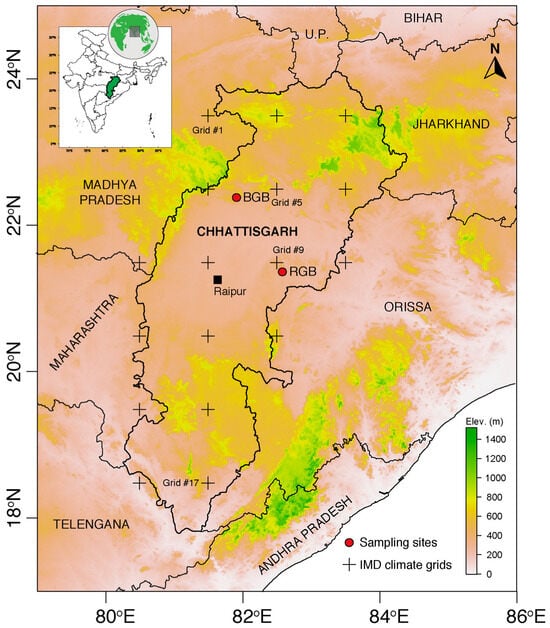
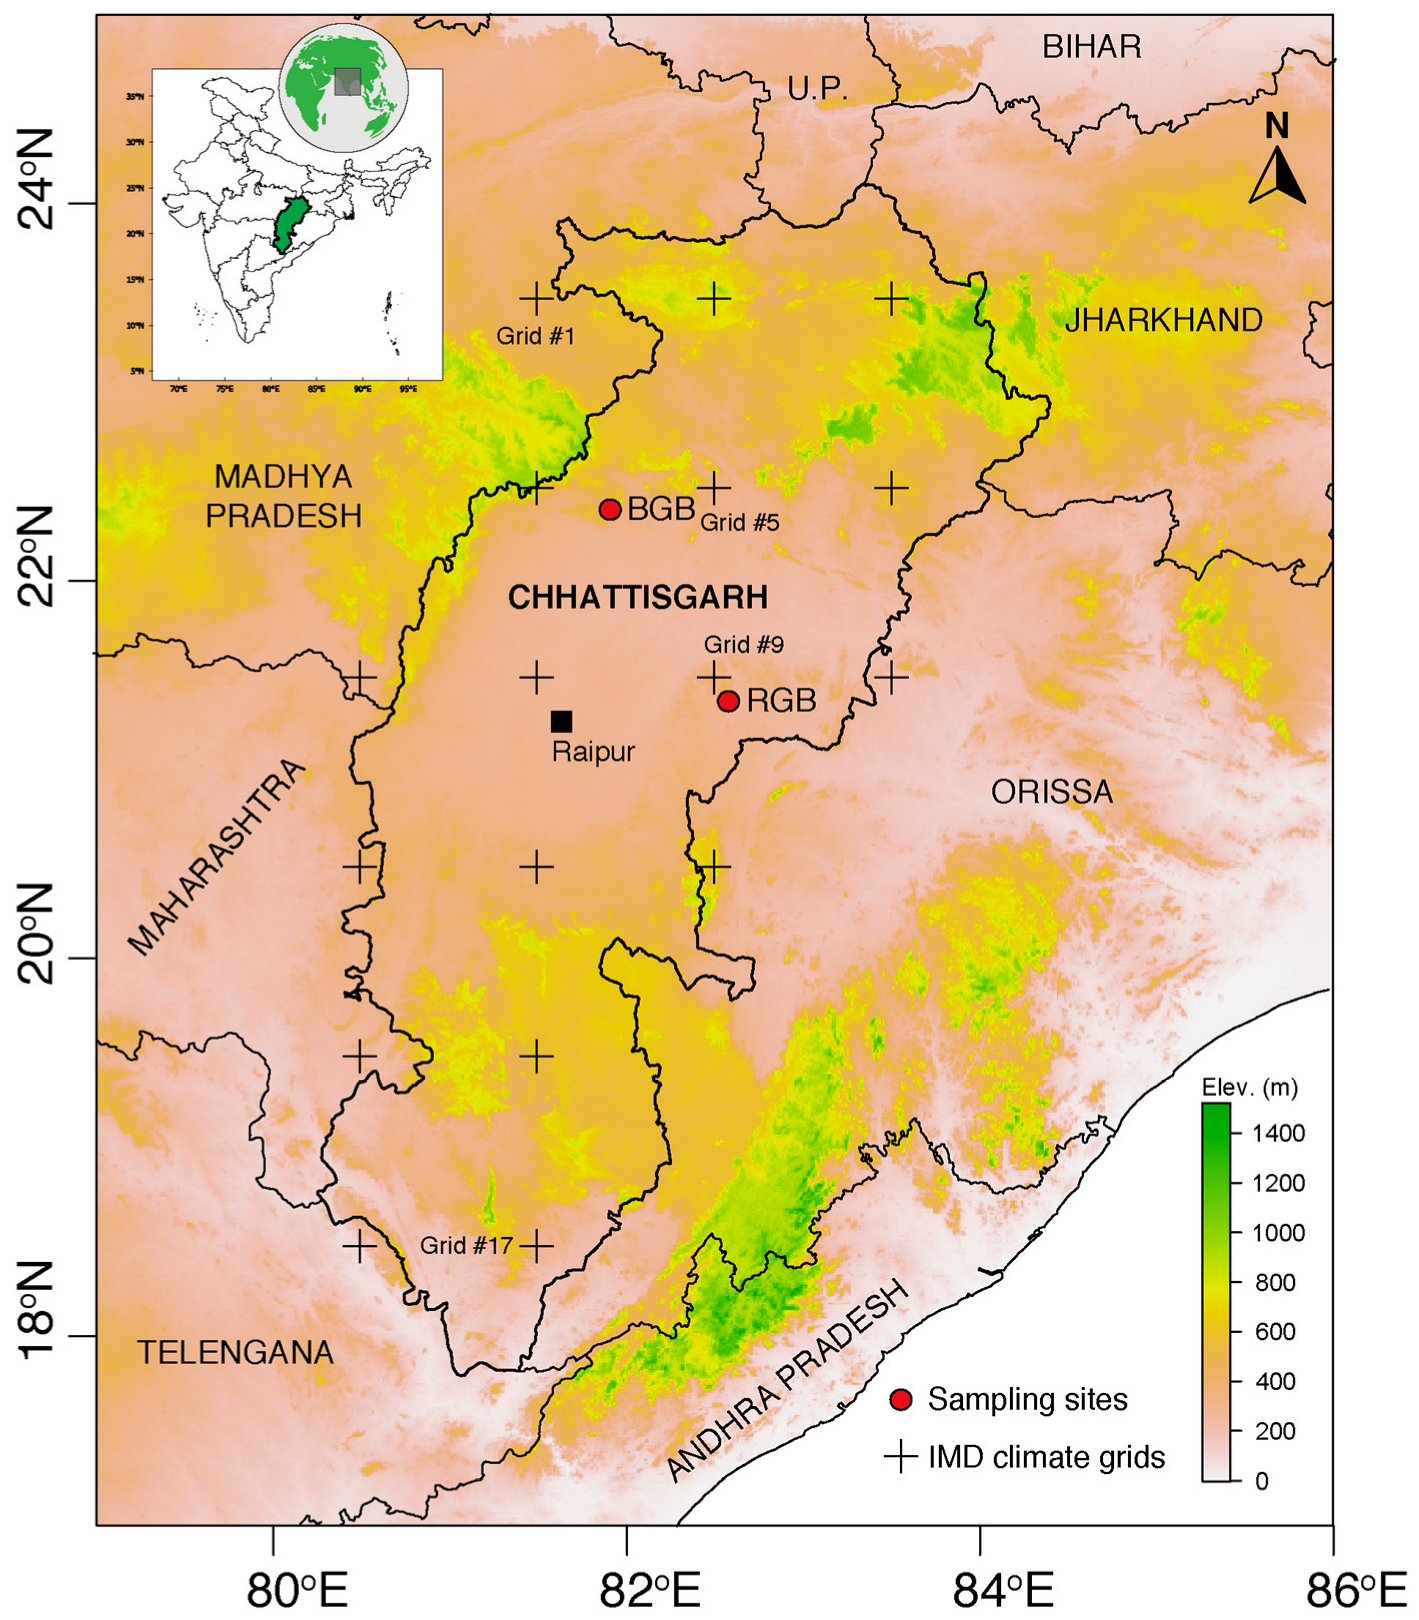
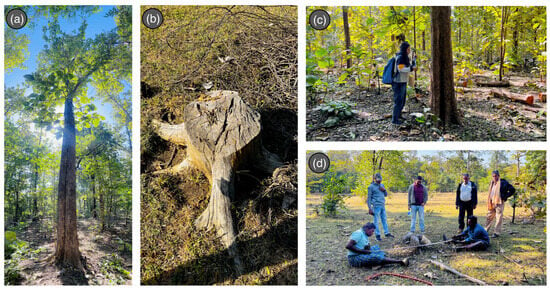
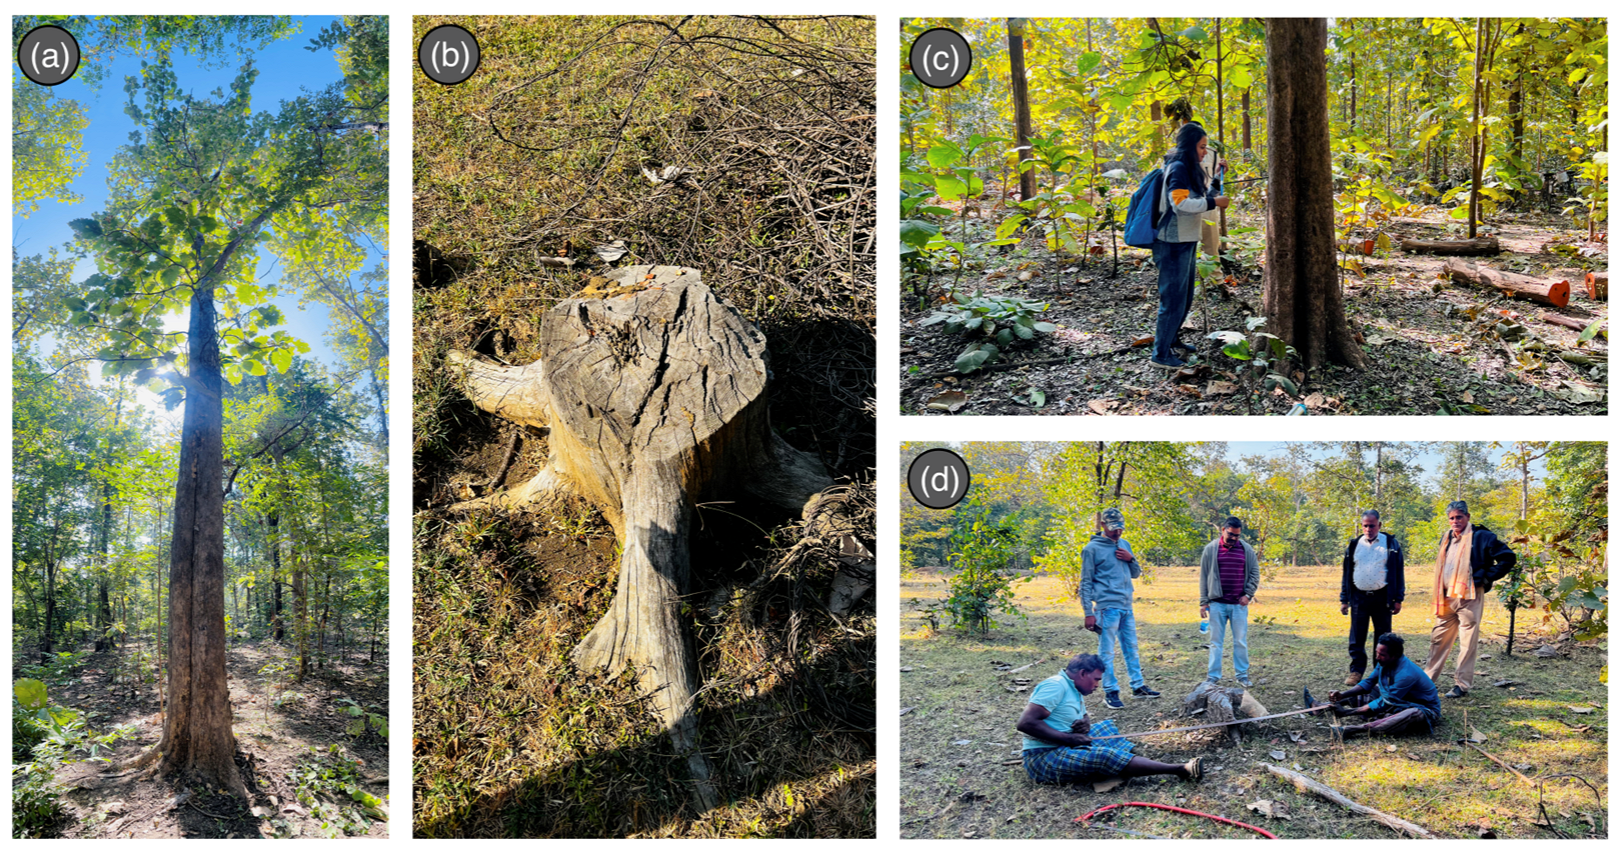
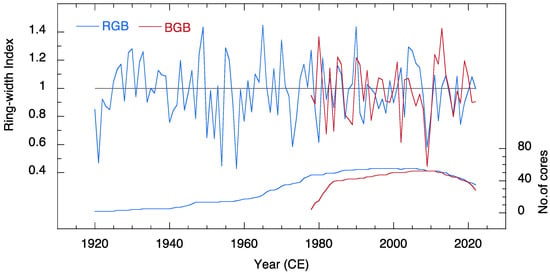
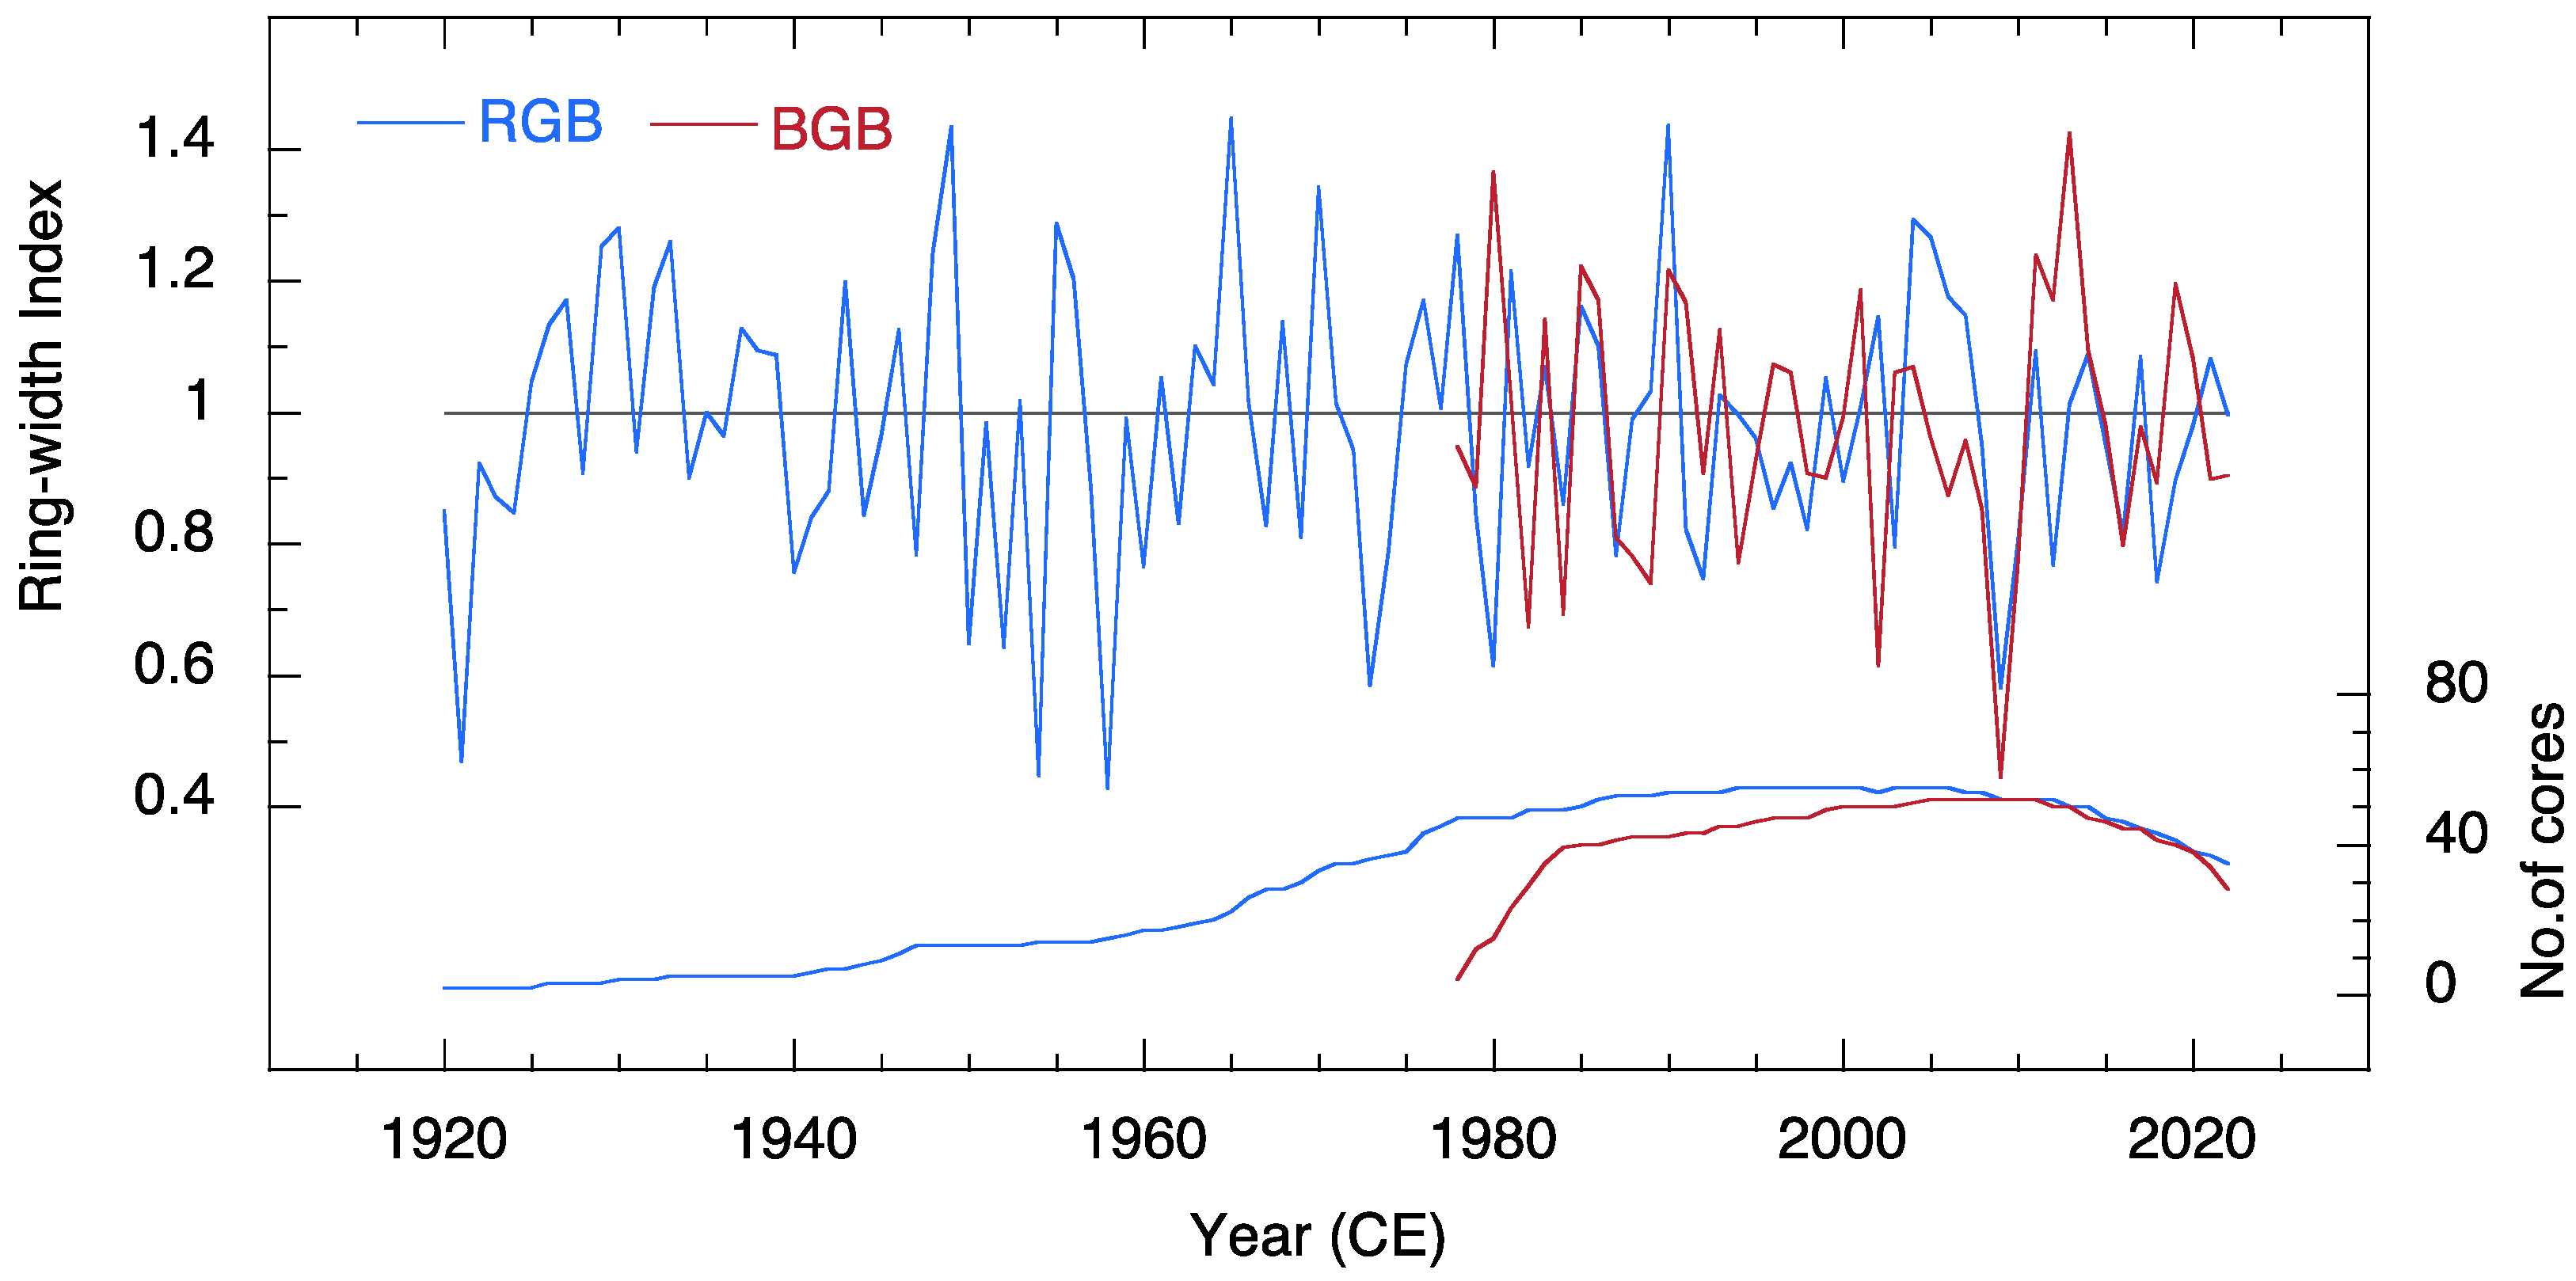
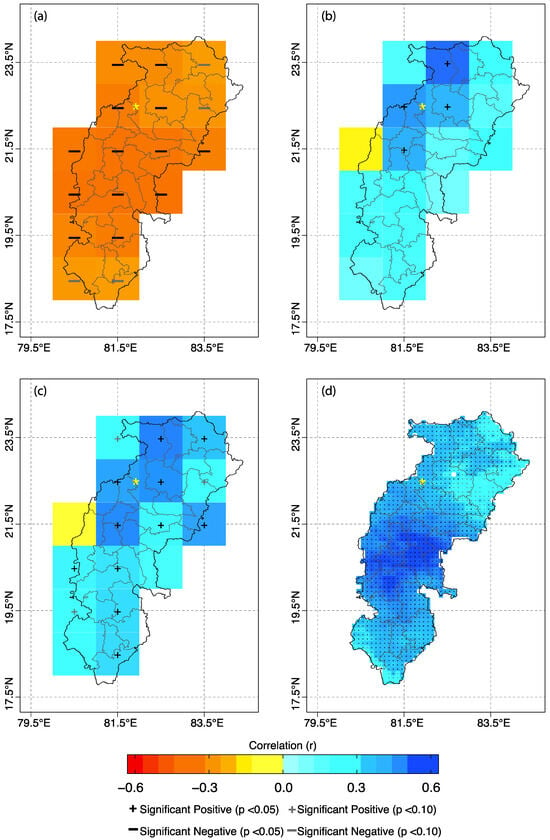
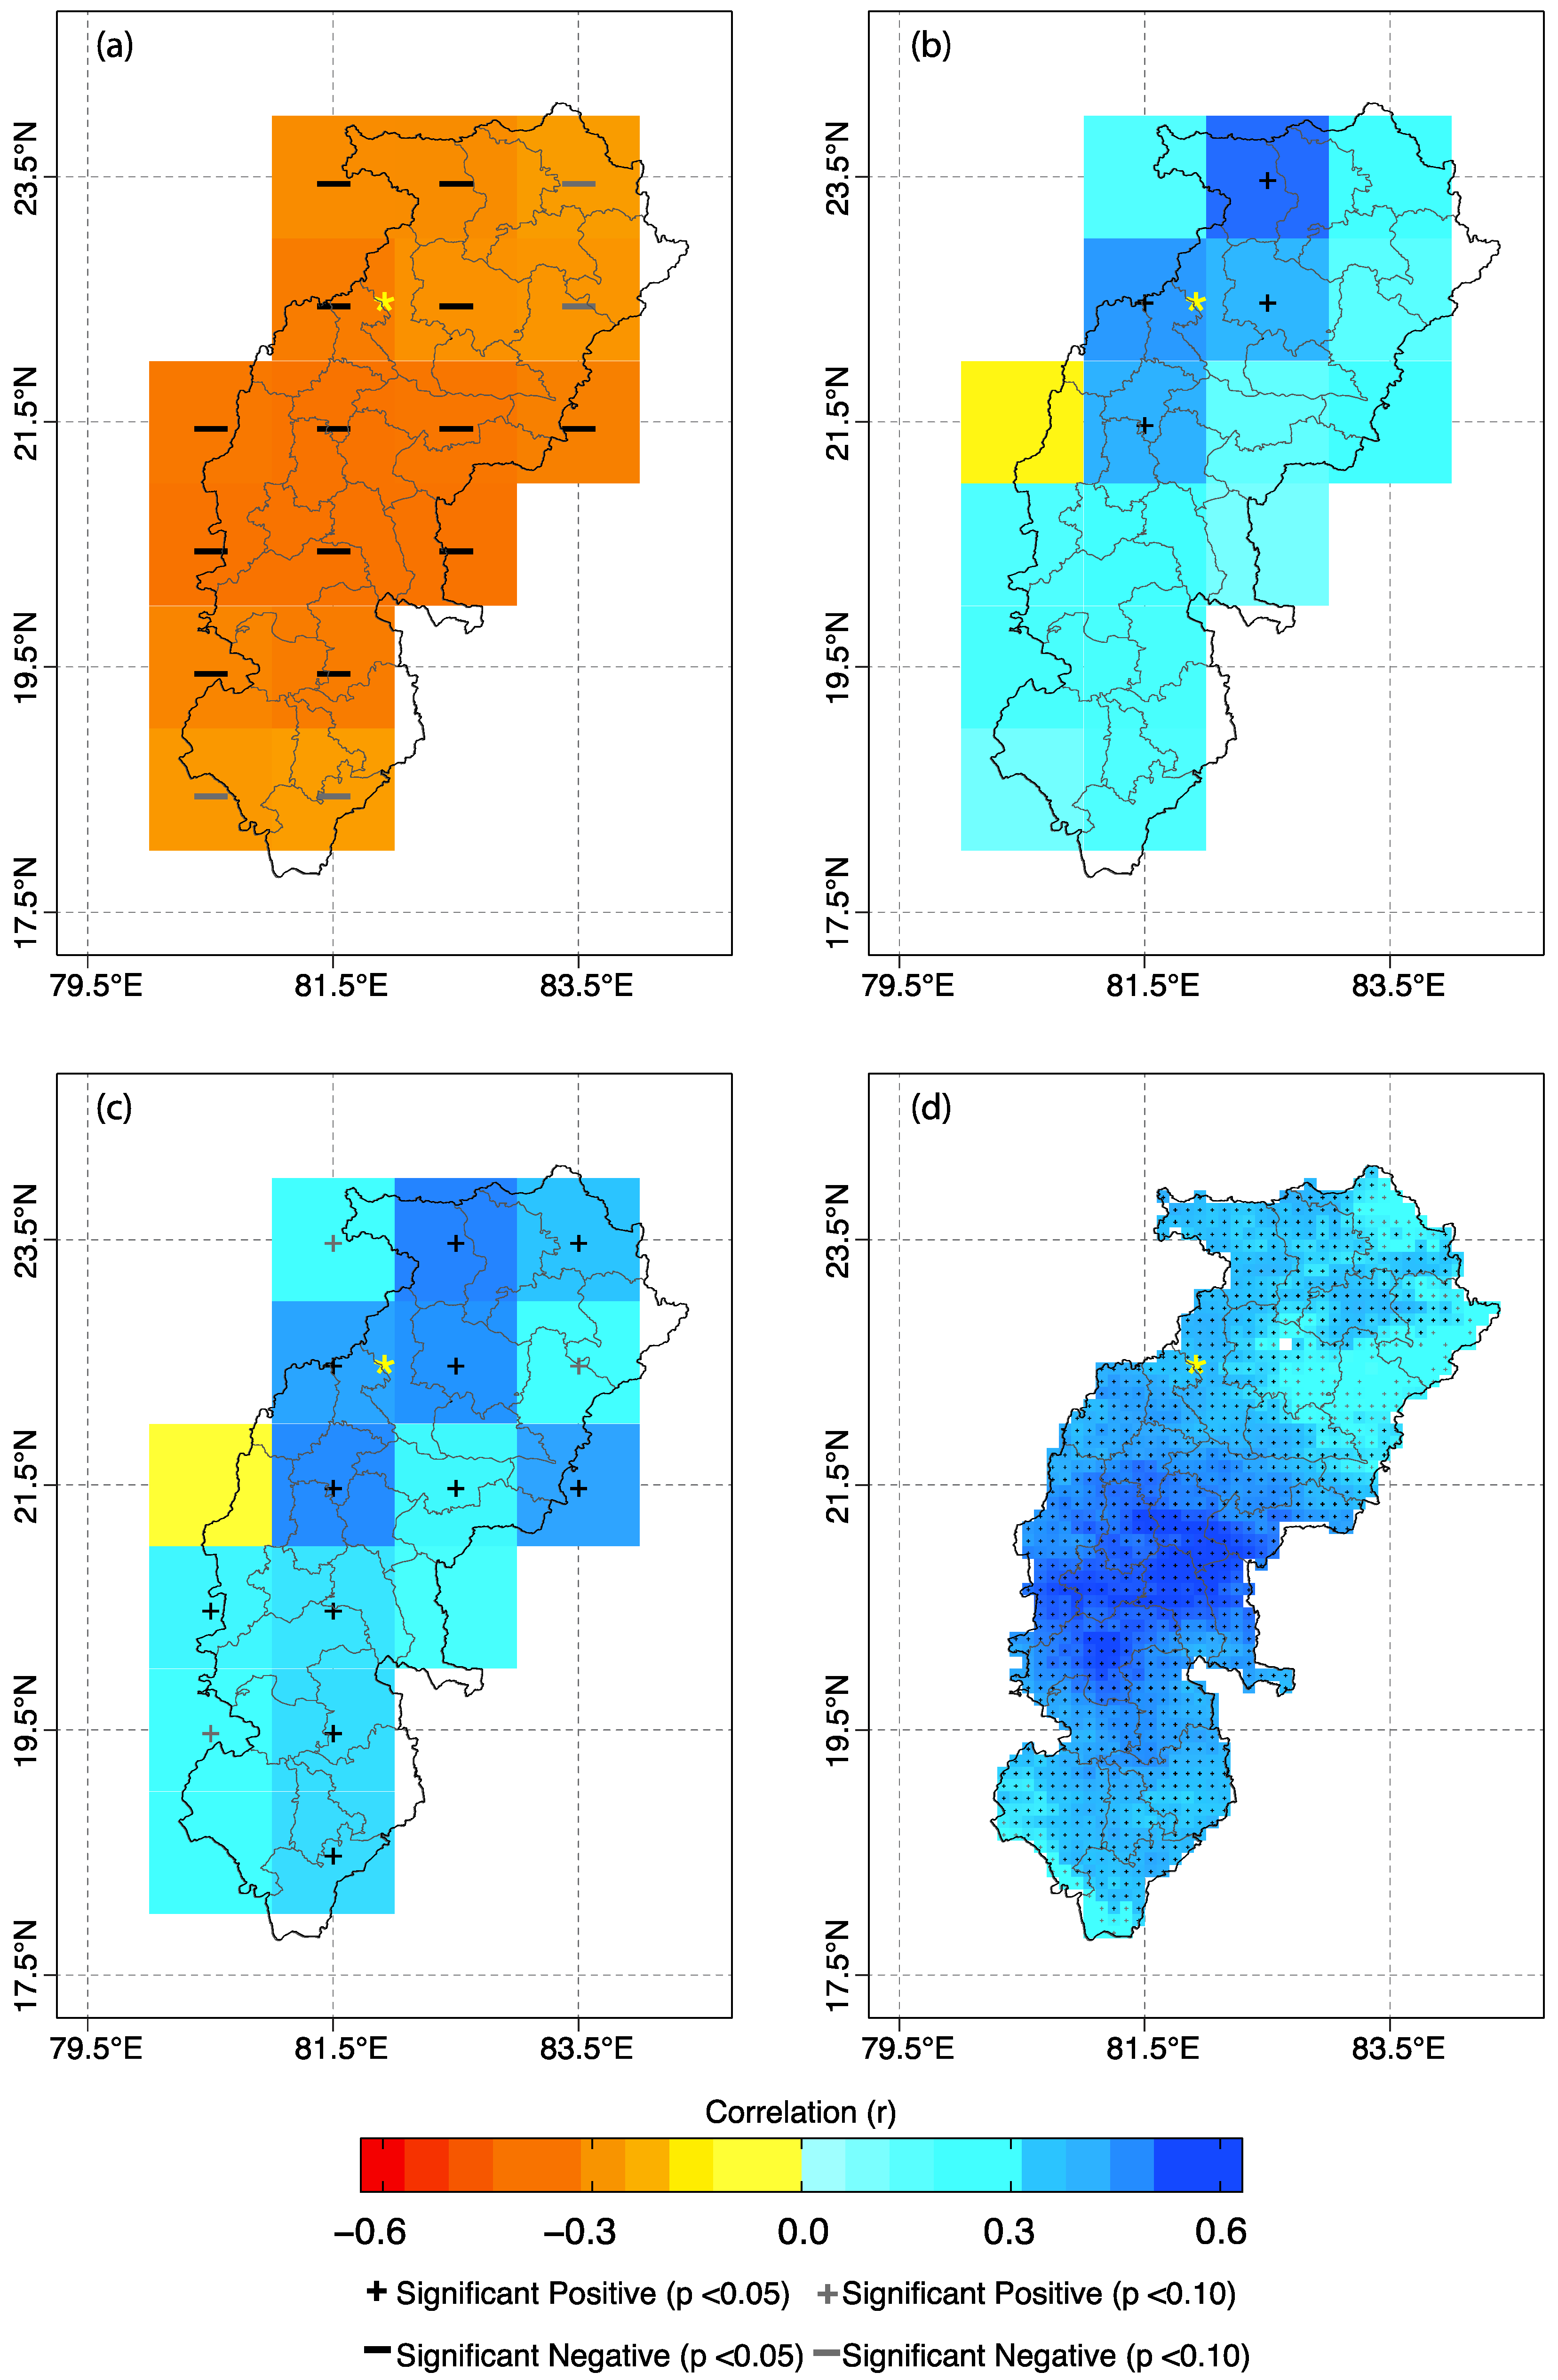
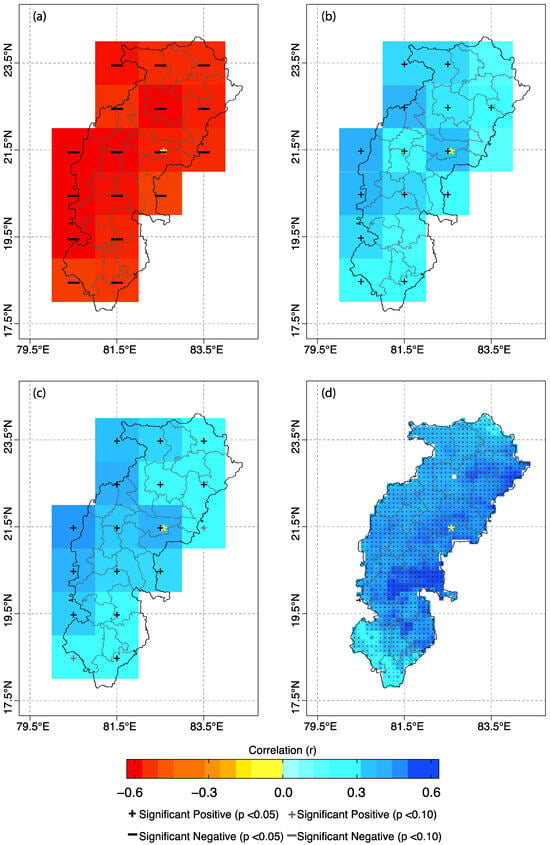
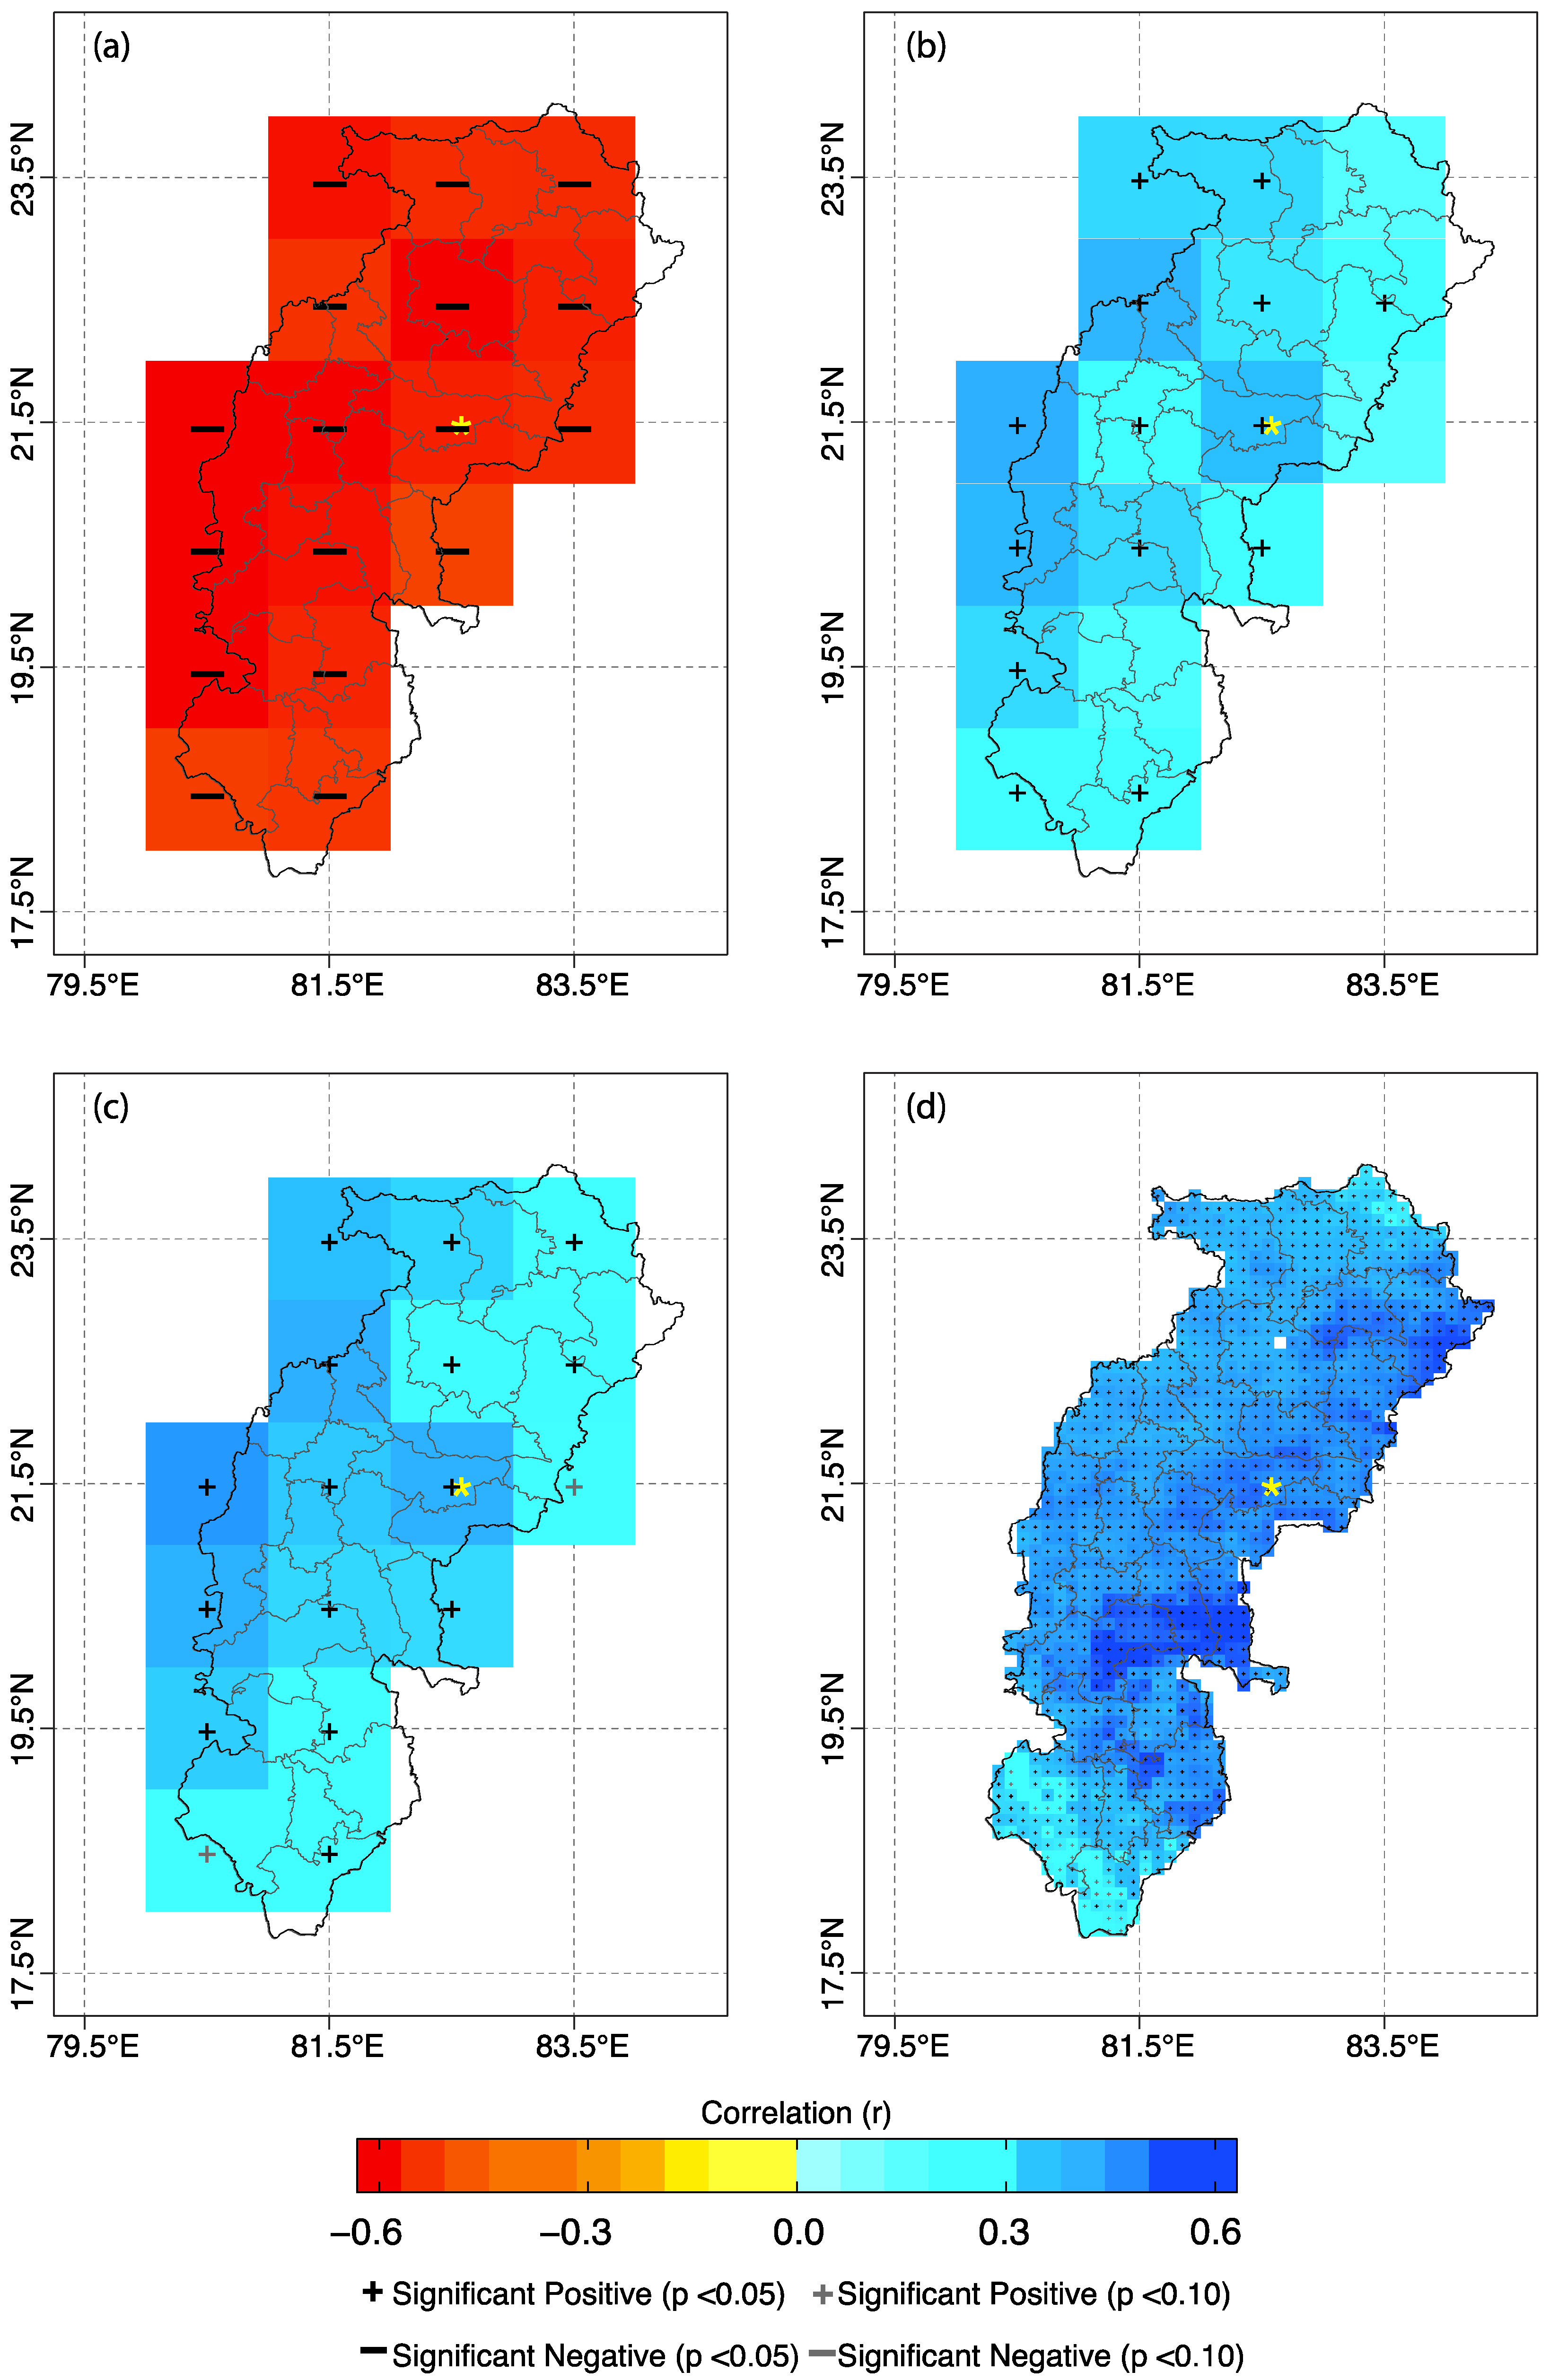
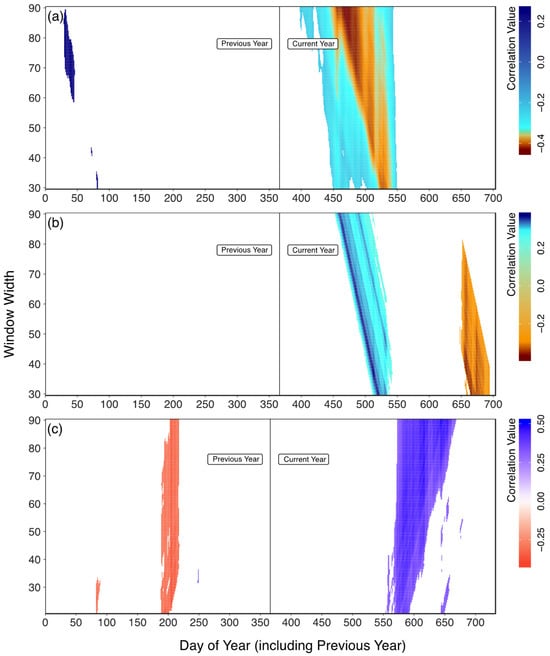
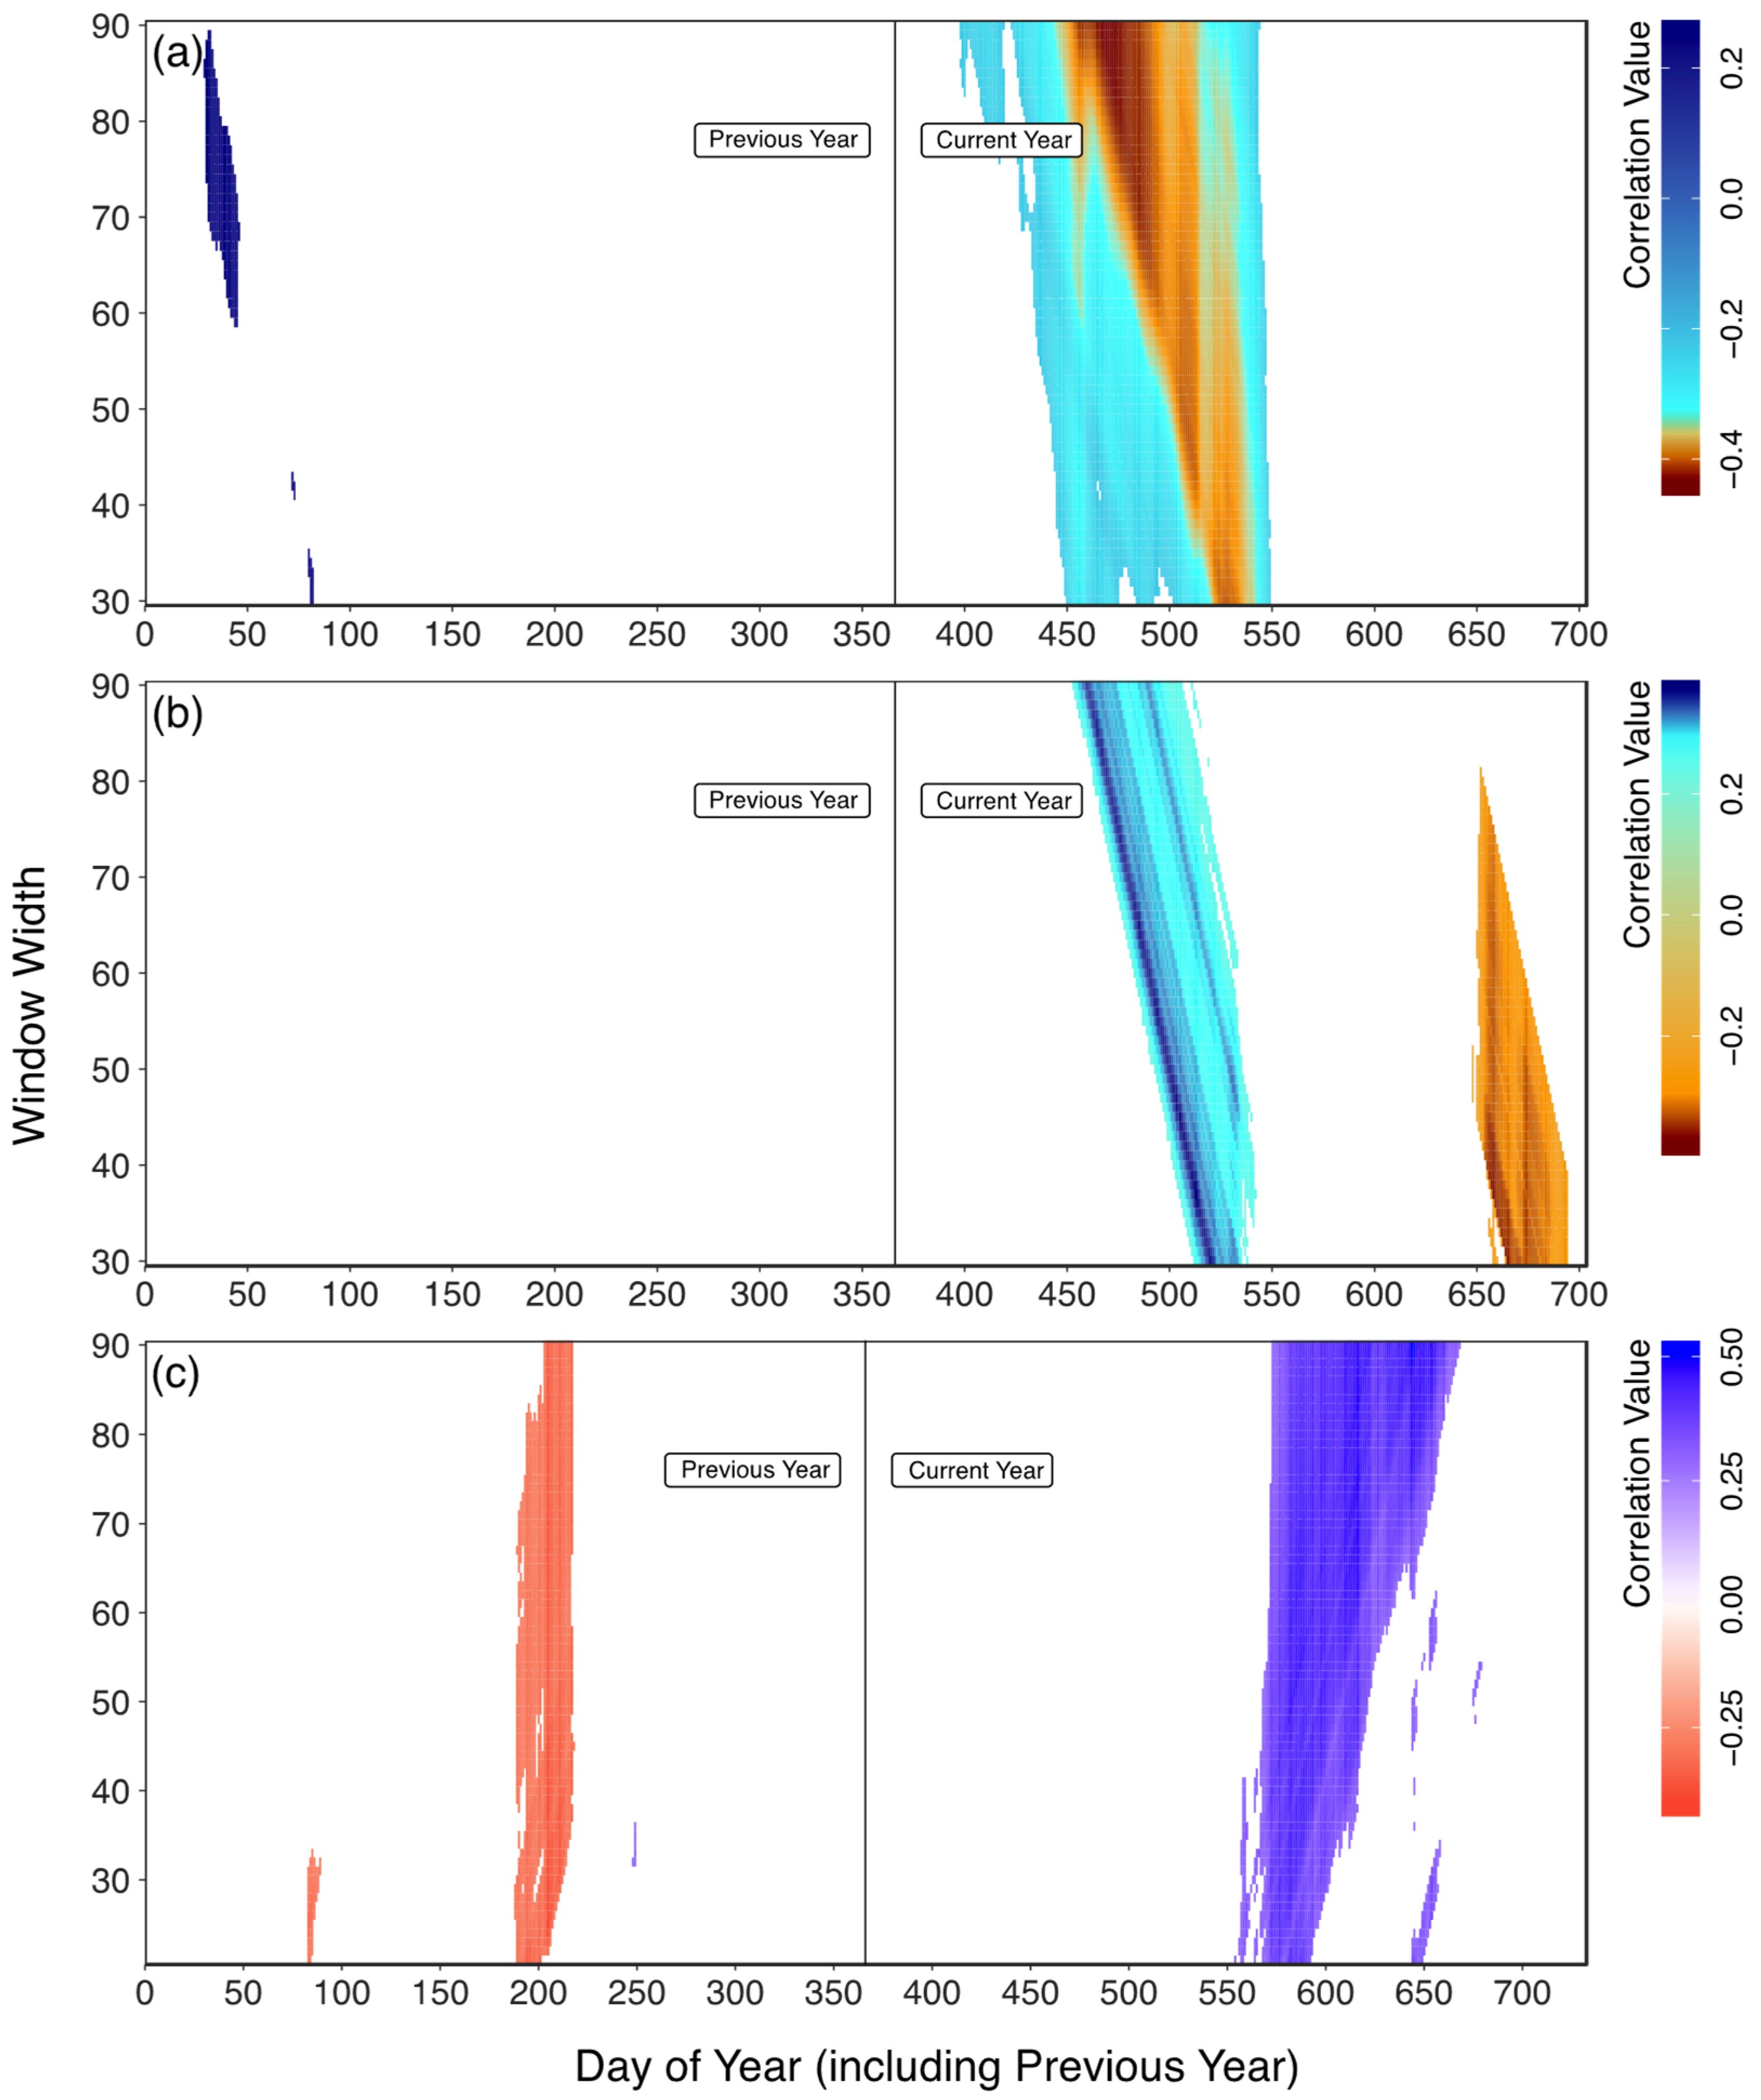
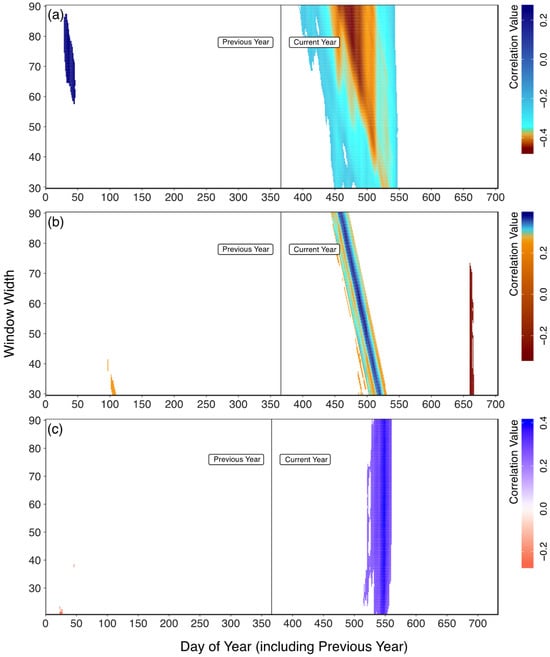
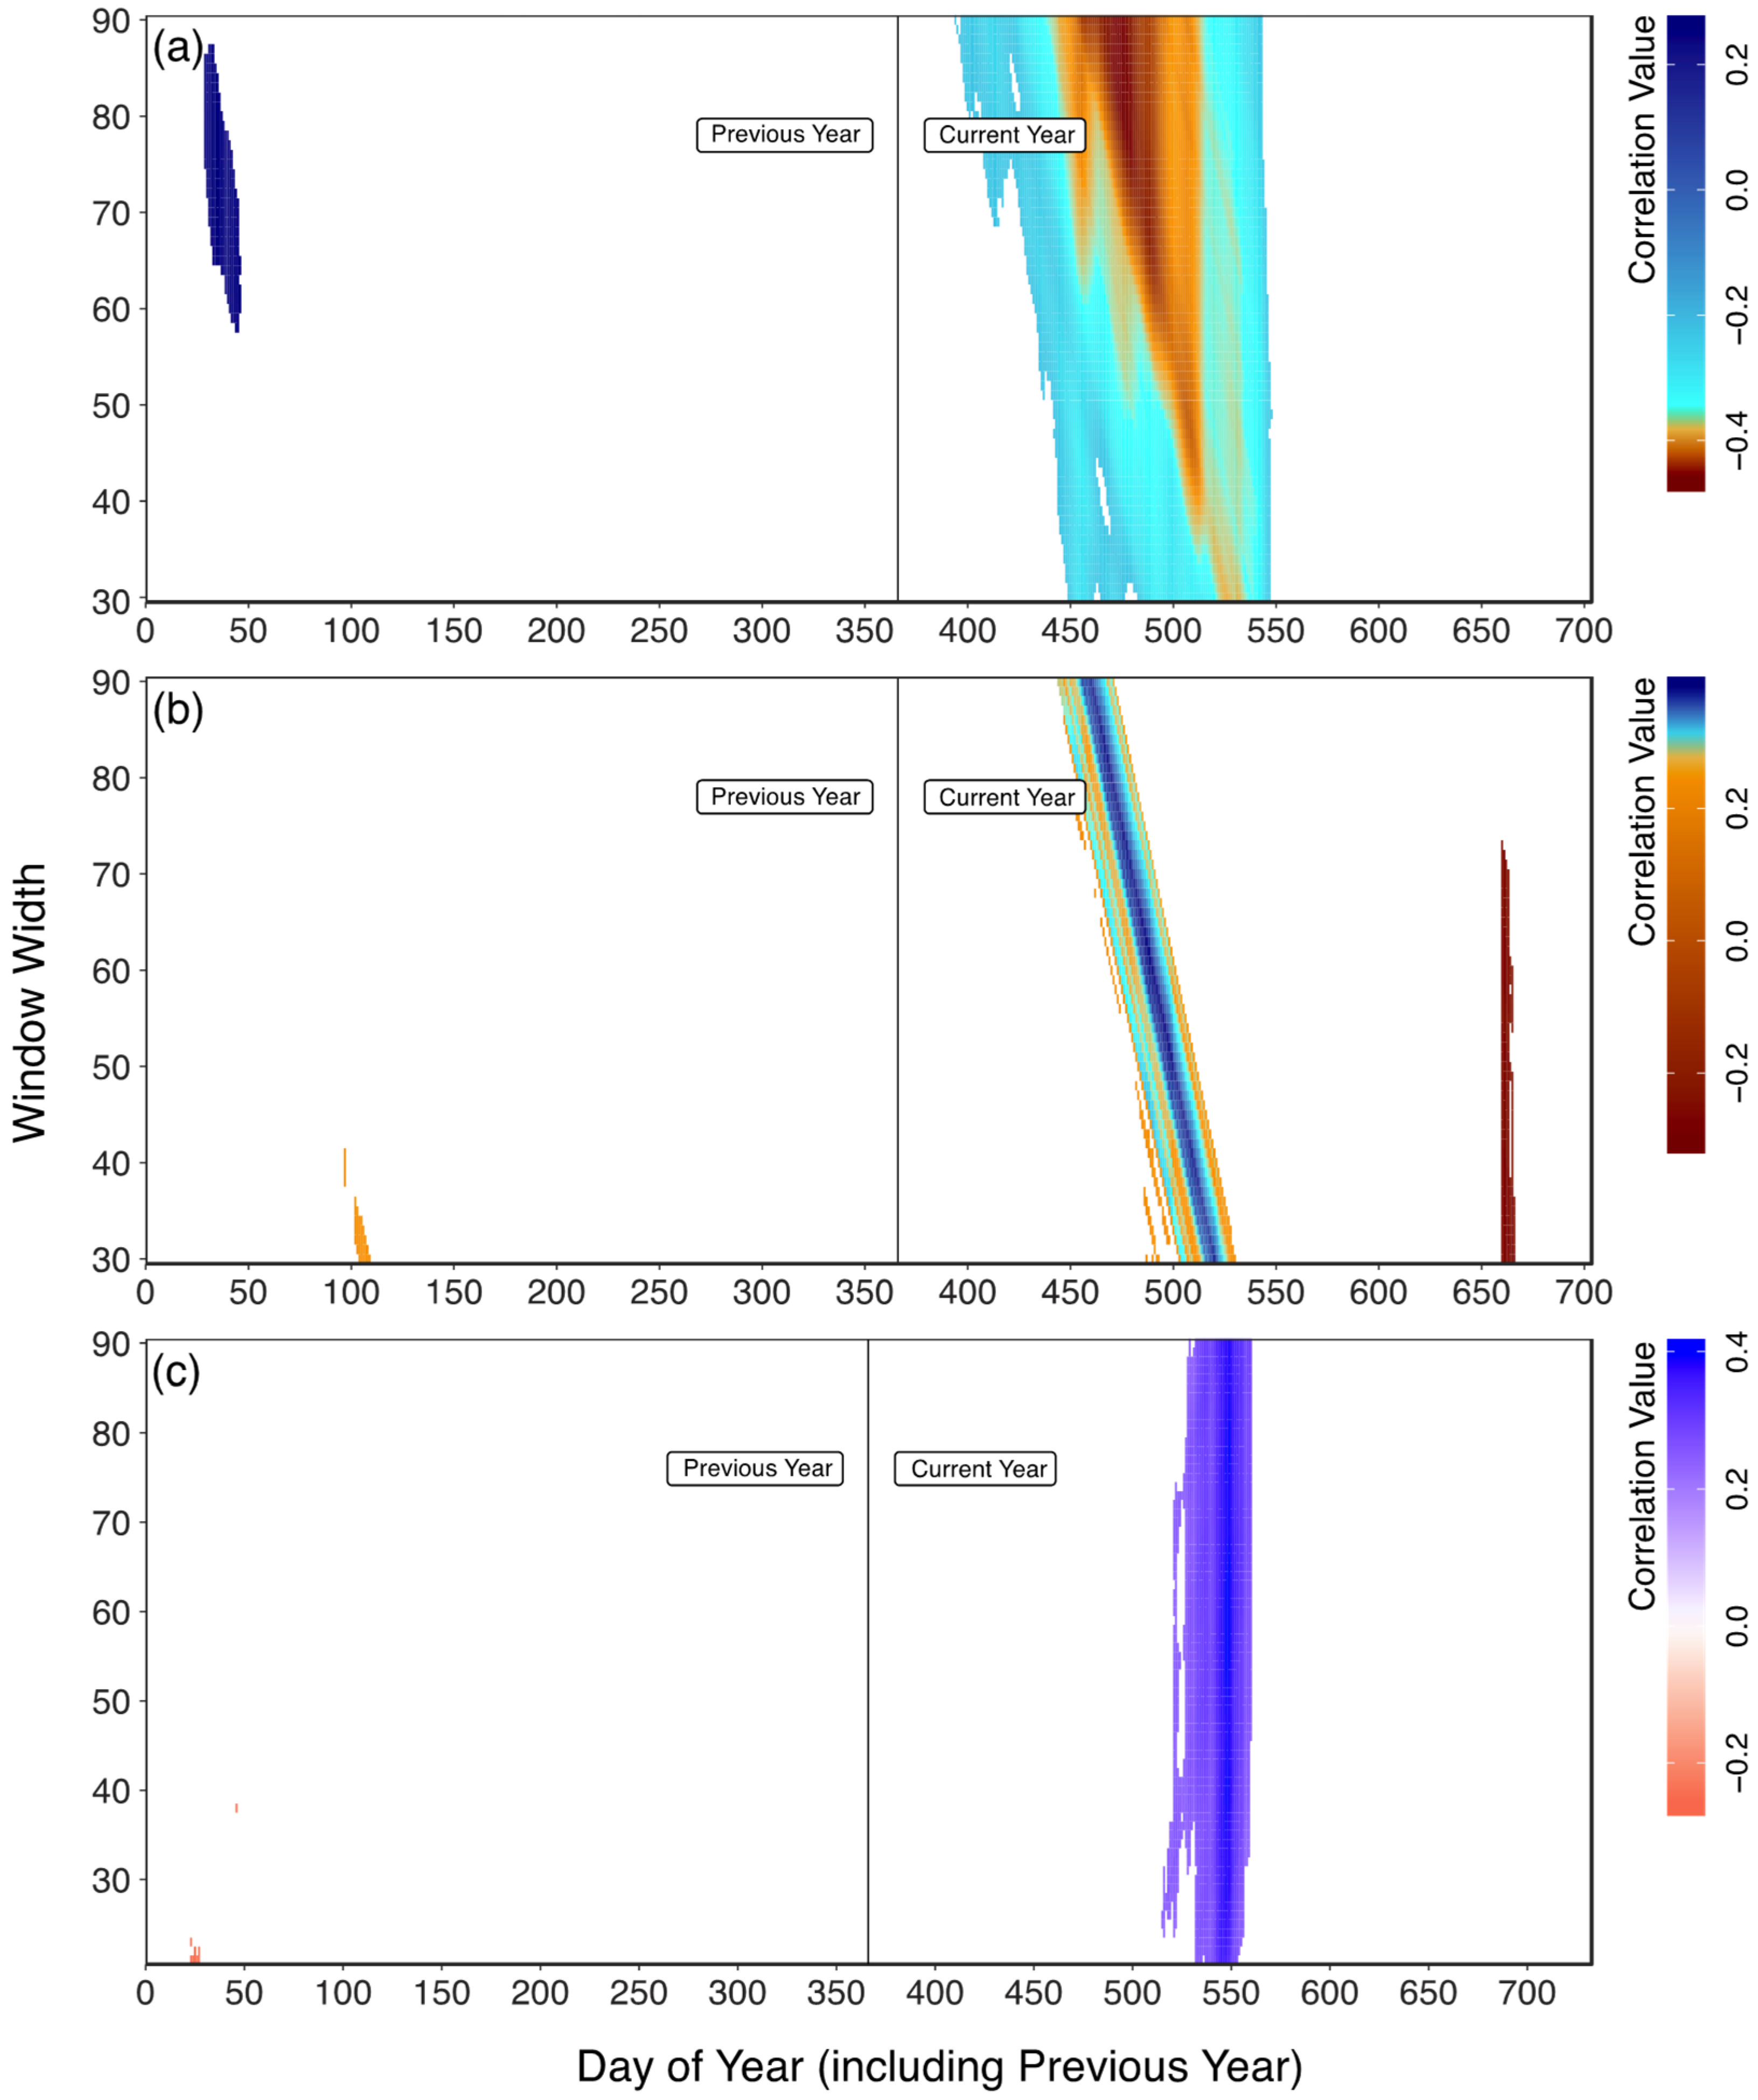
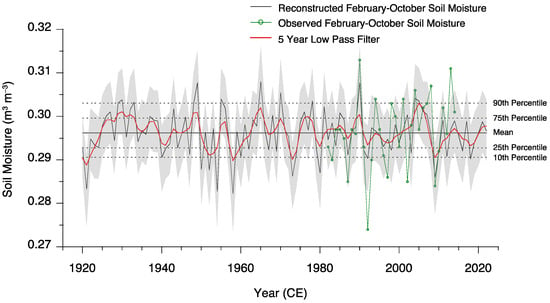
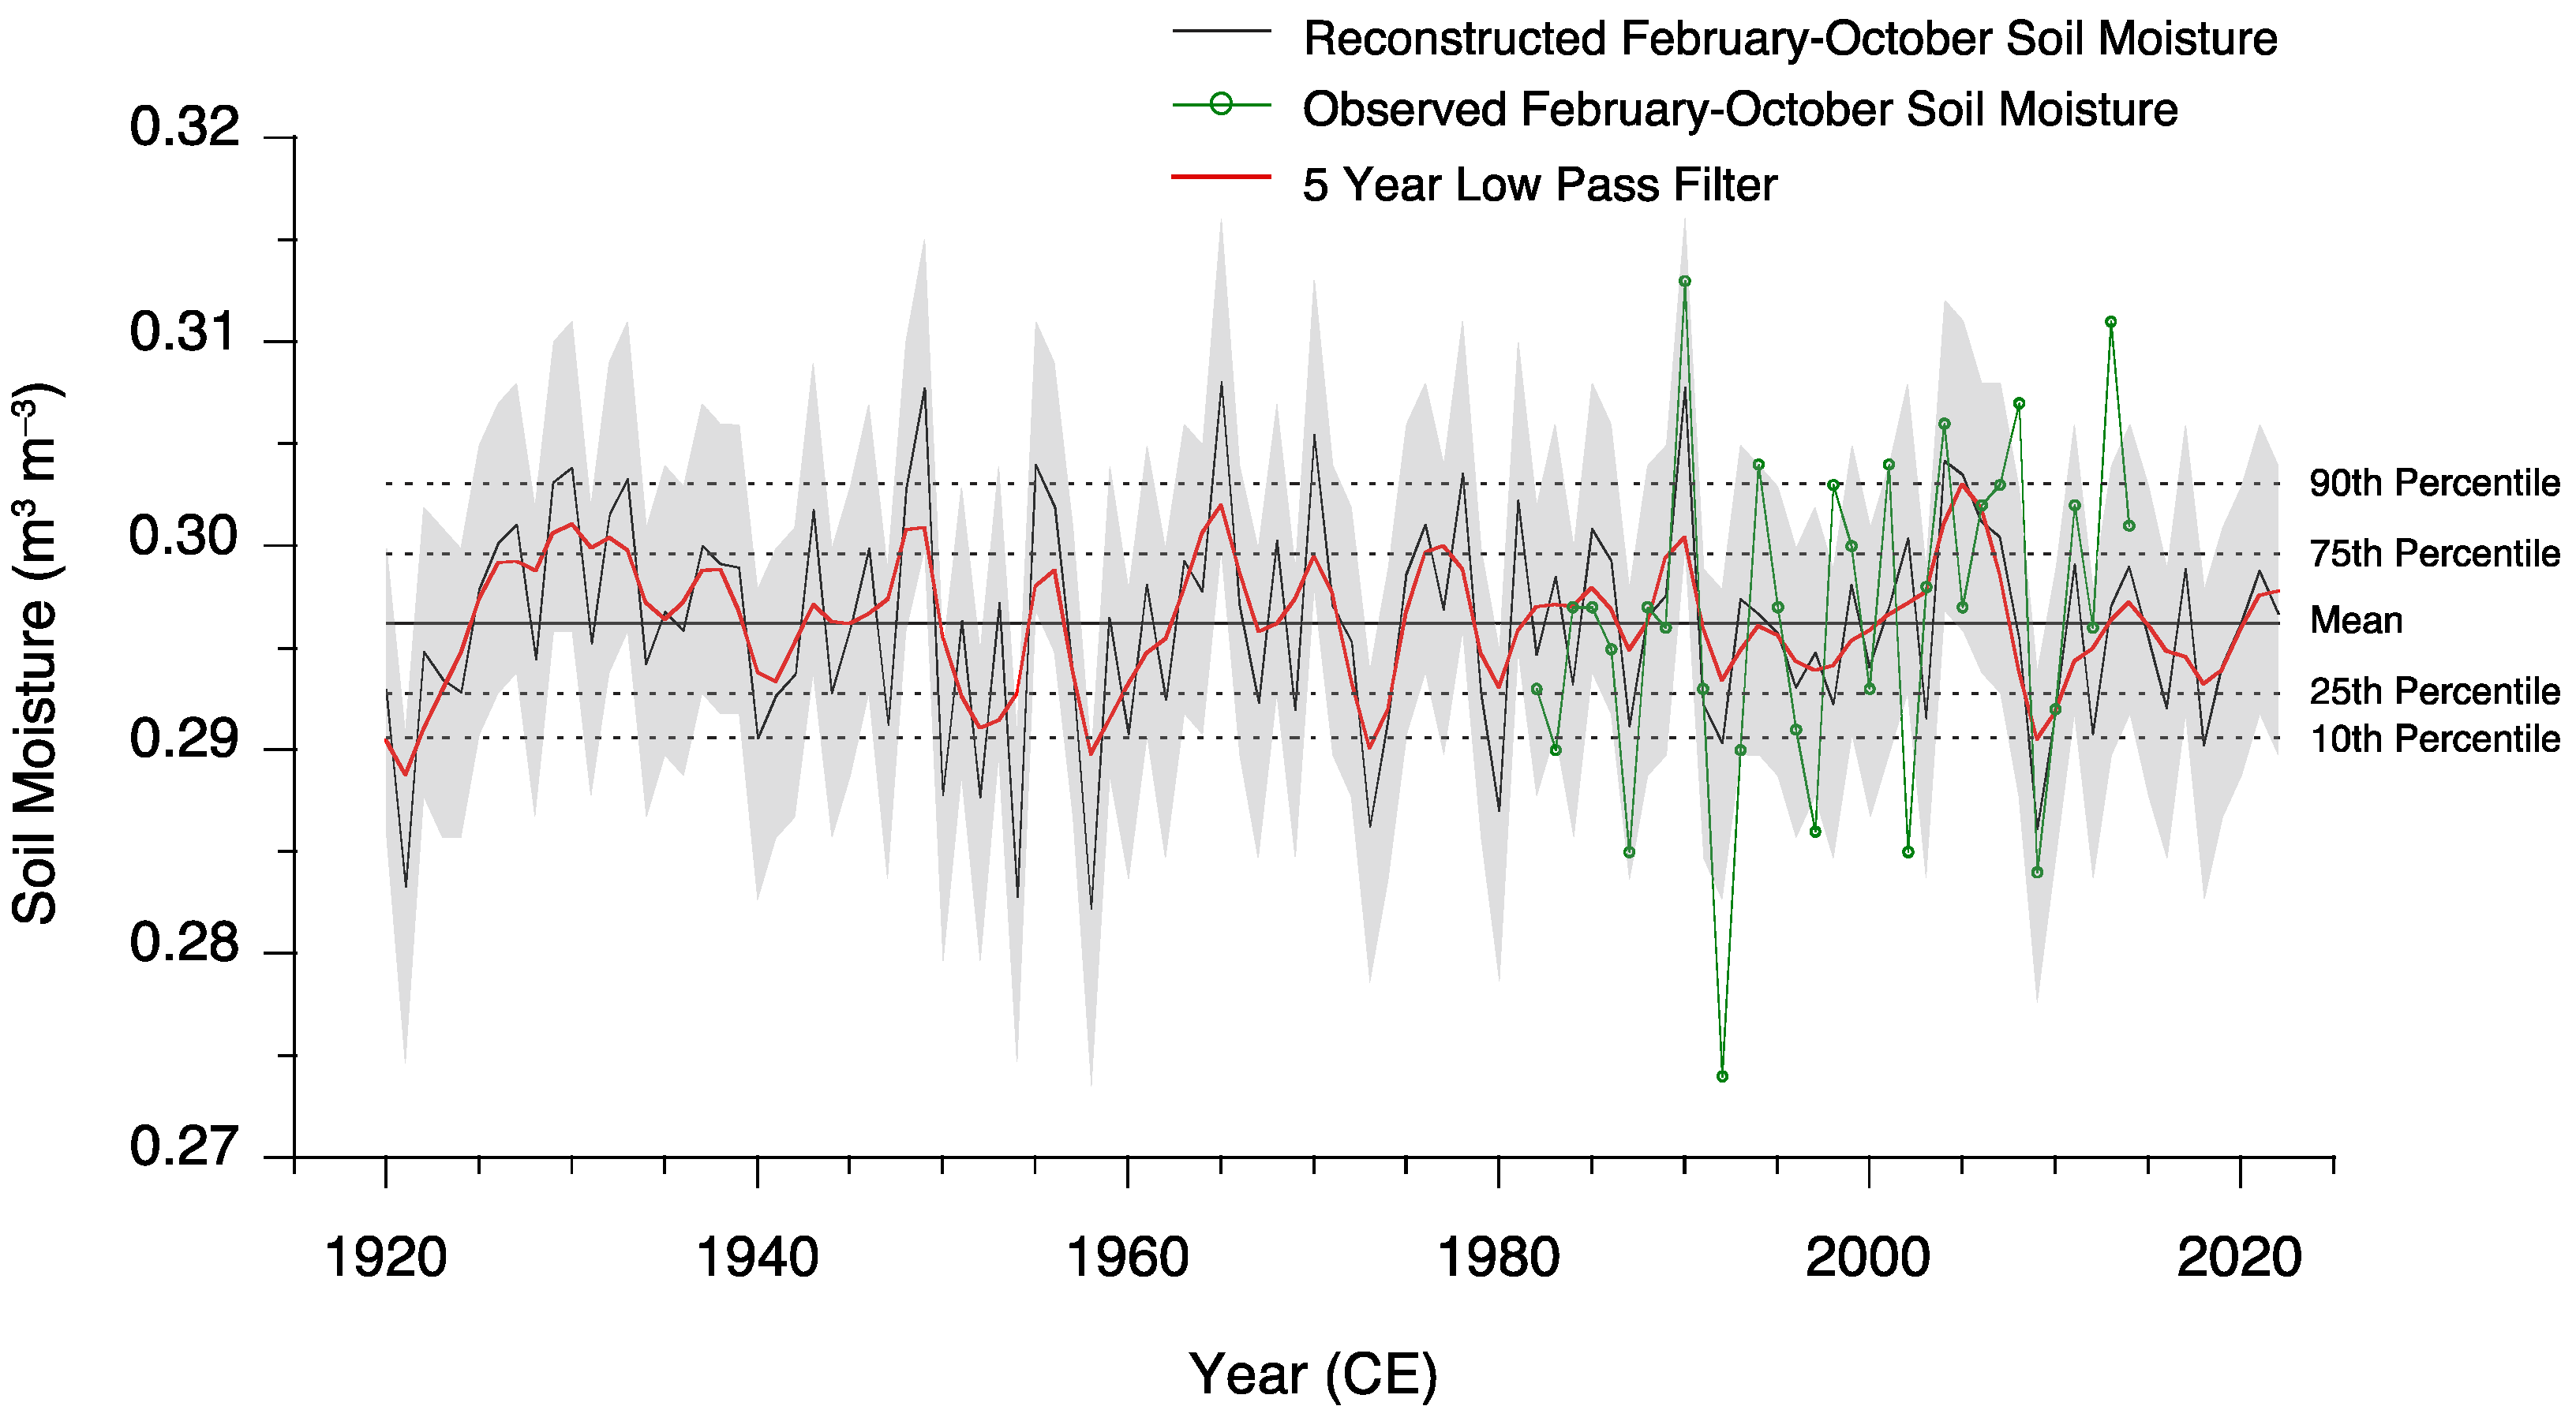
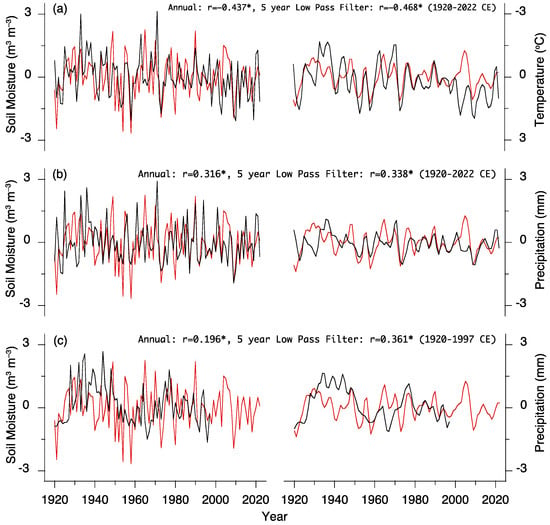
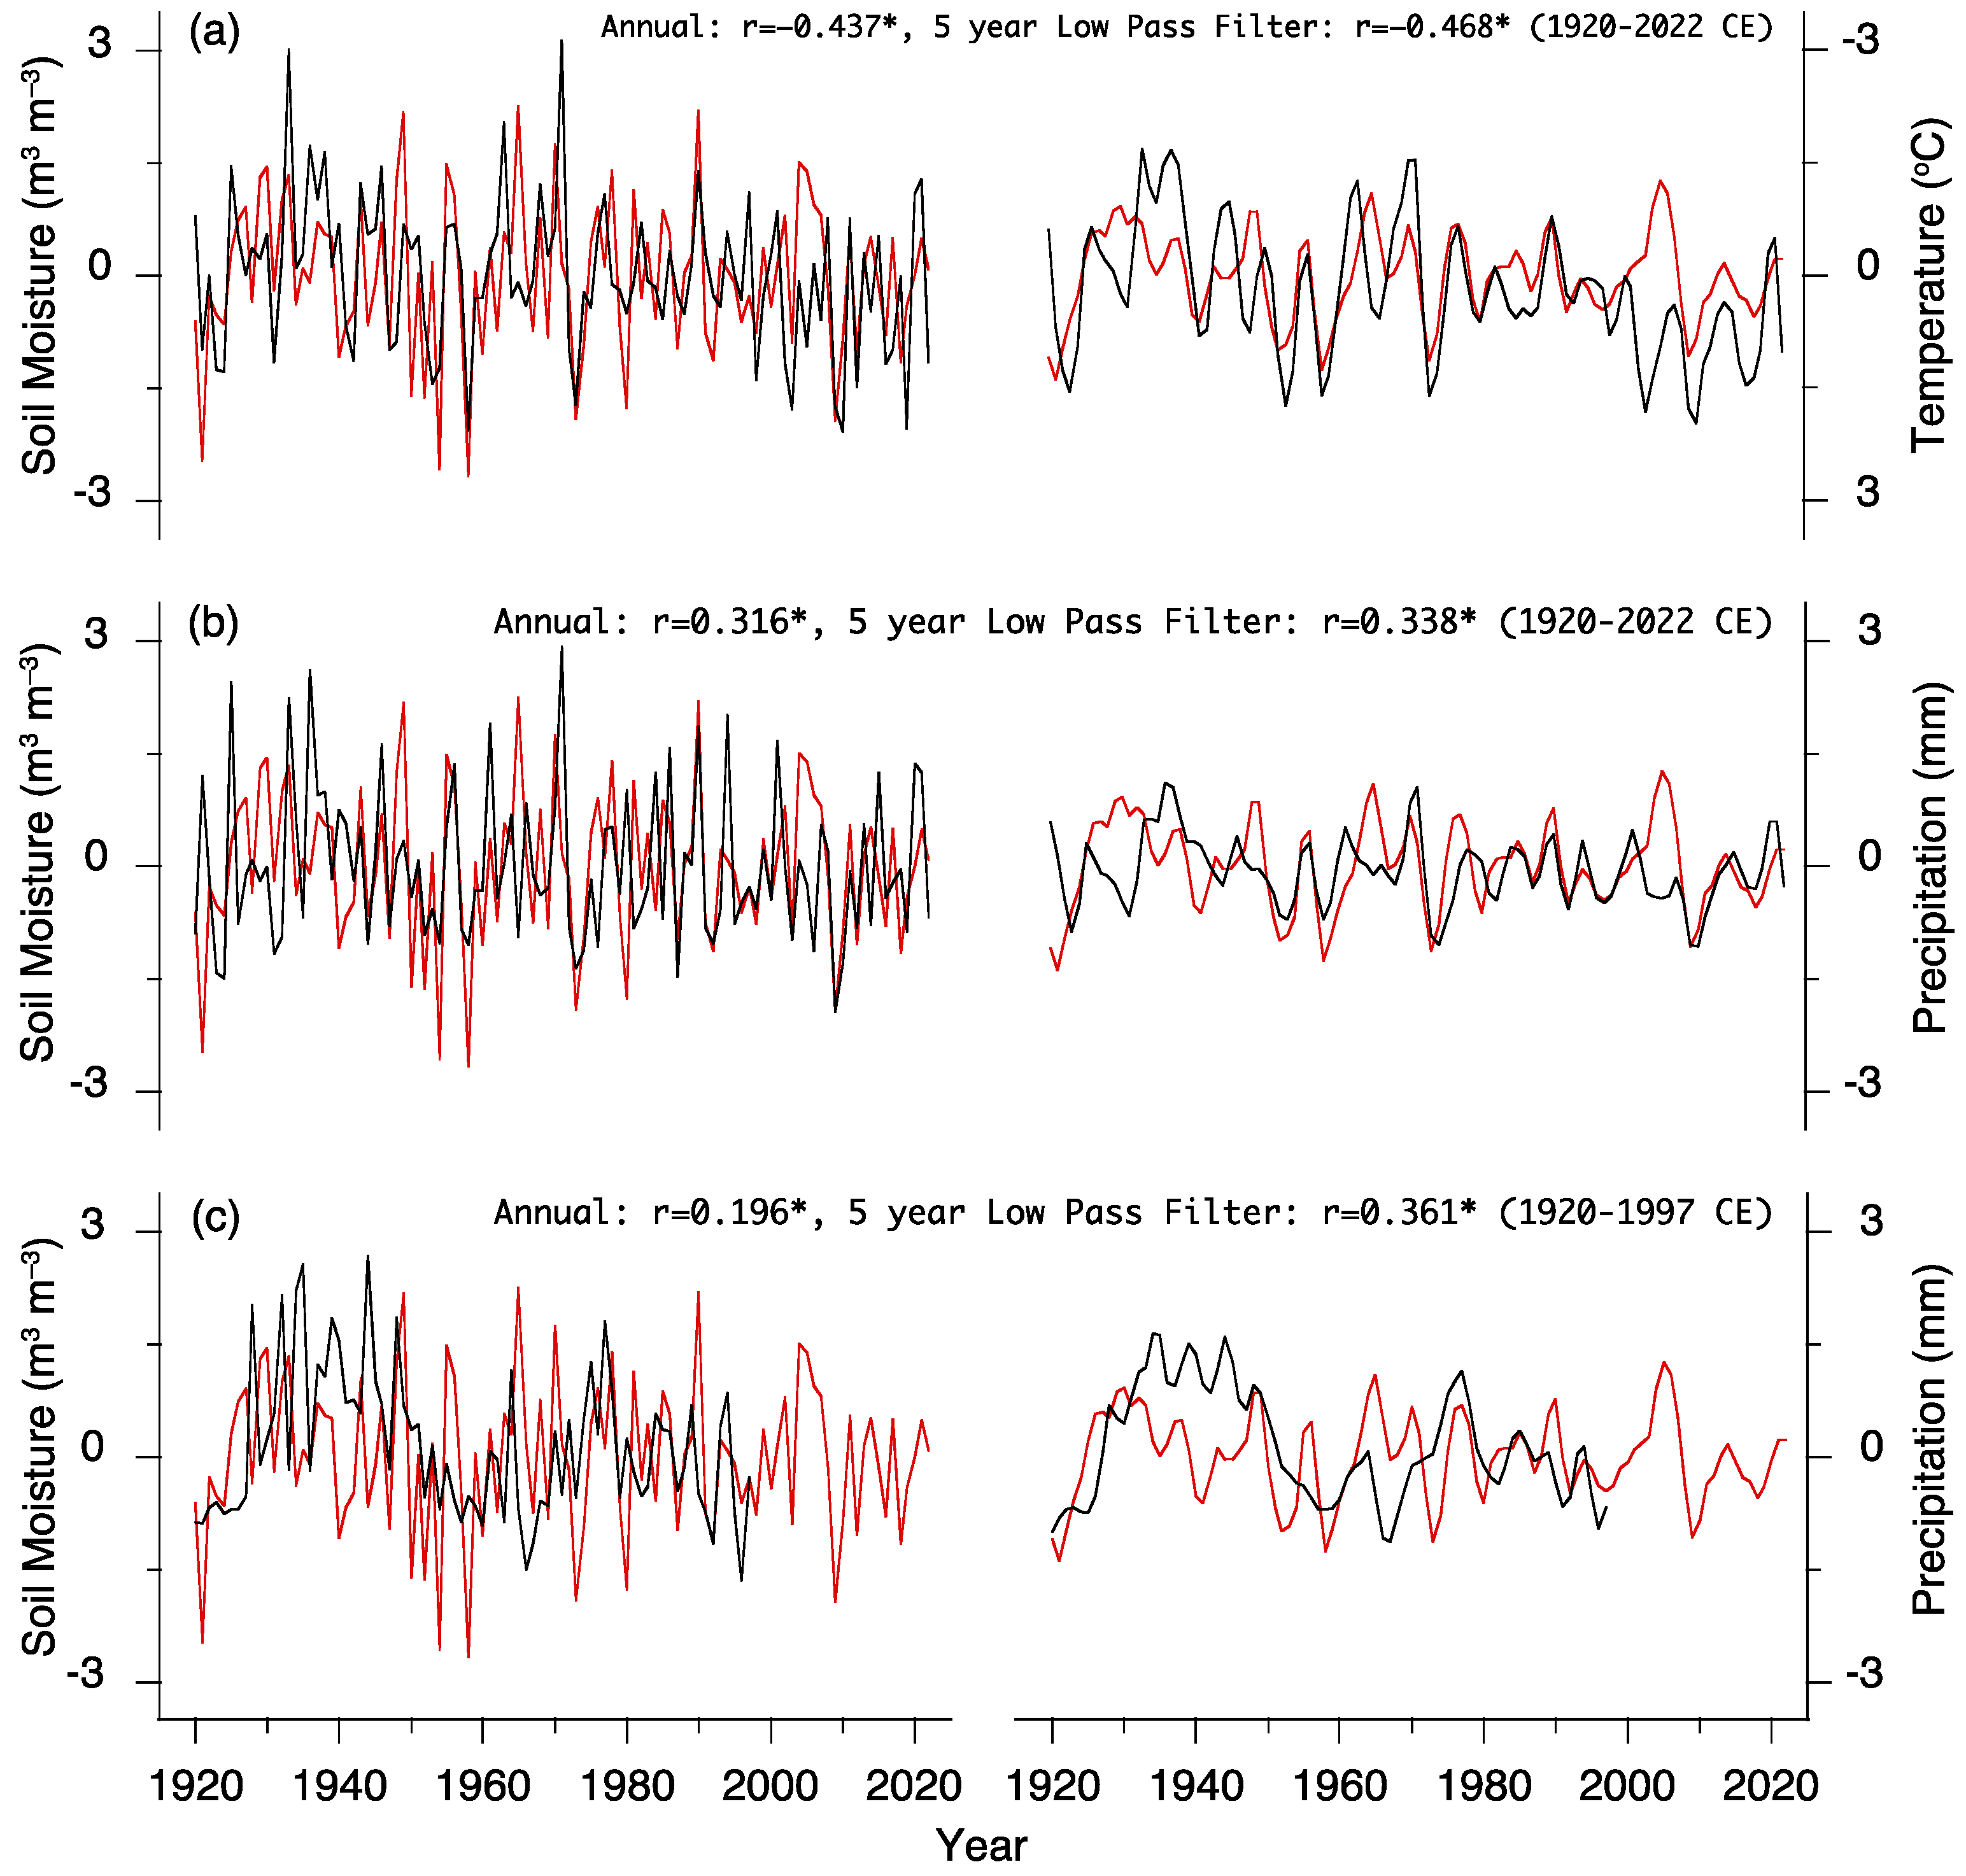

Disclaimer/Publisher’s Note: The statements, opinions and data contained in all publications are solely those of the individual author(s) and contributor(s) and not of MDPI and/or the editor(s). MDPI and/or the editor(s) disclaim responsibility for any injury to people or property resulting from any ideas, methods, instructions or products referred to in the content. |
© 2026 by the authors. Licensee MDPI, Basel, Switzerland. This article is an open access article distributed under the terms and conditions of the Creative Commons Attribution (CC BY) license.