


Abstract
Aligning information technology (IT) workforce demands with educational assessments is essential for bridging skills gaps; yet, no prior corpus maps IT task reasoning to Programme for International Student Assessment (PISA) proficiency levels. This paper introduces a large language model (LLM)-powered framework aligning IT competencies with PISA 2022 and the OECD (Organisation for Economic Co-operation and Development) Learning Compass 2030, drawing on O*NET v30.2 (Occupational Information Network), ESCO (European Skills, Competences, Qualifications, and Occupations) v1.2.1, PISA descriptors and OECD definitions. The framework operates in two stages: Stage 1 aligns 562 IT task statements with minimum PISA 2022 proficiency levels via LLM annotation and cross-model validation; and Stage 2 extends this mapping to the OECD Learning Compass 2030 through the semantic clustering of task embeddings and a bidirectional gap analysis of 95 ESCO transversal skills. Using Gemini 2.5 Flash, 562 tasks are annotated with minimum PISA levels across Mathematical, Reading, and Science literacy (first stage). Annotation reliability is assessed through a five-model cross-validation against a blind human domain expert (treated as a reference benchmark, not a gold standard) on a stratified 100-task sample (17.8% of the corpus), with agreement ranging from fair (Gemini 2.5 Flash, κ = 0.29) to moderate (Claude Haiku 4.5, κ = 0.50; LLaMA 3.3 70B, κ = 0.44). A bias-correction sensitivity analysis confirms that distributional findings remain stable after accounting for the primary annotator’s systematic overestimation, and OLS-calibrated alignment against O*NET ability ratings provides directional plausibility support. Validated tasks are embedded and clustered into 25 technical profiles via K-Means, each classified against OECD dimensions. The framework is extended to 95 ESCO transversal skills in 24 clusters. Bidirectional analysis reveals that, while every PISA proficiency level is engaged by at least one transversal cluster, 33% of these clusters, covering creative, ethical, social–emotional, and dispositional competencies, fall entirely outside PISA’s cognitive scope. This boundary mapping identifies where the PISA-based alignment is valid and where complementary tools are required for a full readiness assessment.
1. Introduction
The relationship between educational systems and labor market requirements has long been a central concern of education policy and workforce development research. Educational assessments such as the PISA measure what students can demonstrably do at the end of compulsory schooling, whilst occupational frameworks such as O*NET document what employees must do across thousands of job titles. Neither, on its own, answers the question that matters most to education policymakers, curriculum designers, and labor economists: at what cognitive level must a graduate actually perform to meet the minimum demands of a given occupation, and how does that threshold compare to what current student populations have measurably achieved?
This gap is particularly acute in the IT sector as IT occupations are among the fastest-growing and highest-compensating categories in OECD labor markets and simultaneously among the most cognitively demanding in terms of the breadth of reasoning they require. Software developers, data scientists, security analysts, and network architects are not simply required to recall technical syntax or apply pre-learned procedures; they routinely formulate novel solutions, interpret ambiguous data, reason inductively from empirical signals, and communicate complex findings to non-specialist stakeholders. These demands span the full range of the PISA literacy domains (Mathematics, Reading, and Science) and, in many cases, exceed the proficiency levels that the majority of students in middle- and lower-performing OECD countries can currently demonstrate. Understanding this gap quantitatively is a prerequisite for any evidence-based response, whether in the form of curriculum reform, targeted skill development programs, or education-to-employment transition policy. Empirical evidence confirms this urgency: a bachelor’s degree is no longer sufficient in routine-intensive IT industries, where a graduate-level cognitive capacity is increasingly required, underscoring the inadequacy of credential proxies and motivating direct cognitive task-demand measurement [1].
No prior study has annotated occupational task statements with PISA proficiency level descriptors. Existing approaches either apply Bloom’s Revised Taxonomy [2] to occupational complexity classification, describing the intended learning outcomes rather than demonstrated population-level achievement or aggregate O*NET ability ratings at the occupation level, which suppresses the intra-occupation cognitive variation that is central to identifying where the demand–supply mismatch actually occurs. Only an assessment-anchored framework such as PISA can support a direct comparison between measured student capability and workforce cognitive demand, and no prior work has operationalized this alignment at the task level. The significance of this work extends across several fields:
(a) For education policy, the framework provides a principled, evidence-based method for quantifying the cognitive distance between measured student populations and occupational entry requirements, expressed in the PISA proficiency levels that governments use to set national benchmarks;
(b) For curriculum design, it provides a granular map of where reasoning demands concentrate across IT occupations;
(c) For AI and educational technology research, the paper contributes a systematic methodology for deploying LLMs as annotation instruments for educational framework alignment, including an explicit five-model reliability analysis with human expert benchmarking and a bias-correction procedure that characterizes both the capabilities and limitations of this approach.
Our analysis contributes to the first PISA-aligned IT competency corpus, a reproducible annotation pipeline, and a structured map of coverage boundaries relative to the OECD Learning Compass.
2. Literature Review
2.1. Theoretical Foundations: Task-Based Labor Models, PISA, and the OECD Learning Compass
The foundation for analyzing work in terms of its constituent tasks rather than broad occupational categories was established by a task-based model of the labor market that distinguishes between routine and non-routine tasks and between cognitive and manual execution modes [3]. Later formalized into a broader framework [4], this tradition shifted the unit of analysis from the occupation to the task, enabling a finer-grained characterization of cognitive demand and its relationship to technological change. Binary cognitive/routine typologies have nonetheless been shown to mask the systematic within-category variation in technological impact, with richer multi-dimensional task taxonomies revealing differentiated effects invisible to simpler frameworks [5], a limitation the present paper addresses by deploying three independent PISA literacy dimensions as the classification scheme. This task-level approach has since been extended to questions of automation susceptibility, with estimates suggesting that approximately 47% of US employment was at risk of computerization [6], and, more recently, to examining how language models specifically alter occupational task demand [7]. Equilibrium models show task displacement concentrates at intermediate cognitive complexity [8], experimental evidence confirms AI tools disproportionately augment below-threshold workers while leaving high-complexity reasoning intact [9], and macro synthesis demonstrates that aggregate AI productivity gains are bounded by the cognitive depth of the affected tasks [10], all reinforcing that task-level characterization is the prerequisite for evidence-based workforce projection. Digital technologies have also been argued to increasingly substitute for cognitive rather than merely physical labor, a shift with direct consequences for the cognitive thresholds that educational systems must help students reach [11]. Two databases operationalize this tradition at scale: O*NET provides ability-rated task descriptions across more than 900 occupational titles, while ESCO organizes occupations, skills, and competencies in a multilingual hierarchy, providing explicit cross-referencing between job-specific technical skills and broader transferable competencies. Text-mining analyses of ESCO against Industry 4.0 technology trends reveal persistent coverage gaps, particularly in emerging knowledge domains, supporting the need for the cross-database integration of O*NET and ESCO to capture the full breadth of contemporary IT task demands [12].
PISA, administered by the OECD since 2000, assesses the mathematical, reading, and science literacy of 15-year-old students across 81 countries, defining literacy not as curriculum mastery but as the capacity to apply reasoning to authentic problems [13]. Each proficiency level is described by explicit descriptors anchored to the empirically derived item difficulty. Empirical work applying Bayesian Network modelling to PISA 2018 and 2022 data has further demonstrated that reading literacy functions as a causally upstream predictor of both mathematical and scientific achievement across country cohorts, revealing structural interdependencies between the three literacy domains that have direct implications for how PISA-aligned competency frameworks are designed and interpreted [14]. The 2022 Assessment and Analytical Framework defines these descriptors as anchored to what students at each threshold demonstrably do, not what they are taught, and explicitly incorporates computational thinking within mathematical literacy [15]. Longitudinal evidence demonstrates that cognitive skills as measured by international assessments, rather than years of schooling alone, are the principal driver of long-run economic growth and labor market outcomes [16]. Building on this evidence, ref. [17] estimates global losses from missing basic PISA skills at over $700 trillion, and the OECD has translated these findings into policy terms by advocating PISA data as a labor market benchmark [18], though neither has operationalized that alignment at the task level. The OECD Learning Compass 2030 [19] extends this framing further, organizing the broader competency landscape for 21st-century work across transformative competency categories, skill dimensions, and knowledge dimensions. This broader framing is warranted by labor-economic evidence that the market increasingly rewards social, dispositional, and higher-order competencies that standardized cognitive assessments are not designed to measure [20], underscoring why the Learning Compass, rather than PISA alone, is required as the full classification target.
2.2. Applied Studies, the Research Gap, and Our Contribution
The growing cognitive demand for advanced reasoning skills in IT occupations, outpacing what most OECD educational systems currently supply, motivates the use of scalable automated annotation to operationalize this gap at the task level. LLMs have been shown to outperform crowd-sourced annotators on structured text classification tasks, achieving a higher agreement with expert gold standards at a substantially lower cost [21]. Related work has applied NLP classification directly to ISCO-08 (International Standard Classification of Occupations) task descriptions for AI exposure estimation at scale, establishing that the automated task-level annotation of international occupational frameworks is methodologically accepted and policy-relevant [22]. In educational settings, LLMs have been applied to classify the cognitive level of assessment items and to align curriculum objectives with taxonomy levels, demonstrating that models can perform structured educational classification reliably at scale. Systematic reviews of LLMs in education identify structured framework alignment as a high-potential application but flag hallucination and construct validity as risks requiring explicit validation [23], risks addressed here through cross-model Cohen’s Kappa [24] analysis and OLS calibration against O*NET expert ratings. Fine-tuned BERT models struggle with ambiguous skill spans in professional text [25], motivating instruction-following LLMs for the more demanding task of PISA-level cognitive classification. Siamese BERT-network architectures enable efficient semantic similarity computation [26,27], supporting the sentence-embedding-based classification of ESCO transversal skills in job advertisements [28] and NLP-based ESCO-to-e-CF alignment that substantially outperforms manual matching [29].
Despite the breadth of research across these fields, a specific and consequential gap remains unaddressed. Occupational task databases such as O*NET provide detailed, ability-rated descriptions of what IT work requires and PISA provides empirically grounded, population-anchored measures of what students can demonstrably do; yet, no prior study has connected the two. Thus, no existing work has annotated occupational task statements with PISA proficiency level descriptors, applied those descriptors as a cognitive demand classification scheme, or used the OECD Learning Compass 2030 as a classification target for empirically derived IT competency clusters. The result is that the cognitive distance between what IT occupations demand and what educational systems demonstrably produce remains unquantified at the task level, the level at which curriculum reform and workforce policy decisions are ultimately made.
3. Methodology
The methodology operationalizes the theoretical gap identified in the literature review, the absence of a task-level bridge between empirically anchored educational assessments and occupational cognitive demand, through a reproducible, LLM-powered annotation pipeline. The pipeline maps individual IT occupational task statements to minimum PISA 2022 proficiency levels across Mathematics, Reading, and Science, then extends this mapping to the broader competency architecture of the OECD Learning Compass 2030. The framework operates in two stages: Stage 1 (PISA alignment): IT task statements are annotated with minimum PISA 2022 proficiency levels, validated through a five-model cross-comparison against a blind human expert, and calibrated against O*NET ability ratings via OLS regression; and Stage 2 (OECD and transversal alignment): the resulting task embeddings are clustered into IT competency profiles, each classified against the OECD Learning Compass 2030, and a bidirectional gap analysis with ESCO transversal skills delineates the boundary of PISA’s cognitive coverage. Together, these six steps operationalize the two stages (Figure 1):
Figure 1.
Methodology flow.
(1) Data preparation and occupational filtering;
(2) Primary LLM annotation using Gemini 2.5 Flash at zero temperature;
(3) A two-protocol assessment combining cross-model Cohen’s Kappa agreement against a human expert (primary validation) and OLS-calibrated plausibility alignment against O*NET ability ratings (secondary, non-independent check);
(4) The semantic clustering of task embeddings into IT competency profiles;
(5) The OECD dimension classification of the resulting clusters;
(6) A bidirectional ESCO transversal skills gap analysis designed to delineate the boundary of PISA’s cognitive coverage.
The first step is focused on data preparation and structuring, assembling and filtering the raw inputs from four publicly available sources that all subsequent steps depend on. Four publicly available sources are used throughout:
- (i)
- O*NET v30.2 (US Department of Labor) supplies Core IT task statements, occupation titles, and Standard Occupational Classification (SOC) codes and ability ratings across 52 dimensions;
- (ii)
- ESCO v1.2.1 (European Commission) provides the European IT occupation hierarchy and the transversal skills branch used in the gap analysis;
- (iii)
- PISA 2022 proficiency level descriptors (OECD, 2023) serve as the annotation target schema, with verbatim text embedded directly in the annotation prompt. The structural asymmetry between domains—Mathematics and Reading literacy include sub-levels 1c, 1b, and 1a, while Science literacy begins at 1b—is encoded throughout the pipeline;
- (iv)
- OECD Learning Compass 2030 concept notes (OECD, 2019) supply the nine dimension descriptions used in both the technical cluster and transversal skill classification prompts.
The selection of SOC code prefixes is based on the 2018 SOC Major Groups 11 (Management) and 15 (Computer and Mathematical Occupations) [30] to effectively isolate the core IT workforce from the broader O*NET dataset. This filtering strategy specifically targets roles responsible for the design, development, security, and management of information systems, as well as data-centric occupations like Data Scientists and Statisticians. Complementing this, the ISCO IT skill profiles (C25, C133, and C35) [31] align with the ISCO-08 classification for Information and Communications Technology Professionals (25), Managers (133), and Technicians (35). By using these hierarchical anchors, the pipeline ensures that the mapping between ESCO-based competencies [32] and PISA reasoning frameworks encompasses the full spectrum of technical depth and managerial responsibility required in the modern IT sector, providing a robust structural basis for the subsequent OLS-based calibration.
The second step performs the core annotation, assigning a minimum PISA proficiency level to each of the 562 task statements across three literacy domains. LLM-based annotation was selected for three reasons: the task requires a simultaneous familiarity with PISA 2022 descriptors and IT occupational language, a dual-expertise combination difficult to source through manual annotation; prior work has shown that LLMs achieve a higher agreement with expert gold standards than human annotators on structured text classification tasks at a substantially lower cost; and the scale of the corpus makes full expert annotation prohibitively expensive, whereas the five-model validation protocol with 100 human-expert-labelled tasks provides a statistically grounded reliability estimate at a fraction of the cost.
The primary annotation model is Gemini 2.5 Flash, accessed via the google-genai SDK with temperature set to 0. All responses are requested as structured JSON to eliminate markdown wrapping. Each task is annotated with the minimum PISA proficiency level required for competent performance, targeting cognitive reasoning demand rather than domain knowledge. The prompt provides the task statement, its occupation title, and the verbatim PISA descriptors for all three domains. For each task, the model returns a structured JSON object containing the following:
- (i)
- One sentence describing the highest complexity cognitive act in that task;
- (ii)
- The minimum PISA level per domain;
- (iii)
- A one-sentence justification citing the relevant level descriptor;
- (iv)
- The primary domain;
- (v)
- A confidence rating (high, medium, or low);
The prompt used for annotation is provided as follows:
You are a senior researcher in PISA 2022 assessment frameworks specializing in adult professional cognitive demands, not student performance.
- TASK STATEMENT:
- “{task}”
- JOB TITLE CONTEXT:
- “{occupation}”
- PISA MATHEMATICAL LITERACY LEVEL DESCRIPTORS:
- {math_levels}
- PISA READING LITERACY LEVEL DESCRIPTORS:
- {reading_levels}
- PISA SCIENTIFIC LITERACY LEVEL DESCRIPTORS:
- {science_levels}
- INSTRUCTIONS:
- 1. Before assigning levels, identify the single most demanding cognitive operation the task requires and state it explicitly in your reasoning.
- 2. Assign the MINIMUM PISA proficiency level a person must have reached to competently perform this task. A level is the minimum if, and only if, its descriptor fully covers the cognitive operation identified above.
- 3. Consider ONLY cognitive reasoning complexity—not domain knowledge. Domain knowledge is awareness of specific tools, protocols, terminology, or procedures (e.g., knowing how a firewall works). Cognitive reasoning is the mental process applied regardless of the domain (e.g., integrating ambiguous information, constructing a justification, or diagnosing a novel problem).
- NOTE:
- For Math and Reading, Level 1 is subdivided into 1c (lowest) → 1b → 1a.
- For Science, the lowest sub-level is 1b (there is no 1c).
- Return ONLY this JSON—no text outside it:
- {{
- “cognitive_demand_summary”: “<one sentence describing the highest complexity cognitive act in this task>“,
- “math_level”: <“1c”|”1b”|”1a”|2|3|4|5|6>,
- “reading_level”: <“1c”|”1b”|”1a”|2|3|4|5|6>,
- “science_level”: <“1b”|”1a”|2|3|4|5|6>,
- “math_reasoning”: “<one sentence citing specific language from the level descriptor>“,
- “reading_reasoning”: “<one sentence citing specific language from the level descriptor>“,
- “science_reasoning”: “<one sentence citing specific language from the level descriptor>“,
- “primary_domain”: “<math|reading|science>“,
- “confidence”: “<high|medium|low>“
- }}
The third step assesses the reliability and plausibility of the primary annotations through two protocols: a cross-model and human-expert agreement analysis (the primary validation evidence) and an OLS-calibrated convergent plausibility check against O*NET ability ratings (a secondary, non-independent indicator):
- (i)
- Expert and cross-model validation. To establish a reliability benchmark for the annotation logic, a stratified 100-task sample (17.8% of the corpus), balanced across three PISA level bands (low: 1c–2; mid: 3–4; and high: 5–6), is subjected to a multi-model validation protocol. First, the sample is independently annotated by a human domain expert blind to all LLM assignments, using the verbatim PISA 2022 descriptors. The human annotations in this study should be treated as a reference benchmark rather than a gold standard, and future replications should involve at least two independent annotators with explicit disagreement-resolution procedures. Second, the same 100 tasks are processed by four additional models of increasing capability and architectural diversity: Gemini 2.5 Pro, a higher-capacity model from the same family as the primary annotator; Claude Haiku 4.5, an externally developed model from a different vendor serving as a cross-architecture control; Gemini 3 Flash Preview, a more recent generation model; and LLaMA 3.3 70B, an open-source model accessed via the Groq API, included to assess whether annotation quality is achievable without proprietary model access. All models were queried using identical prompts and temperature settings (T = 0). Agreement between each model and the human expert is quantified using three metrics: (a) linear-weighted Cohen’s Kappa (k_w), which measures ordinal agreement while penalizing larger-level discrepancies more heavily, (b) the Mean Absolute Error (MAE), and (c) the exact-match percentage. To address the primary annotator’s directional bias, a sensitivity analysis applies per-domain bias correction to the full corpus and compares cluster-level summary statistics before and after correction.
- (ii)
- A convergent plausibility check via OLS-calibrated O*NET ability mapping. To assess whether the LLM-generated PISA annotations are directionally consistent with an independently constructed occupational ability taxonomy, we cross-referenced the model’s output with O*NET occupational ability ratings. Because the OLS coefficients are fitted to the same annotated dataset they evaluate, this check is inherently semi-circular and cannot serve as independent external validation. Rather than applying a manual or ad hoc scale conversion, we derived a data-driven linear calibration from the annotation data itself:
- Each PISA domain was mapped to its closest conceptual equivalents in the O*NET ability taxonomy:
- Mathematics literacy to Mathematical Reasoning and Number Facility;
- Reading literacy to Written Comprehension and Oral Comprehension;
- Science literacy to Inductive Reasoning, Deductive Reasoning, and Problem Sensitivity;
- To map O*NET ability scores (1–7 scale) to PISA proficiency levels (1c–6), we fitted a separate Ordinary Least Squares (OLS) regression model per domain. PISA levels were encoded as a continuous ordinal scale (1c = 1.00, 1b = 1.33, 1a = 1.67, 2 = 2.00, …, 6 = 6.00) and used as the dependent variable, with the mean O*NET ability score per occupation as the predictor. The model takes the form P = β0 + β1 × O, where P is the predicted PISA ordinal value, O is the mean O*NET Level score for the occupation, and β0 and β1 are domain-specific coefficients estimated via OLS from the annotated dataset (n = 562).
Additionally, a bias-correction sensitivity analysis is performed to assess whether the primary annotator’s systematic overestimation affects the corpus-level distributional findings. The mean signed bias per domain is computed from the 100-task validation sample and subtracted from all Flash annotations across the full 562-task corpus, with the results clipped to valid PISA bounds. Cluster-level summary statistics (median proficiency, percentage at Level 3+ and Level 4+) are recomputed on the corrected corpus and compared against the uncorrected values to establish distributional stability.
The fourth step aggregates the 562 individually annotated tasks into interpretable competency clusters through semantic embedding and unsupervised clustering, and classifies each resulting cluster against the nine OECD Learning Compass 2030 dimensions. Task texts are encoded using paraphrase-multilingual-mpnet-base-v2 Sentence-BERT embeddings; these 562 embeddings were then normalized and partitioned into 25 clusters using K-Means clustering (random_state = 42) to produce the IT Competency Demand Profile. Each cluster was automatically labelled by identifying the single task whose embedding was closest to the group’s centroid, e.g., the most “typical” task of that cluster. Each of the 25 technical clusters is classified against the nine OECD Learning Compass 2030 dimensions in a second LLM annotation pass, using the 12 most representative task texts per cluster as input. The prompt (below) returns a step-by-step reasoning, a primary dimension, up to three applicable dimensions, reasoning, and a confidence assessment.
You are an expert in the OECD Learning Compass 2030 framework.
- CLUSTER NAME: {cluster_name}
- REPRESENTATIVE TASKS:
- {tasks}
- OECD LEARNING COMPASS 2030 DIMENSIONS:
- {dims}
- INSTRUCTIONS:
- 1. Analyze the core cognitive, practical, and social activities described in the tasks above.
- 2. Review the OECD dimensions and identify which ones align closest to these activities.
- 3. Select the SINGLE most dominant (PRIMARY) dimension.
- 4. Select all relevant dimensions (maximum 3 total, including the primary).
- Return ONLY a valid JSON object matching this exact schema:
- {{
- “analysis”: “<Step-by-step reasoning: analyze the tasks and map them to the OECD dimensions. Do this FIRST.>“,
- “primary_dimension_id”: “<MUST BE ONE OF: TC01, TC02, TC03, SK01, SK02, SK03, KN01, KN02, KN03>“,
- “all_dimension_ids”: [“<id1>“, “<id2>“],
- “confidence”: “<high|medium|low>“
- }}
The fifth step examines whether different IT career specializations exhibit statistically distinct cognitive demand profiles, by re-aggregating the annotated tasks into seven functional sub-roles and applying the Kruskal–Wallis H-test across the three PISA literacy domains. To ensure statistical significance and reveal the cognitive signatures of the IT sector, individual SOC occupations were aggregated into seven functional sub-roles based on their primary technical objective: (1) Creative Construction (Software Development), (2) Analytical Modeling (Data & Research), (3) Operational Connectivity (Networks & Infra), (4) Adversarial Risk Management (Security), (5) Organizational Leadership (Management), (6) Evaluative Deconstruction (QA & Testing), and (7) Relational Structuring (Databases). This taxonomy allows for the identification of how PISA-level reasoning demands shift when moving from operational to creative or research-oriented IT functions.
To determine whether the identified IT career sub-roles exhibit statistically distinct cognitive profiles, the Kruskal–Wallis H-test was employed. This non-parametric method was selected over a standard one-way ANOVA because the target variables (PISA proficiency levels) are ordinal in nature rather than continuous and their distributions within the IT corpus do not necessarily meet the assumption of normality. The primary purpose of the test is to evaluate whether the samples from the independent sub-role categories originate from the same distribution. A significant H-statistic indicates that the cognitive demand in a specific literacy domain varies across the IT specializations, thereby validating the functional taxonomy used in our study and confirming that the IT sector is not a cognitively monolithic field.
The sixth and final step extends the analysis beyond technical task demands by conducting a bidirectional gap analysis of 95 ESCO transversal skills, mapping the precise boundary of PISA’s cognitive coverage against the full breadth of IT workforce competency. A complementary step examines the ESCO transversal (cross-cutting) skills demanded by IT occupations in order to delineate the boundary of the framework’s PISA-based alignment. A bidirectional analysis is conducted: the forward gap asks which transversal clusters are covered by PISA proficiency descriptors, while the inverse gap asks which PISA proficiency levels are engaged when IT professionals exercise their transversal competencies.
(1) Each of the 24 ESCO transversal skill clusters is classified via a structured Gemini prompt at temperature = 0. The prompt supplies the cluster name, the full list of skill labels with their ESCO definitions, and the nine OECD Learning Compass 2030 dimension descriptions. The model returns the following: the primary dimension ID, all applicable dimension IDs (up to three), an alignment rationale, and a pisa_coverage verdict (full/partial/none) with justification. The prompt is provided as follows:
You are an expert in OECD Learning Compass 2030 and the ESCO transversal skills taxonomy.
- ESCO TRANSVERSAL SKILL CATEGORY: {cluster_name}
- SKILLS IN THIS CATEGORY (label: ESCO definition):
- {skills}
- OECD LEARNING COMPASS 2030 DIMENSIONS:
- {dims}
- These are ESCO-curated transversal (cross-domain) skills applicable to all workers in any sector.
- Task: Classify this category against the OECD Learning Compass 2030.
- - Select the PRIMARY dimension (the best single match).
- - Select ALL applicable dimensions (1–3 total).
- - Judge whether PISA 2022 (Mathematics, Reading, or Science Literacy) directly assesses the cognitive demands described by these skills.
- Return ONLY this JSON:
- {{
- “primary_dimension_id”: “<TC01|TC02|TC03|SK01|SK02|SK03|KN01|KN02|KN03>“,
- “all_dimension_ids”: [“<id1>“, “<id2>“],
- “primary_reasoning”: “<two sentences: why this category maps to the primary dimension>“,
- “pisa_coverage”: “<full|partial|none>“,
- “pisa_coverage_reasoning”: “<one sentence: which PISA domain covers this, or why none>“
- }}
(2) A second prompt reverses the inquiry. For each of the 18 combinations of PISA literacy domain (Mathematics, Reading, and Science) and proficiency level (1a through 6), the model evaluates all 24 transversal clusters and determines whether exercising those skills engages the cognitive reasoning demanded by that PISA level (yes/partial/no). The best coverage across all clusters is recorded for each domain × level pair. Levels below 1a are excluded. The prompt is provided as follows:
You are an expert in PISA 2022 assessment frameworks and workforce competency alignment.
- CONTEXT: We are analyzing whether ESCO transversal (soft) skills require the same
- cognitive reasoning that PISA proficiency descriptors define. The goal is to identify
- PISA reasoning demands that are NOT engaged when IT professionals exercise their
- transversal competencies.
- PISA PROFICIENCY LEVEL DESCRIPTOR:
- Domain: {domain}
- Level: {level}
- Descriptor: {descriptor}
- ESCO TRANSVERSAL SKILL CATEGORY: {cluster_name}
- SKILLS IN THIS CATEGORY (label: ESCO definition):
- {skills}
- QUESTION: When an IT professional exercises the skills in this ESCO category,
- do they engage in the cognitive reasoning described by this PISA proficiency level?
- Answer scale:
- - “yes” = exercising these ESCO skills directly requires the reasoning this PISA level describes
- - “partial” = some skills in the category touch on this reasoning, but only partially or at a lower intensity
- - “no” = the reasoning demanded by this PISA level is not meaningfully engaged by these skills
- Return ONLY this JSON:
- {{
- “covered”: “<yes|partial|no>“,
- “reasoning”: “<one sentence: which skill(s) engage this PISA reasoning, or why none do>“
- }}
4. Results
4.1. Data Preparation and LLM Annotation
The filtering process isolated the core IT workforce from the broader O*NET 30.2 database. Applying the SOC Major Group 11 and 15 prefixes resulted in a corpus of 28 unique IT-specific occupations and 562 core task statements. This dataset encompasses 28 distinct job titles, ensuring coverage across development, management, and data science roles.
From the ESCO v1.2.1 framework, the recursive search of ISCO IT skill profiles C25, C133, and C35 (aligned with ISCO-08 groups) yielded 6618 technical skill relations (Table 1). Additionally, 2996 skills were extracted from the transversal skills (S6.0) to support the subsequent gap analysis.
Table 1.
Dataset summary.
The annotation pipeline achieved a 100.0% success rate for structured JSON retrieval from Gemini 2.5 Flash at temperature 0. Analysis of the reasoning fields indicates that 100.0% of annotations explicitly identified the “highest complexity cognitive act” prior to level assignment.
Fidelity to the PISA domain asymmetry was strictly maintained: while Math and Reading tasks utilized the 1c/1b/1a hierarchy, zero instances of Level 1c were assigned to the Science domain (as per the descriptor constraints). The model reported a “High” confidence in 98.9% of assignments, “Medium” in 1.1%, and “Low” in 0.0%, indicating a high internal consistency in applying the verbatim descriptors. An illustrative annotation trace is as follows:
Task statement (O*NET): “Direct daily operations of department, analyzing workflow, establishing priorities, developing standards, and setting deadlines.”
Identified cognitive demand: “Developing and applying systematic strategies to analyze complex operational workflows, identify constraints, establish optimal priorities, and create effective performance standards.”
PISA alignment Mathematics:
- Assigned level: 5
- Reasoning: “The task requires developing and working with models for complex situations, identifying or imposing constraints, and specifying assumptions to analyze workflow, establish priorities, and set deadlines, aligning with Level 5′s description of applying systematic, well-planned problem-solving strategies for challenging tasks like designing an optimal procedure.”
4.2. LLM Validation Steps
The results of the cross-model validation on a stratified subset of 100 tasks (17.8% of the corpus), balanced across PISA level bands, revealed a moderate agreement (as in Table 2) between Gemini 2.5 Flash and Gemini 2.5 Pro across all three literacy domains (κ = 0.568 for Mathematics, κ = 0.436 for Reading, and κ = 0.573 for Science). Exact agreement ranges from 33% (Reading literacy) to 49% (Mathematics literacy), with neither model systematically dominating: in Mathematics, Flash assigns marginally lower levels than Pro on average (avg. gap = −0.08), while, in Reading and Science, Flash assigns slightly higher levels (avg. gap = +0.12 and +0.14, respectively). None of the three domains exceeds the ±0.30 level threshold for systematic directional bias, indicating that the two models are broadly self-consistent across the corpus; the previously identified Science overestimation at n = 50 does not persist at the expanded sample size.
Table 2.
Cross-model agreement Gemini 2.5 Flash vs. Gemini 2.5 Pro.
While the Cohen’s Kappa scores indicate a moderate overall agreement, a granular review of the tasks that diverge by two or more proficiency levels provides critical insight into the nuances of automated task annotation.
In Table 3, the divergence between the models suggests a significant distinction between (1) procedural volume, the quantity of steps and data-handling required; and (2) cognitive complexity, the depth of abstract reasoning demanded by the task. We observe that Gemini 2.5 Flash occasionally assigned higher proficiency levels to tasks characterized by a high procedural volume, seemingly mistaking administrative scale and extensive documentation for high-level reasoning. In contrast, Gemini 2.5 Pro demonstrated a more precise alignment with PISA’s core methodology by prioritizing cognitive complexity. It focused on the requirement for mental modeling, hypothesis-testing, and inferential reasoning, correctly identifying that a task can be administratively broad yet remain cognitively simple or be procedurally brief while requiring advanced scientific or mathematical logic.
Table 3.
Divergence by two or more levels between models.
This inter-model comparison serves as a self-consistency check between models from the same family and does not constitute external validation against human expert judgement, which is reported in Table 4 and Table 5.
Table 4.
Cross-model agreement with human expert aggregate results.
Table 5.
Cross-model agreement with human expert detailed results.
Table 4 reports the aggregate agreement between each model and the human domain expert across the three PISA literacy domains (Mathematical, Reading, and Scientific literacy), measured by a linear-weighted Cohen’s Kappa, MAE, and exact-match accuracy. Table 6 disaggregates these results by domain.
Table 6.
Convergent validity results.
The human reference labels were provided by a single domain expert. Since the PISA-level assignment of occupational tasks is inherently interpretive, these labels represent one expert’s informed judgement rather than an adjudicated gold standard. The kappa values in Table 4 and Table 5 should accordingly be interpreted as agreement with a single reference point. The degree to which a second expert would assign different levels remains an open question for future multi-rater replication.
Across all domains, Claude Haiku 4.5 demonstrates the highest alignment with the human expert, achieving a weighted Kappa of 0.496 (moderate agreement) and MAE = 0.730, indicating that its classifications deviate from the expert’s judgements by less than one proficiency step on average. In Mathematics, Claude Haiku reaches κ = 0.573, approaching the threshold for substantial agreement, with an exact-match rate of 52%. LLaMA 3.3 70B, the only open-source model tested, achieves the second-highest agreement (κ = 0.436, moderate), demonstrating that annotation quality comparable to proprietary models is achievable without commercial API access and suggesting the portability to cost-sensitive or data-sovereignty-constrained research contexts. Gemini 2.5 Flash, the primary annotator, achieves κ = 0.286 (fair agreement, MAE = 1.293), while Gemini 2.5 Pro occupies a similar band (κ = 0.308, MAE = 1.227). Gemini 3 Flash Preview, a more recent model from the same family, slightly outperforms both earlier Gemini variants (κ = 0.316, MAE = 1.113), suggesting incremental gains in annotation alignment with each model generation, though the improvement remains within the “fair” agreement band.
Science proves the most challenging domain across all models: Claude Haiku’s exact-match rate drops to 27% and Flash’s to 13% (MAE = 1.58), pointing to the systematic overestimation of the cognitive complexity of science-adjacent tasks. Gemini 3 Flash Preview shows a moderate improvement in Science (κ = 0.291, MAE = 1.23) compared to Flash (κ = 0.237, MAE = 1.58), though it remains in the fair agreement range. Directional analysis confirms that Flash assigns a higher level than the human expert in 57–69% of cases across domains, with a mean overestimation of +0.62 levels (Math), +0.86 levels (Reading), and +1.04 levels (Science). This bias is systematic rather than random: predictions diverging by two or more levels from the human expert occur in 30% (Math), 34% (Reading), and 54% (Science) of the validation sample. By contrast, Claude Haiku shows near-zero directional bias (−0.06 to +0.16 levels), with only 4–12% of Math and Reading predictions diverging by two or more levels.
The consistent rank ordering across models (Claude Haiku > LLaMA 70B > Gemini 3 Flash Preview > Pro > Flash) confirms that annotation precision scales predictably with model reasoning capacity and generation recency. The primary annotator’s overestimation is conservative in direction, overstating rather than understating cognitive demands, a property whose implications for corpus-level distributional findings are examined in the sensitivity analysis below. OLS regression was fitted separately for each domain (n = 562 tasks). The estimated coefficients were as follows: Mathematics (β0 = 1.416, β1 = 0.879), Reading (β0 = −0.839, β1 = 1.260), and Science (β0 = −3.087, β1 = 1.917). The increasing slopes across domains suggest that scientific reasoning demands are most sensitive to occupational ability level (small differences in O*NET ability ratings translate into large differences in PISA reasoning level requirements), followed by reading comprehension and mathematical reasoning.
- i.
- Mathematics: PISA = 1.416 + 0.879 × O*NET_score
The positive intercept of 1.416 indicates that even the least demanding IT tasks require a baseline level of mathematical reasoning, while the slope of 0.879 reflects a steady, proportional increase in PISA level as occupational complexity grows. This gradual scaling suggests that mathematical demands are broadly distributed across all seniority levels in the IT sector, from entry-level support roles to advanced engineering positions.
- ii.
- Reading: PISA = −0.839 + 1.260 × O*NET_score
The negative intercept introduces a threshold effect: reading demands do not meaningfully differentiate PISA levels until O*NET ability scores exceed approximately 2.0. Beyond this threshold, however, reading demands escalate more steeply than mathematics, as indicated by the higher slope of 1.260. This pattern is consistent with the nature of IT reading tasks, where the transition from basic technical documentation to complex analytical synthesis is abrupt rather than gradual.
- iii.
- Science: PISA = −3.087 + 1.917 × O*NET_score
The large negative intercept combined with a slope of 1.917, more than double that of Mathematics, indicates that low O*NET scores in inductive and deductive reasoning correspond to minimal scientific reasoning demands, while moderate to high scores translate into rapidly escalating PISA proficiency requirements. This steep sensitivity confirms that scientific reasoning, encompassing hypothesis testing, causal inference, and problem diagnosis, is the most discriminating cognitive dimension in IT occupations. Small differences in occupational ability ratings in this domain produce significantly larger changes in the corresponding PISA proficiency level than in any other domain.
The results indicate a hierarchy of cognitive sensitivity across domains, where Science literacy is the strongest differentiator of advanced IT competency. This ordering has direct implications for curriculum design and workforce policy, as it suggests that interventions targeting scientific reasoning will have the greatest impact on aligning educational outcomes with the proficiency demands of the modern IT labor market.
4.3. OLS Convergent Plausibility Check
To assess the plausibility of the LLM-generated PISA annotations, each task’s assigned proficiency level was compared against the O*NET-calibrated benchmark using two statistics: (1) the Pearson correlation coefficient, where a value of p < 0.05 indicates a statistically significant association; and (2) the mean absolute deviation (MAD), where a value below 1.0 indicates that the model’s predictions are, on average, correct within one PISA proficiency level.
The results in Table 6 indicate that all three domains achieved statistical significance (p < 0.05), suggesting that the association between LLM annotations and O*NET benchmarks is unlikely to be attributable to chance. However, the effect sizes are modest: the Pearson correlations (r = 0.234–0.372) explain 5–14% of the variance, and the OLS benchmark is itself derived from the same annotated dataset, making this a semi-circular calibration check rather than fully independent external validation.
Mathematics literacy and Science literacy both achieved MAD values below 1.0, indicating sub-level accuracy. Reading literacy marginally exceeded the threshold (MAD = 1.015), though it produced the strongest correlation of all three domains (r = 0.372); Science demonstrated the most precise predictions overall.
These results provide directional plausibility support for the annotation pipeline’s construct alignment. The statistically significant correlations indicate that the LLM-generated PISA levels are not independent of occupational ability ratings. However, because the OLS model is fitted to and evaluated against the same Flash-annotated dataset, this constitutes a semi-circular calibration consistency check rather than independent external validation. The modest effect sizes (5–14% of variance explained) further caution against over-interpretation. The primary reliability evidence remains the human-expert comparison reported in Table 4 and Table 5, with the caveat that these results reflect agreement with a single reference annotator whose labels have not been cross-checked with a second independent expert.
4.4. Sensitivity Analysis and Bias Correction
To assess whether the primary annotator’s systematic overestimation affects the corpus-level distributional findings reported in subsequent sections, a bias-correction sensitivity analysis was performed. Using the 100-task validation sample where both Flash and human expert annotations are available, the mean signed bias per domain was computed: +0.62 ordinal steps for Mathematics, +0.86 for Reading, and +1.04 for Science. These values were subtracted from all Flash annotations across the full 562-task corpus, with results clipped to valid PISA ordinal bounds.
The uncorrected annotations position PISA Level 4 as the apparent cognitive floor; however, the sensitivity analysis (Table 7) indicates that, after correcting for Flash’s systematic overestimation, the defensible minimum is PISA Level 3, with the majority of clusters still aligning at or above Level 4.
Table 7.
Sensitivity analysis: raw vs. bias-corrected cluster-level results.
The correction shifts the median cluster demand by one full proficiency level: from Level 4 to Level 3 for Mathematics, and from Level 5 to Level 4 for both Reading and Science. However, the percentage of clusters at Level 3+ remains high (80–100%), demonstrating that the finding that IT tasks align at or above PISA Level 3 cognitive reasoning demands is robust to the primary annotator’s bias. The original claim of a Level 4 floor, as stated in the uncorrected results, should be interpreted with caution: it reflects the upper bound of the demand estimate prior to correction. The bias-corrected results support the more conservative conclusion that Level 3 constitutes the defensible minimum, with the majority of task clusters still aligning at or above Level 4 after correction.
It should be noted that the PISA 2022 descriptors are employed throughout this framework as an interpretive alignment tool for characterizing cognitive reasoning demands, not as a direct assessment of worker ability or as evidence that an individual must have achieved a given PISA score to perform a given task. The mapping reflects the structural correspondence between the reasoning operations described in PISA level descriptors and the cognitive demands implicit in occupational task statements.
4.5. Clusters and Building the IT Competency Demand Profile
A silhouette analysis over k ∈ [10, 40] yielded scores in a narrow range (0.062–0.082), with no dominant peak, a pattern consistent with the high semantic overlap inherent in natural language task descriptions within a single occupational sector. The elbow curve showed a gradual flattening beyond k ≈ 24. Given the statistical equivalence of solutions in this range, k = 25 was selected to approximate the number of distinct IT occupation groups in the O*NET SOC taxonomy, favoring domain interpretability. The semantic coherence of the resulting clusters was confirmed through LLM-based thematic labelling, which produced distinct, non-overlapping descriptions for all 25 clusters. Low silhouette scores are an inherent property of Sentence-BERT embeddings applied to semantically overlapping natural language descriptions within a single occupational domain; they do not invalidate the clusters as interpretive aggregation units. All cluster-level summary statistics reported in this study, including median PISA levels, Level 3+ and Level 4+ percentages, and OECD dimension assignments, are conditional on the K-Means k = 25 solution and should be read as characterizing the distributional structure of the annotated corpus under one interpretable partitioning rather than as evidence of discrete, well-separated competency groups. Table 8 shows the resulted clusters that represent the full spectrum of cognitive work in IT occupations. Under the 25-cluster K-Means solution, selected for domain interpretability rather than statistical separability and characterized by low silhouette scores (0.062–0.082), the analysis of the 562 annotated IT tasks reveals that 20 of the 25 clusters (83.8% of tasks) attained median PISA scores at or above Level 4 across all three literacy domains simultaneously. The highest-demand clusters (Levels 5–6 across all three domains) were research-oriented tasks (Cluster 19) and advanced network/system development (Clusters 7, 8, 23, and 16), reflecting the cognitive ceiling of IT work. Only five clusters, representing approximately 91 tasks (16.2%), fell below Level 4 in at least one domain, corresponding to more routinized operational activities.
Table 8.
Clusters resulted based on task descriptions.
For the OECD Learning Compass 2030 classification, the unit of analysis was the task cluster rather than the individual task. Each of the 25 clusters was represented to the LLM by a sample of its constituent tasks drawn to preserve the most canonical, high-frequency examples within each group. The sample size was set to 12 tasks per cluster, approximately 53% of the mean cluster size of 22.5 tasks; this sample should provide sufficient coverage, exceeding the majority of each cluster’s composition, for reliable identification, while maintaining a well-structured prompt that could be consistently parsed across all clusters.
All 25 clusters were classified with high confidence. The primary dimension distribution is as follows:
- TC01 (Creating new value) is the dominant dimension in 16 of 25 clusters (64%) as in Table 9, encompassing programming, system design, network problem-solving, web development, database architecture, and continuous professional learning, confirming that the core cognitive demand of IT work is adaptive problem-solving, the ability to generate novel solutions rather than merely apply established procedures.Table 9. OECD Learning Compass classification and primary dimension per cluster.
- SK01 (Cognitive and meta-cognitive skills) is primary in 5 clusters (20%), covering statistical method evaluation, business intelligence synthesis, project planning, network availability monitoring, and system configuration recommendation. In these clusters, the defining activity is structured critical thinking and self-regulated analytical reasoning rather than open-ended creation.
- TC02 (Reconciling tensions and dilemmas) is primary in 2 clusters (8%), covering stakeholder requirements consultation and usability collaboration with development teams. The defining cognitive demand here is the navigation of conflicting requirements between users, engineers, and management, a fundamentally relational and negotiation-oriented competency.
- TC03 (Taking responsibility) is primary in 1 cluster (4%), the information security standards cluster, where the ethical and accountability dimension of protecting systems and data constitutes the fundamental driver of all task activity.
- SK03 (Practical and physical skills) is primary in 1 cluster (4%), covering GIS data visualization and mapping tasks, where technical precision in tool operation is the defining demand.
None of the three Knowledge dimensions (KN01–KN03) emerged as the primary driver of any cluster, signaling that the core cognitive demand of IT work is not the possession or recall of disciplinary, interdisciplinary, or epistemic knowledge, but the application of that knowledge in creative and adaptive problem-solving contexts, precisely the type of reasoning that PISA Levels 4–6 are designed to assess.
As seen in Figure 2, which maps all OECD dimension appearances across the 25 clusters, including primary, secondary, and tertiary assignments, SK01 (Cognitive and meta-cognitive skills) appeared as a secondary or tertiary dimension in all 25 clusters, confirming that analytical thinking is a non-negotiable baseline across all IT task types, regardless of specialization. TC01 (Creating new value) follows with 18 appearances and Knowledge dimensions (KN01–KN03) appear only sparingly and never as a primary driver, which reveals that IT work consistently demands the application of thinking skills over the mere possession of knowledge.
Figure 2.
OECD Learning Compass 2030 coverage in IT competency demand profile.
As seen in Table 10 and Figure 3, under the chosen K-Means partitioning, every IT cluster exhibits a median PISA level of at least Level 3 across all three domains in the uncorrected annotations. Given the low silhouette scores, this pattern reflects a consistent distributional characteristic of the corpus rather than evidence of a sharply bounded cluster structure. After bias correction (Table 7), this floor remains at 80–100% coverage depending on domain, confirming the robustness of the Level 3 minimum. Reading and Science both have a median of Level 5, whereas Science is the only domain where 100% of clusters require Level 4 or above. This confirms that Science and analytical reasoning are non-negotiable baseline requirements across all IT occupations, regardless of specialization.
Table 10.
Summary statistics IT competency demand profile.
Figure 3.
PISA-aligned cognitive reasoning demands across 25 IT competency clusters.
In terms of cross-domain correlation, Mathematics–Reading (r = 0.678), Mathematics–Science (r = 0.735), and Reading–Science (r = 0.645), all three are moderately to strongly correlated, meaning tasks that are cognitively demanding in one domain tend to be demanding in all three; the competencies reinforce rather than substitute each other. The highest correlation was observed between Mathematics and Science, suggesting a tight coupling between algorithmic logic and troubleshooting-based inductive reasoning.
The most frequent cognitive requirement is a simultaneous demand for PISA Level 5 across all three domains (Mathematics, Reading, and Science), representing 40% of all clusters (10 of 25). Furthermore, the data reveals that the minimum requirements for Reading literacy consistently exceed those for Mathematics by an average of 0.40 levels, highlighting that modern IT roles require more than just quantitative computation; they place an even heavier burden on the ability to interpret, evaluate, and synthesize complex technical texts and specifications.
4.6. Sub-Role PISA Profile Comparison
The 562 annotated IT tasks were grouped into career sub-roles based on their O*NET SOC codes. The categories are visible in Figure 4, which reveals a clear two-tier structure across IT career sub-roles. Data & Research, Databases, and Management consistently reach Level 5 across all three literacy domains, while Networks & Infrastructure and QA & Testing settle uniformly at Level 4. The most striking profiles are the domain-split sub-roles: Software Development (the largest group with 220) demands Level 5 in Reading and Science but only Level 4 in Mathematics, reflecting the heavy burden of specification interpretation over formal computation; Security shows the inverse pattern, reaching Level 5 only in Scientific Literacy, driven by the causal and hypothetical reasoning required for threat modelling. No sub-role falls below Level 4 in any domain.
Figure 4.
PISA-aligned cognitive reasoning demands by IT career category.
The results of the Kruskal–Wallis H-test confirm that the IT sector is not cognitively monolithic, revealing highly significant differences in PISA proficiency requirements across the eight identified sub-roles for Mathematics (H = 76.18, p < 0.001), Reading (H = 49.35, p < 0.001), and Science literacy (H = 49.19, p < 0.001). The notably higher H-statistic for the mathematical domain suggests that quantitative reasoning serves as the primary differentiator of cognitive demand between IT specializations, whereas reading and scientific reasoning exhibit slightly more uniform requirements across the sector.
4.7. Annotation Analysis
The annotation pipeline’s internal consistency is reflected in the 98.9% high-confidence rate achieved during classification; however, the model-reported confidence should not be conflated with external validity, which is assessed separately in the human expert comparison (Table 4 and Table 5) and bias-correction analysis (Table 7). We found that 98.9% of all tasks were successfully mapped to PISA proficiency levels with a “high” confidence, and only 1.1% with a “medium” confidence. The total absence of “low-confidence” annotations indicates a strong semantic resonance between the linguistic descriptors used in the IT competency corpus (O*NET/ESCO) and the cognitive reasoning requirements defined by the PISA 2022 framework.
The analysis revealed a complexity-certainty correlation (Figure 5), where the model demonstrated a higher confidence when evaluating tasks at the upper end of the PISA scale. High-confidence tasks across all domains averaged a total PISA demand score of 13.4, whereas the small subset of tasks requiring only a “medium” confidence averaged significantly lower at 7.3. This disparity suggests that top-tier IT competencies, such as designing complex neural architectures or evaluating systemic security protocols, utilize precise, technically explicit language that maps directly with PISA Level 5 and 6 descriptors. Conversely, more routine or operational tasks at the PISA Level 3–4 threshold possess a flatter linguistic profile, introducing a degree of ambiguity for the model when distinguishing between basic functional application and the onset of professional-level reasoning.
Figure 5.
Heatmap of mapping MAD between LLM-annotated and O*NET-derived PISA levels.
Figure 5 maps the MAD between LLM-annotated and O*NET-derived PISA levels across eight IT sub-roles and three literacy domains. Networks & Infrastructure is the most difficult sub-role to annotate consistently, with all three domains exceeding the threshold (Mathematics 1.13, Reading 1.12, and Science 1.13). This reflects the high within-occupation variability of networking tasks: a single SOC code spans both routine operational work and highly abstract system design, making a single O*NET score a poor benchmark for individual task-level annotations.
Security stands out as the most internally consistent sub-role, with the lowest MAD across all three domains (0.68, 0.69, and 0.58, respectively). Security tasks define a narrow, well-characterized cognitive type that both the LLM and O*NET evaluate similarly.
Reading literacy shows the widest spread of disagreement, exceeding 1.0 in five of the eight sub-roles, confirming that the LLM systematically interprets reading demands more broadly than the O*NET Written Comprehension score captures, particularly in roles with heavy documentation or specification requirements.
4.8. Transversal Skills Gap
The transversal analysis extends the study’s core technical skill alignment by examining the soft-skill dimension of IT workforce competency.
In Figure 6, the forward-direction chart (left side) reveals that PISA provides partial or no coverage for 83% of ESCO transversal IT skill clusters (20 out of 24). Only 4 clusters (17%) achieve full alignment with PISA proficiency descriptors; a further 12 clusters (50%) are partially covered, meaning their cognitive demands overlap with PISA in some domains or levels but not consistently across the full literacy spectrum. Critically, 8 clusters (33%) receive no coverage whatsoever, confirming a substantial structural blind spot in the PISA assessment framework relative to the competency demands of the IT workforce.
Figure 6.
Forward and inverse gaps results.
Examining PISA from the ESCO side (inverse-direction chart), asking whether any IT transversal skill engages each PISA proficiency level, reveals that 16 out of 18 domain × level pairs (89%) are covered by at least one transversal cluster. The two exceptions are Mathematics literacy Level 6 and Science literacy Level 6, which reach only partial coverage: no single transversal cluster fully demands the abstract modelling and symbolic reasoning required at the highest proficiency tier. Zero PISA levels are missing, meaning that PISA levels are always touched by some IT transversal skill, but ESCO transversal skills extend well beyond what PISA can detect.
Table 11 shows all 8 clusters that fall entirely outside the three cognitive literacy pillars of PISA, representing the social-emotional, ethical, dispositional, and creative competencies that OECD research identifies as essential for the 21st century, but remain invisible in PISA’s assessment design.
Table 11.
Clusters with no PISA coverage.
The transversal gap analysis serves to delineate the boundaries of the proposed framework. The core pipeline successfully aligns the cognitive-technical dimension of IT workforce demand to PISA proficiency levels, confirming that PISA’s literacy constructs are a valid reference point for reasoning complexity in IT task statements. However, the bidirectional analysis of ESCO transversal skills reveals that 33% of soft-skill clusters, primarily social–emotional, ethical, and creative competencies, operate outside PISA’s cognitive-literacy scope, identifying which complementary assessment dimensions would be needed to extend the approach to the full breadth of workforce readiness. The framework thus contributes both a working alignment tool for cognitive competencies and a structured map of where its coverage ends, providing a foundation for future multi-instrument extensions.
The eight clusters identified in Table 11 as falling entirely outside PISA’s scope can be thematically regrouped, based on their OECD Learning Compass dimension assignments and shared competency content, into four broader domains: creative agency (thinking creatively and innovatively, and applying cultural skills, both TC01); ethical stewardship (following ethical code of conduct, and leading others, both TC03); collaborative intelligence (collaborating in teams and networks, SK02; and leading others, TC03); and dispositional resilience (maintaining a positive attitude, and demonstrating willingness to learn both SK02). The remaining cluster, responding to physical circumstances (SK03), sits outside these four groupings and would require a separate treatment. This study’s boundary mapping provides a direct foundation for developing proficiency descriptors for these four domains in future work. PISA level descriptors are structured along two axes—cognitive complexity, ranging from recognition to generation, and contextual breadth, ranging from familiar to novel—and the same logic can be applied to transversal competencies, yielding approximately four levels per domain. For collaborative intelligence, a draft structure following this architecture might be as follows: Level 1—participates in directed team tasks; Level 2—contributes independently to shared goals; Level 3—coordinates roles and resolves conflicts across a team; and Level 4—leads multi-stakeholder collaboration under ambiguity. Empirically anchoring such descriptors through item calibration, analogous to PISA’s IRT-based scale construction, represents a natural and tractable next step for extending the framework to the full breadth of IT workforce readiness.
5. Conclusions
This study demonstrates that IT occupations are uniformly cognitively demanding, with all 25 technical competency clusters exhibiting median PISA levels at or above Level 3 under the chosen K-Means partitioning, establishing a Level 3 floor below which the cognitive reasoning demands described by PISA descriptors are not met by any IT task cluster, as confirmed by bias-correction sensitivity analysis.
PISA measures the cognitive-reasoning capacity that IT work most heavily relies upon: all 25 technical competency clusters require at least Level 3, with Science Literacy emerging as the sole domain where 100% of clusters require Level 4 or above. What PISA misses is structural rather than scalar: 33% of ESCO transversal IT skill clusters, covering creative agency, ethical stewardship and collaborative intelligence, fall entirely outside PISA’s literacy constructs, and no proficiency level, however high, closes this gap. Raising PISA scores addresses the cognitive-technical readiness gap but leaves the transversal readiness gap intact.
Contrary to conventional assumptions, Science Literacy, not Mathematics, emerges as the dominant cognitive demand (44.5% of annotations; Level 5–6 in 64% of clusters), indicating that inductive and deductive reasoning, rather than calculation, constitutes the core competency of IT work. The LLM-based annotation framework is supported by a five-model reliability analysis against a single human domain expert (n = 100), where the best-performing model achieves a moderate agreement (κ = 0.50), and is further checked for convergent plausibility via OLS-calibrated correlations with O*NET ability scores (r = 0.23–0.37, p < 0.01), though the latter is a semi-circular indicator rather than independent validation. A bias-correction analysis confirms that the primary annotator’s systematic overestimation does not alter the corpus-level distributional conclusions.
A bidirectional gap analysis of 24 ESCO transversal skill clusters reveals that, while all PISA proficiency levels (1a–6) are engaged by at least one cluster, eight clusters (33%), spanning creative agency, ethical stewardship, collaborative intelligence, and dispositional resilience, fall outside PISA’s cognitive-literacy scope entirely. This boundary mapping identifies precisely where complementary frameworks, such as social–emotional learning instruments, would be required for a complete assessment of IT workforce readiness.
Beyond its substantive findings, this paper contributes a reusable framework for aligning occupational task demands with population-level educational assessments: any researcher can apply the full pipeline to a different occupational domain by modifying only the SOC code prefixes, and the annotation protocol accommodates any assessment framework whose levels are described by explicit verbal descriptors. The annotated corpus and validation results are released on Zenodo as a stable reference independent of future model updates.
These findings carry direct implications for education and policy: IT curricula should target a minimum of PISA Level 3 with an emphasis on scientific reasoning; the OECD Learning Compass 2030 offers a policy-transferable vocabulary for competency mapping; and the transversal gap analysis provides a concrete roadmap for extending cognitive-literacy assessments with ethical and social–emotional dimensions.
A five-model cross-validation against a blind human expert (n = 100, 17.8% of corpus), including the open-source LLaMA 3.3 70B, confirms that annotation precision scales predictably with model reasoning capacity (κ ranging from 0.29 to 0.50) and that the primary annotator’s disagreements are systematically conservative—overestimating cognitive demands by 0.6–1.0 PISA levels on average. A bias-correction sensitivity analysis demonstrates that this directional bias preserves the validity of the study’s distributional findings (Level 3+ coverage remains at 80–100% after correction), while providing future researchers with empirical guidance for balancing annotation precision against scalability. Future work should broaden the framework to other sectors, compare K-Means clustering with agglomerative and density-based alternatives to assess structural stability (e.g., agglomerative hierarchical clustering, which preserves cluster hierarchy, and DBSCAN, which does not require a pre-specified k), incorporate longitudinal job-posting data, and integrate the identified gaps into a multi-dimensional IT workforce readiness index. A key limitation is the reliance on a single human expert as the reference benchmark. Since the PISA-level assignment of occupational tasks is an interpretive act, at least two independent annotators with a formal adjudication of disagreements would be required to establish a defensible gold standard. Future replications should adopt this multi-rater design and report Krippendorff’s α or multi-rater Kappa alongside the current single-reference metrics. The four transversal competency domains identified as falling outside PISA’s scope—creative agency, ethical stewardship, collaborative intelligence, and dispositional resilience—provide a ready-made structural foundation for a companion instrument: future work should develop and empirically anchor proficiency descriptors for these domains, following the same two-axis architecture of cognitive complexity and contextual breadth that underpins the PISA scale.
Author Contributions
Contribution to the study conception and design, including supervision: A.-M.T., S.-V.O. and A.B.; material preparation, data collection, and analysis were performed by A.-M.T.; and the first draft of the manuscript was written by A.-M.T., S.-V.O. and A.B., the second draft by S.-V.O., and they also commented on all versions of the manuscript. All authors have read and agreed to the published version of the manuscript.
Funding
This work was supported by a grant of the Ministry of Research, Innovation, and Digitization, CNCS/CCCDI—UEFISCDI, project number COFUND-DUT-OPEN4CEC-1, within PNCDI IV. This project has been funded by UEFISCDI under the Driving Urban Transitions Partnership, which has been co-funded by the European Commission.
Institutional Review Board Statement
Not applicable.
Informed Consent Statement
Not applicable.
Data Availability Statement
The data is available on https://doi.org/10.5281/zenodo.20403205, accessed on 9 June 2026.
Acknowledgments
This work was supported by a grant of the Ministry of Research, Innovation, and Digitization, CNCS/CCCDI—UEFISCDI, project number COFUND-DUT-OPEN4CEC-1, within PNCDI IV. This project has been funded by UEFISCDI under the Driving Urban Transitions Partnership, which has been co-funded by the European Commission.
Conflicts of Interest
The authors declare no conflicts of interest.
References
- Zhang, D.; Peng, G.; Yao, Y.; Browning, T.R. Is a College Education Still Enough? The IT-Labor Relationship with Education Level, Task Routineness, and Artificial Intelligence. Inf. Syst. Res. 2024, 35, 992–1010. [Google Scholar] [CrossRef] [Scilit]
- Anderson, L.W.; Krathwohl, D.R. A Taxonomy for Learning, Teaching, and Assessing: A Revision of Bloom’s Taxonomy of Educational Objectives; Longman: Singapore, 2001. [Google Scholar]
- Autor, D.H.; Levy, F.; Murnane, R.J. The Skill Content of Recent Technological Change: An Empirical Exploration. Q. J. Econ. 2003, 118, 1279–1333. [Google Scholar] [CrossRef] [Scilit]
- Acemoglu, D.; Autor, D. Skills, Tasks and Technologies: Implications for Employment and Earnings. In Handbook of Labor Economics, 1st ed.; Ashenfelter, O., Card, D., Eds.; Elsevier: Amsterdam, The Netherlands, 2011; pp. 1043–1171. [Google Scholar] [CrossRef] [Scilit]
- Fernández-Macías, E.; Bisello, M. A Comprehensive Taxonomy of Tasks for Assessing the Impact of New Technologies on Work. Soc. Indic. Res. 2022, 159, 821–841. [Google Scholar] [CrossRef] [Scilit]
- Frey, C.B.; Osborne, M.A. The future of employment: How susceptible are jobs to computerisation? Technol. Forecast. Soc. Change 2017, 114, 254–280. [Google Scholar] [CrossRef] [Scilit]
- Felten, E.W.; Raj, M.; Seamans, R. How will Language Modelers like ChatGPT Affect Occupations and Industries? SSRN Electron. J. 2023. [Google Scholar] [CrossRef] [Scilit]
- Acemoglu, D.; Loebbing, J. Automation and Polarization; National Bureau of Economic Research: Cambridge, MA, USA, 2022. [Google Scholar] [CrossRef] [Scilit]
- Noy, S.; Zhang, W. Experimental evidence on the productivity effects of generative artificial intelligence. Science 2023, 381, 187–192. [Google Scholar] [CrossRef] [Scilit] [PubMed]
- Acemoglu, D. The simple macroeconomics of AI. Econ. Policy 2025, 40, 13–58. [Google Scholar] [CrossRef] [Scilit]
- Brynjolfsson, E.; McAfee, A. The Second Machine Age: Work, Progress, and Prosperity in a Time of Brilliant Technologies; W.W. Norton & Company: New York, NY, USA, 2014. [Google Scholar]
- Chiarello, F.; Fantoni, G.; Hogarth, T.; Giordano, V.; Baltina, L.; Spada, I. Towards ESCO 4.0—Is the European classification of skills in line with Industry 4.0? A text mining approach. Technol. Forecast. Soc. Change 2021, 173, 121177. [Google Scholar] [CrossRef] [Scilit]
- OECD. PISA 2022 Results; OECD Publishing: Paris, France, 2023; Volume I. [Google Scholar] [CrossRef] [Scilit]
- Oprea, S.; Bâra, A. Is Reading an Upstream Predictor of Science and Mathematics Achievements in PISA? A Bayesian Network Analysis for Policy Educational Interventions on Socio-Economic Dispersion and Gender Gaps. Syst. Res. Behav. Sci. 2026. [Google Scholar] [CrossRef] [Scilit]
- OECD. PISA 2022 Assessment and Analytical Framework; OECD Publishing: Paris, France, 2023. [Google Scholar] [CrossRef] [Scilit]
- Hanushek, E.A.; Woessmann, L. The Knowledge Capital of Nations; The MIT Press: Cambridge, MA, USA, 2015. [Google Scholar] [CrossRef] [Scilit]
- Gust, S.; Hanushek, E.A.; Woessmann, L. Global universal basic skills: Current deficits and implications for world development. J. Dev. Econ. 2024, 166, 103205. [Google Scholar] [CrossRef] [Scilit]
- OECD. OECD Skills Outlook 2019; OECD Publishing: Paris, France, 2019. [Google Scholar] [CrossRef] [Scilit]
- OECD. OECD Future of Education and Skills 2030. OECD Learning Compass 2030. A Series of Concept Notes. 2019. Available online: https://www.oecd.org/education/2030-project/ (accessed on 4 April 2026).
- Deming, D.; Silliman, M. Skills and Human Capital in the Labor Market; NBER: Cambridge, MA, USA, 2024. [Google Scholar] [CrossRef] [Scilit]
- Gilardi, F.; Alizadeh, M.; Kubli, M. ChatGPT outperforms crowd workers for text-annotation tasks. Proc. Natl. Acad. Sci. USA 2023, 120, e2305016120. [Google Scholar] [CrossRef] [Scilit] [PubMed]
- Zarifhonarvar, A. Economics of ChatGPT: A labor market view on the occupational impact of artificial intelligence. J. Electron. Bus. Digit. Econ. 2024, 3, 100–116. [Google Scholar] [CrossRef] [Scilit]
- Kasneci, E.; Sessler, K.; Küchemann, S.; Bannert, M.; Dementieva, D.; Fischer, F.; Gasser, U.; Groh, G.; Günnemann, S.; Hüllermeier, E.; et al. ChatGPT for good? On opportunities and challenges of large language models for education. Learn. Individ. Differ. 2023, 103, 102274. [Google Scholar] [CrossRef] [Scilit]
- Landis, J.R.; Koch, G.G. The Measurement of Observer Agreement for Categorical Data. Biometrics 1977, 33, 159. [Google Scholar] [CrossRef] [Scilit] [PubMed]
- Zhang, M.; Jensen, K.; Sonniks, S.; Plank, B. SkillSpan: Hard and Soft Skill Extraction from English Job Postings. In Proceedings of the 2022 Conference of the North American Chapter of the Association for Computational Linguistics: Human Language Technologies; Association for Computational Linguistics: Stroudsburg, PA, USA, 2022; pp. 4962–4984. [Google Scholar] [CrossRef] [Scilit]
- Reimers, N.; Gurevych, I. Sentence-BERT: Sentence Embeddings using Siamese BERT-Networks. In Proceedings of the 2019 Conference on Empirical Methods in Natural Language Processing and the 9th International Joint Conference on Natural Language Processing (EMNLP-IJCNLP); Association for Computational Linguistics: Stroudsburg, PA, USA, 2019; pp. 3980–3990. [Google Scholar] [CrossRef] [Scilit]
- Abdalgader, K.; Matroud, A.A.; Hossin, K. Experimental study on short-text clustering using transformer-based semantic similarity measure. PeerJ Comput. Sci. 2024, 10, e2078. [Google Scholar] [CrossRef] [Scilit] [PubMed]
- Leon, F.; Gavrilescu, M.; Floria, S.-A.; Minea, A.A. Hierarchical Classification of Transversal Skills in Job Advertisements Based on Sentence Embeddings. Information 2024, 15, 151. [Google Scholar] [CrossRef] [Scilit]
- Zare, D.; Fernandez-Sanz, L.; Pospelova, V.; López-Baldominos, I. NLP and Text Mining for Enriching IT Professional Skills Frameworks. Appl. Sci. 2025, 15, 9634. [Google Scholar] [CrossRef] [Scilit]
- Sha, K.; Taeihagh, A.; De Jong, M. Governing disruptive technologies for inclusive development in cities: A systematic literature review. Technol. Forecast. Soc. Change 2024, 203, 123382. [Google Scholar] [CrossRef] [Scilit]
- U.S. Bureau of Labor Statistics. 2018 Standard Occupational Classification System. Available online: https://www.bls.gov/soc/2018/major_groups.htm (accessed on 11 April 2026).
- European Commission. European Skills, Competences, Qualifications and Occupations (ESCO) Occupations. Available online: https://esco.ec.europa.eu/en/classification/occupation?uri=http%3A%2F%2Fdata.europa.eu%2Fesco%2Fisco (accessed on 11 April 2026).
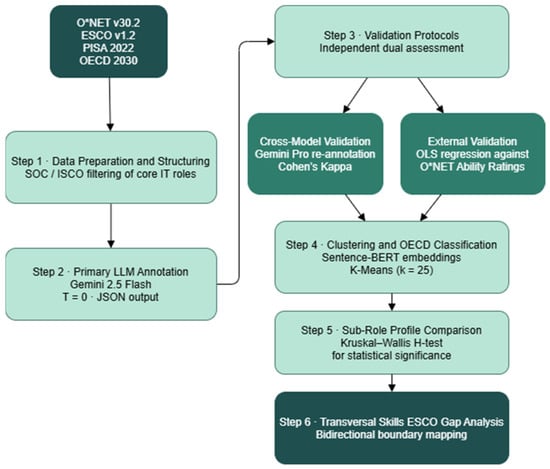
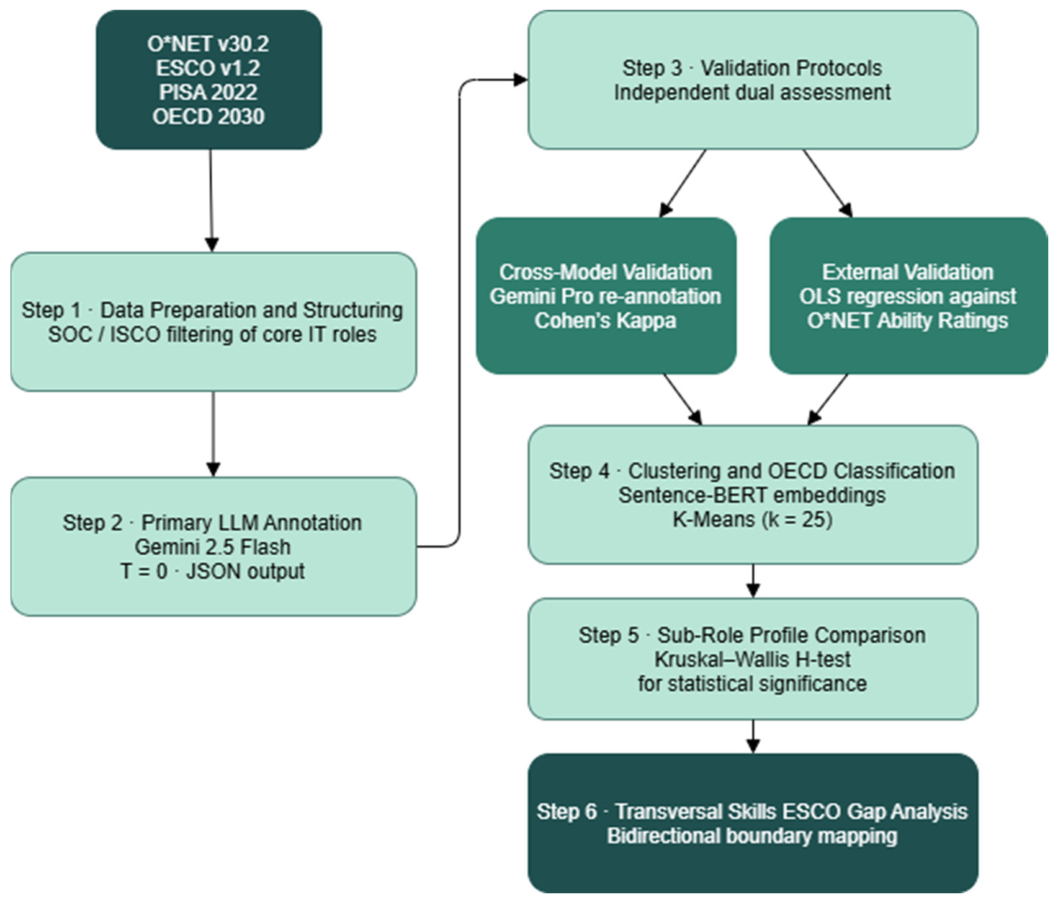
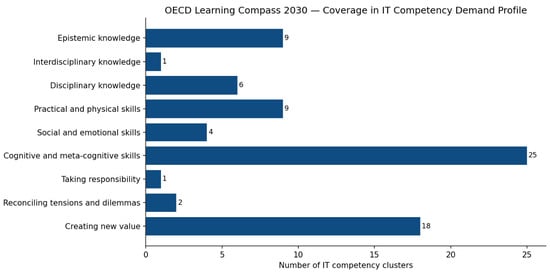
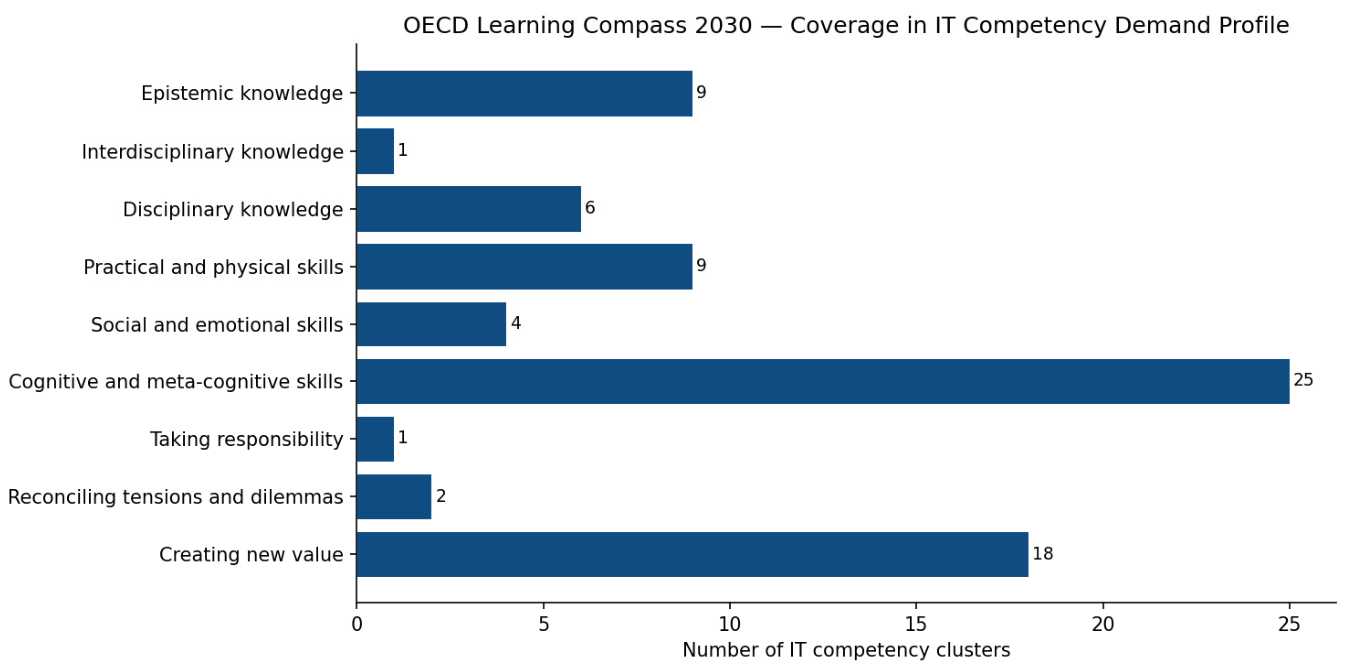
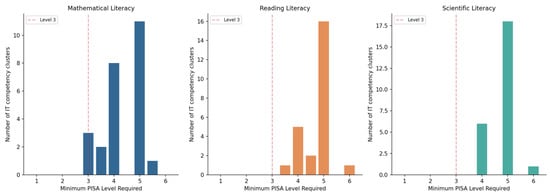
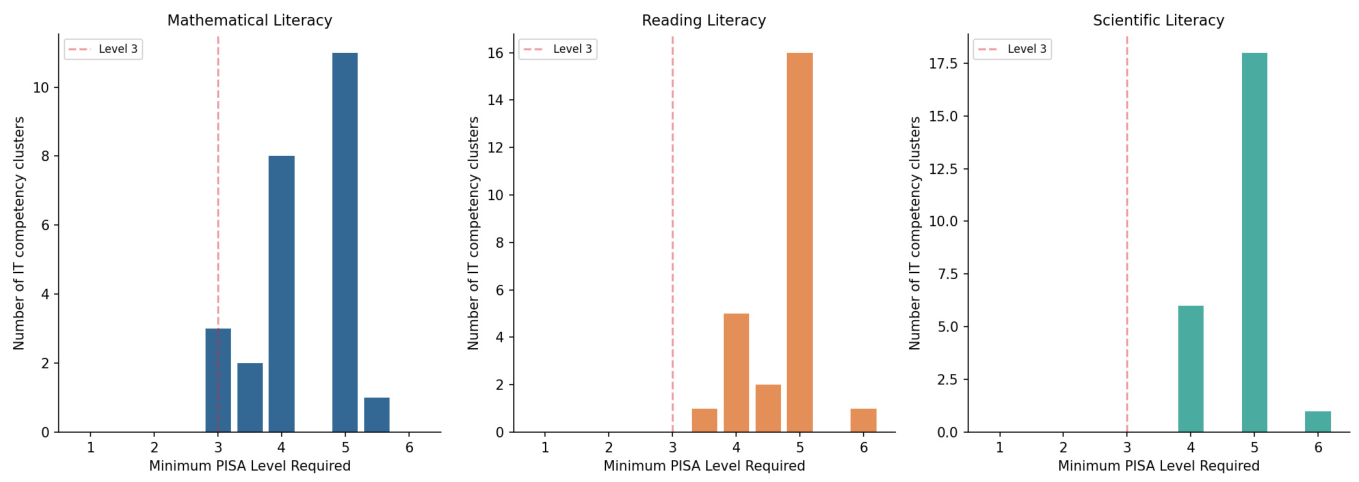
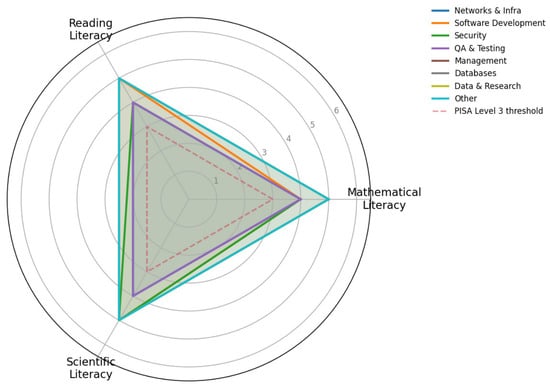
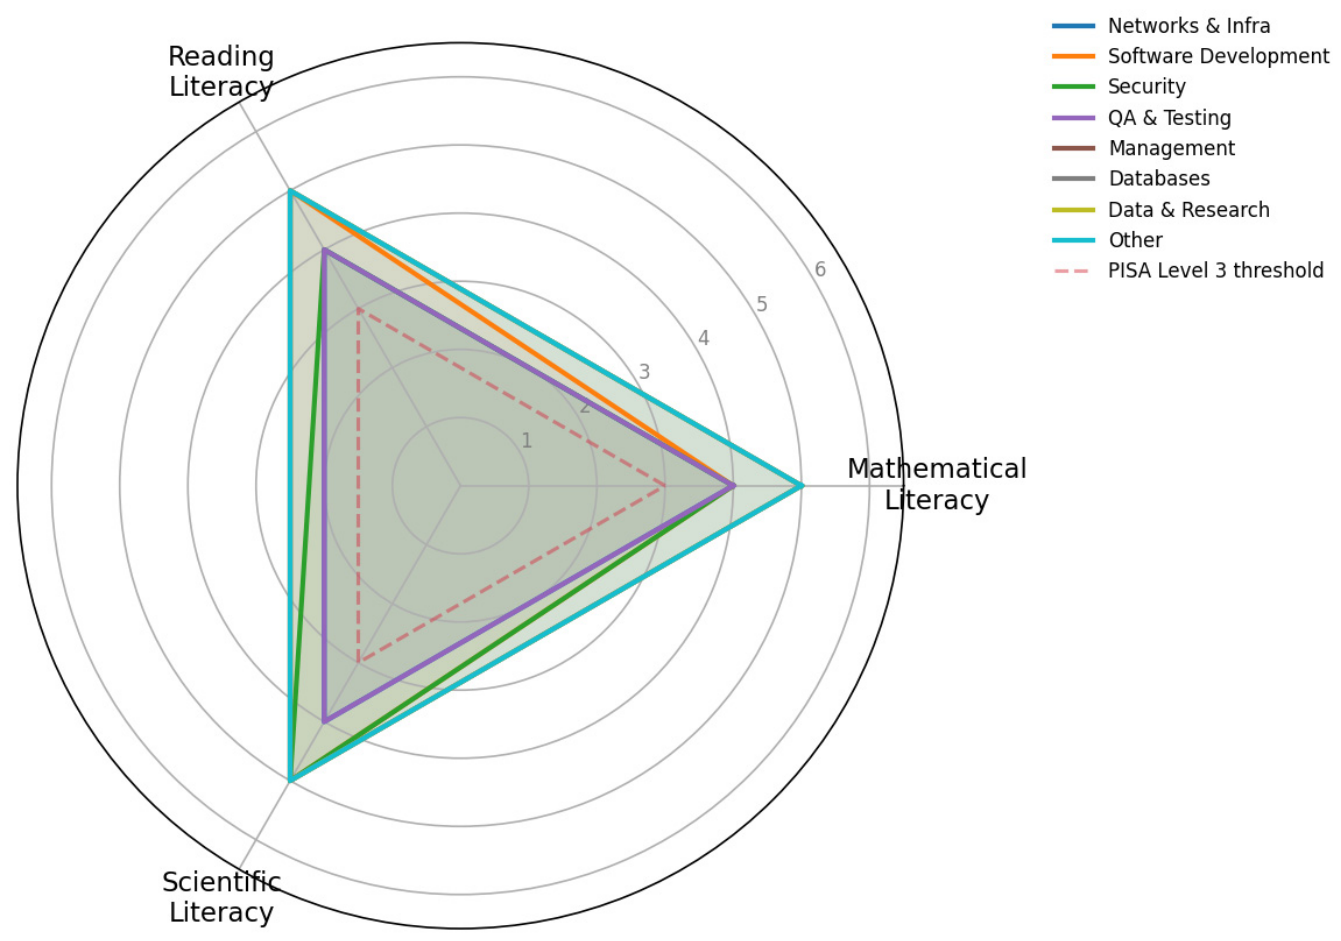
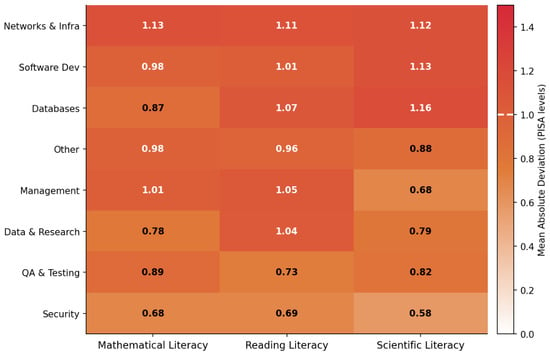
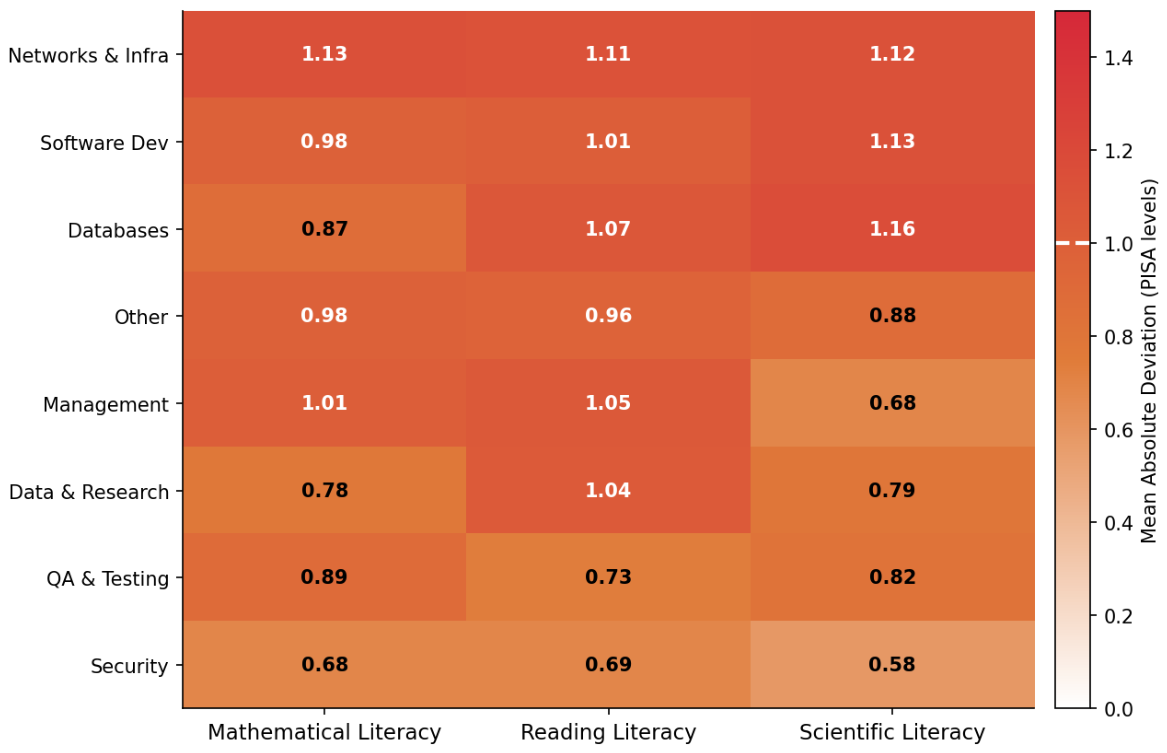
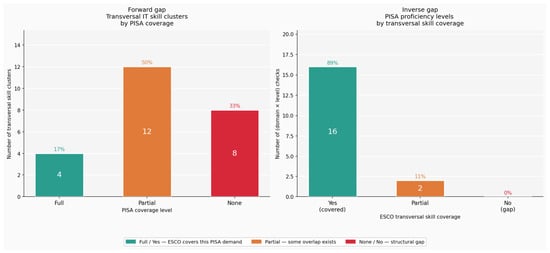
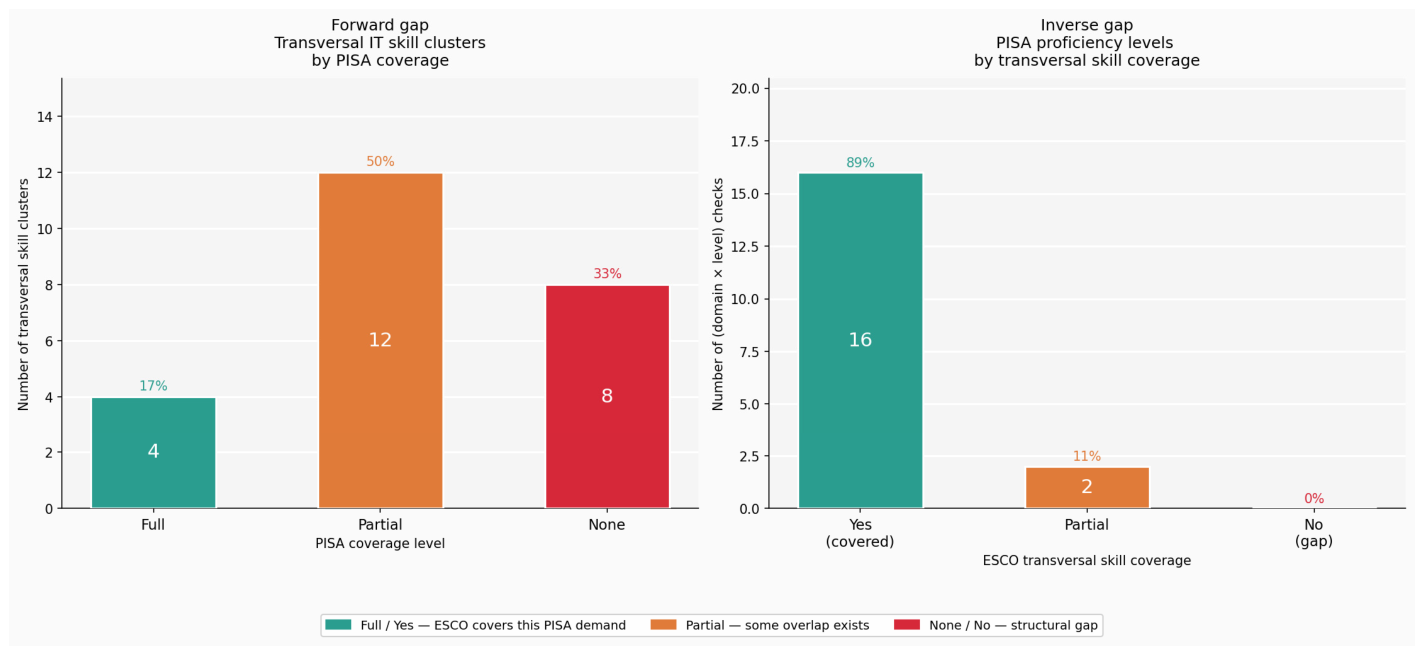

Disclaimer/Publisher’s Note: The statements, opinions and data contained in all publications are solely those of the individual author(s) and contributor(s) and not of MDPI and/or the editor(s). MDPI and/or the editor(s) disclaim responsibility for any injury to people or property resulting from any ideas, methods, instructions or products referred to in the content. |
© 2026 by the authors. Licensee MDPI, Basel, Switzerland. This article is an open access article distributed under the terms and conditions of the Creative Commons Attribution (CC BY) license.