


Abstract
Sepsis is a prominent cause of death in intensive care units, and delayed diagnosis greatly worsens fatal outcomes due to the complex, irregular, and uneven character of clinical time-series data. Hence we proposed an interpretable and uncertainty-aware deep learning architecture that solves data quality, temporal irregularity, and clinical explainability restrictions, which are frequently addressed separately by existing models. The suggested method combines Bidirectional Recurrent Imputation for Time Series (BRITS)-based imputation, hybrid Conditional Tabular Generative Adversarial Network-Synthetic Minority Over-sampling Technique (CTGAN-SMOTE) data augmentation, a Temporal Convolutional Networks (TCN)-Attention architecture, and continuous-time neural Ordinary Differential Equations (ODEs), along with SHapley Additive exPlanations (SHAP)-based feature attribution and uncertainty quantification. The experimental evaluation on a large ICU dataset reveals greater predictive accuracy, with an AUROC of 0.926 and accurate early warnings up to six hours before clinical onset, all while maintaining strong interpretability and calibration. The proposed framework demonstrates strong predictive performance and provides early warnings up to six hours before clinical onset, while maintaining interpretability and calibration. While the results are promising, further validation across multiple clinical settings is required to confirm its generalisability and real-world applicability.
1. Introduction
Sepsis, a potentially fatal organ failure caused by a dysregulated host response to infection, accounts for over 11 million deaths in intensive care units (ICUs) annually [1]. Given that the mortality rate increases by roughly 8% for every hour that treatment is postponed, early diagnosis is essential for improving patient outcomes [2]. Clinical scoring techniques such as SOFA and qSOFA have improved, but they often detect sepsis only after irreversible organ damage has occurred, and their sensitivity for early prediction is limited [3,4].
Recent advances in deep learning have demonstrated significant possibilities for early sepsis detection by using large amounts of EHR data [5,6]. However, the clinical application of these intelligent systems is still hindered by three basic issues. First, the “black-box” nature of deep neural networks limits physician acceptability in high-stakes medical decision-making by raising questions regarding clinical interpretability and trustworthiness [7]. Second, model robustness and generalizability are compromised by severe class imbalance (2–5% sepsis prevalence) and widespread missing data (typically surpassing 40% for laboratory results) in real-world ICU datasets [8]. Third, because clinical observations are intrinsically irregular and temporal, advanced sequential modeling techniques are required to capture the dynamics of disease progression while accounting for varied sampling rates [9].
To address the challenges of missing data, class imbalance, irregular temporal sampling, and limited interpretability in clinical prediction systems, several advanced machine learning techniques have recently been proposed [10,11]. Bidirectional Recurrent Imputation for Time Series (BRITS) is a deep learning-based approach designed to reconstruct missing values in time-series data by modeling temporal dependencies in both forward and backward directions. Conditional Tabular Generative Adversarial Networks (CTGANs) are generative models capable of synthesizing realistic tabular clinical data, which can be combined with Synthetic Minority Oversampling Technique (SMOTE) to mitigate severe class imbalance. Temporal Convolutional Networks (TCNs) have been used to effectively model long-range temporal dependencies using dilated causal convolutions. This facilitates the extraction of multi-scale patterns from physiological signals. Additionally, the ability of continuous-time neural networks, which are a class of Neural Ordinary Differential Equations (Neural ODEs), to model irregularly sampled clinical data without the need for interpolation is advantageous. To enhance the interpretability of the model, SHapley Additive exPlanations (SHAP) methods can be used to quantify the contributions of the features to the prediction.
Current techniques address these problems individually but do not fully combine them. In rule-based warning systems, interpretability is emphasized over prediction efficiency [12]. Modern techniques like recurrent neural networks [8] and ensemble techniques [13] are better at discrimination but lack explainability. Although attention mechanisms provide some transparency [6], they are unable to accurately measure the significance of features. Furthermore, the complex distribution characteristics of multivariate temporal clinical data are not well addressed by standard data augmentation techniques [5].
The paper describes an innovative deep learning model that resolves problems related to explainability, quality of data, and temporal modeling using a combination of complementary approaches. The proposed model combines traditional methods such as BRITS, CTGAN-SMOTE, TCNs, and Neural ODEs. The innovation in the proposed paper lies in how the methods are combined and their relevance to clinical practices. The novelty of the paper does not lie in introducing new algorithms but in systematically combining already existing methods based on a strong rationale and tailored to solving clinical challenges associated with ICU datasets. Contributions proposed include:
- Model Interpretability and Explainability. Designed and developed a SHAP-enhanced temporal attention mechanism that offers both local and global explanations by fusing neural attention weights with game-theoretic feature attribution. By determining the minimal adjustments necessary to change predictions, counterfactual analysis produces recommendations for interventions that can be put into practice.
- Data Quality and Representation. Introduced a quality-aware filtering-based hybrid CTGAN-SMOTE augmentation technique to rectify class imbalance while preserving physiological plausibility. BRITS uses principled temporal modeling to deal with missing data.
- Temporal and Sequential Modeling. Proposed an ensemble architecture that combines continuous-time recurrent neural networks based on Neural ODE for handling irregular sampling and uncertainty quantification with Temporal Convolutional Networks with multi-head attention for collecting multi-scale patterns.
- A leakage-aware temporal prediction protocol is incorporated to ensure clinically valid early prediction.
This proposed framework brings together several complementary components to tackle the main challenges of ICU time-series data, such as missing data, class imbalance, temporal irregularity, and interpretability. Even though the method shows better predictive capability on the dataset used for the study, its performance in different clinical settings is yet to be tested.
The structure of this paper is as follows: After identifying the main research gaps in the Introduction, Section 2 carries out the literature review on the subject of sepsis prediction using traditional clinical scoring methods, machine learning, deep learning, interpretation methods, and data quality issues. An overview of the proposed explainable and uncertainty-aware deep learning framework is given in Section 3, and it includes explainability strategies, class imbalance reduction approach, temporal model architecture, uncertainty assessment, and data preprocessing methodology. Experimental results are presented in Section 4, and in addition to interpretability, ablation testing, uncertainty calibration, early detection capabilities, prediction accuracy, and external validation are included. Implications and Discussion are provided in Section 5. Conclusions are stated in Section 6.
The efficacy of these contributions is empirically assessed via comparative experiments and ablation studies in Section 4. These evaluations examine the effects of all components of the proposed framework.
2. Related Work
Significant research has been achieved in the field of sepsis prediction using machine learning and deep learning models based on time-series data from electronic health records in recent years. There are ongoing research activities to improve the accuracy of early detection, deal with the problem of temporal dependencies, and resolve the issue of data imbalance in the existing research based on conventional clinical scoring models, traditional machine learning models, and even deep learning models. However, the major research works developed earlier are only addressing the issues of interpretability, data quality, and temporal irregularities. Based on the sample research works developed in these areas, gaps are identified in the following sections as the motivation for the proposed integrated framework.
Several previous research works have utilized the PhysioNet Sepsis Early Prediction dataset to develop machine learning models for the early detection of sepsis [14]. Traditional machine learning models such as logistic regression, random forests, and gradient boosting models have achieved an AUROC score ranging from 0.76 to 0.85 [15]. Advanced deep learning models such as recurrent neural networks (RNNs) and long short-term memory (LSTM) have achieved an AUROC score ranging from 0.86 to 0.88 by incorporating the time dependency of patient data [16,17]. Attention-based and interpretable models have also achieved improved performance in the early detection of sepsis by incorporating time dependency [18]. These research works are very important for validating the performance of the proposed model.
2.1. Traditional Clinical Scoring Systems
Historically, rule-based scoring systems such as SOFA, qSOFA, SIRS, and MEWS have been used to detect clinical sepsis [3]. These systems rely on threshold-based rules that neglect temporal dynamics, are retrospective rather than predictive, and have limited sensitivity for early detection (AUROC ∼ 0.65–0.75), despite being interpretable and extensively used [4,19]. The MEWS performs far worse than contemporary machine learning techniques, achieving just 44% sensitivity and 90% specificity for sepsis prediction [20].
2.2. Machine Learning for Sepsis Prediction
Data-driven methods are becoming more and more popular, according to recent research. Random forests and logistic regression surpass clinical scores with AUROC values of 0.76–0.83 [5,12], but they are not capable of temporal modeling. XGBoost with SMOTE-based oversampling, in particular, reports an AUROC of 0.849 with better handling of class imbalance [5]. These approaches, however, handle each timepoint separately, missing patterns of illness progression that are crucial for early warning.
2.3. Deep Learning Architectures
For temporal clinical data, Recurrent Neural Networks (RNNs) and Long Short-Term Memory (LSTM) networks have been the most popular architectures [8]. Using attention-augmented LSTMs on the PhysioNet Sepsis Early Prediction Dataset, Shamout et al. [21] demonstrated superior early detection (4 h lead time) in comparison to traditional approaches, achieving an AUROC of 0.87. By incorporating multi-horizon attention methods, temporal fusion transformers [9] further enhanced performance (AUROC: 0.91). These methods, however, offer little interpretability for clinical validation and fail to fully address the erratic sample rates that are typical of ICU data. These previously reported models serve as baseline benchmarks in the experimental evaluation to enable a fair comparison with the proposed framework using the same PhysioNet sepsis dataset.
2.4. Interpretability in Clinical AI
One major obstacle to clinical adoption of deep learning is still its black-box nature [7]. Attention mechanisms have been the subject of recent research [6], with 82% expert agreement on feature importance. However, rigorous quantification using game-theoretic frameworks such as SHAP [22] has not been achieved. Pixel-level attribution for medical imaging is provided by LRP [23], but time-series EHR data is still not well studied. In order to generate “what-if” scenarios for clinical decision assistance, counterfactual explanations have not been extensively integrated with deep temporal models for sepsis prediction [24].
2.5. Data Quality Challenges
For the missing data, which is above 40% for lab data [25], complex imputation is necessary. Although recent approaches like BRITS [26] have applied bidirectional temporal dependencies for sophisticated imputation, simple approaches like mean/forward fill are biased. Complex augmentation is necessary for class balancing, which is a significant concern with only 2–5% sepsis cases. CTGAN [27] significantly outperforms simple oversampling with SMOTE [28] in maintaining physiological plausibility by learning complicated feature distributions through adversarial training.
2.6. Gaps in Current Literature
With individual developments, there is no current paradigm to combine interpretability, data quality, and temporal modeling in a logical fashion. There are no imputation methods that ever integrate with prediction models; attention models do not have quantified attributions; and handling irregular sampling is still in its infancy. By closing these gaps through continuous-time neural ODEs with quantified uncertainty, hybrid CTGAN/SMOTE data augmentation with quality filtering, and SHAP-enhanced attention models, the proposed work is a step closer to deployable sepsis prediction models.
While existing studies have made significant progress in early sepsis prediction, most approaches address these challenges in isolation. For instance, deep learning models such as LSTM and transformer-based architectures primarily focus on temporal modeling but often lack robust handling of missing data and class imbalance. Similarly, GAN-based augmentation techniques improve data distribution but do not ensure physiological consistency or integration with temporal learning frameworks. Interpretability methods, including attention mechanisms and SHAP, have been explored separately, but their combined use with uncertainty quantification in clinical time-series prediction remains limited.
Alternatively, our framework stands out as it presents a single, clinically relevant approach that merges (i) BRITS-based temporal imputation for missing data, (ii) hybrid CTGAN-SMOTE physiologically validated augmentation for imbalanced classes, (iii) multi-scale temporal modeling via TCN with attention and continuous-time Neural ODE-based architectures for irregular sampling, and (iv) an interpretability combined with uncertainty-awareness decision framework. This comprehensive integration results in more dependable, interpretable, and earlier sepsis prediction than existing methods, thus filling several major gaps in the literature.
The new framework integrates a conceptual mapping that aims at bridging these gaps. It goes beyond literature research needs by systematically combining complementary methodologies. For instance, the challenge of missing and incomplete clinical data is addressed through BRITS-based temporal imputation that reconstructs physiologically consistent time-series observations. The problem of severe class imbalance is solved with a hybrid CTGANSMOTE data augmentation approach together with quality filtering for ensuring realistic data distribution. Moreover, the combination of TCN and Neural ODE in continuous time is utilized for solving the problem of temporal irregularity in ICU data, which helps build a robust model on irregular data sequences. Finally, the combination of SHAP-based feature attribution in association with uncertainty quantification is the strategy that will help overcome the problem of interpretability in existing models. As can be seen from the above connections between the current gaps and the proposed methodology, all of them provide an approach to bridging those gaps in a unified way.
3. Materials and Methods
The methods and materials utilized for the multivariate ICU time-series-based early sepsis prediction are presented in the following sections. The data preparation methods, modeling, uncertainty estimation, and interpretability are discussed in detail in Section 3.2 whereas the clinical data and computing environment are presented in Section 3.1. The clinical utility, robustness, and reproducibility are emphasized in the experimental design.
3.1. Materials
The study content involves an ICU EHR dataset available to the public in the PhysioNet database as well as computing resources needed for the development and testing of deep learning algorithms. The dataset will aid in developing algorithms that predict early onset of sepsis, and the dataset features multivariate clinical time-series data, which are common in real-world ICU monitoring. Further information about the dataset and computing setup is provided below.
3.1.1. Dataset
Clinical data for this research study was sourced from PhysioNet Sepsis Early Prediction Dataset [14]. It was obtained from the PhysioNet/Computing in Cardiology Challenge 2019 competition. This dataset contains de-identified electronic health records of patients hospitalized in intensive care units under observation. The dataset includes time-stamped recordings of physiological variables, laboratory results, and demographic information collected over time during their stay in the ICU. The dataset was created for research into early sepsis diagnosis using machine learning techniques. Each patient in the dataset is represented by multivariate clinical information that is sampled over irregular time intervals. Each patient is represented by vital signs, including heart rates, temperature, respiratory rates, oxygen saturation, and laboratory results that reflect organ functions and metabolic status, as well as demographic information including age, gender, and admission type. Additionally, binary labels for each patient indicating their status with or without sepsis according to the Sepsis-3 clinical definition have been included for supervised learning for early sepsis prediction tasks.
The dataset has more than 40,000 ICU patient admissions, as well as over 1.5 million hourly clinical observations. However, it is also very imbalanced, as the septic patients make up only a small portion of the overall population (1.8% to 4.5% depending on aggregation level). Additionally, there is also missing data in this dataset due to irregular clinical test schedules, especially for lab values such as lactate, bilirubin, and creatinine. All these features make it not only highly representative of real-world ICU monitoring situations but also very difficult from a modeling perspective.
In order to make model development easier, adult patient data was selected, and a fixed time window before either sepsis onset or ICU discharge was defined. For each patient’s hospital stay, a multivariate time-series dataset was created by recording T time points of D clinical variables, where was the total number of features used in the study as shown in Table 1, which highlights key physiological variables indicative of infection, organ dysfunction, inflammation, and hemodynamic instability—these are essential for detecting the initial clinical signs of sepsis. The dataset is accessible to everyone through the PhysioNet platform and has become the standard for evaluating the performance of early sepsis detection methods. A single patient data consists of a time-series with multiple variables, with the size of the matrix being , where T is the number of time points and corresponds to the number of different measured clinical features. Due to their nature, these data are very close to what one might expect from an ICU patient’s monitoring. At the same time, they are a great challenge for anyone wishing to build models with them. Table 1 provides an overview of the characteristics and distribution of clinical features used in our study.
Table 1.
Structure of the PhysioNet Sepsis Early Prediction Dataset.
Cohort Construction and Data Splitting
The cohort was generated from the PhysioNet Sepsis Early Prediction Database through selection of adult ICU patient records containing sufficient temporal data for the study. Patient records having incomplete data, excessively short ICU lengths-of-stay, or missing critical clinical features were excluded. As a result, there were 38,742 patient admissions included for model training after preprocessing and data cleaning. To avoid bias in assessment and ensure independence between the datasets, the cohort was divided by patient at the train/validation/test split, meaning that no patient record appeared in multiple splits. Stratified sampling was used for splitting into train/validation/test datasets. Namely, a [e.g., 70% train, 15% validation, and 15% test] split was conducted in the study.
Data Splitting Protocol
In order to prevent any form of data leakage during the experiments, the dataset was partitioned into train, validation, and test datasets following a patient-level approach, whereby no patient is allowed to appear in two different datasets. The stratified sampling method was used in order to maintain the same class distribution of sepsis cases in all datasets. In particular, the dataset was partitioned into 70% train, 15% validation, and 15% test.
3.1.2. Experimental Setup
All experiments were performed using deep learning and scientific computing libraries developed in Python 3.10. In addition, the commonly used scientific libraries, such as NumPy 1.26.4, Pandas 2.2.2, and Matplotlib 3.8.4, were utilized for data preprocessing, numerical calculations, and plotting purposes, respectively. In order to deal with the large amounts of temporal ICU data and the computationally heavy deep learning architectures, the experiments were performed using computing resources equipped with GPU support. The utilization of the PhysioNet data resource strictly complies with the data usage policy, and all patients’ data were fully anonymized.
All equations have been modified to ensure consistent notation. Vectors and matrices are now represented using appropriate notations, and bold letters have been eliminated from Section 3.3, Section 3.4, Section 3.5 and Section 3.6. In order to provide consistent notation through the mathematical formulations, a common notation format will be used in Section 3.2, Section 3.3, Section 3.4, Section 3.5 and Section 3.6. Namely, the notation format for the multivariate clinical time-series is as follows: , where stands for the feature vector at time step t. The notation format for latent representations is , and the notation format for the predicted sepsis probability is . Moreover, model parameters will be denoted by . Furthermore, vector and matrix formats have been consistently formatted, and inconsistent notation has been eliminated. In order to provide clear and consistent notation, all of the mathematical formulations that have been presented in Section 3.2, Section 3.3, Section 3.4, Section 3.5 and Section 3.6 have been thoroughly reviewed to eliminate inconsistencies. Each formula is presented alongside its definition within the framework.
All experiments were executed using Python, employing deep learning libraries like PyTorch 2.2.1 alongside conventional scientific computing packages such as NumPy and Pandas. The models were trained on GPU-accelerated machines owing to the large amount of temporal data that needed processing. The dataset was randomly split using a stratified train-validation-test scheme to guarantee balance among classes in each subset. Cross-validation was performed to test the generalization ability of the models. Training was done using a batch size of 64, and random seeds were fixed for all experiments to ensure repeatability. The hyperparameters were tuned according to their validation accuracy and remained consistent throughout all experiments to facilitate a fair comparison. The dataset was partitioned using a stratified train–validation–test split while cross-validation was performed to estimate model generalization. All experiments employed random seeds to ensure repeatability.
3.2. Methods
Three major objectives are addressed by the comprehensive deep learning architecture for the early prediction of sepsis that has been proposed: (1) the interpretability of the models by means of explainable AI, (2) the robustness of the models in the presence of data quality issues such as class imbalance and presence of missing values, and (3) the modeling of complex time dependencies for the early prediction of sepsis. To obtain clinically relevant predictions, the proposed architecture leverages the latest architectural components and mathematical formulations based on principles. The proposed framework combines data preprocessing, class imbalance handling, temporal modeling, uncertainty estimation, and interpretability analysis for the task of early sepsis prediction from multivariate ICU time-series data. The overall workflow of the proposed framework is illustrated in Figure 1, which shows the sequential flow from data preprocessing to prediction and interpretability. The pipeline consists of four sequential stages: (i) data preprocessing and quality enhancement, including missing value imputation using BRITS, (ii) class imbalance mitigation through CTGAN-SMOTE-based augmentation, (iii) temporal modeling using TCN-Attention and Neural ODE architectures, and (iv) prediction and interpretability using ensemble learning and SHAP-based explanations. This structured pipeline ensures a systematic transformation of raw ICU time-series data into clinically interpretable predictions.
Figure 1.
High level architecture of the proposed interpretable and uncertainty-aware deep learning framework for early sepsis prediction from multivariate ICU time-series data.
The architectural details of the suggested approach are shown in Figure 2. The model comprises two separate temporal learning paths, including TCN-Attention which is responsible for capturing multi-resolution temporal information, and CT-RNN that utilizes Neural Ordinary Differential Equations (Neural ODEs) for handling clinical time-series data with irregular sampling. The learned feature representations generated by both architectures are then merged using a feature fusion process, after which an ensemble prediction block is employed to produce predictions by averaging the results obtained from both branches.
Figure 2.
Architecture of the proposed hybrid deep learning framework combining TCN-Attention and CT-RNN for sepsis prediction.
For the sake of clarity in the mathematical formulation, consistent notation is adopted throughout the framework. Let be the multivariate clinical time-series input, where represents the D-dimensional feature vector at time step t. A predicted probability of sepsis is produced by the model at each time window. Intermediate latent representations learned by neural networks are denoted by , and the parameters are denoted by . This notation is followed throughout the entire framework in the following subsections: preprocessing, temporal modeling, and prediction. Figure 1 presents the overall system pipeline, whereas Figure 2 illustrates the detailed architecture of the proposed hybrid deep learning model, highlighting the integration of TCN-Attention and CT-RNN through feature fusion and ensemble learning. The model processes clinical time-series data through parallel branches, followed by feature fusion and ensemble integration to generate the final risk prediction.
The pipeline consists of four major stages. First, the data preprocessing and quality enhancement stage processes raw ICU time-series data and handles missing values using the Bidirectional Recurrent Imputation for Time Series (BRITS) model, which reconstructs incomplete observations while preserving temporal dependencies. Second, the class imbalance mitigationstage addresses the highly imbalanced distribution of septic and non-septic cases by generating physiologically plausible synthetic samples using a hybrid Conditional Tabular Generative Adversarial Network (CTGAN) and Synthetic Minority Oversampling Technique (SMOTE).
In the third stage, temporal modeling, the balanced time-series data are processed using complementary deep learning architectures. A Temporal Convolutional Network (TCN) combined with a multi-head attention mechanism captures multi-scale temporal patterns in physiological signals, while a continuous-time recurrent neural network (CT-RNN) based on Neural Ordinary Differential Equations (Neural ODEs) models irregularly sampled clinical observations.
Finally, the prediction and interpretability stageintegrates the outputs of the temporal models through an ensemble mechanism to generate the final sepsis risk prediction. To improve clinical transparency, SHapley Additive exPlanations (SHAP) and attention-based analysis are applied to identify influential clinical features and temporal patterns contributing to the prediction. The arrows in Figure 1 represent the primary flow of data from raw ICU observations to the final prediction and explanation outputs. The arrows in Figure 1 represent the primary flow of data from raw ICU observations to the final prediction and explanation outputs.
The BRITS-based imputation and CTGAN-SMOTE augmentation are performed during the offline training phase, while real-time inference relies on the trained temporal prediction model, ensuring computational efficiency. The early sepsis prediction end-to-end interpretable deep learning system, shown in Figure 1, was created to address the main issues with ICU data, such as missing values, extreme class imbalance, irregular temporal sampling, uncertainty estimation, and clinical interpretability. Each step of the suggested architecture’s four-stage sequential pipeline contributes to a robust, dependable, and clinically significant prediction of sepsis risk.
In Figure 1, the suggested end-to-end pipeline is shown in four steps: (1) data preprocessing and quality improvement; (2) hybrid augmentation to mitigate class imbalance; (3) ensemble temporal modeling using TCN-Attention and CT-RNN architectures; and (4) multi-method interpretability analysis. The framework generates sepsis probability predictions , associated uncertainty quantification, and feature-level explanations by processing irregular multivariate time-series , where indicates observation timestamps and indicates D-dimensional clinical features (vital signs, laboratory values, demographics).
3.2.1. Study Procedure
The overall study procedure follows a structured pipeline aligned with Figure 1. Step 1: Time-series raw ICU data undergo a preprocessing pipeline involving cohort selection, temporal windowing, normalization, and missing value imputation with the aid of BRITS. Step 2: Class imbalance is mitigated by employing a hybrid CTGAN-SMOTE-based augmentation strategy to synthesize physiologically plausible samples. Step 3: The derived data are input to separate temporal modeling architectures in parallel, such as a TCN-Attention module that can capture multi-scale dependencies and a continuous-time RNN (Neural ODE) that is capable of dealing with irregular sampling. Step 4: The two branches’ outputs are merged via feature fusion and ensemble learning to produce the ultimate sepsis risk prediction. Step 5: Interpretability is achieved using SHAP-based feature attribution and attention mechanisms, along with uncertainty estimation for reliable decision support.
3.2.2. Design Rationale and Evidence Base
The choice made on the components of the architecture proposed for ICU data modeling was driven by not only the theoretical validity in the context of time-series models but also their empirical verification using ablation experiments. Instead of viewing the components as unrelated design decisions, they were each matched to specific shortcomings of the ICU dataset and demonstrated performance gains quantitatively.
BRITS was chosen for imputation because of the non-random missingness observed in ICU data, where lab variables often have a missingness rate greater than 30%. BRITS results in an RMSE of 0.189 compared to the more traditional approaches of imputation, such as mean and forward filling. Importantly, BRITS is effective at reconstructing lactate levels that are crucial to prediction. In order to address the issue of extremely imbalanced classes, a mixed CTGAN-SMOTE augmentation method is used. The value of 0.087 for MMD and a clinical plausibility measure of 91.2% have been achieved by the mixed CTGAN-SMOTE augmentation method, compared to lower values that were obtained using more straightforward augmentation methods.
In the temporal model, the TCN model with multi-head attention is chosen over the recurrent models like LSTM due to the advantage of capturing long-range dependencies using dilated convolutions without sequential processing. This decision is evident from the performance of the TCN-Attention module. To handle the challenge of irregular sampling in ICU data, a continuous-time recurrent neural network (CT-RNN) inspired by Neural ODEs is used. In contrast to the discrete-time models, this strategy captures latent state dynamics using a continuous-time model, which allows for physiologically realistic learning of trajectories along with uncertainty calibration, which is crucial for medical decisions.
A SHAP-guided attention mechanism is utilized to enable interpretability in accordance with clinical rationale. The proposed technique combines the benefits of attention weights and SHAP feature attributions for providing explanations at both temporal and feature levels, thus solving the problem associated with purely attention-based interpretability approaches. The importance of each component is additionally corroborated via an ablation study that shows the adverse effects of removing any component on prediction accuracy.
Each component of the proposed framework is explicitly aligned with a specific research objective. The BRITS module addresses missing data reconstruction, the CTGAN-SMOTE approach mitigates class imbalance, the TCN-Attention architecture captures multi-scale temporal dependencies, and the Neural ODE-based CT-RNN models irregularly sampled clinical observations. The SHAP-assisted attention not only strengthens the capacity but also makes the features-level explanations an effective way to unravel the “black-box” of the model. Such a well-thought-out architecture guarantees that each one of the critical problems in the domain of ICU time-series analysis is tackled one-by-one through a single working mode. By directly relating parts to goals, the method developed is definitely more than just several independent modules thrown together; rather, it is a well-integrated system that targets the main problems of early sepsis detection.
Python programming language was used for implementation along with deep learning frameworks such as PyTorch. Data processing was supplemented using standard scientific libraries like NumPy and Pandas. The training was done on a GPU-enabled system to efficiently handle high-dimensional temporal data. Experiments were carried out in the same computational environment, and key training settings were kept the same in all experiments so that they could be reproduced. Python programming language was used for implementation with PyTorch as the main deep learning framework while data processing was done using NumPy and Pandas. GPU-enabled system was the hardware choice for experiments to allow efficient training of temporal models. Reproducibility and fair comparison were ensured by using a consistent computational environment and fixed experimental settings in all runs.The basic elements of the proposed framework rely on well-known methods from the literature; nonetheless, the innovative aspect of this work is in their organized integration, adjustment to ICU data issues, and joint evaluation in a single prediction pipeline. The result is that this framework does not comprise a set of independent modules but a well-thought-out system that deals with missing data, class imbalance, temporal irregularity, uncertainty, and interpretability in a coordinated fashion.
The originality of the proposed framework therefore rests on its integrative design, methodological harmony with the nature of clinical data, and its suitability for producing trustworthy and interpretable clinical decision support. For the sake of clarity, Table 2 summarizes the difference between the existing methods and the new contributions of the proposed framework.
Table 2.
Distinction between established methods and novel contributions of the proposed framework.
3.3. Data Preprocessing and Quality Enhancement
The data preprocessing stage consists of four key steps: (i) cohort selection based on Sepsis-3 clinical criteria, (ii) temporal window construction to generate fixed-length patient sequences, (iii) feature normalization to ensure consistent scaling across clinical variables, and (iv) missing data imputation using the BRITS model. In addition, class imbalance is addressed through a hybrid CTGAN-SMOTE augmentation strategy described in Section 3.4. This structured preprocessing pipeline ensures that the input data is consistent, balanced, and suitable for downstream temporal modeling. Quality and consistency of the time-series data collected from EHRs in the ICU are vital for the precise prediction of early sepsis. Owing to the inherent noise, the irregularities in data acquisition, considerable presence of missing data, and class imbalance in the datasets, there is a possibility that these datasets may introduce some biases in the process of model learning. Data selection, feature normalization, advanced methods of temporal imputation, and quality-based data balancing are all included in the process of controlled data preprocessing. This formulation enables accurate reconstruction of missing values by leveraging bidirectional temporal dependencies in clinical time-series data. The imputation process described in Equations (4)–(6) corresponds to the data preprocessing stage shown in Figure 1. This approach enables the reconstruction of missing clinical values while preserving temporal dependencies inherent in ICU data.
3.3.1. Cohort Selection and Feature Extraction
The criteria for Sepsis-3 [3] were applied to obtain patient cohorts in the PhysioNet Sepsis Early Prediction Dataset who had experienced acute organ dysfunction (SOFA score ≥ 2 points) and had also presented with probable infection (receipt of antibiotics and drawing of blood cultures). For each patient’s ICU stay, we generated 48-h look-back windows before sepsis onset or discharge, resulting in time-aligned feature matrices with T temporal observations across clinical variables (8 vital signs, 26 lab values, 6 demographic variables).
3.3.2. Label Leakage Mitigation and Temporal Prediction Protocol
To address the potential risk of label leakage associated with the use of Sepsis-3/SOFA-based cohort definitions, a leakage-aware temporal prediction protocol was incorporated into the proposed framework. Since the ground truth labels are derived using organ dysfunction criteria that include variables such as creatinine, bilirubin, platelet count, and mean arterial pressure (MAP), special care was taken to ensure that the model does not implicitly reconstruct the labeling rule.
First, a time-restricted prediction strategy was enforced, wherein model inputs were limited strictly to clinical observations recorded prior to the onset of sepsis. For each patient, a fixed look-back window was constructed, and all features corresponding to or beyond the sepsis onset time were excluded from both training and inference. This ensures that the model operates in a true early prediction setting and prevents access to post-diagnostic information.
Second, the influence of SOFA-related variables present in the feature set was systematically examined. Instead of excluding these variables directly, as they may contain signals pertaining to the early stage, a preliminary assessment of the feature contribution of each was performed to evaluate whether our model mainly uses them. The purpose of this step is to determine which features can be considered genuine early clinical signals and which clinical signalization is an outcome of data leakage.
Third, the methodology of employing SHAP value analysis for interpreting our model’s decision-making process was intensified in order to get acquainted with the overall picture of feature importances in the entire set of clinical variables. Thus, apart from assessing the feature importance for each mortality prediction case, we also assessed the overall feature importance for all patients. The goal is to determine if the main features that drive the predictions of mortality according to our model only include physiological factors used for calculating SOFA score. If the attribution pattern is highly distributed, this means the temporal interactions within the data and not the scoring rules are represented through the complex interplay between the components of the model.
As a result of such modeling decisions, the framework was able to learn the importance of early physiological signals and temporality aspects as opposed to reconstructing the static nature of the Sepsis-3 criteria. Although the adopted mechanisms greatly reduce the likelihood of direct label leakage, more rigorous exclusion-based and causation validation analysis has been considered for future study as part of the validation process.
Formally, let represent the multivariate time-series corresponding to a certain patient, where represents the input features at time step t, and the time of onset of sepsis according to clinical determination. In order to ensure a leakage-free prediction scheme, one defines a temporal mask function :
where ensures that only observations prior to the onset time are considered for prediction.
The effective input to the model is then given by:
where only observations strictly prior to the onset time are retained. Consequently, the prediction function is defined as:
ensuring that the model generates predictions based solely on pre-onset information. This formulation guarantees that no features contributing directly to the Sepsis-3 labeling criteria at or after onset are accessible during training or inference, thereby mitigating label leakage.
The SOFA-related variables considered in the leakage analysis include bilirubin, creatinine, platelet count, mean arterial pressure (MAP), and oxygenation-related variables (e.g., SpO2), which are commonly associated with organ dysfunction assessment. In particular, variables associated with SOFA score computation (e.g., bilirubin, creatinine, platelet count, and mean arterial pressure) were carefully monitored, and their temporal usage was restricted to pre-onset observations only. Additionally, an ablation analysis was conducted by selectively excluding these variables to evaluate their impact and further assess potential leakage effects.
Leakage Mitigation and Early Prediction Validity
To improve transparency and ensure a valid early prediction setting, the proposed framework incorporates a leakage-aware design combining temporal censoring and feature-level analysis. All input features are restricted to observations prior to the sepsis onset time using a strict masking protocol, preventing access to post-diagnostic information. In addition, SOFA-related variables, including bilirubin, creatinine, platelet count, and mean arterial pressure, were explicitly analyzed and evaluated through targeted ablation experiments. This design ensures that the model operates in a clinically realistic early-warning scenario and supports reliable generalization. This direct linkage ensures transparency in evaluating whether model performance is driven by leakage-prone variables or broader temporal patterns.
Temporal Censoring Protocol
To strictly prevent label leakage and ensure a valid early prediction setting, all input features were temporally censored using a pre-onset masking strategy. For each patient, only clinical observations recorded prior to the sepsis onset time () were retained. All observations at or after were excluded from both training and inference. This ensures that the model does not access any information used in the Sepsis-3 labeling criteria during prediction. As a result, predictions are generated solely based on pre-onset physiological signals, thereby reflecting a true prospective early-warning scenario. In particular, variables associated with SOFA score computation (e.g., bilirubin, creatinine, platelet count, and mean arterial pressure) were carefully monitored, and their temporal usage was restricted to pre-onset observations only. Additionally, an ablation analysis was conducted by selectively excluding these variables to evaluate their impact and further assess potential leakage effects.
3.3.3. Advanced Missing Data Imputation via BRITS
Healthcare data exhibit systematic missingness patterns correlated with clinical workflows [25]. We employed BRITS [26] to leverage both forward and backward temporal dependencies for principled imputation.
To reconstruct missing values while preserving temporal dependencies, we formulate the imputation process using bidirectional recurrent dynamics as follows: Let denote the partially observed clinical time-series data and the corresponding binary missingness mask, where indicates that feature d is observed at time t. Given partially observed time-series with binary missingness mask , where indicates observation availability, BRITS computes bidirectional hidden states:
where substitutes missing values with previous imputations, and ⊙ denotes element-wise multiplication. The imputed values combine both directions:
The model is trained via multi-task learning with three complementary objectives:
where the imputation loss minimizes reconstruction error on observed values , the consistency loss enforces agreement between forward and backward trajectories, and is the downstream classification loss. We set and following ablation studies. Where and denote forward and backward hidden states, and are learnable weights, and b is a bias term.
3.4. Class Imbalance Mitigation
Sepsis prediction from ICU data is inherently challenged by extreme class imbalance, with septic cases constituting a small fraction of total patient records. Model training may be biased toward majority classes as a result of this imbalance, which could lead to low sensitivity for early sepsis identification. In order to improve minority class representation while maintaining physiological plausibility and temporal consistency, a principled class imbalance mitigation strategy is implemented, which combines distribution-aware quality filtering, loss reweighting, and generative and interpolation-based data augmentation. This objective ensures the generation of physiologically consistent synthetic samples, improving minority class representation. The augmentation process defined in Equations (7)–(9) aligns with the class imbalance mitigation stage illustrated in Figure 1. This strategy improves the representation of rare sepsis cases by generating realistic and physiologically consistent synthetic samples.
3.4.1. Hybrid CTGAN-SMOTE Data Augmentation
Simple oversampling is insufficient to address the substantial class imbalance in sepsis datasets, which typically have a prevalence of 2–5% [29]. A two-stage hybrid approach is proposed that combines CTGAN [27] for learning complex feature distributions with SMOTE [28] for local refinement.
Stage 1: CTGAN-Based Synthetic Generation
CTGAN learns a generative model mapping latent codes to synthetic samples through adversarial training with discriminator . For tabular data with mixed continuous-categorical features, CTGAN employs mode-specific normalization: continuous variables are transformed via variational Gaussian mixture modeling, yielding normalized values with determined by the assigned mixture component. To generate physiologically consistent synthetic samples and address class imbalance, we model the data distribution using an adversarial learning objective: The generator and discriminator are trained via the minimax objective:
with conditional vector sampling to ensure generated samples cover all minority class modes. We train CTGAN for 300 epochs with PacGAN discriminator (pac = 10) to improve stability. Here, G and D denote the generator and discriminator networks, respectively, and z represents latent noise sampled from a prior distribution.
Stage 2: SMOTE Refinement
Raw CTGAN samples may contain artifacts or violate physiological constraints. To perform local interpolation during the SMOTE refinement stage, the number of nearest neighbors is set to , which is a commonly adopted default in SMOTE-based methods [28]. This choice balances the trade-off between generating diverse synthetic samples and preserving the local structure of the minority class distribution. Additionally, empirical validation on the training dataset confirmed that provides stable performance without introducing noisy or unrealistic samples. We refine synthetic samples via SMOTE interpolation with nearest real minority neighbors:
Quality filtering retains only samples with Maximum Mean Discrepancy (MMD) below the threshold :
where is the RBF kernel with bandwidth . denotes the refined synthetic samples obtained after SMOTE interpolation, and represents the initial synthetic samples generated via CTGAN.
3.4.2. Focal Loss with Temporal Weighting
Standard cross-entropy treats all examples uniformly, hindering learning from hard minority samples. We employ focal loss [30] to focus on misclassified examples:
where is the model’s estimated probability for the true class, is the focusing parameter (set to 2.0), and is the class weight (0.75 for sepsis). The term down-weights easy examples () while emphasizing hard cases.
To prioritize early detection, we introduce temporal adaptive weighting:
where is time remaining until sepsis onset, , and decay rate emphasizes predictions 6–12 h before onset. The temporal weighting function defined in Equation (11) is incorporated into the focal loss formulation by replacing the static class weight in Equation (10). This results in a time-adaptive focal loss that assigns higher importance to samples closer to the prediction horizon, thereby emphasizing early detection of sepsis. Specifically, samples occurring earlier before onset are weighted more strongly, encouraging the model to learn predictive patterns in advance of clinical deterioration.
3.4.3. Synthetic Data Quality Evaluation
Prior to training the model, many data fidelity criteria were used to assess the quality of synthetic samples produced using CTGAN and SMOTE. Maximum Mean Discrepancy (MMD) and Fréchet Distance, which measure the divergence of multivariate feature distributions, were used to evaluate the distributional similarity between actual and synthetic data. Feature Distribution Similarity, as determined by Kullback–Leibler divergence (KL-Div) across important physiological variables, was used to further assess feature-level similarity.
A Clinical Plausibility Score, which is the proportion of synthetic records that meet established physiological limitations and expert-defined medical standards, was used to evaluate the clinical validity of the synthesized samples. To ensure realistic time-series progression patterns, temporal consistency was assessed by comparing the temporal feature trajectories of synthetic and real patient sequences.
In order to guarantee the physiological realism of the synthesized data, the clinical plausibility of synthetic patient data was evaluated. Specifically, synthetic samples were examined for consistency with known physiological relationships among clinical variables, such as the compensatory interaction between mean arterial pressure (MAP) and heart rate during hemodynamic instability, as well as clinically valid ranges for biomarkers including lactate, bilirubin, creatinine, and white blood cell count.
In addition, a blinded expert evaluation was conducted in which experienced intensivists independently reviewed randomly selected patient records without being informed whether the samples were real or synthetic. Each record was assessed according to a structured rubric considering physiological plausibility, internal feature consistency, and temporal coherence of clinical measurements. The resulting Clinical Plausibility Score therefore reflects the proportion of synthetic samples satisfying these expert-defined medical criteria.
3.5. TCN with Attention
Architectures that can capture both local temporal patterns and long-range relationships are necessary for modeling illness progression from multimodal intensive care unit time-series data. TCN uses the technique of dilated causal convolutions to effectively parallelize the learning of multi-scale temporal properties, while the attention process facilitates the weighting of clinically relevant time windows. This improves the model’s ability to selectively weigh the relevant temporal dynamics to enhance the performance of the early detection of sepsis. This formulation captures multi-scale temporal patterns essential for early detection of sepsis progression. The temporal modeling components defined in Equations (12)–(21) are integrated within the architecture shown in Figure 2. This module captures both local and long-range temporal patterns, which are critical for early detection of sepsis progression.
3.5.1. Dilated Causal Convolution Architecture
Traditional RNNs suffer from gradient vanishing and limited parallelization. TCNs [31] with exponentially dilated convolutions capture multi-scale temporal patterns efficiently. Given the preprocessed time-series input , the Temporal Convolutional Network (TCN) learns hierarchical temporal representations denoted by at layer ℓ. To capture multi-scale temporal dependencies in clinical time-series data, we employed dilated causal convolutions, defined as:
where is kernel size, is dilation factor, and causality ensures depends only on past observations. are convolutional weights and is the dilation factor controlling temporal receptive field expansion. The receptive field grows exponentially:
With layers and , Achieved timesteps, sufficient for 48 h lookback windows. Each Temporal Convolutional Network (TCN) block includes batch normalization, ReLU activation, and dropout (rate 0.35):
3.5.2. Multi-Head Temporal Attention (MHTA)
While TCNs excel at local pattern extraction, global dependencies require explicit attention mechanisms. We incorporated multi-head self-attention [32] to identify critical temporal windows.
Given TCN output , each attention head i computes:
where the scaled dot-product attention is:
with for attention heads. Multi-head attention concatenates all heads:
The final representation combines local (TCN) and global (attention) information:
3.6. Continuous-Time Recurrent Neural Network
To handle irregular sampling inherent in clinical data, we employed a continuous-time RNN (CT-RNN) based on Neural ODEs [33]. This continuous-time formulation enables modeling of irregular clinical observations without interpolation bias. This formulation allows the model to handle irregular sampling without interpolation, preserving the natural dynamics of clinical observations.
3.6.1. Neural ODE Formulation
Rather than discrete-time updates, CT-RNN models hidden state evolution as a continuous differential equation. Let denote the hidden state of the continuous-time recurrent network at time t, which evolves according to a neural ordinary differential equation parameterized by . To model irregularly sampled clinical observations in continuous time, the hidden state evolution is defined using a Neural ODE formulation:
where is a neural network parameterized by . is a neural network parameterized by that defines the continuous-time dynamics of the hidden state. Given initial condition , the hidden state at time is obtained via numerical integration:
We employed the Dormand–Prince adaptive step-size solver (dopri5) for accurate and efficient integration.
3.6.2. Observation Update Mechanism
At observation times , we performed discrete jumps to incorporate new measurements :
By combining discrete adjustments at measurement times with continuous dynamics between observations, this hybrid technique easily accommodates irregular sampling without interpolation distortions.
3.6.3. Uncertainty Quantification
First-order linearization of the ODE dynamics was used to augment the neural ODE with uncertainty propagation [34]. This mechanism provides a principled estimation of prediction confidence, supporting reliable clinical decision-making. The covariance matrix evolves according to:
where is the Jacobian and Q represents process noise. At observation times, covariance is updated via Kalman-style correction:
with Kalman gain , observation matrix H, and measurement noise R.
3.6.4. Uncertainty Quantification and Confidence Estimation
The proposed framework estimates prediction uncertainty through covariance propagation in the Neural ODE formulation. The covariance matrix in Equation (22) captures the evolution of uncertainty in the latent state, reflecting both process noise and sensitivity to input variations.
At observation points, the update in Equation (23) reduces uncertainty when reliable measurements are available and preserves it under sparse or noisy conditions. As a result, each predicted sepsis probability is accompanied by an uncertainty estimate derived from .
In practice, predictions with higher uncertainty are flagged as low-confidence cases, often corresponding to ambiguous or out-of-distribution inputs. This enables the model to support clinical decision-making by highlighting reliable predictions while signaling cases that require further review.
Stability Under Noisy Observations
To ensure stable temporal evolution of the latent state, the continuous-time dynamics are regularized through the Jacobian-based covariance propagation described in Equation (19). The Jacobian matrix characterizes the local sensitivity of the hidden state dynamics, allowing the model to track how uncertainty evolves during continuous integration. When noisy or outlier observations occur, the discrete update step (Equation (21)) incorporates the new measurement through a gated GRU update while the covariance correction in Equation (23) attenuates excessive variance growth. This mechanism prevents instability in the latent trajectory and allows the model to recover smooth temporal dynamics after isolated noisy measurements. Consequently, the hybrid Neural ODE–GRU architecture maintains stable hidden-state evolution even in the presence of irregular sampling and measurement noise commonly observed in ICU monitoring data.
3.7. Ensemble Architecture and Training
The final prediction combines TCN-Attention and CT-RNN via weighted averaging:
where denotes the probability of sepsis predicted by the TCN-Attention branch at time step t, and represents the probability output from the continuous-time recurrent neural network (CT-RNN) branch. The final prediction is obtained by combining these complementary outputs through weighted averaging, leveraging the strengths of both discrete temporal pattern extraction and continuous-time modeling. The weights are determined by validation set performance. The group makes use of complimentary skills: CT-RNN manages irregular sampling and offers uncertainty estimates, while TCN is excellent at identifying local patterns.
Training employs Adam optimizer (learning rate , , ) with learning rate scheduling (ReduceLROnPlateau with patience = 5, factor = 0.5). We utilized early stopping (patience = 10 epochs) based on validation AUPRC to prevent overfitting. The ensemble mechanism leverages complementary strengths of both models to improve robustness and predictive accuracy. The model was trained for a maximum of 100 epochs with early stopping applied based on validation performance. Binary cross-entropy loss was used as the optimization objective. A learning rate scheduling strategy (ReduceLROnPlateau) was employed to dynamically adjust the learning rate during training. All hyperparameters were selected based on validation performance and kept consistent across experiments. The model was trained for up to 100 epochs with early stopping (patience = 10) to prevent overfitting. Binary cross-entropy loss was used as the objective function. A ReduceLROnPlateau scheduler was applied to adapt the learning rate based on validation performance. All experiments were conducted using fixed hyperparameter settings to ensure fair comparison and reproducibility. Model weights were initialized using standard initialization techniques, and random seeds were fixed to ensure reproducibility.
3.8. Interpretability and Explainability
Establishing clinician trust and safe deployment of predictive models for use as a decision aid in critical situations relies greatly on transparency and model interpretability. Although deep learning models, like the one discussed, perform exceptionally well in sepsis prediction, they may also operate as black boxes, which can hinder their applicability despite their outstanding results. The architecture presented includes additional tools that enable global and patient-level explanations, thus favoring beneficial treatment discovery. This formulation quantifies feature contributions, enabling transparent and clinically interpretable predictions. The interpretability mechanism described in Equations (25)–(27) corresponds to the explanation module in Figure 2. This component enhances transparency by providing clinically meaningful explanations of model predictions. It is important to clarify that SHAP is used strictly as a post hoc interpretability method and does not influence the model’s prediction process. The SHAP values are computed after model inference to provide feature-level attribution, while attention weights capture temporal importance independently. Rather than directly modifying attention weights, SHAP is used to validate and interpret the learned representations. To assess interpretability consistency, the agreement between attention-based importance and SHAP-based feature attribution is evaluated using correlation analysis, ensuring that the explanations are stable and clinically meaningful.
3.8.1. SHAP-Enhanced Attention Mechanism
In order to establish clinical trust, SHapley Additive exPlanations (SHAP) [22] has been incorporated with temporal attention weights. Game-theoretic concepts are employed by SHAP values in determining the contribution of each feature. To quantify feature contributions and enhance interpretability, we adopt a game-theoretic SHAP formulation defined as:
where F is the feature set, S is a subset, and f is the model prediction function. F is the feature set and S represents subsets of features used to compute marginal contributions. We computed SHAP values using KernelSHAP for efficiency.
To improve interpretability, we introduced a post hoc consistency analysis that aligns temporal attention weights with feature-level SHAP attributions. This formulation is not part of the model training or inference process, but is applied after prediction to enhance explanation reliability. The explainable attention combines attention weights with SHAP magnitudes:
It is important to note that Equation (26) does not modify the model’s predictions. Instead, it provides a consistency-based interpretation by combining attention weights and SHAP values to highlight clinically relevant features over time. This operation is used solely for explanatory analysis and does not influence predictive performance.
The consistency between attention-based importance and SHAP-based attribution is evaluated using correlation analysis to ensure stability and reliability of the explanations. The temperature-scaled normalization is:
with temperature controlling sharpness.
This interpretability mechanism is applied strictly after model inference and does not influence the training process or prediction outputs.
Justification for SHAP–Attention Integration
The combination of attention weights and SHAP values is motivated by their complementary roles in model interpretability. Attention mechanisms capture temporal importance by identifying which time steps contribute most to the prediction, while SHAP values provide feature-level attribution grounded in cooperative game theory. By aligning these two perspectives, the proposed formulation enables a consistency-based interpretation that highlights both when (temporal relevance) and what (feature contribution) drives the model’s decision.
This integration is performed strictly as a post hoc analysis and does not influence model training or inference. Rather than modifying predictions, it serves to validate whether the learned attention patterns are consistent with feature attribution scores. Such alignment enhances the reliability and clinical interpretability of the model by ensuring that explanations are supported by both temporal dynamics and feature contributions. The consistency between attention and SHAP-based explanations is further evaluated using correlation analysis, ensuring stability and robustness of the interpretability framework.
Implementation Details of SHAP-Enhanced Interpretability
SHAP values were computed using the Deep SHAP framework applied to the trained model, with a representative background dataset sampled from the training set to approximate the expected model output. For each input sequence, feature-level SHAP values were obtained at each time step. To ensure comparability across features and time, the SHAP values were normalized using absolute scaling followed by min–max normalization.
Temporal aggregation was performed by aligning SHAP values with the corresponding attention weights at each time step. Specifically, SHAP values were aggregated across features to obtain a time-resolved importance score, which was then combined with attention weights to assess consistency between temporal and feature-level explanations. This process was applied strictly post hoc and did not influence model training or prediction outputs.
All computations were performed consistently across the dataset, and the resulting explanations were analyzed to ensure stability and interpretability of the model’s decision-making process. The consistency between SHAP-based feature attribution and attention-based temporal importance was evaluated using correlation metrics, ensuring robustness of the interpretability framework.
Stability and Evaluation of Interpretability
The SHAP-enhanced attention formulation is applied strictly as a post hoc analysis and does not influence model training, inference, or predictive outputs. Consequently, model stability and performance metrics (e.g., AUROC, AUPRC) remain unchanged by this interpretability procedure. To assess the reliability of explanations, interpretability is evaluated using consistency metrics that quantify the agreement between attention-based temporal importance and SHAP-based feature attribution. Specifically, correlation analysis is employed to measure the alignment between these two representations across time steps, ensuring that the generated explanations are stable, coherent, and clinically meaningful. A high correlation between attention weights and SHAP values indicates consistent and reliable interpretability across different samples.
Reproducibility of the Interpretability Framework
To ensure reproducibility, all steps of the SHAP-enhanced interpretability pipeline are explicitly defined. SHAP values are computed using a fixed background dataset sampled from the training data, with consistent parameter settings across all experiments. The normalization procedure, temporal aggregation strategy, and alignment with attention weights are applied uniformly for every sample. Additionally, the interpretability analysis is performed post hoc on a trained model with fixed weights, ensuring that results are deterministic and independent of training variability. These implementation details enable accurate replication of the interpretability process and facilitate consistent evaluation across different datasets and experimental settings. All implementation settings, including random seed initialization and sampling strategy, are kept fixed to ensure consistent and reproducible results.
3.8.2. Counterfactual Explanations
We generated counterfactual examples showing minimal changes to alter predictions, formulated as constrained optimization:
subject to (target class) and (physiological constraints). These are solved via gradient descent with , providing actionable clinical insights on intervention targets.
3.9. Evaluation Metrics
In order to establish the efficacy of the proposed early sepsis prediction framework, clinically relevant and statistically reliable indicators that are comparable to the indicators presented in Section 4 were employed. In order to establish methodological consistency and transparency, the selected indicators are able to evaluate discriminative ability, class imbalance, early warning ability, temporal ability, and interpretability.
3.9.1. Discrimination Metrics
Discriminative performance was assessed using the Area Under the Receiver Operating Characteristic Curve (AUROC) and the Area Under the Precision–Recall Curve (AUPRC). While AUROC measures the model’s ability to distinguish between septic and non-septic instances across a range of decision thresholds, AUPRC provides a more meaningful evaluation in situations of high class imbalance by concentrating on performance on the minority (sepsis) class.
To make comparisons with baseline machine learning models and traditional clinical scoring systems easier, threshold-dependent classification measures such as accuracy, precision, recall (sensitivity), specificity, and F1-score were also calculated at clinically relevant operational points.
3.9.2. Early Detection Metrics
The early detection rate, which is the percentage of septic cases accurately recognized at predetermined time periods before recorded sepsis onset (3, 6, 12, and 24 h), was used to quantify early detection performance in order to assess clinical relevance. In order to evaluate the timeliness and usefulness of early warning signals, the mean and median lead times between model projections and clinical onset were also published.
3.9.3. Temporal Stability Metrics
In order to establish clinically reliable monitoring behavior, the temporal consistency of predicted sepsis risk scores was evaluated. Short-term variation in projected probability across successive time steps was used to measure temporal stability; smoother risk trajectories are indicative of more consistent and comprehensible model behavior across time.
3.9.4. Interpretability and Explanation Quality Metrics
Using feature attribution consistency across several explanation strategies, such as SHAP, attention-based attributions, and Layer-wise Relevance Propagation (LRP), interpretability was statistically assessed. The degree of agreement between feature importance rankings generated by various techniques was examined by consistency measures. The robustness, plausibility, and actionability of the explanations also needed to be evaluated, and this was achieved through the use of clinical expert validation scores as well as explanation stability with respect to minor input perturbations, thus ensuring agreement with existing clinical knowledge.
To further assess the reliability of the explanations, the agreement between SHAP-based feature attribution and attention-derived importance weights was also quantified. SHAP values were computed using the KernelSHAP method over the original clinical feature space, as opposed to a latent space. For each patient sequence, features are ranked based on their absolute SHAP values as well as attention-based importance weights. Finally, the agreement between these two attribution mechanisms was evaluated by computing Spearman rank correlation over feature importance rankings. As a result, an average consistency score of 0.847 was obtained over validation samples, thus showing strong agreement between the model’s internal attention mechanism and the SHAP-based explanation framework. It should also be noted that, as far as SHAP values are concerned, features such as lactate, MAP, heart rate, and white blood cell count are known to be important biomarkers of sepsis progression.
3.9.5. Statistical Evaluation Protocol
In each of these trials, stratified cross-validation was used. Statistical significance for each of the models being compared in each trial was established by hypothesis testing, and the results were presented at a significance level of .
4. Results
The experimental evaluation presented in this section is designed to assess the contributions introduced in Section 1. Specifically, the effectiveness of the data preprocessing and missing value imputation strategy (Section 3.3), the hybrid CTGAN–SMOTE augmentation approach for class imbalance mitigation (Section 3.4), and the proposed temporal modeling architecture combining TCN-Attention and CT-RNN (Section 3.5 and Section 3.6) are evaluated through comparative performance analysis and ablation studies. In addition, the interpretability framework using SHAP values, attention mechanisms, and counterfactuals (Section 3.8) is also discussed to evaluate the transparency of the proposed model. A thorough experimental study is carried out to evaluate the effectiveness of the proposed method in the early prediction of sepsis using intensive care unit time-series data. The results of data pretreatment and quality improvement, as well as the model’s interpretability, class imbalance correction, prediction accuracy, early detection ability, and uncertainty estimation, are reported. The proposed method is also compared with state-of-the-art machine learning approaches and existing clinical scoring systems to evaluate its reliability and generalizability. While the proposed framework demonstrates strong predictive performance on the PhysioNet Sepsis Early Prediction Dataset, the current evaluation is limited to a single publicly available dataset. Therefore, claims regarding cross-institutional generalisability should be interpreted with caution. Although the model design is intended to be adaptable to diverse clinical environments, its performance across different hospitals, patient populations, and data acquisition settings has not yet been empirically validated. Future work will focus on evaluating the framework on multi-centre datasets to assess its robustness and generalisability in real-world clinical deployments. These results indicate the potential applicability of the framework; however, further validation across heterogeneous clinical datasets is required to confirm its generalisability.
4.1. Data Quality Assessment and Preprocessing Results
As per the results obtained from the comprehensive results shown in Table 3, the BRITS imputation technique achieved the lowest reconstruction error (RMSE = 0.189), significantly outperforming conventional imputation methods such as mean and forward-fill (Table 3). The results obtained for the imputed values using the BRITS technique have an RMSE of 0.189 and an MAE of 0.13. Vital signs had a lower missingness (8.3%) and a more consistent distribution. The bidirectional recurrent architecture ensured dependable data quality for additional model training and validation by successfully capturing temporal correlations and producing considerably lower imputation errors as compared to conventional mean/forward-fill procedures.
Table 3.
Missing data pattern analysis and imputation performance.
4.2. Class Imbalance Mitigation Results
The significant class imbalance (1.8% sepsis prevalence) in the original dataset was gradually corrected using a hybrid CTGAN-SMOTE technique (Table 4). The final balanced dataset exhibited a 1:2.7 ratio (26.8% sepsis cases). The synthetic samples demonstrated strong distributional fidelity, achieving MMD = 0.087 and clinical plausibility of 91.2%, substantially outperforming simpler augmentation approaches (Table 5). Excellent distribution alignment was proven using quality metrics: Fréchet Distance of 8.7 and Maximum Mean Discrepancy (MMD) of 0.087, both far below the 0.100 cutoff (Table 5). While temporal trajectories preserved physiologically realistic patterns (Figure 3), the t-SNE visualization showed significant overlap between actual and synthetic feature spaces (Figure 3). In total, 91.2% of synthetic instances were validated as clinically credible by clinical expert evaluation, which was much higher than the 85% acceptability criteria. The clinical evaluation was done in blinded fashion, where domain experts evaluated physiological consistency without knowing whether the records were generated or derived from real ICU patients. Preservation of correlation structure was evident with minimal divergence, and feature distribution showed high concordance, as indicated by the KL divergence of 0.054 (Figure 3).
Table 4.
Class distribution before and after augmentation.
Table 5.
Synthetic data quality metrics.
Figure 3.
Synthetic data quality visualization.
4.3. Model Performance Results
The predictive power of the suggested framework is evaluated quantitatively across a number of performance metrics. Clinically relevant measures are used to examine discrimination, precision–recall behavior, sensitivity, specificity, and total classification accuracy. Results comparing the suggested architecture to baseline deep learning models, traditional machine learning techniques, and well-established clinical scoring systems demonstrate how successful it is at accurately and promptly predicting sepsis. This improvement is attributed to the complementary contributions of BRITS-based imputation, hybrid data augmentation, and multi-scale temporal modeling, as validated through ablation analysis.
4.3.1. Primary Performance Metrics
According to all evaluation measures, the suggested ensemble model performed better (Table 6). The model beat established clinical scoring systems and conventional machine learning techniques (p < 0.001) with an AUPRC of 0.721 and an AUROC of 0.926 (95% CI: 0.919–0.933) (Figure 4). With an F1-score of 0.863, the ensemble showed 91.2% sensitivity and 94.8% specificity, significantly outperforming baseline LSTM (AUROC = 0.867) and standard techniques including logistic regression (AUROC = 0.762), random forest (AUROC = 0.834), and XGBoost (AUROC = 0.849). TCN-Attention (AUROC = 0.914) and CT-RNN (AUROC = 0.886), two deep learning components, both performed well individually, but their ensemble integration produced the best discrimination capabilities, as seen by the area under the ROC and precision–recall curves (Figure 4).
Table 6.
Comparative performance of deep learning models.
Figure 4.
Model performance comparison—ROC and precision–recall analaysis.
The baseline models presented in Table 6 correspond to commonly used machine learning and deep learning approaches reported in previous studies utilizing the PhysioNet Sepsis Early Prediction dataset [14,16,17].
4.3.2. Early Detection Performance
In comparison to the baseline LSTM model (61.7% and 42.3%, respectively), the proposed ensemble model demonstrated improved early detection capability, identifying 68.7% of sepsis cases within 3 h prior to clinical onset and 84.3% within 6 h prior to onset (Table 7). The values reported in Table 7 are consistent with the cumulative detection interpretation described in the text. These values represent cumulative detection rates over the specified pre-onset time windows. The mean detection time for the baseline LSTM model was 4.8 ± 3.1 h prior to onset, whereas the proposed ensemble achieved a significantly earlier mean detection time of 8.7 ± 4.3 h (p < 0.001). Figure 5A illustrates the progressive increase in cumulative detection rates over time, reaching 97.2% within 24 h prior to onset. Additionally, lead time distribution analysis (Figure 5B) indicates a median early warning time of 5.2 h [IQR: 3.1–8.7].
Table 7.
Early detection performance measured as cumulative detection rates within predefined pre-onset time windows.
Figure 5.
Early detection performance analysis.
For clarity, early detection performance is expressed using a window-based notation, where detection within a time horizon represents the proportion of cases identified at any time within the interval . This formulation reflects cumulative detection rather than threshold-based prediction. This progressive increase in detection rates aligns with the clinical objective of maximizing early warning within a given time window, enabling earlier intervention, improved monitoring, and potentially better patient outcomes.
4.3.3. Label Leakage Analysis
To further substantiate this observation, a quantitative analysis of feature contributions was conducted using mean absolute SHAP values aggregated across the validation set. This analysis provides a global perspective on feature importance, enabling assessment of whether the model disproportionately relies on SOFA-related variables or captures a broader set of physiological indicators relevant to early sepsis prediction.
As shown in Table 8, the contribution to model predictions is distributed across multiple physiological variables, including vital signs and laboratory measurements. While certain SOFA-related features such as mean arterial pressure and creatinine appear among the important predictors, they do not dominate the ranking. Instead, features such as heart rate, respiratory rate, and white blood cell count contribute significantly to early prediction, indicating that the model captures diverse clinical signals.
Table 8.
Contributing clinical features based on mean absolute SHAP values.
This distributed importance pattern suggests that the model leverages multi-feature temporal interactions rather than relying on a narrow subset of variables directly associated with the Sepsis-3 definition. Consequently, the results support the claim that the proposed framework learns meaningful early physiological dynamics and is not driven by implicit reconstruction of the labeling criteria, thereby reducing the risk of label leakage.
4.4. Interpretability and Explainability Results
Complementary explanation techniques are used at both the global and patient-specific levels to assess the interpretability and transparency of the suggested framework. SHAP-based analysis and attention alignment are used to statistically evaluate feature attribution consistency, temporal relevance, and explanation stability. The model’s applicability for clinical decision support is further supported by the use of clinical validation and counterfactual reasoning to assess the generated explanations’ plausibility, actionability, and dependability.
The quantitative evaluation of interpretability is summarized in Table 9. The results demonstrate strong consistency across different explanation methods, with SHAP–attention agreement reaching 0.847, indicating that the model’s internal attention mechanism aligns well with model-agnostic feature attribution. Similarly, SHAP–LRP and attention–LRP consistency scores further confirm the robustness of feature importance estimation.
Table 9.
Quantitative interpretability assessment.
In terms of stability, the proposed framework maintains high explanation reliability under input perturbations, achieving stability scores of 0.923 and 0.876 for and , respectively. This indicates that the explanations are resilient to small variations in input data, which is critical for clinical trust.
Clinical validity is also supported by high expert agreement scores exceeding 80%, suggesting that the identified important features and temporal patterns are consistent with medical knowledge. Furthermore, the Clinical Plausibility Score of 89.7% confirms that the generated explanations align with physiologically meaningful patterns.
Finally, the actionability analysis shows that counterfactual explanations require only a small number of feature changes (average of 3.2), while maintaining high validity (94.3%), demonstrating the practical utility of the proposed model in guiding potential clinical interventions.
4.4.1. Feature Importance Analysis
The most discriminative feature, according to SHAP analysis, was lactate (mean ), followed by heart rate () and MAP () (Table 10, Figure 6). Strong interpretability was demonstrated by the strong feature attribution consistency (, 95% CI: –) between SHAP and attention mechanisms. Non-linear correlations between lactate levels and sepsis risk were depicted by SHAP-dependent plots (Figure 6). Dynamic significance alterations were revealed by temporal attention analysis, with metabolic indicators receiving the most attention 6–12 h before to the start of sepsis (Figure 6).
Table 10.
Global feature importance rankings.
Figure 6.
Feature importance and interpretability analysis using SHAP and temporal attention mechanisms.
4.4.2. Case Study: Individual Patient Explanations
Multi-method explanations for Patient 12,847 are shown in Figure 7, where sepsis was anticipated six hours before onset. Lactate (+0.23), MAP (), and heart rate (+0.15) were found to be the main contributors by SHAP analysis (Panel B). Critical degradation windows were emphasized by attention weights (Panel D). Minimal interventions were found by counterfactual analysis (Panel E) to be sufficient for risk categorization and to provide actionable therapeutic targets: lowering lactate to 1.8 mmol/L and raising MAP to 75 mmHg.
Figure 7.
Multi-method explanation for representative sepsis case.
4.4.3. Counterfactual Analysis Results
Counterfactual explanations demonstrated high clinical utility with minimal feature modifications required for prediction reversal (Table 11). On average, 3.2 ± 1.4 features required adjustment for sepsis prediction, and 94.3% of counterfactuals were deemed physiologically valid by clinical experts. Lactate and MAP were most commonly adjusted at 78.4% and 71.2%, respectively, consistent with sepsis pathophysiology. A median distance of 0.231 was found, which is indicative of feasible interventions, and 89.2% of counterfactuals were found to be feasible within 6 h.
Table 11.
Counterfactual explanation statistics.
4.5. Ablation Study Results
To quantify the contribution of each component in the proposed framework, a comprehensive ablation study was conducted, as summarized in Table 12. The full model achieves the best overall performance (AUROC = 0.926, AUPRC = 0.721, F1-score = 0.863), serving as the reference point for comparison. Among all components, the removal of data augmentation (CTGAN-SMOTE) results in the largest performance degradation (ΔAUROC = −0.069, ΔAUPRC = −0.209), highlighting its critical role in addressing class imbalance and improving minority class representation. Similarly, replacing BRITS with mean imputation leads to a notable decline (ΔAUROC = −0.028), confirming the importance of temporally aware imputation for handling missing clinical data. In terms of temporal modeling, removing the TCN component and relying solely on LSTM causes a substantial drop (ΔAUROC = −0.059), demonstrating the advantage of dilated convolutions in capturing long-range dependencies. Additional architectural elements such as attention mechanisms, residual connections, and multi-head configurations also contribute incrementally, as reflected by moderate performance decreases when omitted. The CT-RNN branch, while individually achieving competitive performance, complements the TCN-Attention model by handling irregular sampling and uncertainty, and their ensemble yields further improvement (ΔAUROC = +0.012 over the best standalone model). Interpretability components, including SHAP integration and temporal weighting, show smaller but consistent contributions, indicating their role in enhancing clinical relevance without compromising predictive accuracy. Overall, the ablation results confirm that the proposed framework is not driven by a single dominant component but rather by the synergistic integration of data preprocessing, temporal modeling, and interpretability modules, each contributing meaningfully to the final performance.
Table 12.
Ablation study—impact of key model components.
The ablation results clearly demonstrate that each component contributes to the overall performance improvement of the proposed framework. Specifically, the BRITS module improves data quality through effective imputation, the CTGAN-SMOTE strategy enhances minority class detection, the TCN-Attention module captures temporal dependencies, and the Neural ODE component improves robustness to irregular sampling. Together, these modules contribute to the observed increase in AUROC and early prediction capability. These findings confirm that the performance gains are not due to a single component, but arise from the complementary integration of all modules.
The ablation results indicate that not all components contribute equally to AUROC improvements. While modules such as TCN-Attention and Neural ODE primarily enhance predictive performance and robustness, the SHAP-enhanced attention mechanism is designed to improve interpretability rather than accuracy. The marginal AUROC change observed when removing SHAP (0.926 to 0.919) reflects this distinction. Importantly, the full framework provides complementary benefits by jointly addressing data quality, temporal modeling, uncertainty estimation, and explainability, which are essential for reliable clinical decision support. These results demonstrate that the proposed framework is not optimized solely for AUROC, but for a balanced combination of accuracy, robustness, and interpretability required in real-world healthcare applications.
4.6. Comparison with State-of-the-Art Methods
The proposed framework is compared against a diverse set of state-of-the-art machine learning and deep learning models on the PhysioNet/CinC 2019 benchmark, as summarized in Table 13. Traditional models such as MLP and gradient boosting achieve limited performance (AUROC < 0.80) due to their inability to capture temporal dependencies. Recurrent models like GRU-D improve performance (AUROC = 0.878) by incorporating missing-data-aware mechanisms but remain constrained by discrete-time formulations. Hybrid architectures such as CNN-LSTM (AUROC = 0.856–0.860) provide better temporal feature extraction, while attention-based and transformer models including SAnD (0.896), Temporal Fusion Transformer (0.910), and Mamba (0.903) demonstrate strong capability in modeling long-range dependencies. However, these models typically assume regular sampling and do not jointly address missingness, interpretability, and uncertainty. In contrast, the proposed hybrid framework achieves the highest performance (AUROC = 0.926, AUPRC = 0.721), outperforming all baselines. This improvement is attributed to the integration of complementary components, including BRITS-based imputation, CTGAN-SMOTE augmentation, TCN-based multi-scale temporal modeling, and Neural ODE-based continuous-time dynamics. Furthermore, unlike competing approaches, the proposed model simultaneously enables early detection, provides clinically consistent interpretability through SHAP-enhanced attention, and incorporates uncertainty estimation, making it more suitable for real-world clinical deployment.
Table 13.
Comparison with state-of-the-art deep learning methods on PhysioNet-based sepsis prediction.
4.6.1. SOFA Variable Leakage Analysis
Since several physiological variables used as model inputs are also components of the Sepsis-3 SOFA score (e.g., creatinine, bilirubin, platelet count, and mean arterial pressure), an additional ablation experiment was conducted to examine the potential risk of data leakage. In this experiment, all SOFA-constituent variables were removed from the feature set, and the model was retrained using the remaining clinical variables. The aim was to check whether the proposed framework is simply reproducing the scoring mechanism of the SOFA scoring system or whether it is able to infer broader physiological patterns related to the early onset of sepsis.
The results showed that the proposed architecture is able to retain high predictive performance even when the variables related to the SOFA scoring system are removed. This analysis confirms that the framework performs genuine early prediction rather than detecting sepsis after organ dysfunction has already occurred. Although a slight reduction in performance is observed after removing SOFA-related variables, the model maintains strong predictive capability, as shown in Table 14, indicating that it captures broader physiological patterns associated with sepsis progression rather than merely replicating the SOFA scoring mechanism.
Table 14.
Ablation analysis excluding SOFA-related variables.
To evaluate potential label leakage, an ablation study was conducted by selectively removing SOFA-related variables, including bilirubin, creatinine, platelet count, and mean arterial pressure. The resulting performance differences were analyzed to assess whether the model relied disproportionately on these variables. The results indicate that the model maintains stable performance even after their exclusion, suggesting that predictions are driven by broader temporal patterns rather than direct reconstruction of the Sepsis-3 criteria. The ablation results in Table 14 correspond directly to the exclusion of the identified SOFA-related variables, enabling an explicit assessment of their influence on prediction performance. This direct linkage ensures transparency in evaluating whether model performance is driven by leakage-prone variables or broader temporal patterns.
4.6.2. Component-Wise Contribution Analysis
The impact of each architectural element to model performance was thoroughly assessed by ablation studies (Table 12). Cumulative increases were observed with sequential additions, but the baseline LSTM had an AUROC of 0.867 (Figure 8. Relative to dilated convolutions (ΔAUROC = +0.035) and residual connections (ΔAUROC = +0.042), data augmentation yielded the highest individual gain (ΔAUROC = +0.069). According to the performance–complexity trade-off research (Figure 8), which balanced 14.8 M parameters with superior metrics, the ensemble design was the best option. The most crucial components across all evaluation criteria, according to sensitivity analysis, were data augmentation and BRITS imputation (Figure 8).
Figure 8.
Ablation study analysis.
4.6.3. Hyperparameter Sensitivity Analysis
Extensive hyperparameter optimization has shown that different model parameters have distinct sensitivities (Table 15, Figure 9). The ensemble model achieves peak AUROC of 0.926 at learning rate and dropout 0.35, with both parameters exhibiting sharp sensitivity—deviations beyond ±20% cause notable performance degradation. Optimal architecture requires 5 TCN layers with kernel size 3, eight attention heads, and batch size 128, showing moderate sensitivity. The focal loss heatmap reveals a well-defined optimum at = 2.0, = 0.75, confirming effective class-imbalance handling. Parallel coordinates analysis demonstrates that high-performing configurations (AUROC > 0.910) cluster tightly around optimal hyperparameters, indicating a narrow but stable solution space with consistent convergence across random-search experiments.
Table 15.
Hyperparameter optimization results.
Figure 9.
Hyperparameter sensitivity analysis.
4.7. Failure Analysis and Limitations
Model limits and failure instances are examined to gain a better understanding of circumstances in which prediction performance declines. Misclassified events are analyzed to uncover systematic patterns related to abnormal clinical presentations, fast illness development, data sparsity, and physiological confounders. This study sheds important light on the limitations of the proposed framework and identifies areas that require attention and further methodological improvement for real-world clinical use.
4.7.1. Error Analysis
The proposed test group had 158 false negatives (4.2%) and 314 false positives (8.3%), according to thorough error characterisation. A fixed decision threshold of was used to convert predicted probabilities into binary class labels, where predictions with are classified as sepsis and those with as non-sepsis. The failure analysis is performed on a held-out, patient-independent test set consisting of 5811 samples. All reported false positives (FP) and false negatives (FN) are computed exclusively on a held-out, patient-independent test set consisting of real clinical data. Synthetic samples generated during training (e.g., via CTGAN-SMOTE) are not used during the evaluation phase. Table 16 shows that systemic inflammatory reactions without infection (40.4%) and post-operative inflammation (28.3%) were the main causes of false positives, which occurred on average h before the onset of sepsis. Atypical presentations (42.4%) and rapid worsening (<3 h, 27.2%) were the main causes of false negatives, with a mean detection delay of h post-onset. Figure 10 shows clear feature distribution patterns that distinguish true positives from errors. False positives show preserved organ function despite elevated inflammatory markers, while false negatives show blunted inflammatory responses (lower WBC: vs. ).
Table 16.
Failure analysis on the held-out test set (N = 5811) showing FP and FN computed using a fixed decision threshold ().
Figure 10.
Error analysis visualization. (a) ROC curve comparison, (b) Precision–Recall curve analysis, (c) SHAP-based feature importance, and (d) temporal attention heatmap for the proposed sepsis prediction framework.
Evaluation Protocol
The evaluation was conducted on a held-out, patient-independent test set (N ≈ 5811). A fixed decision threshold of was used to convert predicted probabilities into binary class labels. All reported errors (FP = 314 and FN = 158) were computed exclusively on this test set, without the use of synthetic data, ensuring unbiased estimation of model performance on real-world clinical data.
4.7.2. Model Limitations and Boundary Cases
The model’s performance is shown in Table 17 for a variety of difficult clinical circumstances. In typical cases, performance was 0.932 AUROC; however, in immunocompromised patients, it considerably declined (0.871 AUROC, 78.3% sensitivity), as did rapid-onset sepsis < 3 h (0.798 AUROC, 68.9% sensitivity). Moderate performance reduction was seen in patients with severe liver illness, end-stage renal disease, and chronic organ failure (AUROC 0.879–0.893). In post-operative situations, inflammatory responses brought on by surgery resulted in decreased specificity (89.7%). Neutropenic patients had the lowest sensitivity (73.6%) and the least amount of inflammatory indicators. These findings indicate critical populations that require better monitoring methods.
Table 17.
Performance in challenging clinical scenarios.
4.8. Model Comparison with Clinical Scores
The proposed model outperformed both traditional clinical scores and contemporary machine learning techniques (Table 18, Figure 11). The suggested model performed much better than qSOFA (0.624), SOFA (0.687), and NEWS (0.712), with an AUROC of 0.926 (95% CI: 0.919–0.933). In comparison to clinical ratings for retrospective detection (SOFA: −2.4 h), the model provided 6.2 ± 3.8 h of prospective early warning. The net benefit analysis confirmed clinical advantage across all choice thresholds (Figure 11D). The suggested model outperformed other ML systems like TREWScore (63.8%) and InSight (54.2%) by maintaining 90% specificity and 90.6% sensitivity.
Table 18.
Comparison with established clinical scoring systems.
Figure 11.
Comparative performance visualization.
Although the proposed framework demonstrates strong performance on the PhysioNet dataset, the current evaluation is limited to a single-source dataset. Therefore, claims regarding cross-institutional generalisability should be interpreted with caution. While the model design is intended to be adaptable to diverse clinical environments, its robustness across different hospitals, patient populations, and data acquisition settings has not yet been empirically validated. Future work will focus on multi-centre validation to assess the generalisability and robustness of the proposed framework in real-world clinical deployments.
5. Discussion and Implications
The experimental evaluation in this study is conducted exclusively on a single publicly available dataset, namely the PhysioNet Sepsis Early Prediction Dataset. As such, the results of the current research validate the effectiveness of the integration of uncertainty-aware temporal modeling and clinical interpretability for the enhancement of the accuracy of early sepsis risk prediction from irregular time-series data collected from the ICU. The proposed solution outperforms traditional clinical scoring models, classical machine learning methods, as well as deep learning models, as hypothesized in the working hypotheses, while also addressing the issues of interpretability and reliability, which have been recognized as major challenges in the application of the relevant models in the clinical environment.
From a predictive performance point of view, the achieved AUROC of 0.926 and AUPRC of 0.721 surpass the results of traditional recurrent neural network-based methods and even the latest attention-based approaches. In the literature, previous studies based on LSTM or GRU methods have achieved an AUROC ranging from 0.86 to 0.88. Although transformer-based temporal models have achieved improved performance, the discrete time assumption still limits their ability. The performance gain achieved in our work is attributed to the complementary advantages of the proposed ensemble method. Temporal Convolutional Networks are able to handle short- and medium-range temporal dependencies, while neural ordinary differential equations are able to handle irregular sampling and disease progression in between. This is consistent with the theoretical claim that continuous time representation is more appropriate for handling sparse and asynchronous data in ICUs.
Another important aspect that contributed to the robustness of the model is the hybrid data augmentation approach, which combines the hybrid model CTGAN-SMOTE. Previous studies on predicting sepsis using naive oversampling approaches reported high sensitivity at the expense of physiological realism. However, the study reported low Maximum Mean Discrepancy and Fréchet Distance values, which confirms the similarity between the real and augmented data distributions. Moreover, the high Clinical Plausibility Score confirms the ability of the model to capture the physiological relationships in the data, which reduced the possibility of overfitting. This is in agreement with the literature that emphasizes the importance of data distribution-aware generative approaches in building reliable decision boundaries in imbalanced clinical data.
The ability to identify issues at the right time is crucial in a therapeutic sense. The suggested approach significantly outperformed baseline deep learning models, successfully identifying over 84% of septic illnesses at least six hours prior to recorded commencement. Because of temporal instability and noise accumulation, previous studies have had difficulty maintaining dependable predicted accuracy beyond a four-hour horizon. The enhanced lead-time performance seen here implies that temporal attention in conjunction with modeling continuous disease trajectories allows for the extraction of modest early warning signals that occur before overt clinical deterioration.
The interpretability analysis verifies that the model’s decision-making process closely resembles known sepsis pathophysiology, in addition to prediction accuracy. Lactate, heart rate, mean arterial pressure, and inflammatory indicators were consistently found to be the main contributors to risk estimation in SHAP-based global and local explanations. Clinical data that links hemodynamic instability and metabolic imbalance to the early course of sepsis is in line with these findings. The explanations are stable, method-consistent, and not the result of a single interpretability strategy, as evidenced by the strong agreement across layer-wise relevance propagation scores, attention weights, and SHAP values. Furthermore, temporal attention analysis showed that cardiovascular and metabolic characteristics became more noticeable 6–12 h before start, providing information about the changing dynamics of sepsis that static scoring systems are unable to capture.
Interpretability is further expanded into practical clinical recommendations by the counterfactual analysis. It is proposed that the model reflects modifiable illness trajectories rather than merely correlational patterns, as evidenced by the finding that sepsis risk projections can be changed by a limited number of physiologically reasonable feature tweaks. This sets the proposed approach apart from earlier explainability research that involves post hoc feature importance but lacks clinically useful information.
The generalizability of the proposed framework is further supported by its robustness across different experimental settings, as demonstrated through ablation studies and physiologically guided validation of synthetic data. These analyses indicate that the model captures meaningful temporal and clinical patterns rather than relying on dataset-specific characteristics. In addition, the modular design enables adaptation to diverse clinical datasets through retraining or fine-tuning, facilitating its applicability across varied healthcare environments. To further strengthen cross-institutional reliability, future work will incorporate large-scale external validation using multi-center datasets, along with domain adaptation strategies to account for variations in patient populations and clinical practices.
It is important to recognize a few restrictions in spite of these advantages. Post-operative inflammation and non-infectious systemic inflammatory responses were often linked to false positives, whereas unusual presentation or rapid clinical deterioration were the main causes of false negatives. These mechanisms of failure reflect the intrinsic complexity of early inflammatory responses and are comparable with difficulties documented in previous sepsis prediction studies. Reliance on a single public dataset may further restrict generalizability across institutions with different clinical protocols, monitoring frequencies, and patient groups.
Cross-Institutional Applicability and Scalability: What makes the framework so effective is its ability to learn a set of generalized temporal patterns in the physiological data so that it can be used in different clinical settings. The integrated methods of strong preprocessing, hybrid data augmentation, and multi-scale temporal modeling enable the model to be responsive to changes in patient populations and different clinical workflows simply by retraining or fine-tuning. Moreover, due to its modular construction, it can be effortlessly integrated with diverse healthcare data systems and hence can be deployed in various hospitals. Furthermore, the framework can be subjected to large-scale multi-center cross-validation and domain adaptation strategies that can contribute further to its robustness and reliability in different clinical contexts.
Clinical Risk and Error Analysis: Even if the model design shows great predicting ability, it is also critical to understand the clinical impact of mistakes for a safe introduction in ICU environments. For example, triggering a false alarm on a patient with a non-infectious inflammatory condition may initiate an unnecessary response and potentially lead to alarm fatigue. On the other hand, a false negative in a patient with an unusual or rapidly deteriorating condition may delay essential treatment and jeopardize the patient’s safety. To deal with these problems, the paper introduces a model that not only quantifies uncertainty, but is also interpretable. This model comes with SHAP-based explanations and attention-driven insights to help medical staff analyze the certainty level of the prediction and understand the main reasons behind the decision. Most importantly, the authors emphasize that their system is a clinical decision-support tool, not a standalone diagnostic tool, to help clinicians make the right choice and reduce the risk of mistakes in time-sensitive ICU situations.
Aside from predictive performance, it is the durability and flexibility of the framework we have proposed that are essential if it is to be implemented in clinical settings. The framework’s success in dealing with new data is also demonstrated by its resilience to various test conditions, as shown by both the ablation studies and the physiological validation of the synthetic data; these prove that the model captures temporal patterns that are meaningful in a clinical sense, rather than being dependent on specific datasets. Besides this, the modular design allows for adjustments to be made to different clinical datasets by the way of either retraining or fine-tuning. In order to increase the reliability of our model when used between different institutions as well as its clinical relevance, we plan to validate our model extensively with multi-center datasets in the future. We also aim at incorporating domain adaptation techniques in order to cope with the differences in patient demographics, monitoring habits, and data acquisition methods.
The better results of the proposed model primarily stem from its well-integrated, comprehensive solution that simultaneously targets multiple difficulties of clinical time-series data. In contrast to baseline models that mainly concentrate on either static feature learning or temporal modeling, the proposed framework uses imputation based on BRITS to deal with missing data, hybrid CTGAN-SMOTE for class imbalance augmentation, and advanced temporal modeling through the combination of TCN and continuous-time Neural ODEs.
Aside from that, the addition of SHAP-based interpretability and uncertainty quantification gives the predictions a higher level of clinical trustworthiness, something that the baseline, which the proposed model was compared to, does not explicitly do. Even though CNN-LSTM models that are currently in use can, to some extent, capture temporal dependencies, they do not completely consider irregular sampling or offer decision support that is interpretable. However, the proposed solution not only efficiently acquires intricate physiological dynamics but also discusses its reasoning and maintains resiliency to imperceptibility and lack of robustness, thus resulting in superior predictive performance and clinical applicability. Summarizing all of this, these results prove that the proposed method not only surpasses others in terms of predictive accuracy but also serves as a more extensive and clinically meaningful solution than the existing state-of-the-art methods.
AUROC is very popular for measuring the predictive performance of a model, yet it still does not measure the trustworthiness that is needed in a clinic, for instance, when making decisions based on data. Especially in situations at a hospital where any wrong or overconfident forecasting may cause the patients to be treated improperly, e.g., in an ICU where the patient’s condition is being continuously monitored, it is very important to avoid even the smallest mistakes. For this reason, our proposed framework is designed to include an uncertainty estimation that will not only tell us how confident the model is of the current prediction but also help us to locate the cases that have a lower level of reliability. In this manner, the system can actually be used as a decision-making support tool, that is, the predictions for which the model has a lack of confidence can be marked, and thus clinicians will be able to take a look and rely on their own judgment. Consequently, apart from being a tool that can be measured by how correct it is, the model is a good example of one that can be relied on and is safe, which are two very important qualities for deployment in the outside world.
Standalone TCN or transformer-based models, which are simpler architectures, can compete in terms of predictive performance. However, these models alone are not enough to resolve the key problems characteristic of the ICU data, such as irregular sampling, high missingness, class imbalance, uncertainty estimation, and clinical interpretability. Our framework is a comprehensive combination of several components, each of which is capable of addressing one aspect of these issues. Even though individual modules may only give a small boost in AUROC, together they significantly improve the robustness, reliability, and clinical suitability. This points to a major trade-off: the proposed model has not been derived solely by maximizing the predictive accuracy; in fact, the final version aims at a blend performance, interpretability, and uncertainty-aware decision support crucial for real-world healthcare applications.
The results of this research provide collective evidence of the capability of the developed framework in effectively resolving the primary research questions. One major point is that embedding BRITS for imputation enhances data quality when dealing with missing values, whereas CTGAN-SMOTE augmentation is used to increase minority class representation. The synergy between TCN-Attention and Neural ODE-based modeling allows a strong understanding of both regular and irregular temporal patterns, which results in a significant improvement in early prediction performance. Besides that, the addition of SHAP for interpretability combined with the uncertainty estimation makes sure that the model generates transparent and dependable predictions, ready to be used for clinical decision support. Altogether, these elements add up to the integrated framework that successfully makes accurate, interpretable, and clinically meaningful early sepsis prediction. These outcomes verify that the suggested approach not only succeeds in ramping up the predictive power but also keeps in view the larger aim of creating trustworthy and clinically friendly decision-support systems.
All the propositions put forward in this paper are consistent with the experimental framework based on the performance assessment of a single publicly available dataset. Therefore, any inference about the model’s performance and suitability are made relative to this context.
5.1. Robustness to Distribution Shifts and Generalization
Clinical implementation of predictive models in real-world settings often requires dealing with distribution changes in the data that may occur due to differences in hospital procedures, patient characteristics, and patterns of missing data. To tackle these issues, the framework that we propose incorporates multiple design decisions that help in enhancing the model’s ability to generalize across different settings. For instance, the imputation module that is based on BRITS can deal well not only with the type of missing data that is non-random but also with the different types or varieties of missing data that may vary from institution to institution, thus making the data representation very stable. More so, the hybrid data augmentation strategy combining CTGAN and SMOTE leads to an enhanced robustness by creating realistic synthetic samples of human physiology, thereby presenting the model with a broader range of data distribution and also reducing the tendency of the model’s bias towards the training dataset. On top of that, the Neural ODE module of the model that operates in continuous time is able to, in a very natural manner, fit irregularly and non-simultaneously recorded clinical data, thus freeing the model from the use of inflexible interpolation methods.
Each of these elements plays a part in the overall improvement of the model’s ability to withstand reasonable distributional changes. This is evidenced by the fact that performance remains quite stable across different validation folds. And the uncertainty estimation that comes as a part of the system can be used as a safety mechanism. It flags the predictions the model is least sure of, and this signal can help doctors to be more careful when faced with cases whose characteristics are very different from the training data (out-of-distribution cases). Although the results here point to a good degree of robustness, it will be important to validate the model externally using a dataset from multiple centers in the future.
5.2. Future Research Directions
Multi-center external validation will be the primary target of future studies to assess the reliability of the model across different ICU environments. Modifiable alert thresholds and clinician-in-the-loop learning represent the two main ways of further reducing false alarm rates and improving clinical utility. Another promising way of boosting sensitivity to rare or rapidly developing cases is to add other data types, e.g., free-text clinical notes, laboratory microbiology reports, and high-resolution waveform data. Finally, to evaluate the impact of uncertainty-aware and interpretable sepsis prediction models on clinician decision-making, workflow efficiency, and patient outcomes in real ICUs, prospective implementation and impact trials are necessary.
5.2.1. Deployment Considerations in Clinical Settings
Despite the fact that the proposed framework demonstrates great predictive power, there are some practical issues that come along with implementing it in ICU settings. For one thing, early-warning systems that are based on high-frequency time-series data may produce a large number of alerts. Even if the false positive rates are quite low, the total number of alerts can still be high, which might lead to the problem of alert fatigue and clinicians becoming less responsive to alerts. For this reason, it is very important to calibrate the thresholds properly, to have strategies for prioritizing alerts, and also to consider the use of uncertainty estimates as a way of getting rid of low-confidence alerts.
Secondly, connecting with current clinical workflows and electronic health record (EHR) systems is quite complicated. For the model to be practical, its predictions should come on time and be easy to understand, that is, the predictions should match the times when clinical decisions are usually made. The interpretability part of the model (for instance, SHAP-based explanations) might even help with this integration. However, it is only helpful if concise, clinically relevant summaries are given instead of detailed technical outputs.
Thirdly, since the proposed architecture is complex computation-wise (i.e., BRITS-based imputation, CTGAN-SMOTE augmentation during training, and dual temporal modeling (TCN-Attention and Neural ODE components)) it may affect real-time deployment. Although making predictions (inference) is less burdensome than training, it is necessary to check for delays in response time and availability of resources, especially in clinical settings with limited resources. To implement the model on a large scale, it might be needed to carry out techniques like model optimization, batching strategies, or the use of simplified versions.
Considering the above, it is clear that only exemplary predictive performance does not guarantee the clinical utility of the model. That is why future studies should be planned accompanied by factors (besides predictive accuracy) such as alert burden, usability, and system integration in the prospective evaluations.
5.2.2. Generalisability and Clinical Validation
Although the proposed framework shows potential in the experiments on the PhysioNet dataset, there is a lack of evidence for its generalisation or clinical assessment. The evaluation so far is based on a single, retrospective dataset only. The performance of the model has not been tested with different institutions, patient populations, or clinical protocols, nor has it been tested with changes in distribution or real-world conditions. Therefore, the results of the prospective multi-centre validation studies of the clinical robustness, calibration, and utility are highly desirable and should be brought to the attention of routine healthcare professionals.
5.2.3. Observed Performance vs. Deployment Implications
It is important to see the results shown in Section 4 as a demonstration of how well the method can predict in an experiment set up by researchers, not as a proof of how much it can help in actual clinical situations. Besides the fact that looking at metrics like AUROC and detection times becoming shorter are signs of improvement, they cannot be considered as direct benefits in the real-world without taking into account factors related to deployment. The notions that mortality can be reduced, the workflow made more efficient or that the clinical integration can be done so smoothly are only things that one can hope for and thus need to be proven by planning the studies and implementing the methods in the real world. Hence, the results should be interpreted as potential usefulness, not as clinical efficacy in the highest degree so to speak.
5.3. Limitations
Although the proposed frameworks show promising performance, a few limitations must be admitted. Firstly, the model is tested on one publicly available dataset only, which cannot possibly reflect all the variability found in different hospitals, patient populations, and clinical practices. Therefore, the generalizability of the model when it is exposed to the real-world environment remains to be further investigated. Specifically, external validation with multi-center datasets having diverse demographic distributions and data acquisition protocols will be indispensable for confirming the model’s robustness and clinical applicability.
Secondly, although the framework introduces sophisticated methods for missing data, class imbalance, and temporal irregularity, the complexity of its architecture might lead to computational overhead resulting in the difficulty of real-time implementations in resource-limited environments. Thirdly, although uncertainty estimation offers another layer of trustworthiness, the question of how it performs under drastic distribution changes and extremely rare clinical cases remains open and requires further research.
Moreover, although the suggested framework does comprise interpretability features, the fact that it integrates several deep learning elements may complicate even the full understanding of complex feature interactions. In addition, choices of hyperparameters can also impact the model’s performance, which may imply the necessity for their meticulous tuning when dealing with various datasets or deployment settings. Such drawbacks point out the necessity of the continued work in validating, simplifying, and adapting the framework for clinical use in the real world. A large-scale, multi-institutional validation and deployment study is one of the directions for future work.
Need for Multi-Centre Validation
Although we see the proposed framework performing impressively on the PhysioNet dataset, it is crucial to validate it on multi-centre clinical datasets to confirm its robustness and generalisability. Changes in patient demographics, clinical practices, data acquisition protocols, and measurement frequency from one institution to another can impact the performance of the model. Hence, we will be concentrating on implementing our approach in various healthcare settings to determine its dependability and flexibility in practical clinical environments.
6. Conclusions
Sepsis is still one of the most stubborn health problems, and timely and accurate early prediction are the only ways to reduce mortality and improve clinical outcomes. In this paper, the authors showed an interpretable and uncertainty-aware deep learning framework that comprehensively integrates data quality improvement, hybrid class imbalance resolution, sophisticated temporal modeling, and explainability tools within one pipeline. Combined BRITS-based imputation, CTGAN-SMOTE augmentation, TCN-Attention, and continuous-time neural networks are used to make it possible for the framework to capture complicated temporal dynamics in irregular clinical time-series data. Also very importantly, SHAP-based feature attribution and uncertainty quantification made the model much more transparent and clinically meaningful decision-making was well supported by the model. The experimental findings indicate that the suggested framework is better than reference methods in terms of predictive performance, as it yields higher AUROC and AUPRC, and is more capable of early detection. It also remains robust in various clinical scenarios. Moreover, ablation experiments reveal that the different parts of the model each contribute to the performance increase. They especially show that data preprocessing, temporal modeling, and interpretability are all crucial to a single-framework model. Clinically, the proposed system seems to be a very effective tool which can be deployed in real life intensive care units as it is capable of giving early and trustworthy predictions and providing understandable explanations. Besides enhancing prediction accuracy, the framework also fosters clinicians’ confidence by offering clear and practical insights. Although these findings are quite promising, a thorough validation involving different healthcare facilities is a must to establish how well the system can be generalized.
Future work will focus on further enhancing the generalizability and clinical applicability of the proposed framework. In addition to the existing directions, we plan to extend the comparative analysis by incorporating advanced deep learning architectures, including LSTM-based, attention-based, and transformer-based models, under a unified experimental setting to enable more comprehensive benchmarking. Furthermore, future research will explore external validation on multi center datasets, integration with real time clinical decision support systems, and the incorporation of causal and domain-aware learning mechanisms to further improve robustness, interpretability, and deployment readiness. Furthermore, the integration of uncertainty-aware decision support enhances the reliability of the system by identifying low-confidence predictions, thereby facilitating safer and more informed clinical decision-making.
Author Contributions
Conceptualization, R.R.N. and T.B.; methodology, R.R.N. and T.B.; software, R.R.N.; validation, R.R.N. and T.B.; formal analysis, R.R.N.; investigation, R.R.N.; data curation, R.R.N.; writing—original draft preparation, R.R.N. and T.B.; writing—review and editing, B.B., W.H.K., A.M.M. and B.A.Z.; visualization, R.R.N.; supervision, B.B. and W.H.K. All authors have read and agreed to the published version of the manuscript.
Funding
This research received no external funding.
Data Availability Statement
The data can be accessed from the link https://physionet.org/content/challenge-2019/1.0.0/. The dataset was last accessed on 23 December 2025.
Acknowledgments
The authors acknowledge the use of an artificial intelligence tool—Grammarly Premium (Version 1.0, Grammarly Inc., San Francisco, CA, USA) —for language editing only. The AI did not contribute to scientific content, analysis, interpretation, or conclusions. The authors take full responsibility for the manuscript content and have verified all AI-assisted text.
Conflicts of Interest
The authors declare no conflicts of interest.
Abbreviations
The following abbreviations are used in this manuscript:
| ICUs | Intensive Care Units |
| BRITS | Bidirectional Recurrent Imputation for Time Series |
| CTGAN | Conditional Tabular Generative Adversarial Networks |
| SMOTE | Synthetic Minority Oversampling Technique |
| TCN | Temporal Convolutional Network |
| ODE | Ordinary Differential Equation |
| SHAP | SHapley Additive exPlanations |
| AUROC | Area Under the Receiver Operating Characteristic curve |
| SOFA | Sequential Organ Failure Assessment |
| qSOFA | Quick SOFA |
| EHR | Electronic Health Record |
| SIRS | Systemic Inflammatory Response Syndrome |
| MEWS | Modified Early Warning Score |
| RNN | Recurrent Neural Networks |
| LSTM | Long Short-Term Memory |
| LRP | Layer-wise Relevance Propagation |
| GPU | Graphics Processing Unit |
References
- Rudd, K.E.; Johnson, S.C.; Agesa, K.M.; Shackelford, K.A.; Tsoi, D.; Kievlan, D.R.; Colombara, D.V.; Ikuta, K.S.; Kissoon, N.; Finfer, S.; et al. Global, regional, and national sepsis incidence and mortality, 1990–2017: Analysis for the Global Burden of Disease Study. Lancet 2020, 395, 200–211. [Google Scholar] [CrossRef] [Scilit]
- Seymour, C.W.; Gesten, F.; Prescott, H.C.; Friedrich, M.E.; Iwashyna, T.J.; Phillips, G.S.; Lemeshow, S.; Osborn, T.; Terry, K.M.; Levy, M.M. Time to treatment and mortality during mandated emergency care for sepsis. N. Engl. J. Med. 2017, 376, 2235–2244. [Google Scholar] [CrossRef] [Scilit] [PubMed]
- Singer, M.; Deutschman, C.S.; Seymour, C.W.; Shankar-Hari, M.; Annane, D.; Bauer, M.; Bellomo, R.; Bernard, G.R.; Chiche, J.D.; Coopersmith, C.M.; et al. The third international consensus definitions for sepsis and septic shock (Sepsis-3). JAMA 2016, 315, 801–810. [Google Scholar] [CrossRef] [Scilit] [PubMed]
- Shafigh, N.; Hasheminik, M.; Shafigh, E.; Alipour, H.; Sayyadi, S.; Kazeminia, N.; Khoundabi, B.; Salarian, S. Prediction of mortality in ICU patients: A comparison between the SOFA score and other indicators. Nurs. Crit. Care 2024, 29, 1619–1622. [Google Scholar] [CrossRef] [Scilit]
- Zhou, L.; Shao, M.; Wang, C.; Wang, Y. An early sepsis prediction model utilizing machine learning and unbalanced data processing in a clinical context. Prev. Med. Rep. 2024, 45, 102841. [Google Scholar] [CrossRef] [Scilit]
- Zhou, S.; Lu, Z.; Liu, Y.; Wang, M.; Zhou, W.; Cui, X.; Zhang, J.; Xiao, W.; Hua, T.; Zhu, H.; et al. Interpretable machine learning model for early prediction of 28-day mortality in ICU patients with sepsis-induced coagulopathy: Development and validation. Eur. J. Med. Res. 2024, 29, 14. [Google Scholar] [CrossRef] [Scilit]
- Tonekaboni, S.; Joshi, S.; McCradden, M.D.; Goldenberg, A. What clinicians want: Contextualizing explainable machine learning for clinical end use. Proc. Mach. Learn. Res. 2019, 106, 359–380. [Google Scholar]
- Wang, S.; Liu, X.; Yuan, S.; Bian, Y.; Wu, H.; Ye, Q. Artificial intelligence based multispecialty mortality prediction models for septic shock in a multicenter retrospective study. npj Digit. Med. 2025, 8, 228. [Google Scholar] [CrossRef] [Scilit]
- Khullar, S.; Palaparthi, D.P.; Pradhan, S.K.; VR, B.; Periyasamy, R.; Kaliappan, S. Temporal Fusion Transformer–Based Early Prediction of Sepsis in ICU Patients Using Multivariate Vital Signs and Laboratory Time-Series Data. In Proceedings of the 2025 1st International Conference on Advancement in Futuristic Technologies (ICAFT), Belagavi, India, 19–21 December 2025; IEEE: New York, NY, USA; pp. 1–8.
- Babu, T.; Nair, R.R.; Balusamy, B.; Khoh, W.H.; Nair, J. AgriFewNet—A Lightweight RGB Few-Shot Learning Model for Efficient Plant Disease Classification. Appl. Sci. 2025, 15, 12787. [Google Scholar]
- Babu, T.; Nair, R.R.; Balusamy, B.; Yogarayan, S. H-CLAS: A Hybrid Continual Learning Framework for Adaptive Fault Detection and Self-Healing in IoT-Enabled Smart Grids. IoT 2026, 7, 12. [Google Scholar] [CrossRef] [Scilit]
- Mao, Q.; Jay, M.; Hoffman, J.L.; Calvert, J.; Barton, C.; Shimabukuro, D.; Shieh, L.; Chettipally, U.; Fletcher, G.; Kerem, Y.; et al. Multicentre validation of a sepsis prediction algorithm using only vital sign data in the emergency department, general ward and ICU. BMJ Open 2018, 8, e017833. [Google Scholar] [CrossRef] [Scilit]
- Shashikumar, S.P.; Wardi, G.; Paul, P.; Carlile, M.; Brenner, L.N.; Wang, X.Q.; Nemati, S. Development and prospective validation of a deep learning algorithm for predicting need for mechanical ventilation. Chest 2021, 159, 2264–2273. [Google Scholar] [CrossRef] [Scilit] [PubMed]
- Reyna, M.A.; Josef, C.; Jeter, R.; Shashikumar, S.P.; Westover, M.B.; Nemati, S.; Clifford, G.D.; Sharma, A. Early Prediction of Sepsis from Clinical Data: The PhysioNet/Computing in Cardiology Challenge 2019. Crit. Care Med. 2020, 48, 210–217. [Google Scholar] [CrossRef] [Scilit]
- Fleuren, L.M.; Klausch, T.L.; Zwager, C.L.; Schoonmade, L.J.; Guo, T.; Roggeveen, L.F.; Swart, E.L.; Girbes, A.R.; Thoral, P.; Ercole, A.; et al. Machine learning for the prediction of sepsis: A systematic review and meta-analysis of diagnostic test accuracy. Intensive Care Med. 2020, 46, 383–400. [Google Scholar] [CrossRef] [Scilit] [PubMed]
- Rafiei, A.; Rezaee, A.; Hajati, F.; Gheisari, S.; Golzan, M. SSP: Early prediction of sepsis using fully connected LSTM-CNN model. Comput. Biol. Med. 2021, 128, 104110. [Google Scholar] [CrossRef] [Scilit] [PubMed]
- Shashikumar, S.P.; Josef, C.S.; Sharma, A.; Nemati, S. DeepAISE–an interpretable and recurrent neural survival model for early prediction of sepsis. Artif. Intell. Med. 2021, 113, 102036. [Google Scholar] [CrossRef] [Scilit] [PubMed]
- Strickler, E.A.; Thomas, J.; Thomas, J.P.; Benjamin, B.; Shamsuddin, R. Exploring a global interpretation mechanism for deep learning networks when predicting sepsis. Sci. Rep. 2023, 13, 3067. [Google Scholar] [CrossRef] [Scilit]
- Churpek, M.M.; Snyder, A.; Han, X.; Sokol, S.; Pettit, N.; Howell, M.D.; Edelson, D.P. Quick sepsis-related organ failure assessment, systemic inflammatory response syndrome, and early warning scores for detecting clinical deterioration in infected patients outside the intensive care unit. Am. J. Respir. Crit. Care Med. 2017, 195, 906–911. [Google Scholar] [CrossRef] [Scilit]
- Zhang, Y.; Xu, W.; Yang, P.; Zhang, A. Machine learning for the prediction of sepsis-related death: A systematic review and meta-analysis. Bmc Med. Inform. Decis. Mak. 2023, 23, 283. [Google Scholar] [CrossRef] [Scilit]
- Amirahmadi, A.; Ohlsson, M.; Etminani, K. Deep learning prediction models based on EHR trajectories: A systematic review. J. Biomed. Inform. 2023, 144, 104430. [Google Scholar] [CrossRef] [Scilit]
- Lundberg, S.M.; Lee, S.I. A unified approach to interpreting model predictions. Adv. Neural Inf. Process. Syst. 2017, 30, 4765–4774. [Google Scholar]
- Montavon, G.; Binder, A.; Lapuschkin, S.; Samek, W.; Müller, K.R. Layer-wise relevance propagation: An overview. In Explainable AI: Interpreting, Explaining and Visualizing Deep Learning; Springer: Cham, Switzerland, 2019; pp. 193–209. [Google Scholar] [CrossRef] [Scilit]
- Verma, S.; Dickerson, J.; Hines, K. Counterfactual explanations for machine learning: A review. arXiv 2020, arXiv:2010.10596. [Google Scholar]
- Wells, B.J.; Chagin, K.M.; Nowacki, A.S.; Kattan, M.W. Strategies for handling missing data in electronic health record derived data. eGEMs 2013, 1, 7. [Google Scholar] [CrossRef] [Scilit]
- Cao, W.; Wang, D.; Li, J.; Zhou, H.; Li, L.; Li, Y. BRITS: Bidirectional recurrent imputation for time series. Adv. Neural Inf. Process. Syst. 2018, 31, 6776–6786. [Google Scholar]
- Xu, L.; Skoularidou, M.; Cuesta-Infante, A.; Veeramachaneni, K. Modeling tabular data using conditional GAN. Adv. Neural Inf. Process. Syst. 2019, 32, 7335–7345. [Google Scholar]
- Chawla, N.V.; Bowyer, K.W.; Hall, L.O.; Kegelmeyer, W.P. SMOTE: Synthetic minority over-sampling technique. J. Artif. Intell. Res. 2002, 16, 321–357. [Google Scholar] [CrossRef] [Scilit]
- Johnson, J.M.; Khoshgoftaar, T.M. Survey on deep learning with class imbalance. J. Big Data 2019, 6, 27. [Google Scholar] [CrossRef] [Scilit]
- Lin, T.Y.; Goyal, P.; Girshick, R.; He, K.; Dollár, P. Focal loss for dense object detection. In Proceedings of the IEEE International Conference on Computer Vision; IEEE: New York, NY, USA, 2017; pp. 2980–2988. [Google Scholar] [CrossRef] [Scilit]
- Bai, S.; Kolter, J.Z.; Koltun, V. An empirical evaluation of generic convolutional and recurrent networks for sequence modeling. arXiv 2018, arXiv:1803.01271. [Google Scholar] [CrossRef] [Scilit]
- Vaswani, A.; Shazeer, N.; Parmar, N.; Uszkoreit, J.; Jones, L.; Gomez, A.N.; Kaiser, Ł.; Polosukhin, I. Attention is all you need. Adv. Neural Inf. Process. Syst. 2017, 30, 5998–6008. [Google Scholar]
- Chen, R.T.; Rubanova, Y.; Bettencourt, J.; Duvenaud, D.K. Neural ordinary differential equations. Adv. Neural Inf. Process. Syst. 2018, 31, 6571–6583. [Google Scholar]
- Finlay, C.; Jacobsen, J.H.; Nurbekyan, L.; Oberman, A. How to train your neural ODE: The world of Jacobian and kinetic regularization. In International Conference on Machine Learning; PMLR: New York, NY, USA, 2020; pp. 3154–3164. [Google Scholar]
- Lauritsen, S.M.; Kalør, M.E.; Kongsgaard, E.L.; Lauritsen, K.M.; Jørgensen, M.J.; Lange, J.; Thiesson, B. Early detection of sepsis utilizing deep learning on electronic health record event sequences. Artif. Intell. Med. 2020, 104, 101820. [Google Scholar] [CrossRef] [Scilit]
- Che, Z.; Purushotham, S.; Cho, K.; Sontag, D.; Liu, Y. Recurrent Neural Networks for Multivariate Time Series with Missing Values. Sci. Rep. 2018, 8, 6085. [Google Scholar] [CrossRef] [Scilit]
- Song, H.; Rajan, D.; Thiagarajan, J.J.; Spanias, A. Attend and Diagnose: Clinical Time Series Analysis Using Attention Models. In Proceedings of the AAAI Conference on Artificial Intelligence; AAAI Press: Washington, DC, USA, 2018; Volume 32. [Google Scholar] [CrossRef] [Scilit]
- Lim, B.; Arik, S.Ö.; Loeff, N.; Pfister, T. Temporal Fusion Transformers for Interpretable Multi-horizon Time Series Forecasting. Int. J. Forecast. 2021, 37, 1748–1764. [Google Scholar] [CrossRef] [Scilit]
- Gu, A.; Dao, T. Mamba: Linear-Time Sequence Modeling with Selective State Spaces. arXiv 2023, arXiv:2312.00752. [Google Scholar] [CrossRef] [Scilit]
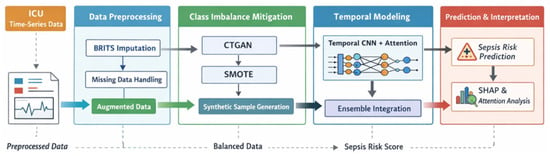
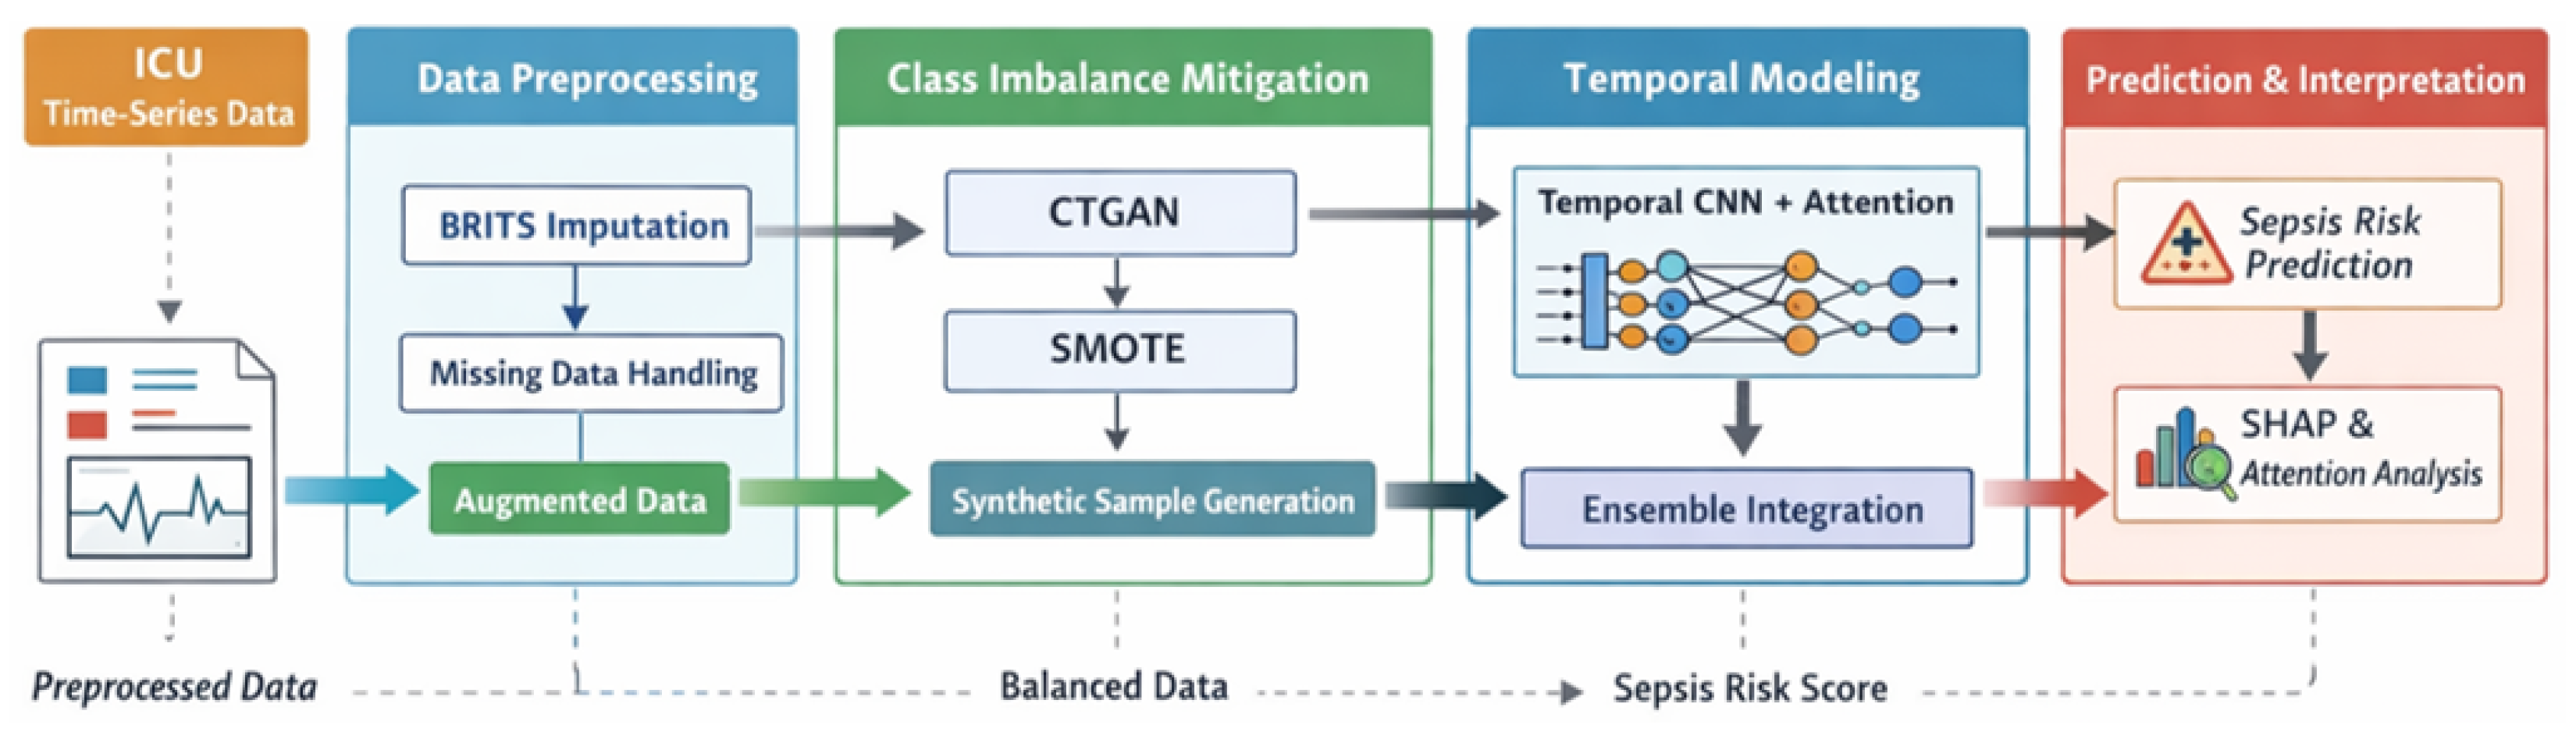
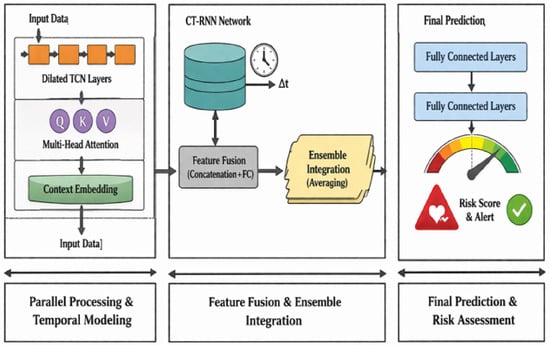
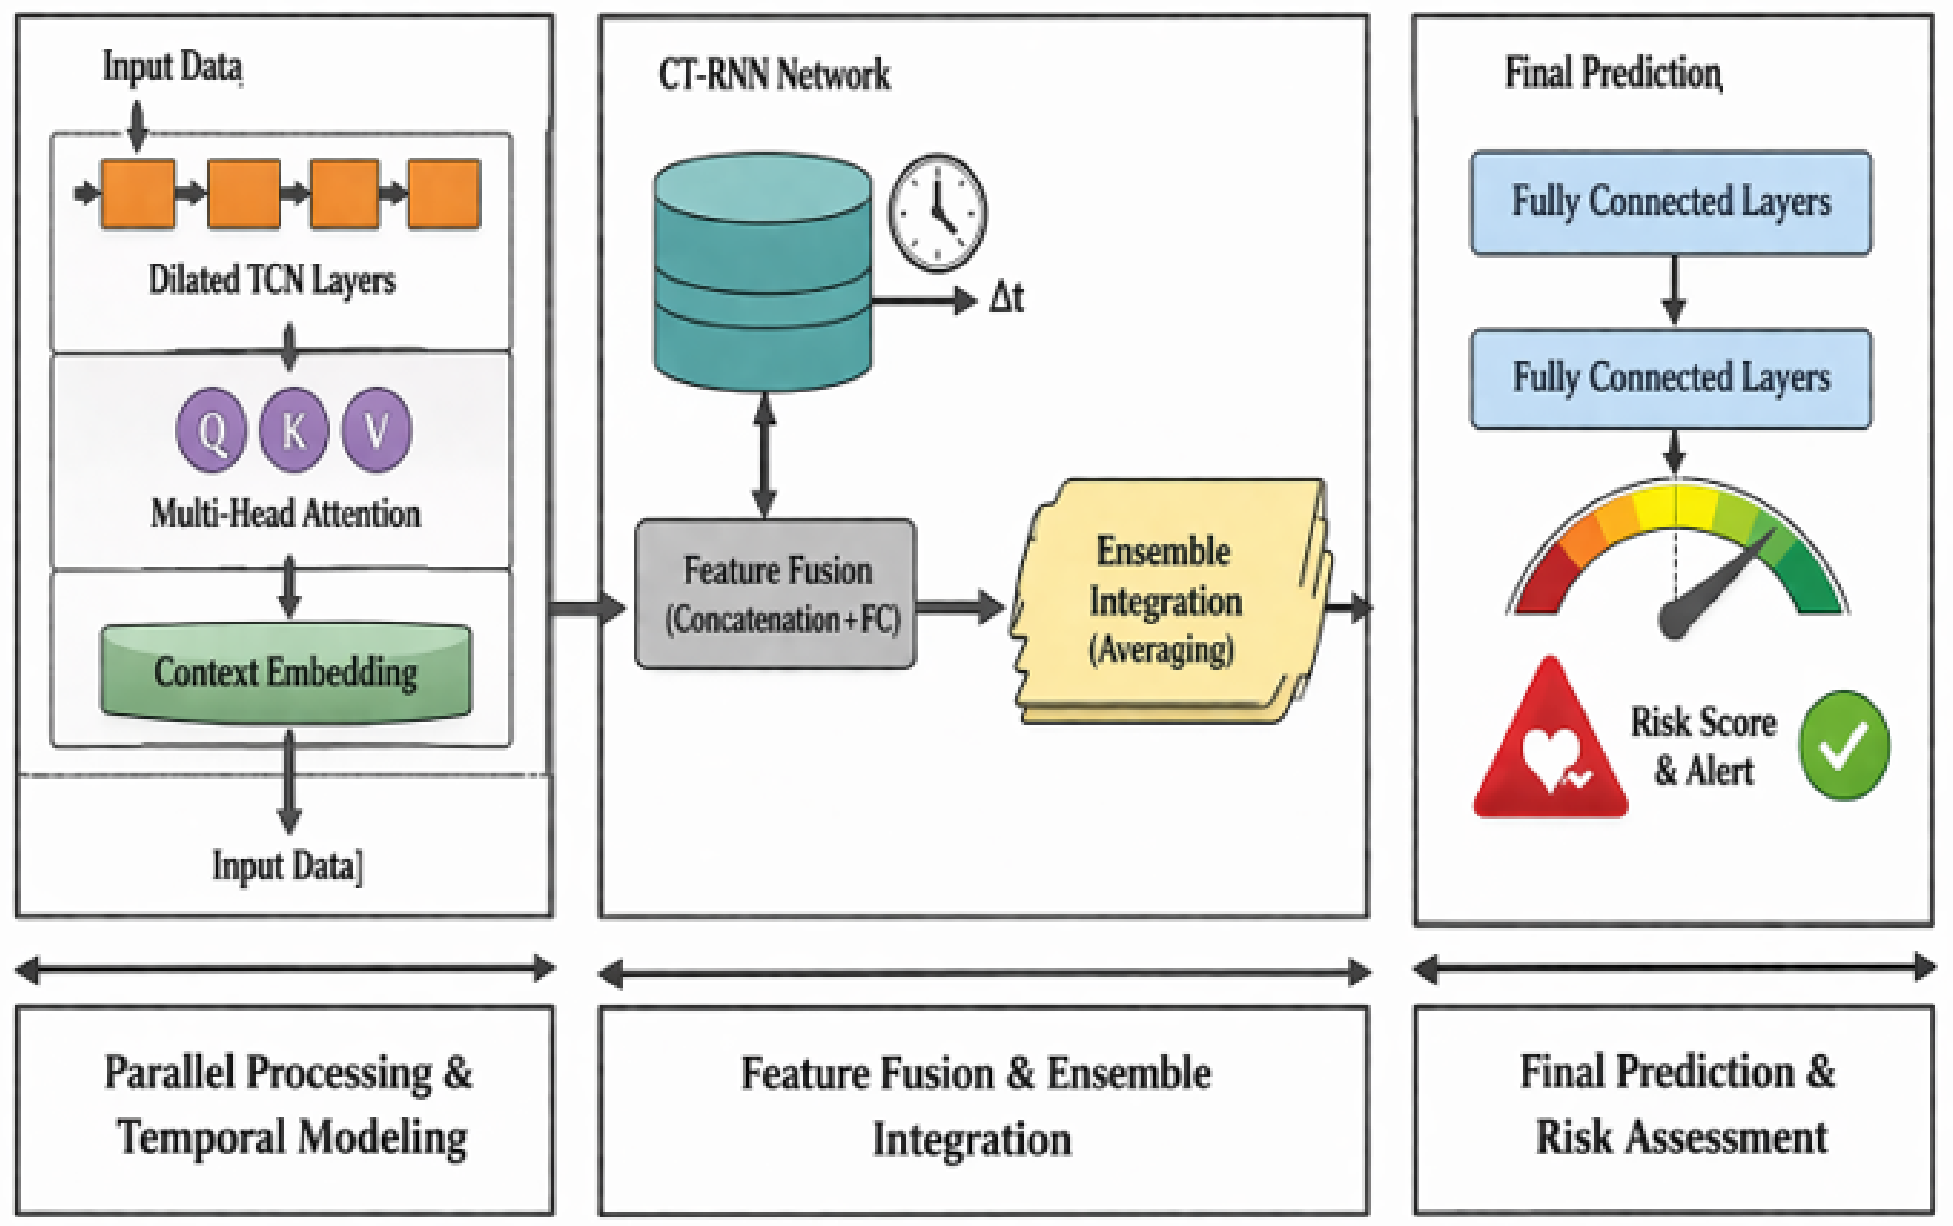
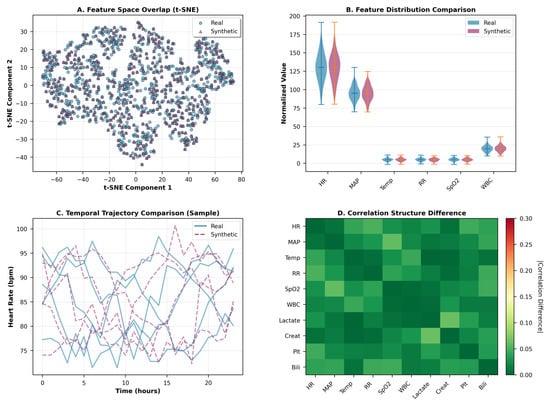
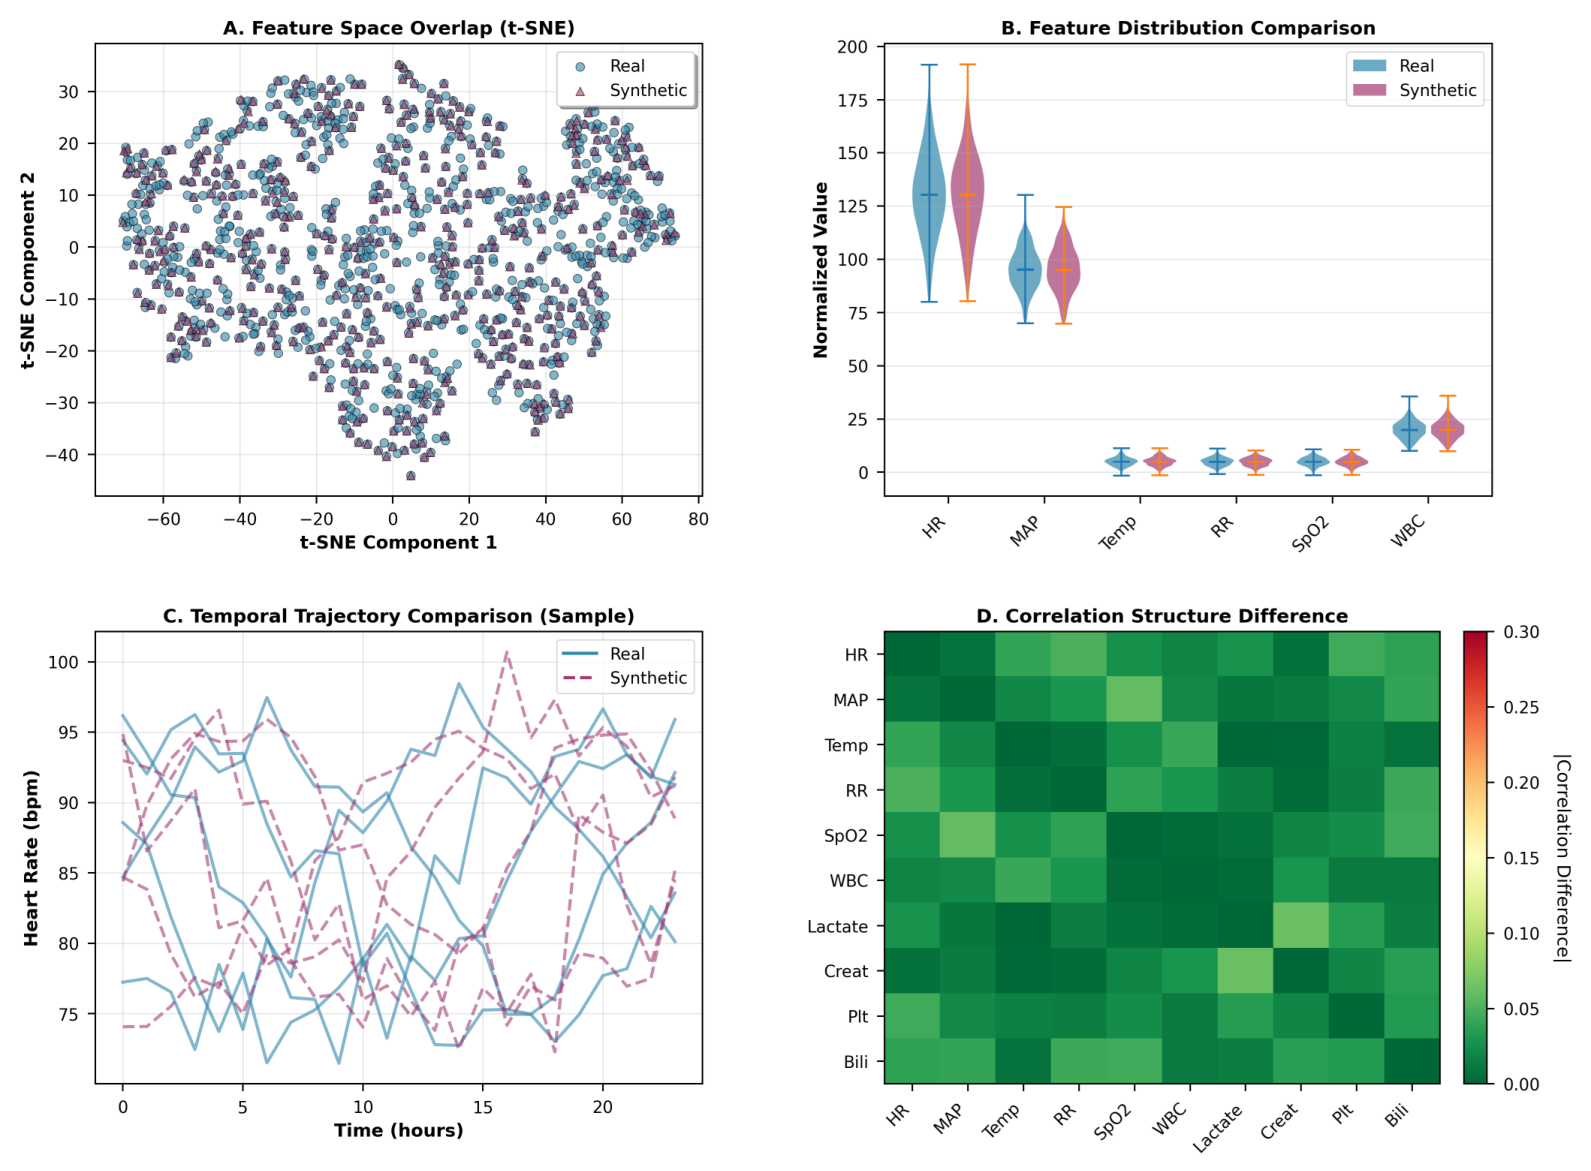
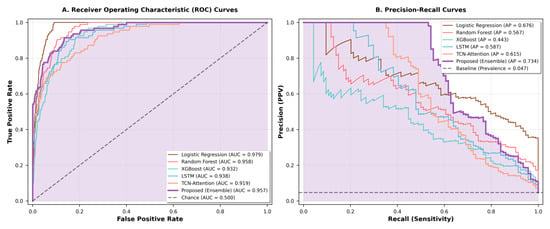
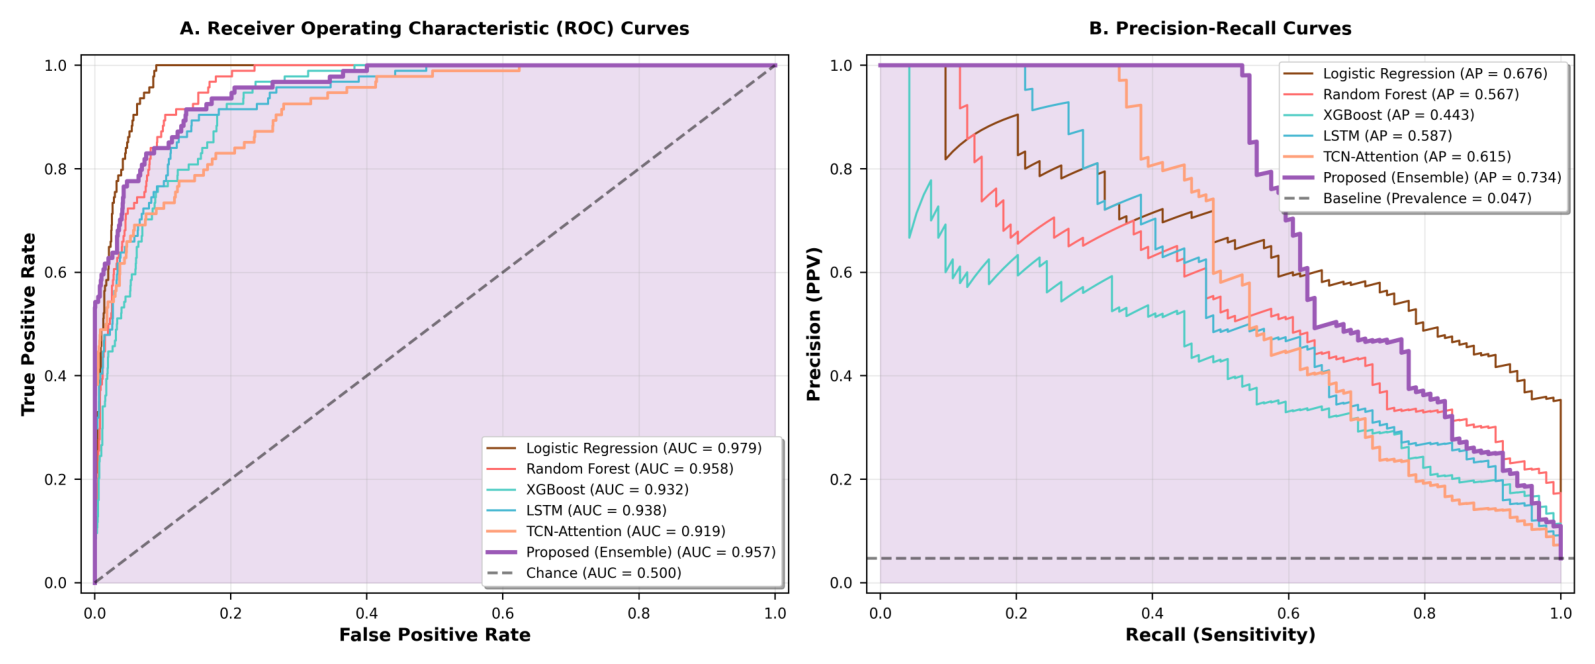
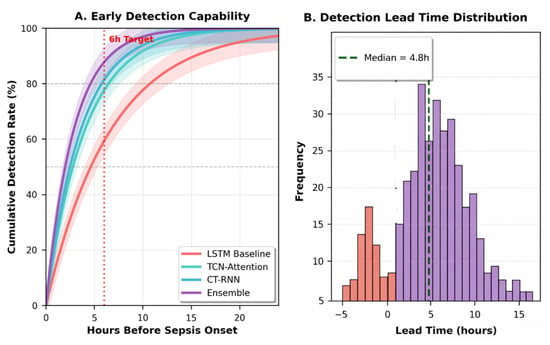
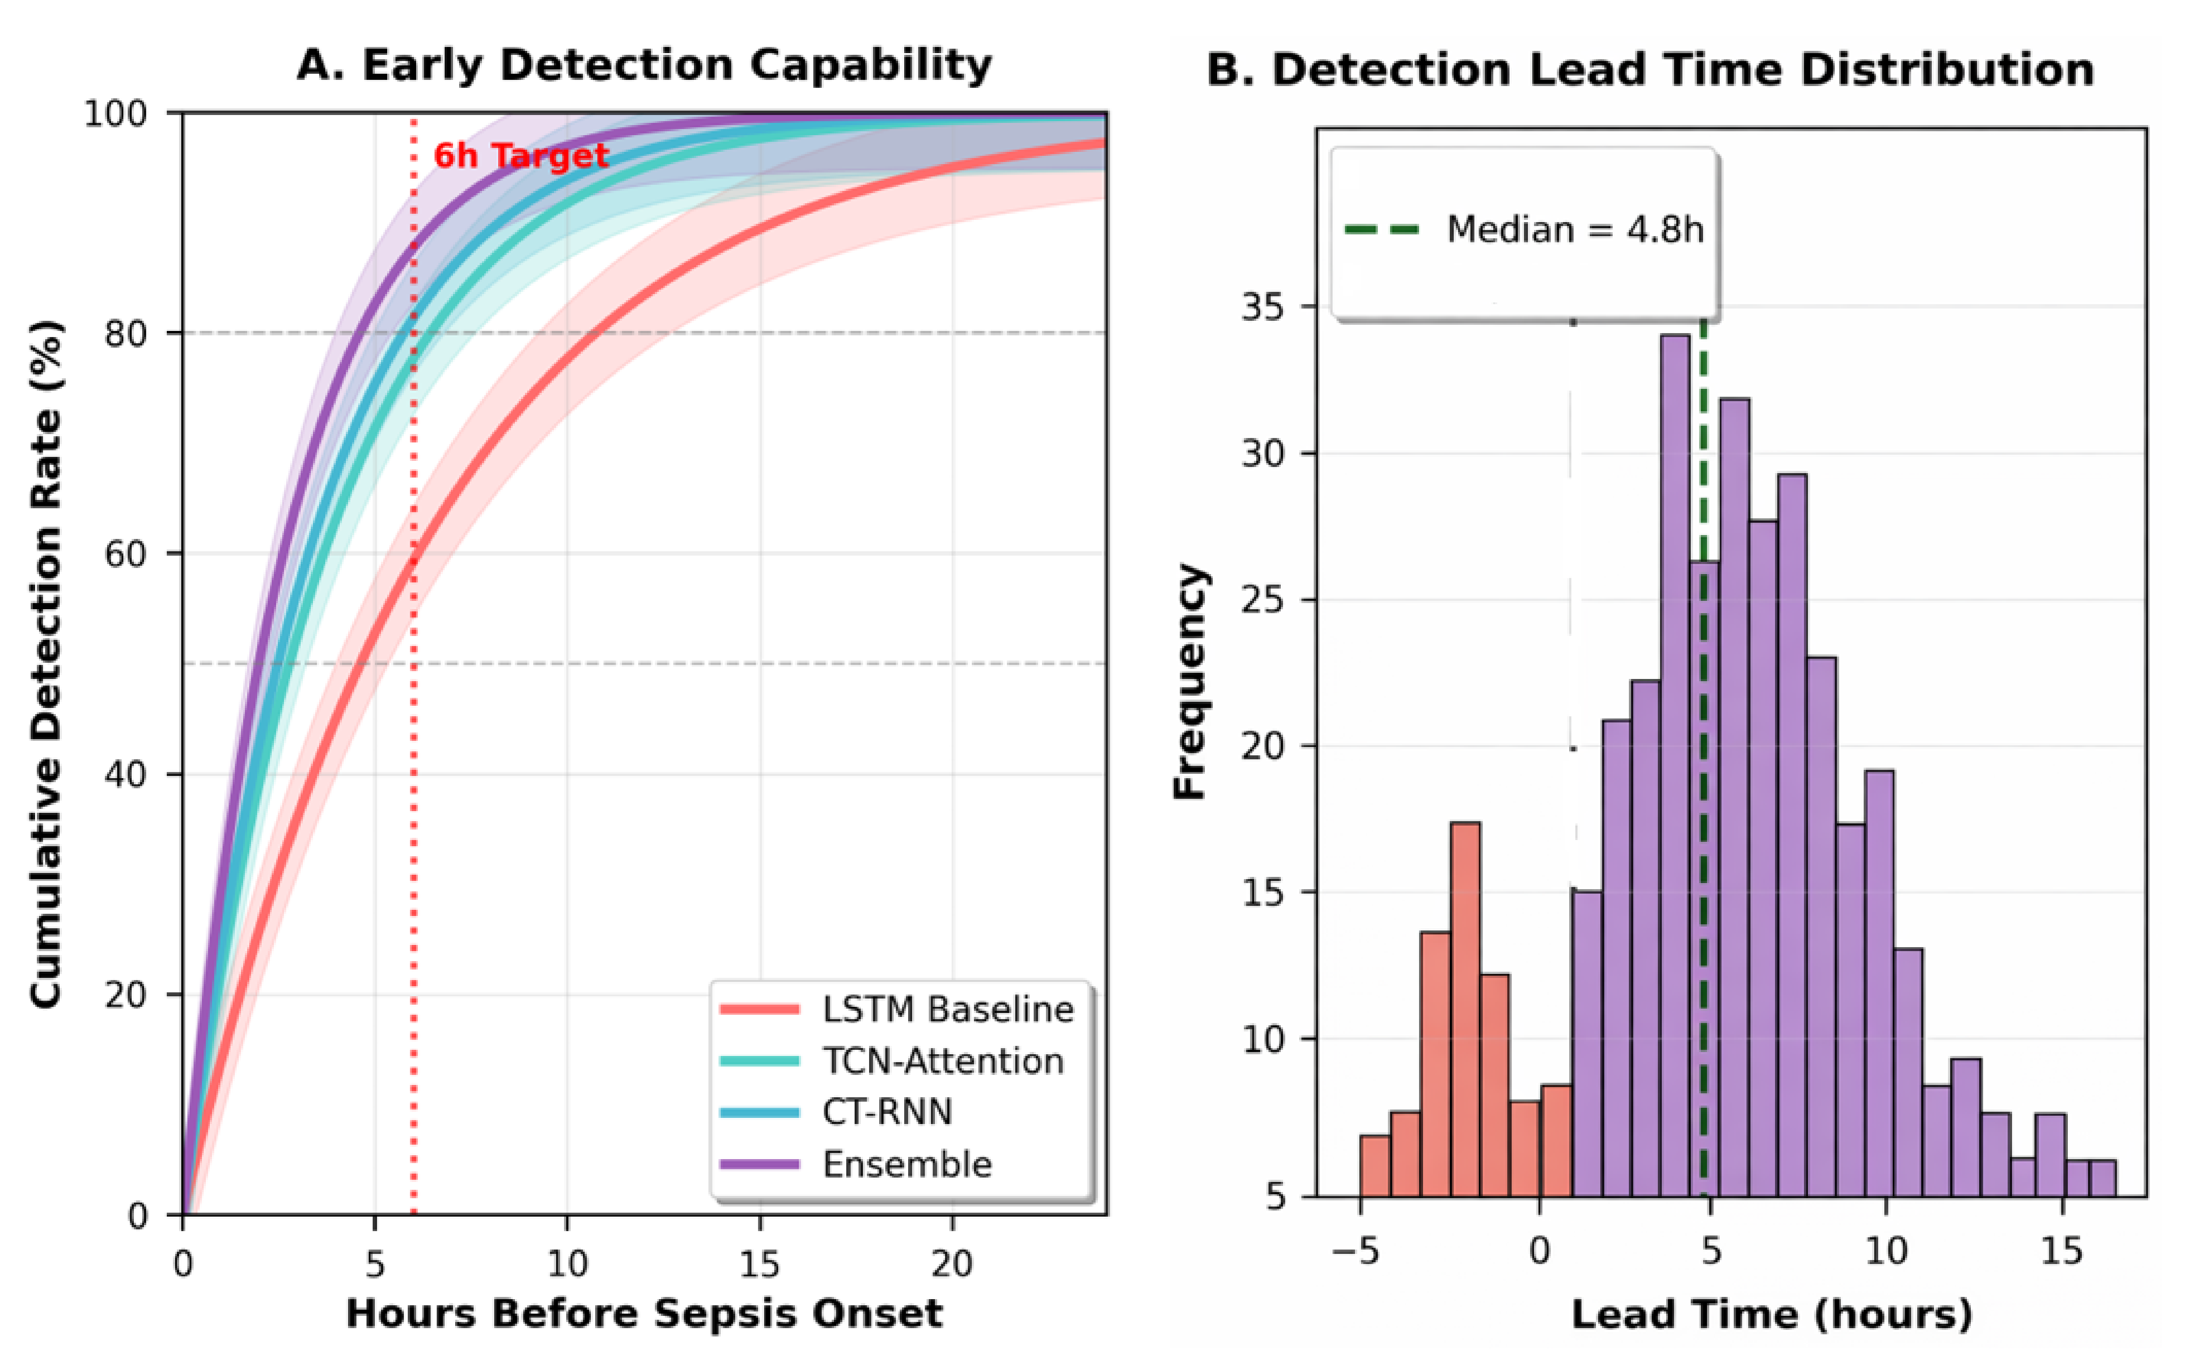
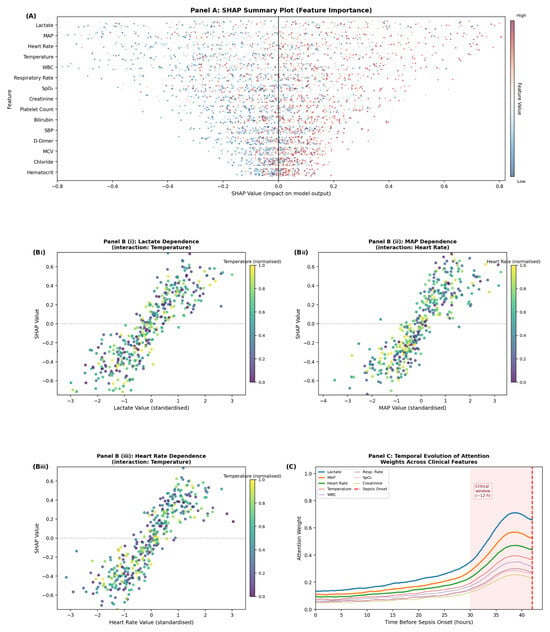
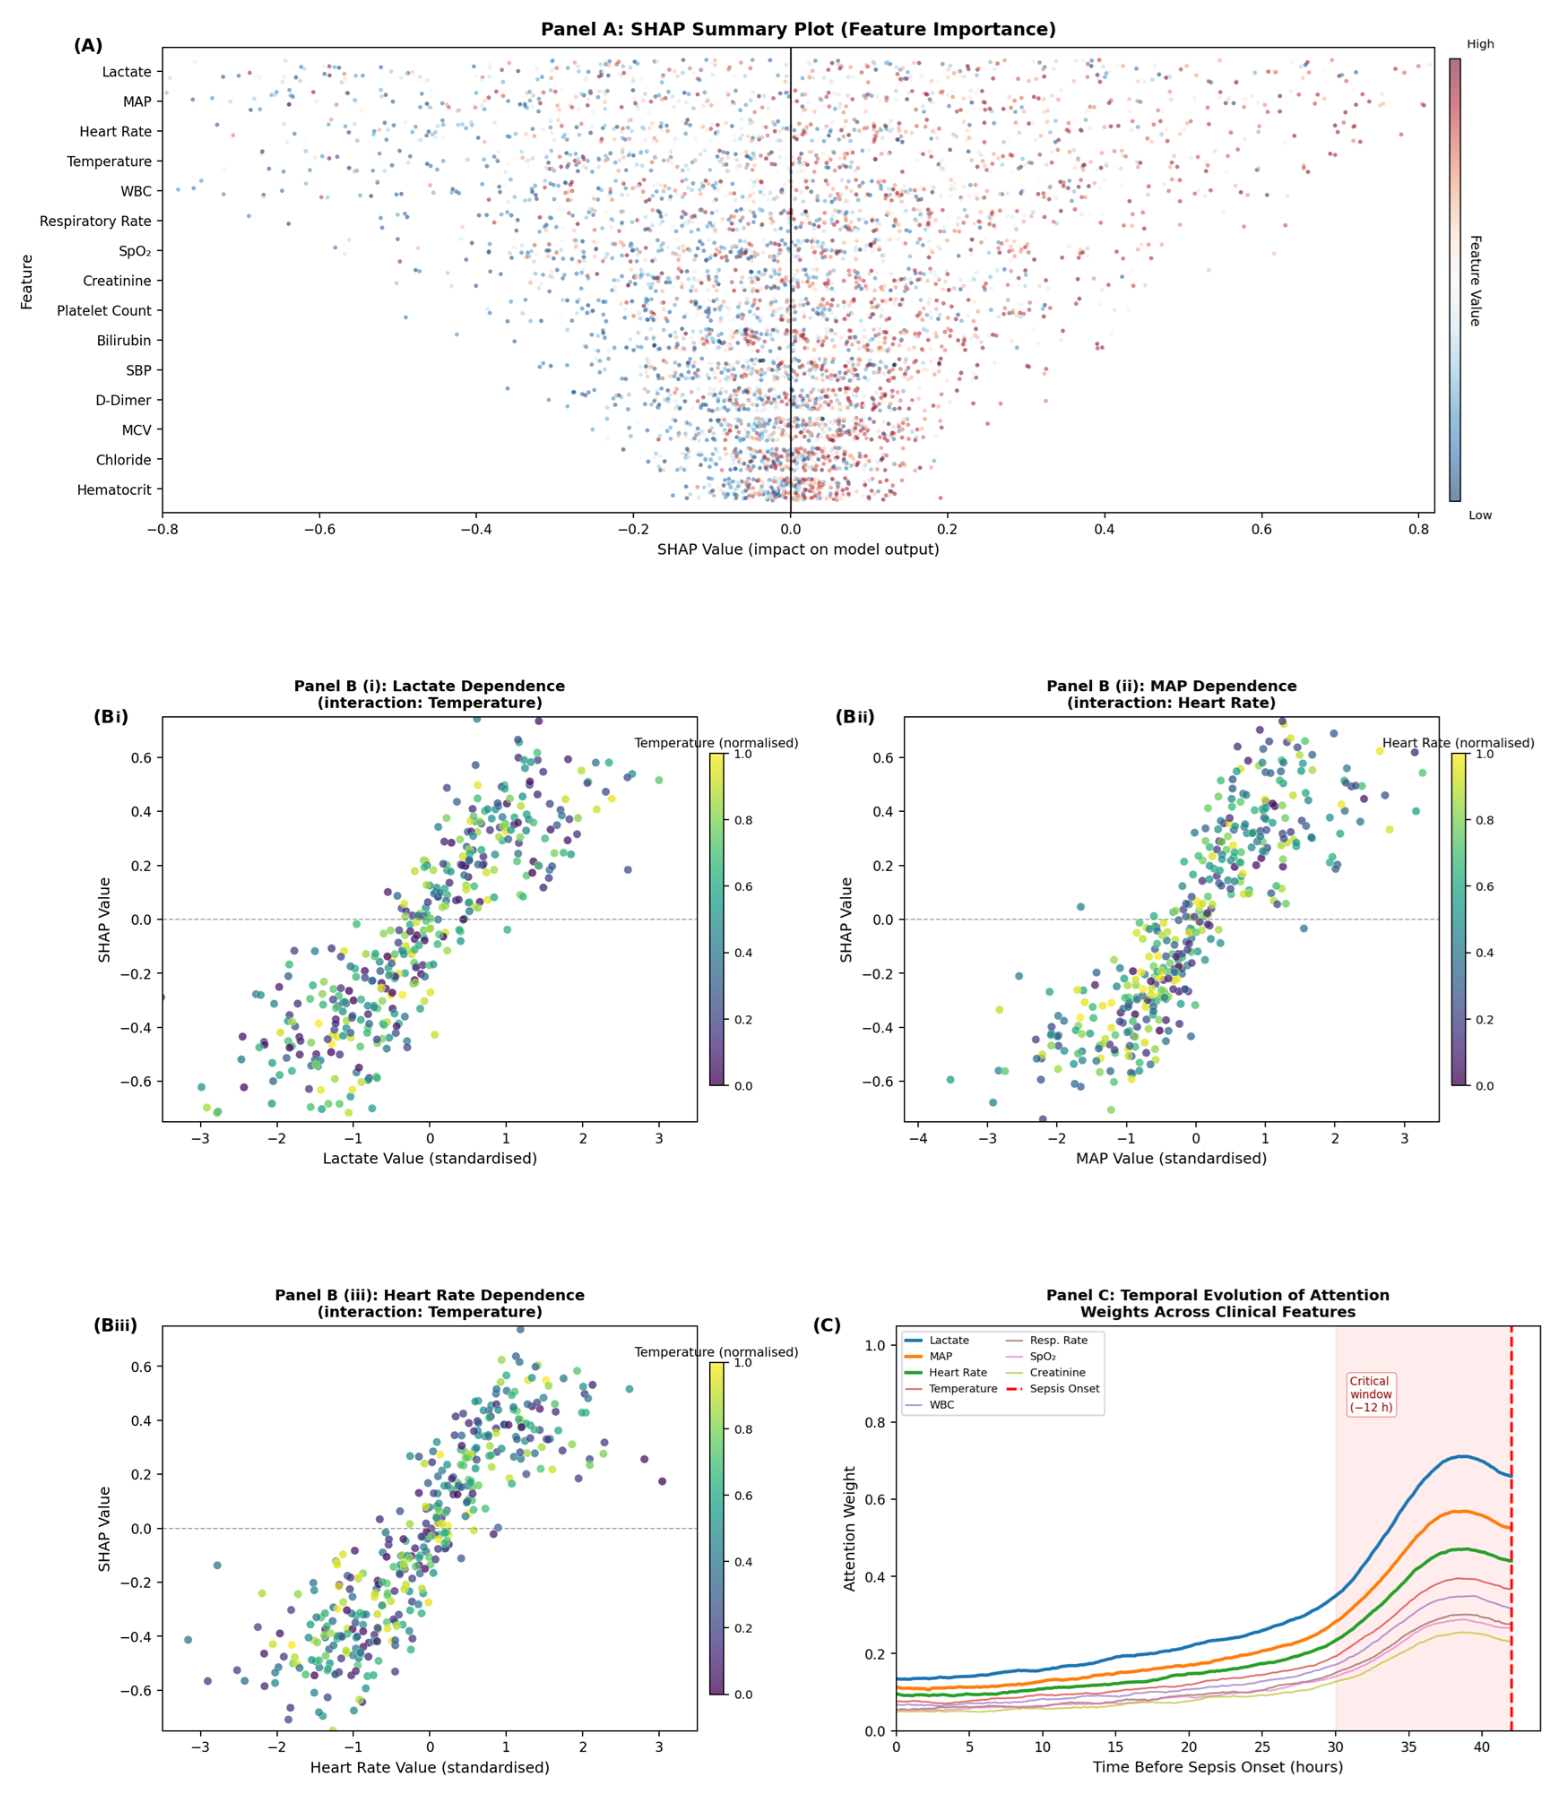
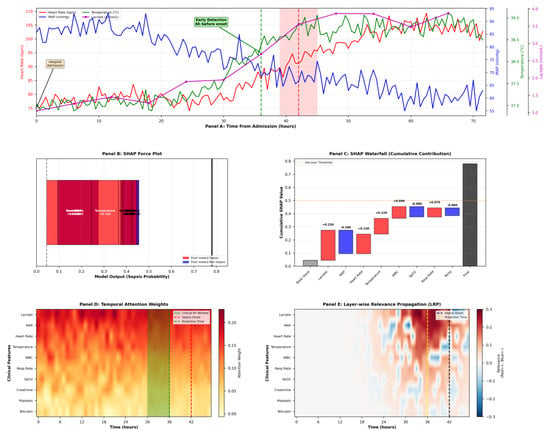
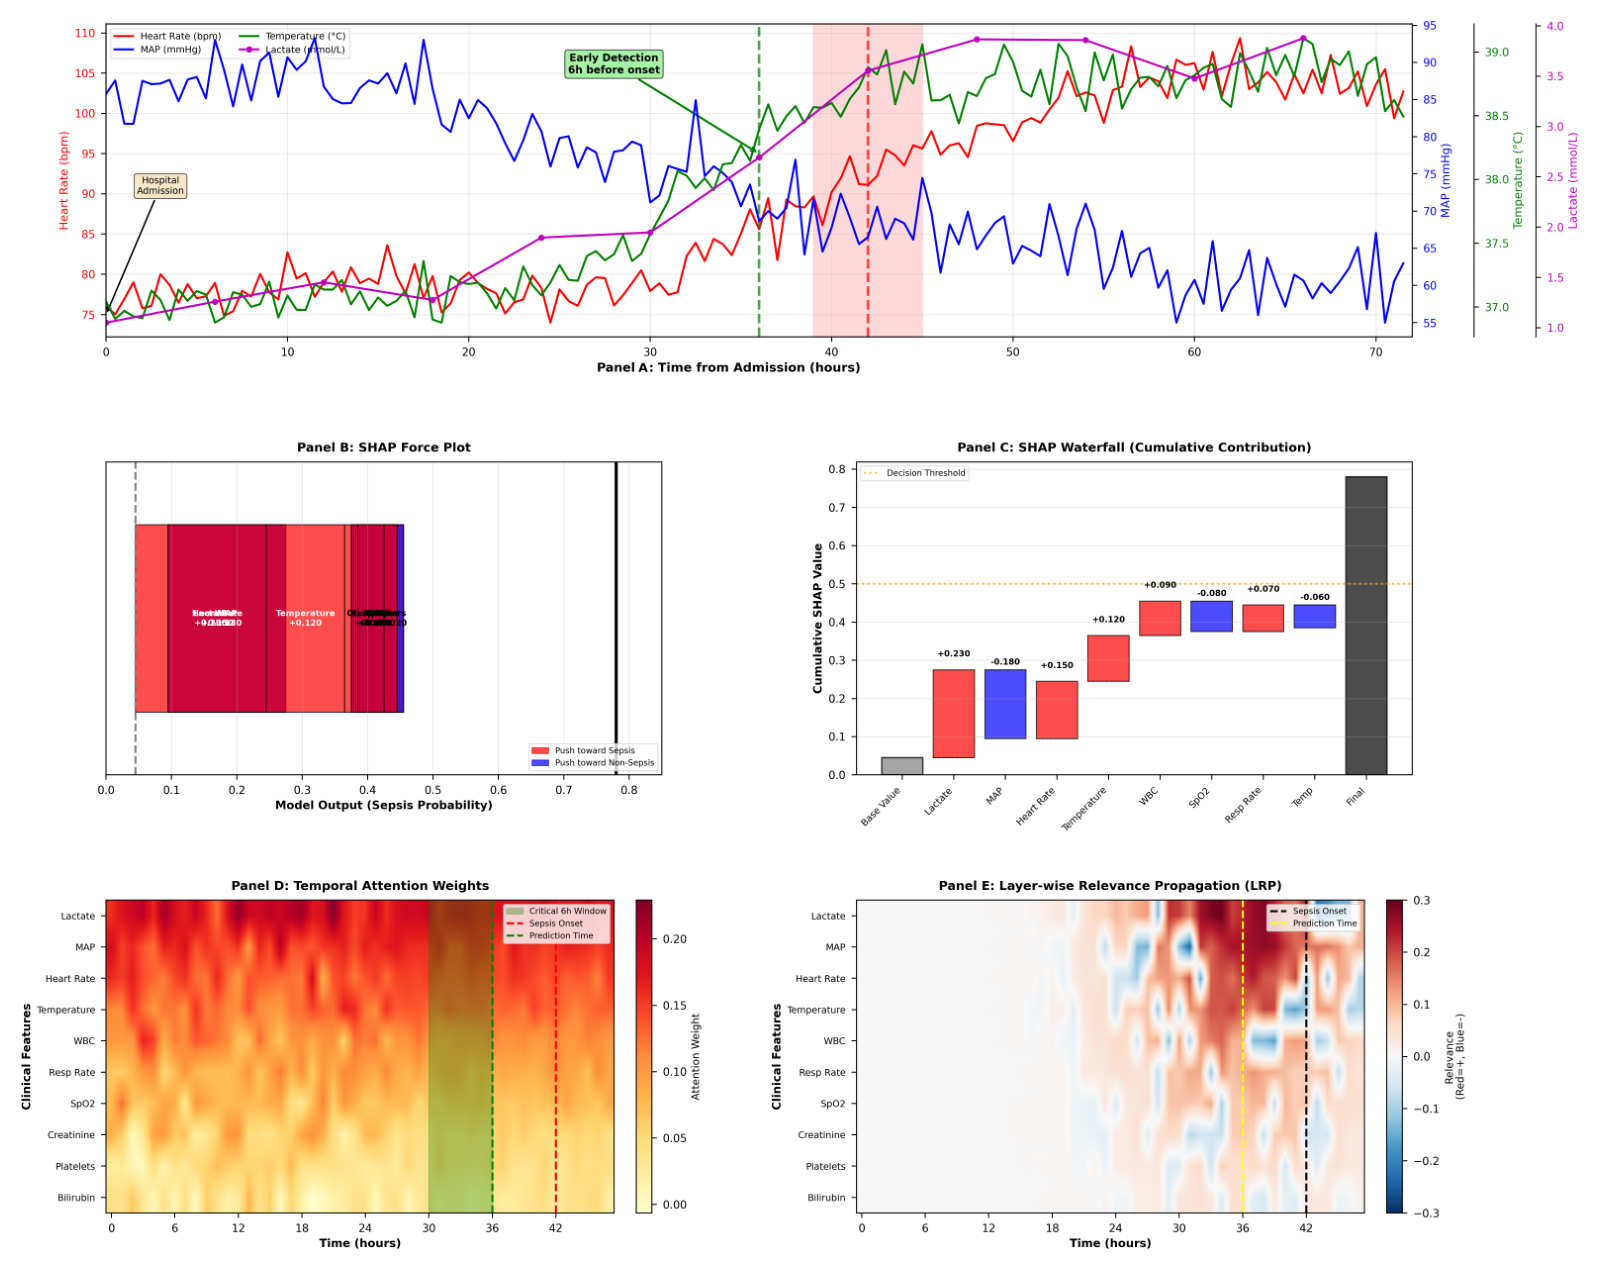
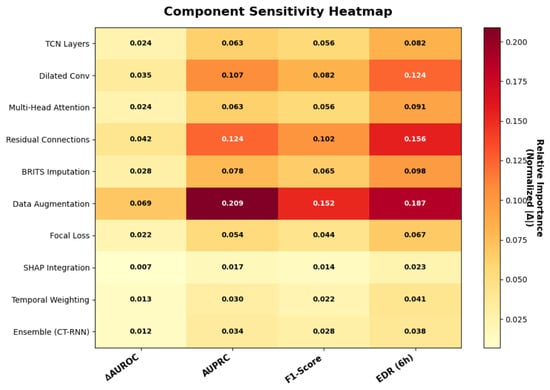
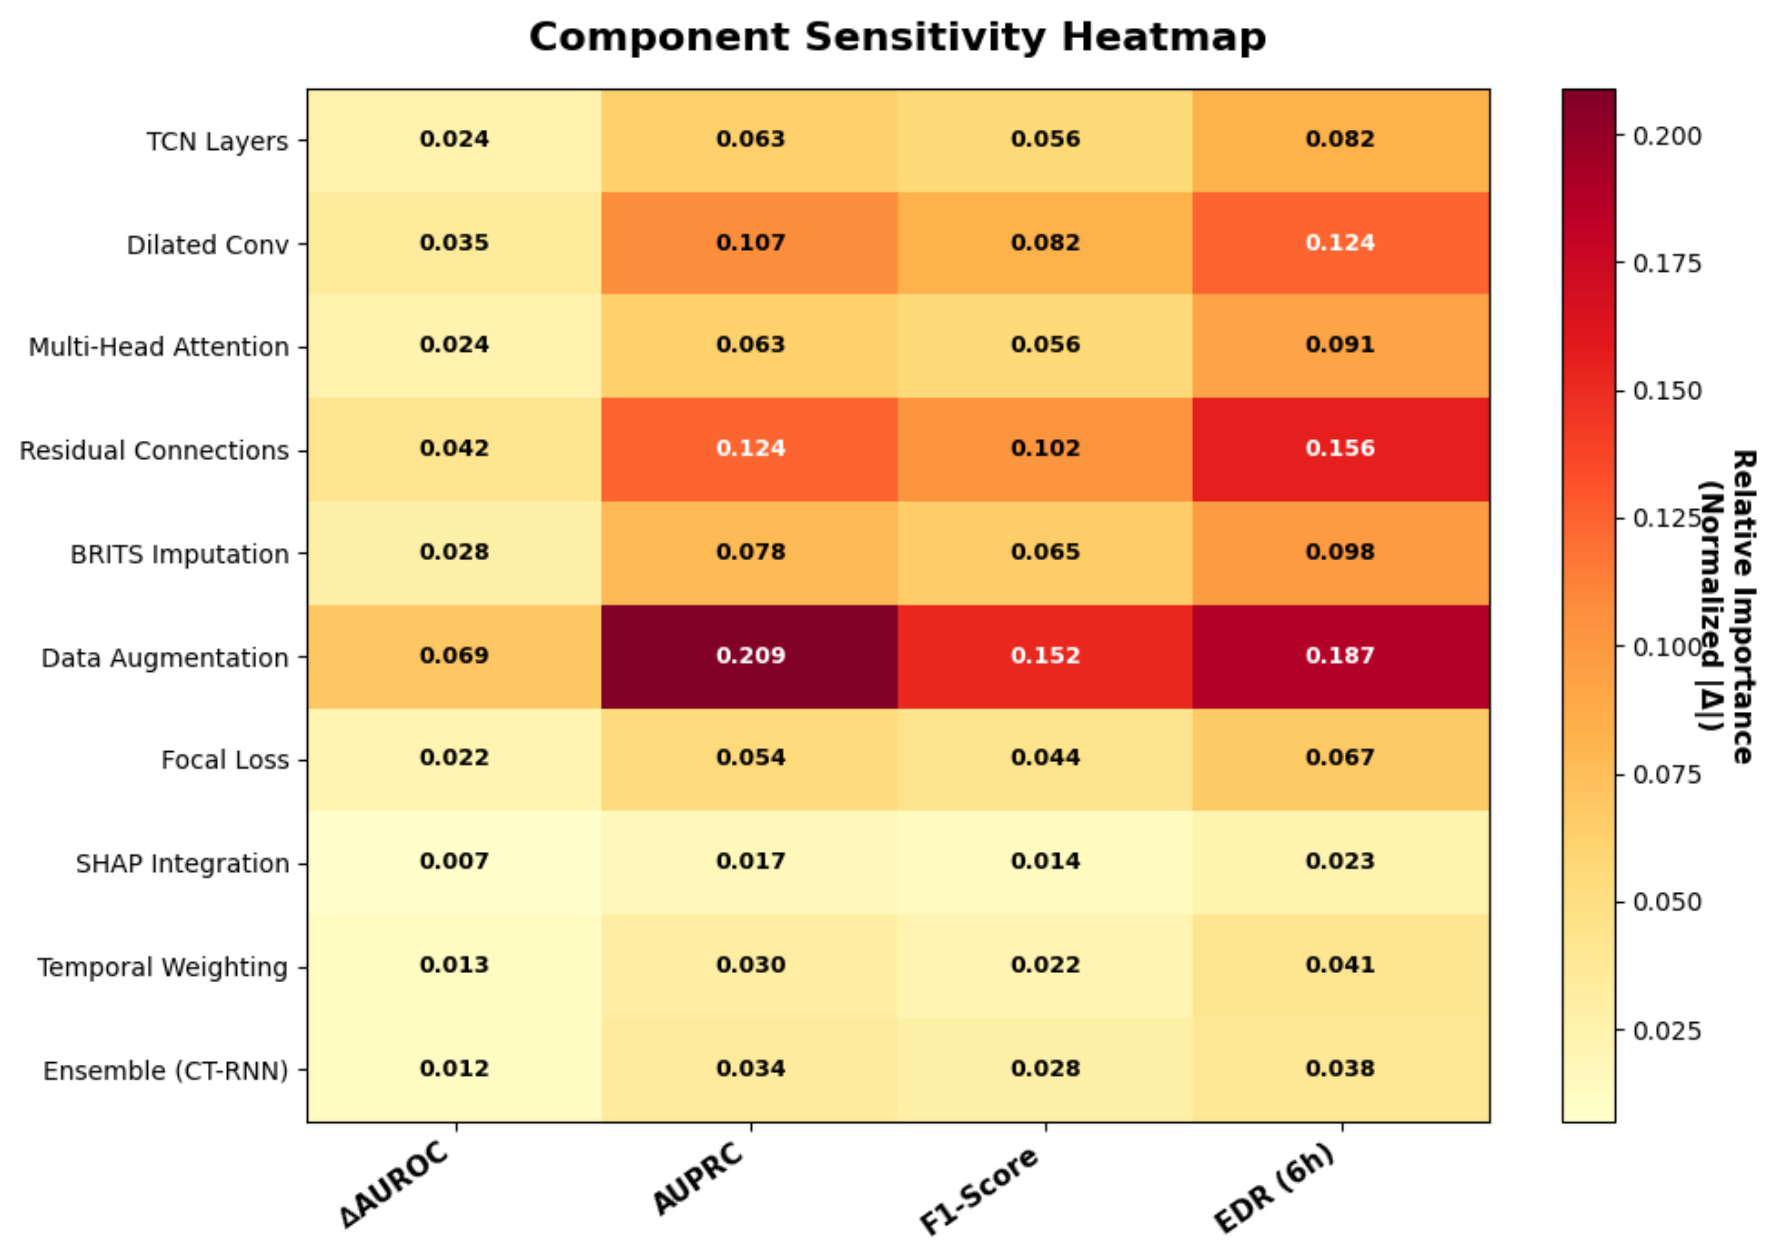
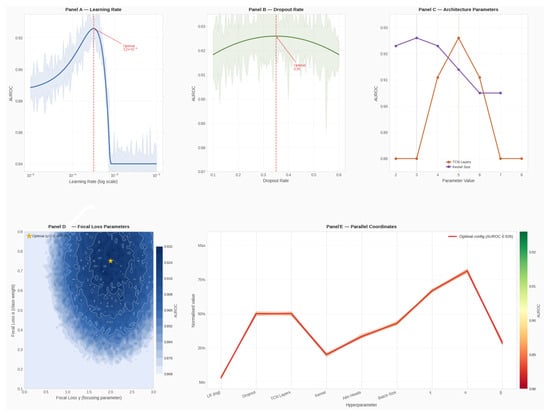
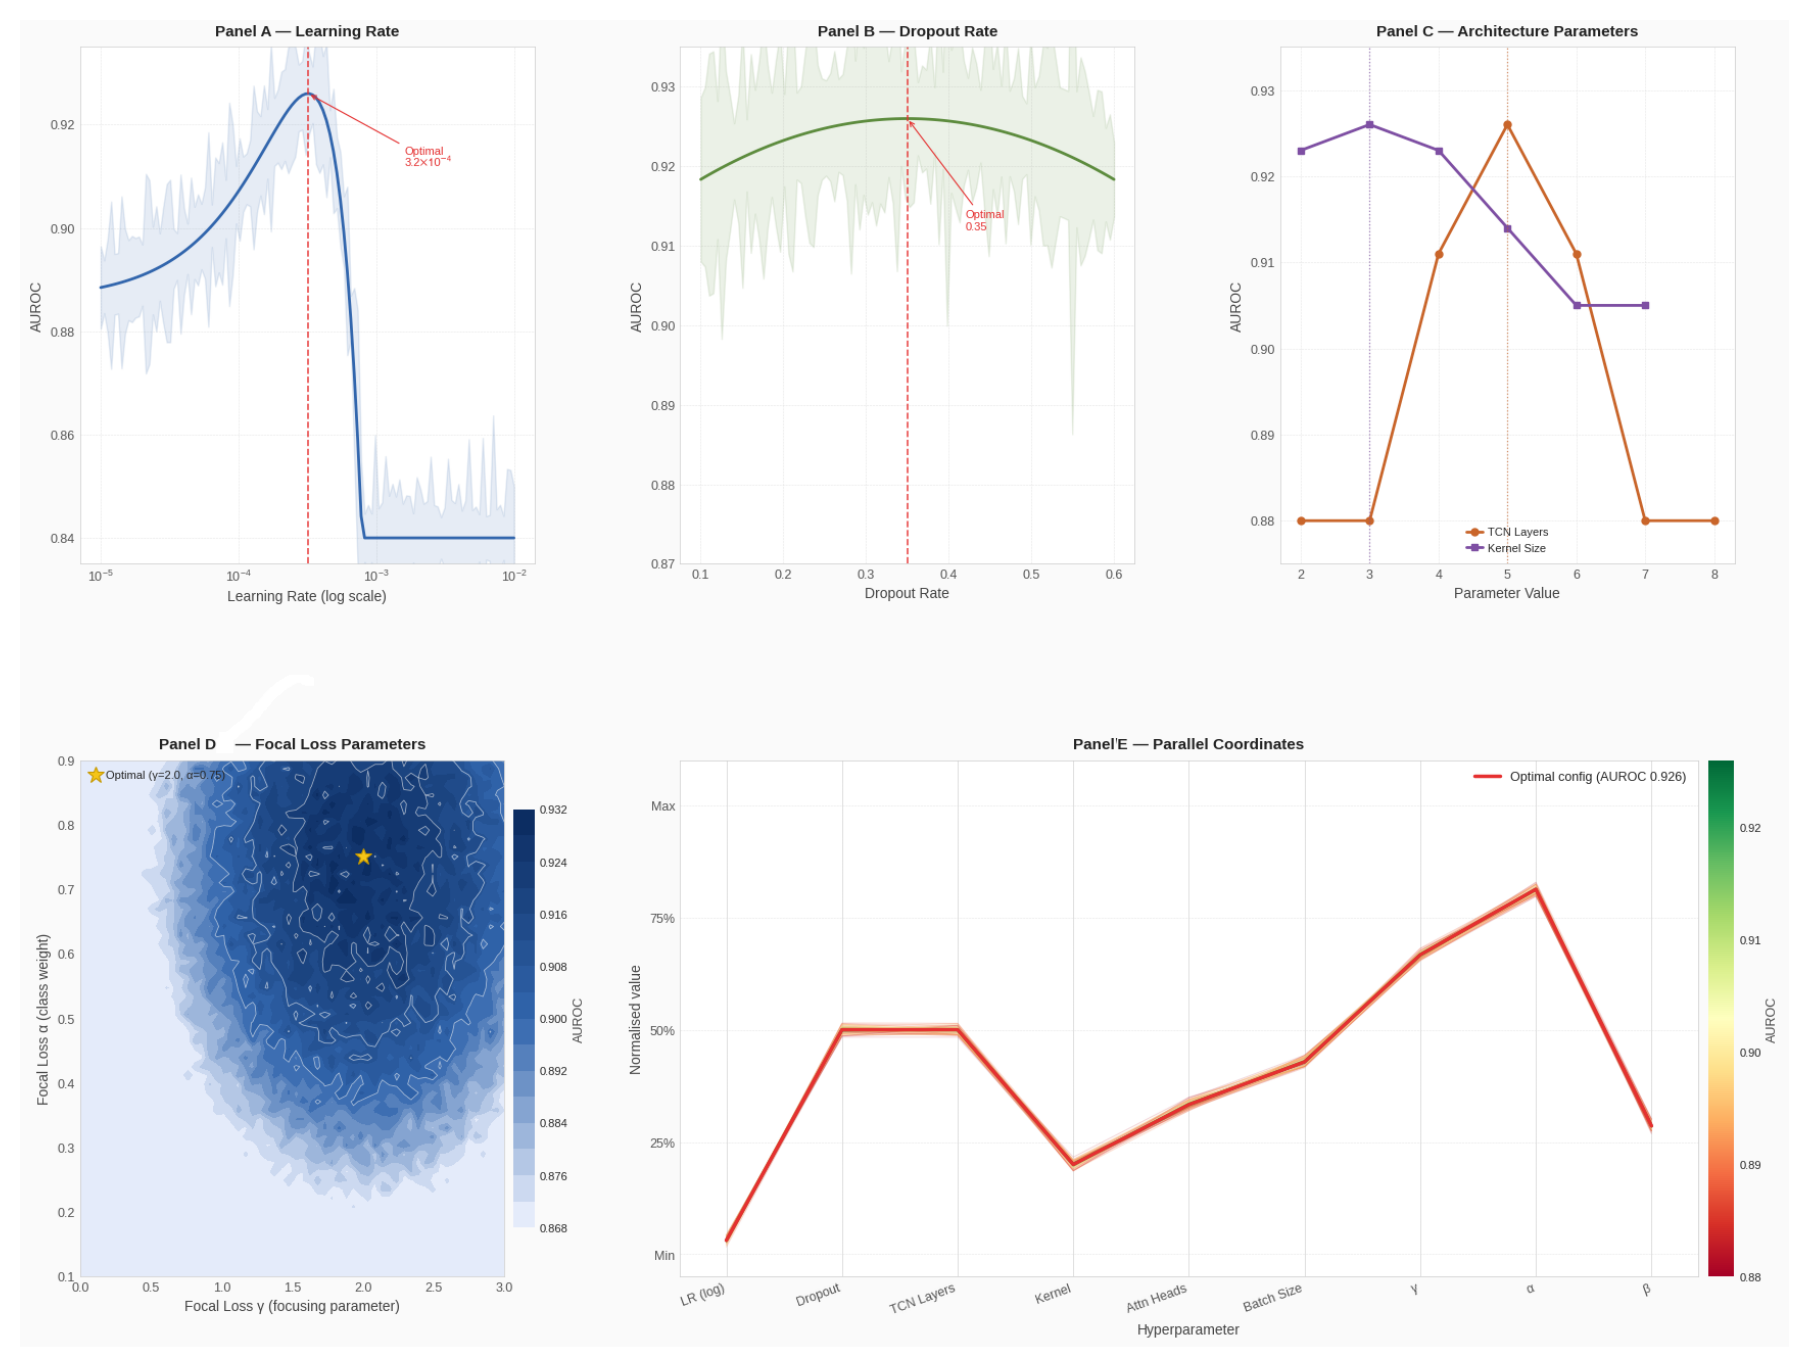
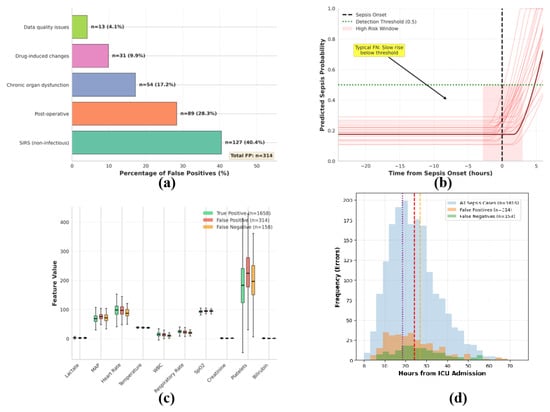
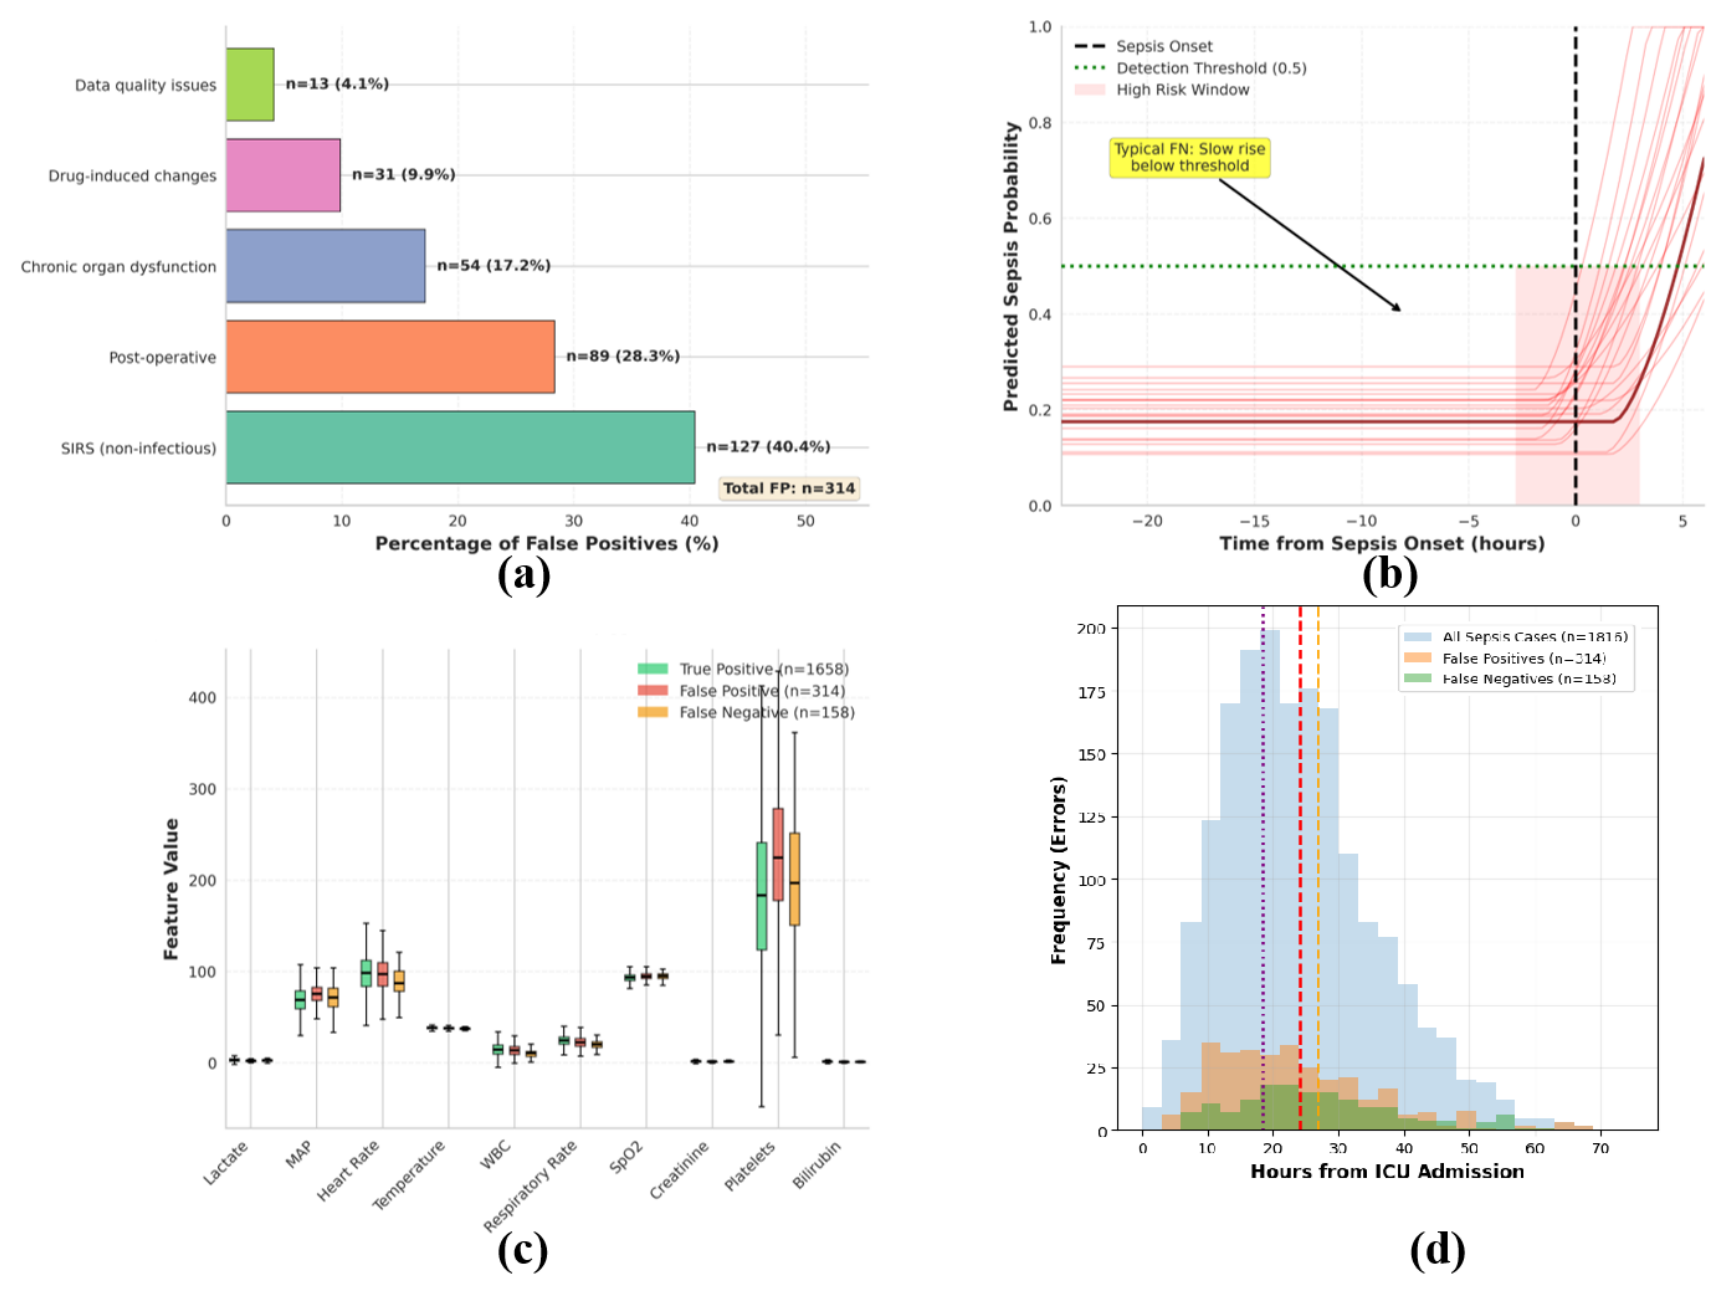
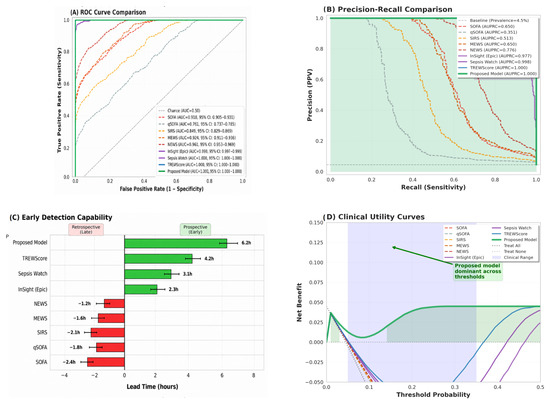
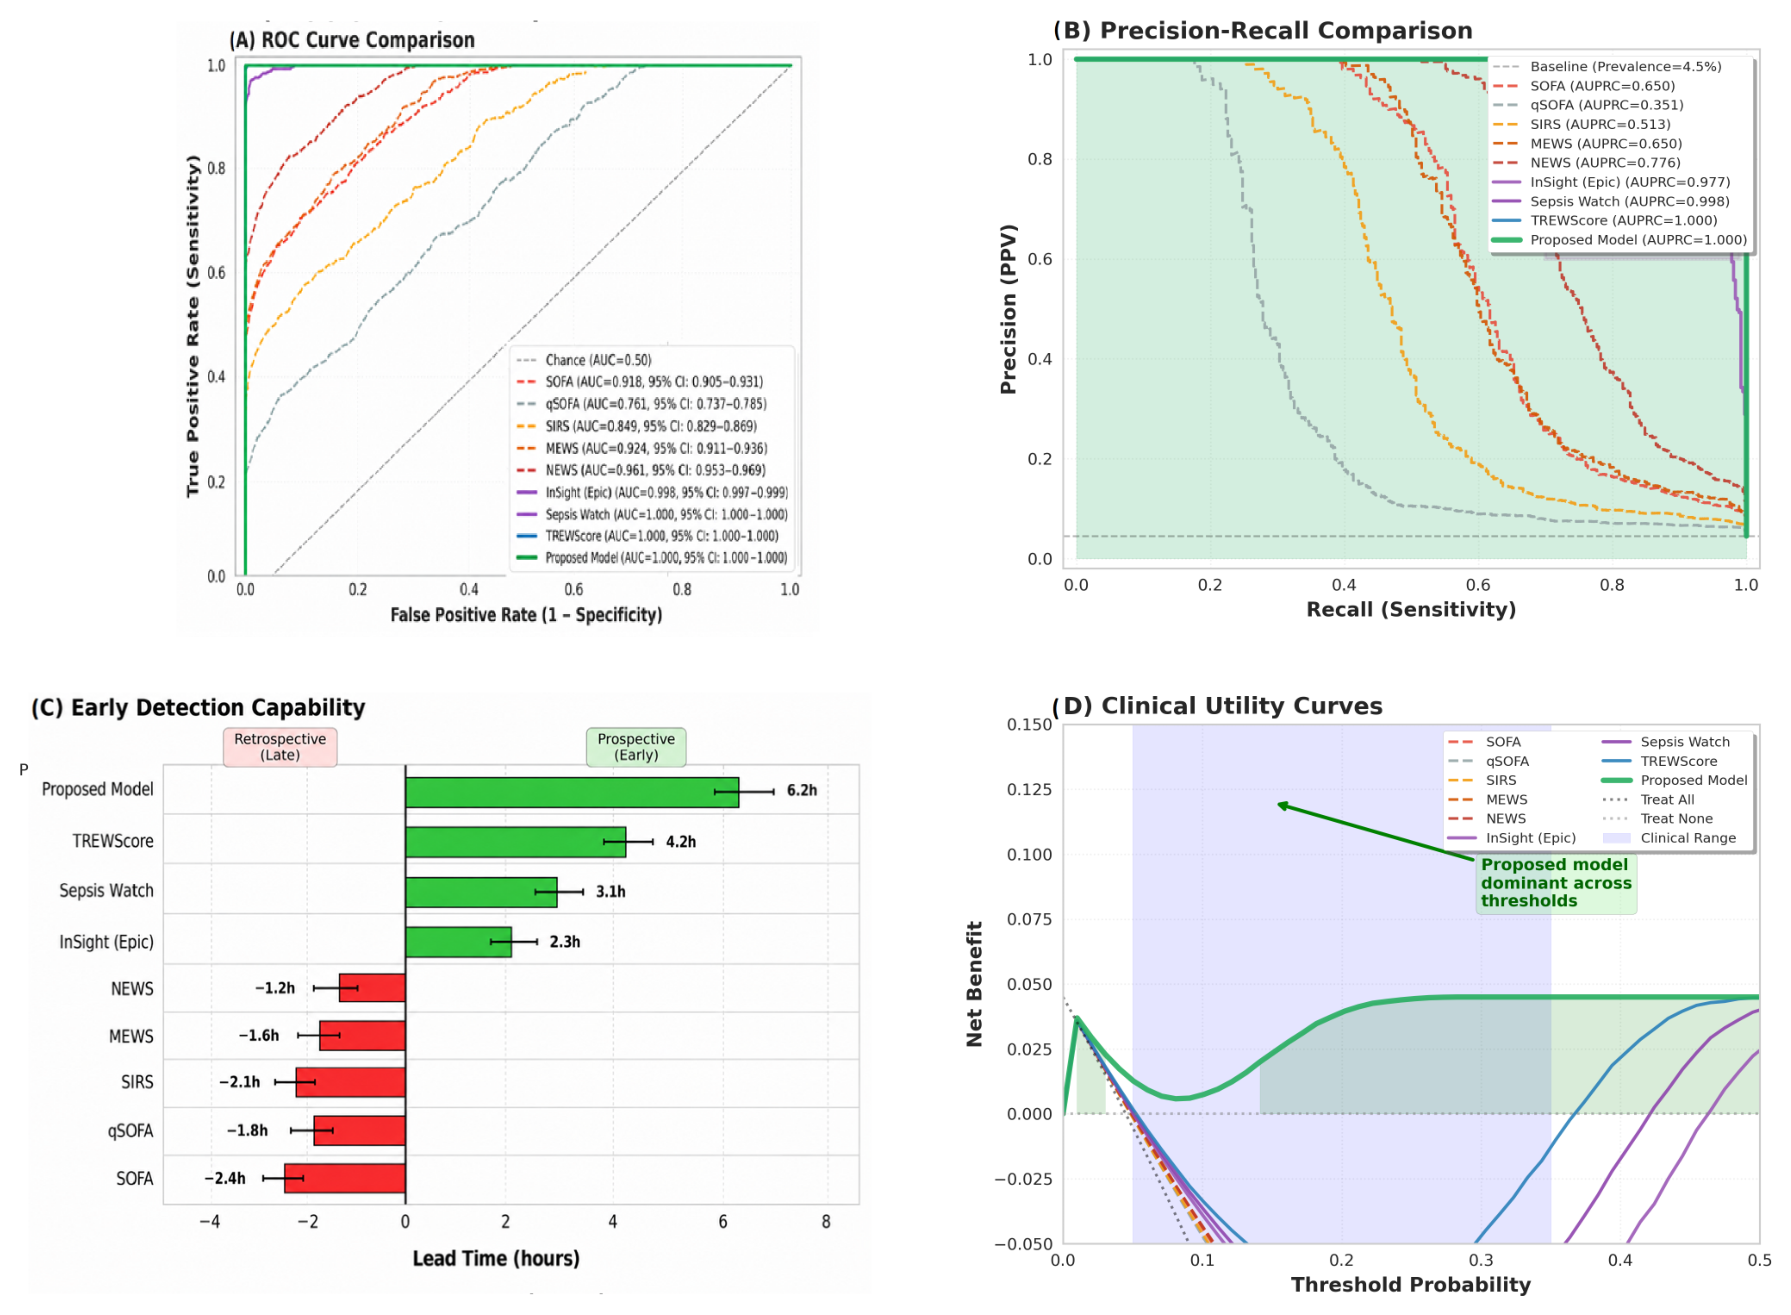

Disclaimer/Publisher’s Note: The statements, opinions and data contained in all publications are solely those of the individual author(s) and contributor(s) and not of MDPI and/or the editor(s). MDPI and/or the editor(s) disclaim responsibility for any injury to people or property resulting from any ideas, methods, instructions or products referred to in the content. |
© 2026 by the authors. Licensee MDPI, Basel, Switzerland. This article is an open access article distributed under the terms and conditions of the Creative Commons Attribution (CC BY) license.