


Abstract
This study examines how filler-specific processing and the resulting spatial organization govern the structural response and measured electrical behaviour of epoxy nanocomposites containing graphene nanoplatelets (GNP), graphene oxide (GO), or molybdenum disulfide (MoS2). Bulk specimens and spin-coated films containing 0.25–5 wt% nominal filler were prepared with 22 wt% and 8 wt% A1 amine hardener, respectively. GNP and MoS2 formulations required pulsed sonication followed by planetary mixing, whereas GO was processed by planetary mixing alone; temporary isopropanol was additionally required for the nominal 5 wt% GNP formulation. Film thickness, low-frequency impedance, diamond-ATR FTIR spectra, Raman spectra, and planar and cross-sectional Raman maps were evaluated. Films from the higher nominal GNP-loading formulation showed the clearest increase in mean thickness, consistent with concentration-dependent rheology and platelet interactions during spin coating. The impedance response was strongly contact-sensitive. Under identical embedded-contact conditions, the specimen prepared from the nominal 5 wt% GNP formulation exhibited substantially lower impedance than neat epoxy across the common frequency range, with a median |Z_GNP|/|Z_epoxy| ratio of approximately 0.16. The persistence of this difference across the common frequency interval provides a clear same-fixture electrical distinction between the two tested specimens. Because one specimen was examined per condition, this result is reported at the specimen level and is not used to assign bulk conductivity, a unique conduction mechanism, or a numerical percolation threshold. ATR-FTIR showed preservation of the epoxy fingerprint together with the oxygen-rich GO contribution, while Raman spectroscopy retained the characteristic carbon and MoS2 signatures. Raman mapping showed isolated filler-rich domains at nominal 0.25 wt% and broader, more spatially continuous domains at nominal 5 wt% for the matched GNP and GO datasets, while cross-sectional mapping confirmed subsurface filler signatures for all three systems. Together, the results establish a processing–structure–measurement framework for these three 2D-filler/epoxy systems and identify the experimental controls needed for reliable interpretation of functional response.
1. Introduction
Two-dimensional (2D) fillers offer high aspect ratio, large interfacial area, and the possibility of modifying polymer properties at comparatively low mass loading. In epoxy matrices, graphene nanoplatelets are attractive when electrical and thermal transport or multifunctional reinforcement is sought; graphene oxide provides an oxygen-functionalized surface that can improve wetting and interfacial affinity; and layered MoS2 offers semiconducting, thermal, barrier, and tribological functionality [1,2,3,4,5,6,7,8]. These advantages are not intrinsic consequences of nominal filler content alone. Dispersion, wetting, cure kinetics, viscosity evolution, platelet orientation, agglomeration, and the formation of filler-rich regions can alter the final response as strongly as the properties of the starting powder.
Processing strategy is therefore a central experimental variable. Mechanical stirring and planetary mixing are scalable and limit solvent use, but may not fully disrupt stacked platelets. Probe sonication can break agglomerates and improve exfoliation, yet excessive exposure can reduce platelet dimensions, introduce defects, heat the resin, and modify viscosity. Solvent-assisted routes can temporarily reduce viscosity and promote wetting, but solvent removal must be controlled to avoid residual porosity or composition changes. Earlier studies have shown that graphene/epoxy mechanical, electrical, thin-film, and multifunctional response depends strongly on filler loading, dispersion history, solvent-assisted processing, and platelet alignment [9,10,11,12,13,14], while GO transfer and interfacial engineering provide complementary routes for controlling epoxy nanocomposite structure and properties [15,16]. Recent studies of GNP/epoxy coatings confirm that dispersion route measurably affects morphology, abrasion resistance, dynamic-mechanical response, and thermal-mechanical behaviour [17,18]. Recent application-oriented work also reinforces the broader link between nanofiller structure, processing conditions, conductive-network development, and sensor performance [19].
The optimum processing route also depends on the intended function. Graphitic fillers are commonly pursued for conductive, dielectric, electromagnetic-shielding, strain-sensing, or thermally functional composites, whereas GO is often selected where interfacial chemistry, coating integrity, or barrier properties are important. MoS2/epoxy systems are increasingly investigated for tribological, corrosion-protective, thermal, and piezoresistive applications; recent coating work demonstrates that the filler can modify tribocorrosion performance when its distribution and interface are appropriately controlled [20]. Across these applications, a processing method that maximizes macroscopic dispersion can still produce local heterogeneity, and that heterogeneity becomes especially important in thin films where small changes in viscosity, deposition delay, or platelet orientation generate measurable thickness and spatial gradients.
Electrical characterization introduces an additional measurement problem. Highly resistive epoxy specimens can be dominated by non-ohmic or poorly reproducible electrode contacts. A measured decrease in impedance may arise from increased true contact area, a conductive interlayer, or a surface-current path rather than from the intended bulk conductive network. Contact geometry is therefore not a peripheral experimental detail: it determines which electrical conclusions can legitimately be drawn and whether an apparent filler effect is intrinsic to the composite.
The experimental campaign also generated a separate study devoted exclusively to broadband dielectric-permittivity extraction by coaxial transmission/reflection measurements and to the influence of moisture and metrological limitations [21]. The present paper addresses a different question and contains none of the coaxial permittivity curves, effective-medium analysis, or moisture modelling reported there. Here, specimen preparation, film formation, contact-sensitive low-frequency impedance, ATR-FTIR, Raman spectroscopy, and planar/depth-resolved Raman mapping are combined to establish how the processing route is reflected in the observed composite structure.
The specific objective is to compare three chemically and electrically distinct 2D fillers within the same epoxy platform while retaining the filler-specific processing required to produce usable specimens. The novelty lies in linking (i) the different dispersion demands of GNP, GO, and MoS2, (ii) film-thickness and spatial Raman evidence of the resulting microstructural heterogeneity, and (iii) a systematic fixture-screening study showing how electrode contact controls the apparent low-frequency response. Unlike studies that infer performance directly from nominal loading, the present work identifies which processing and measurement controls must be satisfied before conductivity, dielectric, sensing, or coating performance can be interpreted. Within this framework, the embedded-contact GNP/neat-epoxy comparison provides a controlled specimen-level demonstration of electrical contrast under identical fixture conditions, while the concentration series is not used to infer a numerical percolation threshold.
2. Materials and Methods
2.1. Materials and Composite Series
A commercial thermosetting epoxy resin was combined separately with GNP, GO, or MoS2. The available experimental records identify GO and MoS2 as commercial powders used as received, but they do not retain traceable supplier names, catalogue numbers, purity grades, particle-size distributions, GO oxidation degree, or MoS2 grade. These details are therefore reported as unavailable rather than reconstructed retrospectively. GNP were produced in-house from Asbury® intercalated graphite (Asbury Graphite Mills, Inc., Asbury, NJ, USA) by microwave expansion, as described below. For each filler, nominal loadings of 0.25, 0.5, 1, 2, and 5 wt% were prepared together with neat epoxy. Both self-supporting bulk specimens and coatings on microscope slides were produced. Unless otherwise stated, filler contents are reported as nominal formulation mass fractions.
The curing agent, denoted A1, was a laboratory-prepared tetraethylenepentamine-based hardener modified with formaldehyde to increase nucleophilic reactivity. The archived protocol specifies 22 wt% A1 for self-supporting bulk specimens and 8 wt% for thin-film formulations; the lower film fraction was selected to retain sufficient coatability before viscosity increased. The exact stoichiometric conversion and degree of cure were not independently verified by DSC, glass-transition measurements, or spectroscopic conversion analysis. Consequently, the two specimen families are treated as intentionally different formulations, and bulk impedance and thin-film spectroscopic results are not interpreted as a geometry-only comparison. The documented starting-material characteristics and the traceability status of the archived record are summarized in Table 1.
Table 1.
Composite series, specimen formulations, and filler-specific processing conditions.
2.2. GNP Production
GNP were produced by exposing Asbury® intercalated graphite to 800 W microwave irradiation for a few seconds. Rapid vaporization of the intercalating species expanded the graphite into worm-like particles. The preparation record reports lateral dimensions of approximately 2–10 µm, thicknesses corresponding to roughly 4–11 stacked graphitic layers, and a residual intercalant fraction of about 1%. These values characterize the in-house GNP precursor population used in the campaign; a complete post-processing particle-size distribution was not measured. The expanded material was subsequently incorporated into the epoxy and further separated during the sonication stage.
2.3. Degassing, Filler Dispersion and Curing
The liquid epoxy was first degassed in a THINKY Mixer ARV-310 planetary centrifugal vacuum mixer (THINKY Corporation, Tokyo, Japan). The program consisted of 500 rpm for 3 min at atmospheric pressure, 1000 rpm for 3 min at 0.2 kPa, and 2000 rpm for 3 min at 0.2 kPa. Rotation and revolution of the inclined container generated strong shear and rapid three-dimensional flow, while reduced pressure promoted removal of entrained air. The progressive sequence was used to remove larger bubbles before the more intensive vacuum-mixing stages.
GNP and MoS2 formulations were probe-sonicated for 30 min at 44% instrument amplitude using alternating 1 s pulses and 1 s pauses to limit overheating [22,23]. GO formulations were processed without sonication because planetary mixing was sufficient to obtain macroscopic dispersion in the employed resin. For the nominal 5 wt% GNP formulation, isopropanol was used as a temporary processing aid and was removed at 80 °C until consecutive mass measurements were unchanged. Plastic tools were used during transfer to reduce the risk of metallic contamination.
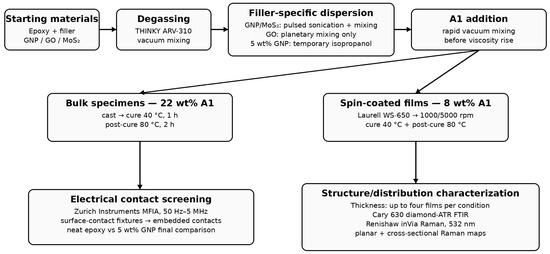
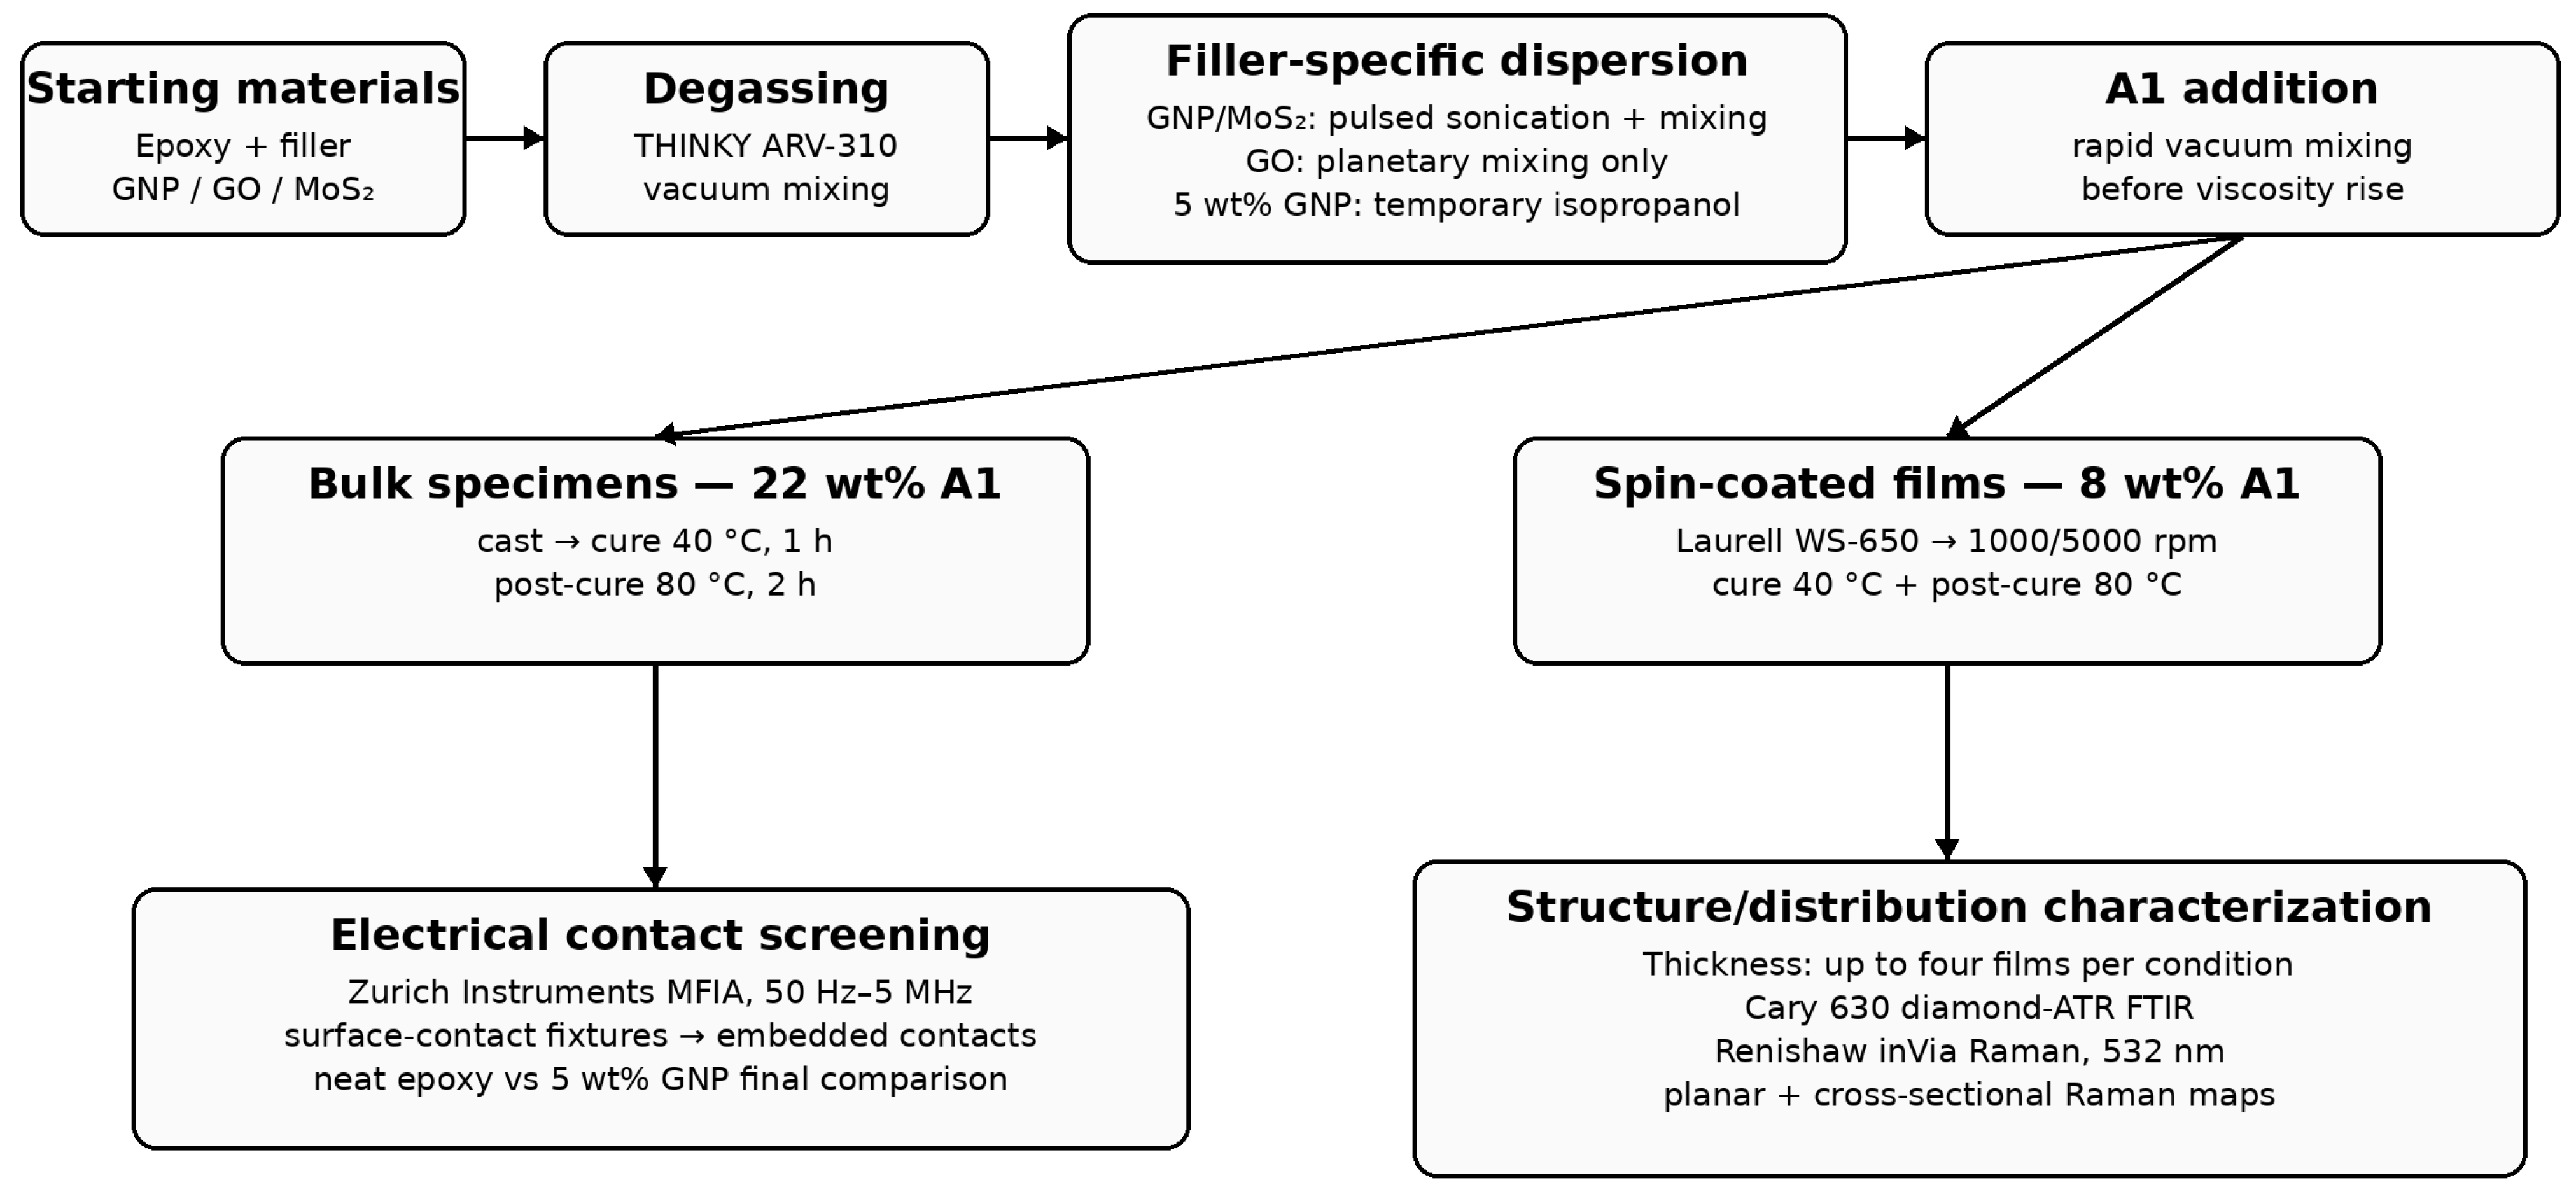
After filler addition, the mixtures were processed at 2000 rpm for 2 min at atmospheric pressure, 1000 rpm for 6 min at 0.2 kPa, and 2000 rpm for 8 min at 0.2 kPa. A1 was then incorporated rapidly to minimize spatial differences in the onset of crosslinking. Four 1 min mixing steps were used at 200, 500, 1000, and 2000 rpm; the last two were performed at 30 kPa to reduce bubble content without promoting loss of the curing agent. Specimens were held at 40 °C for 1 h, allowed to rest for at least 20 h, and then subjected to a 2 h post-cure step at 80 °C. MoS2 formulations were allowed to rest for approximately 30 min before the 40 °C treatment because shorter waiting times produced visibly uncovered regions in thin films. This schedule is reported as the experimental curing protocol; in the absence of DSC/Tg measurements, complete conversion is not claimed. The full preparation and characterization sequence is summarized in Scheme 1, and filler-specific conditions are listed in Table 2.
Scheme 1.
Experimental workflow and filler-specific processing route.
Table 2.
Documented starting-material characteristics relevant to processing and interpretation. Missing supplier/grade information is explicitly identified because it was not preserved in the surviving experimental record.
2.4. Thin-Film Fabrication and Thickness Measurement
Approximately 0.250 g of formulation was deposited on 15 mm × 15 mm microscope slides (nominal thickness 0.13–0.17 mm) using a Laurell WS-650 spin coater (Laurell Technologies Corporation, Lansdale, PA, USA). The sequence consisted of 200 rpm for 2 s, 500 rpm for 2 s, 1000 rpm for 2 s, followed by 60 s at either 1000 or 5000 rpm. No permanent solvent was used, so film formation was governed mainly by centrifugal flow, the evolving viscosity of the curing formulation, and the final spin step. GNP formulations were passed through a satin cloth before deposition to remove visibly unexpanded residues.
Coating thickness was determined hierarchically. For each film, five gauge measurements were taken (four corners and the centre) with 0.001 mm instrumental resolution, and the measured slide thickness (nominally 0.15 ± 0.04 mm) was subtracted. For a given filler/loading/spin-speed condition, the plotted value was obtained from the means of the independently prepared films available for that condition (maximum four films in the original campaign). The number of available films was condition-dependent. The semi-range bars therefore visualize the observed spread of the available film means for each condition; they are not used to compare variability among conditions or for inferential statistics. Interpretation focuses on the mean-thickness trends and their processing context.
2.5. Low-Frequency Impedance Contact Screening
Bulk specimens were screened with a Zurich Instruments MFIA impedance analyzer (Zurich Instruments AG, Zurich, Switzerland) over approximately 50 Hz to 5 MHz. Four-terminal and two-terminal arrangements, metallic plate clamps, manufacturer templates, retractable gold pins, copper and carbon tapes, carbon adhesive, and tin-assisted contacts were tested. Short–open or short–open–load calibration was used as appropriate. Five consecutive acquisitions were averaged for each displayed trace; these repeats describe short-term instrumental variability and are not independent specimen replicates.
Most surface-contact arrangements produced open-circuit-like behaviour, very high impedance, or low-frequency features that changed with fixture geometry. In the final proof-of-principle configuration, two holes separated by approximately 10 mm were drilled into selected specimens, and gold pins were inserted and fixed with tin. This configuration forced current injection into the specimen volume. It was applied only to neat epoxy and to the specimen prepared from the nominal 5 wt% GNP formulation. Consecutive acquisitions establish short-term instrumental repeatability within each specimen. These data therefore quantify contact sensitivity and document a controlled same-fixture specimen-level impedance contrast. Because independent specimen replication and a full concentration series were not part of this fixture-screening experiment, the result is not converted to bulk conductivity or used to determine a percolation threshold. Detailed fixture photographs and the initial GO screening are provided in the following subsection.
2.6. Detailed Impedance Fixture Screening
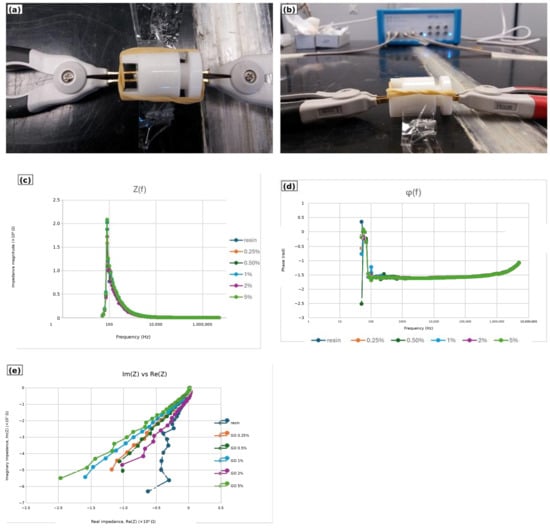
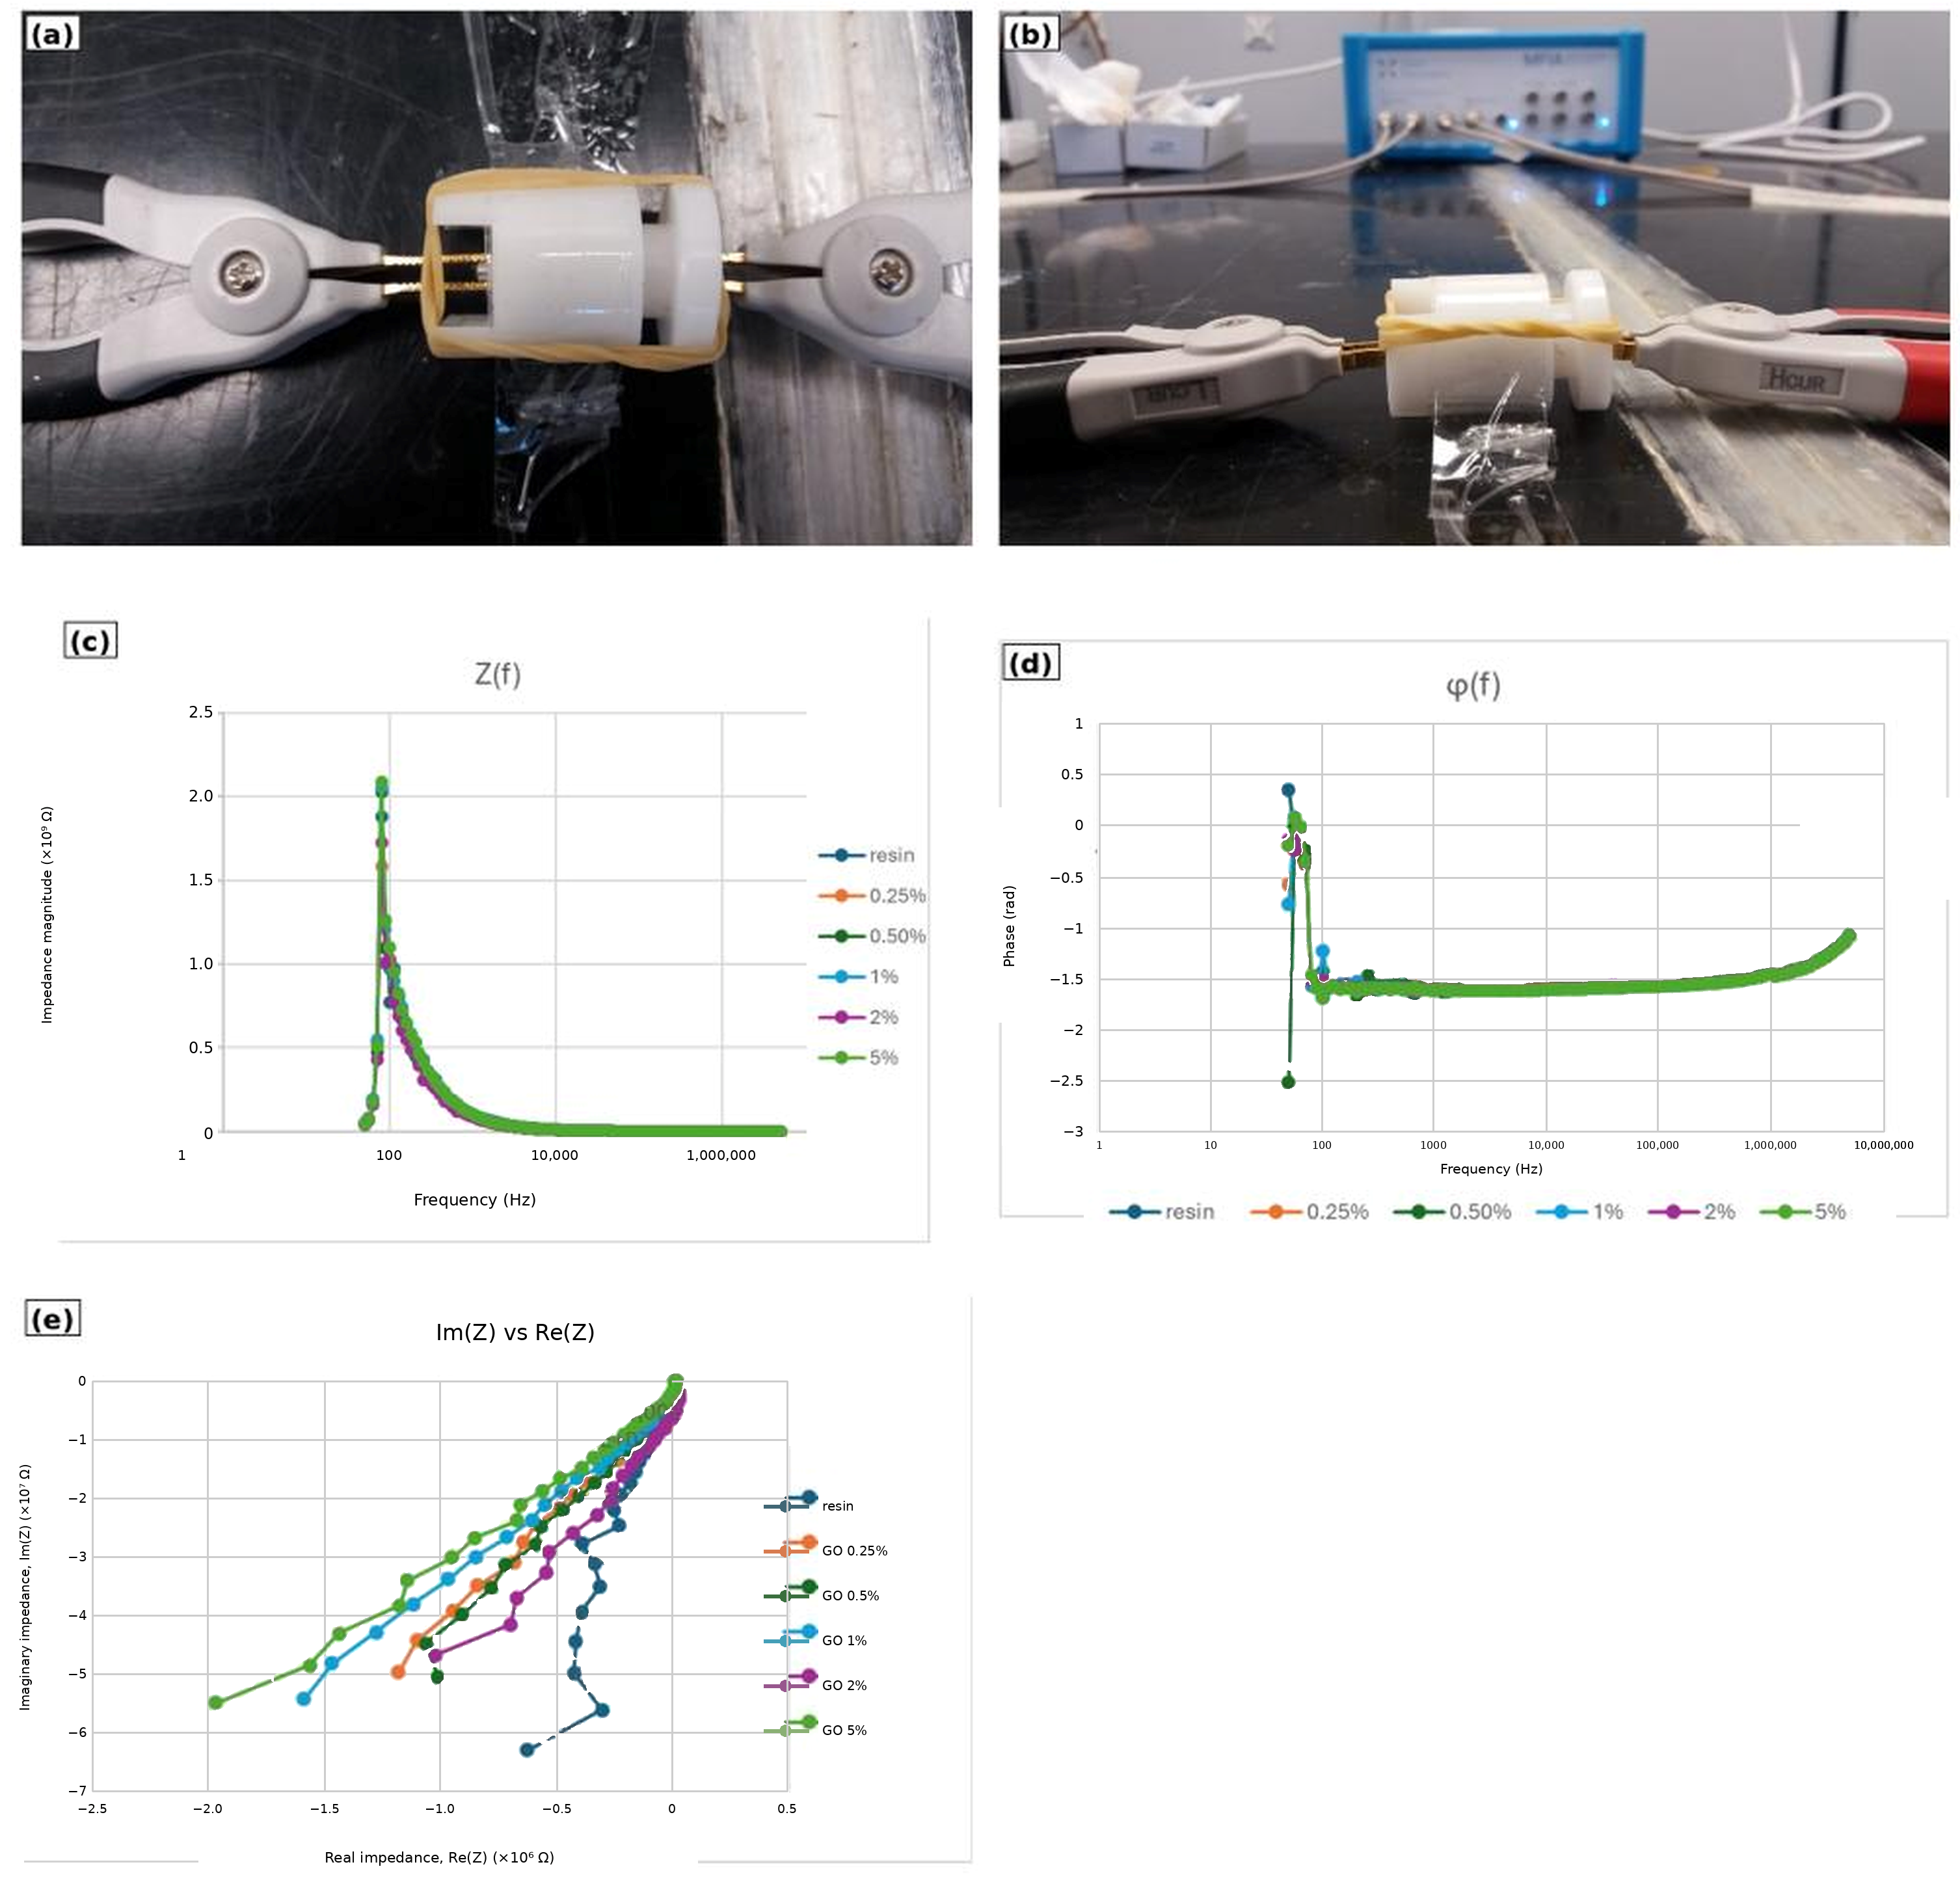
The first fixture used a two-piece Teflon cylinder and aluminum plate contacts. A 4-terminal short–open calibration was attempted over 50 Hz–5 MHz. The open reference was represented by a dielectric disk of unknown permittivity. The resulting GO-series impedance magnitude, phase, and Nyquist traces were highly uncertain and could yield non-physical negative fitted components. These data, reported in Figure 1, are retained here to document why the fixture was abandoned, not as quantitative material properties.
Figure 1.
Initial plate-contact arrangement and GO-series screening. (a,b) Fixture photographs; (c) impedance magnitude; (d) phase; (e) Nyquist representation. The response was dominated by calibration and contact limitations.
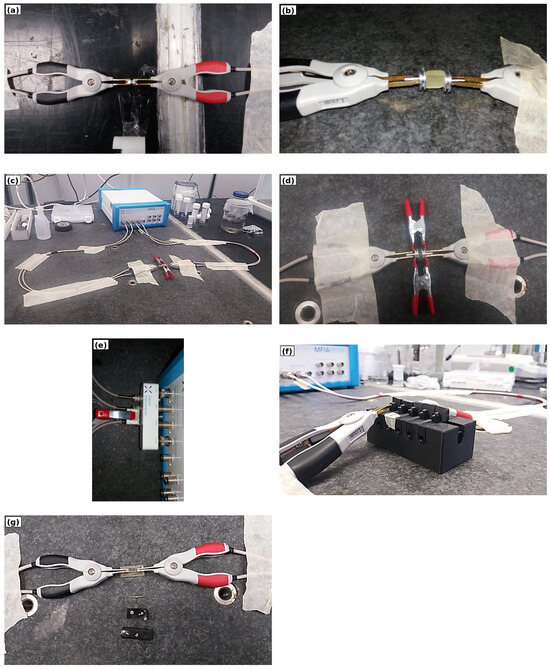
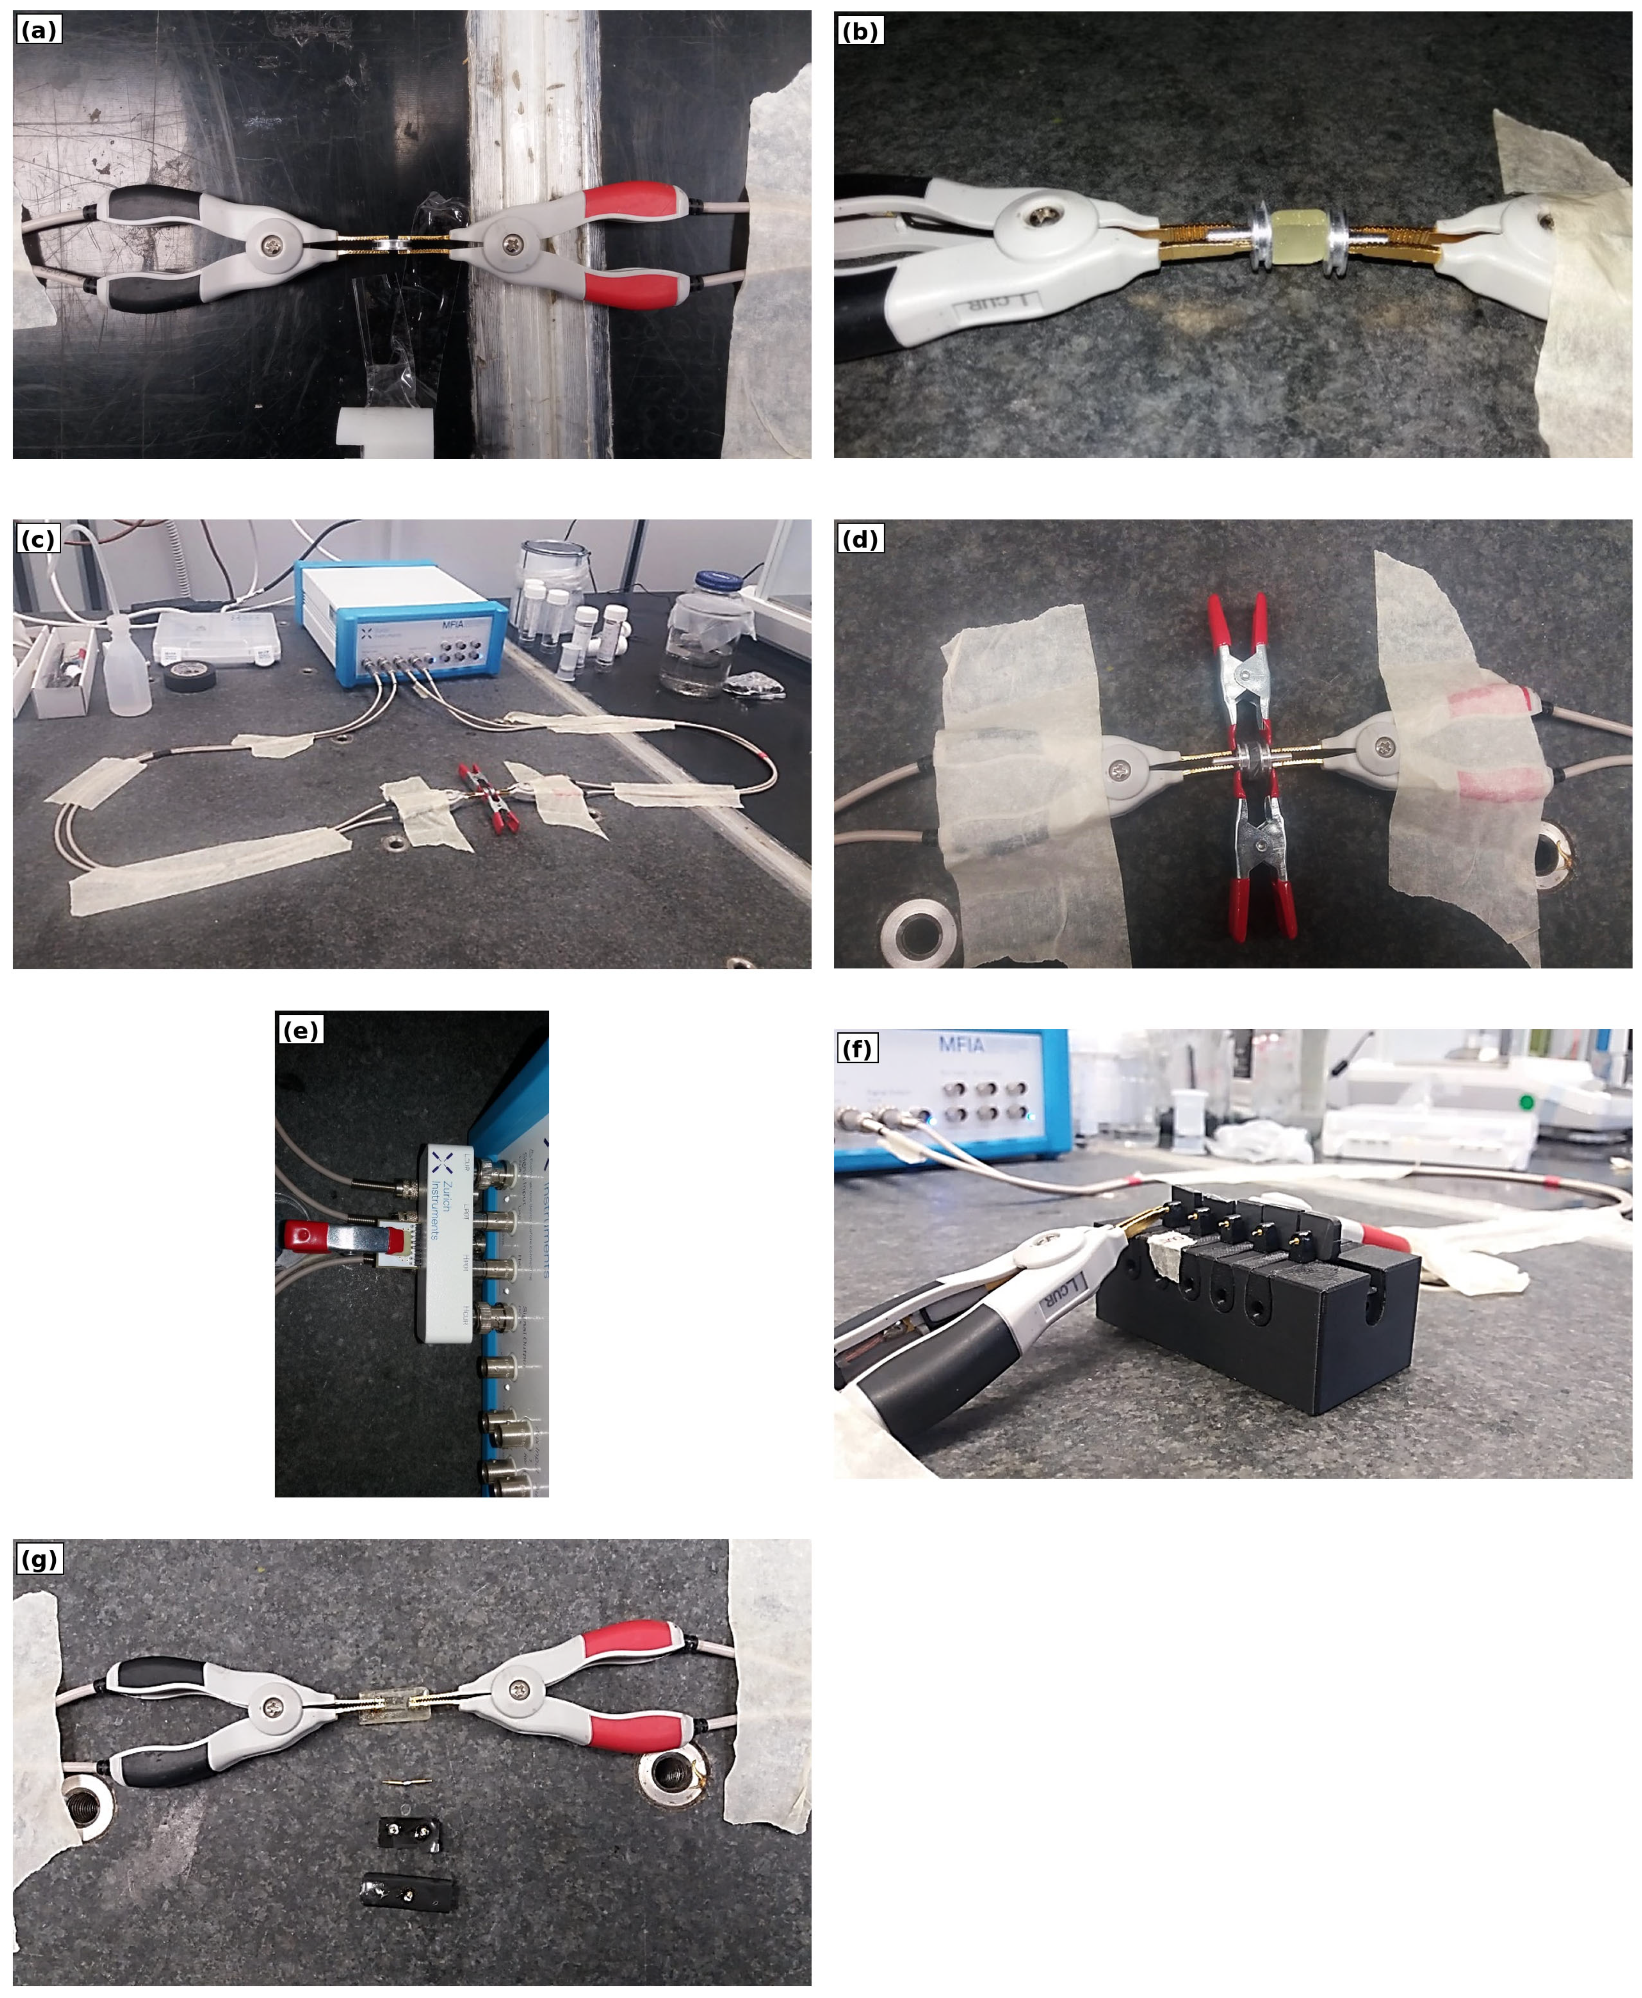
Subsequent configurations removed the Teflon body, changed from four-terminal to two-terminal measurement, used different plate separations and specimen orientations, employed manufacturer templates, and introduced retractable gold pins. The photographs in Figure 2 document these configurations. Setups 4 and 7 were excluded from the original analysis; numbering is retained only to preserve the laboratory record.
Figure 2.
Alternative low-frequency impedance fixtures examined during contact optimization. (a) Direct clamp-to-specimen configuration using opposing clips; (b) short-path plate/contact arrangement with the specimen held between opposing metallic contacts; (c) overview of the MFIA test bench and alternative wired fixture arrangements used during screening; (d) modified direct-clamp geometry used to vary contact pressure and current path; (e) manufacturer impedance calibration/test template connected to the analyser; (f) retractable gold-point contact holder for localized surface contact; and (g) drilled-specimen geometry used for the final embedded-contact configuration. The sequence was used to identify and separate fixture/contact effects from the response of the highly resistive epoxy composites.
2.7. ATR-FTIR Spectroscopy
ATR-FTIR measurements were performed with a Cary Agilent 630 Fourier-transform infrared spectrometer (Agilent Technologies, Santa Clara, CA, USA) equipped with a diamond attenuated-total-reflectance element. The film surface was pressed against the diamond using the instrument micrometric pressure screw to maintain stable mechanical contact. Total internal reflection within the crystal generates an evanescent field that penetrates only a few micrometres into the specimen; the measurement therefore probes the near-surface region rather than the full film thickness.
One film with continuous visible coverage was selected for each composition. This criterion ensured stable ATR contact and avoided obvious uncovered regions or mechanical damage to the slide and crystal. The selection was deliberately local rather than random; the spectra therefore establish band-level and composition-level consistency within the selected films, not specimen-to-specimen population statistics. Neat resin, raw GO, and the composite concentration series were compared over the available mid-infrared window. Because coating thickness, surface roughness, and local ATR contact cannot be identical for every specimen, interpretation emphasizes band position, spectral shape, and reproducible qualitative trends rather than absolute absorbance.
2.8. Raman Spectroscopy and Mapping
Raman measurements were carried out with a Renishaw inVia microscope (Renishaw plc, Wotton-under-Edge, UK) equipped with 532 and 633 nm lasers, 10× and 100× objectives, a motorized stage with nominal 100 nm in-plane repositioning precision, 600 and 1800 lines mm−1 gratings, and a CCD detector. All spectra and maps reported here were acquired with the 532 nm laser. Extended spectra (approximately 200–3500 cm−1) were collected for films from the nominal 0.25 and 5 wt% formulations of each filler. These endpoint formulations were selected to contrast dilute and high nominal loading, while optical monitoring during acquisition was used to maintain focus and avoid visibly damaged regions. Five consecutive acquisitions were summed to improve signal-to-noise ratio; these are instrumental repeats, not independent specimen replicates. For GO-containing specimens, incident power was reduced to 5% of the available laser power to limit local heating and visible damage. Cosmic-ray removal, baseline correction, and normalization were applied before comparison.
Planar maps were acquired with the 100× objective using a spectral window centred near 1100 cm−1, 5% laser power, and 1 s integration per point. At each position, a matrix-associated band and a filler-associated band were evaluated separately, and their intensity ratio was used as a relative indicator of filler-rich versus matrix-rich regions. This ratio reduces, but does not eliminate, variations caused by local focus and film thickness. Cross-sectional maps were collected from approximately 2 µm above the optically identified surface to 10 µm below it in 0.5 µm steps. Nominal zero depth therefore denotes the visually identified film surface, not an independently metrologized interface. Because Raman intensity also depends on absorption, scattering efficiency, platelet orientation, the optical point-spread function, and the local matrix contribution, the maps are interpreted as spatial distributions of Raman-active domains and relative continuity rather than calibrated local filler volume fractions. The original acquisitions also used map-specific intensity scales; a post hoc area-fraction or domain-size segmentation would require an arbitrary common threshold and is therefore not presented as quantitative composition data.
2.9. Experimental Design, Repeatability and Scope of Inference
The datasets have different levels of replication and are interpreted accordingly. Film-thickness plots draw on the independently prepared films available for each condition, with a maximum of four films and five spatial gauge readings used to calculate each film mean. Because film number differs by condition, the semi-range is used to display the observed spread within each condition and is not compared across formulations as a population-variability statistic. In contrast, the five consecutive impedance acquisitions and five Raman acquisitions are instrumental repeats. The final embedded-contact comparison involved one neat-epoxy specimen and one specimen prepared from the nominal 5 wt% GNP formulation; its normalized impedance contrast is therefore a direct specimen-level observation from a controlled same-fixture comparison rather than a population statistic. ATR-FTIR was performed on one continuously coated film per composition, and the Raman maps represent selected local fields rather than whole-specimen volume averages.
All filler loadings are nominal formulation values. Satin-cloth filtration of GNP coatings can remove incompletely exfoliated residues, and the retained GNP fraction was not independently mass-balanced after filtration. For the nominal 5 wt% GNP formulation, isopropanol was evaporated until consecutive mass measurements were unchanged, but the retained filler content was not re-measured independently. The curing schedule was not validated by DSC/Tg or conversion analysis. In addition, a matched nominal 5 wt% planar MoS2 map is absent from the archived dataset, although cross-sectional maps are available at nominal 0.25 and 5 wt%. These constraints define the scope of the claims made below and are carried explicitly into the Discussion and Conclusions.
3. Results and Discussion
3.1. Specimen Formation and Coating Thickness
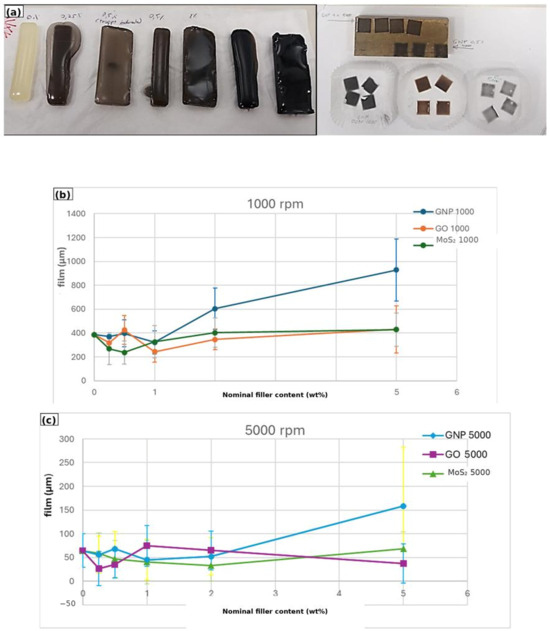
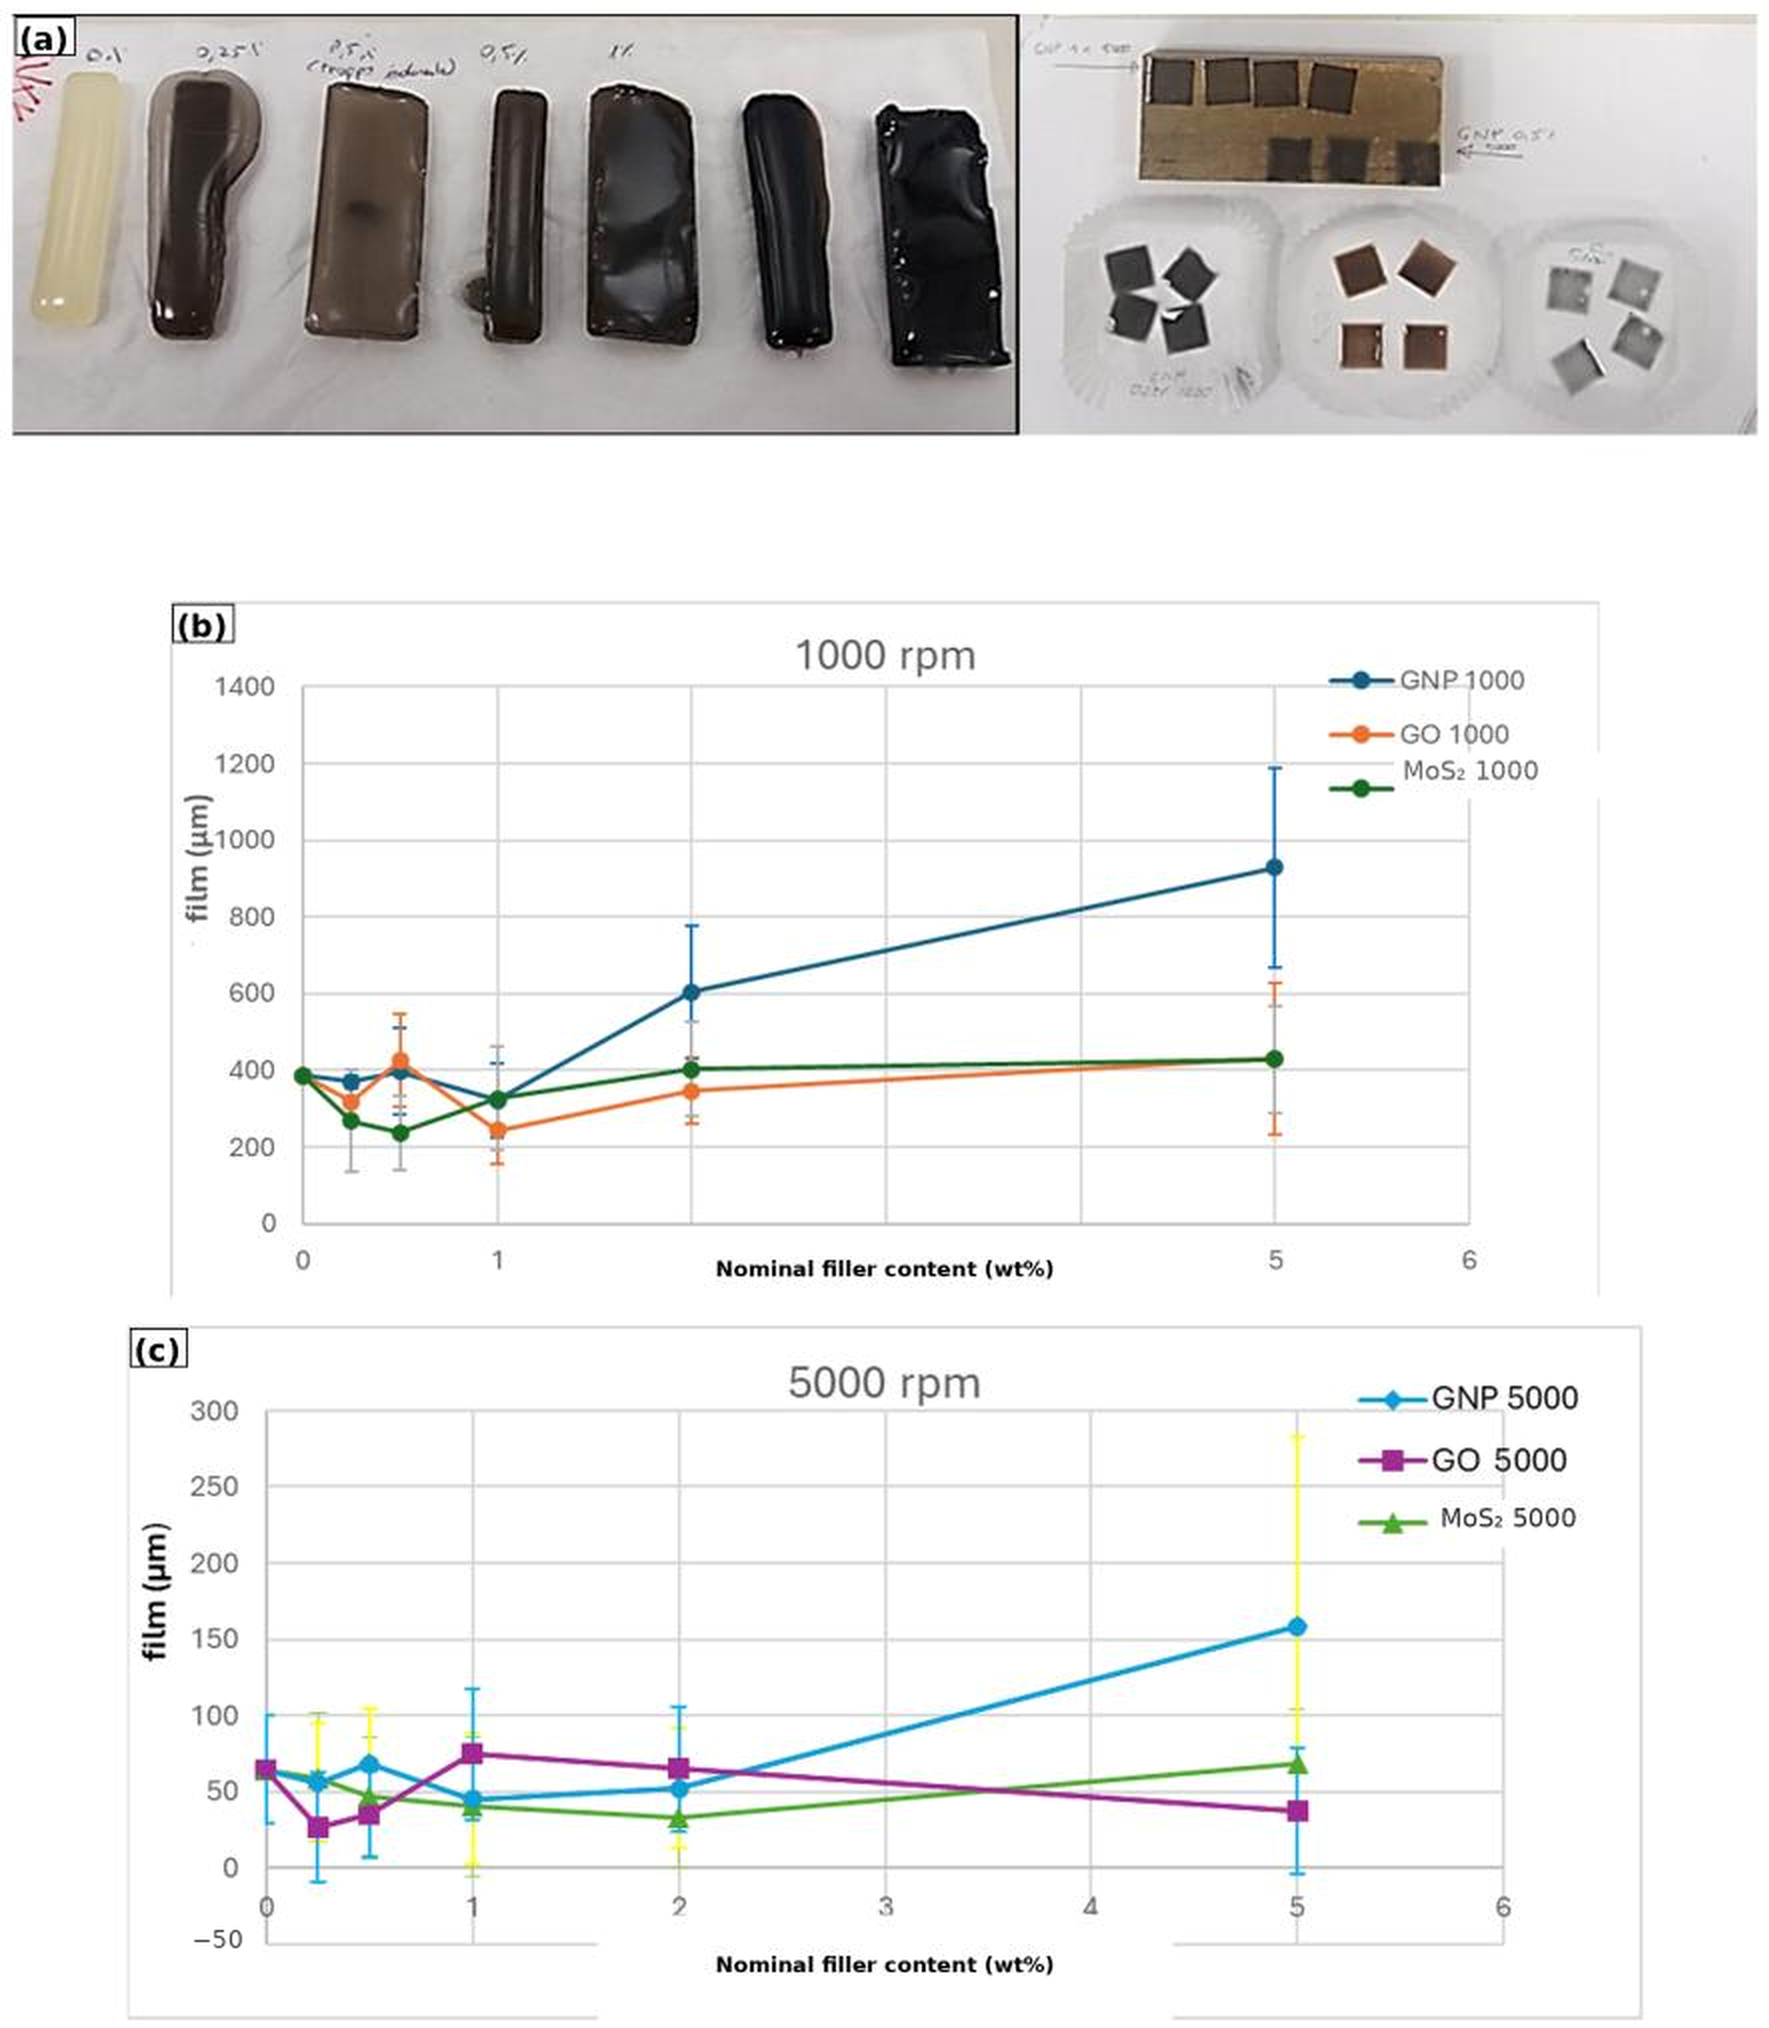
The preparation route produced both bulk specimens and coated slides across the full nominal filler range (Figure 3a). All formulations remained macroscopically processable up to the nominal 5 wt% level, although each filler required a different balance between dispersion energy, bubble removal, and the processing time available before the hardener increased viscosity.
Figure 3.
Specimen formation and film thickness. (a) Representative bulk specimens and coated slides. Mean coating thickness versus nominal filler content after a final spin step at (b) 1000 rpm and (c) 5000 rpm. Each film value was obtained from four-corner and centre gauge measurements; plotted values combine the independently prepared films available for the corresponding condition (maximum four). Semi-range bars show the observed spread of the available film means within each condition and are not used for cross-condition variance comparisons or inferential statistics.
GNP coatings showed the clearest increase in mean thickness at high nominal loading, particularly after the final 1000 rpm spin step (Figure 3b). The same tendency was weaker, but still evident, at 5000 rpm (Figure 3c). Because each plotted point combines the independently prepared films available for that condition, the mean trend is not based solely on repeated local readings from a single coating. The semi-range bars show the observed within-condition spread and are not used for cross-condition variance comparisons. The mean thickness trend should not be attributed to filler density alone. Increasing nominal GNP content increases the probability of platelet–platelet interactions and can raise effective viscosity and resistance to radial flow. The elapsed time after A1 addition further changes viscosity during coating, while filtration removes the largest incompletely exfoliated residues. Recent GNP/epoxy coating studies likewise show that dispersion route and loading alter coating morphology and viscoelastic or mechanical response [17,18]. The smaller mean changes observed for GO and MoS2 do not imply perfect local uniformity.
These thickness variations constrain the spectroscopy. Absolute FTIR or Raman intensity cannot be compared directly among all formulations when thickness, surface roughness, and local optical focus vary. The subsequent discussion therefore relies on characteristic bands, normalized spectra, and spatial intensity ratios rather than on uncorrected signal amplitude.
3.2. Electrode–Composite Contact Controls the Measured Impedance
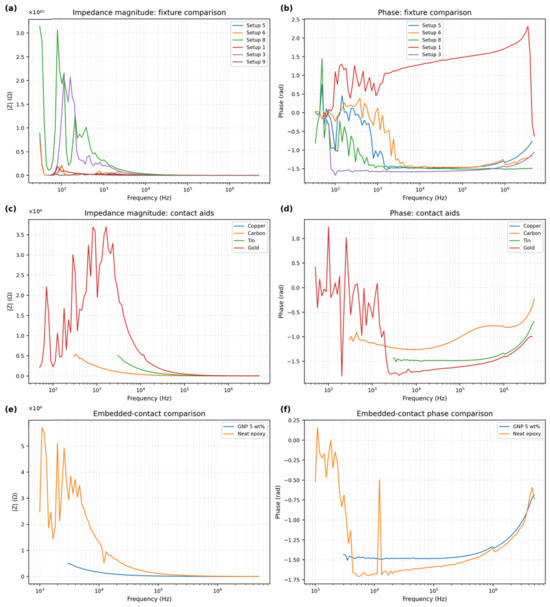
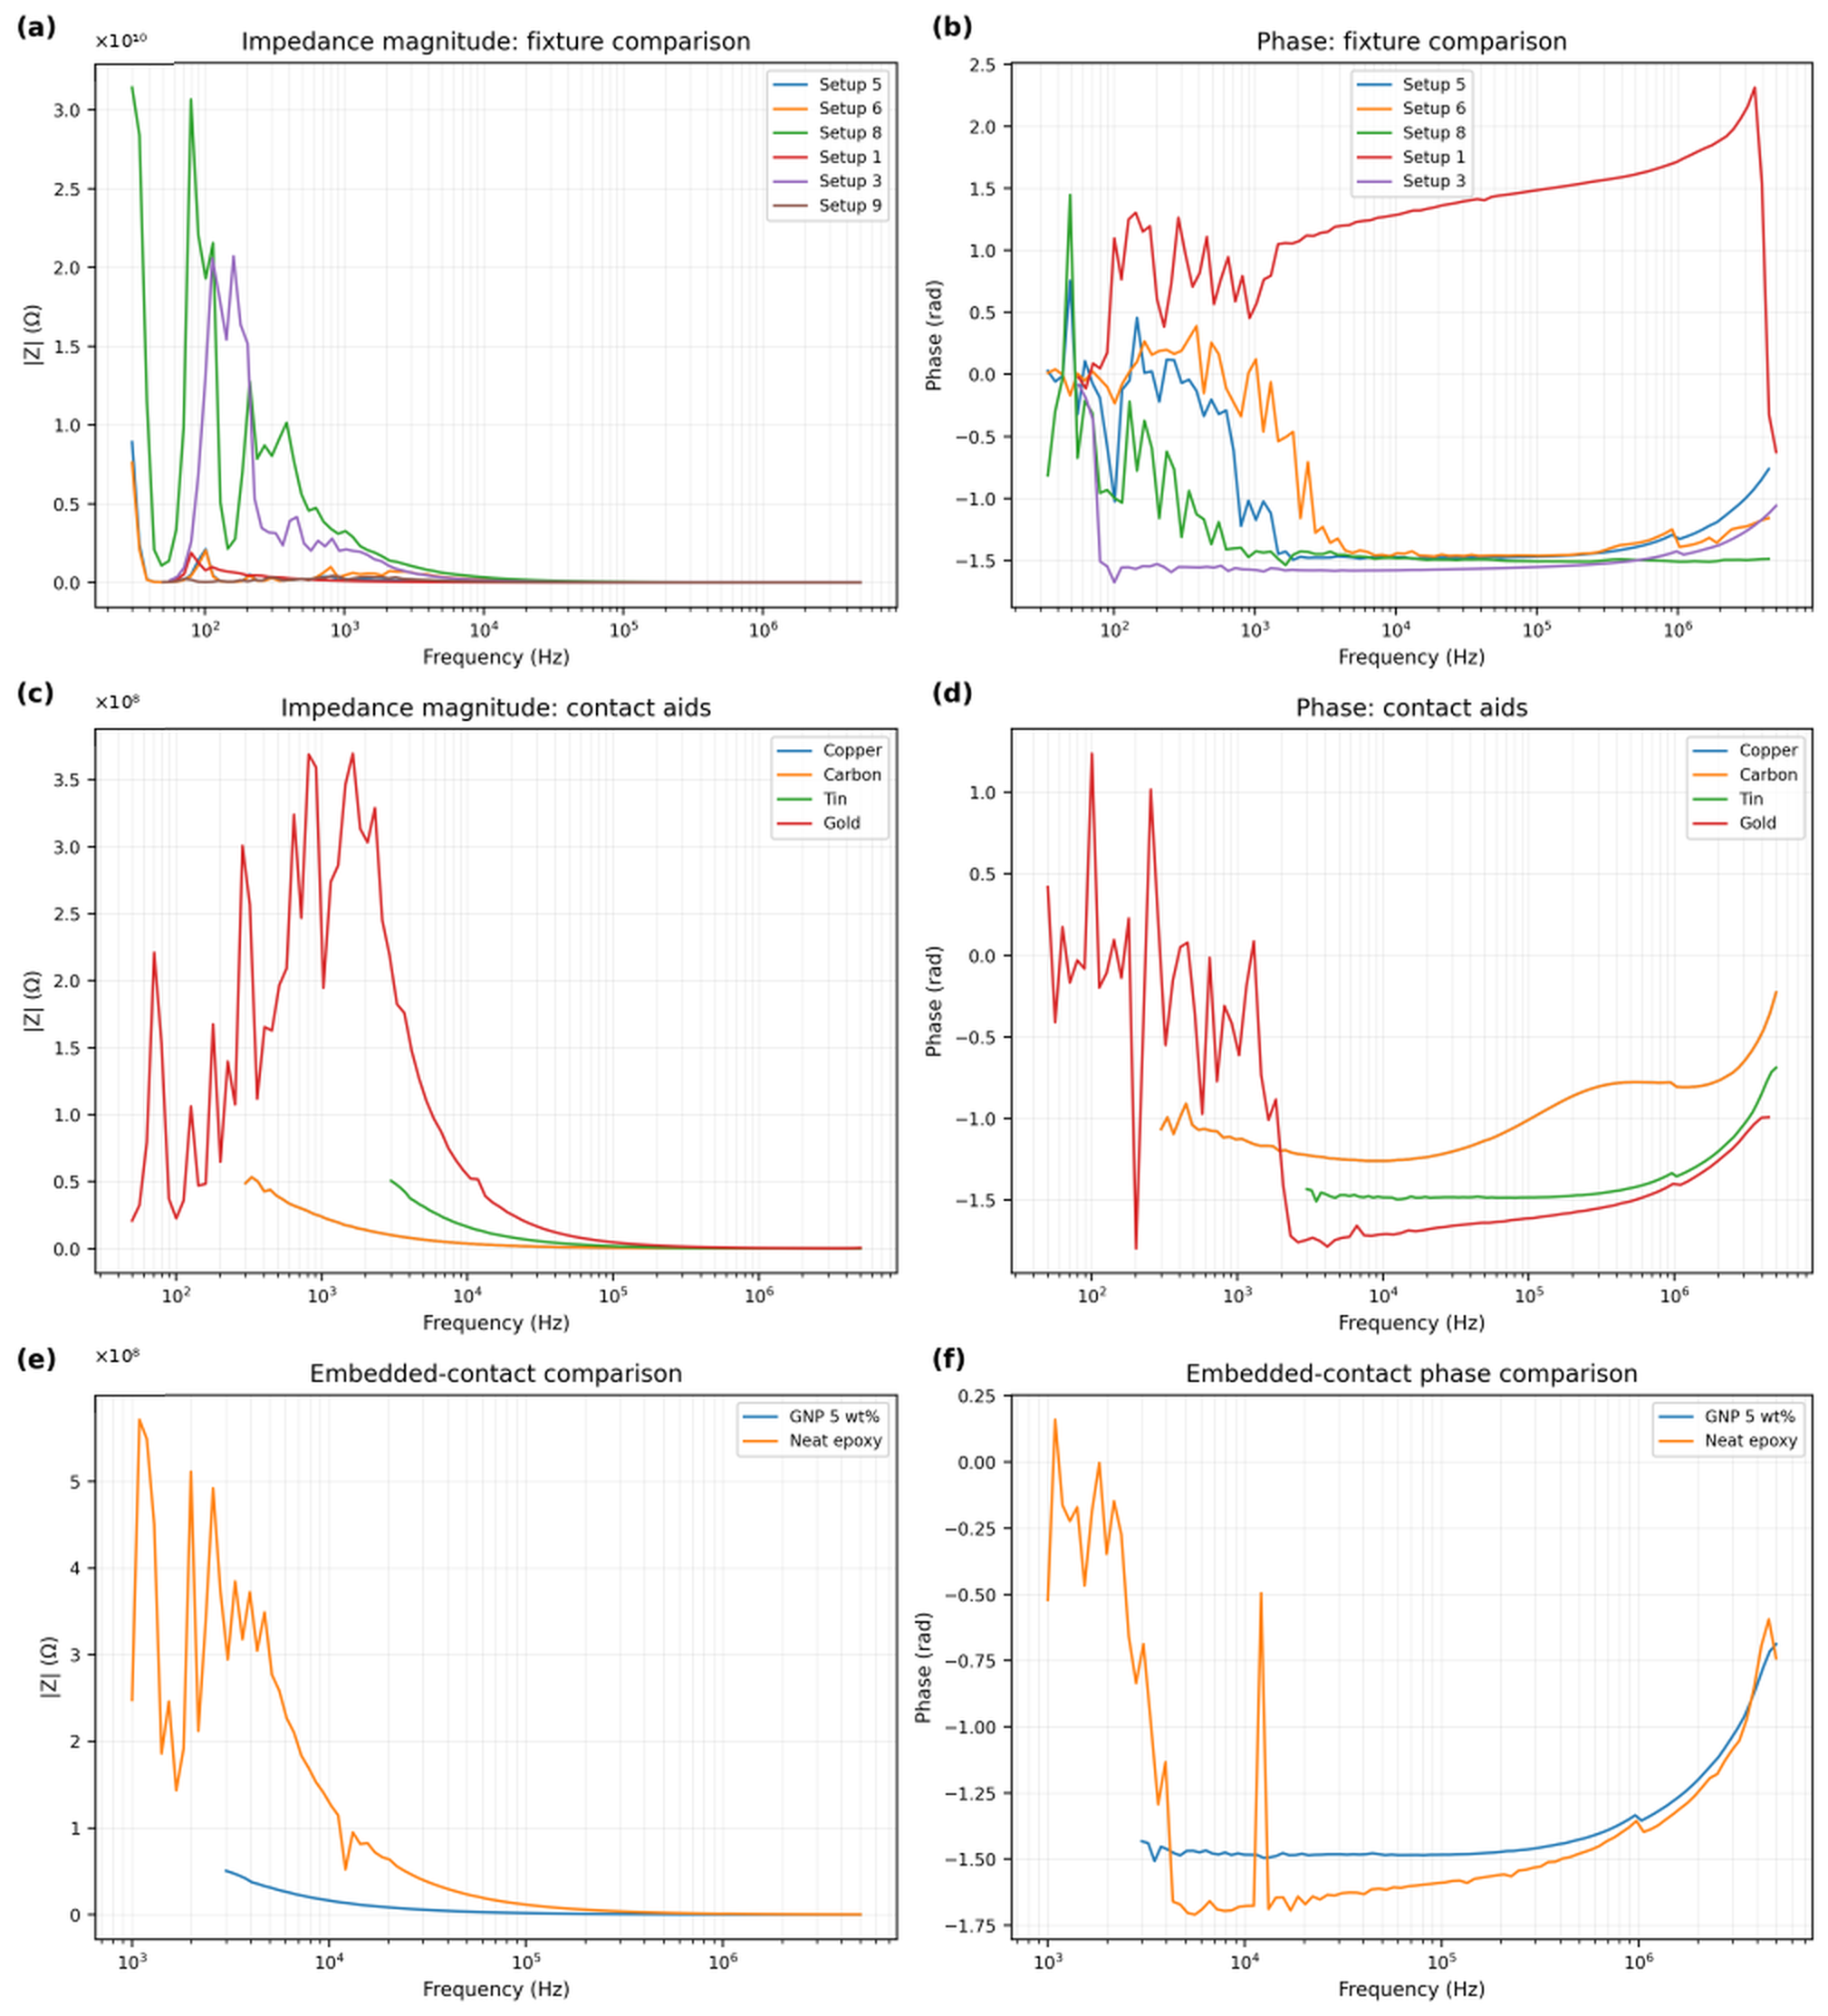
The fixture comparison shows that the measured response was not determined by the composite alone. Surface-contact arrangements produced markedly different impedance magnitudes and phase trends when specimen orientation, clamping geometry, calibration procedure, or contact material was changed (Figure 4a–d). Several configurations approached open-circuit behaviour and showed unstable low-frequency features, consistent with a highly resistive epoxy surface combined with variable contact capacitance and contact resistance.
Figure 4.
Contact sensitivity of the low-frequency impedance response, replotted from the original acquisition data on a common compact format. (a,b) Magnitude and phase for neat epoxy measured with alternative fixtures; (c,d) effects of conductive tapes, adhesive/tin-assisted contacts, and gold-point contacts; (e,f) embedded-contact comparison between neat epoxy and the specimen prepared from the nominal 5 wt% GNP formulation. Consecutive instrument acquisitions were averaged within each trace; they are instrumental repeats rather than independent specimen replicates. In panels (c,d), the Copper trace is largely obscured by overlap with the Carbon-contact response.
Copper tape, carbon tape, carbon adhesive, and tin-assisted contacts reduced the apparent impedance or shifted the frequency at which the circuit ceased to appear open. These contributions could not be removed reliably by calibration because the added material altered both contact area and interfacial impedance. The near overlap of some copper- and carbon-assisted traces therefore does not show that the underlying composites have the same bulk response; rather, it demonstrates that the contact layer can dominate the measurement.
Embedded contacts produced the clearest specimen-level electrical contrast in the low-frequency campaign (Figure 4e,f). Under the same drilled-contact geometry, the specimen prepared from the nominal 5 wt% GNP formulation exhibited lower impedance than neat epoxy throughout the common 3 kHz–5 MHz interval. Descriptive normalization of the plotted curves gives |Z_GNP|/|Z_epoxy| values of approximately 0.10–0.25, with a median near 0.16; equivalently, the GNP-containing specimen was typically about six times less impedant in this controlled same-fixture comparison. The contrast persists over a broad common frequency interval and across consecutive acquisitions, demonstrating that the observed difference is not confined to a single frequency or sweep. This is a direct electrical distinction between the two tested specimens under matched contact conditions. With one specimen per condition, however, the experiment does not establish the population-level magnitude or uniquely identify whether the difference arises from bulk transport, electrode–specimen contributions, or local filler enrichment. Accordingly, the result is not converted into bulk resistivity and is not used to define a concentration-dependent percolation threshold.
3.3. ATR-FTIR Signatures
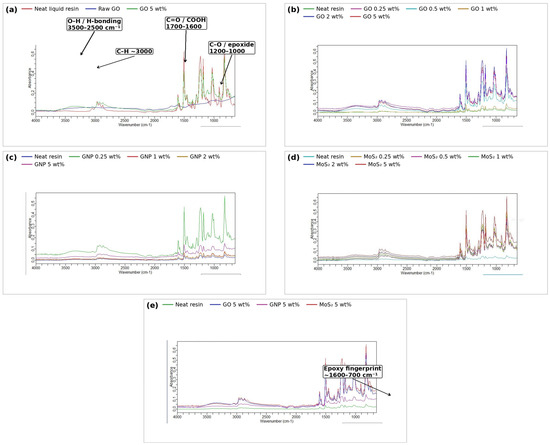
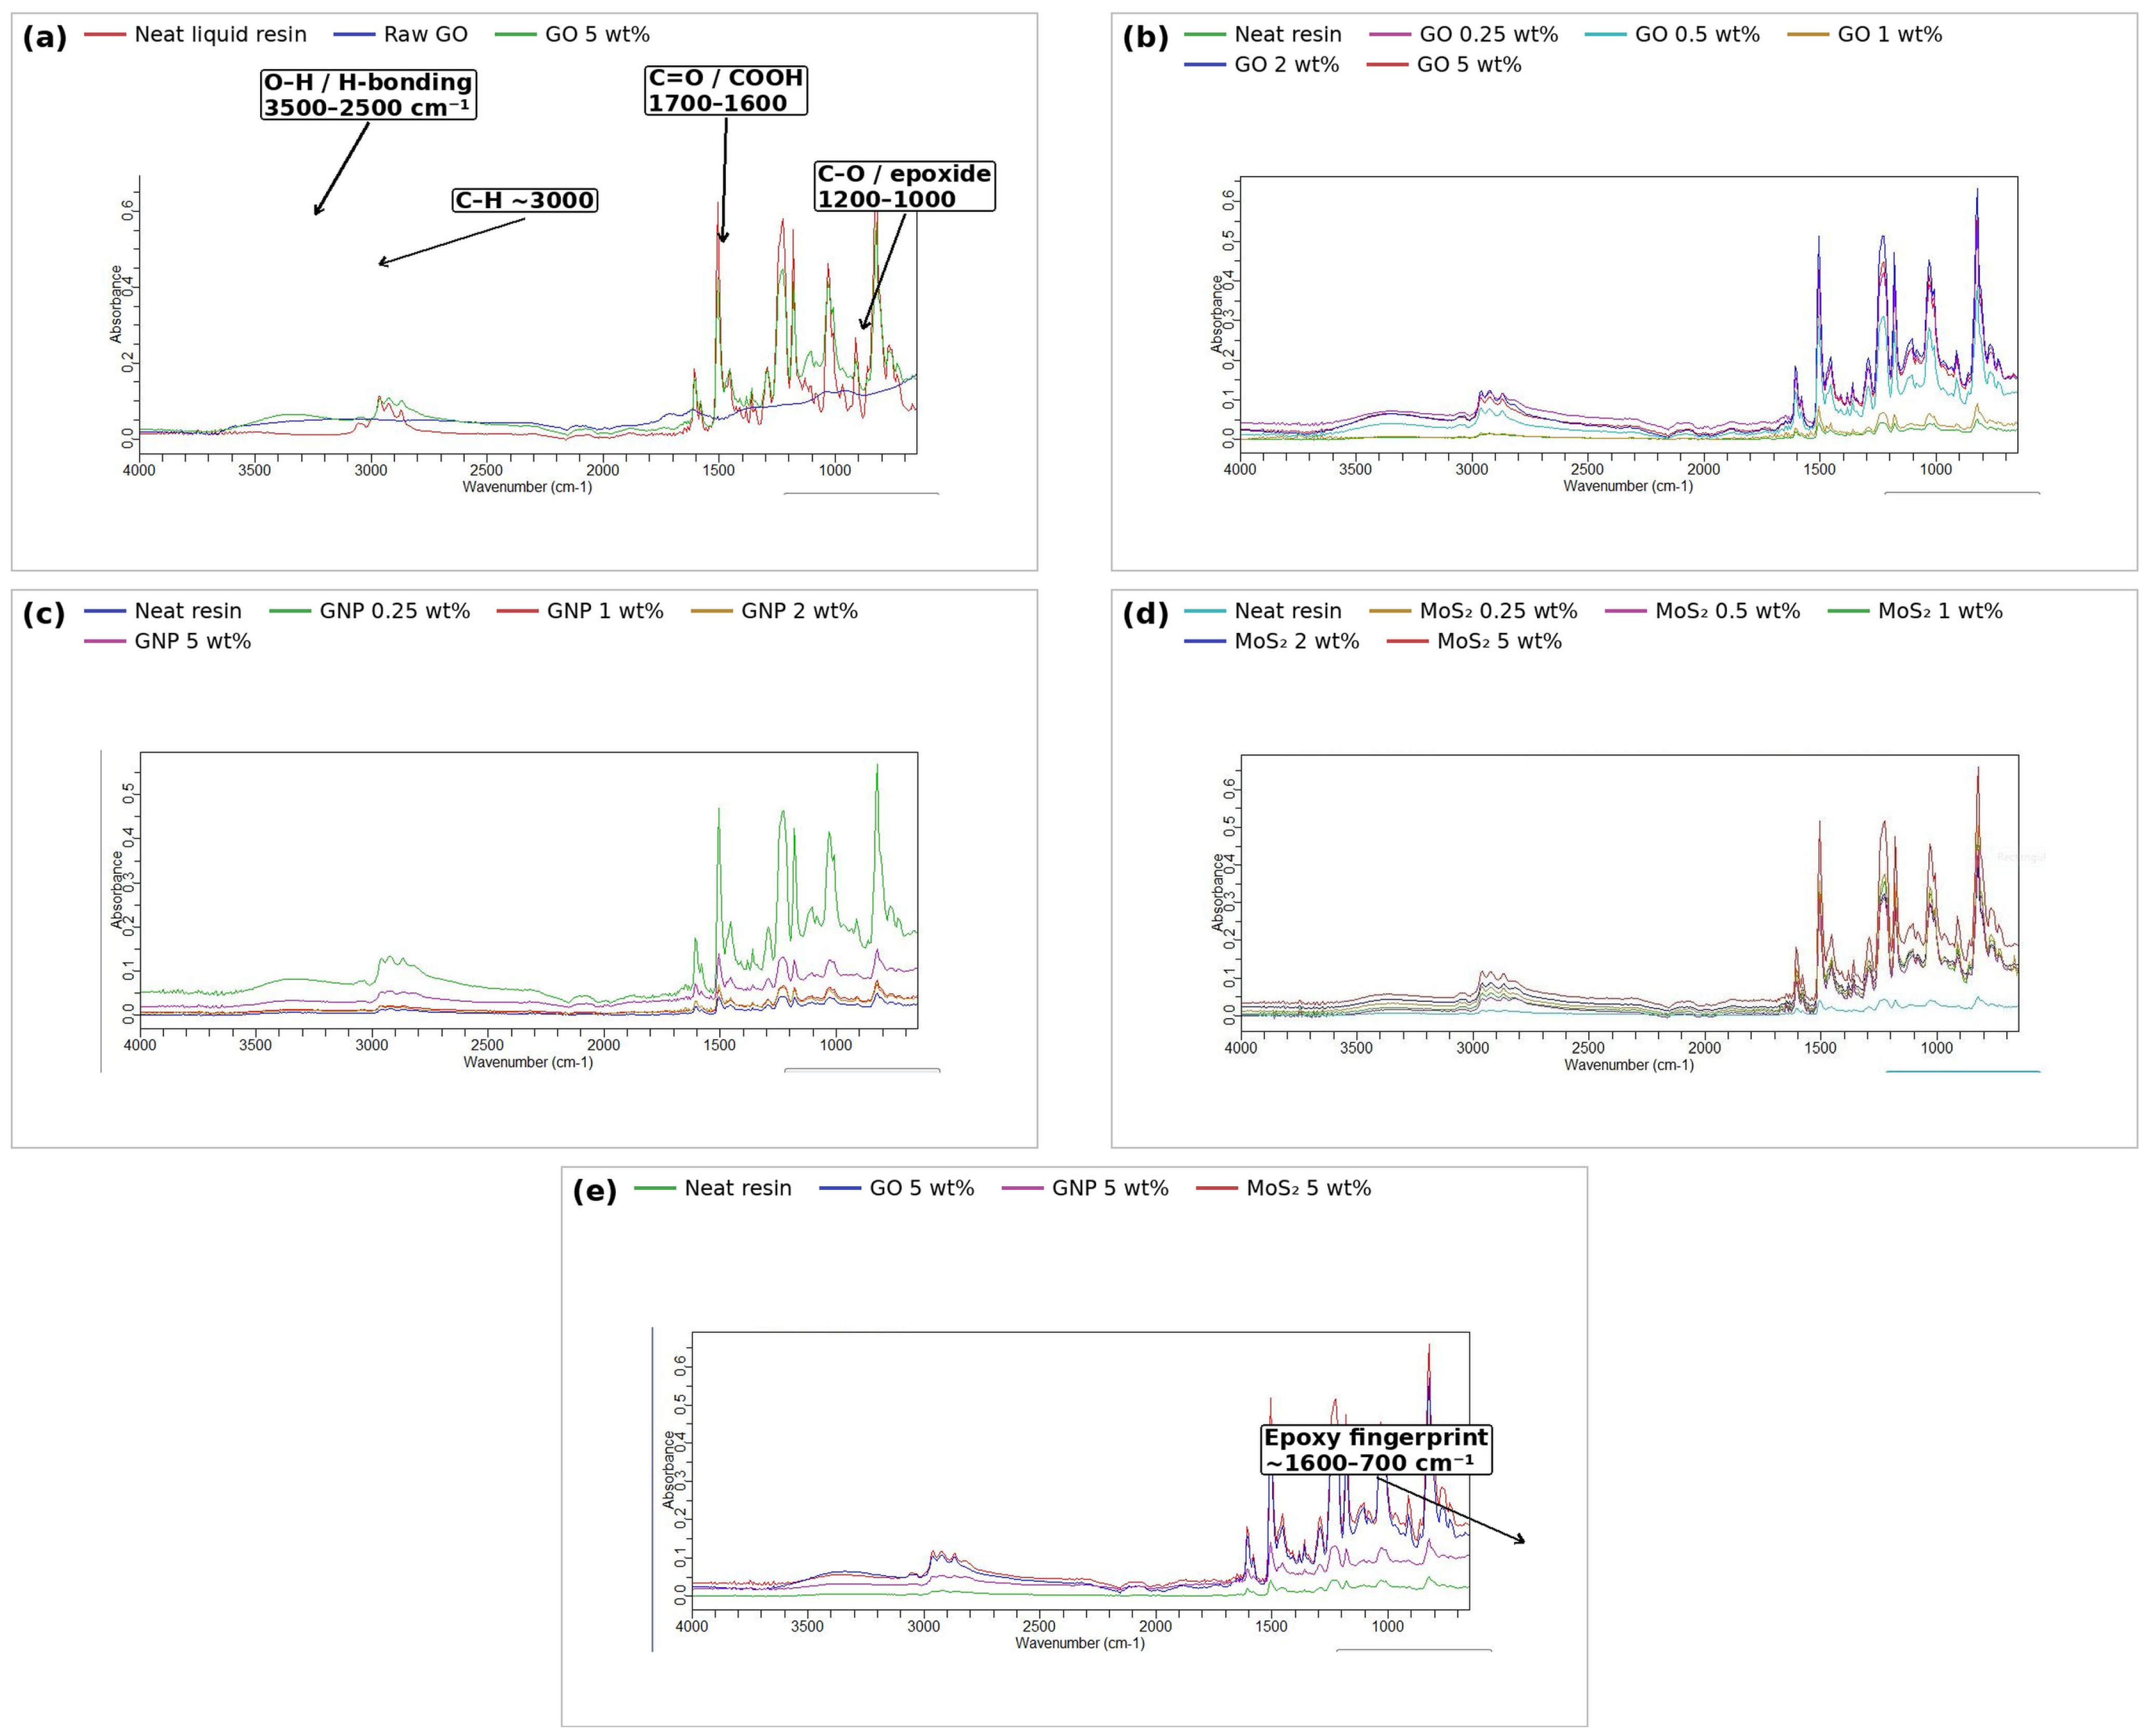
The ATR-FTIR spectra were evaluated using the near-surface measurement protocol described in Section 2.7. Figure 5 compares the neat resin, raw GO, the nominal concentration series for all three fillers, and the three nominal 5 wt% composites. Interpretation is based on band positions and reproducible spectral changes rather than absolute absorbance, because film thickness and local ATR contact vary among specimens.
Figure 5.
Diamond-ATR FTIR characterization of the epoxy nanocomposite series. (a) Neat liquid resin, raw GO, and nominal 5 wt% GO/epoxy. (b–d) Concentration series for GO, GNP, and MoS2, respectively. (e) Direct comparison of neat resin and the three nominal 5 wt% composites. Principal FTIR band regions discussed in the text are labelled directly in the figure. Band positions and reproducible spectral changes are interpreted qualitatively; absolute absorbance is affected by local film thickness and ATR contact.
Neat liquid epoxy shows the expected matrix fingerprint, including C–H stretching near 3000 cm−1 and a dense set of bands between approximately 1600 and 700 cm−1. Raw GO is readily distinguished by a broad O–H/hydrogen-bonding envelope extending approximately 3500–2500 cm−1, carbonyl/carboxyl contributions in the 1700–1600 cm−1 region, and C–O/epoxide-related bands around 1200–1000 cm−1. These features provide qualitative spectral markers rather than concentration calibrants.
In the direct comparison of neat resin, raw GO, and the nominal 5 wt% GO composite (Figure 5a), the composite retains the principal resin bands while acquiring the broad oxygen-containing contribution characteristic of GO. The simultaneous presence of both components provides a clear spectroscopic marker of GO incorporation, while preservation of the matrix fingerprint shows that the principal epoxy spectral structure remains detectable after processing.
Across the GO concentration series (Figure 5b), the 3500–3000 cm−1 contribution becomes progressively more evident relative to neat resin, while oxygenated-group and matrix fingerprint bands remain superimposed. The systematic evolution with nominal loading is therefore consistent with an increasing spectroscopic contribution from GO rather than random variation among unrelated spectra.
No new dominant set of bands unrelated to either constituent emerges in the GO series. The spectra are therefore consistent with an interface governed predominantly by adsorption, hydrogen bonding, van der Waals interactions, and other non-covalent contributions between the oxygenated GO surface and the epoxy network. ATR-FTIR cannot exclude a small fraction of covalent interfacial bonding or cure-related changes below its detection sensitivity; this bounded interpretation is consistent with nanoscale studies showing a finite interphase in graphene-based epoxy nanocomposites [24].
The GNP and MoS2 concentration series (Figure 5c,d) remain dominated by the epoxy-matrix bands, as expected because the characteristic lattice signatures of graphitic GNP and layered MoS2 are weak or poorly resolved in the investigated mid-infrared window. Importantly, the principal epoxy fingerprint remains present across the full loading range and no intense additional bands attributable to degradation products or major unwanted side reactions appear after filler incorporation.
The direct nominal 5 wt% comparison (Figure 5e) emphasizes the filler-specific infrared response. GO produces the clearest modification in the high-wavenumber region because of its oxygenated surface, whereas GNP- and MoS2-filled films remain closer to the matrix-dominated profile. For GNP and MoS2, changes in baseline and relative intensity remain compatible with variations in film thickness, local filler distribution, and ATR contact. The data therefore support chemically stable composite-film formation under the employed processing routes without requiring the stronger conclusion that all interfacial chemistry is absent.
Overall, ATR-FTIR establishes preservation of the principal epoxy fingerprint, retention of the oxygen-rich GO contribution after processing, and the absence of reproducible new intense bands attributable to major reaction products. The results are consistent with predominantly non-covalent matrix–filler coupling under the employed conditions, but they are not presented as conclusive proof that covalent interfacial reactions are completely absent.
3.4. Raman Fingerprints of the Fillers in the Epoxy Matrix
Extended Raman spectra from films prepared at nominal 0.25 and 5 wt% were compared using the acquisition and normalization procedure described in Section 2.8. The endpoint formulations provide a direct contrast between dilute and high nominal loading, while optical monitoring during acquisition was used to maintain focus and avoid visibly damaged regions. Analysis focused on the graphitic D, G, and 2D bands, the MoS2 E12g and A1g modes, and the epoxy-associated features near 1100 and 912 cm−1.
The spectra were used first to verify that each filler remained structurally identifiable after dispersion, coating, thermal treatment, and post-cure. Quantitative interpretation was restricted to parameters that can be traced directly to the archived processed spectra; peak positions and robust intensity ratios are reported, whereas FWHM values are not reconstructed because traceable peak-fit outputs and fit uncertainties were not retained.
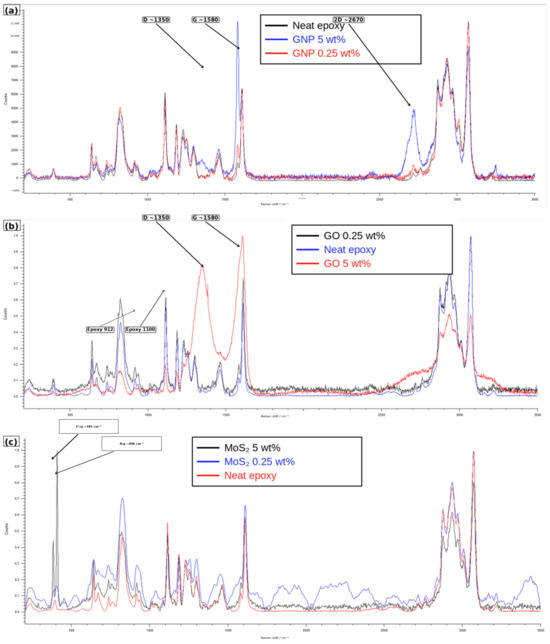
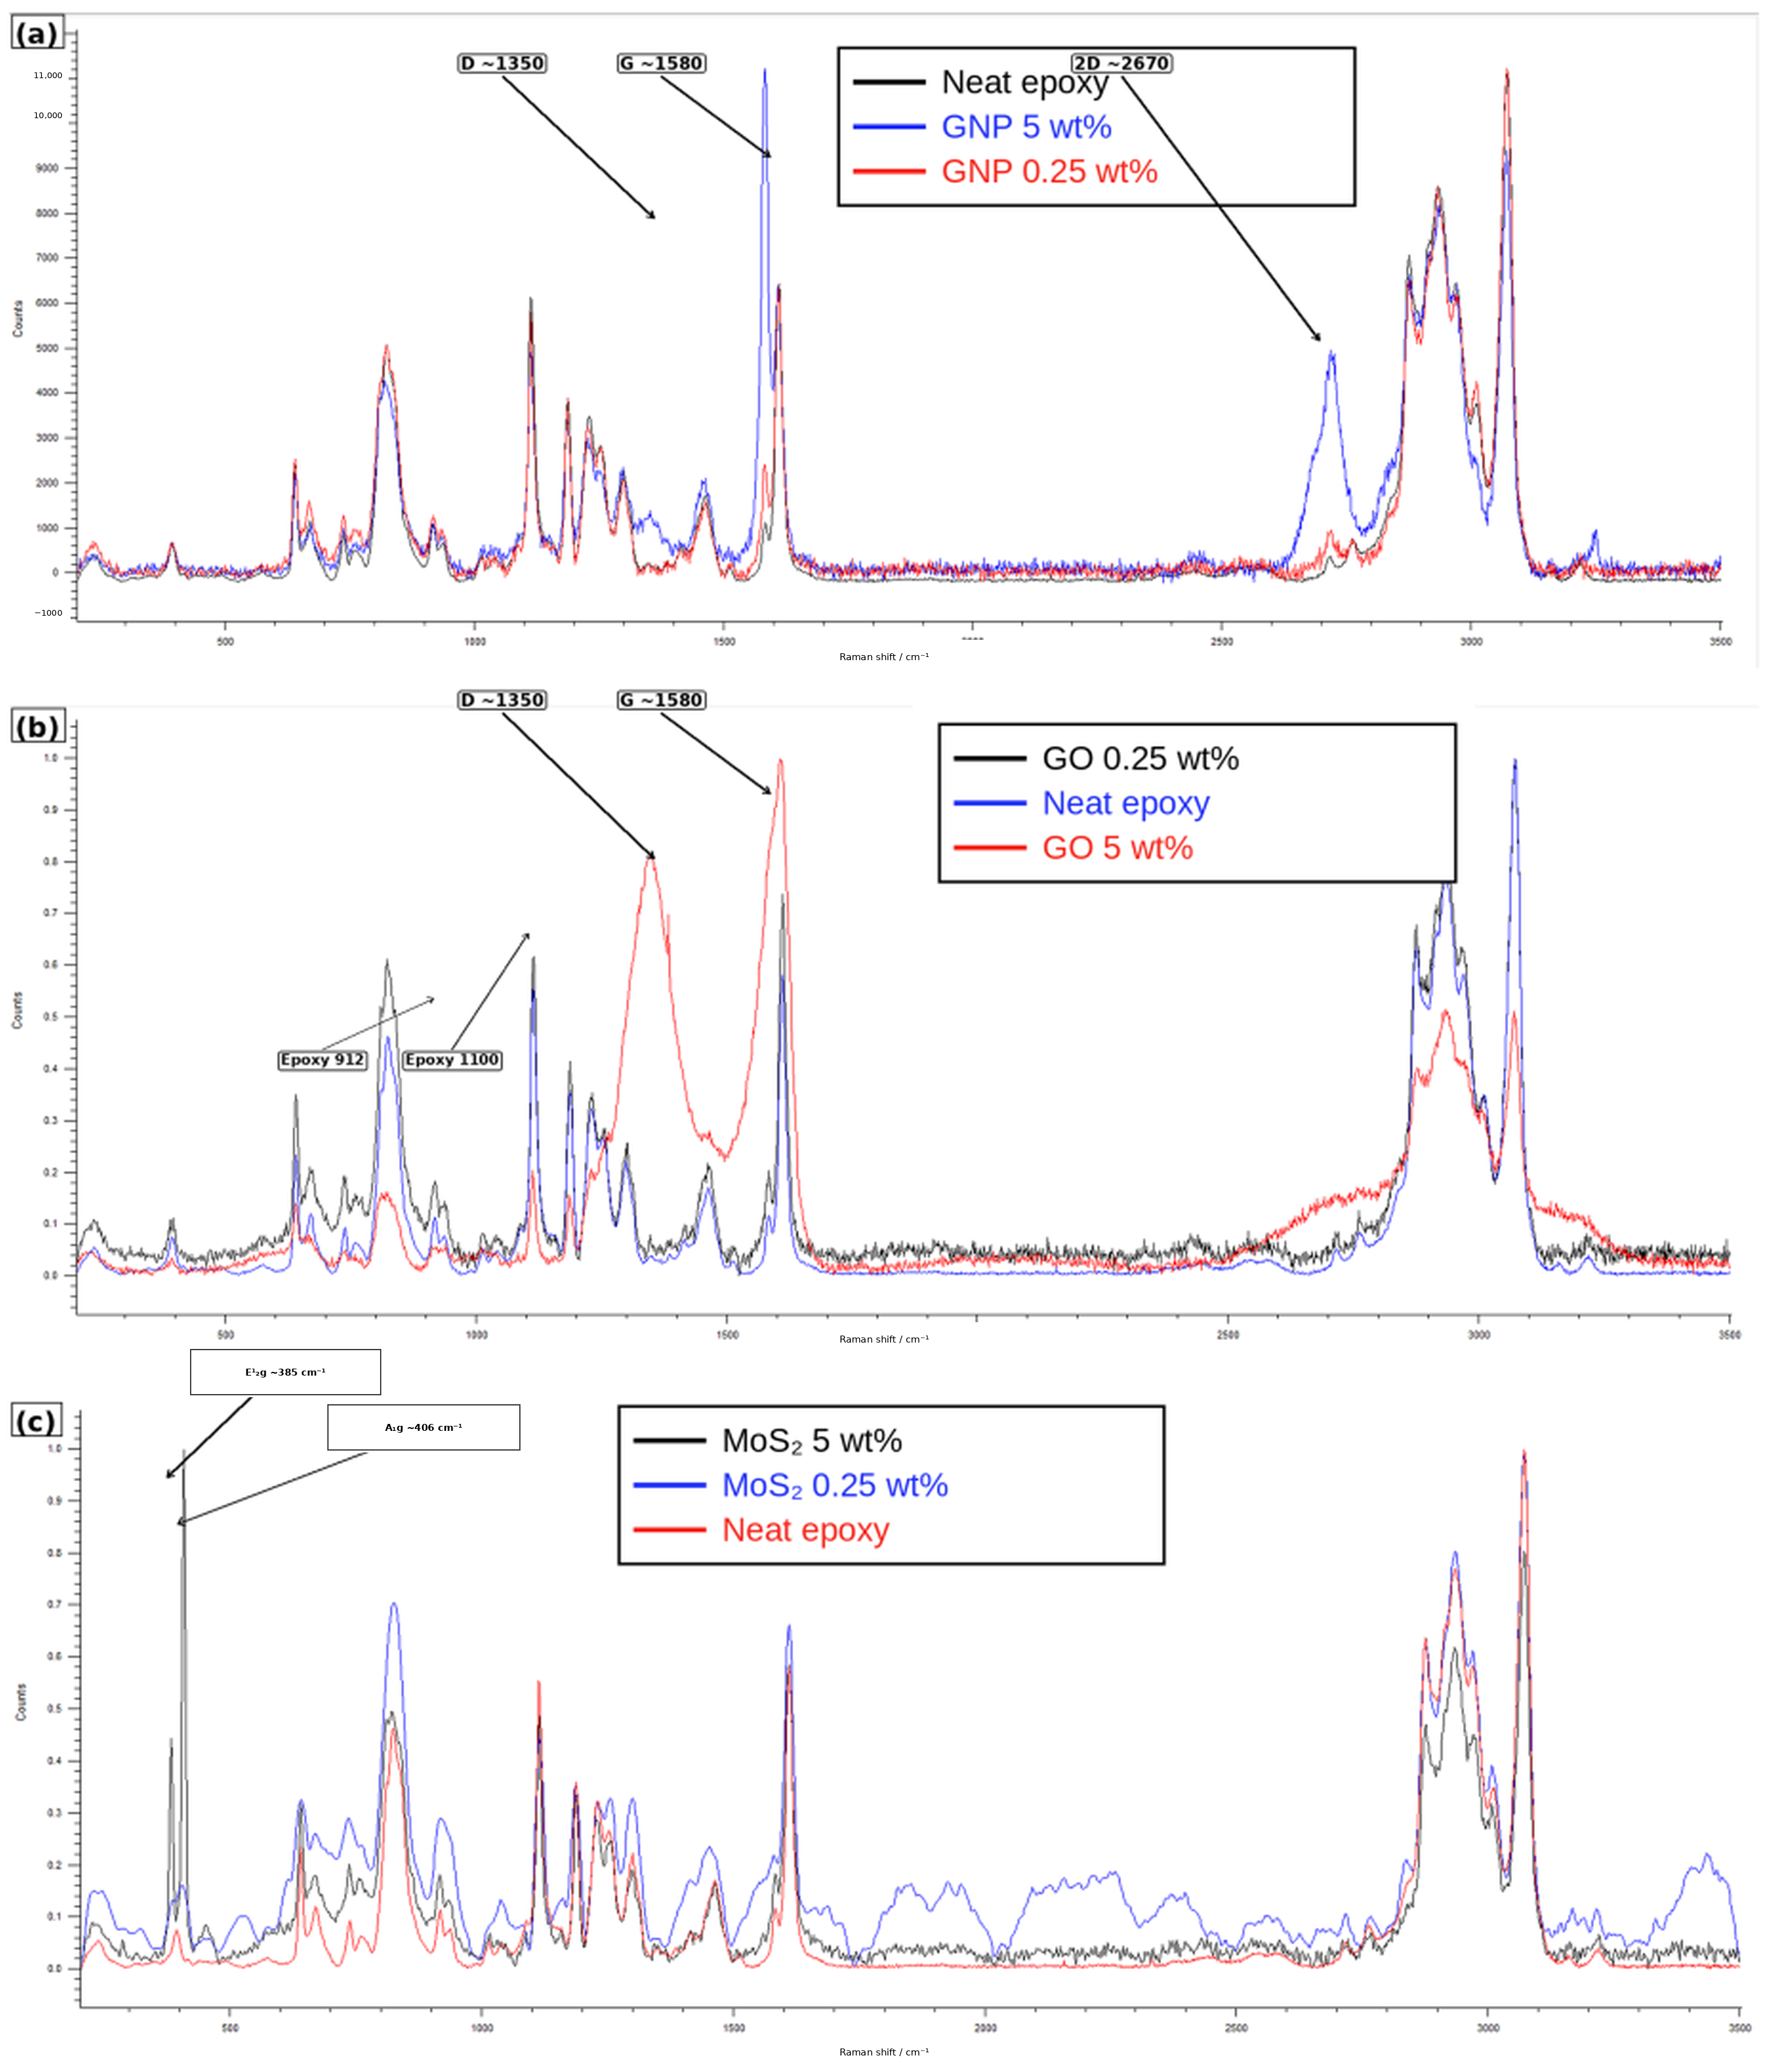
The GNP composites show the graphitic G band near 1580 cm−1 and the 2D band near 2670 cm−1 (Figure 6a) [25,26]. The nominal 0.25 wt% specimen has a comparatively narrow 2D contribution, whereas the nominal 5 wt% spectrum is broader and less symmetric, consistent with a more heterogeneous population of multilayer or stacked graphitic domains at higher nominal loading. A D-band contribution near 1350 cm−1 becomes more visible in the nominal 5 wt% spectrum, indicating a greater sampled contribution from platelet edges and disordered carbon sites. Because the archived dataset does not retain traceable peak-fit outputs or fit uncertainty suitable for robust FWHM analysis, exact FWHM values are not reconstructed retrospectively; the reproducible peak positions and qualitative line-shape evolution are reported instead (Table 3).
Figure 6.
Raman spectra of neat epoxy and composites prepared at nominal 0.25 and 5 wt% containing (a) GNP, (b) GO, and (c) MoS2. Characteristic filler bands are labelled directly in the spectra: the carbon D, G, and 2D bands for GNP, the D and G bands for GO, and the E12g and A1g modes for MoS2; the epoxy-associated 912 and 1100 cm−1 markers used in the semi-quantitative comparison are also indicated in panel (b). Spectra were processed by cosmic-ray removal, baseline correction, and normalization.
Table 3.
Raman markers used for filler identification in the epoxy films. Peak positions are approximate values read from the archived processed spectra; FWHM is not reported because traceable peak-fit outputs were not retained.
GO-containing specimens display the expected broad D and G bands associated with disordered sp2-carbon domains (Figure 6b) [27]. The GO contribution remains readily distinguishable from the epoxy fingerprint at both nominal endpoint loadings, showing that the oxygenated carbon framework remains spectroscopically identifiable after composite processing. The matrix-associated feature near 1100 cm−1 was evaluated relative to the reference band near 912 cm−1. As summarized in Table 4, I(912)/I(1100) is 0.31 for neat epoxy, 0.31 for nominal GO 0.25 wt%, and 0.33 for nominal GO 5 wt%. The near-constant ratio shows that GO incorporation does not produce a selective depletion of the 1100 cm−1 matrix feature. Together with the GO D/G response, this supports incorporation of the oxygenated carbon phase while retaining the principal epoxy spectral fingerprint.
Table 4.
Semi-quantitative Raman amplitudes of the epoxy-associated bands. The values are used to test for monotonic changes in the matrix-associated spectral ratio and are not treated as absolute concentration measurements.
The MoS2 composites show two distinct low-wavenumber modes near 385 and 406 cm−1, assigned to the in-plane E12g and out-of-plane A1g vibrations, respectively (Figure 6c) [28,29,30]. Their simultaneous detection confirms that the layered MoS2 phase survives sonication, mixing, coating, and thermal treatment. The approximate 21 cm−1 separation is compatible with the multilayer MoS2 domains, although the embedded and variably oriented flakes do not justify an exact layer-count assignment from these composite spectra. The Raman markers used for all three fillers are summarized in Table 3.
Taken together, the spectra establish three processing–structure results: each filler retains a recognizable Raman fingerprint after composite fabrication; the epoxy spectral pattern remains identifiable in every formulation; and the relative prominence and line shape of filler bands evolve with nominal loading, consistent with a larger sampled population of graphitic or layered domains in the nominal 5 wt% formulations.
3.5. Planar Raman Maps
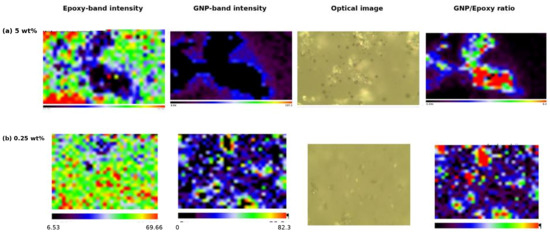
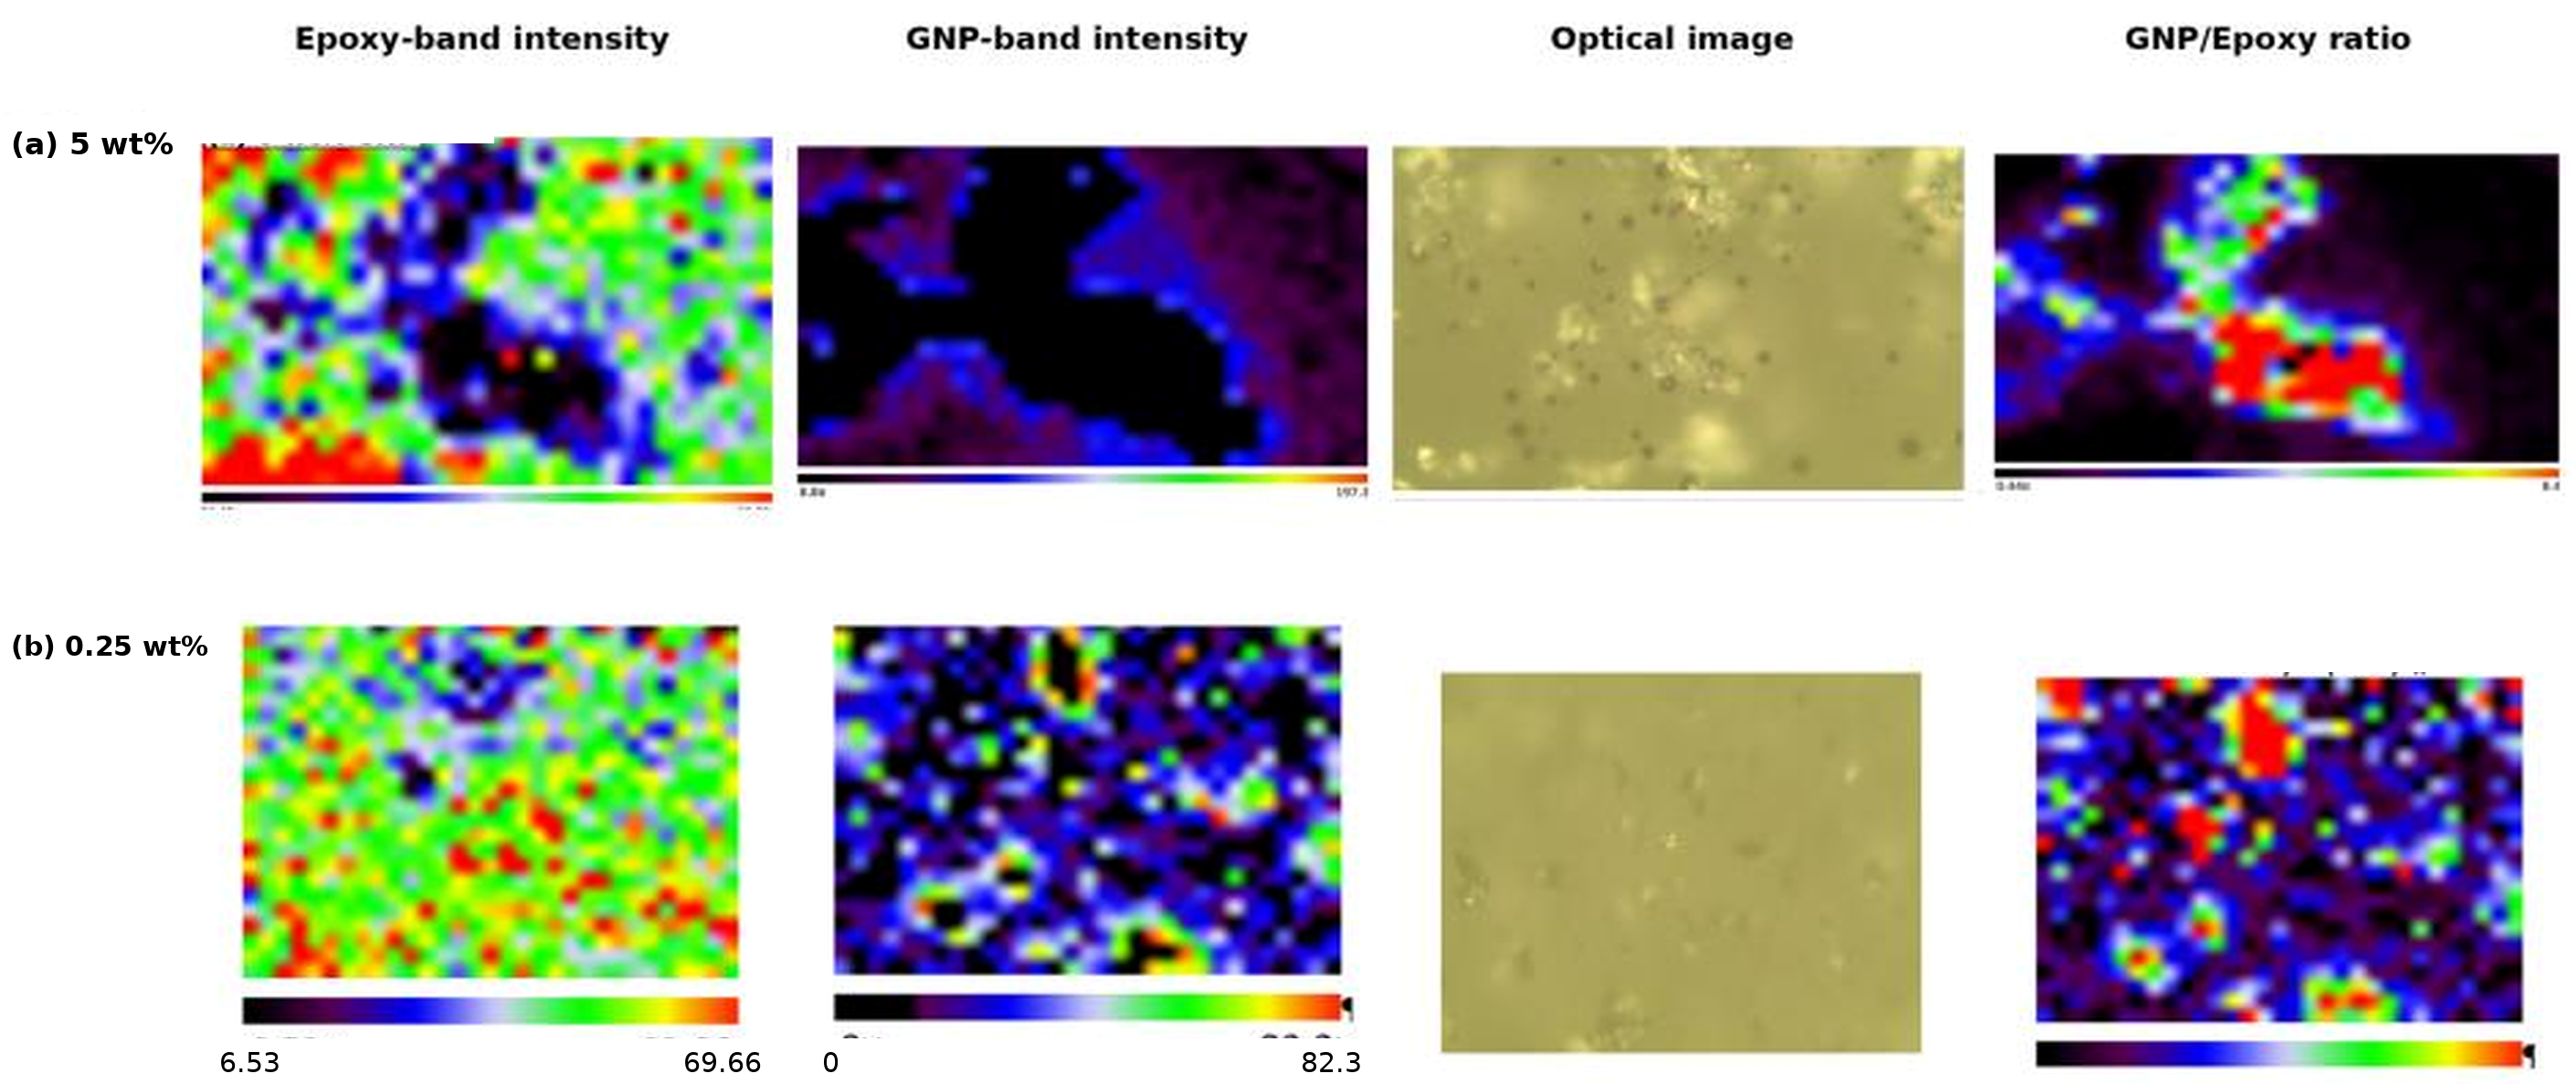
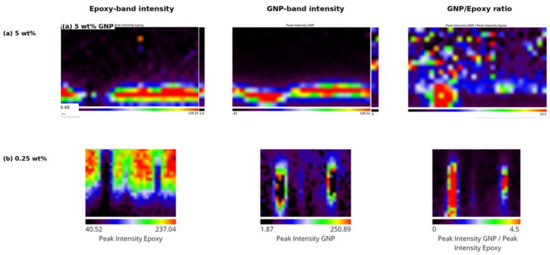
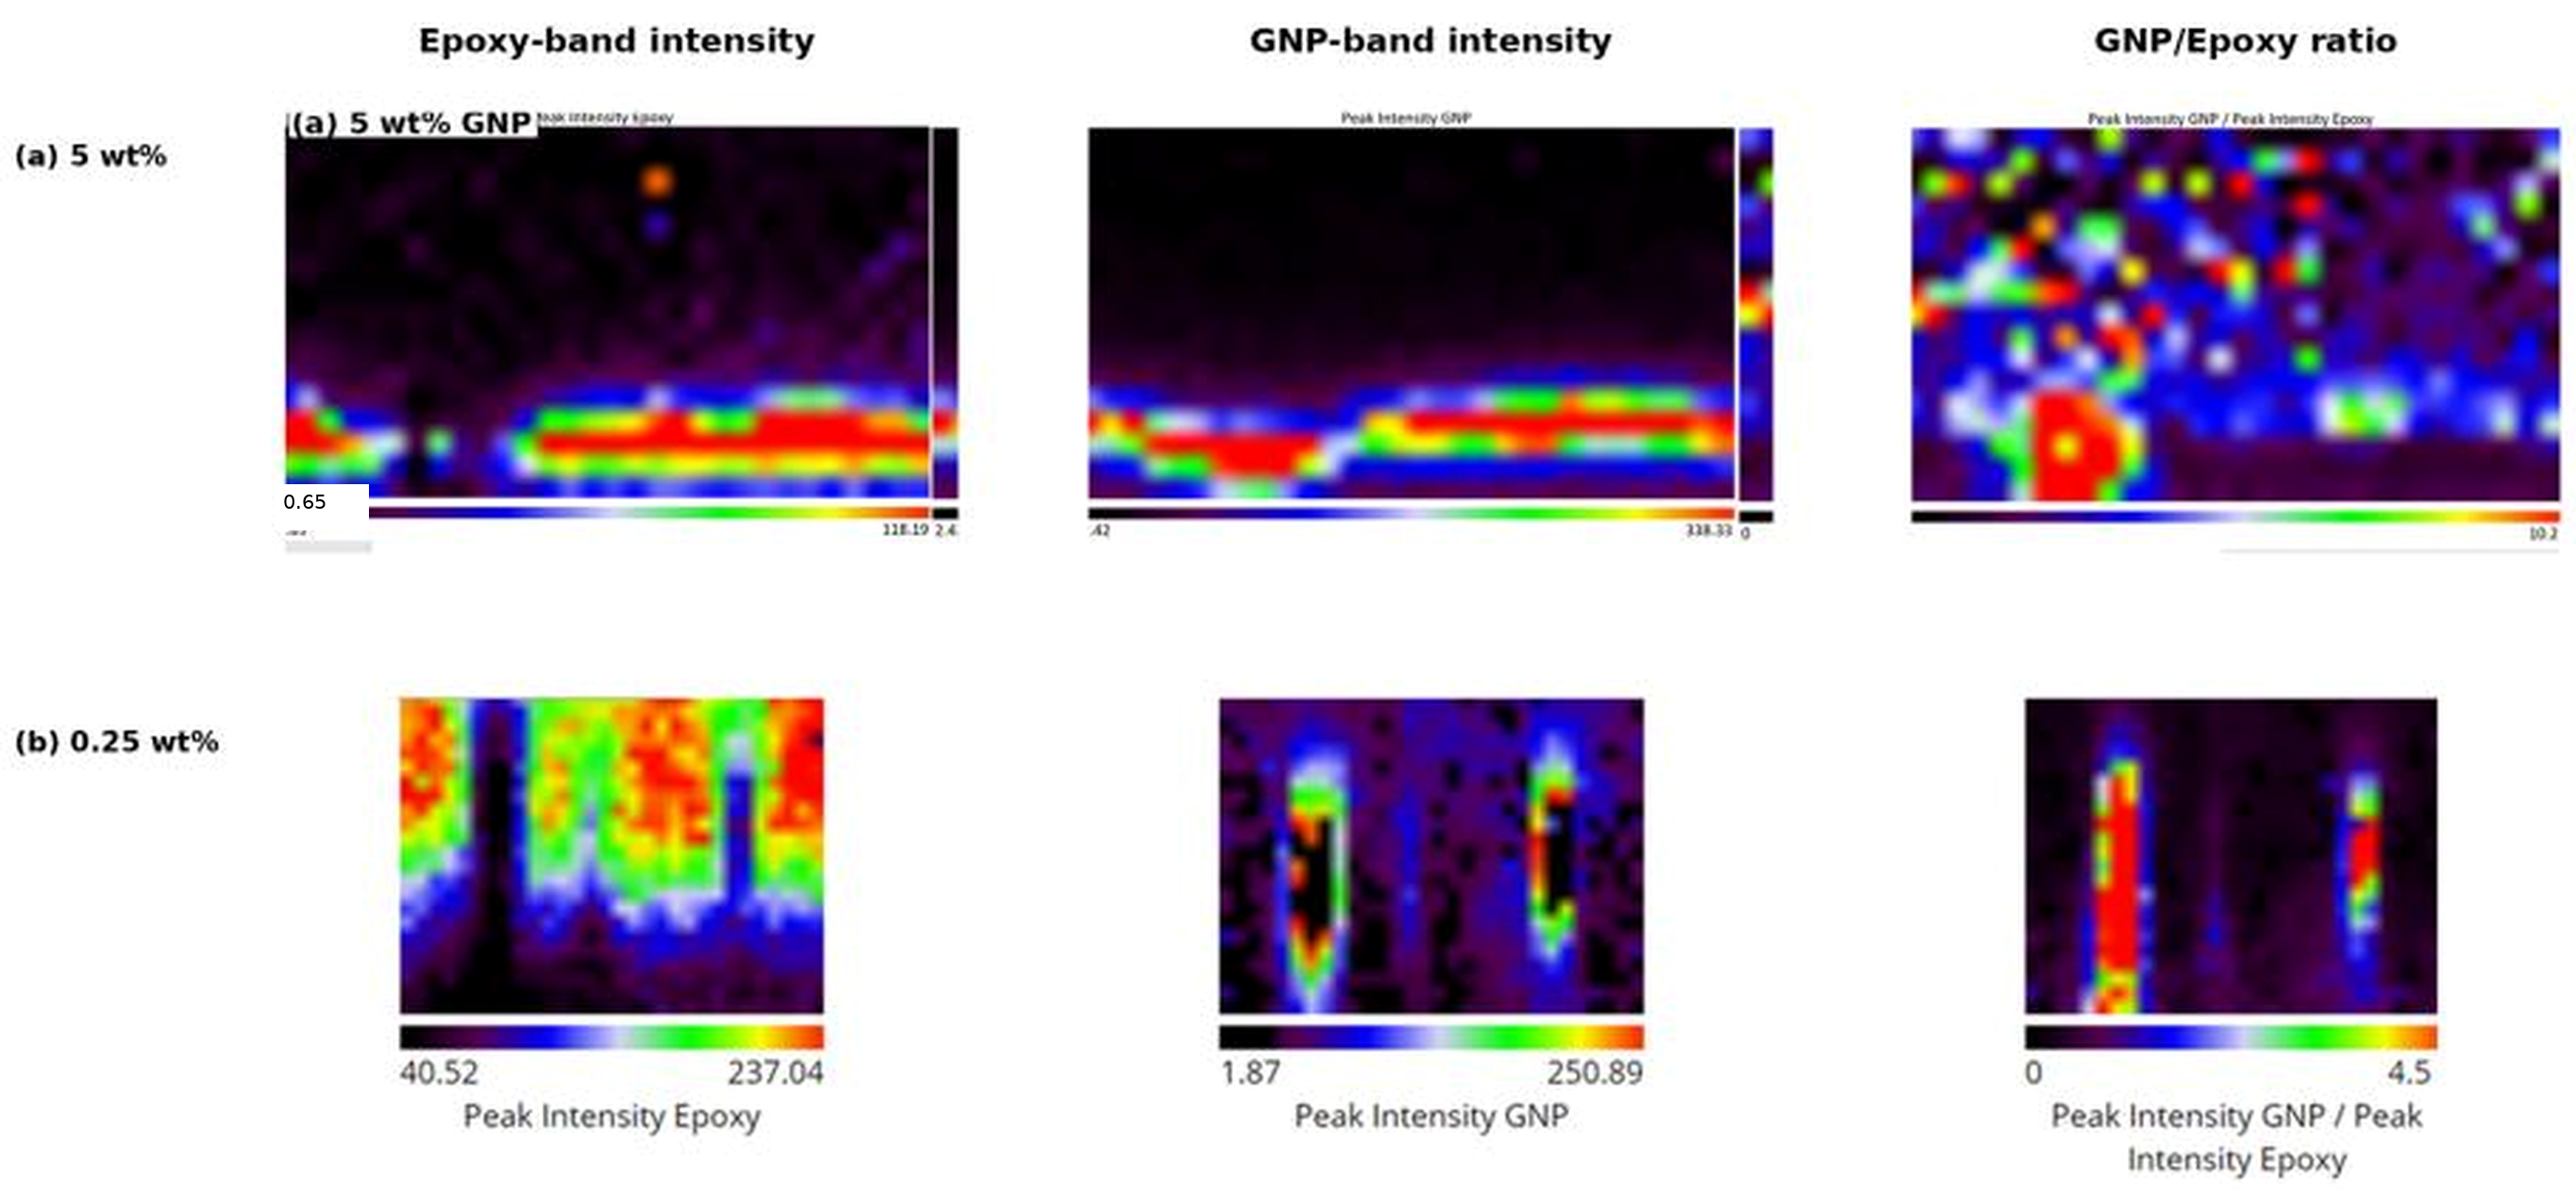
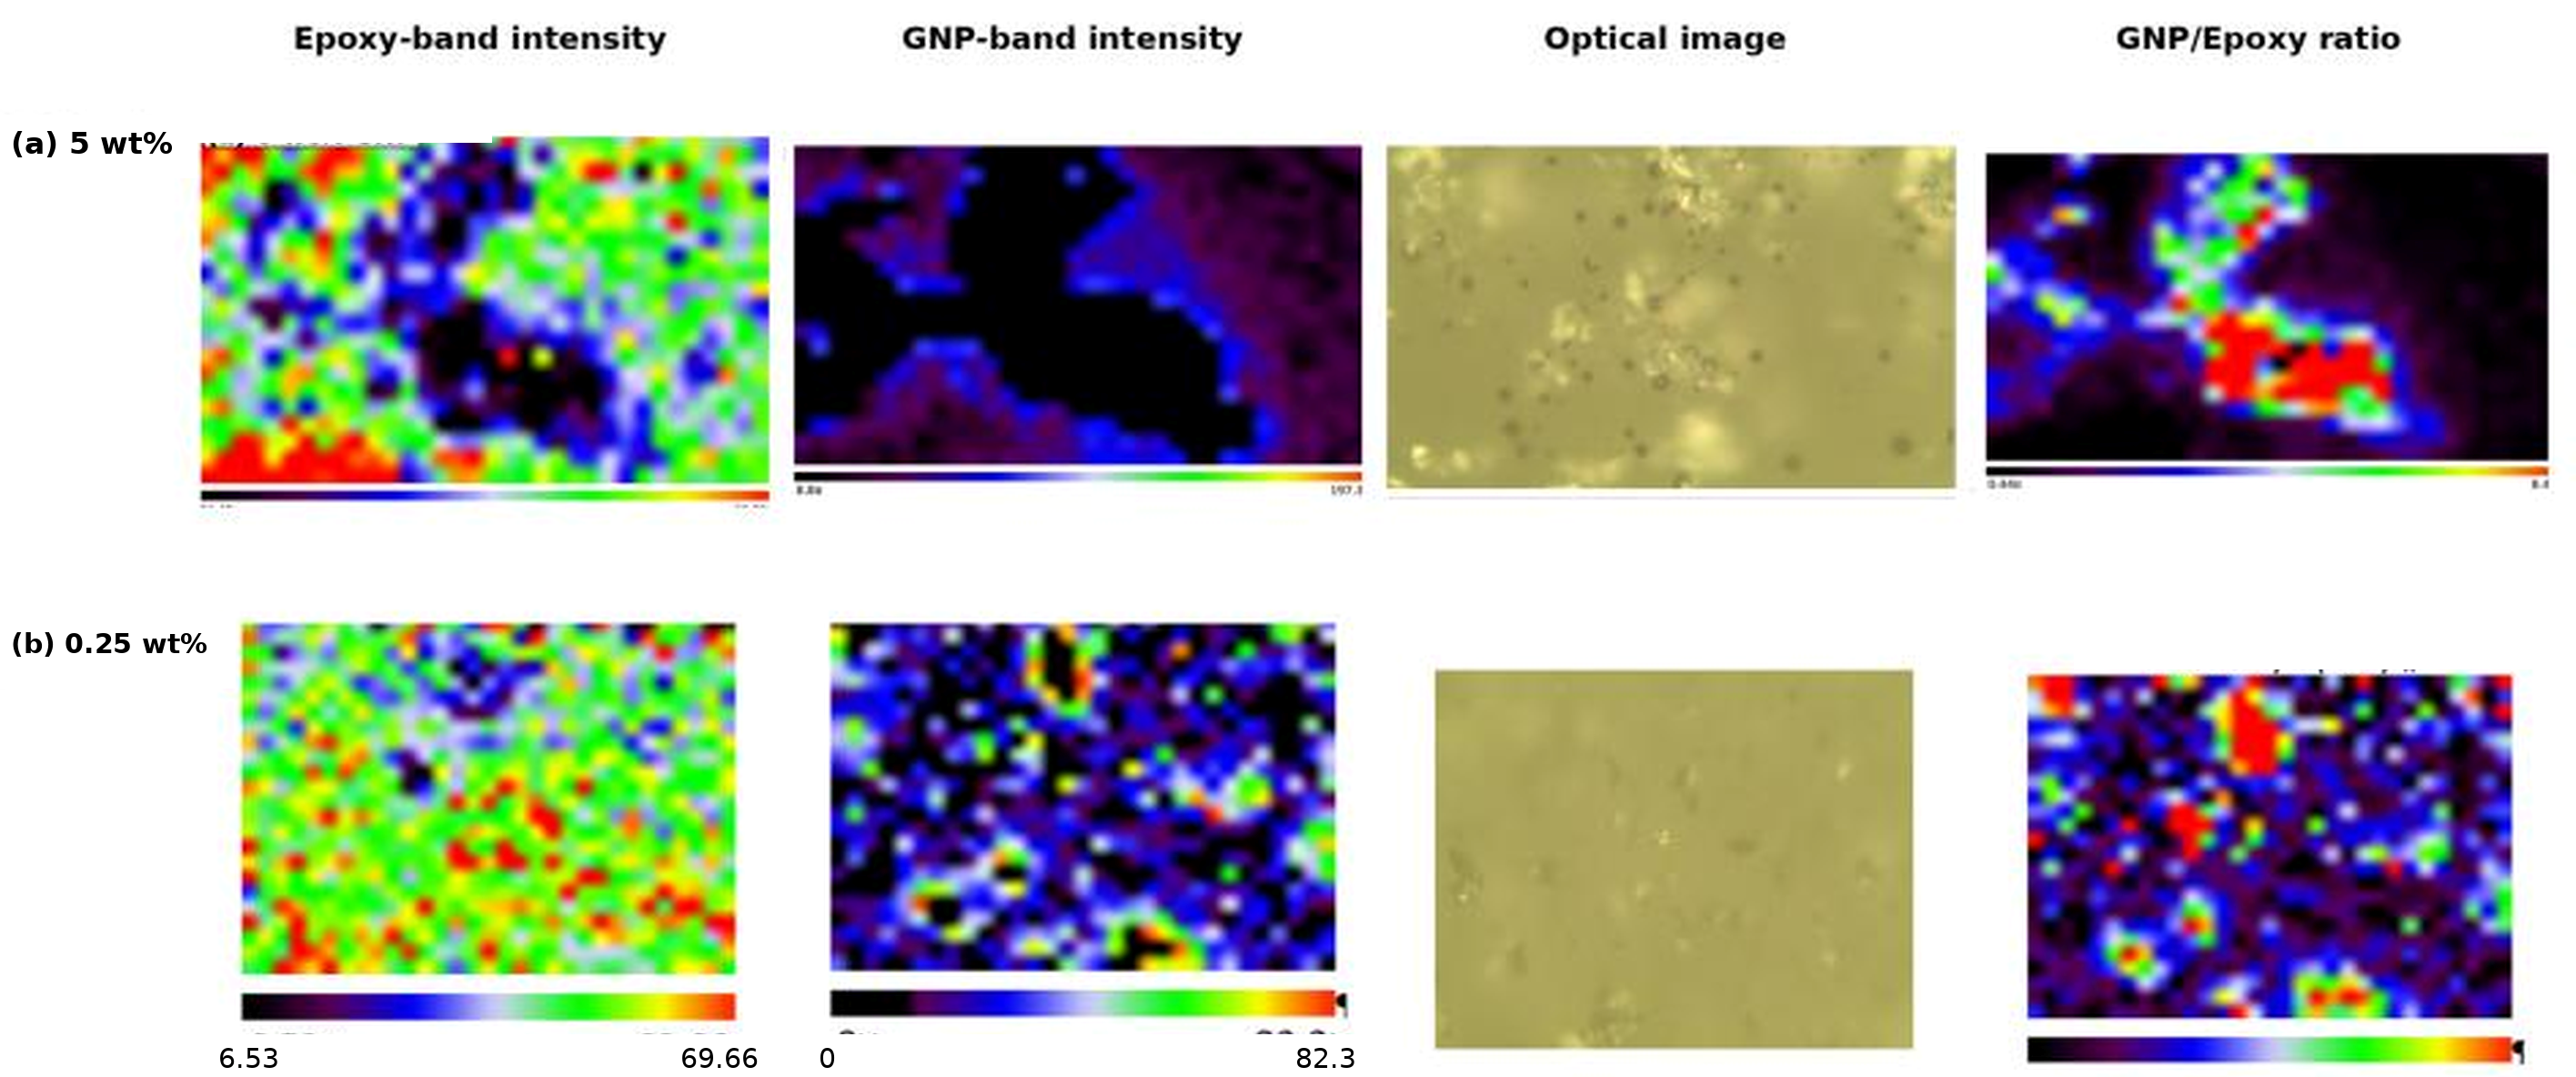
Planar Raman maps show a clear loading-dependent evolution of the GNP spatial distribution within the sampled fields. The nominal 0.25 wt% film contains discrete regions of elevated graphitic-band intensity separated by matrix-dominated areas, whereas the nominal 5 wt% film displays broader, more laterally connected regions and higher local filler-to-matrix intensity ratios (Figure 7). This increased spatial continuity is an experimentally observed structural feature and provides a plausible microstructural context for future transport measurements. It also occurs in the high-loading formulation for which lower same-fixture impedance was observed in the separate bulk-specimen case experiment. Because the Raman maps and impedance experiment probe different specimens and geometries, and because the electrical comparison contains one specimen per condition, the present data do not establish that the mapped domains themselves form an electrically connected transport network. The comparison with ultralow-threshold engineered graphene aerogels [31] is retained only to place network architecture in context, not to assign a threshold to the present composites.
Figure 7.
Planar Raman maps of GNP/epoxy films at (a) nominal 5 wt% and (b) nominal 0.25 wt%. For each loading, the panels show the epoxy-associated intensity, GNP-associated intensity, optical field, and GNP/epoxy intensity ratio. Acquisition-specific colour scales are retained and are not converted into absolute volume fraction; interpretation applies to the sampled fields.
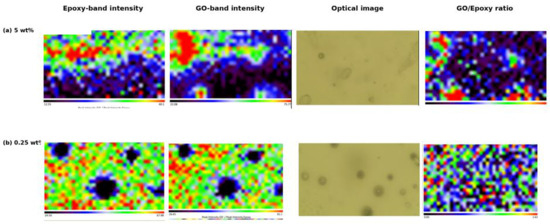
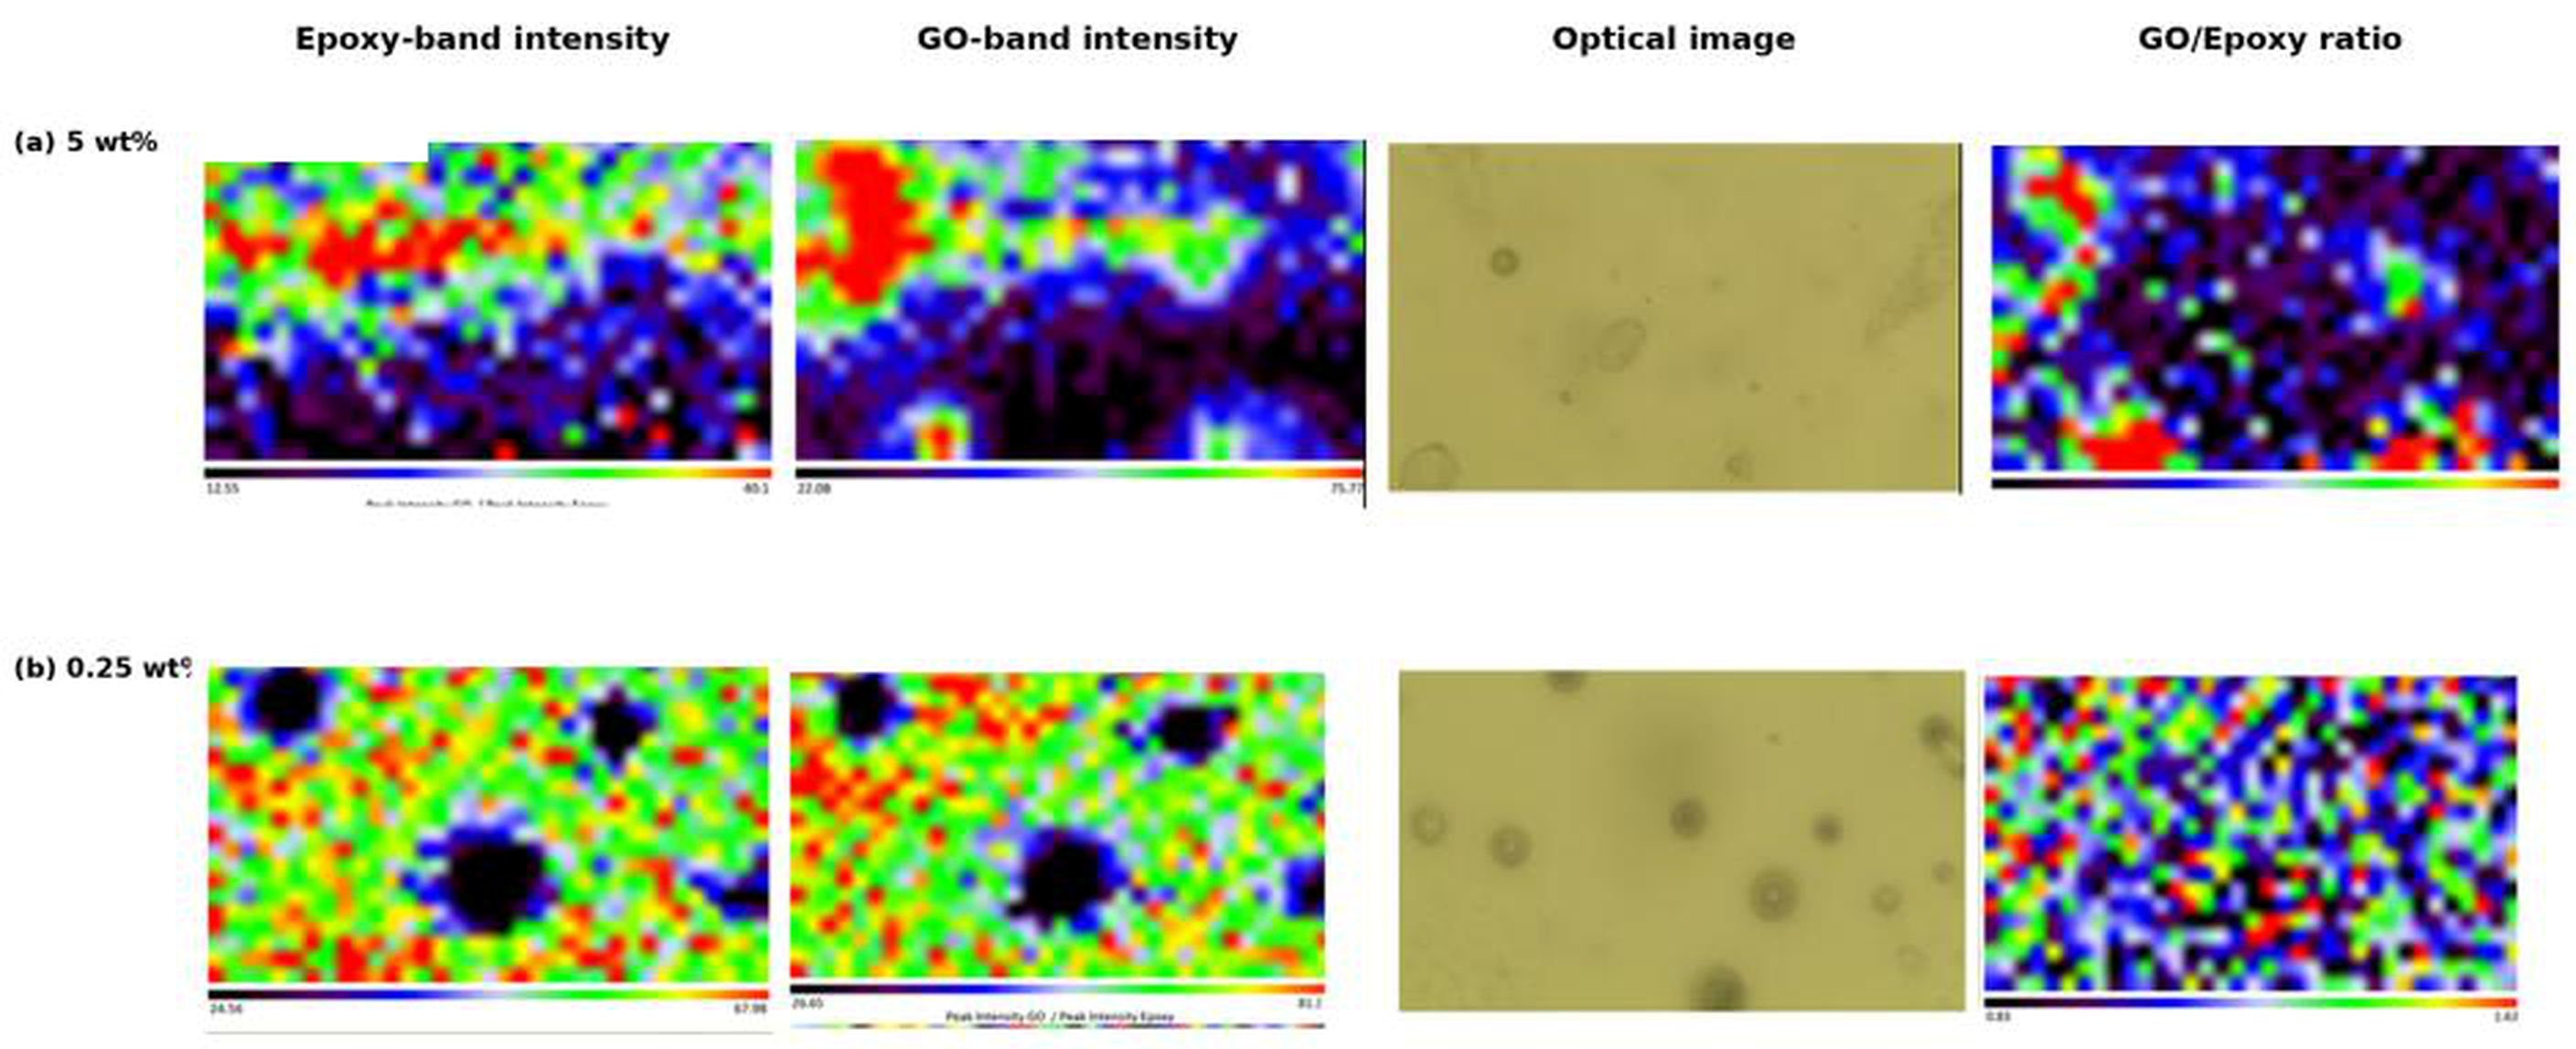
The GO maps show the same loading-dependent progression within the sampled fields (Figure 8). At nominal 0.25 wt%, GO-associated intensity is concentrated in separated local domains, whereas the nominal 5 wt% film contains broader regions with elevated GO-to-epoxy intensity ratios. Optical micrographs confirm local morphological heterogeneity, but Raman-active GO is distributed across the mapped fields rather than confined to a single macroscopic inclusion. The results therefore support distributed incorporation of GO together with loading-dependent growth and interconnection of GO-rich domains within the sampled fields.
Figure 8.
Planar Raman maps of GO/epoxy films at (a) nominal 5 wt% and (b) nominal 0.25 wt%. Each group shows the epoxy-associated intensity, GO-associated intensity, optical field, and GO/epoxy intensity ratio. The maps provide relative spatial contrast within the sampled fields rather than calibrated concentration.
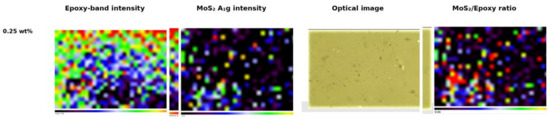
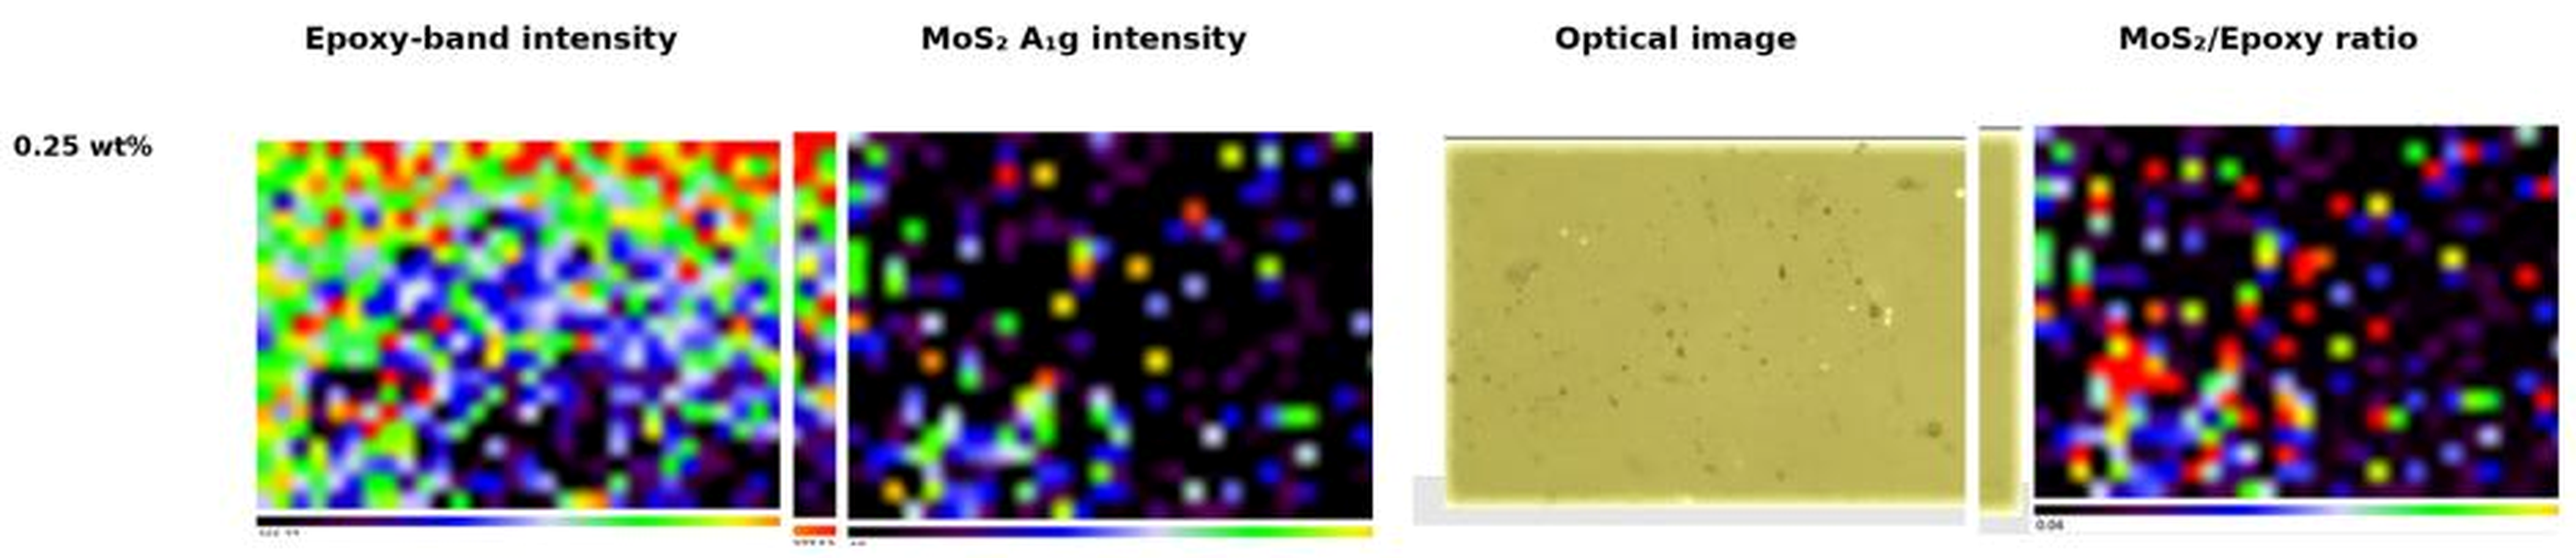
For MoS2, the available nominal 0.25 wt% planar map shows multiple spatially separated A1g-rich regions within the sampled field of the epoxy matrix (Figure 9). Their distribution across that field confirms that the MoS2 signal does not arise from a single isolated surface deposit in the mapped area. A matched nominal 5 wt% planar map was not retained in the archived dataset. The cross-sectional maps available at both endpoint formulations are therefore discussed separately as local depth-resolved observations; they are not treated as a substitute for the missing matched planar comparison.
Figure 9.
Planar Raman map of the nominal 0.25 wt% MoS2/epoxy film, showing epoxy-associated intensity, MoS2 A1g-associated intensity, the optical field, and the MoS2/epoxy intensity ratio within the sampled field. A matched nominal 5 wt% planar map was not retained in the archived dataset.
Overall, the planar maps show a transition from predominantly isolated filler-rich domains at low nominal loading to larger, network-like regions at high nominal loading for the matched GNP and GO datasets within the sampled fields. This trend is visible independently in the filler-band images and in the filler-to-matrix ratio maps. Absolute filler-rich area fractions, domain-size distributions, and inter-domain distances are not reported because the original acquisitions use local intensity scaling and Raman intensity is not a direct volume-fraction calibration. Applying a common post hoc segmentation threshold would therefore create artificial precision. The robust same-geometry structural result is the increase in domain extent and lateral overlap with nominal loading in the matched GNP and GO sampled fields.
Cross-sectional mapping extends the planar analysis by resolving Raman response from above the apparent surface into selected local coating fields. Filler-associated signals are detected below the nominal surface for all three filler families, establishing subsurface Raman-active domains within the sampled cross-sections rather than superficial contamination at those locations. The maps also reveal lateral and depth-dependent heterogeneity within the selected fields, as expected for platelet-based composites formed by shear mixing, sonication, and spin coating.
For GNP, the nominal 5 wt% sampled cross-section contains laterally extended regions of elevated graphitic signal and a broad filler-to-matrix ratio response (Figure 10a), whereas the nominal 0.25 wt% sampled cross-section is dominated by narrower, spatially separated features (Figure 10b). Within these mapped fields, the higher nominal loading clearly produces greater lateral overlap of Raman-active graphitic domains through the sampled coating depth. Apparent vertical dimensions are broadened by the optical point-spread function and uncertainty in locating the exact surface; the maps therefore establish subsurface presence and relative continuity within the sampled regions rather than exact platelet dimensions or whole-film statistics.
Figure 10.
Cross-sectional Raman maps of GNP/epoxy films at (a) nominal 5 wt% and (b) nominal 0.25 wt%. The columns show epoxy-associated intensity, GNP-associated intensity, and the GNP/epoxy intensity ratio as functions of lateral position and nominal depth. The comparison describes the selected local cross-sectional fields and is not a whole-film statistical measurement.
GO shows a similarly systematic difference within the sampled cross-sectional fields (Figure 11). The nominal 5 wt% field contains broad, contiguous regions of GO-associated intensity, whereas the nominal 0.25 wt% field is dominated by separated local maxima. Persistence of the GO signal below the nominal surface confirms subsurface incorporation through the sampled depth. Local differences between matrix and GO maps reflect both composition and optical factors, while the greater lateral continuity at nominal 5 wt% is reproduced in both the intensity and ratio maps within the selected fields.
Figure 11.
Cross-sectional Raman maps of GO/epoxy films at (a) nominal 5 wt% and (b) nominal 0.25 wt%. The columns show epoxy-associated intensity, GO-associated intensity, and the GO/epoxy intensity ratio. Reduced laser power was used for GO-containing specimens to limit local damage. The comparison describes the selected local cross-sectional fields.
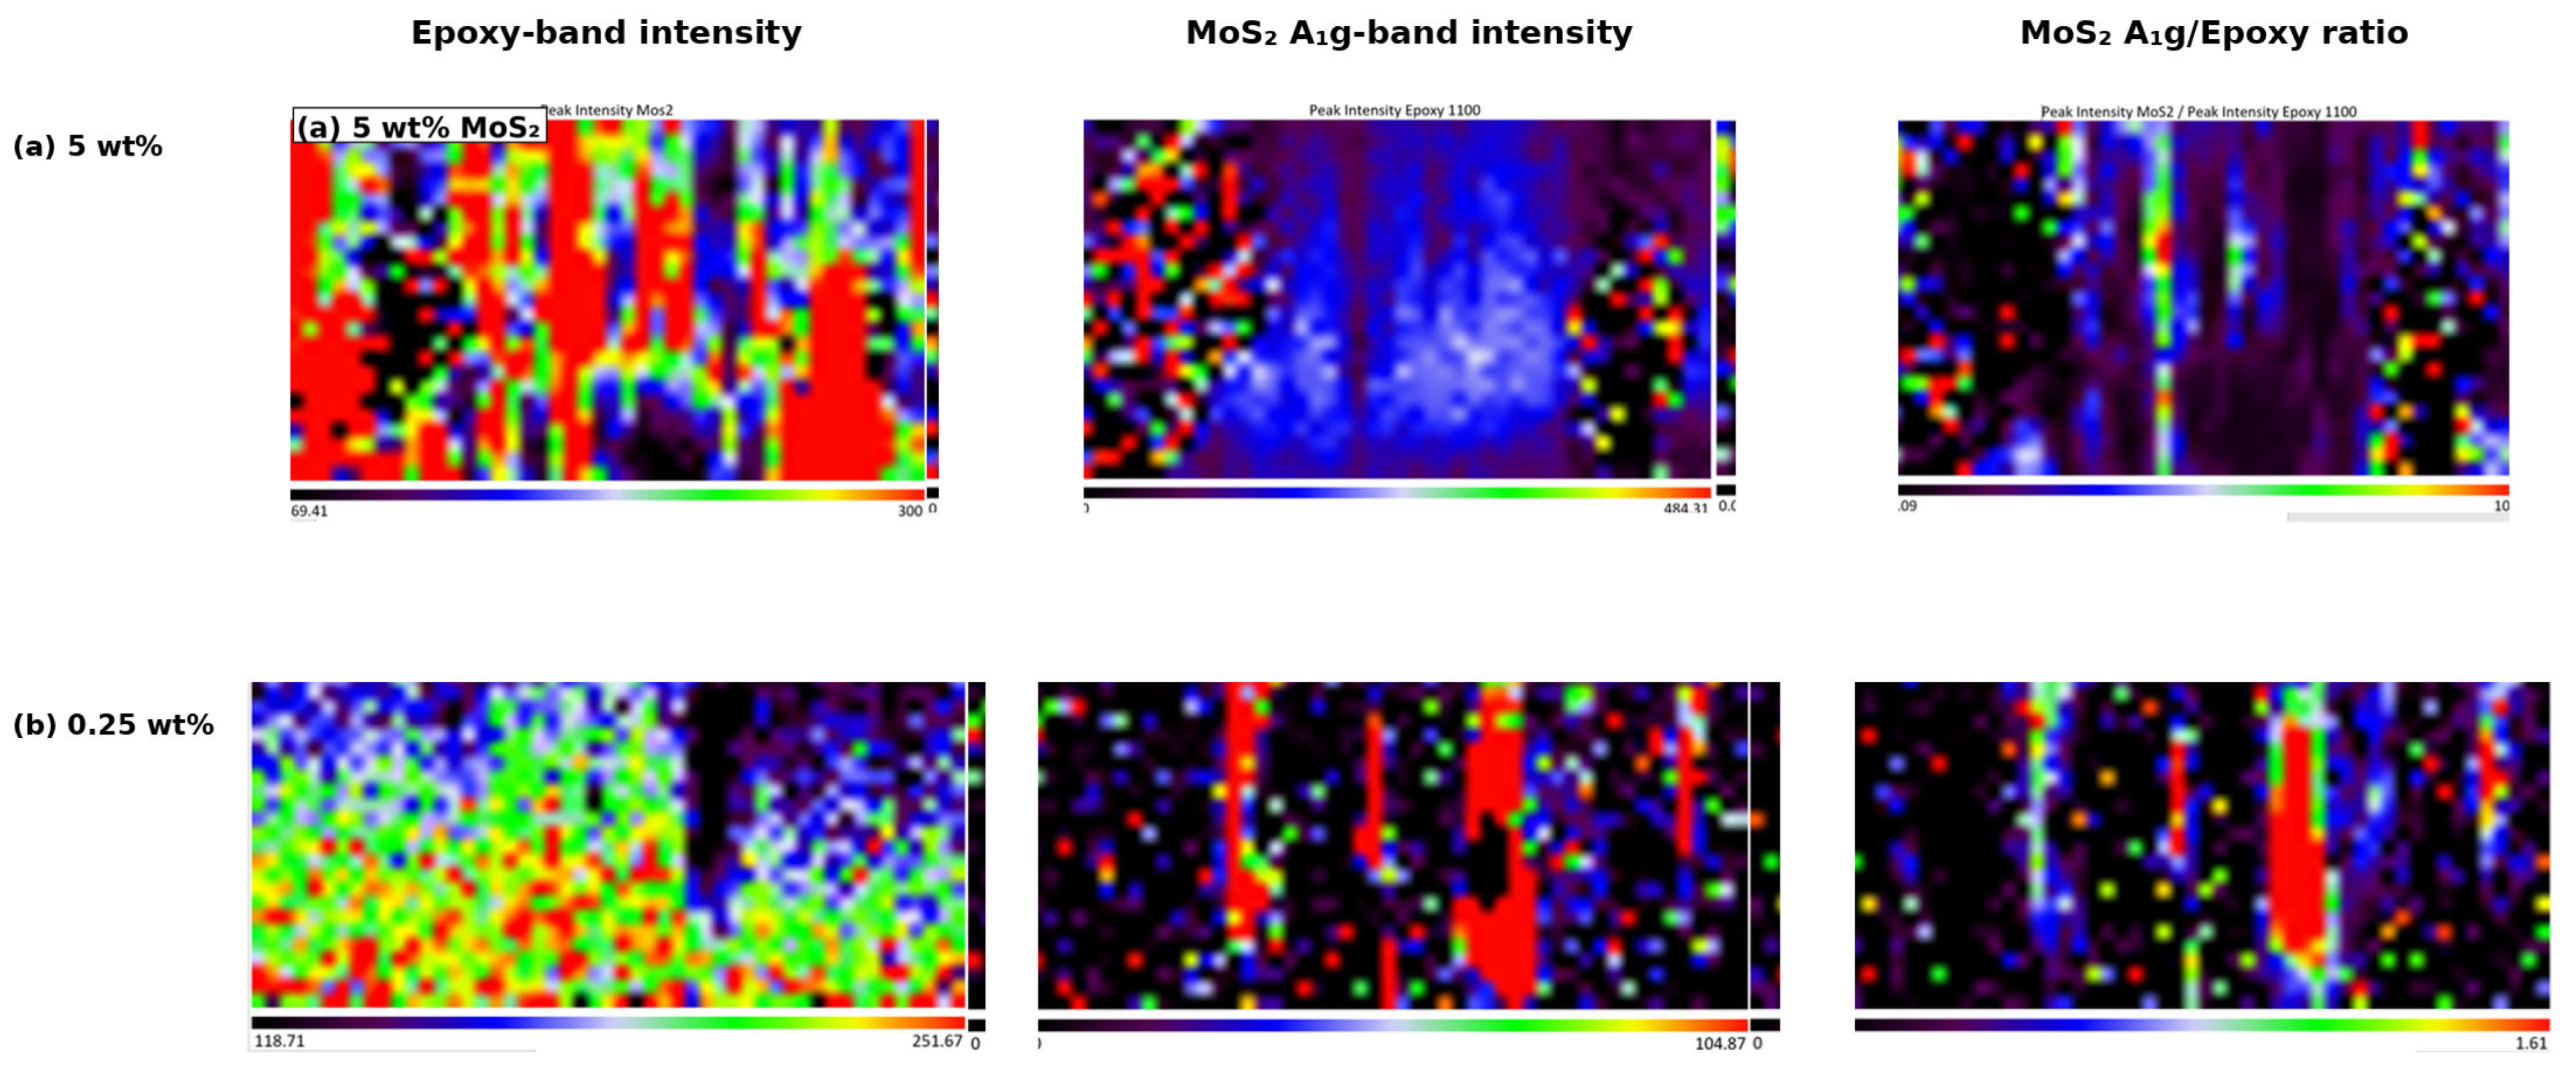
The MoS2 cross-sectional dataset provides depth-resolved observations at both endpoint formulations but is not treated as equivalent to the missing planar pair (Figure 12). In the sampled nominal 0.25 wt% cross-section, A1g-rich regions appear as discrete local features; in the sampled nominal 5 wt% cross-section, Raman-active regions are more numerous and extend over larger lateral distances. Filler-associated signal is detected below the nominal surface at both endpoint formulations, directly establishing subsurface incorporation at the mapped locations rather than a purely superficial deposit. Because MoS2 is substantially denser than the epoxy matrix and the formulations were rested for approximately 30 min before the 40 °C treatment, density-driven vertical redistribution remains a plausible contributor. The observed local difference therefore should not be extrapolated to a whole-film loading-dependent concentration profile, and a quantitative sedimentation gradient cannot be excluded. Related epoxy studies show that appropriately dispersed MoS2 nanostructures can support mechanical, barrier, thermal, tribological, and piezoresistive functions [20,32,33,34].
Figure 12.
Cross-sectional Raman maps of MoS2/epoxy films at (a) nominal 5 wt% and (b) nominal 0.25 wt%. The columns show epoxy-associated intensity, MoS2 A1g-associated intensity, and the MoS2/epoxy intensity ratio. Both endpoint formulations are represented by selected local cross-sectional fields in the archived dataset; these maps are not whole-film concentration profiles.
The combined planar and cross-sectional datasets establish a coherent structural picture across the sampled Raman fields. All three fillers retain their characteristic Raman signatures and are detected below the apparent film surface at the mapped locations. For GNP and GO, the matched planar datasets show greater domain extent and lateral overlap at nominal 5 wt%, while the cross-sectional maps confirm subsurface filler signatures. For MoS2, the cross-sectional maps establish subsurface incorporation at both endpoint formulations, although possible sedimentation prevents extrapolation of the local cross-sectional difference to a unique whole-film loading trend. No single macroscopic filler-rich phase dominates the sampled fields. These observations support the effectiveness of the filler-specific processing routes in distributing Raman-active domains through the films and provide a microstructural basis for subsequent quantitative electrical, dielectric, sensing, coating, or structural measurements.
Raman spectroscopy and mapping provide mutually reinforcing evidence of successful filler incorporation and loading-dependent spatial organization where matched datasets are available. The extended spectra verify the chemical identity and structural persistence of GNP, GO, and MoS2 after processing. The matched GNP and GO planar maps show that higher nominal loading enlarges and increases the lateral overlap of filler-rich domains within the sampled fields, while cross-sectional maps establish subsurface Raman-active filler signatures for all three systems. The stable matrix-associated peak ratio in the GO series further supports retention of the epoxy spectral fingerprint. Together, the data define a processing–structure model in which the fillers remain chemically recognizable and, for the matched GNP and GO datasets, develop greater spatial continuity as nominal loading increases from 0.25 to 5 wt%. A systematic comparison of processing demand, spectroscopic and spatial response, and functional interpretation across the three filler systems is provided in Table 5.
Table 5.
Systematic comparison of the three filler systems based on the present processing and characterization dataset.
3.6. Relation to the Companion Dielectric Study
The present article and the companion dielectric study [21] originate from the same broader experimental campaign but address different questions using different measurements. The present work focuses on preparation history, low-frequency contact sensitivity, film thickness, vibrational signatures, and spatial Raman distribution. Bulk specimens containing 22 wt% A1 were used for low-frequency fixture screening, whereas thin films containing 8 wt% A1 were prepared to retain coatability for thickness and spectroscopic analysis. These formulation differences are explicitly retained because they are part of the processing–structure problem and the two specimen families are not treated as interchangeable.
The companion article [21] is restricted to broadband coaxial transmission/reflection measurements, complex-permittivity extraction, moisture-related effects, and the metrological limits of that measurement chain. None of its coaxial permittivity figures, effective-medium calculations, or moisture modelling is reproduced here. Conversely, the present fixture-screening sequence, ATR-FTIR concentration series, Raman fingerprints, and planar/depth-resolved maps are not part of the dielectric article. The two papers are therefore complementary rather than duplicate partitions of the same analysis.
The present results also explain why a simple monotonic relation between nominal filler loading and an electrical or dielectric quantity should not be assumed without adequate controls. Film thickness and spatial organization vary with processing; surface-contact impedance can be dominated by the electrode interface; retained GNP content after filtration is nominal rather than analytically verified; and conditioning or cure state can influence polymer response. The resulting hierarchy of controls for future quantitative transport studies is clear: matched formulation and geometry, verified current injection, independent specimen replicates, controlled conditioning, actual filler-content verification when processing can remove material, and microstructural characterization at the location being measured.
3.7. Applicability, Limitations and Outlook
The dataset provides a practical processing and characterization baseline for coating, sensing, dielectric, and electrically functional epoxy systems in which 2D-filler organization and contact geometry strongly influence measured performance. The comparison highlights clear filler-specific behaviour: GO was processed without the additional sonication required for GNP and MoS2; high nominal GNP loading produced the strongest rheological and film-thickness response together with the clearest increase in graphitic spatial continuity in the matched Raman fields; and MoS2 remained spectroscopically detectable below the coating surface at both endpoint formulations despite the possibility of density-driven redistribution.
The principal scope limitations are incomplete traceability of the commercial GO and MoS2 grades and size distributions, lack of DSC/Tg verification of cure state, nominal rather than post-processing filler-content verification, condition-dependent small-n film-thickness replication, one specimen per condition in the final embedded-contact electrical comparison, one selected film per formulation for ATR-FTIR, local rather than whole-sample Raman maps, and the missing nominal 5 wt% planar MoS2 map. These constraints bound the level of inference but do not diminish the directly observed processing, spectral, spatial-organization, and same-fixture electrical results. Future work should combine independent batches with mass-balanced filler verification, rheology, DSC/Tg, calibrated SEM/EDS or quantitative Raman segmentation, and replicated four-/two-probe or embedded-electrode transport measurements across the full concentration series.
4. Conclusions
This study establishes a comparative processing–structure–measurement framework for epoxy nanocomposites containing GNP, GO, and MoS2 over 0.25–5 wt% nominal loading. Filler-specific processing was essential: GNP and MoS2 required pulsed sonication plus planetary mixing, GO was processed by planetary mixing alone, and the nominal 5 wt% GNP formulation required temporary isopropanol. Film-thickness data from independently prepared coatings show that the higher nominal GNP-loading formulation produced the clearest increase in mean thickness, consistent with a stronger rheological and platelet-interaction penalty during spin coating. ATR-FTIR retained the epoxy fingerprint and oxygen-rich GO contribution, while 532 nm Raman spectroscopy verified the characteristic GNP, GO, and MoS2 structural signatures after processing.
The low-frequency measurements demonstrate that contact geometry is itself a controlling experimental variable in highly resistive composites. Under identical embedded-contact conditions, the specimen prepared from the nominal 5 wt% GNP formulation showed markedly lower impedance than neat epoxy, with a median |Z_GNP|/|Z_epoxy| ratio near 0.16 over the common frequency range. The persistence of this contrast across a broad frequency interval provides a clear electrical distinction between the two tested specimens under matched contact conditions. Because the protocol was applied to one specimen per condition, the result is retained as a specimen-level comparison rather than generalized as a bulk material property; its physical origin cannot be assigned uniquely, and it is not used to calculate bulk conductivity or a numerical percolation threshold.
Planar and cross-sectional Raman maps provide the complementary structural result. For the matched GNP and GO planar datasets, nominal 0.25 wt% films are dominated by separated filler-rich regions whereas nominal 5 wt% films show greater lateral overlap and network-like spatial continuity in the mapped areas. For GNP, this spatial evolution provides a physically relevant microstructural context for the separately observed same-fixture impedance contrast, while the present data do not require a unique electrical mechanism to establish that structural trend. For MoS2, depth maps directly demonstrate subsurface incorporation at both endpoint formulations; possible density-driven redistribution means that the difference between the two sampled cross-sections is not extrapolated to a whole-film concentration profile. Taken together, the evidence supports the central claim that nominal filler content must be interpreted together with dispersion route, viscosity history, spatial organization, and measurement contact. These controls provide a strong foundation for subsequent quantitative transport, dielectric, sensing, and coating studies on the same material platform.
Funding
The author acknowledges partial support from the Romanian PNRR project, Investment I8, “Composite materials for applications in the water management field” (contract No. 760270/26.03.2024). This work is supported in part by the Italian Ministry for University and Research (MUR) through the FISA-Fondo Italiano per le Scienze Applicate, 2023 call, project FISA-2023-00229 “Advanced Composite Nanomaterials for Water Management”.
Data Availability Statement
The experimental data supporting this study are available from the corresponding author upon reasonable request. The broadband coaxial permittivity dataset and its analysis are reported separately in Ref. [21] and are not part of the present article.
Acknowledgments
The participation of Giulia Penné in the early stages of this work is gratefully acknowledged.
Conflicts of Interest
Author Stefano Bellucci was employed by the company Qi S.r.l. The author declares that the research was conducted in the absence of any commercial or financial relationships that could be construed as a potential conflict of interest.
References
- Knight, M.; Curliss, D. Composite Materials. In Encyclopedia of Physical Science and Technology, 3rd ed.; Academic Press: Cambridge, MA, USA, 2003. [Google Scholar]
- Ahmadi, Z. Epoxy in nanotechnology: A short review. Prog. Org. Coat. 2019, 132, 445–448. [Google Scholar] [CrossRef] [Scilit]
- Wei, J.; Vo, T.; Inam, F. Epoxy/graphene nanocomposites—Processing and properties: A review. RSC Adv. 2015, 5, 73510–73524. [Google Scholar] [CrossRef] [Scilit]
- Atif, R.; Shyha, I.; Inam, F. Mechanical, Thermal, and Electrical Properties of Graphene-Epoxy Nanocomposites—A Review. Polymers 2016, 8, 281. [Google Scholar] [CrossRef] [Scilit]
- Dabrowska, A.; Bellucci, S.; Cataldo, A.; Micciulla, F.; Huczko, A. Nanocomposites of epoxy resin with graphene nanoplates and exfoliated graphite: Synthesis and electrical properties. Phys. Status Solidi (B) 2014, 251, 2599–2602. [Google Scholar] [CrossRef] [Scilit]
- Plyushch, A.; Macutkevic, J.; Kuzhir, P.; Banys, J.; Bychanok, D.; Lambin, P.; Bistarelli, S.; Cataldo, A.; Micciulla, F.; Bellucci, S. Electromagnetic properties of graphene nanoplatelets/epoxy composites. Compos. Sci. Technol. 2016, 128, 75–83. [Google Scholar] [CrossRef] [Scilit]
- Collado, I.; Jiménez-Suárez, A.; Moriche, R.; Del Rosario, G.; Prolongo, S.G. Electrical, Thermo-Electrical, and Electromagnetic Behaviour of Epoxy Composites Reinforced with Graphene Nanoplatelets with Different Average Surface Area. Polymers 2022, 14, 5520. [Google Scholar] [CrossRef] [Scilit]
- Wang, X.; Xing, W.; Feng, X.; Song, L.; Hu, Y. MoS2/Polymer Nanocomposites: Preparation, Properties, and Applications. Polym. Rev. 2016, 57, 440–466. [Google Scholar] [CrossRef] [Scilit]
- Abdelal, N.; Dib, N.; Young, D.; Slanker, A. Electromagnetic interference shielding and dielectric properties of graphene nanoplatelets/epoxy composites in the x-band frequency range. J. Mater. Sci. 2022, 57, 13928–13944. [Google Scholar] [CrossRef] [Scilit]
- Potts, J.R.; Dreyer, D.R.; Bielawski, C.W.; Ruoff, R.S. Graphene-based polymer nanocomposites. Polymer 2011, 52, 5–25. [Google Scholar] [CrossRef] [Scilit]
- A Rafiee, M.; Rafiee, J.; Wang, Z.; Song, H.; Yu, Z.-Z.; Koratkar, N. Enhanced Mechanical Properties of Nanocomposites at Low Graphene Content. ACS Nano 2009, 3, 3884–3890. [Google Scholar] [CrossRef] [Scilit]
- Ghaleb, Z.; Mariatti, M.; Ariff, Z. Properties of graphene nanopowder and multi-walled carbon nanotube-filled epoxy thin-film nanocomposites for electronic applications: The effect of sonication time and filler loading. Compos. Part A Appl. Sci. Manuf. 2014, 58, 77–83. [Google Scholar] [CrossRef] [Scilit]
- Monti, M.; Rallini, M.; Puglia, D.; Peponi, L.; Torre, L.; Kenny, J. Morphology and electrical properties of graphene–epoxy nanocomposites obtained by different solvent assisted processing methods. Compos. Part A Appl. Sci. Manuf. 2013, 46, 166–172. [Google Scholar] [CrossRef] [Scilit]
- Wu, S.; Ladani, R.B.; Zhang, J.; Bafekrpour, E.; Ghorbani, K.; Mouritz, A.P.; Kinloch, A.J.; Wang, C.H. Aligning multilayer graphene flakes with an external electric field to improve multifunctional properties of epoxy nanocomposites. Carbon 2015, 94, 607–618. [Google Scholar] [CrossRef] [Scilit]
- Amirova, L.; Surnova, A.; Balkaev, D.; Musin, D.; Amirov, R.; Dimiev, A.M. Homogeneous Liquid Phase Transfer of Graphene Oxide into Epoxy Resins. ACS Appl. Mater. Interfaces 2017, 9, 11909–11917. [Google Scholar] [CrossRef] [Scilit]
- An, J.; Zhang, Y.; Zhang, X.; He, M.; Zhou, J.; Zhou, J.; Liu, Y.; Chen, X.; Hu, Y.; Song, X.; et al. Structure and Properties of Epoxy Resin/Graphene Oxide Composites Prepared from Silicon Dioxide-Modified Graphene Oxide. ACS Omega 2024, 9, 17577–17591. [Google Scholar] [CrossRef] [Scilit]
- Bergseth, Z.; Qi, X.; Wang, X. A study on graphene nanoplatelet dispersion methods and their effects on coating abrasion resistance and surface properties. Prog. Org. Coat. 2024, 189, 108352. [Google Scholar] [CrossRef] [Scilit]
- Louis, S.; Arukula, R.; Yang, D.; Kim, T.; Wu, X.; Qi, X. Effects of dispersion methods on dynamic and thermal mechanical properties of GNP–epoxy nanocomposite coatings. Prog. Org. Coat. 2026, 210, 109652. [Google Scholar] [CrossRef] [Scilit]
- Shchegolkov, A.V.; Shchegolkov, A.V.; Kaminskii, V.V. Carbon Nanotubes and Graphene in Polymer Composites for Strain Sensors: Synthesis, Functionalization, and Application. J. Compos. Sci. 2026, 10, 43. [Google Scholar] [CrossRef] [Scilit]
- Ravi, P.; Katiyar, J.K.; Shravan Kumar, C. Physico-tribocorrosion performance of epoxy/MoS2 nanocomposite coating. Mater. Today Commun. 2025, 42, 111219. [Google Scholar] [CrossRef] [Scilit]
- Bellucci, S. Critical Assessment of Dielectric Permittivity Measurements in Epoxy Nanocomposites Based on Two-Dimensional Fillers. Discov. Polym. 2026. [Google Scholar] [CrossRef] [Scilit]
- Seretis, G.; Theodorakopoulos, I.; Manolakos, D.; Provatidis, C. Effect of sonication on the mechanical response of graphene nanoplatelets/glass fabric/epoxy laminated nanocomposites. Compos. Part B Eng. 2018, 147, 33–41. [Google Scholar] [CrossRef] [Scilit]
- Baig, Z.; Mamat, O.; Mustapha, M.; Mumtaz, A.; Munir, K.S.; Sarfraz, M. Investigation of tip sonication effects on structural quality of graphene nanoplatelets (GNPs) for superior solvent dispersion. Ultrason. Sonochem. 2018, 45, 133–149. [Google Scholar] [CrossRef] [Scilit]
- Liu, Y.; Hamon, A.-L.; Haghi-Ashtiani, P.; Reiss, T.; Fan, B.; He, D.; Bai, J. Quantitative Study of Interface/Interphase in Epoxy/Graphene-Based Nanocomposites by Combining STEM and EELS. ACS Appl. Mater. Interfaces 2016, 8, 34151–34158. [Google Scholar] [CrossRef] [Scilit]
- Ferrari, A.C.; Meyer, J.C.; Scardaci, V.; Casiraghi, C.; Lazzeri, M.; Mauri, F.; Piscanec, S.; Jiang, D.; Novoselov, K.S.; Roth, S.; et al. Raman spectrum of graphene and graphene layers. Phys. Rev. Lett. 2006, 97, 187401. [Google Scholar] [CrossRef] [Scilit]
- Ni, Z.; Wang, Y.; Yu, T.; Shen, Z. Raman spectroscopy and imaging of graphene. Nano Res. 2008, 1, 273–291. [Google Scholar] [CrossRef] [Scilit]
- Claramunt, S.; Varea, A.; López-Díaz, D.; Velázquez, M.M.; Cornet, A.; Cirera, A. The Importance of Interbands on the Interpretation of the Raman Spectrum of Graphene Oxide. J. Phys. Chem. C 2015, 119, 10123–10129. [Google Scholar] [CrossRef] [Scilit]
- Li, H.; Zhang, Q.; Yap, C.C.R.; Tay, B.K.; Edwin, T.H.T.; Olivier, A.; Baillargeat, D. From Bulk to Monolayer MoS2: Evolution of Raman Scattering. Adv. Funct. Mater. 2012, 22, 1385–1390. [Google Scholar] [CrossRef] [Scilit]
- Ibrahim, W.L.; Öper, M.; Şar, H.; Ay, F.; Perkgöz, N.K. Evolution of Raman and photoluminescence spectral characteristics of monolayer CVD-MoS2 over a wide temperature range. Vib. Spectrosc. 2022, 123, 103443. [Google Scholar] [CrossRef] [Scilit]
- Tumino, F.; D’agosta, P.; Russo, V.; Bassi, A.L.; Casari, C.S. Raman Spectroscopy of 2D MoS2 Interacting with Metals. Crystals 2023, 13, 1271. [Google Scholar] [CrossRef] [Scilit]
- Wang, Z.; Shen, X.; Han, N.M.; Liu, X.; Wu, Y.; Ye, W.; Kim, J.-K. Ultralow Electrical Percolation in Graphene Aerogel/Epoxy Composites. Chem. Mater. 2016, 28, 6731–6741. [Google Scholar] [CrossRef] [Scilit]
- Najmi, P.; Keshmiri, N.; Ramezanzadeh, M.; Ramezanzadeh, B.; Arjmand, M. Epoxy nanocomposites holding molybdenum disulfide decorated with covalent organic framework: All-in-one coatings featuring thermal, UV-shielding, and mechanical properties. Compos. Part B Eng. 2023, 260, 110785. [Google Scholar] [CrossRef] [Scilit]
- Riaz, S.; Park, S.-J. A comparative study on nanoinclusion effect of MoS2 nanosheets and MoS2 quantum dots on fracture toughness and interfacial properties of epoxy composites. Compos. Part A Appl. Sci. Manuf. 2021, 146, 106419. [Google Scholar] [CrossRef] [Scilit]
- Dong, M.; Bilotti, E.; Zhang, H.; Boland, C.S.; Papageorgiou, D.G. High performing piezoresistive MoS2/epoxy strain sensors for structural health monitoring. Polymer 2024, 309, 127449. [Google Scholar] [CrossRef] [Scilit]

Disclaimer/Publisher’s Note: The statements, opinions and data contained in all publications are solely those of the individual author(s) and contributor(s) and not of MDPI and/or the editor(s). MDPI and/or the editor(s) disclaim responsibility for any injury to people or property resulting from any ideas, methods, instructions or products referred to in the content. |
© 2026 by the author. Licensee MDPI, Basel, Switzerland. This article is an open access article distributed under the terms and conditions of the Creative Commons Attribution (CC BY) license.