


Abstract
The SnO2-TiO2 binary nanocomposites’ metal oxide was synthesized by a co-precipitation method and potentially utilized for wastewater treatment applications. The average crystallite size, dislocation density, and micro strain of the synthesized nanocomposites were calculated by the Debye–Scherrer, modified Debye–Scherrer, and W–H methods. The nanocomposites exhibit a tetragonal crystal structure with 62% crystallinity. The presence of Ti–O–Ti and Sn–O–Sn bonds was identified using the FTIR technique. The surface morphology was examined during SEM and EDAX analyses. The optical properties were interpreted with the help of UV–Vis and PL spectroscopy, and the bandgap energy was ascertained. From the CV and EIS studies, the behavior of the diffusive and capacitive natures was determined. Photocatalytic studies were carried out under sunlight and UV light by degrading (cationic) malachite dye at concentrations of 10, 20, and 40 mg/L. When analyzed with seven kinetic models, it was inferred that a pseudo-second and first-order were followed under visible and UV light. The maximum degradation efficiency of 94% was achieved for the 20 mg/L dye concentration within 50 min under UV and 150 min under solar irradiation. Complete decolorization was observed for both 10 mg/L and 20 mg/L dye concentrations under both irradiations.
1. Introduction
Metal oxide nanoparticles show great photocatalytic efficiency in several environmental remediation applications. Binary oxide ceramic materials (TiO2, ZnO, Al2O3, SiO2, CeO2, and Fe2O3) are utilized in modern solar cell studies and pave the way for environmentally safe next-generation photovoltaic technologies [1]. The photocatalytic performance of metal oxide nanoparticles like TiO2 and ZnO was explored under various conditions, and numerous parameters were surveyed [2]. SnO2 nanoparticles were utilized in various fields as photocatalysts, with organic pollutant, dye [3,4,5], and supercapacitor [6] applications. The photocatalytic degradation of malachite green was studied [7] for SnO2 nanoparticles, which were potentially used to remove persistent organic pollutants (POPs) [4] and also utilized as sensors [8]. Several routes were employed for the synthesis of SnO2 nanoparticles. A study on the supercapacitive performance of SnO2 quantum dots synthesized by the soft chemical method [9] showed that they had better performance than nanoparticles. A new method was employed for the synthesis of SnO2 nanoparticles at different calcinated temperatures [3]. In the research, 99% efficiency was achieved when degrading malachite green dye and using the Langmuir isotherm model, and pseudo-second-order kinetics were studied. The precipitation method [5], hydrothermal route [10], wet chemical method [11], and electrochemical oxidation method [12] were used as different synthesis methods. The lattice parameters were found by the Nelson–Riley equation, with the results demonstrating the highly crystalline nature of SnO2 nanoparticles produced via the co-precipitation method [8]. The co-precipitation method was employed at different calcinated temperatures (500 °C, 700 °C, and 900 °C), and the researchers observed antimicrobial behavior of nanoparticles [13]. SnO2 nanoparticles show significant antimicrobial activities that can be potentially applied for various utilities [11,13]. Ni-SnO2-TiO2 was synthesized by the one-pot method [14] and showed enhanced photocatalytic performance on methyl orange dye. The TiO2 nanoparticle showed 99.9% MG dye degradation and was the first paper to identify and characterize the intermediates of the process [15]. The sol–gel [16] method was employed for the TiO2 nanoparticle synthesis process used to degrade MG dye. The reaction shows exothermic and negative Gibbs free energy, suggesting that the spontaneous adsorption process happened. Mercury light irradiation was used to achieve 90% degradation of methyl orange dye within 30 min [17], synthesized via the solvothermal method. Various applications like self-cleaning, antibacterial, anticancer therapy [18], photocatalytic [19,20], and targeted drug delivery utilize TiO2 nanoparticles.
SnO2-TiO2 nanocomposites have attracted attention because of their wide range of applications. Diverse synthesis techniques were applied by various researchers. Hassan et al. [21] synthesized SnO2-doped TiO2 nanoparticles via a surface-assisted sol–gel method at different calcination temperatures and observed that there was an increase in crystallite size and phase transformation with an increase in temperature. The anatase to rutile phase transformation occurred between 400–600 °C, with complete transformation at 700 °C, and the highest photocatalytic activity was noted for catalysts calcined at 500 °C. Pham et al. [22] synthesized the TiO2 nanotubes’ heterojunction with SnO2 nanoparticles by a one-step hydrothermal route to ease the synthesis method. SnO2-TiO2 nanocomposites were synthesized using a low-temperature hydrothermal method [23], and it was noted that the composite materials exhibited significant absorption capacity in the UV region while remaining transparent in the visible region. The microwave-assisted method was employed for the synthesis of SnO2, TiO2, and Ti0.5Sn0.5O2 nanoparticles and tested for photocatalytic degradation using Indigo carmine [24]. The SnO2-TiO2 nanocomposites were synthesized using the sol–gel method, and good absorption behavior was observed [25]. The present work focuses on the efficiency of the photocatalyst under two light sources with different concentrations of malachite green dye, mimicking wastewater treatment. Different kinetic models were studied in this work, and the most appropriate model for the reaction was ascertained.
2. Materials and Methods
The co-precipitation method was employed for this synthesis process. All the chemicals and reagents have been obtained from Sigma Aldrich Chemicals Private Limited (Bangalore, India) and are used as such, until unless specified. The SnO2-TiO2 nanocomposites were obtained from the following steps. High-grade TiO2 and SnO2 powders were purchased from The TiO2 sample of 7.987 g (2 M) was taken in a 500 mL beaker containing 50 mL of acetic acid as the precursor material. The beaker was placed in a magnetic stirrer (Model: REMI 1MLH sourced from The Precision Scientific Co. (CBE), Thiruvarur, India) and stirred for 10 min. The prepared solution consisted of 3.767 g (0.5 M) of SnO2 powder with 50 mL of deionized water added dropwise to the precursor mixture. This study was designed to synthesize nanocomposites with a molar ratio of SnO2:TiO2 (1:4) to achieve enhancement in the properties of the TiO2 nanoparticle. The NaOH solution was added to the solution to induce precipitation of the solution. The solution was stirred continuously for 2 h at room temperature. The solution was kept undisturbed overnight, and the precipitated sample was filtered with the help of Wattman filter paper. The collected precipitate was further washed several times using ethanol and deionized water to avoid contamination and reaction byproducts, which could potentially influence the properties of the nanocomposite. The collected precipitate will be placed in a hot air oven for 6 h at 100° C. The dried samples were cooled down and powdered with a mortar and pestle, and washed further to avoid impurities. Then, the sample was placed in a muffle furnace for 1 h at 400 °C, and the desired nanocomposites were obtained. The pure TiO2 nanoparticles were synthesized using the identical procedure, without the SnO2 precursor.
3. Results and Discussion
3.1. XRD Analysis
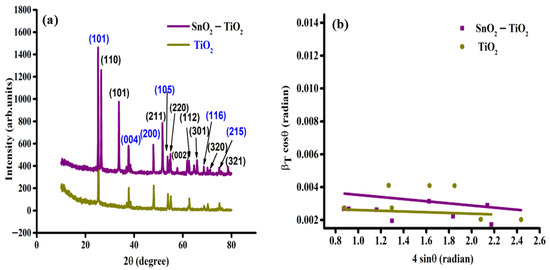
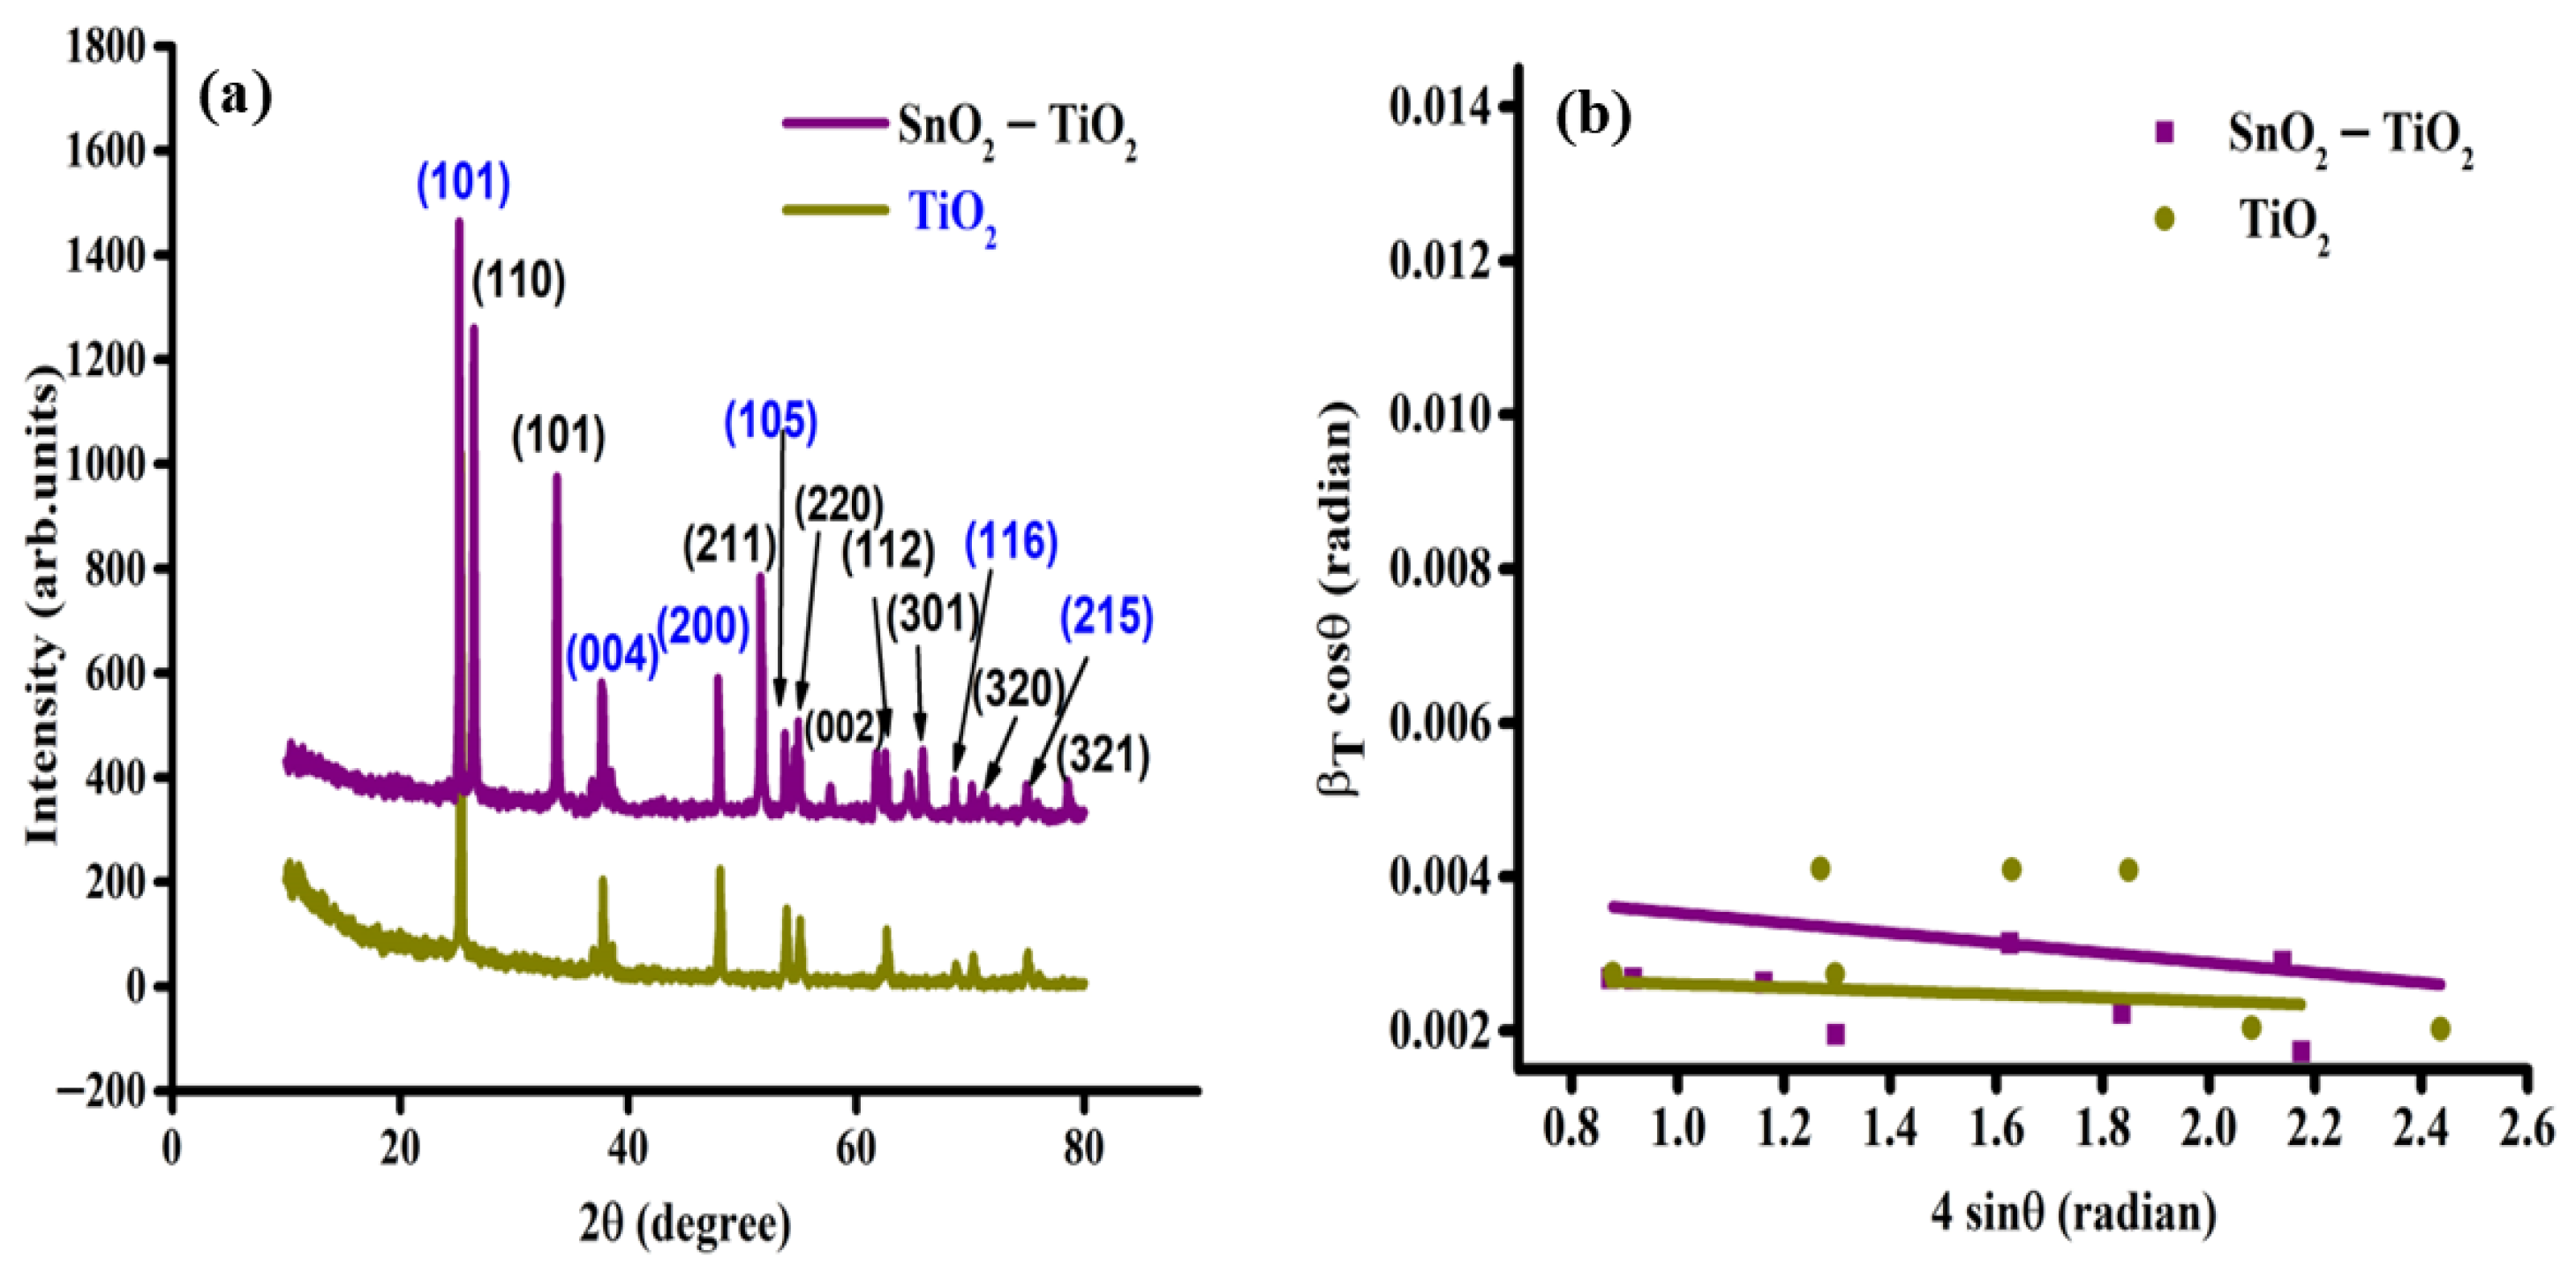
The crystal structure, phase purity, and crystallite size of the synthesized nanomaterial can be ascertained using XRD analysis. The sharp and intense peaks shown in Figure 1a indicate the crystalline nature of the nanocomposite. The peaks observed from the XRD spectra match with previous experimental data, confirming the formation of SnO2-TiO2 nanocomposites.
Figure 1.
(a) XRD peak and (b) W–H plot of TiO2 nanoparticles and SnO2-TiO2 nanocomposite.
The high, intense peaks obtained at the peak positions 25.19°, 37.85°, 47.93°, 53.76°, 68.6°, and 75° confirm the presence of planes (101), (004), (200), (105), (116), and (215) of TiO2 [6,8] of the anatase phase and tetragonal crystal structure. The lattice constant obtained from the calculation was a = b = 3.80 Å, c = 9.50 Å, and α = β = γ = 90°. The rutile phase tetragonal crystal structure of SnO2 with planes (110), (101), (211), (220), (002), (112), (301), (320), and (321) at peak positions 26.47°, 33.76°, 51.67°, 54.65°, 57.75°, 64.65°, 65.85°, 71.21°, and 78.60° [3,21] were matched with these data. The lattice constants for the SnO2 structure were a = b = 4.76 Å, c = 3.19 Å, and α = β = γ = 90°.
The Debye–Scherrer formula (Equation (1)), Modified Debye–Scherrer formula [24,26] (Equation (2)), and W–H method (Equation (3)) were employed to determine the average crystallite size of the SnO2-TiO2 nanocomposite. The dislocation density (δ) and micro strains (ε) were calculated from the Debye–Scherrer method and are given in Equations (4) and (5), and the strain was calculated from the W–H method.
where ‘D’ is the crystallite size, ‘λ’ is the wavelength of the X-rays, which is 1.5405 Å, ‘k’ is the particle factor = 0.94, ‘β’ is the full width half maximum, ‘θ’ is Bragg’s diffraction angle, and ‘βT’ is the total broadening. The average crystallite size of the nanocomposite can be obtained directly from the Debye–Scherrer formula. To obtain more accuracy, the least square linear regression on Equation (2) was performed in the Modified D–S method. From the FWHM and total broadening values, the Williamson–Hall (W–H) method determines the average crystallite size and micro strain of the nanocomposite material. The values obtained for the TiO2 nanoparticles and SnO2-TiO2 nanocomposites are given in Table 1.
βT cosθ = kλD + 4ε sinθ
Table 1.
Parameters ascertained from the XRD data.
The Debye–Scherrer method provides individual peak values, whereas the modified Debye–Scherrer method was opted to minimize the sum of absolute error and promote accuracy by the least square technique [27], and W–H method includes the data of strain broadening and size [28], which was the reason behind the variations in the average crystallite size for these three methods. The compression in the lattice plane can be inferred from the negative value of strain. The crystallinity of the material was studied using the peak area method, and noted 22% for TiO2 nanoparticles and 62% for the nanocomposite. The reduction in crystalline percentage was due to the smaller area of the crystalline peak when compared to the area of the whole peaks (amorphous + crystalline), as it can easily be observed using the XRD plot.
3.2. FTIR Analysis
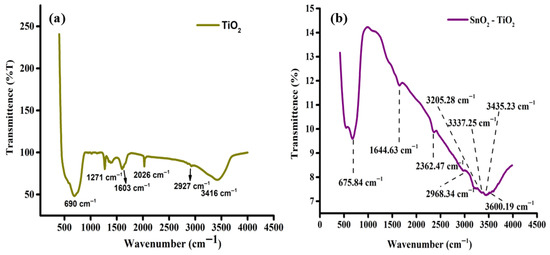
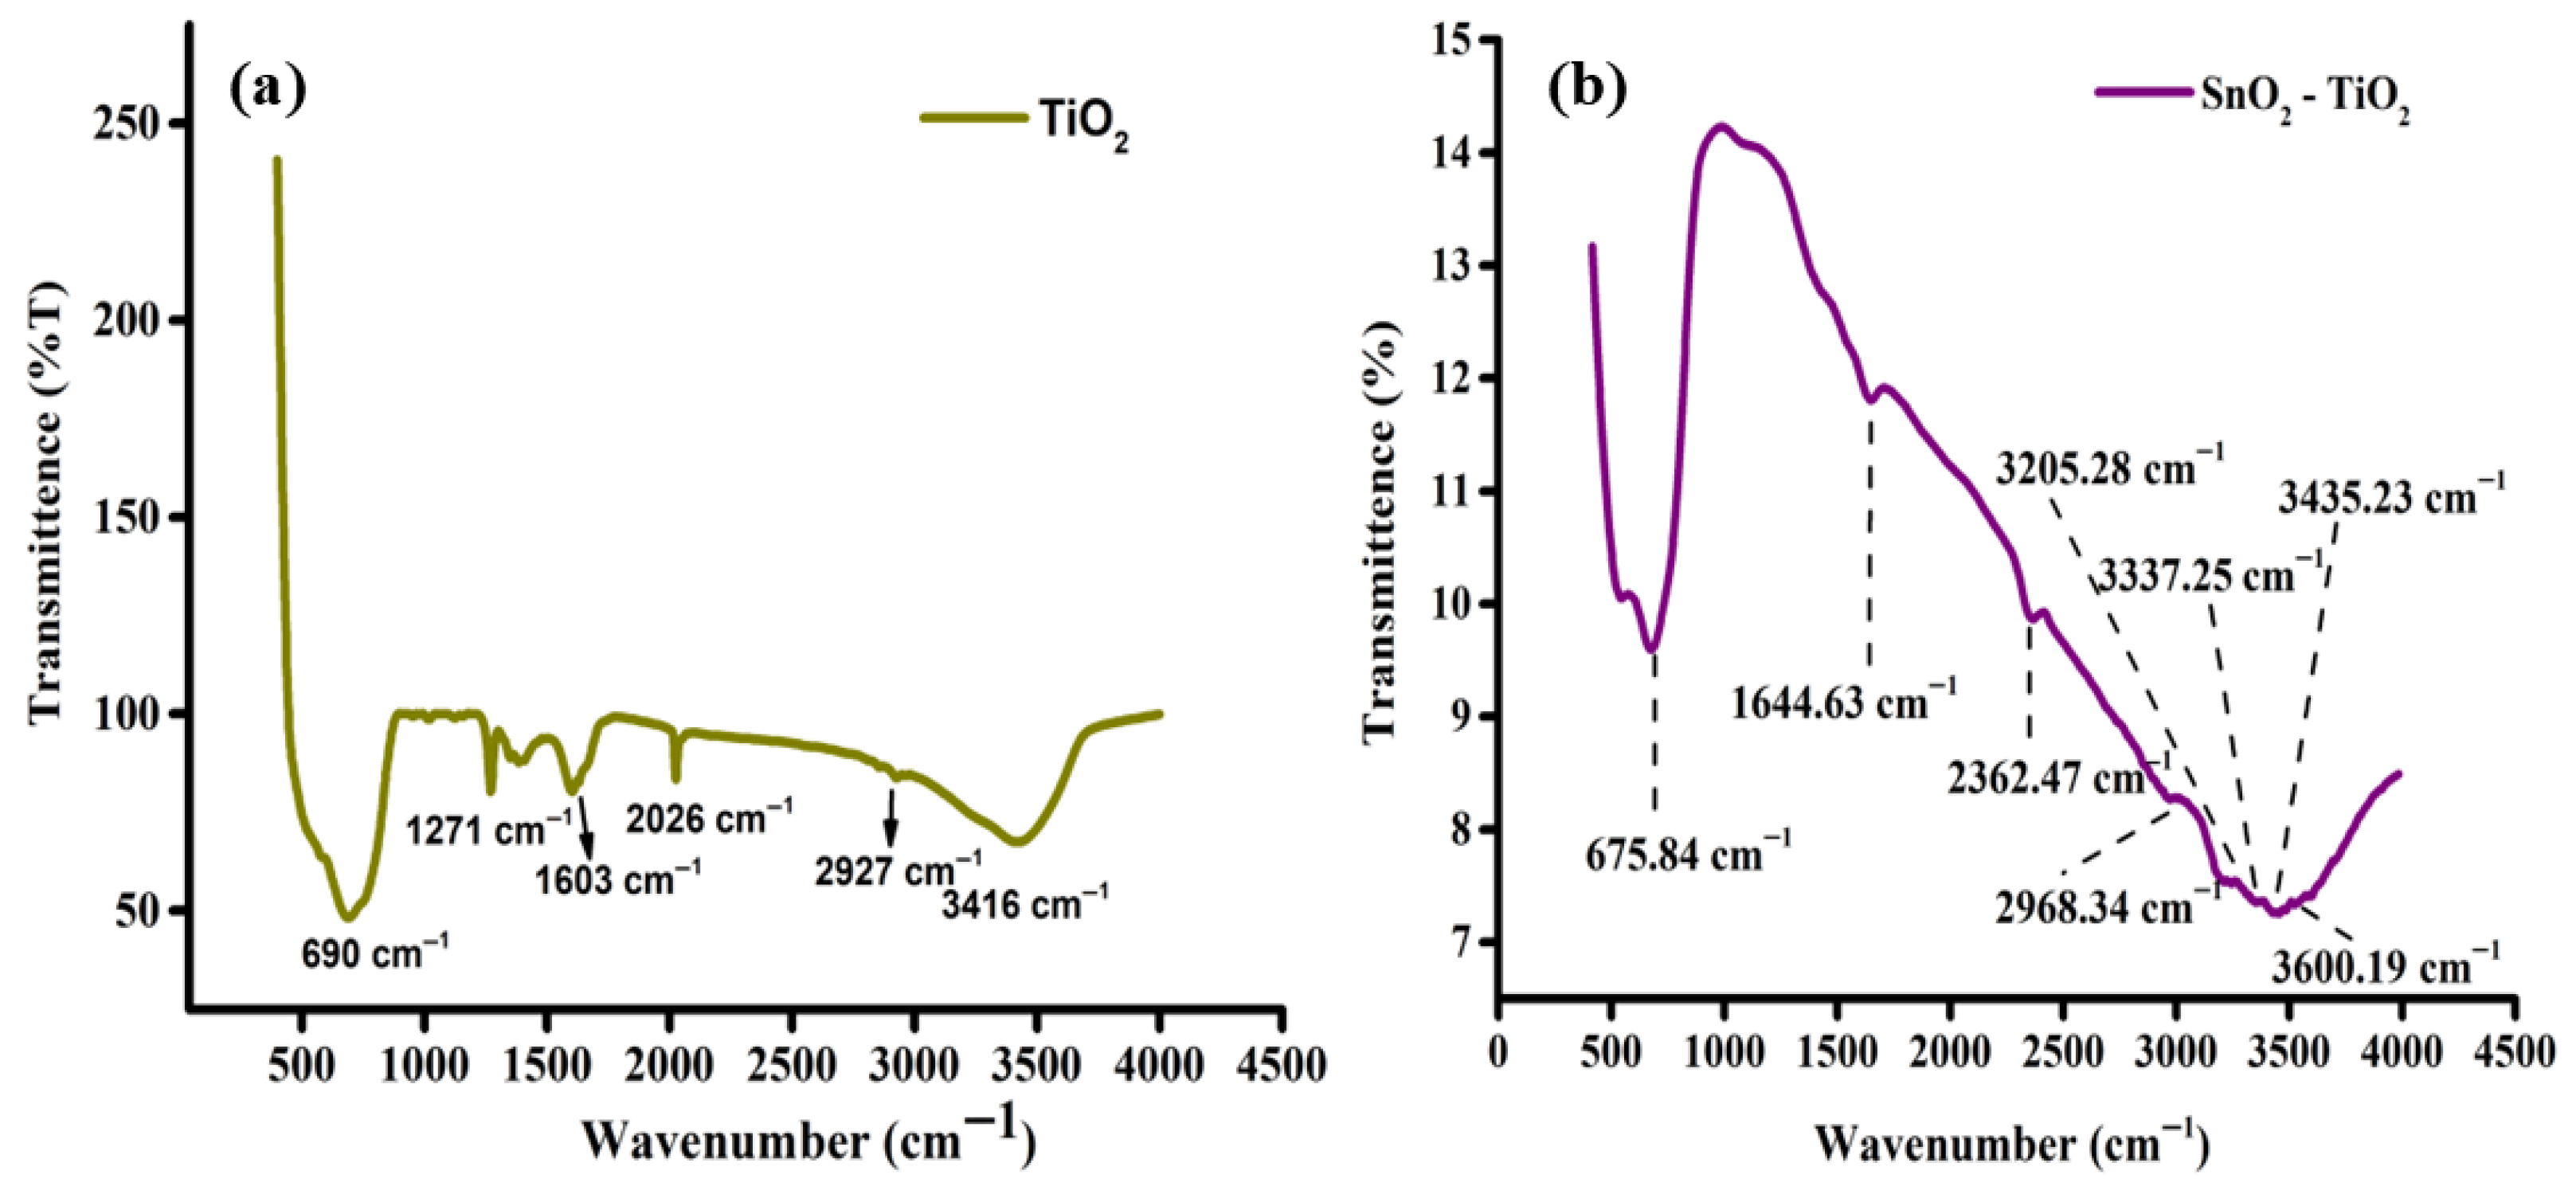
The FTIR spectra of TiO2 nanoparticles and SnO2-TiO2 nanocomposites in the range of 500–4500 cm−1 are illustrated in Figure 2a,b. The presence of functional materials was observed with the help of the FTIR spectra. The strong peaks were observed due to the stretching vibrations of the Ti-O-Ti and Sn-O-Sn molecules at 690 cm−1 and 675.84 cm−1.
Figure 2.
FTIR spectra of (a) TiO2 nanoparticles and (b) SnO2-TiO2 nanocomposite.
The types of vibrations observed for the materials are listed in Table 2. The bending vibrations were observed between 1600–1650 cm−1 due to the adsorption of water molecules on the surface of metal oxides. The bonds present at the peaks of 2026, 2927, 2362.47, and 2968.34 cm−1 were due to the presence of an aliphatic compound with stretching vibrations, which remained non-volatile due to the less calcinated temperature during the synthesis process.
Table 2.
Parameters calculated from the FTIR spectra.
The stretching vibration of hydroxyl groups on the surface of the nanocomposites was responsible for the presence of a broad peak near 3000–3600 cm−1. The presence of a hydroxyl group (OH at 1600–1650 cm−1 and 3000–3600 cm−1) on the surface of the nanocomposite promotes photocatalytic performance by retarding the recombination of free radicals [29], thus enhancing the rate of the reaction. The adsorption of water molecules on the surface tends to increase the hydrophilicity and photocatalytic response [30] when illuminated under light radiation.
3.3. SEM & EDS Analysis
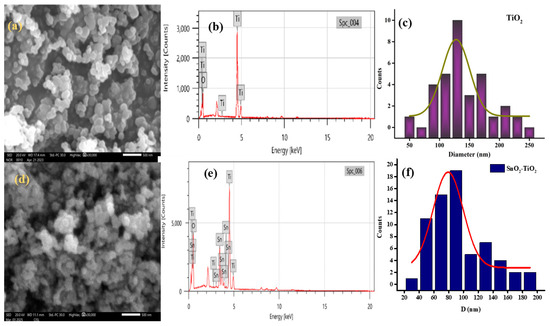
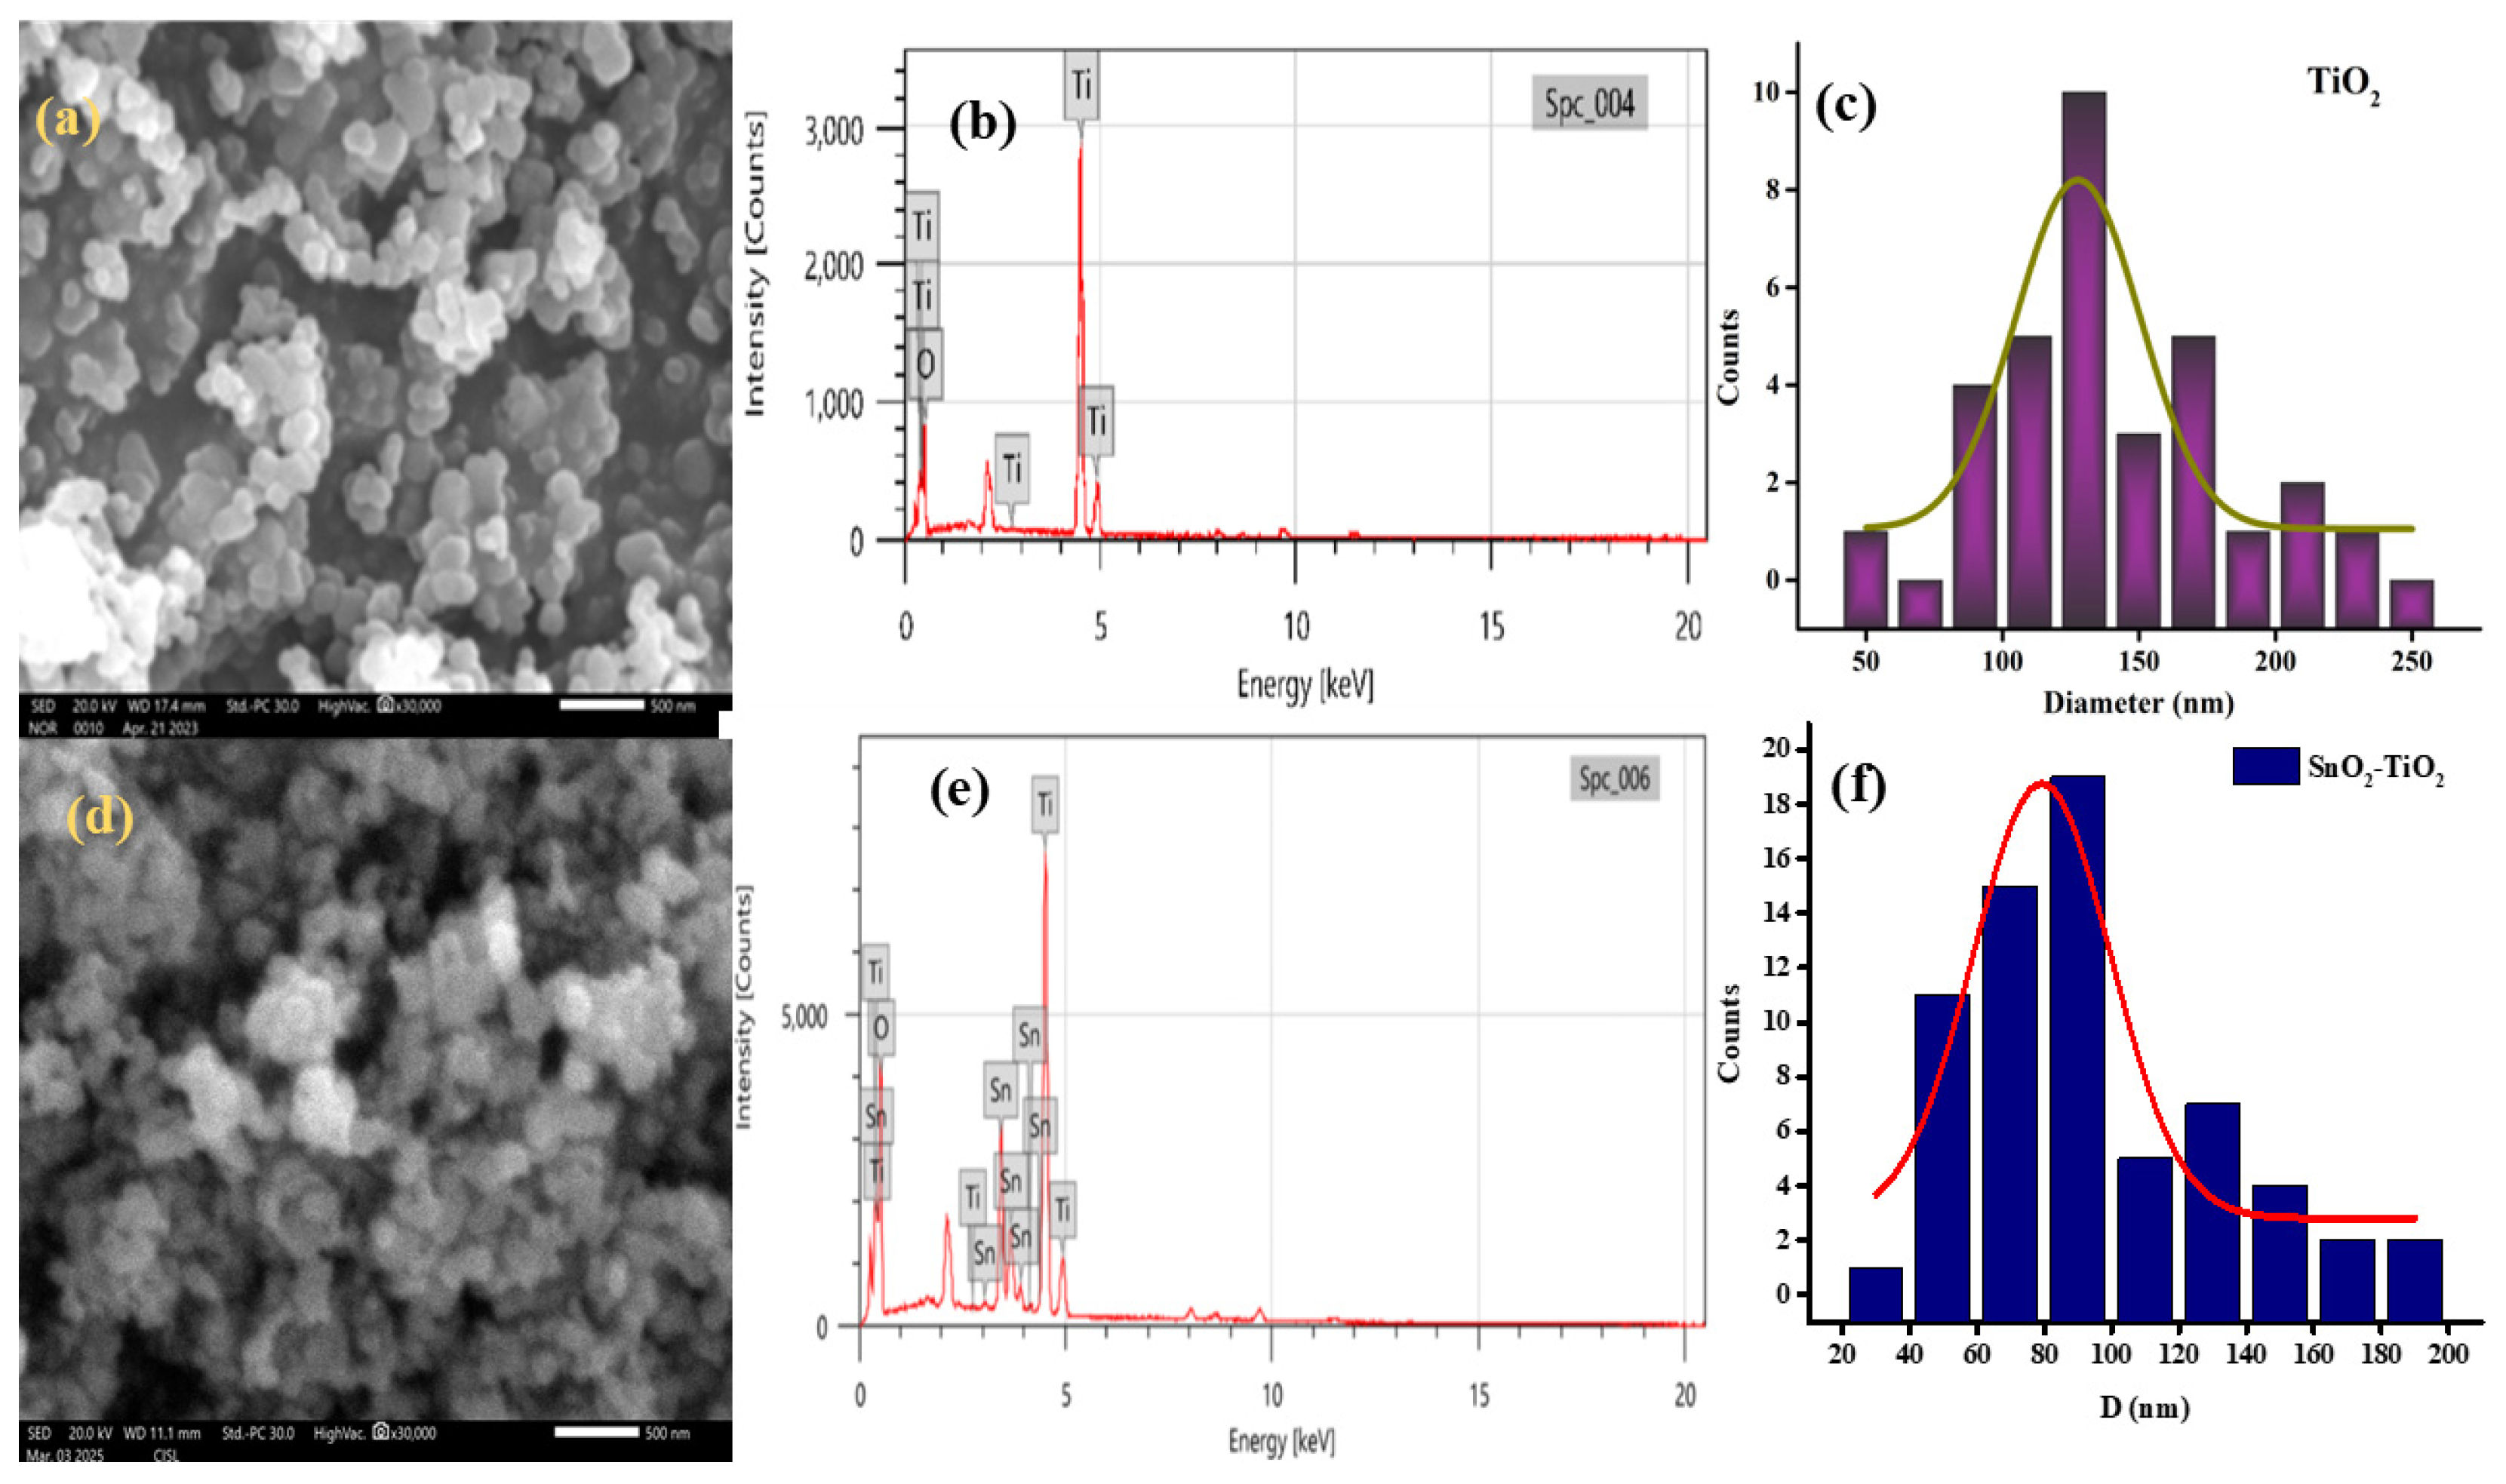
The surface morphology of the TiO2 nanoparticles and SnO2-TiO2 nanocomposite was studied with the aid of SEM micrographs, which are shown in Figure 3a,d of various magnifications and ranges.
Figure 3.
(a,d) SEM micrograph, (b,e) EDS spectra, (c,f) particle size distribution of TiO2 nanoparticles and SnO2-TiO2 nanocomposite.
The SnO2-TiO2 nanocomposites were agglomerated in the form of clusters of varied size distributions [26]. The particles were nearly spherical in structure and had a particle size range from 39 nm to 192 nm. The particle size distribution of the nanocomposites was studied using a Gauss fit, given in Figure 3e, and the average particle size obtained was 79.27 nm for the nanocomposites and 127 nm for the TiO2 nanoparticles. The smaller size of the reduced nanocomposites will enhance photocatalytic activity by improving the charge transfer rate [31]. The EDS analysis, shown in Figure 3b,e, confirms that the synthesized nanocomposites only consist of Ti, Sn, and O elements without any byproducts. The atomic % of the elements composed of nanocomposites were 76.20% of O, 18.65% of Ti, 5.16% of Sn, 70% of O, and 30% of Ti in pure nanoparticles.
3.4. UV–Vis Spectrometer Analysis
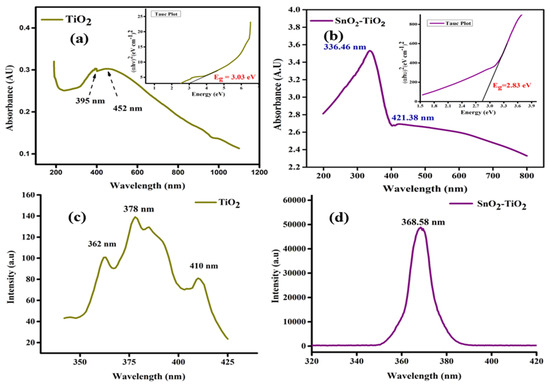
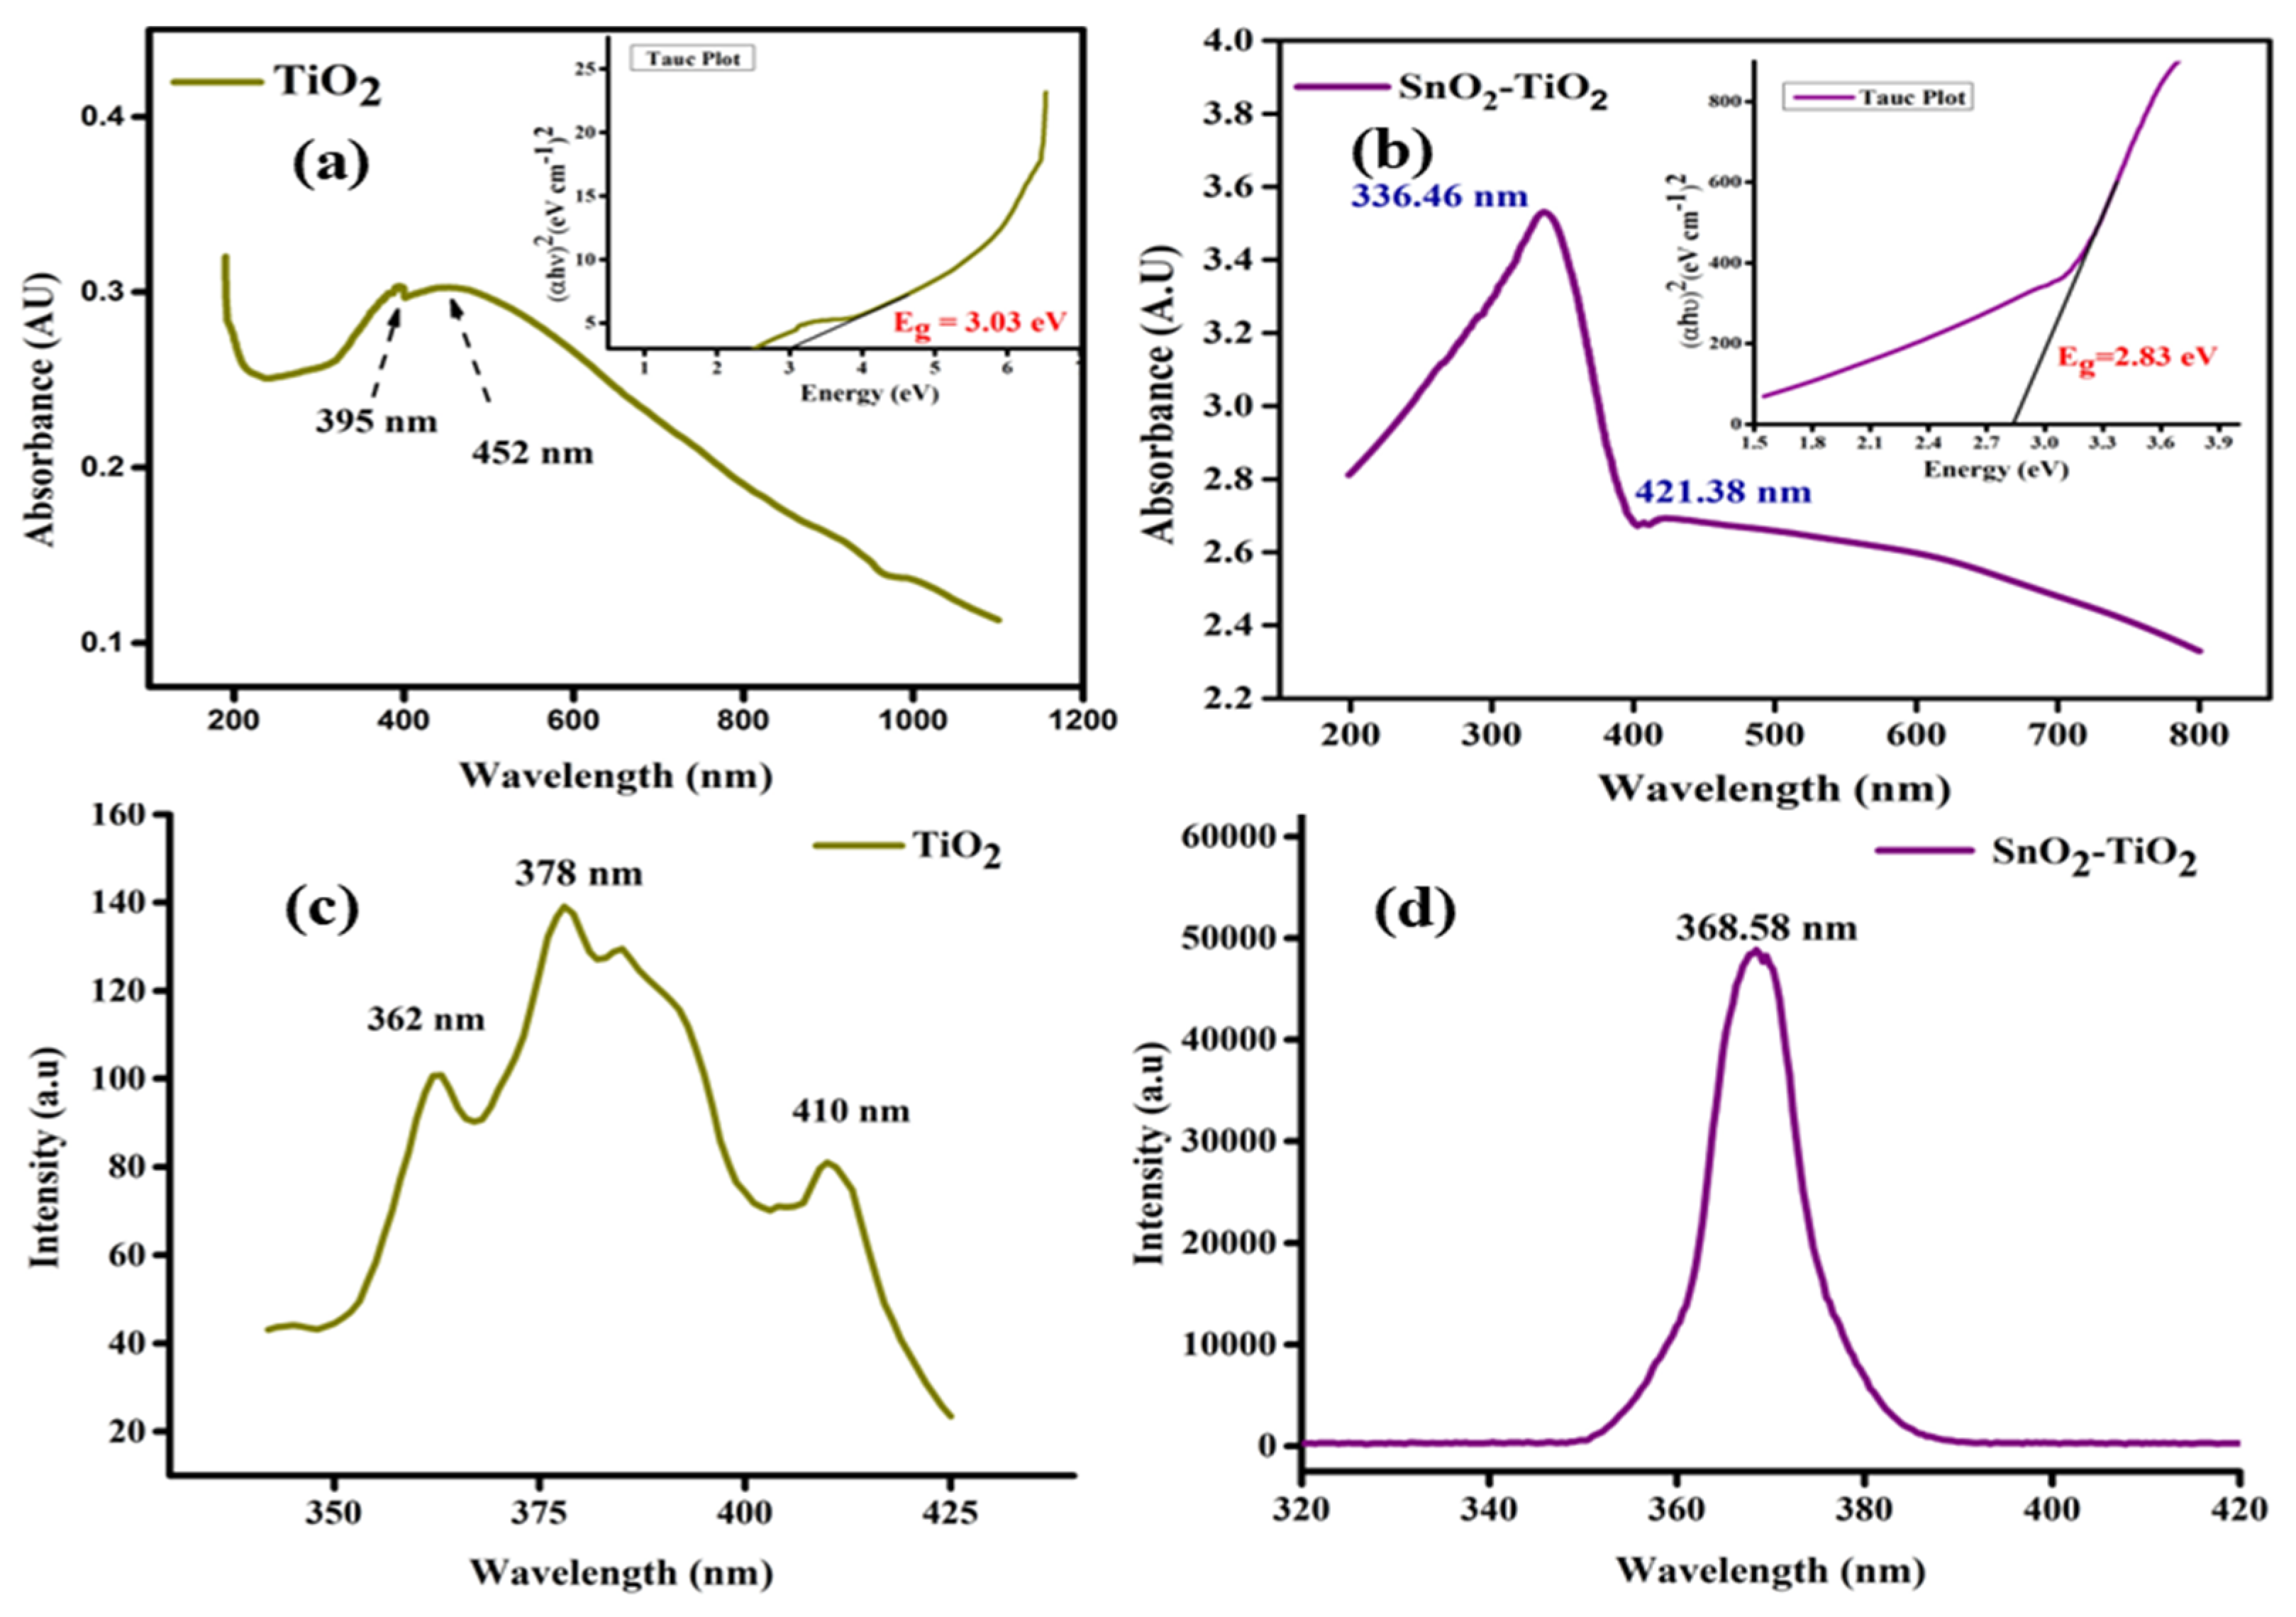
The intense absorption peak can be observed in Figure 4a,b at 395 nm for TiO2 nanoparticles. Additionally, a peak at 336.46 nm, corresponding to SnO2, and another peak at 421.38 nm, corresponding to TiO2, were observed for SnO2-TiO2 nanocomposites when examined using a UV–Vis spectrophotometer. The two peaks indicate that the formation of the heterojunction can exhibit increased reactivity under both types of irradiation. The optical properties of the SnO2-TiO2 nanocomposites can be interpreted through this spectrum.
Figure 4.
(a,b) UV–Vis spectra (inset Tauc plot) and (c,d) photoluminescence spectra of TiO2 nanoparticles and SnO2-TiO2 nanocomposite.
Tauc’s relation [6] was employed to calculate the optical bandgap energy of the nanocomposite.
where A, α, h, ν, and Eg are constant, absorbance coefficient, Planck constant, wavenumber, and optical bandgap energy, respectively, and n defines the value for a particular band type. Here, the bandgap energy obtained was 2.83 eV with a direct bandgap. The nanocomposite material has a more narrow optical bandgap energy than the pure TiO2 nanoparticle of 3.03 eV [21]. Thus, the lesser Eg enhances photocatalytic activity as it influences the rate of charge separation and speeds up photocatalysis. The linear portion used for extrapolation in the Tauc plot has been redefined based on the region of maximum slope, which is more representative of inter-band electronic transitions rather than defect-mediated transitions. As reported in the literature, applying linear extrapolation in regions affected by sub-bandgap absorption leads to an underestimation of the bandgap. Therefore, only the region exhibiting a clear linear trend after the absorption onset has been considered.
αhν = A (hν − Eg)n
3.5. PL Analysis
Insight into the optical and electronic characteristics of the material can be obtained from the photoluminescence spectra, as shown in Figure 4c,d. The SnO2-TiO2 nanocomposites show an emission maximum in the ultraviolet A region at 369 nm [21] wavelength. The optical bandgap energy was calculated from the energy equation. For that particular excitation wavelength, the optical bandgap energy observed was 3.36 eV. The optical bandgap energy observed for TiO2 nanoparticles was 3.28 eV at the emission maximum wavelength of 378 nm.
3.6. CV and EIS Analyses
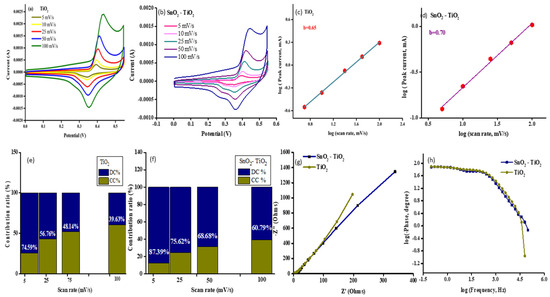
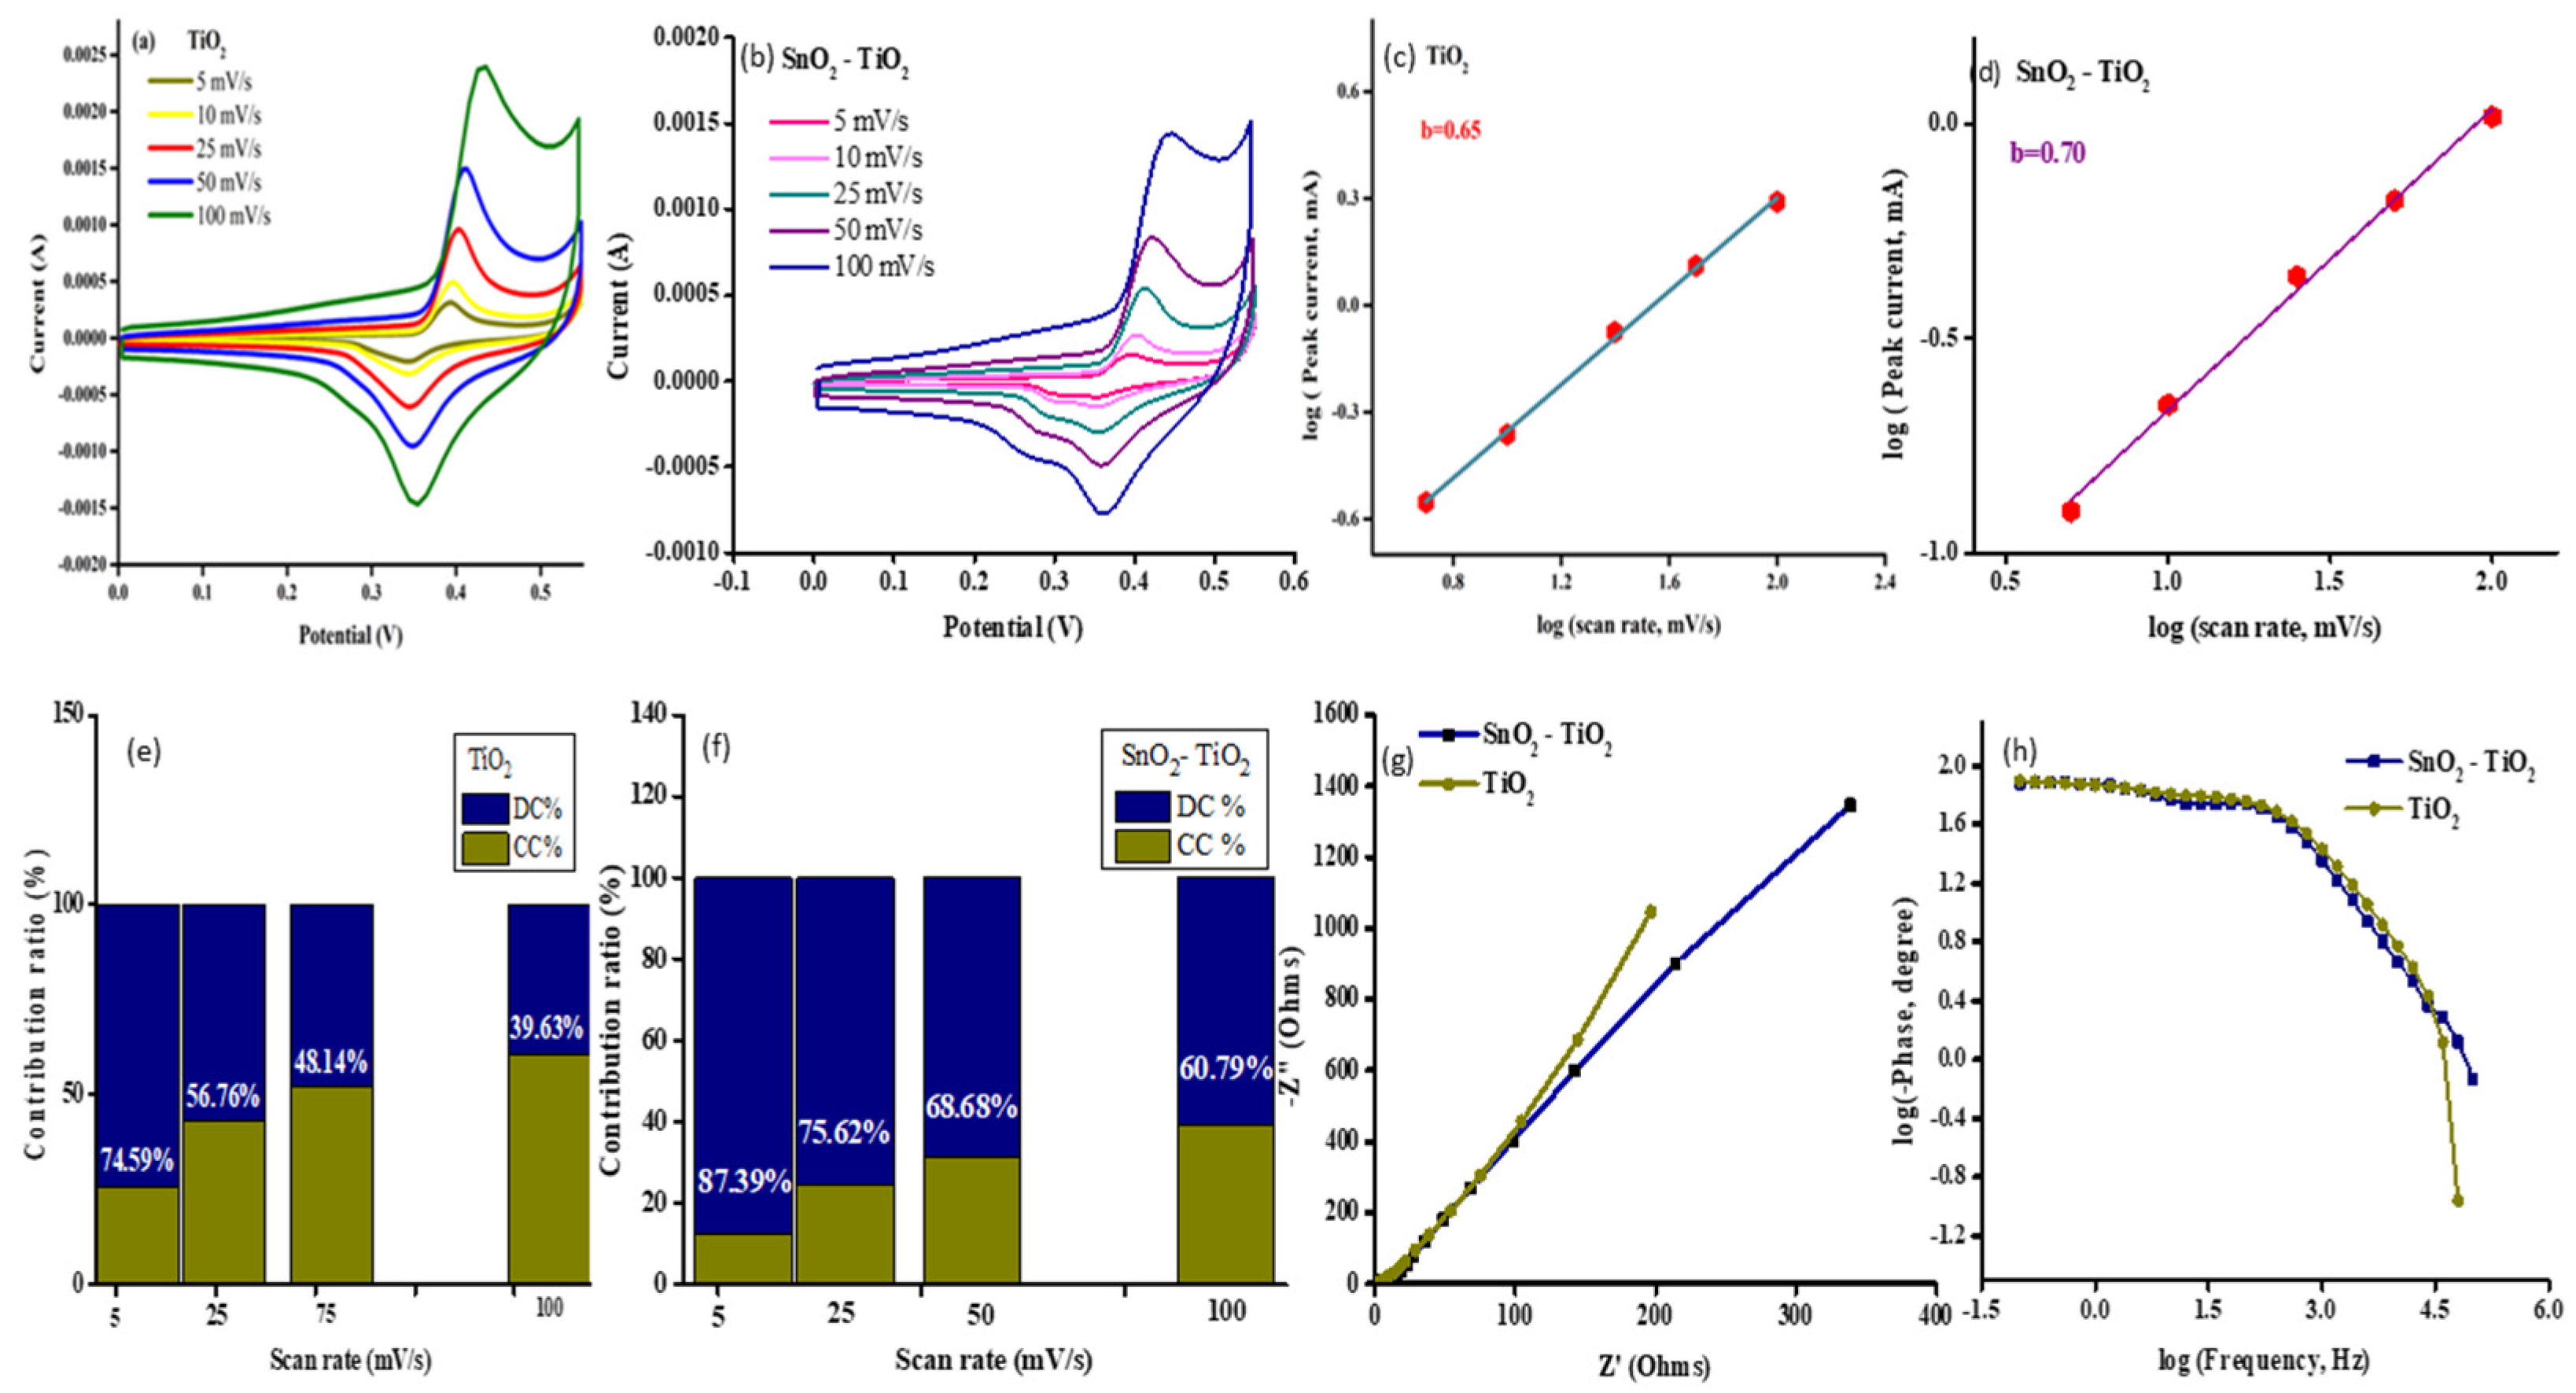
The electrochemical behavior of the nanocomposite was analyzed with the aid of CV data. Figure 5a,b shows the CV curve at different scan rates of 5, 10, 25, 50, and 100 mV/s with a potential window of −1.0 to 2.0 V. The curves become wider with an increase in scan rates. The oxidation and reduction peaks were observed in the curve, which shows that a redox mechanism took place in the process. The total charge stored was observed from the area enclosed in the CV curve [32].
Figure 5.
(a,b) CV peak, (c,d) power law plot to find diffusivity or capacitive behavior, (e,f) contribution ratio % of material, (g) EIS spectra, and (h) log frequency vs. log phase plot of TiO2 nanoparticles and SnO2-TiO2 nanocomposite.
A Nyquist plot of the EIS spectra, given in Figure 5g, helps in understanding the charge recombination mechanism of the nanocomposite. The curve without an eminent semicircle indicates the low charge transfer resistance, which shows the conductive nature of the system. In Figure 5h, the phase angle approaches 0° and 1° for the high frequency range (10 kHz) due to resistance, and 76° and 79° for the low frequency end, which denotes the capacitive behaviors for the nanocomposite and nanoparticle material. The surface or capacitive-induced and diffusion-controlled processes are believed to be responsible for the total current [33].
The power law plot, or Dunn plot, was used to determine whether the material was capacitive or diffusive controlled.
i = a νb
log(i) = log(a) + b log (ν)
i = k1ν + k2ν1/2
i/ν1/2 = k1ν1/2 + k2ν1/2
From the equation above, ν is the scan rate and a, b are constants, where the value of b determines whether the process is surface or diffusive controlled. The linear regression of the scan rate vs. peak current (cathodic and anodic peak currents) in, and the ν1/2 vs. peak current, can be employed to discover the diffusive and capacitive behavior of the material. Figure 5c,d provides the b value of 0.65 and 0.70 for the TiO2 nanoparticle and SnO2-TiO2 nanocomposite when linearly fitted. The value ranges between 0.5 < b < 1 show both capacitive- and diffusive-controlled reactions [34].
The diffusion-controlled (k2ν1/2) and capacitive-controlled (k1ν) contribution % [32,35] can be calculated by plotting ν1/2 vs. i/ν1/2. The contribution ratio of capacitive and diffusive behavior at different scan rates is observed in Figure 5e,f for both TiO2 nanoparticles and SnO2-TiO2 nanocomposites. The diffusive contribution was ~74% for 5 mV/s and further decreased in percentage with an increase in scan rate from 56.26%, 48.14%, and 39.63% for 25 mV/s, 50 mV/s, and 100 mV/s, as seen in Figure 5e for the TiO2 nanoparticles. Whereas for the SnO2-TiO2 nanocomposite, the diffusive contribution obtained was 87.39%, 75.62%, 68.68%, and 60.79% for the respective scan rates of 5, 25, 50, and 100 mV/s.
3.7. Photocatalytic Analysis
3.7.1. Preparation of Malachite Green Dye (MG) Stock Solution
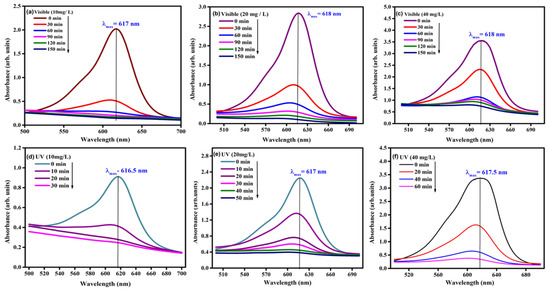
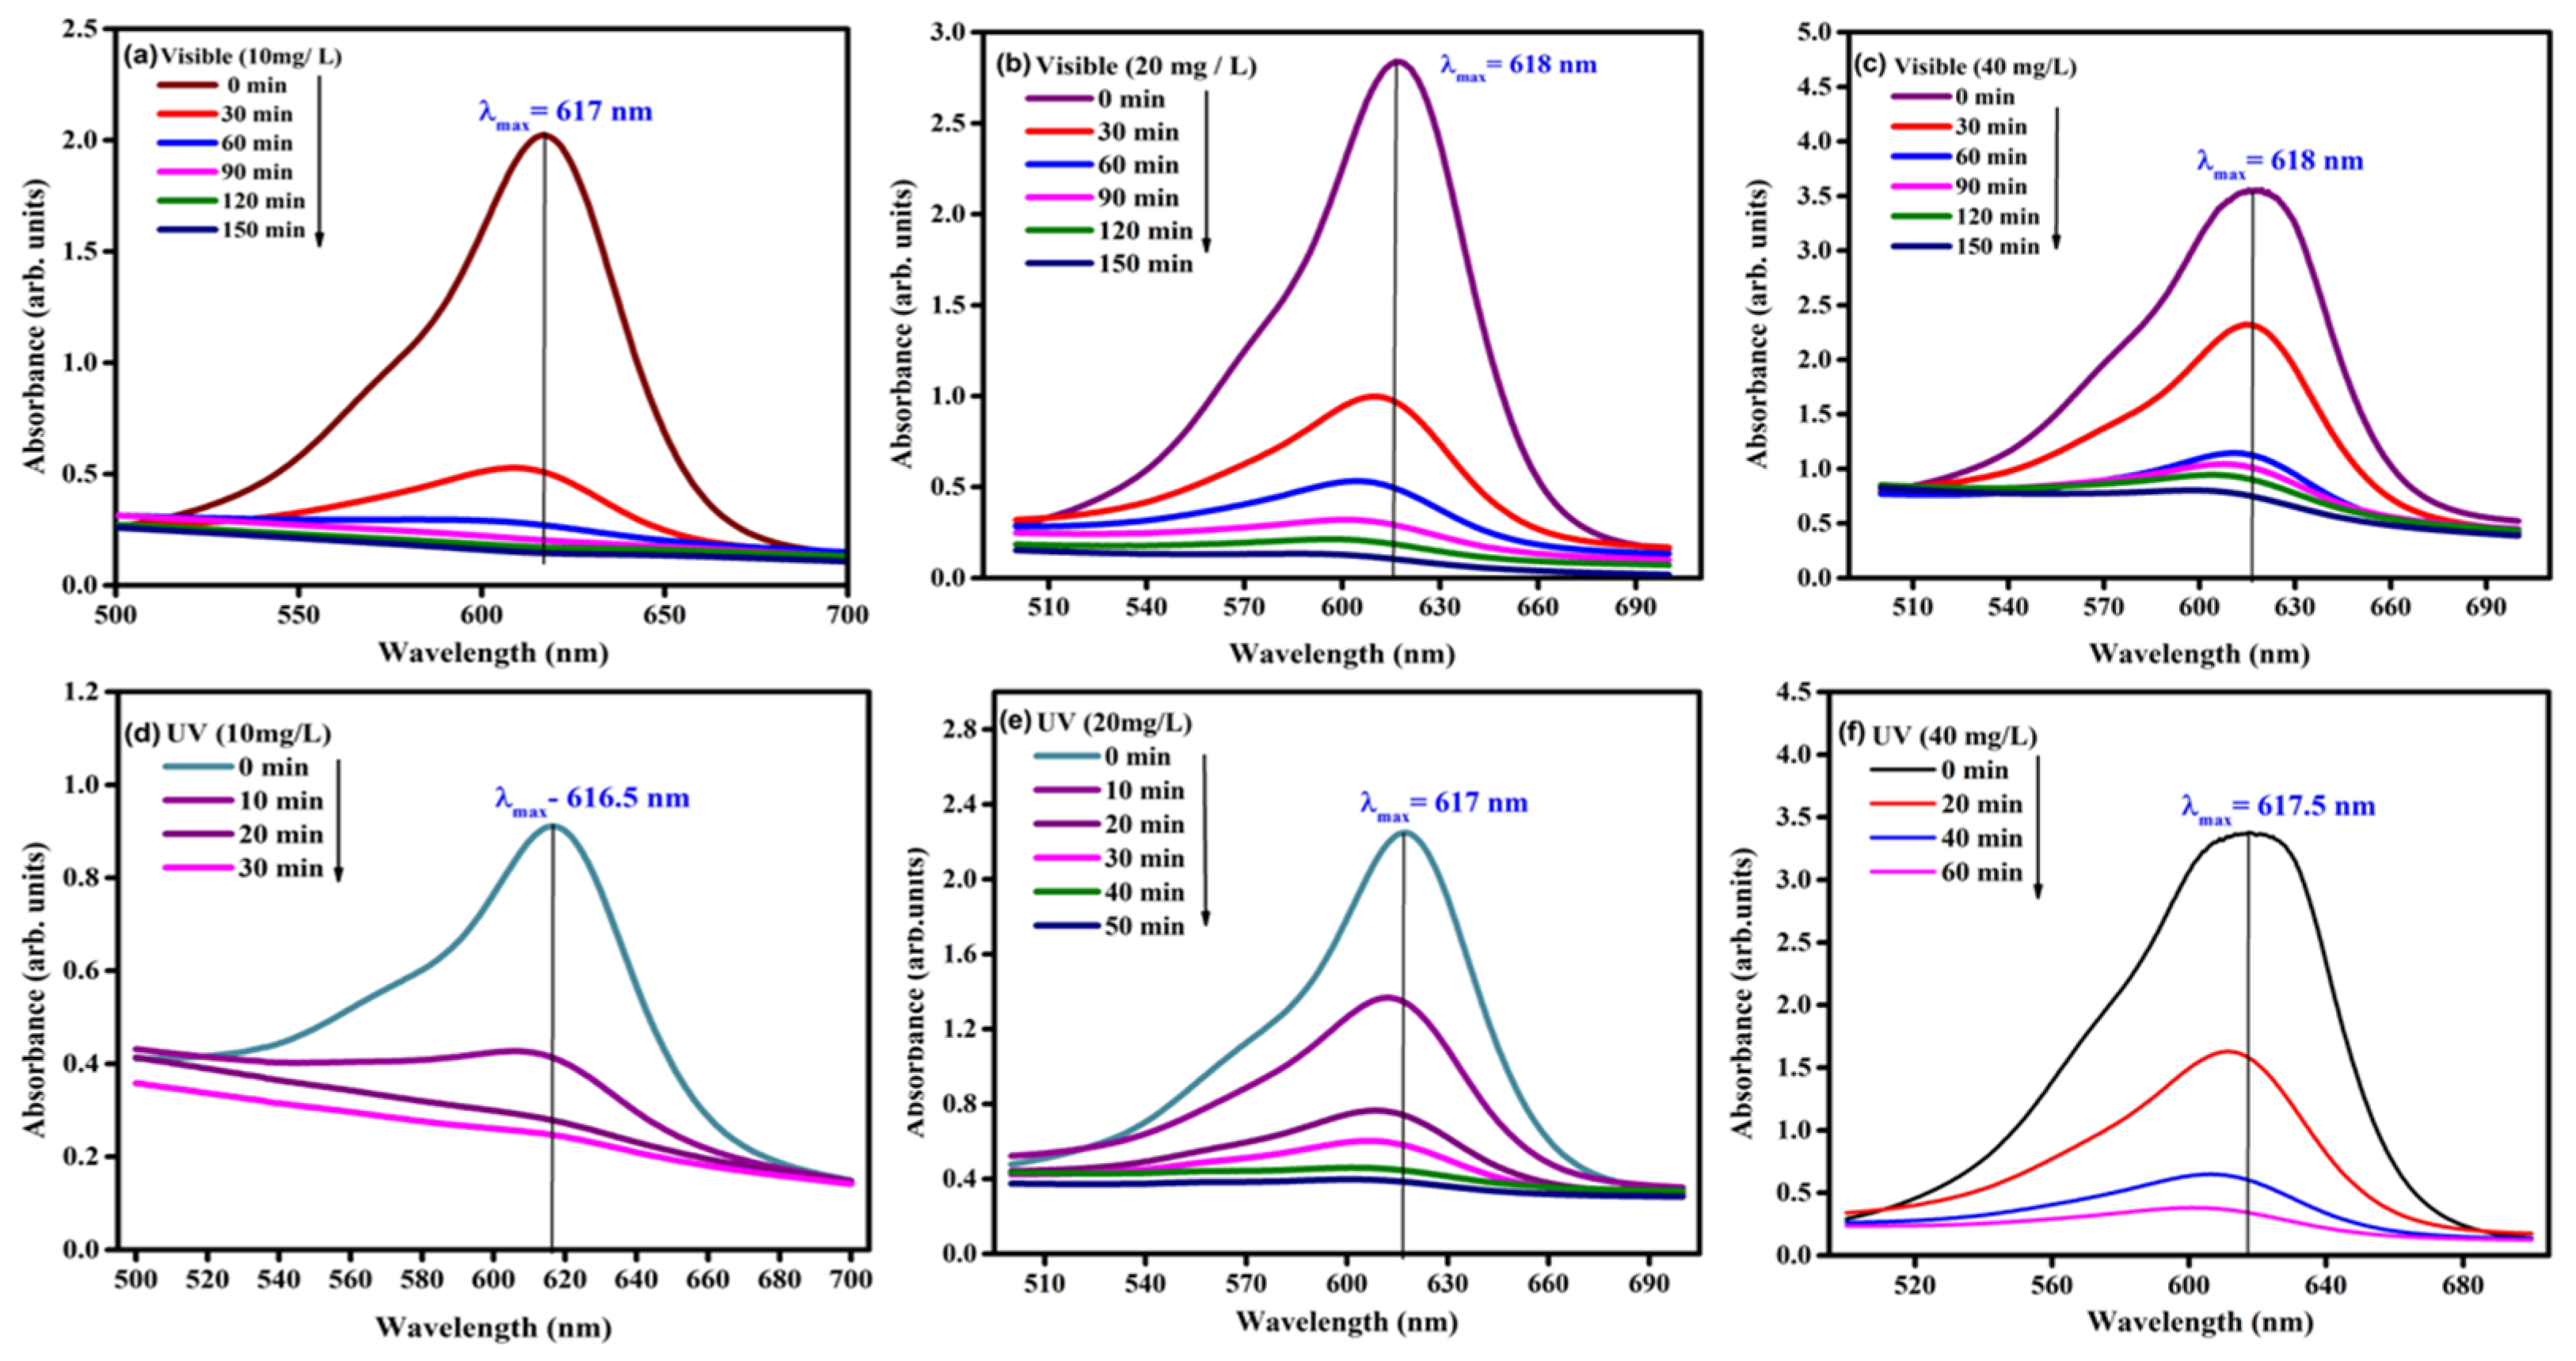
This study focused on observing the photocatalytic reaction of the nanocomposite at varied concentrations under varied light sources. The dye of varied concentrated stock solutions was prepared for 10 ppm, 20 ppm, and 40 ppm measurements. The one-liter capacity of stock solutions was prepared by mixing with dyes of 10, 20, and 40 mg concentrations and deionized water. The mixture was homogenized with the help of a magnetic stirrer. For the visible light (sunlight) test, 200 mL of the stock solution was taken in a 500 mL beaker of each concentration, and 60 mg of the sample was added to it and stirred thoroughly in the dark for 15 min. For the UV light test, 400 mL of the stock solution and 120 mg of the samples for each concentration were placed in a thick borosilicate vessel. This vessel was positioned 20 mm away from a quartz-jacketed tube that housed the lamp during the testing. The triple-jacketed reactor, with an immersion well setup, was used for the UV system. The UV light with a wavelength range of 200–400 nm (254 nm, 356 nm, and 365 nm) was illuminated with the help of a medium-pressure mercury lamp. The aliquots were taken, and absorbance values were tested in a UV–Vis spectrophotometer at regular time intervals of 30 min for visible irradiation, 10/20 min for UV irradiation. The UV–Vis spectra at various time intervals are shown in Figure 6a–f.
Figure 6.
UV–Vis absorbance plot of SnO2-TiO2 nanocomposite for various concentrations of the aqueous dye solutions It dounder (a–c) visible and (d–f) UV radiation.
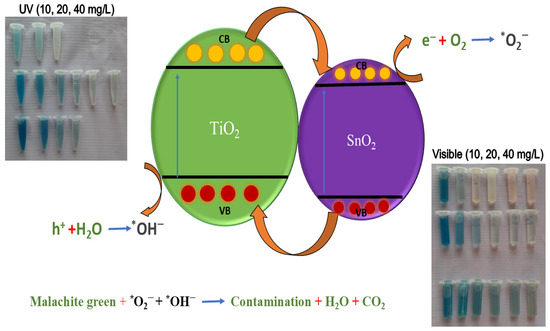
The photocatalytic reaction initiates when the energy of incident light exceeds the optical bandgap energy. When the energy is absorbed by the elements, excitation of electrons takes place, followed by charge separation [10,21,26]. The electrons from the valence band of TiO2 passed to SnO2 and undergo a reduction reaction to form free radicals, *O2−, and the holes that traveled from SnO2 to TiO2 undergo an oxidation reaction and form *OH−. These radicals and anions undergo a reaction and degrade the pollutants. Figure 7 illustrates the entire photocatalytic mechanism. From the EIS spectra, the curve with no prominent semicircle indicated the low resistance value, which confirms that the charge separation effectively promotes the photocatalytic activity, and bandgap energy from UV and PL data shows the activation of photocatalytic activity in visible and UV irradiation.
Figure 7.
Photocatalytic mechanism of SnO2-TiO2 binary nanocomposite (* in the figure indicates the radical).
3.7.2. Reaction Kinetics
In this study, seven kinetic models were employed to investigate photocatalytic reactions. The subsequent kinetic models were summarized based on previous works. [7,11,14,15,24,26,34,35,36,37,38,39]. The data collected from the photocatalytic reaction were used to study the kinetic models, and the results are given in Table 3.
Table 3.
Correlation coefficients and rate constants of different kinetic models.
The zero-order and pseudo-zero-order kinetics:
The zero-order kinetic reaction has been given as follows:
The general expression was obtained as Ct − C0 = −kt by integrating and modifying the equation. The rate constant and correlation coefficient were found by linear regression of time vs. (Ct − C0). The pseudo-zero-order kinetic model was studied by concentration (t vs. Ct) with respect to time [37]. The kinetics do not depend upon the concentration of the dye [37].
The first-order and pseudo-first-order kinetics:
This kinetic model depends on the concentration of dye during the reaction process, and the adsorption–desorption process is not disturbed by the reaction, as mentioned in [37,38]. The first-order kinetics has been studied by linear regression of T vs. Ct, and the pseudo-first-order kinetics can be studied by linear fitting of time vs. log (C0/Ct). The rate equation in integral form is given as [35]
The pseudo-second-order kinetics:
The reaction depends on both the concentration of dye and reactant active sites. The rate of the reaction is proportional to the square of the concentration [37]. The linear plot of t vs. t/Ct was used to study this model. The pseudo-second-order kinetics is represented by the equation,
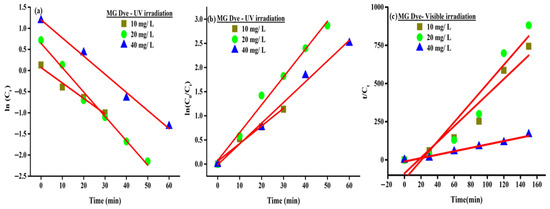
Figure 8 describes the pseudo-first-order, pseudo-second-order, and first-order kinetic models.
Figure 8.
(a) First order, (b) pseudo-first-order (UV) kinetic models, and (c) pseudo-second-order (Visible) kinetic model.
The modified Freundlich model and parabolic diffusion model:
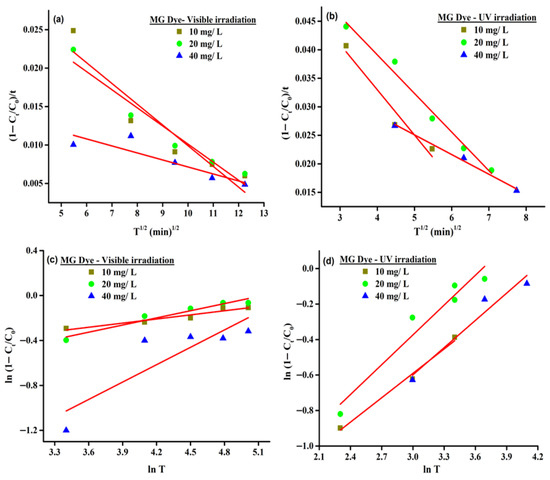
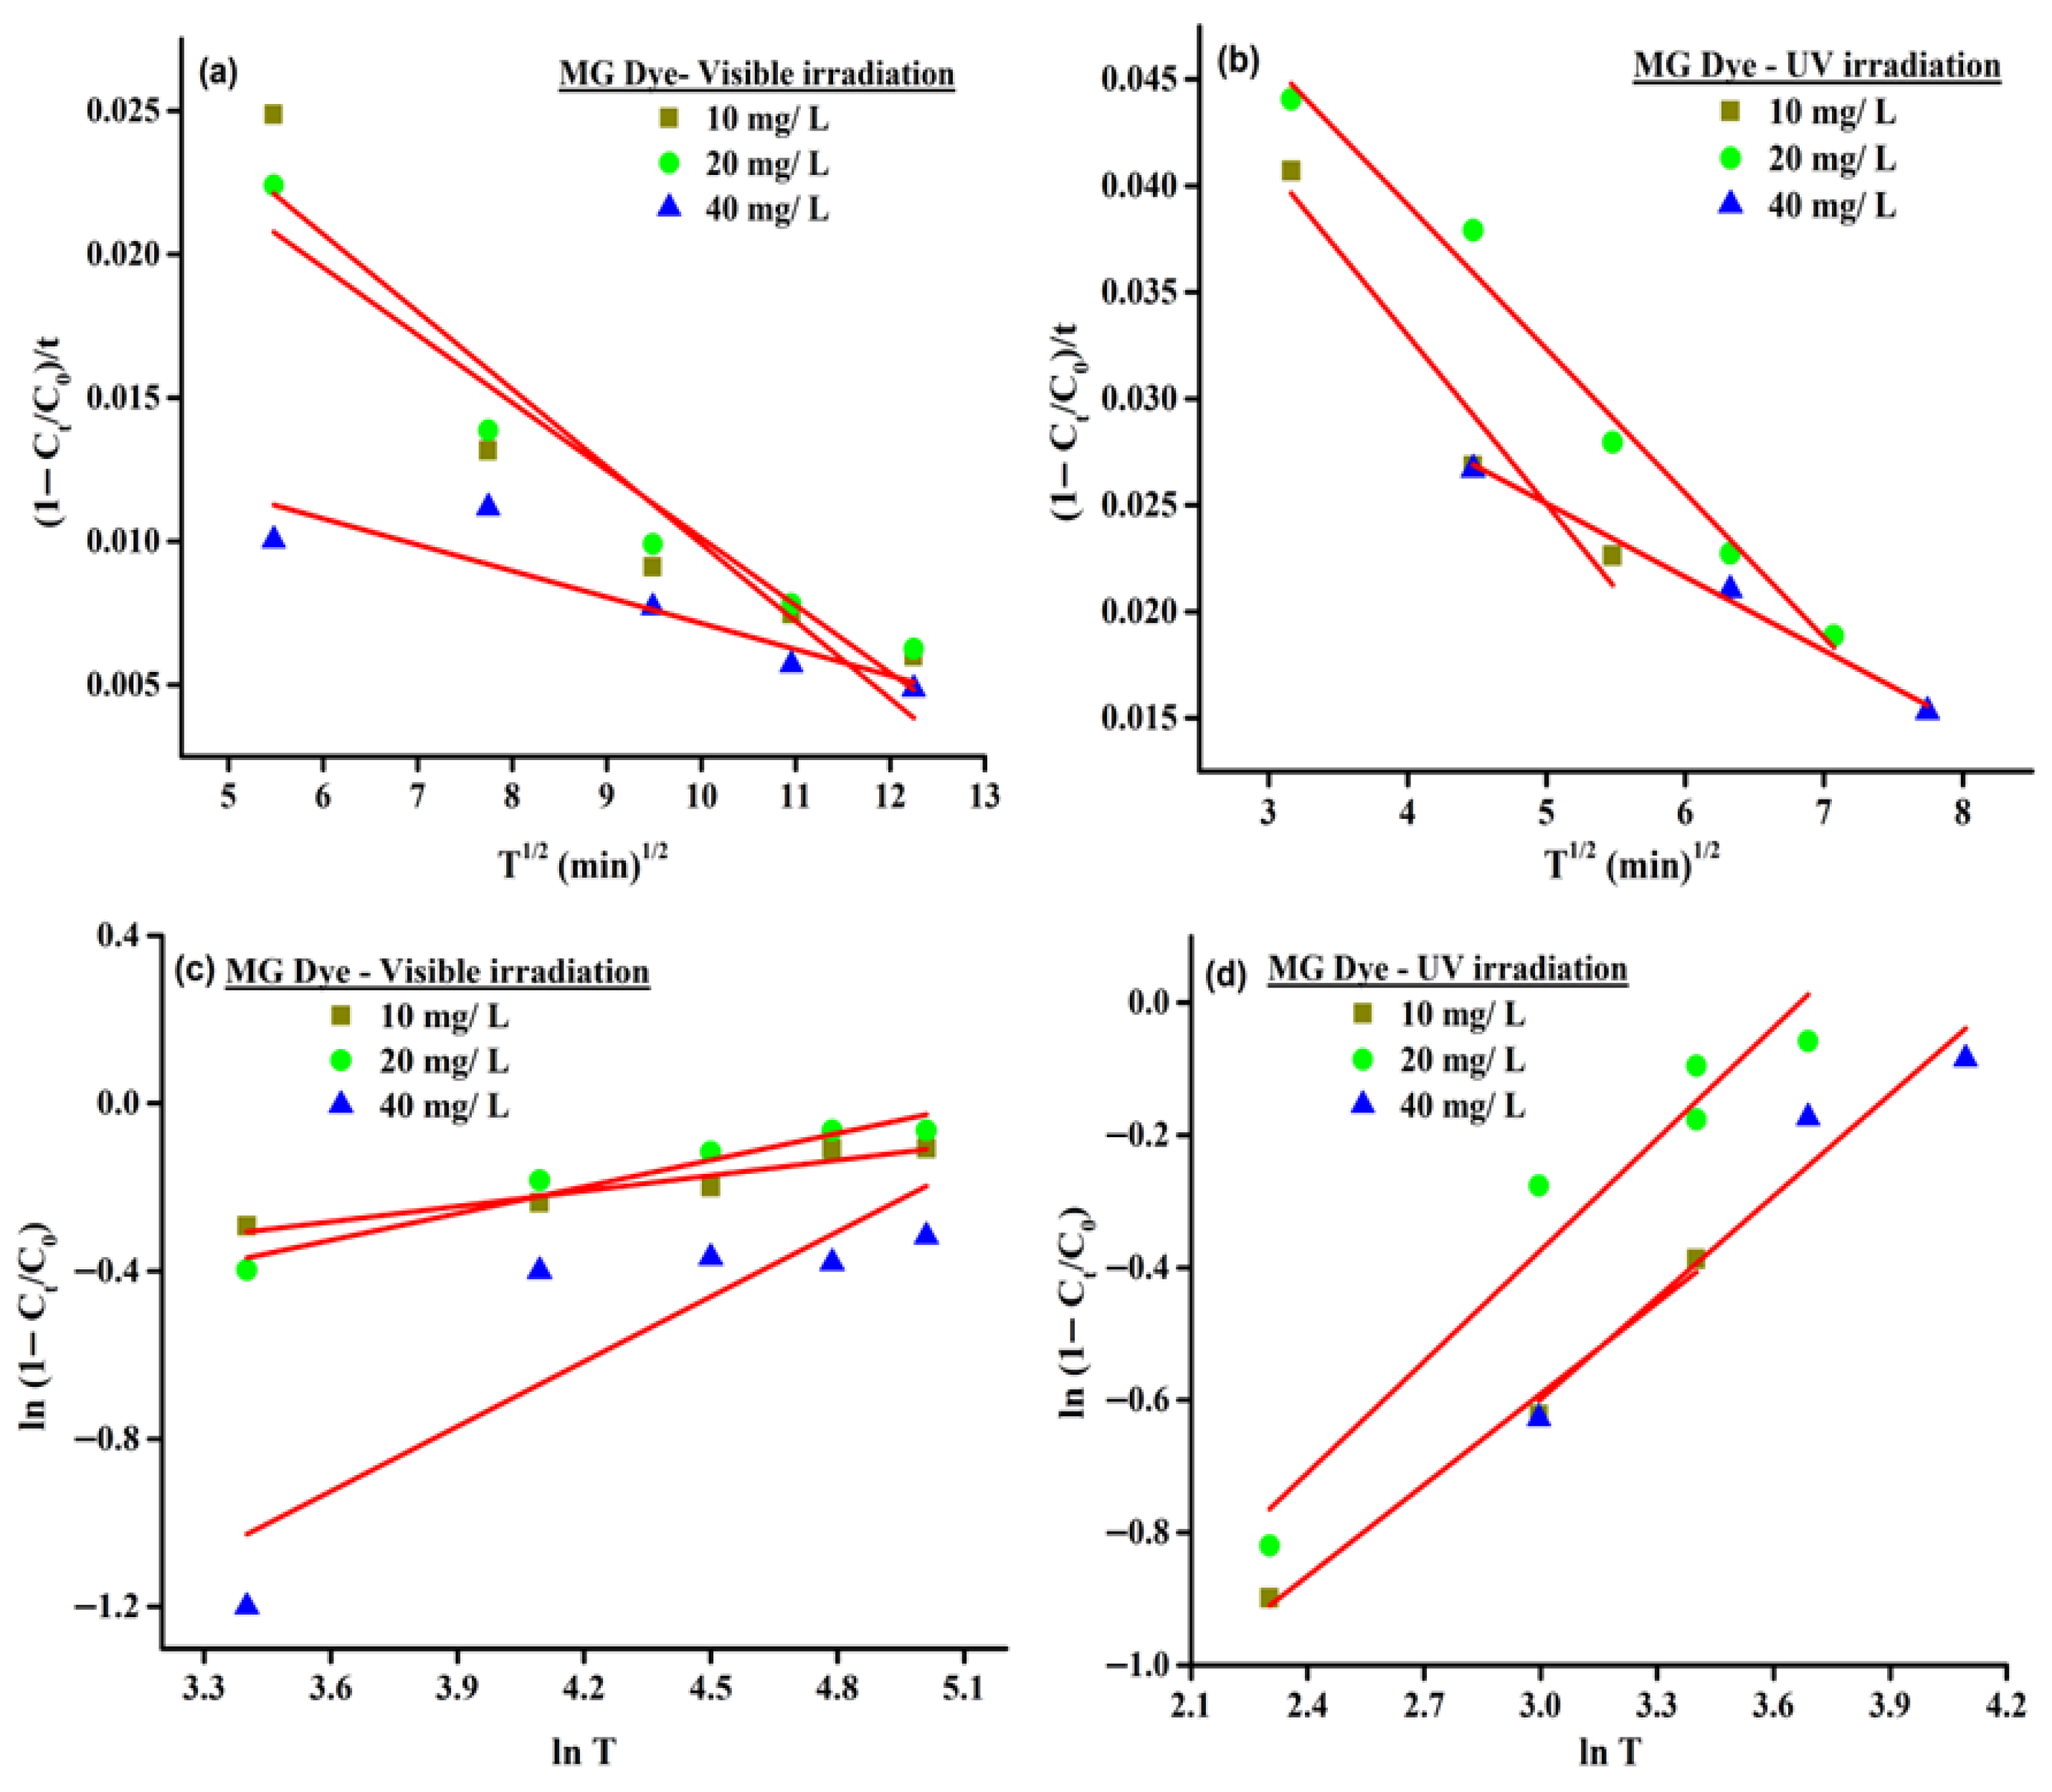
The modified Freundlich model was studied by plotting log T vs. (log (1 − (C0/Ct)). This model describes the diffusion-controlled and ion-exchange process during the reaction [36]. The parabolic diffusion method defines the diffusion of dye towards the active site of the catalyst and is obtained by the linear fitting of t1/2 vs. (1 − (C0/Ct))/t. The model is shown in Figure 9.
Figure 9.
(a,b) Parabolic diffusion model (visible and UV) and (c,d) modified Freundlich model (visible and UV).
Initial studies were conducted on TiO2 nanoparticles at a concentration of 20 mg/L under both types of light sources. The 54% and 93% degradation rates were achieved with constant values of 0.00931 and 0.00246 under visible and UV light sources, respectively. The rate constant value and degradation efficiency were significantly higher for the nanocomposite, leading to a focus on comprehensive studies of the SnO2-TiO2 nanocomposite. From the results, we can conclude that the reaction follows pseudo-second-order kinetics when conducted under sunlight. The data also show that the first-order and pseudo-first-order kinetic models provide a similarly good linear fit for tests conducted under UV light irradiation, as illustrated in Figure 8a–c. The UV irradiation is highly energetic, thus surplus quick ROS generation will be produced, so the reaction relies only on the concentration, hence follows pseudo-first-order and first-order reactions [37,38], as stated earlier. For a visible light source as sunlight, which is less intense as the distance increases, ROS generation will consume time, thus it relies on both the concentration and reactant active sites [37]. The linear correlation coefficient and rate constant values obtained for 10, 20, 40 and mg/L concentrations under visible irradiations were 0.90239 and 5.14787 min−1, 0.89003 and 6.25869 min−1, and 0.97569 and 1.11768 min−1, respectively. The values obtained under UV radiation are 0.9693 and 0.03652 min−1, 0.9881 and 0.05769 min−1, and 0.9884 and 0.04285 min−1, respectively. The modified Freundlich model and parabolic diffusion model were slightly fitted for UV light-irradiated reactions. Thus, during photocatalysis under visible radiation, the reaction depends on both the concentration of pollutant and the reactant’s active sites, as mentioned in [37], whereas the reaction depends only on the concentration of dye alone [37,38] under UV light.
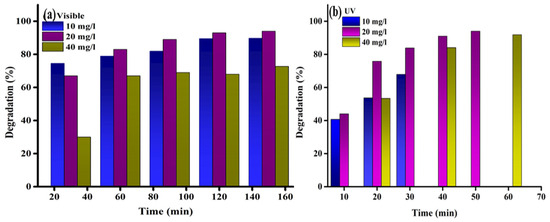
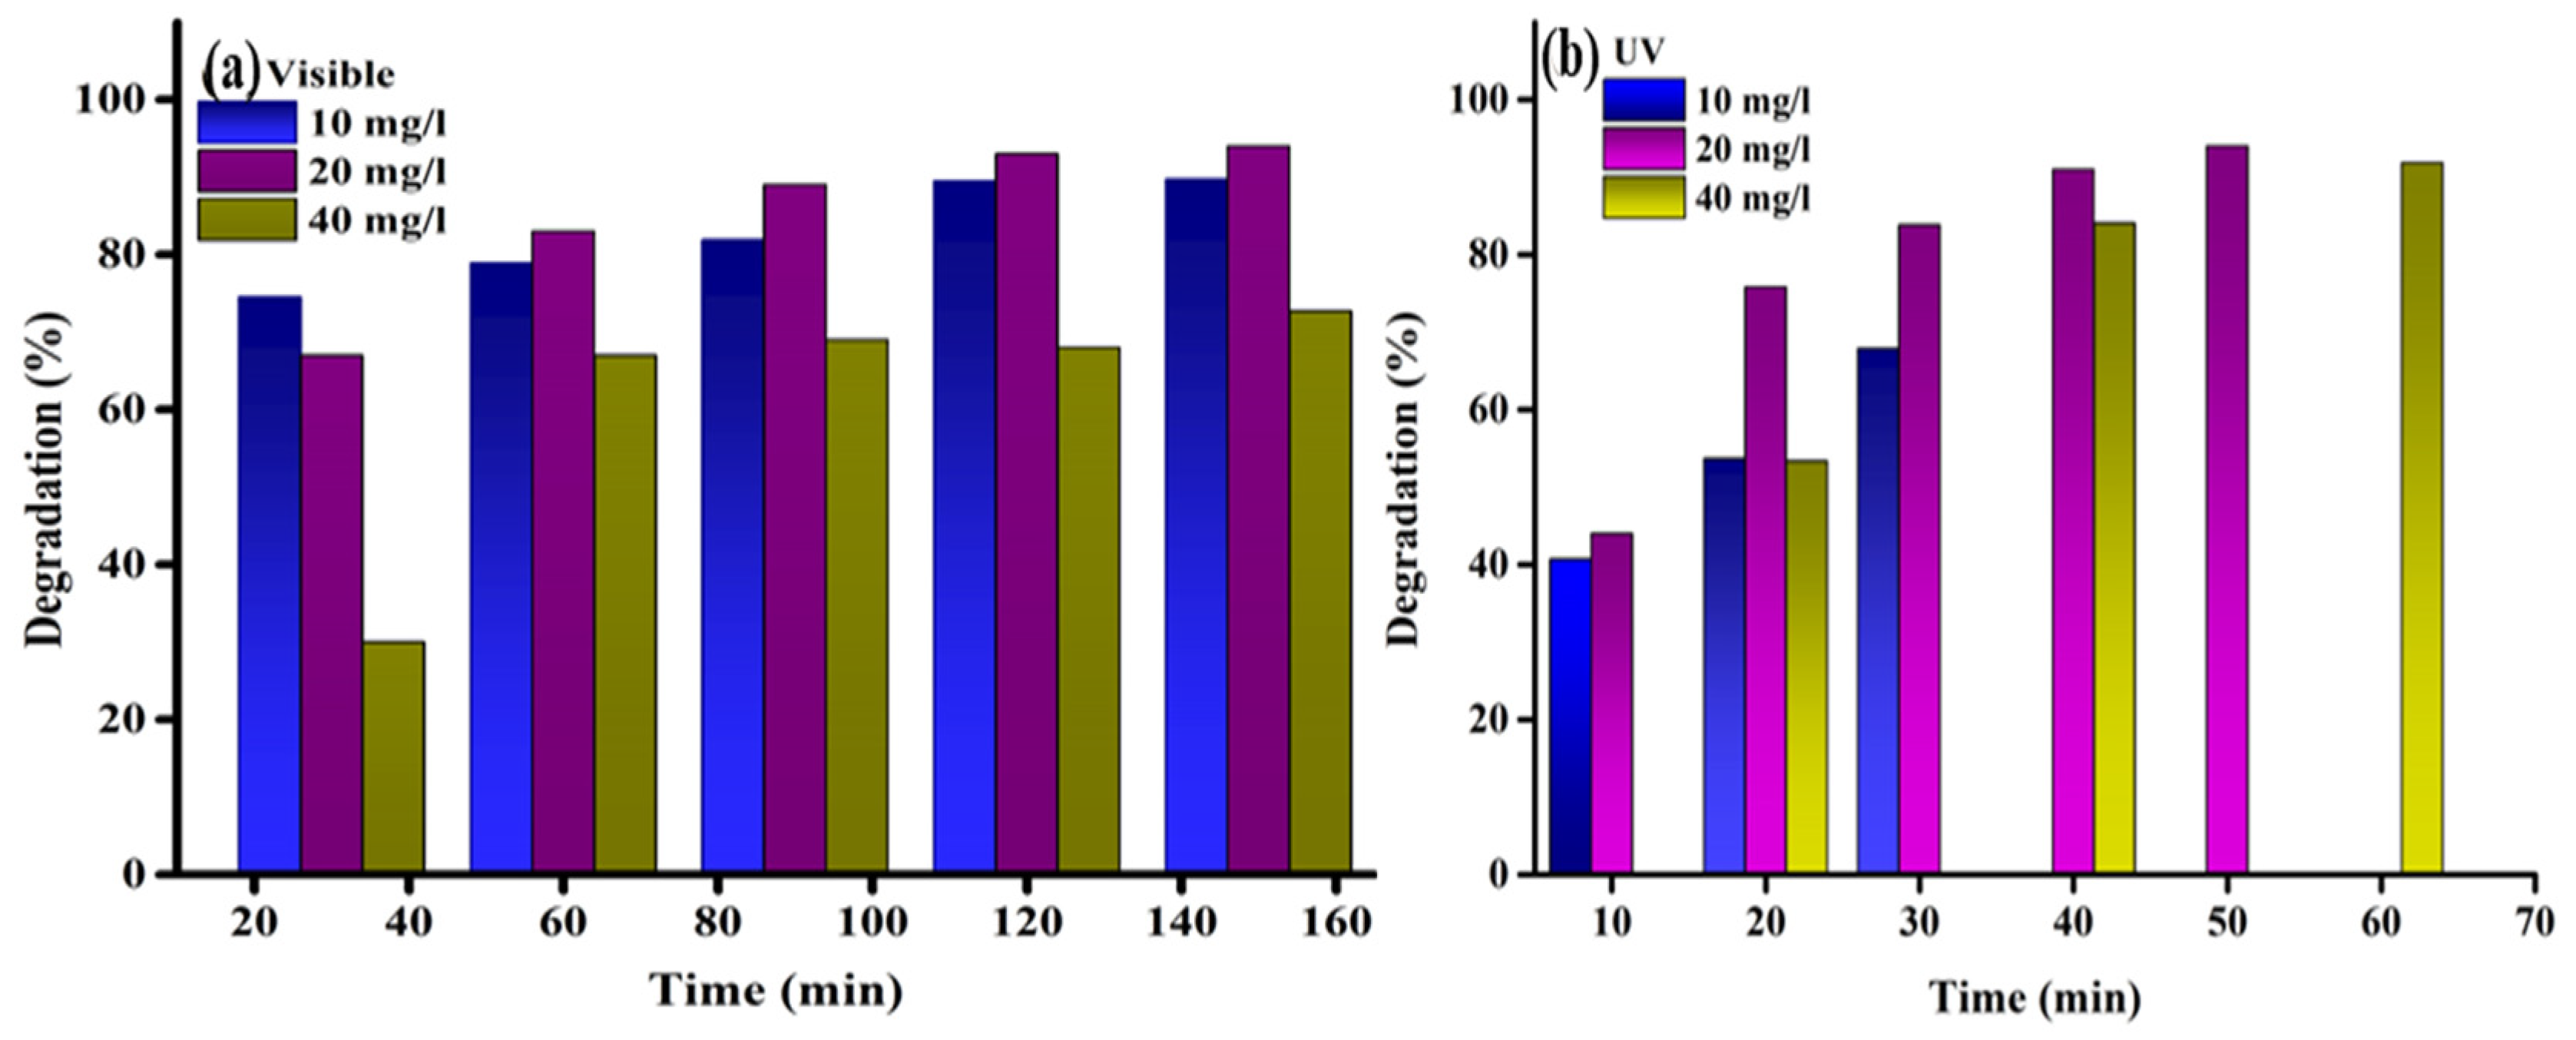
The degradation efficiency was calculated using the formula [6,7], . The photocatalytic degradation efficiency achieved under sunlight after a time interval of 150 min was 90%, 94%, and 73% for 10, 20, and 40 mg/L concentrations of dye, with complete decolorization occurring at 10 and 20 mg/L. For the UV light source, complete degradation occurred for 10 and 20 mg/L of 68% and 94% within 30 and 50 min, whereas 92% degradation was achieved for a 40 mg/L concentration of dye after 1 h. Figure 10a,b shows the degradation efficiency of the catalyst during the reaction under sunlight and UV light. Thus, the synthesized nanocomposites can be used as a photocatalyst in both light sources and are most effective.
Figure 10.
(a) % degradation under visible irradiation and (b) UV radiation source of SnO2-TiO2 nanocomposite.
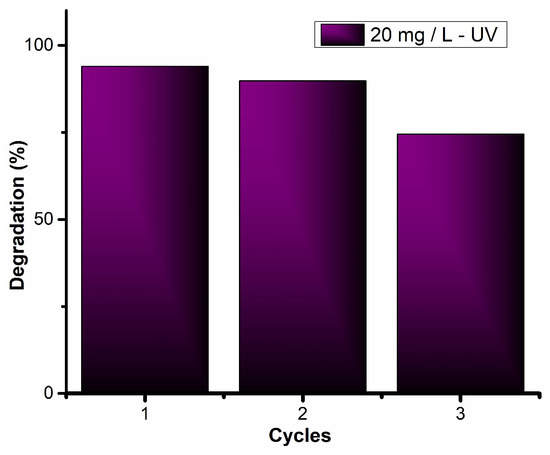
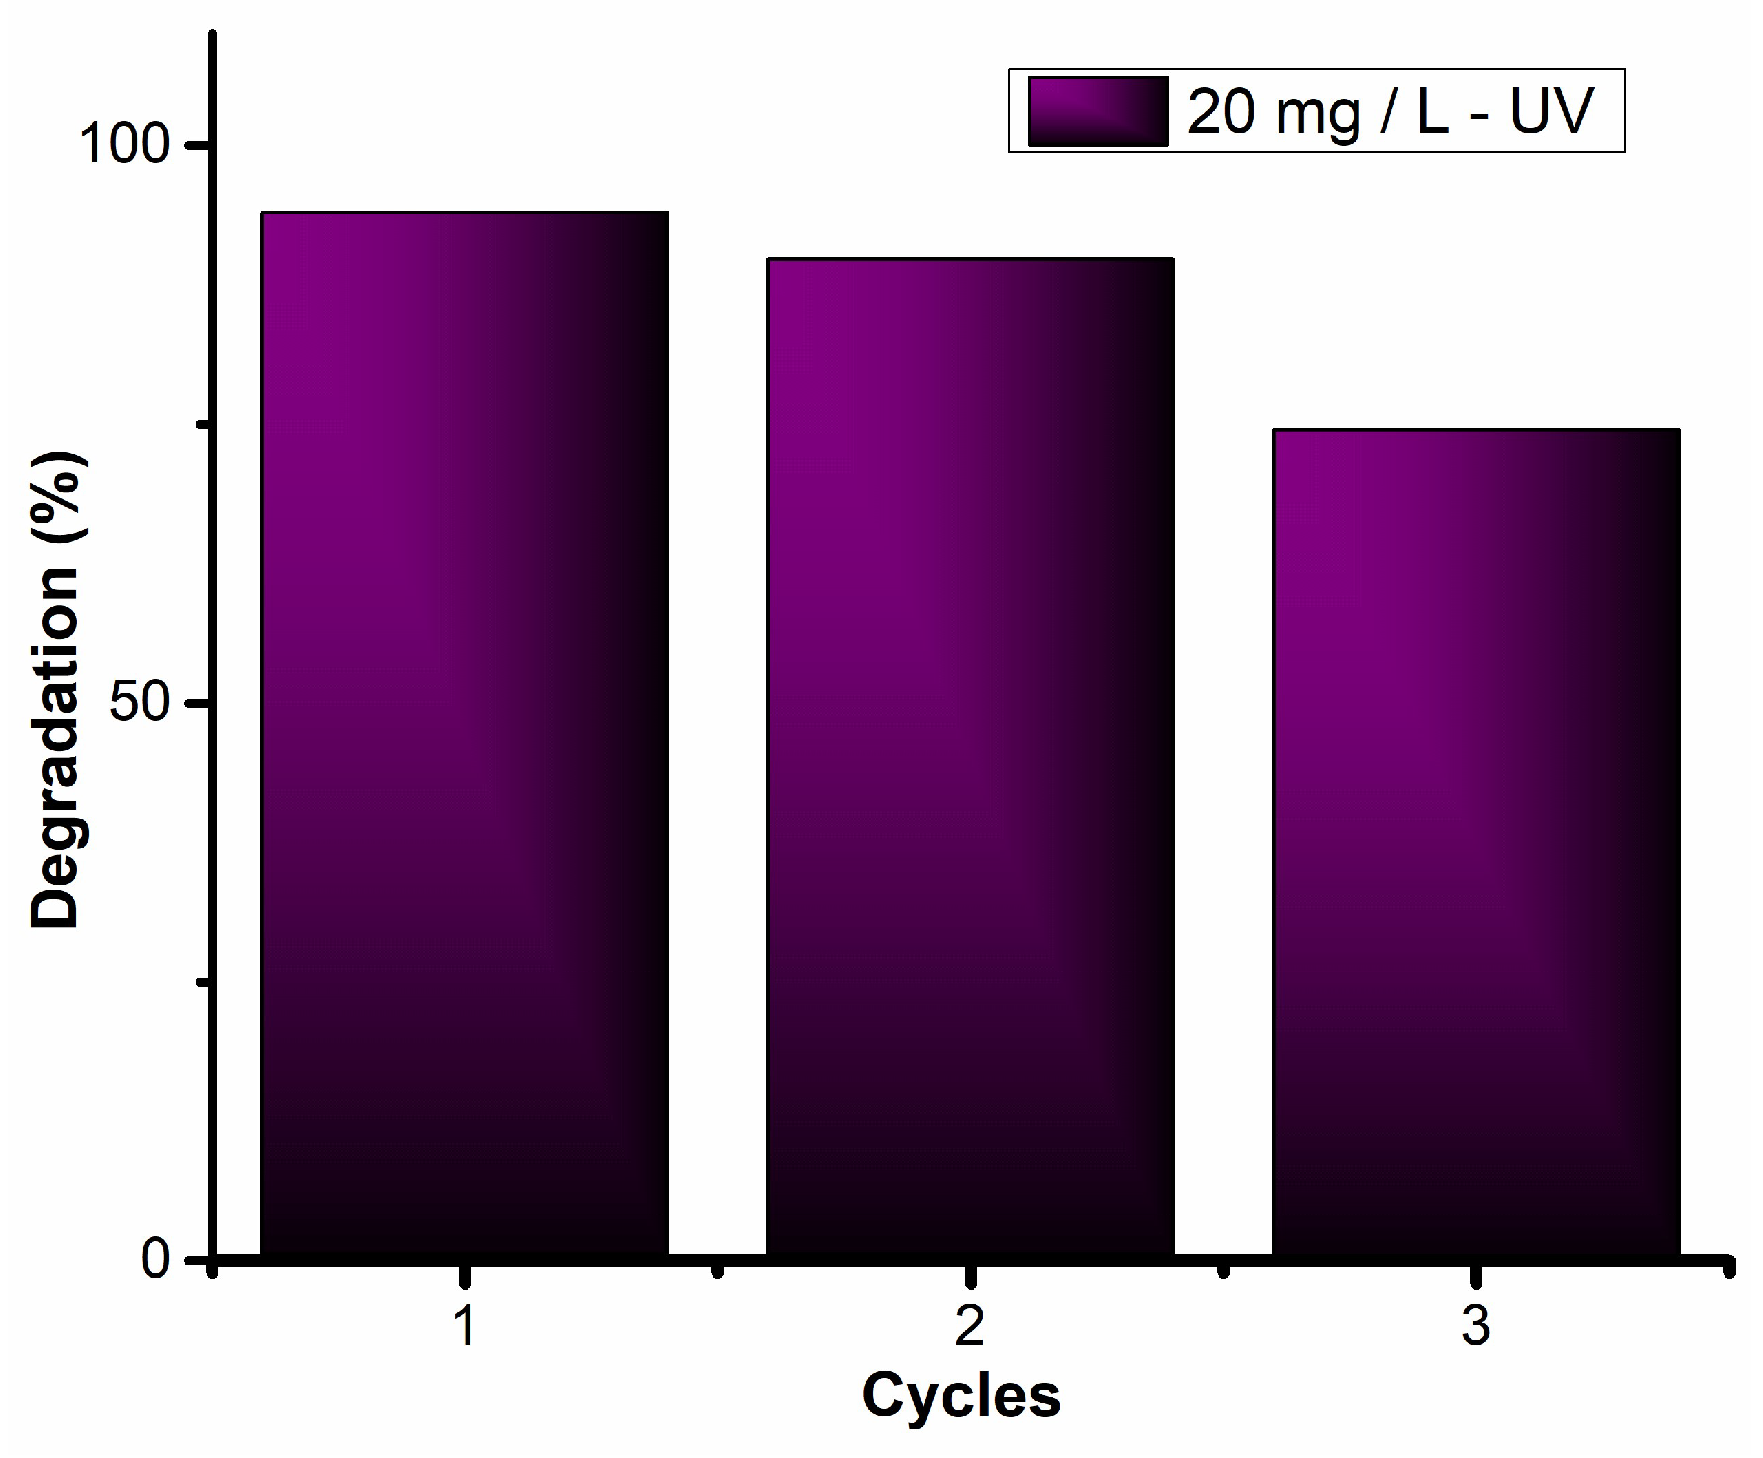
To ensure the reproducibility of the SnO2-TiO2 nanocomposite, it was tested over multiple cycles. The degradation efficiency was initially 94% but decreased to 90% and then to 75% in subsequent cycles, as shown in Figure 11. The recyclability test was done under a UV light source to ensure an even working setup with a 20 mg/L concentration. At this stage, the experiments were conducted to verify the feasibility and initial performance of the material rather than to establish comprehensive kinetic reproducibility. Due to this preliminary scope, repeated experimental trials and statistical analyses (such as error bars or standard deviations) have not yet been systematically performed. However, the obtained degradation trends were consistent across the limited number of trials conducted, indicating reliable photocatalytic activity.
Figure 11.
The degradation efficiency for the recyclability test of the nanocomposites.
4. Conclusions
The SnO2-TiO2 nanocomposites synthesized via the co-precipitation method demonstrated improved performance under both UV and visible radiation as photocatalysts. This advancement paves the way for future research in wastewater treatment and other applications for environmental remediation. The XRD peaks show that the nanocomposites possessed 62% crystallinity with a tetragonal crystal structure, and FTIR and EDS show the presence of elements and the non-contaminant nature of the nanocomposite materials. The SEM micrograph shows the surface morphology of different-sized nanocomposites. The narrow bandgap energy opens the way for optical applications. The values obtained from the relations and calculations from CV data show that the chosen nanocomposite can show hybrid (both capacitive and diffusive) behavior. The complete decolorization was observed under both UV and solar irradiations for both 10 mg/L and 20 mg/L dye concentrations. The maximum photocatalytic degradation efficiency of 94% was obtained within 50 min for UV irradiation and within 150 min under visible radiation at a 20 mg/L concentration. Various kinetic models, like the zero-order, first-order, second-order, pseudo-zero-order, and pseudo-first-order models, as well as the modified Freundlich model and parabolic diffusion model, were used to determine which model was followed during the reaction. Among that, this study, under visible radiation, obeys the pseudo-second-order reaction, as it depends both on the reactant site and concentrations, and UV-radiated studies depend only on the concentration, and thus follow both first- and pseudo-first-order kinetics equally. The nearly good fitted values were obtained for both the modified Freundlich model and the parabolic diffusion models.
Author Contributions
Conceptualization, S.S.; methodology, S.S.; software, R.R.; validation, U.R. and S.S.; formal analysis, K.P. and S.A.; writing—original draft preparation, S.S.; writing—review and editing, T.T., S.W.K., and S.G.P.; supervision, T.T.; project administration, T.T.; funding acquisition, T.T. and S.S. All authors have read and agreed to the published version of the manuscript.
Funding
In order to promote excellence in science and technology (S&T), the Department of Science and Technology (DST) provided financial assistance (DST/CURIE-PG/2022/54, dated 21 November 2022).
Data Availability Statement
The raw data supporting the conclusions of this article will be made available by the authors on request.
Acknowledgments
It is expressed in the acknowledgement that the author (S. Synthiya) is grateful to management. In addition, she thanks the Department of Science and Technology (DST) for supporting women’s institutions through the CURIE Program (Consolidation of University Research for Innovation and Excellence). We used Quillbot v41.51.0, an AI tool for paraphrasing and English grammatical corrections.
Conflicts of Interest
The authors declare no conflicts of interest.
References
- Suchikova, Y.; Nazarovets, S.; Konuhova, M.; Popov, A.I. Binary Oxide Ceramics (TiO2, ZnO, Al2O3, SiO2, CeO2, Fe2O3, and WO3) for Solar Cell Applications: A Comparative and Bibliometric Analysis. Ceramics 2025, 8, 119. [Google Scholar] [CrossRef] [Scilit]
- AlMohamadi, H.; Awad, S.A.; Sharma, A.K.; Fayzullaev, N.; Távara-Aponte, A.; Chiguala-Contreras, L.; Amari, A.; Rodriguez-Benites, C.; Tahoon, M.A.; Esmaeili, H. Photocatalytic Activity of Metal- and Non-Metal-Anchored ZnO and TiO2 Nanocatalysts for Advanced Photocatalysis: Comparative Study. Catalysts 2024, 14, 420. [Google Scholar] [CrossRef] [Scilit]
- Lanjwani, M.F.; Khuhawar, M.Y.; Lanjwani, A.H.; Khuhawar, T.M.J.; Ghoto, S.A.; Soomro, W.A. Photocatalytic degradation capability of SnO2 nanoparticles as a catalyst vs. malachite green dye: Factorial design, kinetic and isotherm models. Bull. Mater. Sci. 2024, 47, 1. [Google Scholar] [CrossRef] [Scilit]
- Shabna, S.; Jude Dhas, S.S.; Biju, C.S. Potential progress in SnO2 nanostructures for enhancing photocatalytic degradation of organic pollutants. Catal. Commun. 2023, 177, 106642. [Google Scholar] [CrossRef] [Scilit]
- Kim, S.P.; Choi, M.Y.; Choi, H.C. Photocatalytic activity of SnO2 nanoparticles in methylene blue degradation. Mater. Res. Bull. 2016, 74, 85–89. [Google Scholar] [CrossRef] [Scilit]
- Manikandan, K.; Dhanuskodi, S.; Maheswari, N.; Muralidharan, G. SnO2 nanoparticles for supercapacitor application. AIP Conf. Proc. 2016, 1731, 050048. [Google Scholar] [CrossRef] [Scilit]
- Devi, S.A.; Singh, K.J.; Devi, K.N. Hydrothermal synthesis of SnO2 for the photocatalytic degradation of malachite green dye. AIP Conf. Proc. 2020, 2265, 030059. [Google Scholar] [CrossRef] [Scilit]
- Tazikeh, S.; Akbari, A.; Talebi, A.; Talebi, E. Synthesis and characterization of tin oxide nanoparticles via the co-precipitation method. Mater. Sci.-Pol. 2014, 32, 98–101. [Google Scholar] [CrossRef] [Scilit]
- Bonu, V.; Gupta, B.; Chandra, S.; Das, A.; Dhara, S.; Tyagi, A.K. Electrochemical supercapacitor performance of SnO2 quantum dots. Electrochim. Acta 2016, 203, 230–237. [Google Scholar] [CrossRef] [Scilit]
- Patil, G.E.; Kajale, D.; Gaikwad, V.; Jain, G. Preparation and characterization of SnO2 nanoparticles by hydrothermal route. Int. Nano Lett. 2012, 2, 17. [Google Scholar] [CrossRef] [Scilit]
- Bhawna; Choudhary, A.K.; Gupta, A.; Kumar, S.; Kumar, P.; Singh, R.P.; Singh, P.; Kumar, V. Synthesis, antimicrobial activity, and photocatalytic performance of Ce-doped SnO2 nanoparticles. Front. Nanotechnol. 2020, 2, 595352. [Google Scholar] [CrossRef] [Scilit]
- Chen, W.; Ghosh, D.; Chen, S. Large-scale electrochemical synthesis of SnO2 nanoparticles. J. Mater. Sci. 2008, 43, 5291–5299. [Google Scholar] [CrossRef] [Scilit]
- Arularasu, M.V.; Anbarasu, M.; Poovaragan, S.; Sundaram, R.; Kanimozhi, K.; Magdalane, C.M.; Kaviyarasu, K.; Thema, F.T.; Letsholathebe, D.; Mola, G.T.; et al. Structural, optical, morphological and microbial studies on SnO2 nanoparticles prepared by co-precipitation method. J. Nanosci. Nanotechnol. 2018, 18, 3511–3517. [Google Scholar] [CrossRef] [Scilit]
- Renganathan, P.; Marimuthu, S.; Kanniah, R.; Karthikeyan, V.; Ayyakannu Sundaram, G. Synthesis and characterizations of Ni-SnO2-TiO2 nanocomposite for photocatalytic application. Results Chem. 2022, 4, 100557. [Google Scholar] [CrossRef] [Scilit]
- Chen, C.C.; Lu, C.S.; Chung, Y.C.; Jan, J.L. UV light induced photodegradation of malachite green on TiO2 nanoparticles. J. Hazard. Mater. 2007, 141, 520–528. [Google Scholar] [CrossRef] [Scilit]
- Abou-Gamra, Z.M.; Ahmed, M.A. TiO2 nanoparticles for removal of malachite green dye from wastewater. Adv. Chem. Eng. Sci. 2015, 5, 373–388. [Google Scholar] [CrossRef]
- Rajput, R.B.; Jamble, S.N.; Kale, R.B. Solvothermal synthesis of anatase TiO2 for the detoxification of methyl orange dye with improved photodegradation efficiency. Eng. Sci. 2021, 17, 176–184. [Google Scholar] [CrossRef] [Scilit]
- Ziental, D.; Czarczynska-Goslinska, B.; Mlynarczyk, D.T.; Glowacka-Sobotta, A.; Stanisz, B.; Goslinski, T.; Sobotta, L. Titanium dioxide nanoparticles: Prospects and applications in medicine. Nanomaterials 2020, 10, 387. [Google Scholar] [CrossRef] [Scilit]
- Haider, A.J.; Al Anbari, R.H.; Kadhim, G.R.; Salame, C.T. Exploring potential environmental applications of TiO2 nanoparticles. Energy Procedia 2017, 119, 332–345. [Google Scholar] [CrossRef] [Scilit]
- Haider, A.J.; Jameel, Z.N.; Al-Hussaini, H.M. Review on: Titanium dioxide applications. Energy Procedia 2019, 157, 17–29. [Google Scholar] [CrossRef] [Scilit]
- Hassan, S.M.; Ahmed, A.I.; Mannaa, M.A. Preparation and characterization of SnO2-doped TiO2 nanoparticles: Effect of phase changes on the photocatalytic and catalytic activity. J. Sci. Adv. Mater. Devices 2019, 4, 400–412. [Google Scholar] [CrossRef] [Scilit]
- Pham, V.; Tran, H.H.; Nguyen, S.; Thi, C.; Hieu, L. One-step hydrothermal synthesis and characterisation of SnO2 nanoparticle-loaded TiO2 nanotubes with high photocatalytic performance under sunlight. J. Mater. Sci. 2018, 53, 10. [Google Scholar] [CrossRef] [Scilit]
- Wang, Y.; Li, W.; Zhou, B.; Zhao, X. Synthesis and characterization of SnO2–TiO2 nanocomposite with rutile phase via hydrothermal method at low temperature. Chem. Res. Chin. Univ. 2013, 29, 617–620. [Google Scholar] [CrossRef] [Scilit]
- Bargougui, R.; Pichavant, A.; Hochepied, J.-F.; Berger, M.-H.; Gadri, A.; Ammar, S. Synthesis and characterization of SnO2, TiO2 and Ti0.5Sn0.5O2 nanoparticles as efficient materials for photocatalytic activity. Opt. Mater. 2016, 58, 253–259. [Google Scholar] [CrossRef] [Scilit]
- Messaadi, C.; Ghrib, T.; Jalali, J.; Ghrib, M.; Alyami, A.; Gaidi, M.; Manso-Silván, M.; Ezzaouia, H. Synthesis and characterization of SnO2–TiO2 nanocomposite photocatalysts. Curr. Nanosci. 2019, 15, 398–406. [Google Scholar] [CrossRef] [Scilit]
- Hassan, S.M.; Ahmed, A.I.; Mannaa, M.A. Structural, photocatalytic, biological and catalytic properties of SnO2/TiO2 nanoparticles. Ceram. Int. 2018, 44, 6201–6211. [Google Scholar] [CrossRef] [Scilit]
- Monshi, A.; Foroughi, M.R.; Monshi, M. Modified Scherrer equation to estimate more accurately nano-crystallite size using XRD. World J. Nano Sci. Eng. 2012, 2, 154–160. [Google Scholar] [CrossRef]
- Jannat, M.R.; Biswas, B.; Rahman, M.L.; Ahmed, M.F.; Hossain, M.J.; Khanam, J.; Sharmin, N. Validity of crystallite size determination methods based on XRD peak broadening in pure and metal-doped nickel ferrites. Results Mater. 2025, 28, 100762. [Google Scholar] [CrossRef] [Scilit]
- Rychtowski, P.; Tryba, B.; Skrzypska, A.; Felczak, P.; Sreńscek-Nazzal, J.; Wróbel, R.J.; Nishiguchi, H.; Toyoda, M. Role of the hydroxyl groups coordinated to TiO2 surface on the photocatalytic decomposition of ethylene at different ambient conditions. Catalysts 2022, 12, 386. [Google Scholar] [CrossRef] [Scilit]
- Belhadj, H.; Hakki, A.; Robertson, P.K.J.; Bahnemann, D.W. In situ ATR-FTIR study of H2O and D2O adsorption on TiO2 under UV irradiation. Phys. Chem. Chem. Phys. 2015, 17, 22940–22946. [Google Scholar] [CrossRef] [Scilit]
- Zamiri, G.; Haseeb, A.S.M.A.; Jagadish, P.; Khalid, M.; Kong, I.; Krishnan, S.G. Three-dimensional graphene–TiO2–SnO2 ternary nanocomposites for high-performance asymmetric supercapacitors. ACS Omega 2022, 7, 43981–43991. [Google Scholar] [CrossRef] [Scilit]
- Bulla, M.; Kumar, V.; Devi, R.; Kumar, S.; Sisodiya, A.K.; Dahiya, R.; Mishra, A.K. Natural resource-derived NiO nanoparticles via aloe vera for high-performance symmetric supercapacitor. Sci. Rep. 2024, 14, 7389. [Google Scholar] [CrossRef] [Scilit]
- Tang, W.; Chen, J.; Yin, Z.; Sheng, W.; Lin, F.; Xu, H.; Cao, S. Complete removal of phenolic contaminants from bismuth-modified TiO2 single crystal photocatalysts. Chin. J. Catal. 2021, 42, 347–355. [Google Scholar] [CrossRef] [Scilit]
- He, P.; Quan, Y.; Xu, X.; Yan, M.; Yang, W.; An, Q.; He, L.; Mai, L. High-performance aqueous zinc-ion battery based on layered H2V3O8 nanowire cathode. Small 2017, 13, 1702551. [Google Scholar] [CrossRef] [Scilit] [PubMed]
- Zheng, Y.; Gao, X.; Miao, C.; Dai, H.; Xia, Z.; Wang, H.; Yao, Z.; Zhou, J.; Sun, G. CO2V2O7@Ti3C2TxMXene hollow structures synergizing the merits of conversion and intercalation for efficient lithium-ion storage. Adv. Sustain. Syst. 2022, 6, 2200153. [Google Scholar] [CrossRef] [Scilit]
- Gharbani, P.; Mehrizad, A.; Mosavi, S.A. Optimization, kinetics and thermodynamics studies for photocatalytic degradation of methylene blue using cadmium selenide nanoparticles. npj Clean Water 2022, 5, 34. [Google Scholar] [CrossRef] [Scilit]
- Uddin, M.J.; Alam, M.M.; Islam, M.A.; Snigda, S.R.; Das, S.; Rahman, M.M.; Uddin, M.N.; Morris, C.A.; Gonzalez, R.D.; Diebold, U.; et al. Tailoring the photocatalytic reaction rate of a nanostructured TiO2 matrix using additional gas phase oxygen. Int. Nano Lett. 2013, 3, 16. [Google Scholar] [CrossRef] [Scilit]
- Hokonya, N.; Mahamadi, C.; Mukaratirwa-Muchanyereyi, N.; Gutu, T.; Zvinowanda, C. Green synthesis of P–ZrO2–CeO2–ZnO nanoparticles using leaf extracts of Flacourtia indica and their application for the photocatalytic degradation of Congo red. Heliyon 2022, 8, e10277. [Google Scholar] [CrossRef] [Scilit]
- Dodd, A.C.; McKinley, A.J.; Saunders, M.; Tsuzuki, T. Effect of particle size on the photocatalytic activity of nanoparticulate zinc oxide. J. Nanopart. Res. 2006, 8, 43–51. [Google Scholar] [CrossRef] [Scilit]

Disclaimer/Publisher’s Note: The statements, opinions and data contained in all publications are solely those of the individual author(s) and contributor(s) and not of MDPI and/or the editor(s). MDPI and/or the editor(s) disclaim responsibility for any injury to people or property resulting from any ideas, methods, instructions or products referred to in the content. |
© 2026 by the authors. Licensee MDPI, Basel, Switzerland. This article is an open access article distributed under the terms and conditions of the Creative Commons Attribution (CC BY) license.