


Abstract
Advanced thermal management applications, including electronics cooling, battery systems, and micro heat exchangers, are increasingly requiring thermally conductive yet flexible polymer composites. Composite films containing total nanofiller loadings of 2.5, 5, 7.5, and 10 wt.% were systematically characterized using SEM, TGA, DSC, TT, and SSTM following ASTM C177-19. SEM analysis confirmed uniform dispersion and effective network formation of MWCNTs and GNPs within the TPU matrix at higher filler loadings. Thermal stability improved significantly, with the degradation onset temperature increasing from 319.2 °C for pure TPU to 369 °C for the TPU/MWCNT/GNP (90/5/5 wt.%) composite. DSC results revealed enhanced glass transition and melting temperatures, indicating improved thermal resistance and crystallinity. Mechanical testing showed a substantial increase in Young’s modulus, reaching 72.5 MPa for the 90/5/5 wt.% composite, corresponding to a 286.66% improvement over pure TPU. Most notably, steady-state thermal conductivity increased dramatically from 0.20 W/mK for pure TPU to 1.533 W/mK for the 90/5/5 wt.% composite, representing a 666.50% enhancement. The experimental results closely aligned with percolation-based theoretical models at higher filler concentrations. Overall, the developed hybrid nanofiller TPU composites demonstrate a synergistic improvement in thermal conductivity, mechanical strength, and thermal stability, making them promising candidates for flexible thermal management components in electronics, automotive, renewable energy, and biomedical applications.
1. Introduction
In recent decades, thermally conductive polymer composites (TCPCs) have gained substantial scientific attention because of their broad applicability in various technological domains. The blending of two or more polymers can create custom materials with specific properties. However, the components often need to be mixed in a particular way to achieve the desired results [1,2]. Thermoplastic polyurethane (TPU) is a widely recognized polymer for its multipurpose properties, including elasticity, exceptional resilience, easy obtainability [3], biodegradable nature [4], and resistance to various forms of damage, such as scratches and distortion [5]. Its low heat distortion temperature enables suitable adjustment of its characteristics [6]. However, uncontaminated TPU exhibits inferior mechanical, electrical and thermal properties compared to other polymers in the thermoplastic group [7,8]. Incorporating highly conductive nanofillers is often advantageous to enhance its properties, including mechanical strength, electrical conductivity and the thermal properties of composites [9,10]. Flexible, thermally conductive polymer composites (CPCs), such as some of those based on TPU, are crucial for thermal management applications because of their ability to dissipate heat while efficiently offering flexibility for diverse usage situations [11,12]. Carbon-derived nanofillers, such as graphene nanoplatelets (GNPs), carbon nanotubes (CNTs), carbon black, and carbon fibers, along with certain conductive micro-scale fillers from metallic and ceramic families, have become key contributors to the rapid advancement of nanotechnology, nanocomposite materials, and nanoscience in recent years [13,14]. Among the various nanofillers available today, graphene nanoplatelets (GNPs) and carbon nanotubes (CNTs) are the most widely used and highly demanding materials [15,16]. MWCNTs exhibit greater necessity within the CNT group compared to single-walled CNTs. The utilization of GNPs and MWCNTs has increased across numerous user areas, such as aerospace, defense, healthcare, sensor technology, electronics, packaging, biotech, automotive, and more [17,18].
Although thermoplastic polyurethane (TPU) offers advantages such as flexibility, durability, and ease of processing, its relatively low thermal conductivity restricts its direct use in applications requiring efficient heat dissipation. To address this limitation, the incorporation of thermally conductive nanofillers has been explored as an effective approach to improve the thermal and mechanical performance of TPU-based composites. Carbon nanomaterials, including multi-walled carbon nanotubes (MWCNTs) and graphene nanoplatelets (GNPs), are particularly attractive because of their high intrinsic conductivity and their ability to form conductive networks within polymer matrices. However, the combined influence of these hybrid nanofillers in TPU systems and their effect on microstructural, thermal, and mechanical characteristics still require further systematic investigation [19,20].
Some of the developments in this area, with recent advancements, are presented in this section. Vairagade et al. [21] investigated heat recovery from a hemispherical cavity solar receiver using a solar parabolic dish system integrated with an additively manufactured, thermally conductive polymer composite heat exchanger. The TPU/MWCNT/GNP composite design enhanced thermal performance, delivering up to a 10.91% improvement in efficiency under different operating conditions. The findings highlight the promise of 3D-printed TPU-based composites for improving solar energy applications. Gnanasekaran et al. [22] explored and utilized fused deposition modeling (FDM) to fabricate thermally conductive polymer nanocomposites using PBT reinforced with CNTs and graphene. The results showed that PBT/CNT composites demonstrated better performance, as confirmed through effective extrusion and 3D printing of the materials. Thiyagu et al. [10] experimentally investigated graphene-based polyurethane (PU) nanocomposites, focusing on their thermal and morphological properties. Their study aimed to improve the thermal stability of PU by incorporating various weight percentages of graphene through melt mixing and solvent casting methods. The study confirmed that the graphene was uniformly dispersed within the PU matrix without altering its chemical properties, as evidenced by various material characterization techniques, including SEM, FTIR, and XRD. This novel material can act as the best substitute for metals in microelectronics, renewable automotive, and biomedical fields. Kumar et al. [23] examined the electrical performance of EVA/graphite composites produced through a CNC-supported fused layer modeling technique. SEM observations showed even distribution of graphite in the EVA matrix, which contributed to enhanced electrical conductivity. Composites were prepared in ratios from 100/0 to 50/50 wt.%, with a percolation threshold observed at 70/30. The highest conductivity, 539 times that of pure EVA, was achieved at 50 wt.% graphite loading. Their study demonstrated a remarkable enhancement in the thermal performance of the developed TPU composites. MWCNTs and GNPs were incorporated to strengthen the material’s thermal and mechanical characteristics. In addition, both theoretical predictions and experimental measurements of thermal conductivity were evaluated for potential application use. The present investigation aimed to conduct further research on optimizing nanofiller proportions for several thermal management applications.
Novelty of the Present Investigation
The current investigation demonstrated the systematic development and characterization of thermoplastic polyurethane (TPU)-based hybrid nanocomposites reinforced with multi-walled carbon nanotubes (MWCNTs) and graphene nanoplatelets (GNPs). Although individual nanofillers such as carbon nanotubes and graphene have been extensively studied, the available literature on their combined hybrid reinforcement within a TPU matrix is very limited, and comprehensive investigations of their synergistic effects remain scarce. In this work, a hybrid nanofiller system consisting of one-dimensional MWCNTs and two-dimensional GNPs is incorporated into the TPU matrix to explore their combined influence on the microstructural and mechanical behavior of the composite films. Furthermore, the study systematically evaluates different hybrid nanofiller compositions to identify an optimized formulation that provides significant improvement in Young’s modulus while maintaining the inherent flexibility of TPU. The investigation therefore contributes to addressing the existing research gap in TPU-based hybrid nanocomposites, providing new insights into the role of combined nanocarbon reinforcements and offering potential pathways for developing advanced polymer composites for structural and multifunctional engineering applications.
2. Materials and Methods
2.1. Materials
We used pellets of TPU provided by NU Ossa Mediequip Private Ltd. in Nagpur, India. Dimethylformamide (DMF) was purchased from RCF Ltd., Amravati, Maharashtra, India. Graphene and MWCNT nanofillers were acquired from Tokyo Chemical Industry (India) Ltd., Chennai, Tamil Nadu, India. All chemicals and nanofillers were used as received without further purification.
2.2. Preparation of MWCNT and GNP-Reinforced TPU Composites
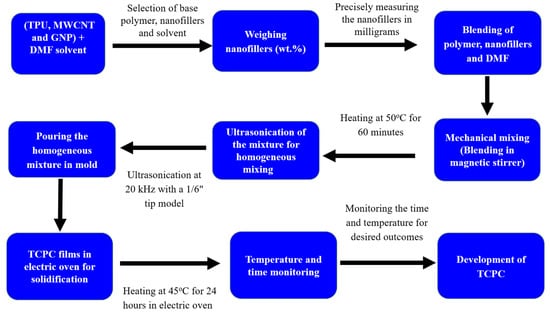
Prior to mixing, the TPU pellets were air-dried at 45 °C for three hours to remove any absorbed moisture that could affect dispersion and film formation. The weight ratio of 1:5 TPU to DMF was maintained. The required amounts of MWCNTs and GNPs were accurately weighed in milligrams using a 0.1 mg precision analytical balance (PB-220X) supplied by Ravi Scientific Industries Pvt. Ltd., New Delhi, India. The MWCNT nanofillers used had an average diameter of 8–10 nm, a length of about 10 μm, and a purity of nearly 99.99%. The GNP nanofillers measured 8–10 nm in size, had a thickness of around 8 μm, and also exhibited a purity close to 99.99%. The nanofillers were gradually introduced into the TPU–DMF solution to avoid agglomeration during mixing. Figure 1 depicts the methodology adopted to fabricate the TPU composites.
Figure 1.
Methodology adopted to fabricate the TPU composites.
The blend was magnetically stirred at 50 °C for one hour (MSH-300i, Avantor Performance Materials India Pvt. Ltd. Haryana, India), followed by one hour of probe sonication using an ATP-500 unit (20 kHz, 1/6” tip, 30–500 W). This process helped to get uniform dispersion of the conductive nanofillers within the polymer matrix. The combination of magnetic stirring and ultrasonication assisted in breaking nanofiller clusters and promoting uniform dispersion within the TPU matrix.
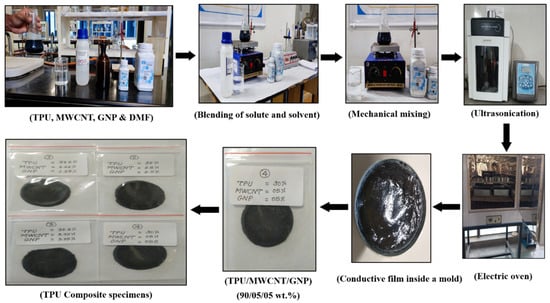
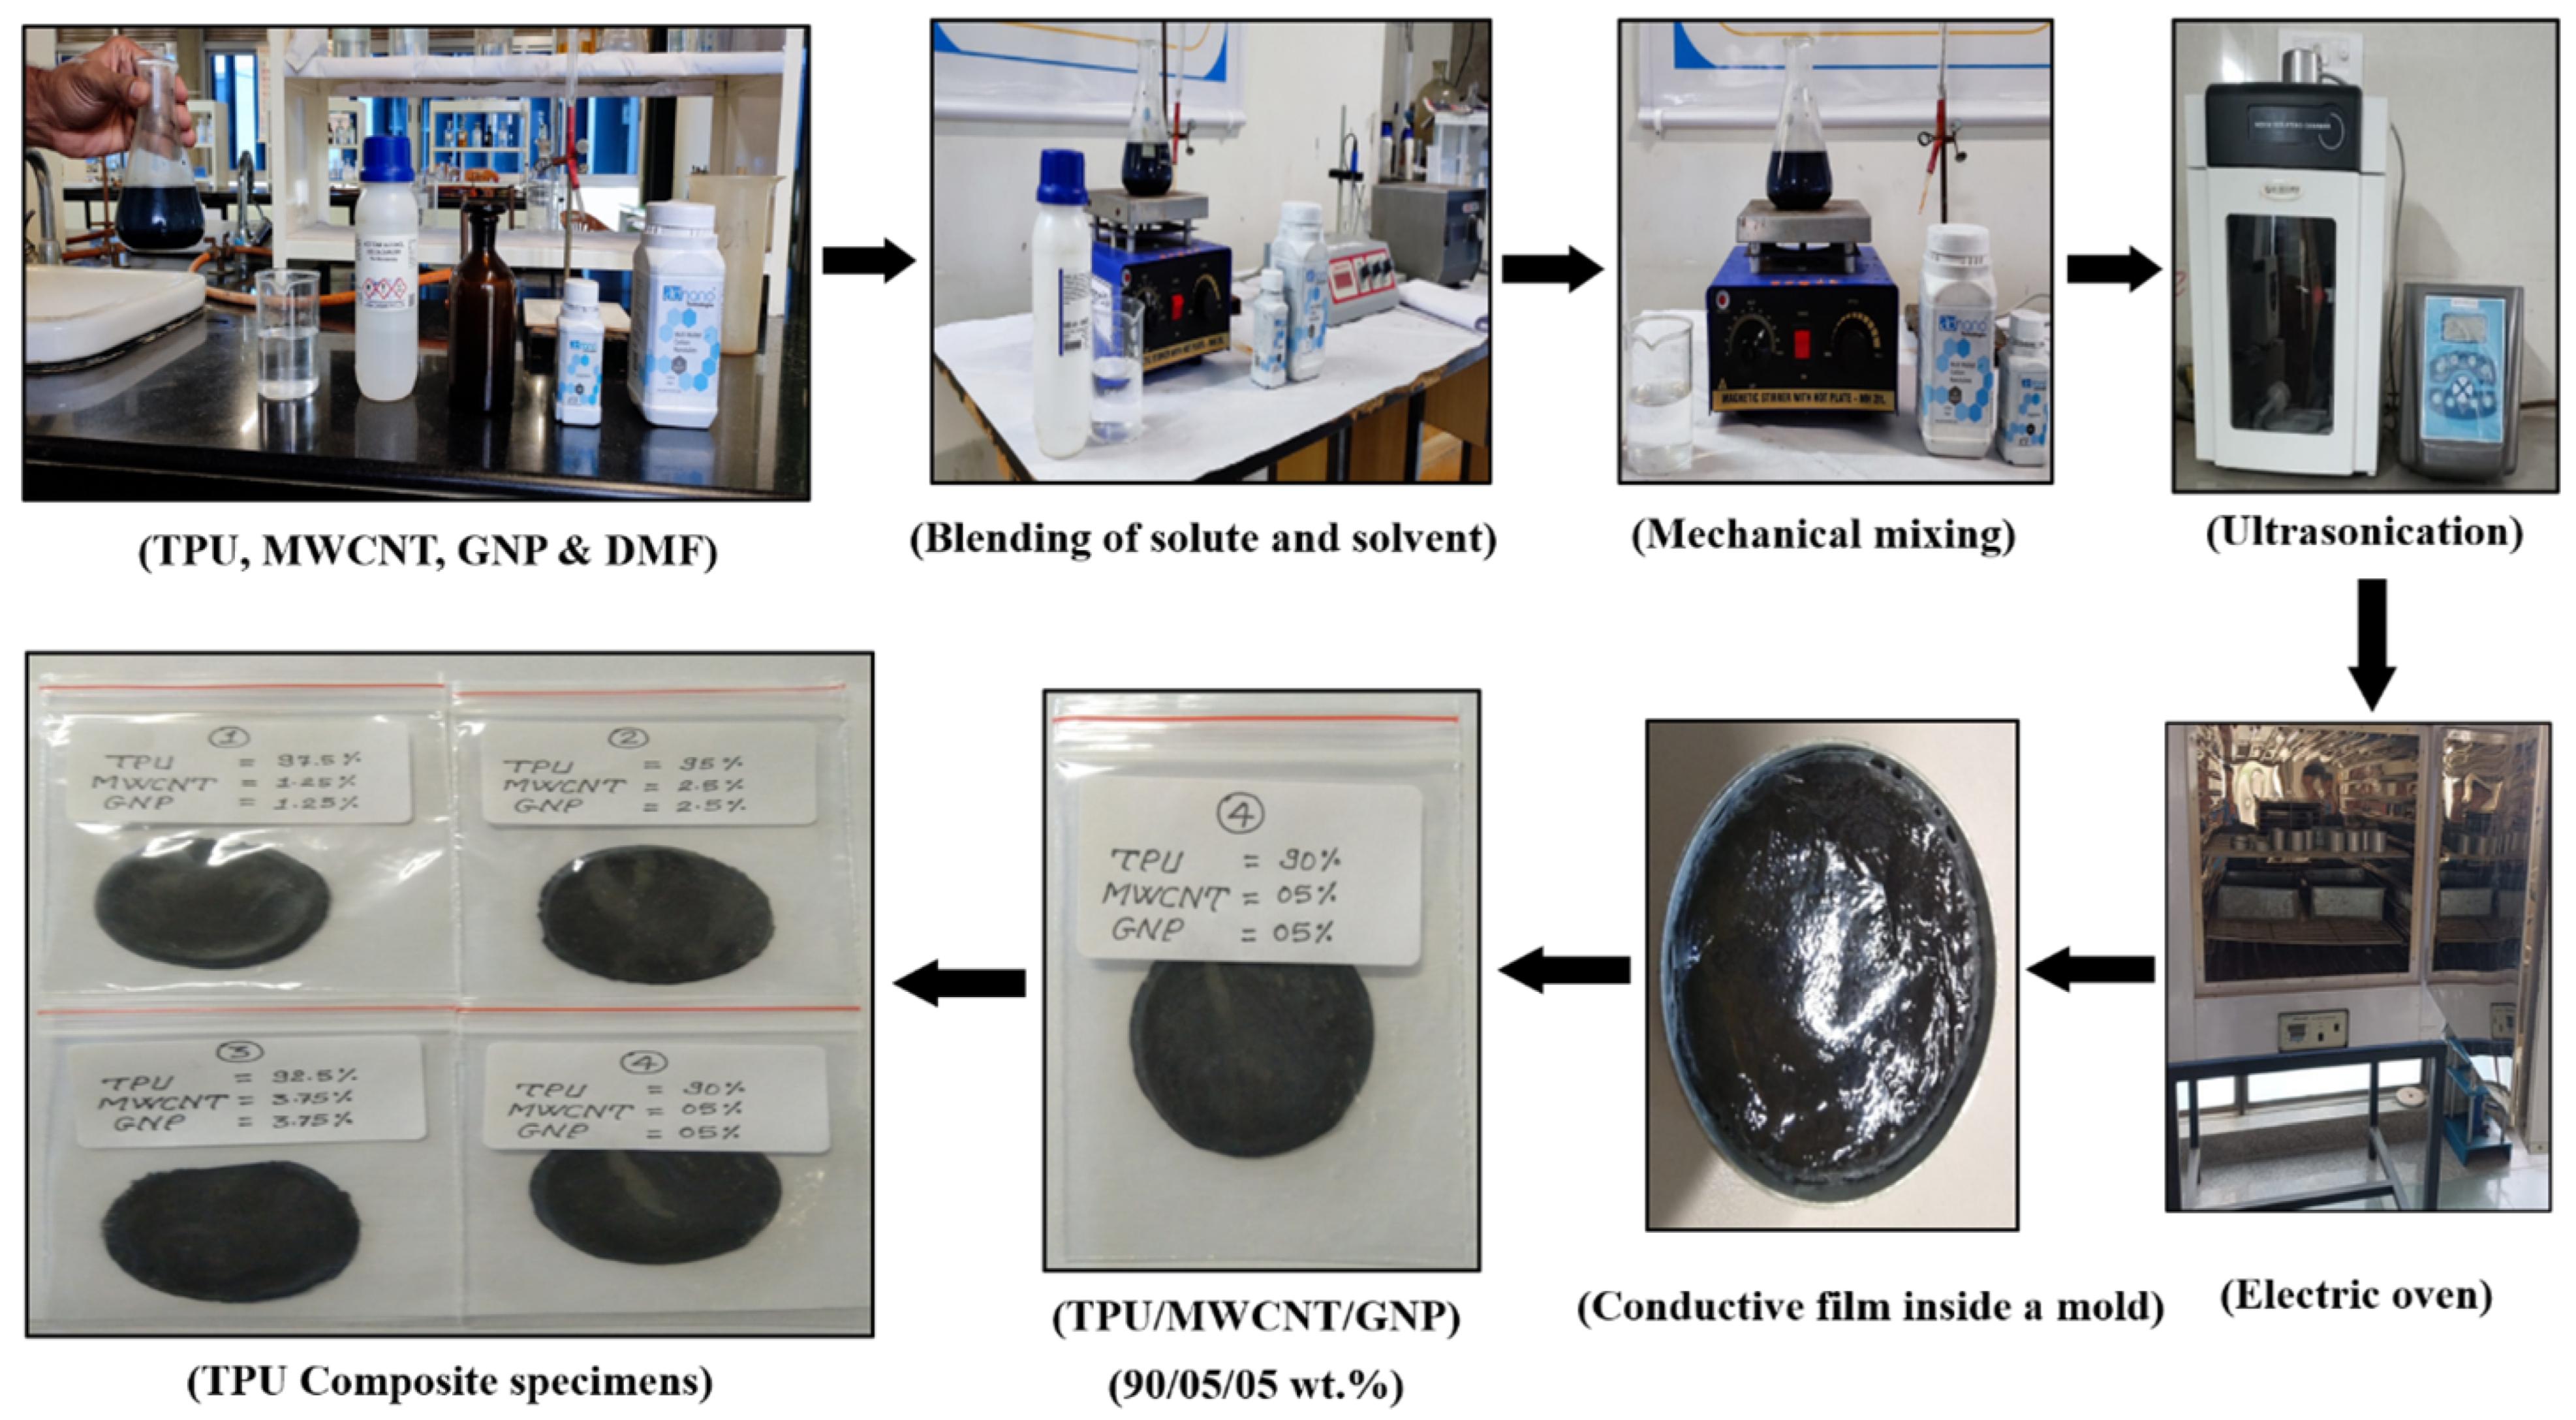
Following the ultrasonication shown in Figure 2, the solution was placed into the circular chamber of an electric oven and maintained at 45 °C for 24 h. This step allowed slow evaporation of the DMF solvent and resulted in the formation of solid TPU composite films. The method adopted to fabricate PU composite combinations is shown in Figure 1. In hybrid composites, the thermal conductivity (keff) can be determined using Equation (1) [24].
Figure 2.
Fabrication of TPU composites in the research laboratory.
In Equation (1), represents the actual thermal conductivity of composites, while and indicate the volumetric proportion. These parameters are commonly used in theoretical models to estimate the effective thermal conductivity of multiphase composite materials.
In the present study, we prepared four conductive films, labelled as TPU97.5/1.25/1.25, TPU95/2.5/2.5, TPU92.5/3.75/3.75, and TPU90/05/05, using the total varying weight percentages of MWCNTs and GNPs (2.5, 5, 7.5, and 10 wt.%). Table 1 displays the compositions that were used for the TPU films. In the TPU composites designation, “TPU” stands for thermoplastic polyurethane, with the first value corresponding to the polyurethane amount, the second to MWCNT content, and the third to graphene (GNP). The overall formulation is expressed as TPU/MWCNT/GNP. This nomenclature was adopted to clearly represent the relative composition of polymer and hybrid nanofillers in each fabricated specimen.
Table 1.
Nanofiller distributions for the thermally conductive TPU composites.
2.3. Testing and Characterizations
2.3.1. Scanning Electron Microscopy Characterization
The examination of the cut cross-section morphology of the TPU/MWCNT/GNP composite films, incorporating 2.5, 5, 7.5, and 10 wt.% of combined nanofillers, was conducted after the composite preparation, as shown in Figure 2. The composite underwent a scanning electron microscopy test (Make: EcoSEM-3062, ECO Instrument Co., Ltd., China) with a magnification range from 1000× to 20,000×.
2.3.2. Thermogravimetric Analysis (TGA) Characterization
The thermal behavior of the fabricated samples was evaluated using a thermogravimetric analyzer (Make: TGA 8000, model N5320010, from PerkinElmer Co., Ltd., USA) in a nitrogen environment. The TPU/MWCNT/GNP composite films containing 2.5, 5, 7.5 and 10 wt.% of MWCNTs and GNPs were used. These films were exposed to temperatures up to 600 °C with a rise of 10 °C/min. The samples, weighing eight to ten milligrams, were placed in a crucible for the tests needed. Subsequently, the TGA plots of the composite films were analyzed.
2.3.3. Differential Scanning Calorimeter Characterization
The composite films were further assessed for thermal characteristics using a DSC (N-650, SCINCO Co., Ltd., Republic of Korea). TPU/MWCNT/GNP samples weighing around 10 milligrams were loaded in crucibles. These specimens were heated to 250 °C at a temperature increase of 10 °C/min in a nitrogen environment for about 10 min. The plots obtained from the DSC tests were analyzed to investigate the composite’s key thermal parameters are melting point, transition temperature, crystallinity, and thermal stability.
2.3.4. Mechanical Testing of the Polymer Composites
A universal testing machine, UTM (UTE-60, FIE Pvt. Ltd., India), was employed to determine the tensile strength at failure of the TPU composites. All the thermally conductive composite films of TPU/MWCNT/GNP were investigated using the tensile testing machine. ASTM D638 test specimens were prepared from the composite compositions fabricated through fused deposition modeling (FDM) 3D printing.
2.3.5. Thermal Conductivity of the Polymer Composites
Thermal conductivity evaluation for obtaining steady-state values typically involves measuring temperatures at regular intervals across alternating layers. K-type thermocouples (TCs) were placed on a circular metallic thin plate and composite films to measure the temperatures under steady-state conditions. A custom apparatus was designed to study one-dimensional heat flow and measure thermal conductivity under steady-state conditions in accordance with ASTM C177-19 [25]. An experimental setup with dimensions 100 × 80 × 25 mm was developed, while the composite specimens had dimensions, e.g., 60 mm diameter and 5 mm thickness. The thermal conductivity of the composite specimens was calculated using Fourier’s law, as shown in Equation (2).
Some hypothetical models of polymer composites have been introduced to estimate thermal conductivity, as shown in Table 2.
Table 2.
Hypothetical models for estimating the thermal conductivity of specimens.
3. Results and Discussion
3.1. SEM Investigations of Flexible Conductive Films
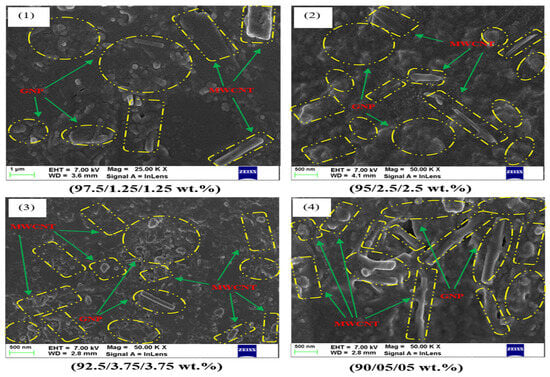
Figure 3 presents the SEM micrographs of the fabricated TPU composites. The dispersion of MWCNT and GNP nanofillers within the TPU matrix was examined for all TPU/MWCNT/GNP composite specimens. The SEM analysis was carried out on thermally conductive TPU composite films containing combined nanofiller (MWCNTs and GNPs) loadings of 2.5%, 5%, 7.5%, and 10% by weight. The films were examined under various magnifications, ranging from 1000× to 200,000×. These investigations offered valuable insights into the morphology and distribution, highlighting the significance of nanofiller content in influencing composite structure.
Figure 3.
SEM images of TPU composite films: (1) 2.5 wt.% of combined MWCNTs and GNPs, (2) 5 wt.% of combined MWCNTs and GNPs, (3) 7.5 wt.% of combined MWCNTs and GNPs, and (4) 10 wt.% of combined MWCNTs and GNPs.
The first two sets of films, as shown in Figure 3, (1) and (2) demonstrated the existence of MWCNT and GNP nanofillers at 2.5 wt.% and 5 wt.%. The films had compositions of TPU/1.25/MWCNT/1.25/GNP and 95/TPU/2.5/MWCNT/2.5/GNP within the polymer matrix. The graphene (GNP) nanofillers are shown with circular and elliptical shapes, while the MWCNTs are shown with rectangular shapes. The third and the fourth set of films, as shown in Figure 3 (3) and (4), with a nanofiller percentage of 7.5 to 10 wt.%, including compositions 92.5/TPU/3.75/MWCNT/3.75/GNP and 90/TPU/05/MWCNT/05/GNP, exhibit high-quality dispersion of the nanofillers in the polymer matrix, as demonstrated by the SEM analysis. Additionally, it was observed that the conductive films may attain enhanced heat transfer capability and higher thermal conductivity, supporting improved TPU composite performance, consistent with the reported findings of Wang et al. (2020), Payam et al. (2019), and Azadi et al. (2022) [36,37,38].
3.2. TGA of the Flexible Conductive Films
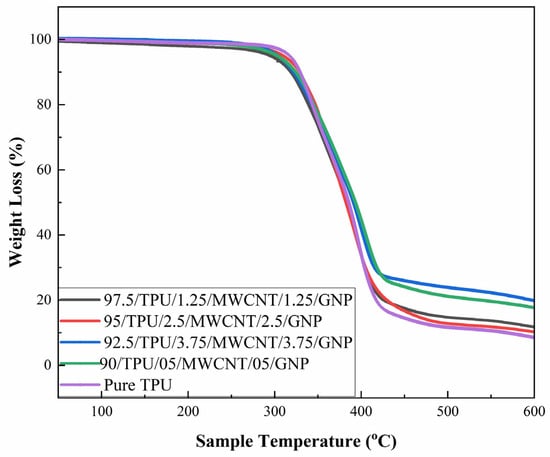
Thermal stability was evaluated using PerkinElmer TGA 8000 for all TPU/MWCNT/GNP formulations listed in Table 3. Pure TPU showed single-step degradation starting at 319.2 °C, serving as the reference. In contrast, the nanofiller-loaded composites shown in Figure 4 also exhibited single-step degradation, with the onset of degradation varying from 329 °C to 369 °C depending on nanofiller concentration.
Table 3.
Degradation and decomposition temperatures of the TPU composites.
Figure 4.
TGA results of TPU composites with different wt.% values of combined MWCNTs and GNPs.
The degradation temperature was determined using the tangent intersection method, where the onset temperature corresponds to the intersection of the extrapolated baseline and the tangent drawn at the point of maximum slope of the TGA curve, as per the instrument software analysis.
Rapid decomposition occurred between 329 and 343 °C, with continued loss up to ~488–533 °C, indicating enhanced thermal stability due to MWCNT and GNP incorporation. This study shows similar results to those reported in the study by Xu et al. (2014) [39].
The decomposition temperature for each composite corresponds to the final stage of major mass loss, approximately 88.5%, ranging from 488 °C to 533 °C, as presented in Table 3, rather than a single fixed decomposition point. The composite with the composition 90/TPU/05/MWCNT/05/GNP demonstrated superior thermal stability, with an initial degradation temperature of 369 °C and a peak decomposition temperature of 533 °C, indicating enhanced resistance to thermal breakdown.
Table 4 illustrates the reduction in thermal degradation (weight percentage) of the composite films, as observed using a TGA analyzer. A progressive improvement in thermal stability (i.e., reduction in degradation rate) was observed from 2.85% to 12.35% across the developed TPU composites. The results further show that the residual weight (wc, %) increases steadily with increasing nanofiller content, indicating enhanced thermal stability of the TPU composites.
Table 4.
Residual weight and reduction in thermal degradation of TPU composites.
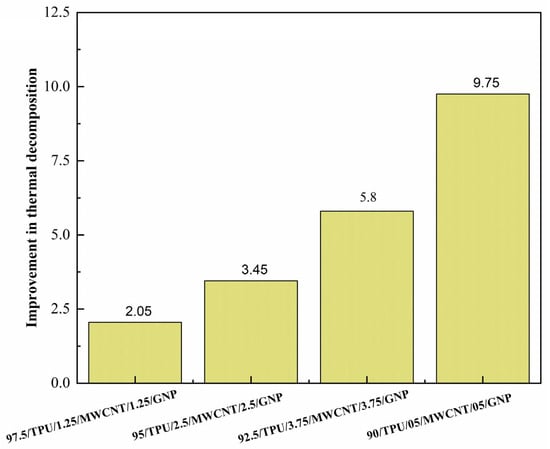
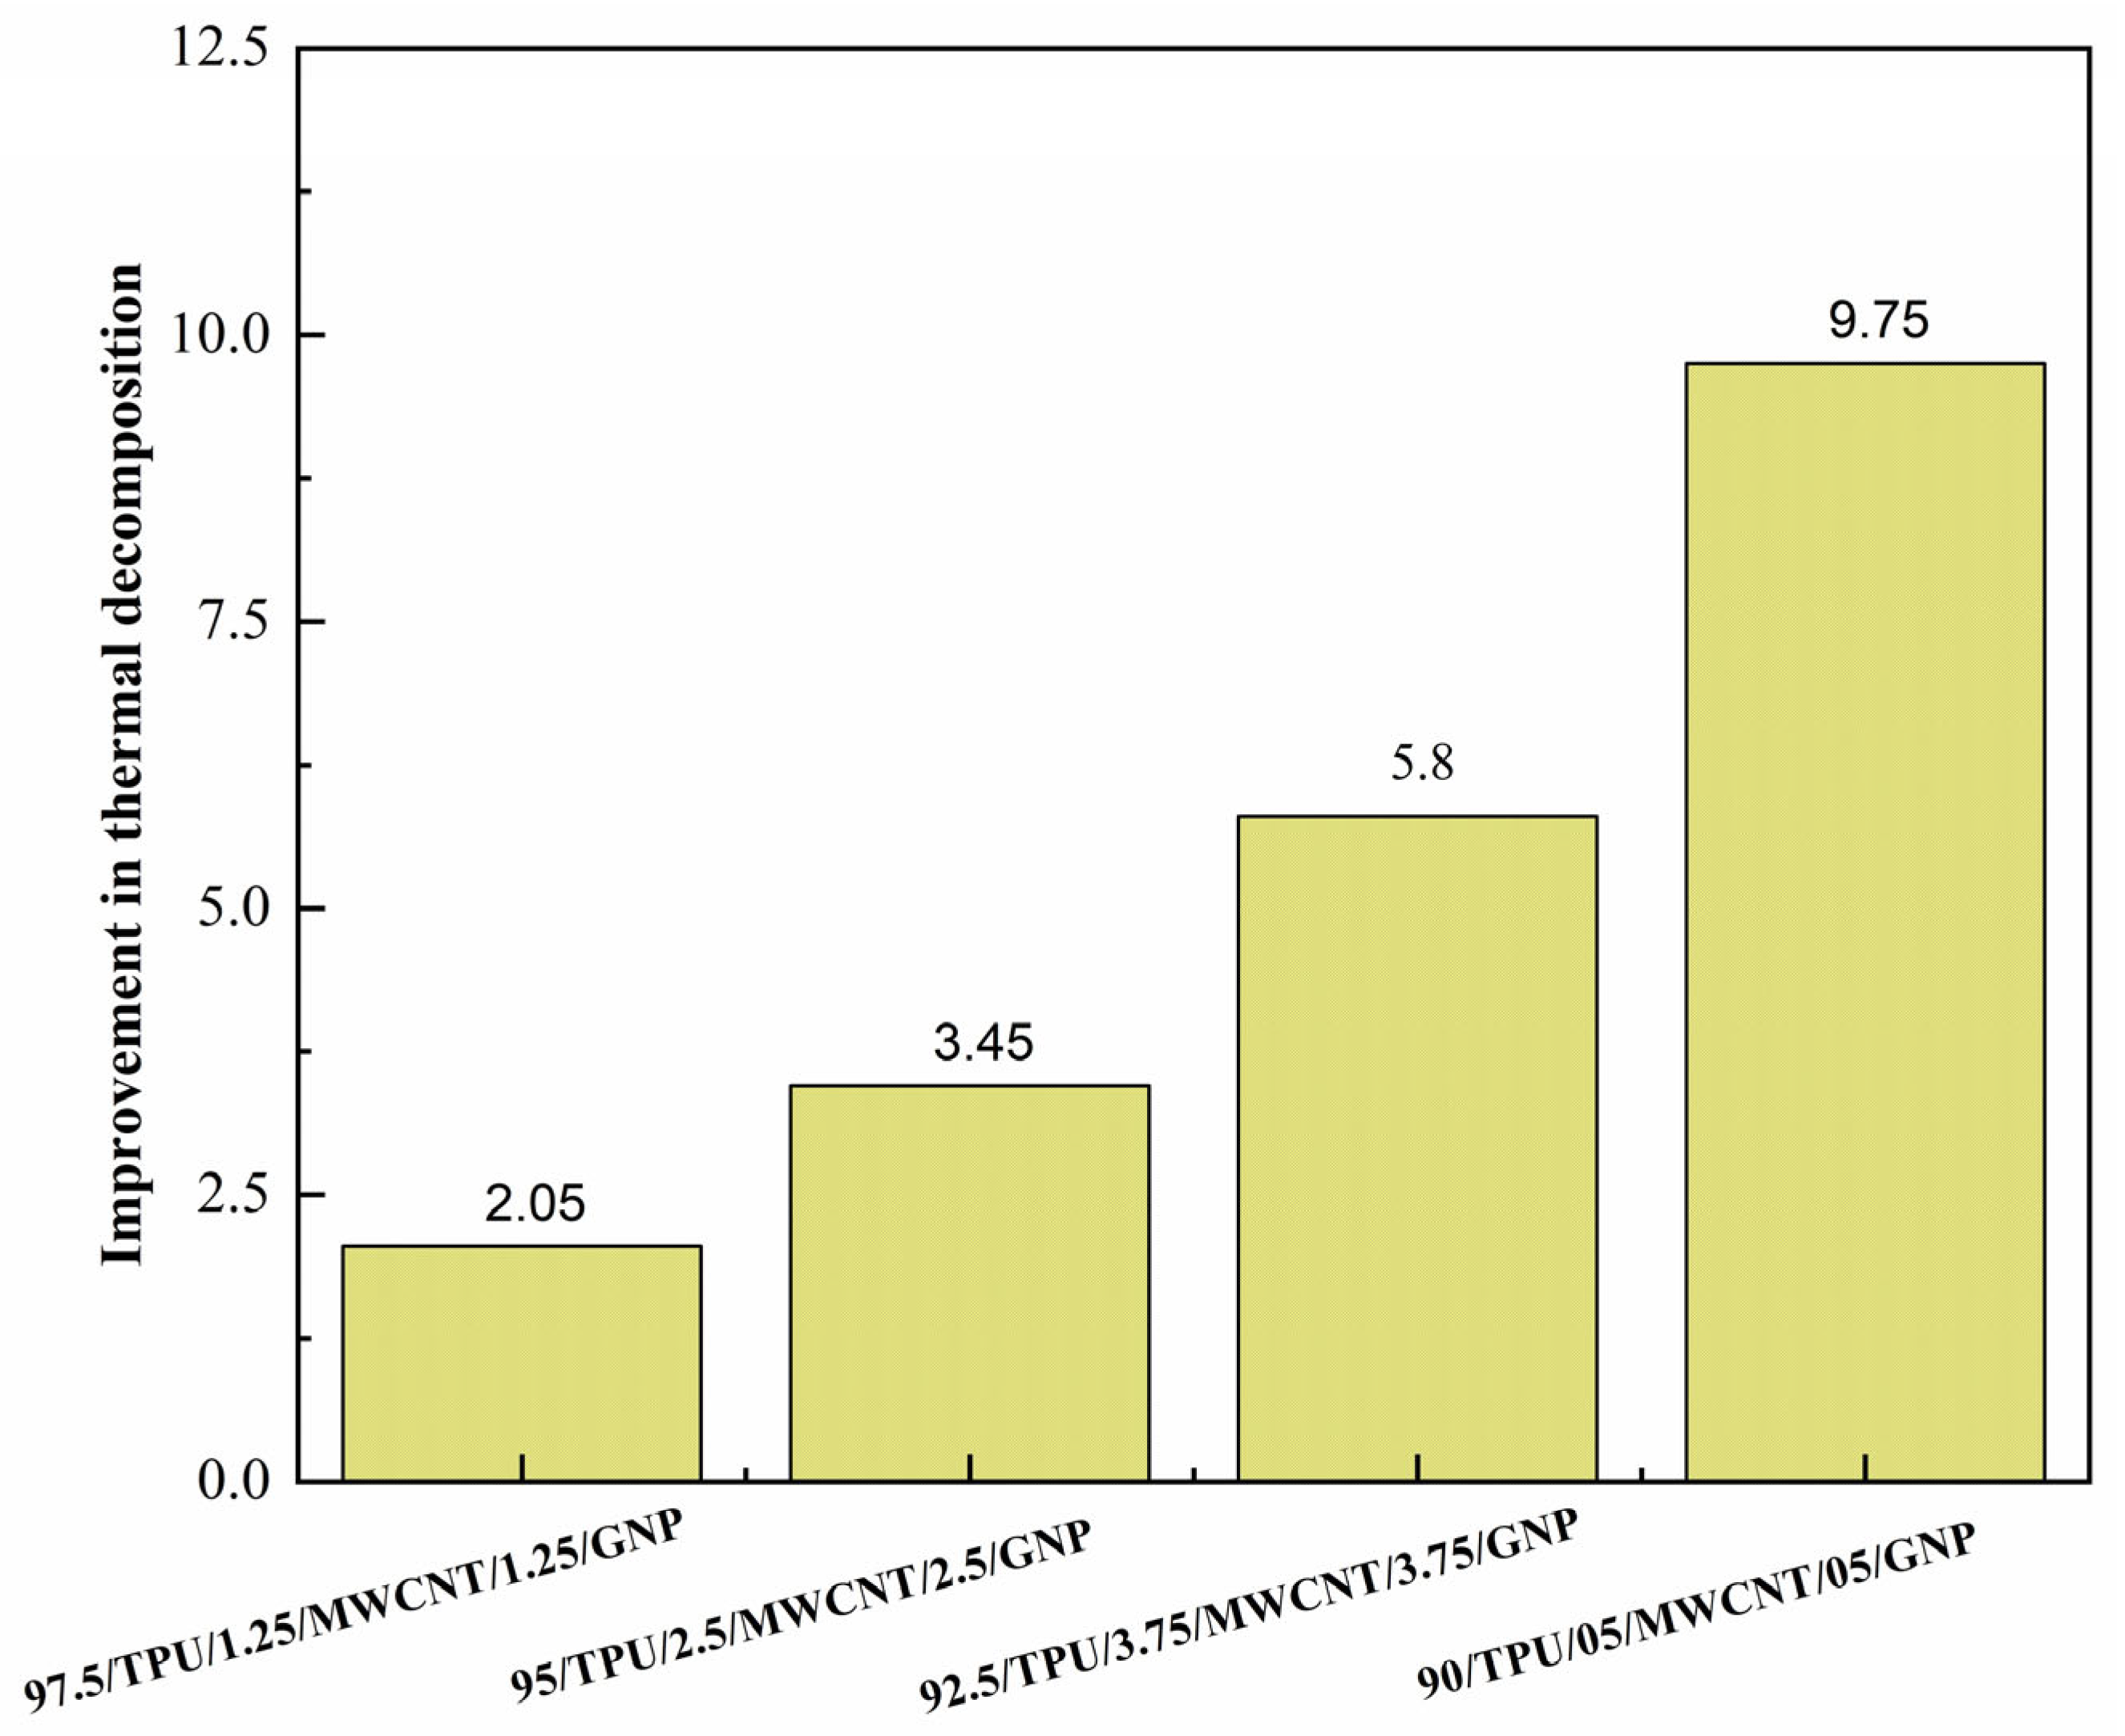
Figure 5 displays the percentage enhancement in thermal decomposition. The graph illustrates an increase in decomposition temperature with increasing nanofiller content, varying from 2.05% to 9.75% across compositions. The decomposition temperature of TPU (TTPU ≈ 485 °C) was considered as the reference value for calculating the percentage improvement across compositions.
Figure 5.
Improvement in thermal decomposition of TPU composite films.
The maximum limit of the degradation temperature of TPU composites moved to a higher range after incorporating the nanofillers. The enhanced thermal stability of TPU/MWCNT/GNP composites makes them ideal for heat-resistant electronic enclosures and automotive components. This claim is in line with prior research findings by Jiao et al., 2009; Xu et al., 2014; Kumar, Gupta and Varadarajan, 2019; Azadi et al., 2022; Bashpa, K and Francis, 2022; Duan et al., 2023; Shaker et al., 2023 [38,39,40,41,42,43,44].
3.3. DSC Analysis of the Flexible Conductive Films
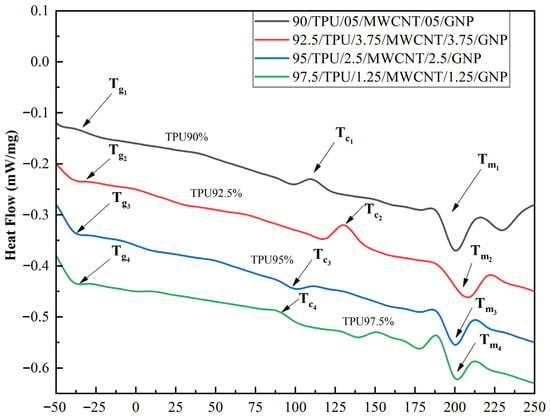
DSC analysis is utilized to explore the compatibility of various polymer composites. Thermal properties, including glass temperature (Tg), crystallization (Tc) and melting temperature (Tm), were obtained from a DSC analyzer. Table 5 provides the data of Tg, Tc, and Tm for our developed flexible TPU films. The DSC analysis also helped to identify the thermal transition behavior of the entire polymer matrix. The measured Tg, Tc, and Tm values indicate systematic changes in thermal transitions with increasing nanofiller content, reflecting modifications in polymer chain mobility and crystallization behavior.
Table 5.
TPU composites characterized by a DSC calorimeter.
Table 6 shows the TPU specimens with their compositions and concentrations of nanofillers. The measured glass transition (Tg), crystallization (Tc), and melting (Tm) temperatures of the developed films demonstrated the transition of thermally conductive specimens from hard to soft states, amorphous to crystalline, and solid to liquid states during the melting process using a DSC calorimeter. The values of peak temperature for these states were recorded during the investigation.
Table 6.
Mechanical tensile test of TPU composites.
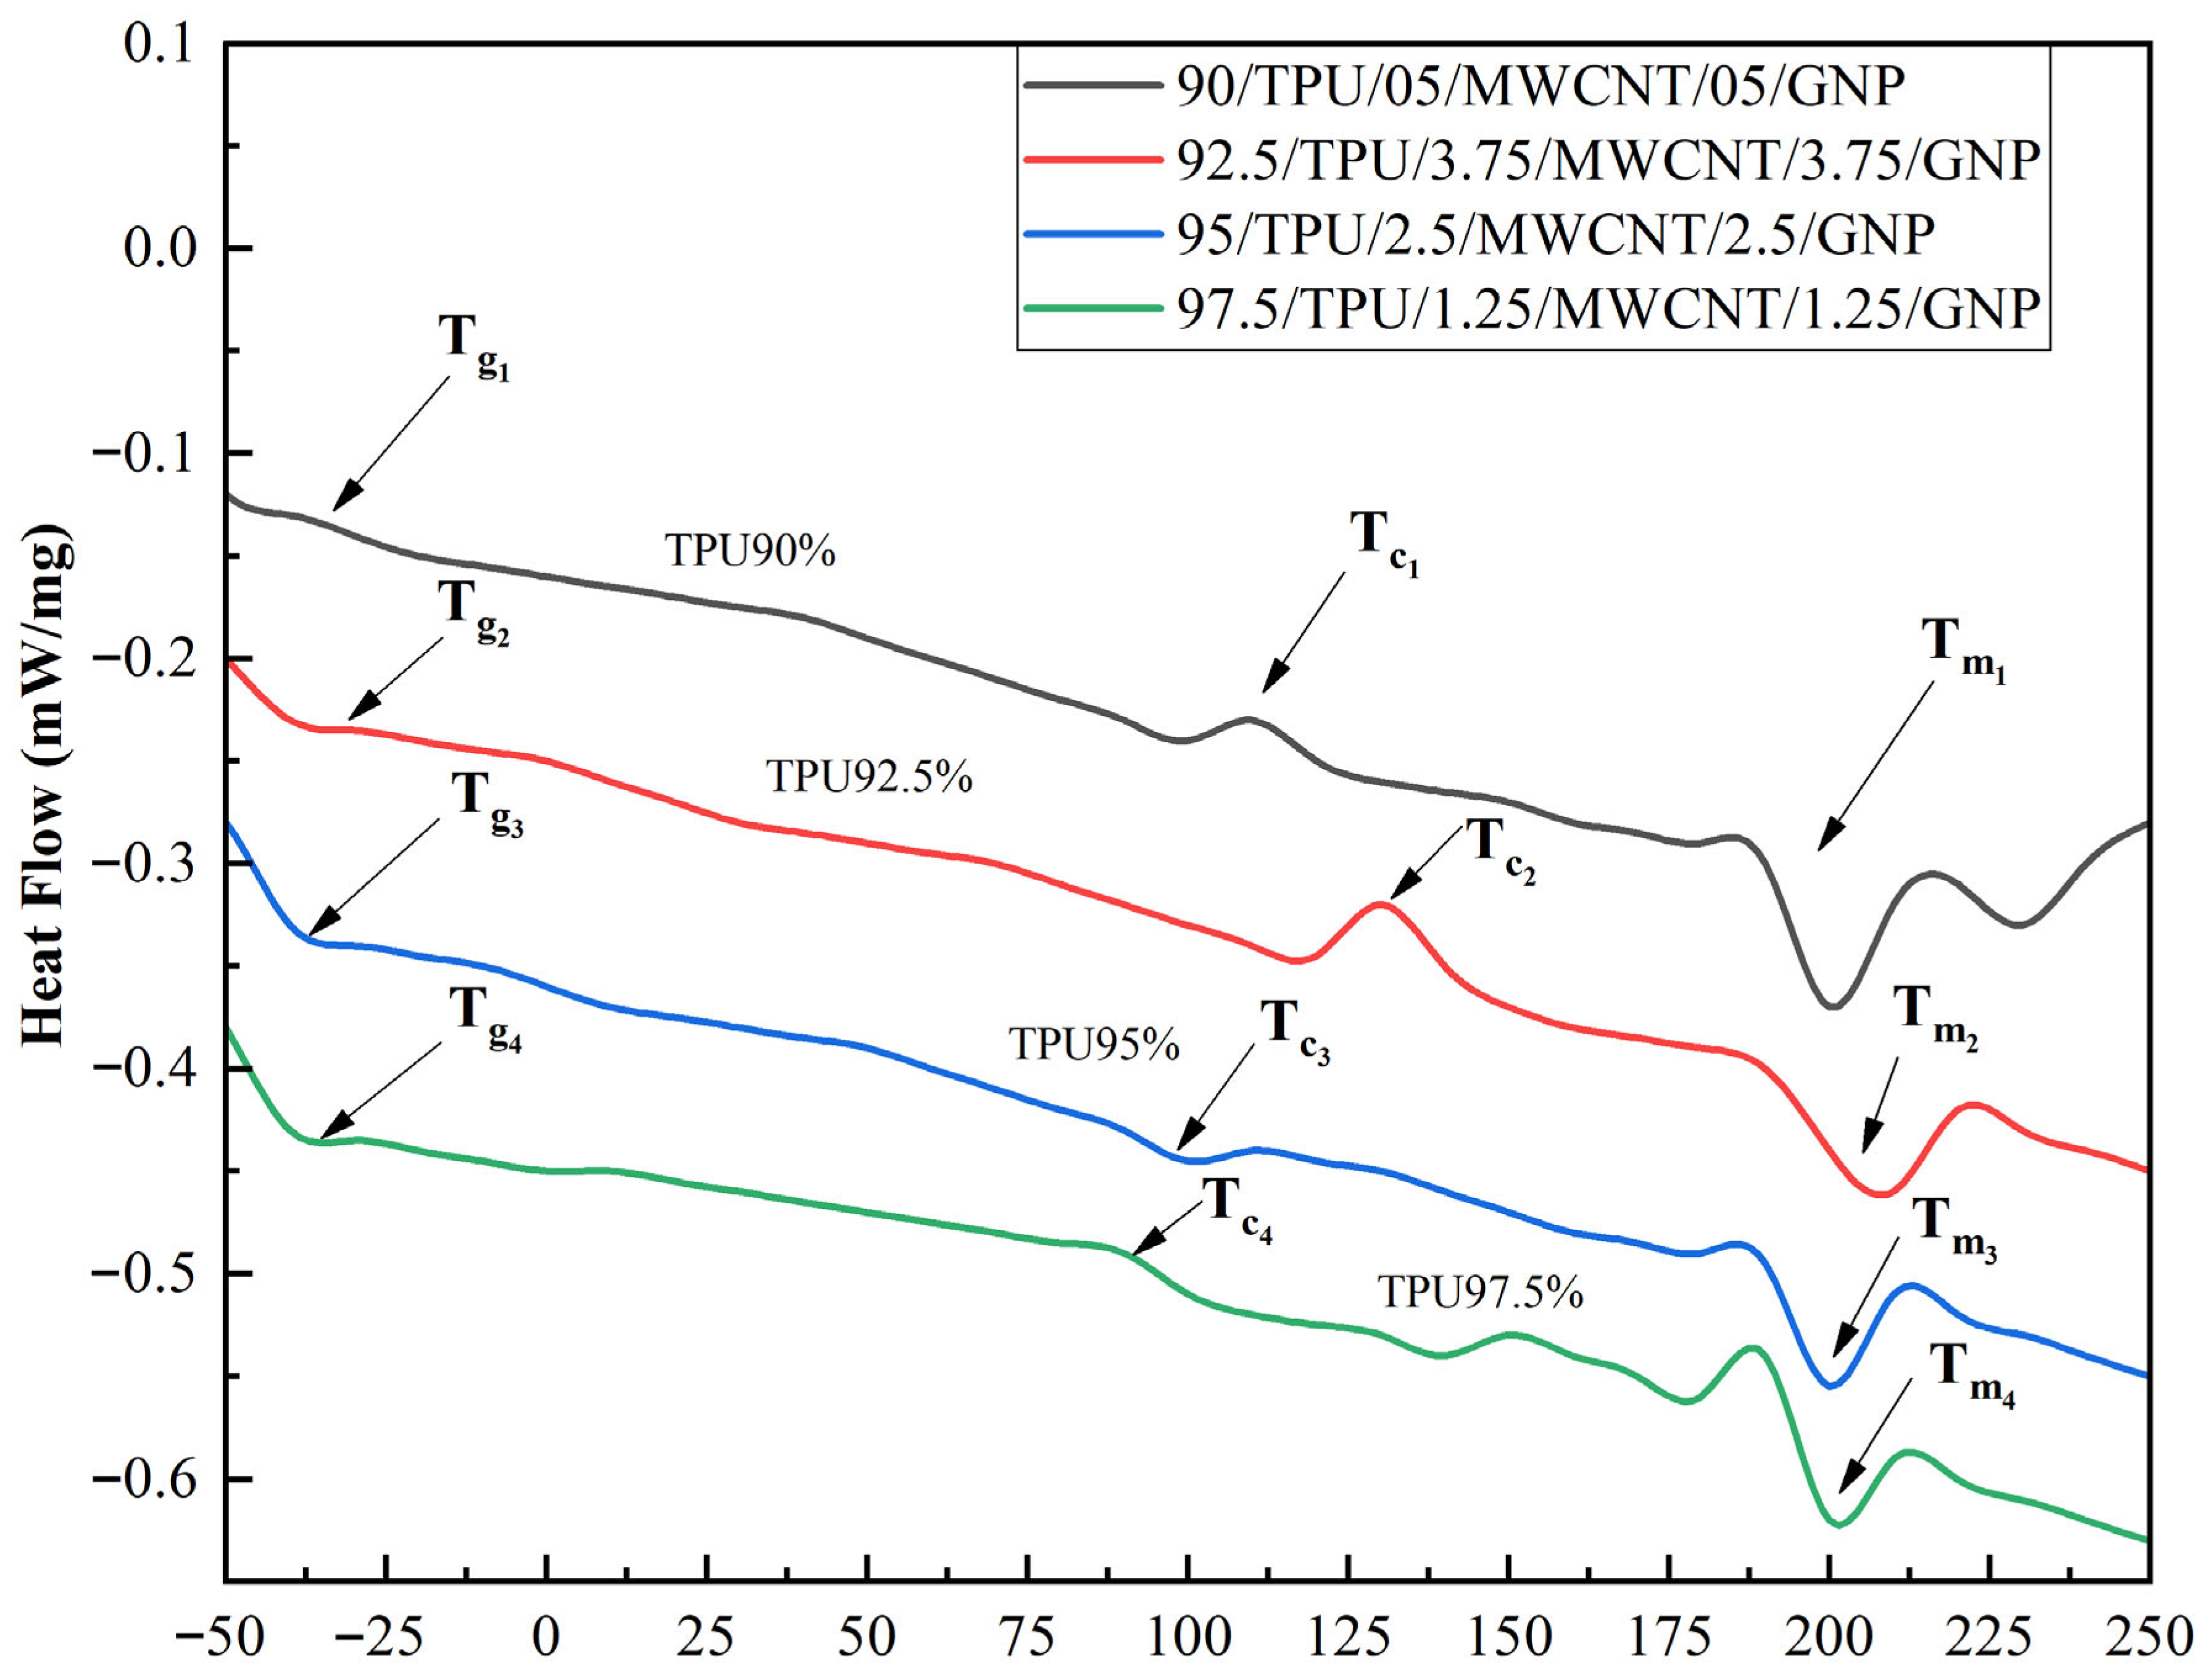
Figure 6 displays the DSC curves for the TPU/MWCNT/GNP composites containing 2.5 wt.%, 5 wt.%, 7.5 wt.% and 10 wt.% of combined MWCNT and GNP nanofillers. The analysis of the curves indicates that all TPU composites showed transition curves, i.e., (Tg), (Tc), and (Tm). For specimen 97.5/TPU/1.25/MWCNT/1.25/GNP, the first peak was observed at −30 °C, corresponding to the glass transition temperature. Similarly, for the highest nanofiller concentration, i.e., 90/TPU/05/MWCNT/05/GNP, the transition temperature was recorded at −20 °C, significantly improving the transition temperature (Tg) of the material. For crystallization temperature, the first peak was observed at 122 °C for specimen 97.5/TPU/1.25/MWCNT/1.25/GNP. Similarly, the highest crystallization temperature was recorded at 110 °C for the specimen with composition 90/TPU/05/MWCNT/05/GNP. Also, the melting temperature was investigated using the DSC calorimeter. The melting temperature of the pure TPU polymer was observed at 180 °C, as per sources [45,46]. The best crystallization and melting temperature properties were exhibited by the conductive specimen with composition 90/TPU/05/MWCNT/05/GNP, showcasing the temperatures of 110 °C and 205 °C. This finding was aligned with other findings by researchers around the globe for the hybrid mixing of nanofillers, including Duan et al. (2023), Fang et al. (2018), Wang et al. (2021), Kumar et al. (2019), Li et al. (2021), and Tayfun et al. (2017) [41,43,47,48,49,50].
Figure 6.
DSC results of TPU composites with wt.% of combined MWCNTs and GNPs.
3.4. Mechanical Testing of the Polymer Composites
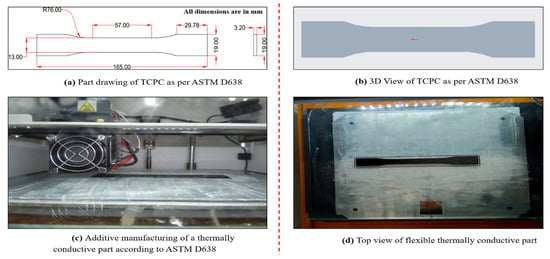
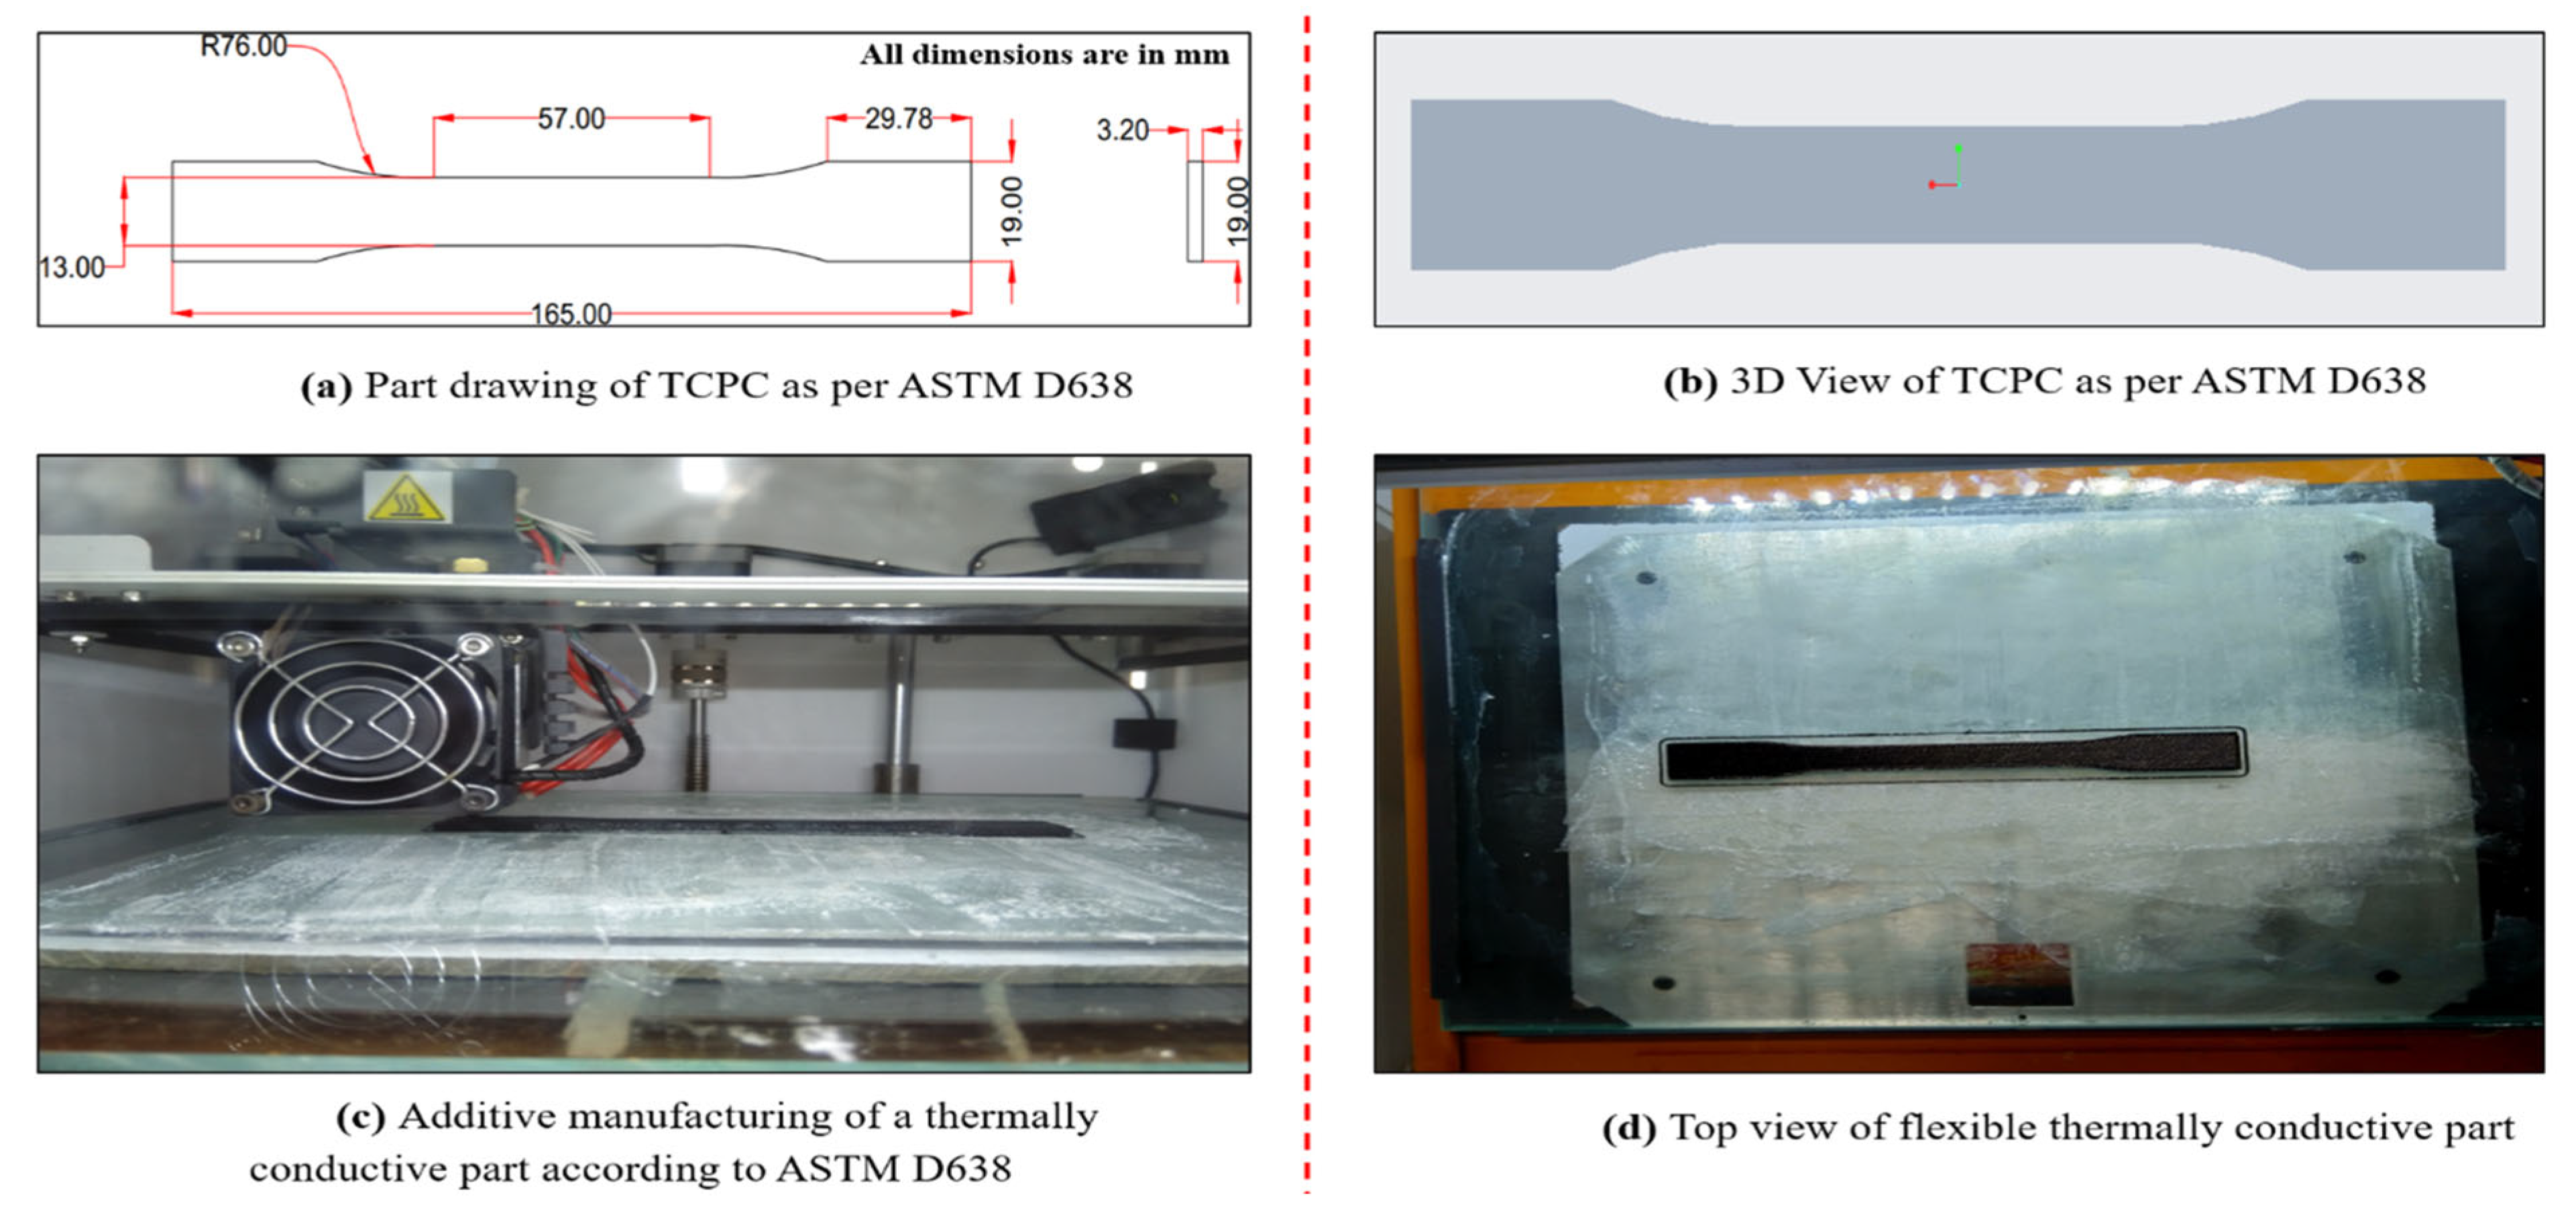
Mechanical performance was assessed through tensile tests using a UTM setup [51] (Model no. UTE-60, FIE Pvt. Ltd., India), and specimens with different TPU/MWCNT/GNP ratios were produced by FDM-based 3D printing for evaluation [52]. In the present study, composite specimens with varying compositions of thermoplastic polyurethane TPU, MWCNTs, and GNPs were fabricated via a fused deposition modeling (FDM)-based 3D printing technique, adhering to ASTM D638 standards, as shown in Figure 7a–d.
Figure 7.
Fabrication of a thermally conductive TPU specimen as per ASTM D638.
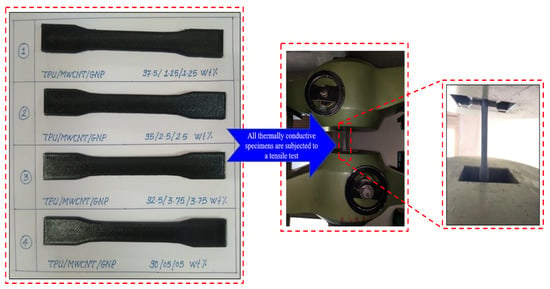
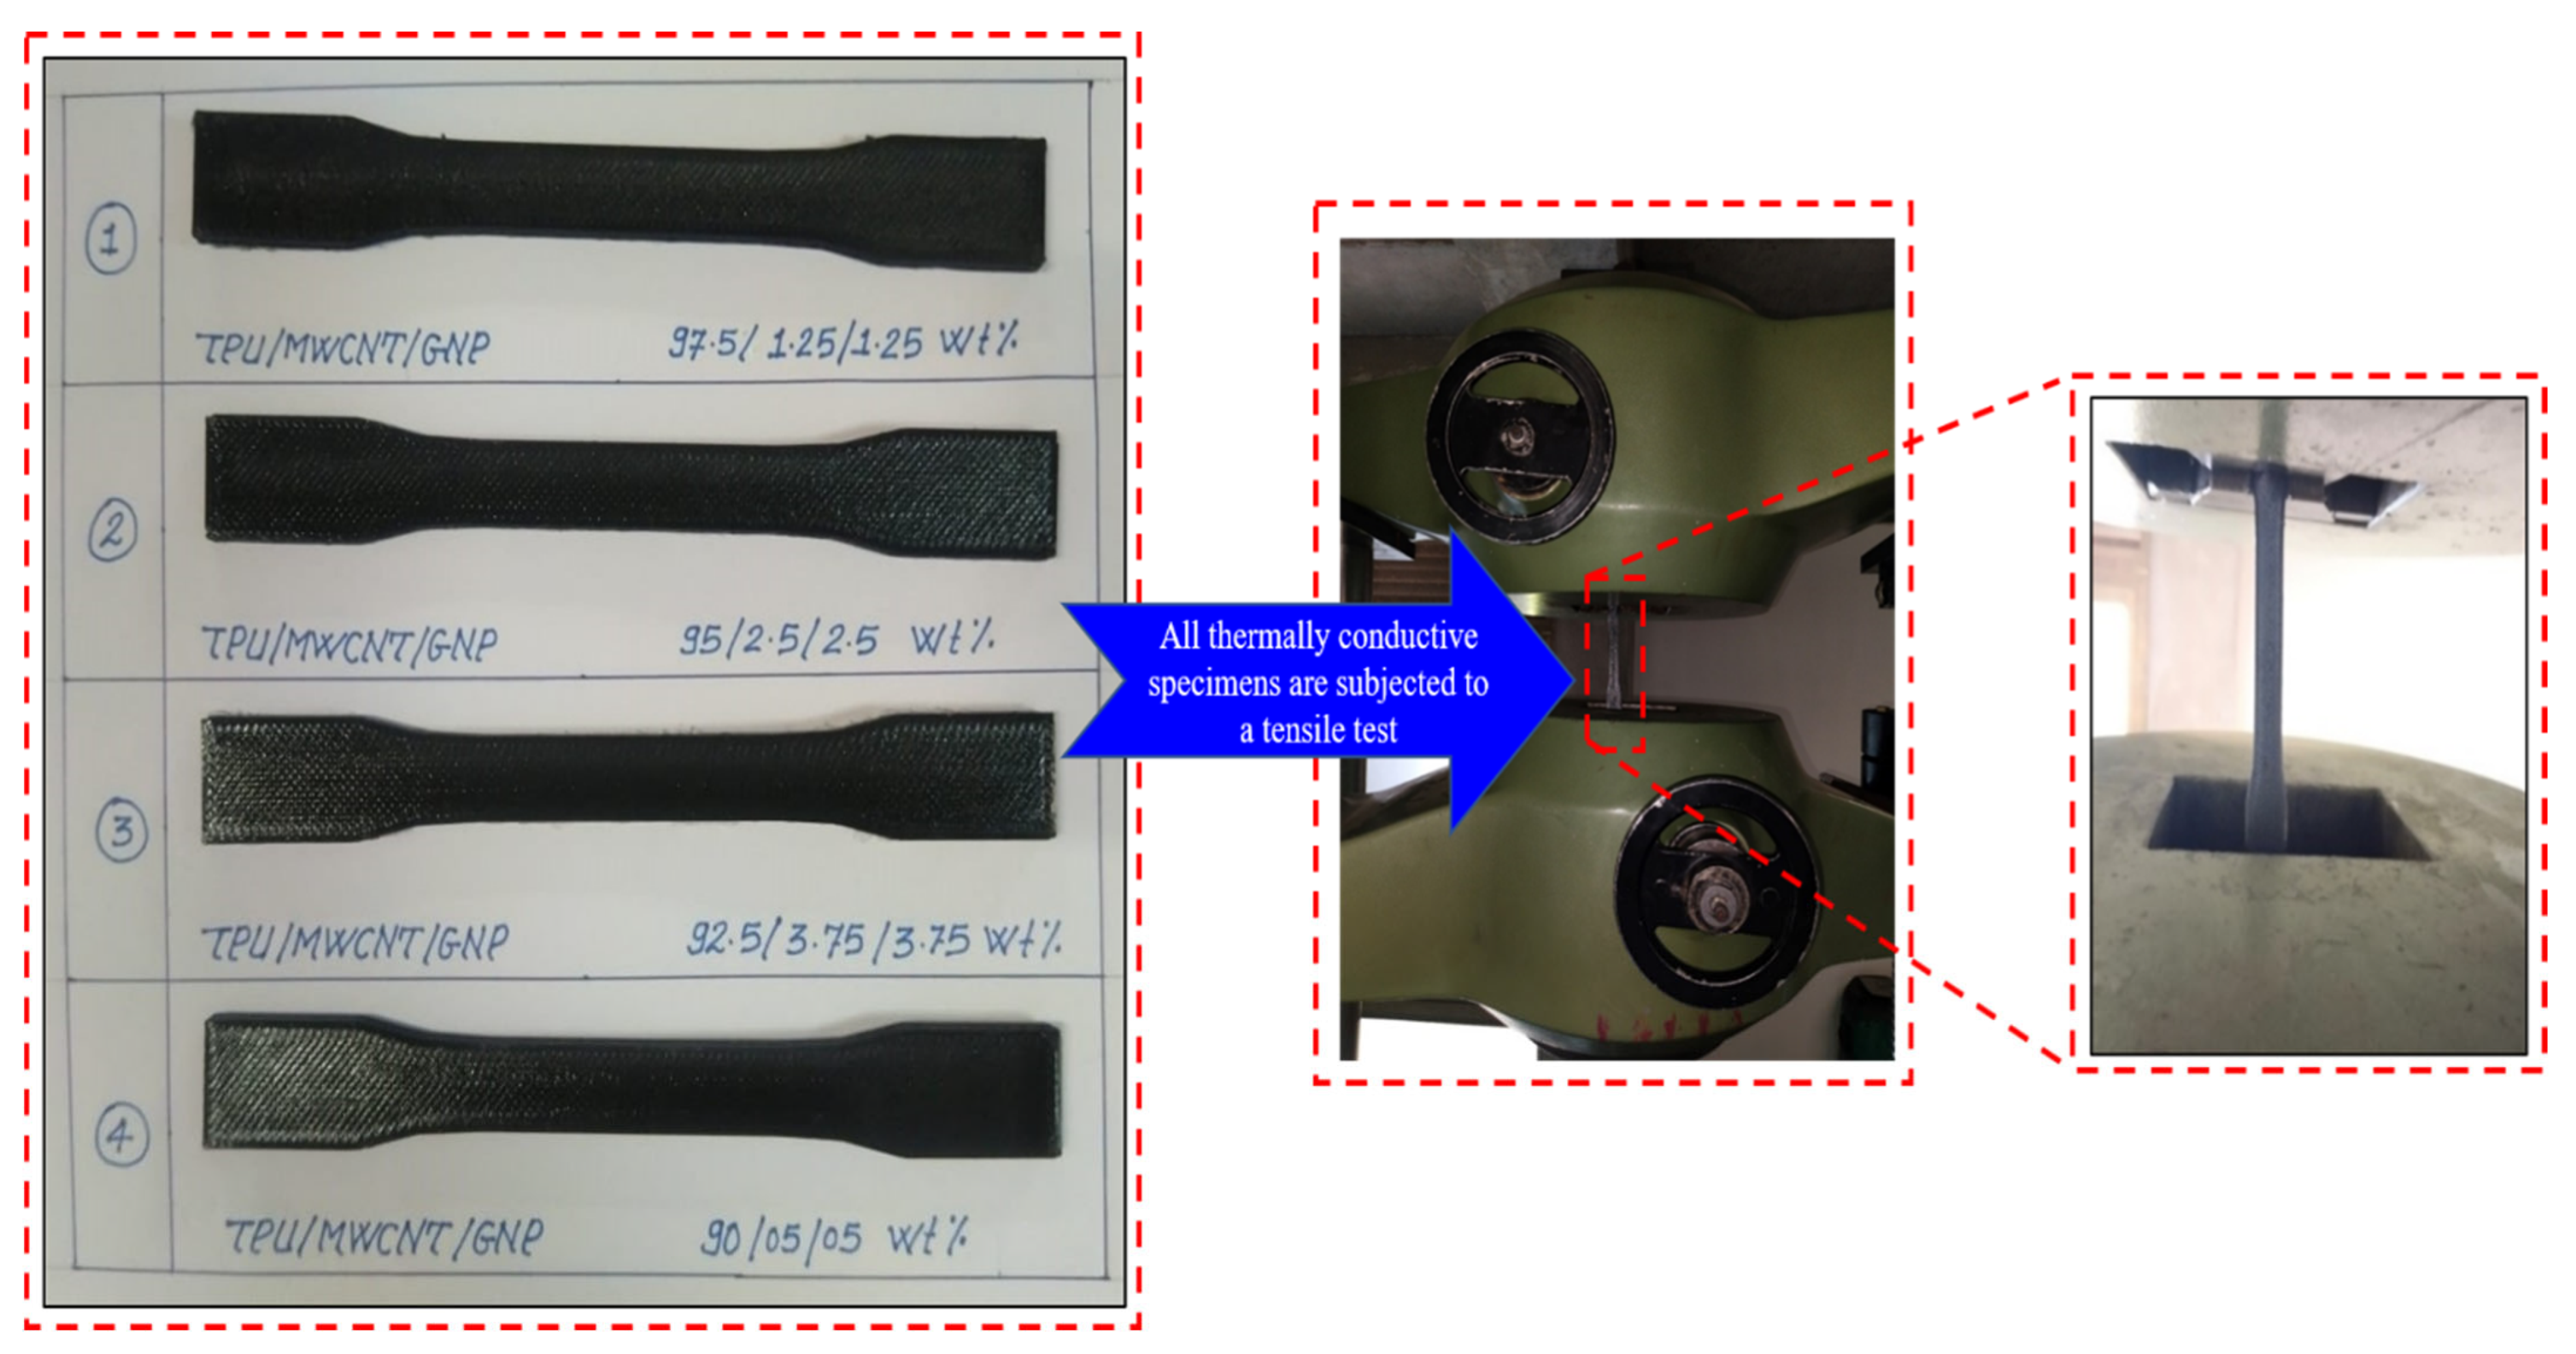
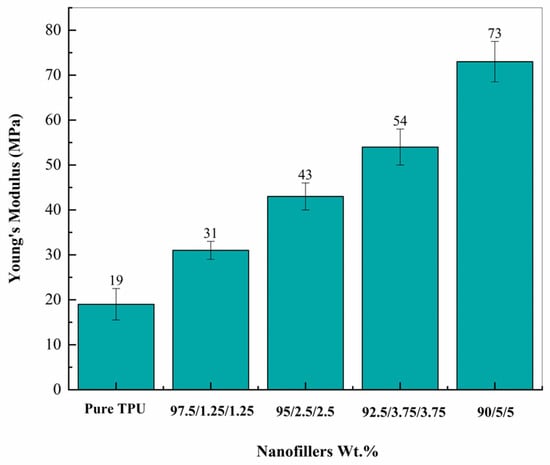
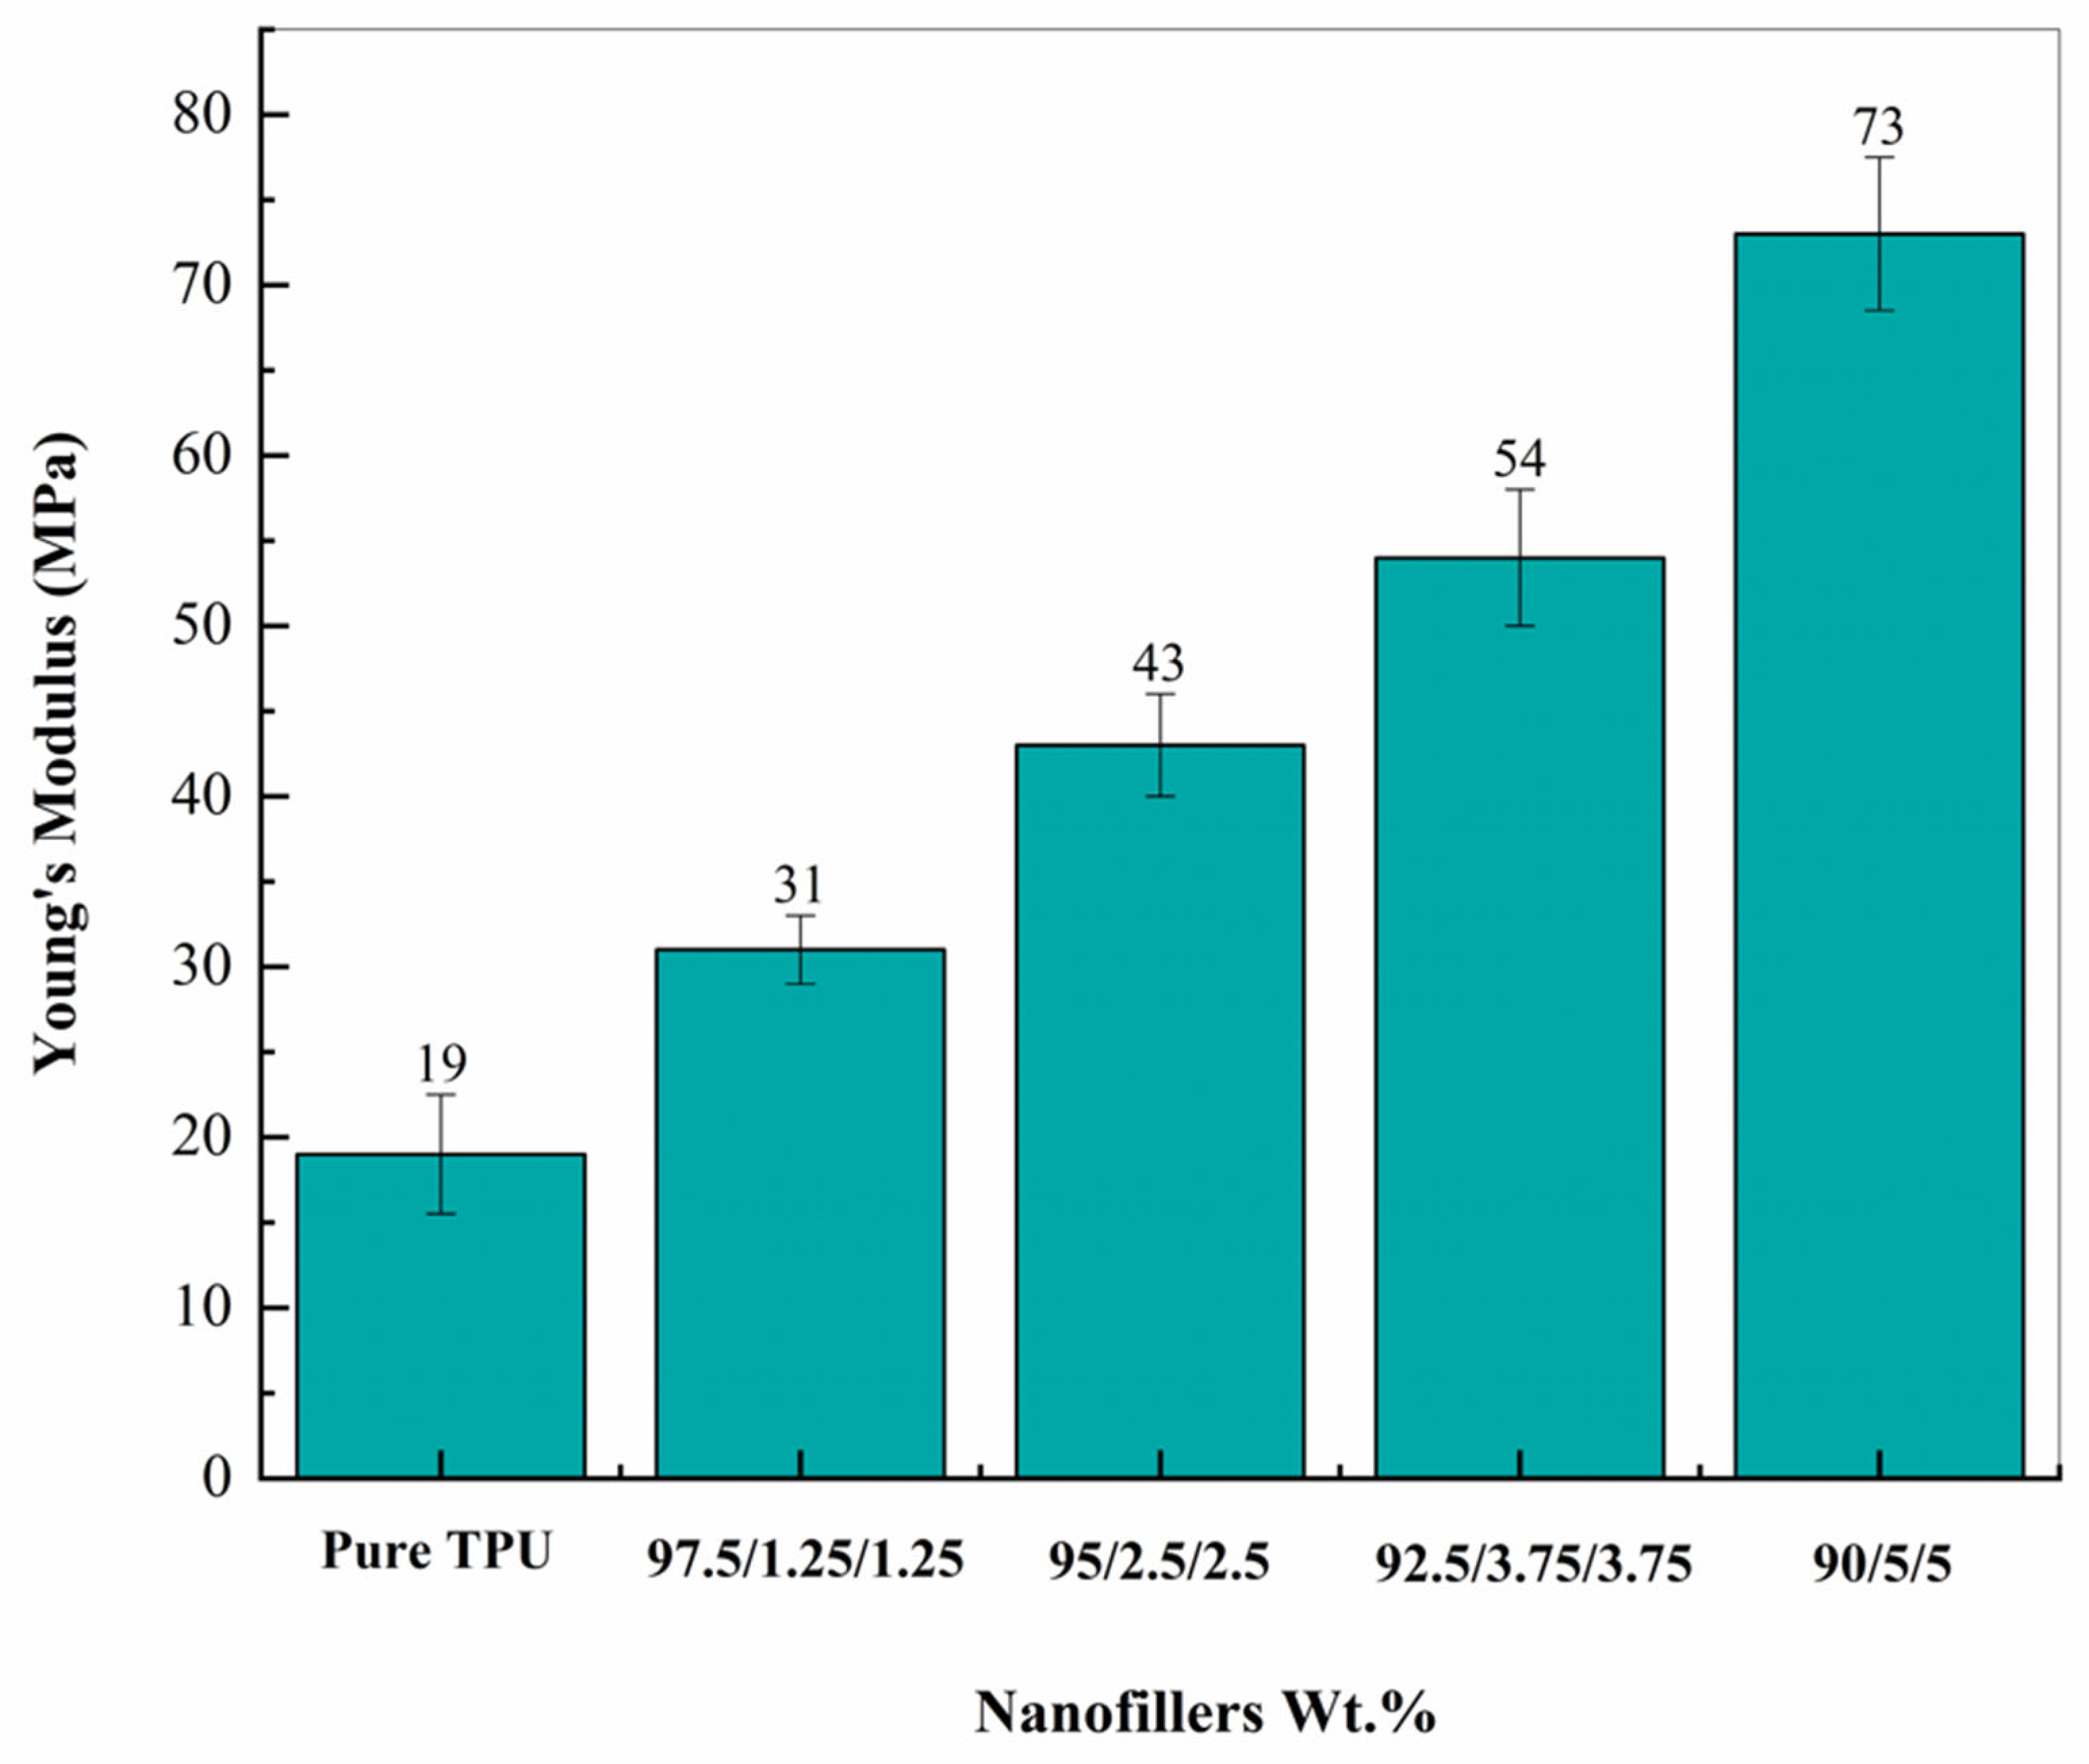
Figure 8 shows the TPU composites and the universal testing machine used to conduct the mechanical tensile test. The pure TPU material, known for its flexibility, exhibited a baseline Young’s modulus of 18.75 MPa. With the incorporation of MWCNTs and GNPs, a significant enhancement in mechanical properties was observed. The specimen with the 97.5/TPU/1.25/1.25 composition reached a Young’s modulus of 31.4 MPa, and the specimen with the 95/TPU/2.5/2.5 composition achieved 42.8 MPa. Furthermore, the 92.5/TPU/3.75/3.75 composition demonstrated 53.5 MPa, while the 90/TPU/5/5 composition recorded the highest value of 72.5 MPa. The compositions of all specimens with their strength and improvement in Young’s modulus are shown in Table 6. Notably, the 90/TPU/5/5 composite composition exhibited the highest Young’s modulus, with an improvement of 286.66%, making it suitable for the fabrication of microchannel heat exchangers and thermal management systems. This finding is consistent with previous studies on mechanical testing of polymer composites, including Zhao and Hu (2022), Fuentes del Toro et al. (2025), Seki et al. (2022), and Do et al. (2023) [53,54,55,56].
Figure 8.
3D-printed specimens as per ASTM D638 for the tensile test.
An increasing trend in Young’s modulus was observed for all TPU composites compared to pure TPU (Figure 9). The maximum value of 72.5 MPa was obtained for the 90/TPU/05/MWCNT/05/GNP composition. Detailed values and percentage improvements are presented in Table 6.
Figure 9.
Results of tensile test for TPU composite specimens as per ASTM D638.
3.5. Steady-State Temperature Measurement of the Flexible Conductive Composites
Several steps are involved in measuring thermal conductivity using the steady-state approach. The present investigation aimed to measure the thermal conductivity of the four developed flexible TPU composites made using the solution mixing technique. The examination was carried out in line with ASTM standards (ASTM C177-19). The dimensions of the experimental setup were 100 × 80 × 25 mm, containing composite specimens measuring 60 mm in diameter and 5 mm in thickness. The test utilized a power supply (make: APLAB Pvt. Ltd., Mumbai, India, DC Supply—TS3202M) with voltage ranging from 5 to 30 volts and current from 0 to 5 amps. During the experiment, nine K-type thermocouples were utilized with a calibrated thermometer.
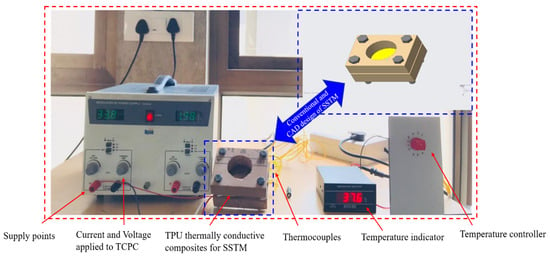
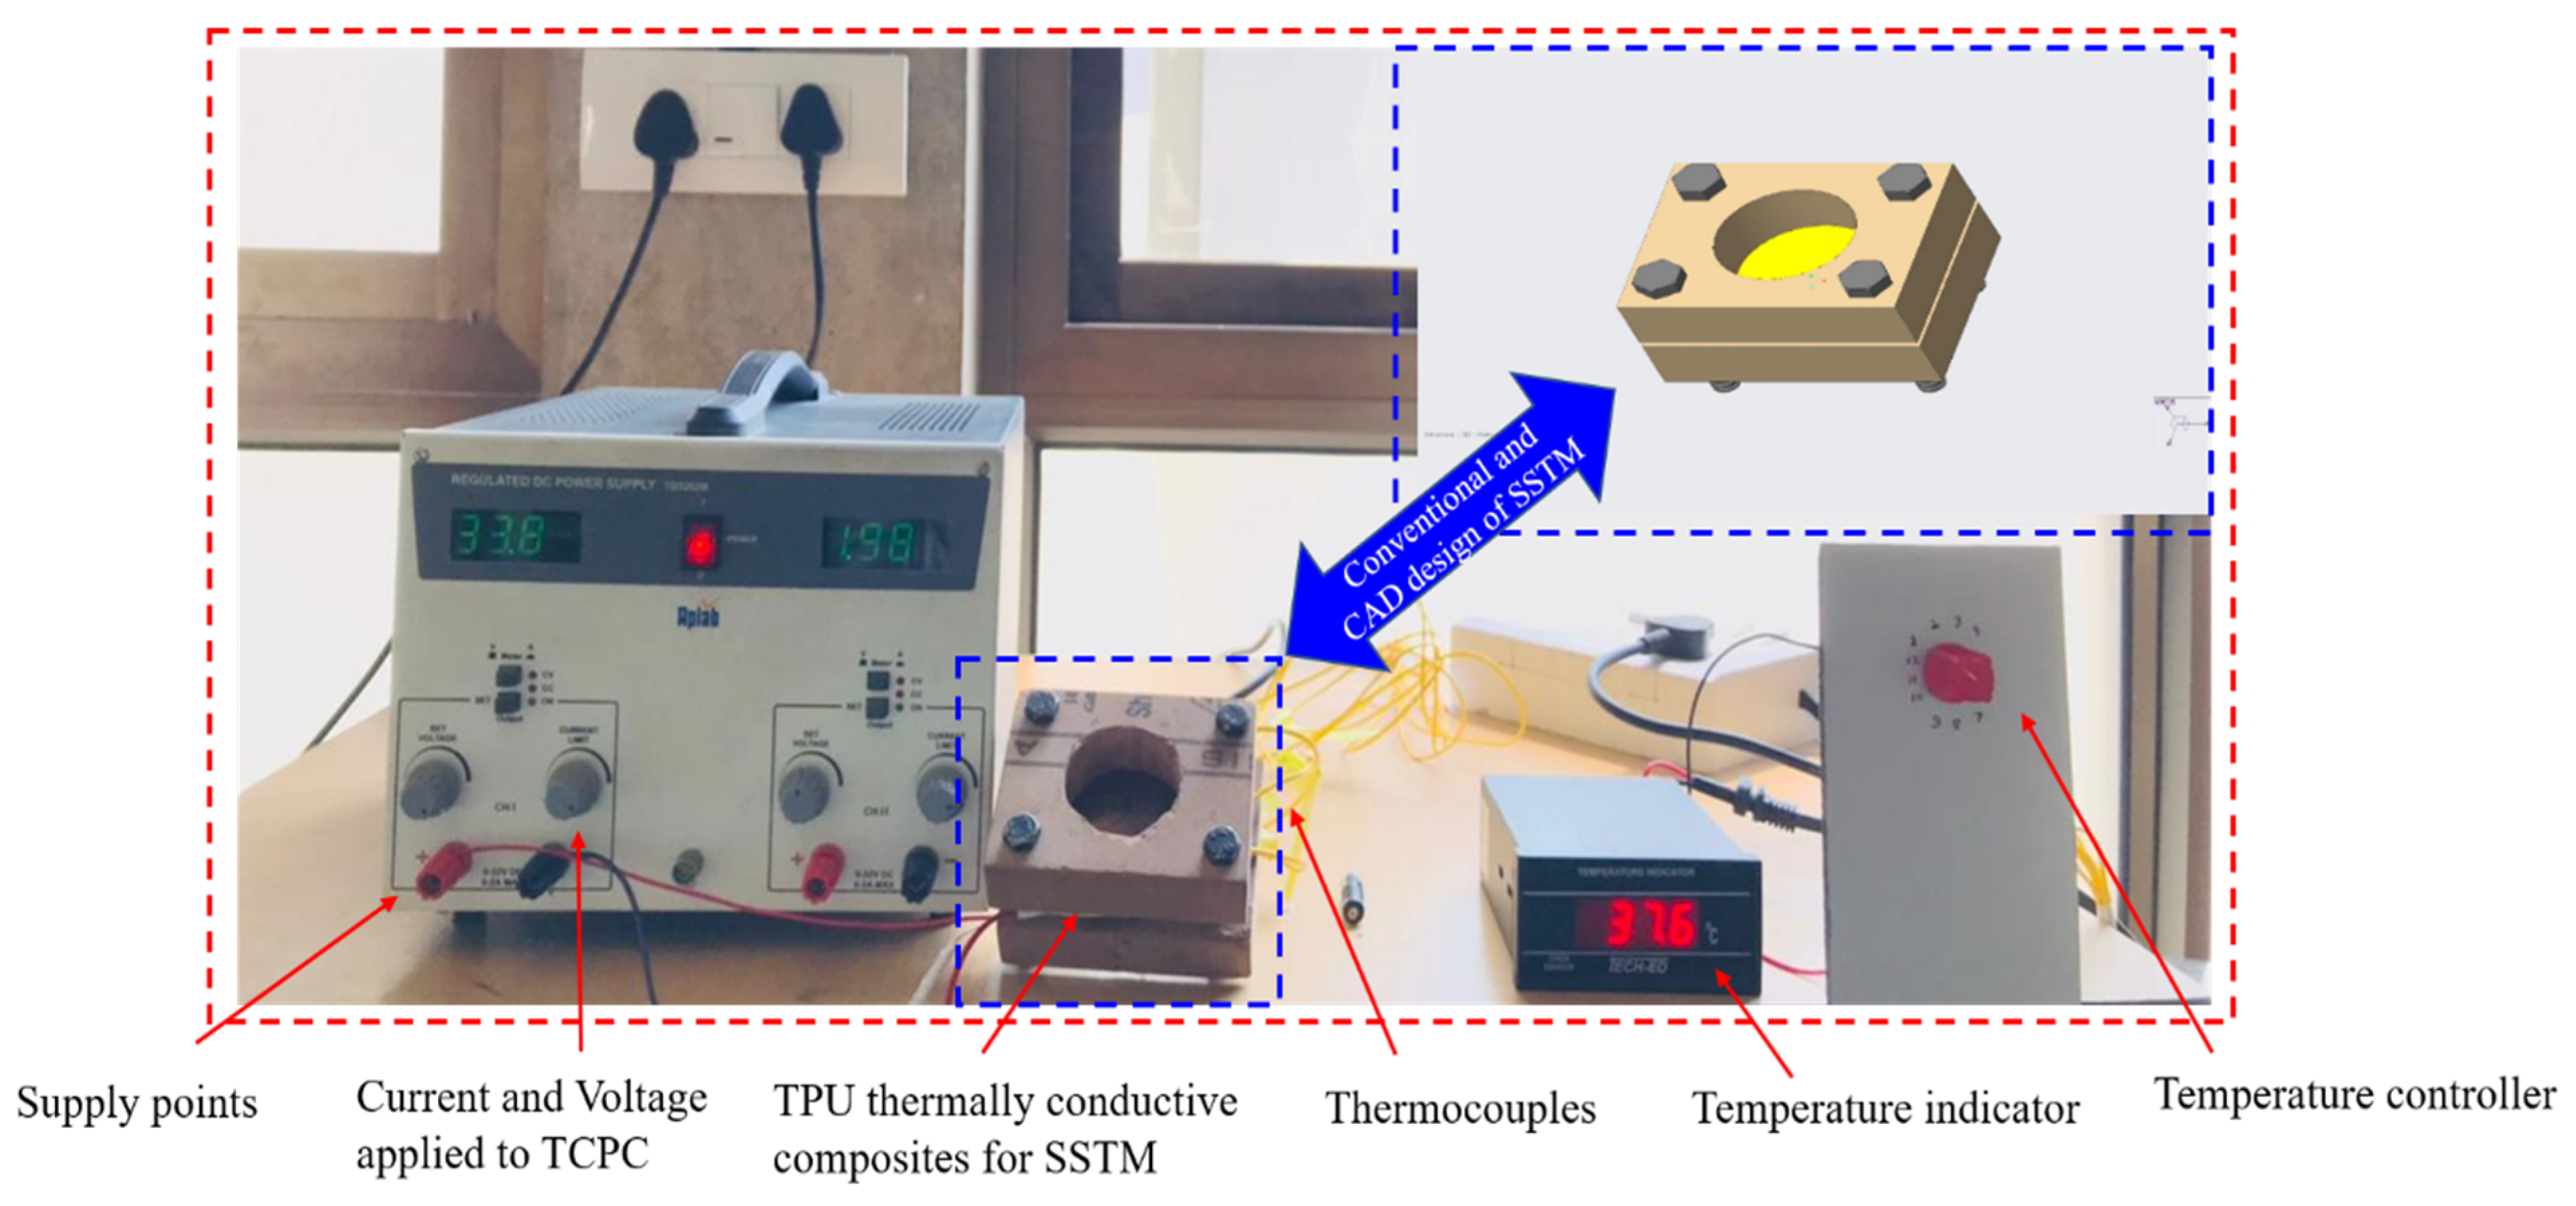
The test involves measuring the temperature at regular intervals across alternating layers of circular metallic and composite films using K-type thermocouples. The experimental facility was designed to facilitate 1D conduction. The experimental setup, with all spares, the assembled view and the CAD (3D) view, is shown in Figure 10.
Figure 10.
Steady-state temperature measurement setup.
Equation (3) evaluates the thermal conductivity of developed composite films ( by comparing it to a reference material (matrix) using their respective lengths and temperature differences under steady-state heat conduction.
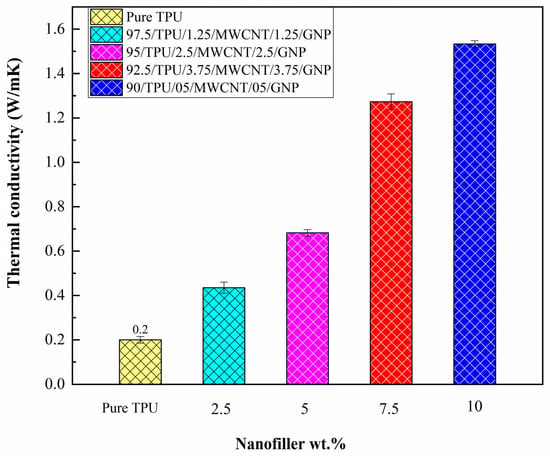
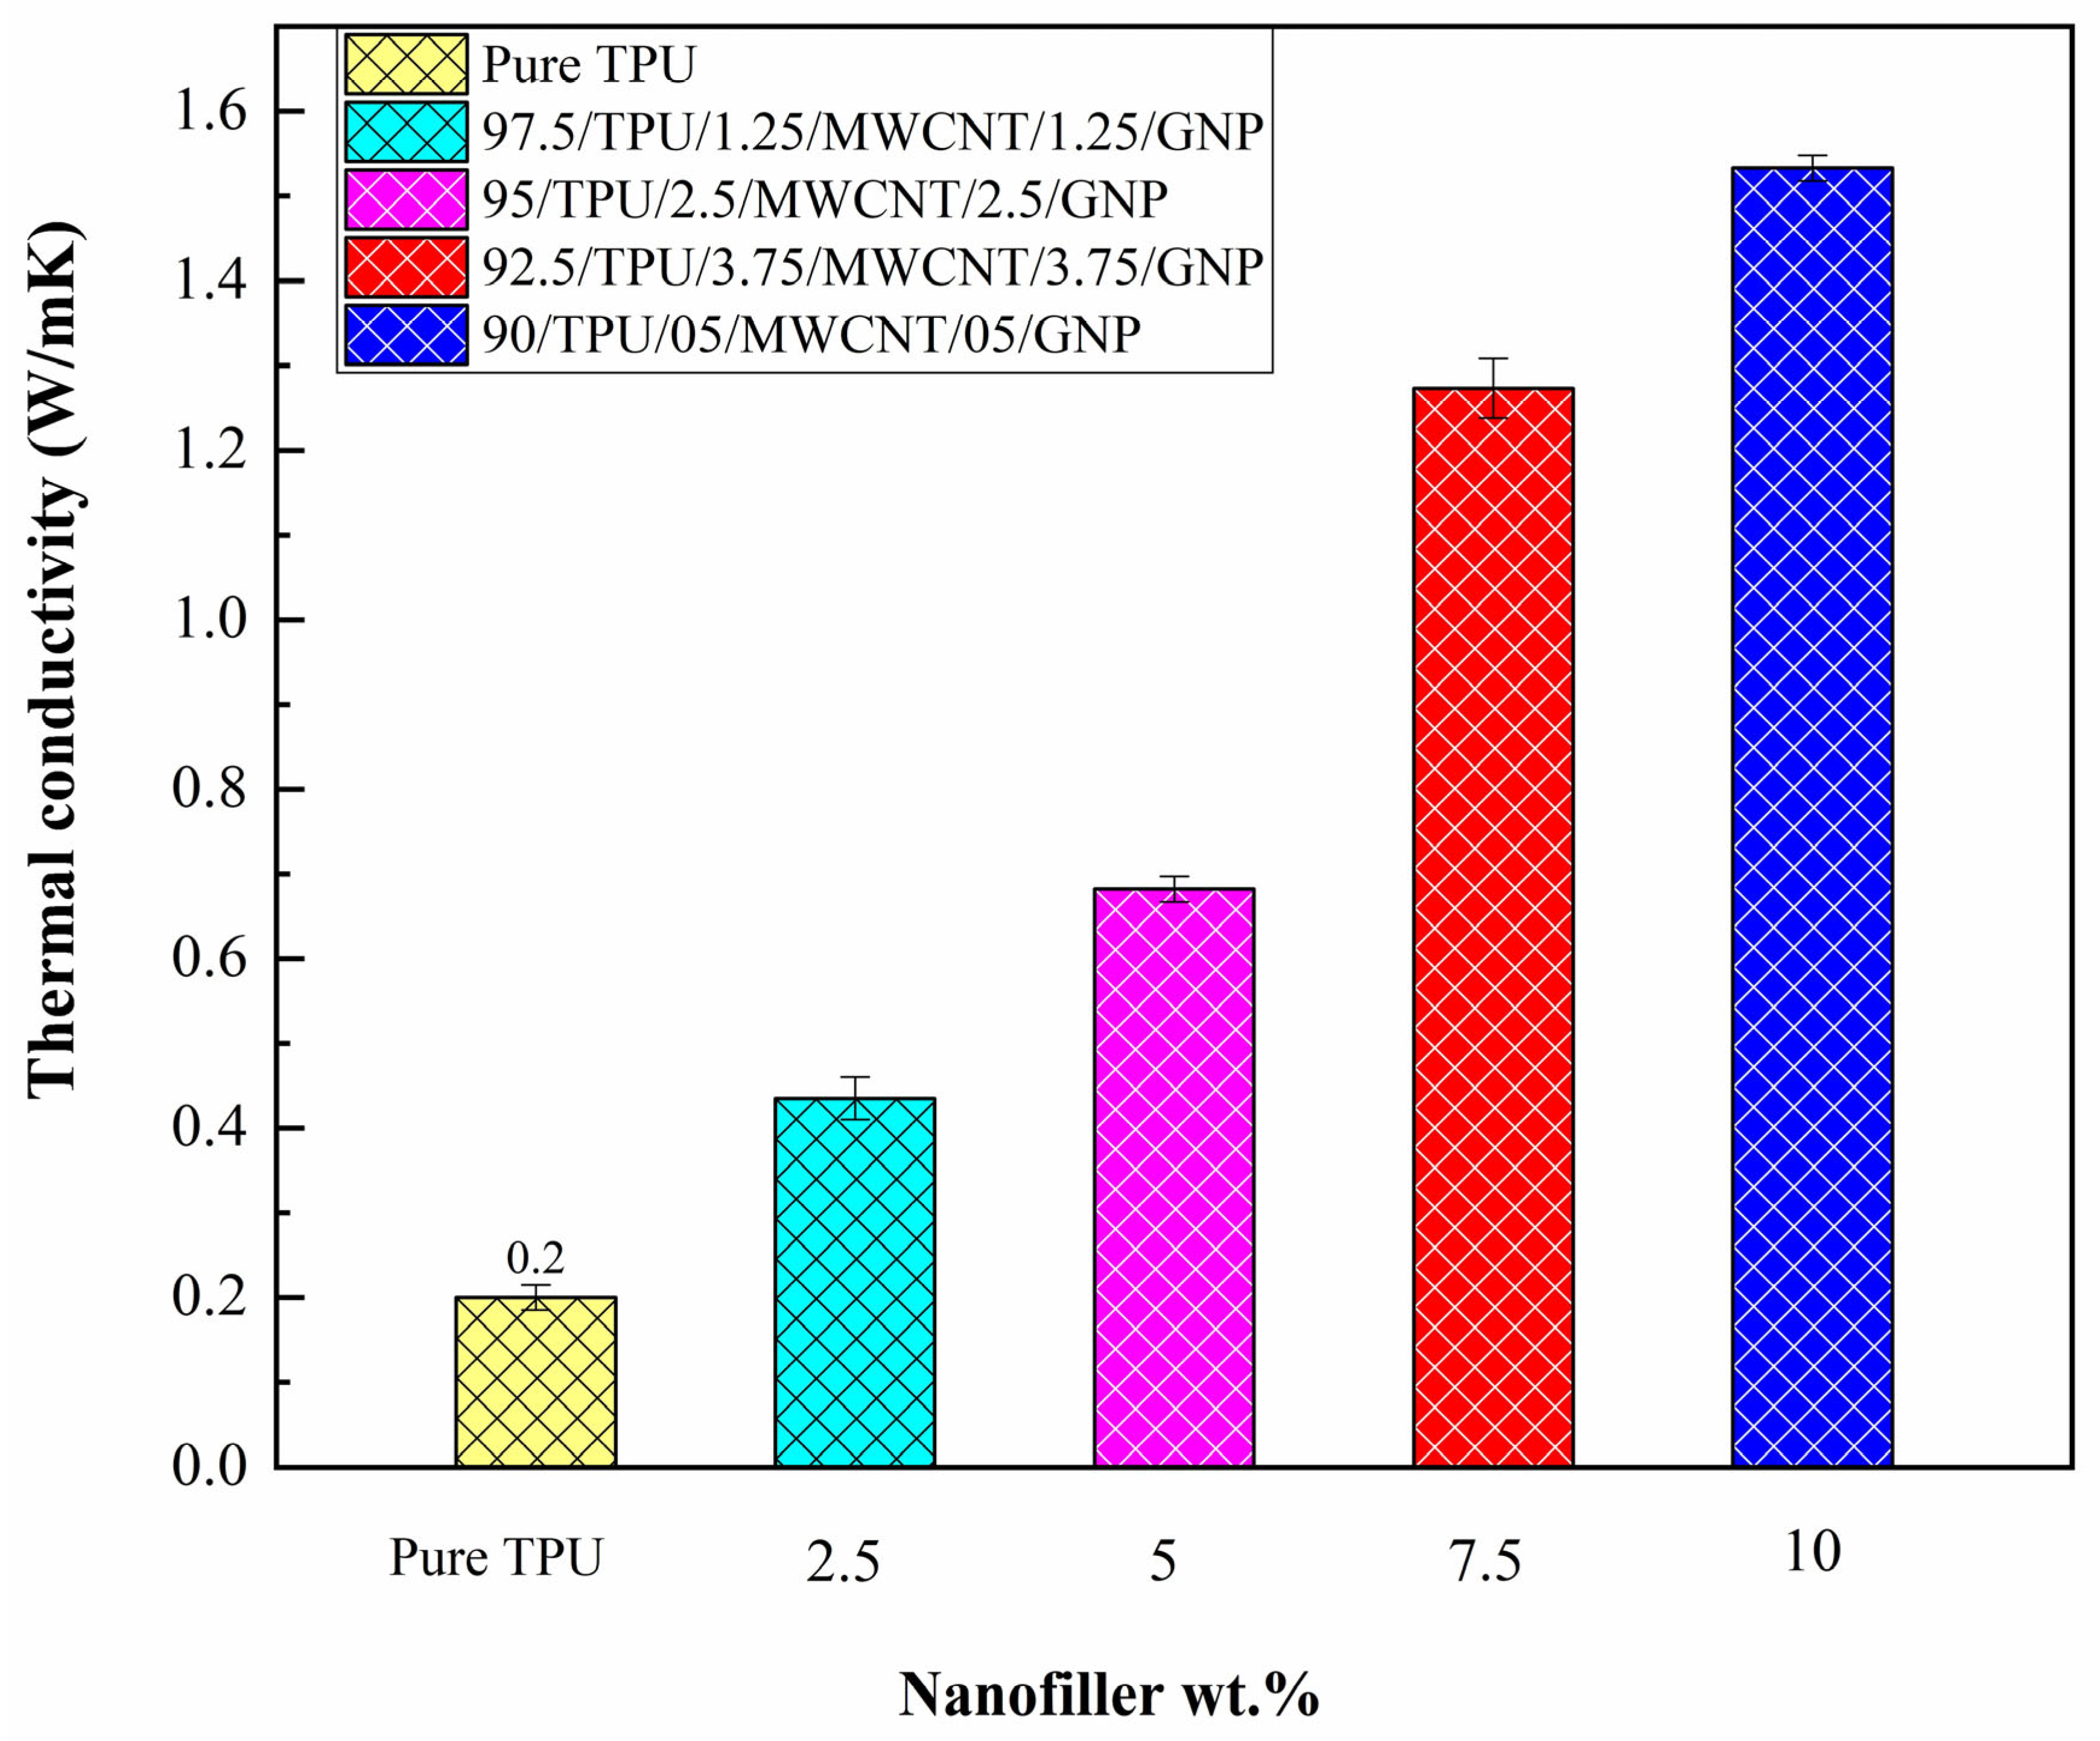
The temperatures of all samples were recorded, and the thermal conductivity values shown in Table 7 were calculated using Fourier’s law, as expressed in Equation (3). The thermal conductivity values are displayed in the bar graph shown in Figure 11. It shows a percentage deviation ranging from ±0.015 to ±0.035 W/mK during the experiment. All the prepared samples were inspected to determine their heat transfer capability compared to pure TPU, which has a thermal conductivity of 0.2 W/mK.
Table 7.
Thermal conductivity of the TPU composites.
Figure 11.
Results of the SSTM of TPU composite films.
3.6. Contribution of the Present Work Compared with Prior TPU/CNT/Graphene Studies
The present study demonstrates a significantly higher enhancement in thermal conductivity (up to 666.5%) in TPU-based composites using a hybrid MWCNT/GNP system prepared via solution mixing, compared to previously reported methods and materials, as shown in Table 8.
Table 8.
Benchmarks and previous references of thermally conductive polymer composites.
3.7. Analyzing Our Findings in Comparison with Prior Research
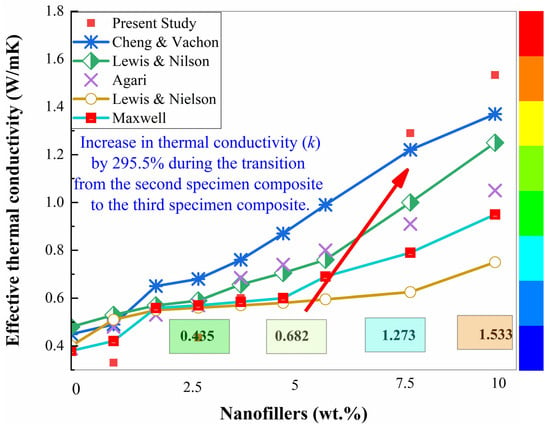
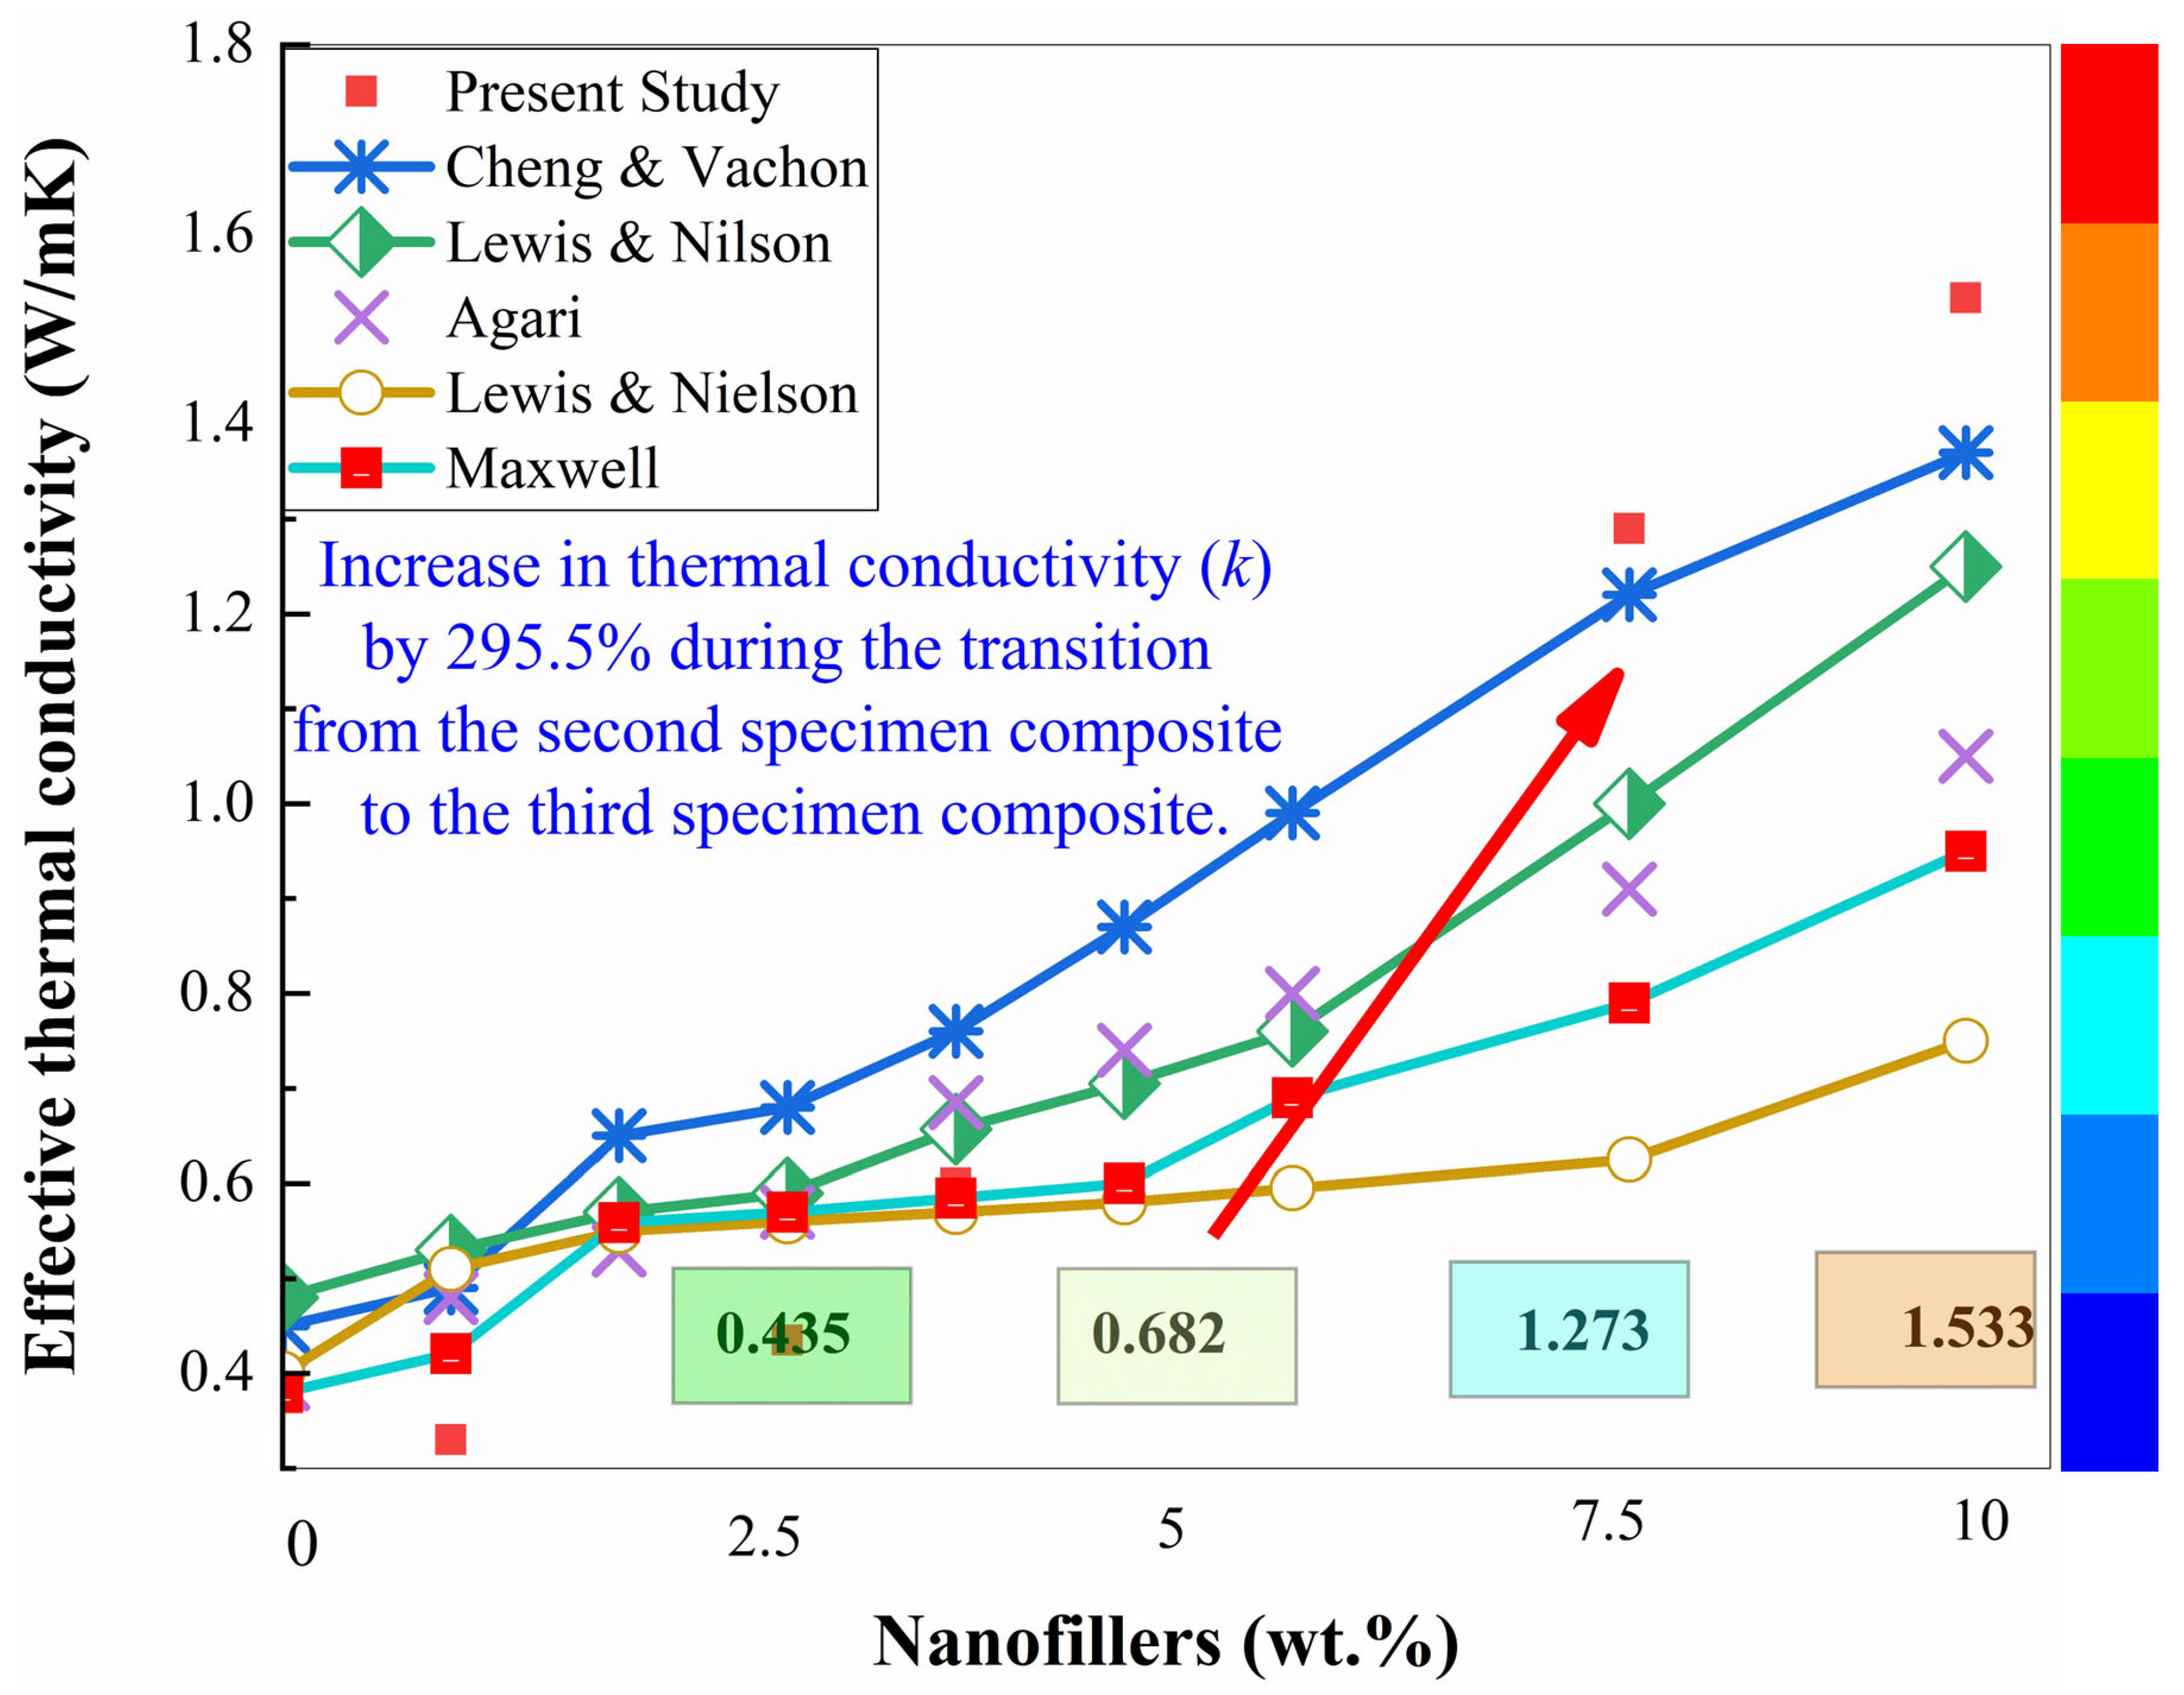
The research observations of our study were compared with those in the existing literature. The measured thermal conductivity of the TPU composites was evaluated against theoretical model predictions, as shown in Table 2 in the present manuscript. We divided the thermal conductivity investigation of the present study into four zones, as shown in Figure 12, ranging from 2.5 wt.% to 10 wt.%, for clarity and ease of understanding. Zone I, also known as the minimal enhancement region, corresponds to the 0–2.5 wt.% concentration of combined nanofillers (MWCNTs and GNPs) in the TPU matrix. In this region, the thermal conductivity showed minimal improvement, remaining close to that of pure TPU, in alignment with the Maxwell and Hamilton models. The low nanofiller concentration was insufficient to form a continuous conductive network, resulting in only a gradual increase in thermal conductivity up to 0.435 W/mK.
Figure 12.
Comparison of the thermal conductivity of the TPU specimens in the present investigation with prior studies.
Zone II, also known as the initial percolation region, corresponds to the 2.5–5 wt.% concentration of combined nanofillers (MWCNTs and GNPs) in the TPU matrix. In this region, the thermal conductivity of our samples increased from 0.435 W/mK for 97.5TPU/1.25MWCNT/1.25GNP to 0.682 W/mK for 95TPU/2.5MWCNT/2.5GNP, representing a 295.50% increase compared to pure TPU. The experimental results of this study closely align with the Lewis and Nielsen model. Zone III, known as the percolation threshold region, corresponds to a nanofiller concentration of 5–7.5 wt.% and is also clearly illustrated in Figure 12. In this region, the thermal conductivity increased significantly, from 0.682 W/mK for 95TPU/2.5MWCNT/2.5GNP to 1.273 W/mK for 92.5TPU/3.75MWCNT/3.75GNP, representing a 536.50% enhancement compared to pure TPU. This sharp rise, as shown in Figure 12, aligns poorly with the Agari and Lewis models, which account for percolation effects. Zone IV, known as the connected network region, corresponds to a nanofiller concentration of 7.5–10 wt.%, corresponding to the specimen composition of 90TPU/5.0MWCNT/5.0GNP. In this zone, the thermal conductivity increased from 1.273 W/mK to 1.533 W/mK, representing a 130% enhancement. This rise corresponds to the percolation threshold, where a well-connected filler network significantly improves thermal transport. The experimental results exceed the predictions of the Cheng and Lewis models, which tend to underestimate the impact of percolation effects at higher filler loadings. This claim is in line with the research findings of H. Olcay and E. D. Kocak (2022), Cheng and Vachon (1969), Guo et al. (2018), and Singh and Dey (2007) [35,60,61,62].
4. Conclusions
In this study, the solution mixing method was used to create innovative thermally conductive flexible composite films. By altering the total amount of MWCNTs and GNPs in the TPU matrix, the morphological, thermal, and mechanical properties of TPU/MWCNT/GNP composites were assessed. When comparing the TPU/MWCNT/GNP composite with a ratio of 90/05/05 wt.% to pure TPU, it was found that the thermal conductivity increased by almost 666.50%. The fine dispersion of the nanofillers (MWCNTs and GNPs) within the TPU matrix was verified by morphological analyses. The glass transition temperature was significantly raised when MWCNT and GNP nanofillers were added to the TPU polymer. Furthermore, TGA research revealed a 12.35% reduction in thermal deterioration for TPU composites with 10 weight percent mixed nanofillers. With compositions of 90/05/05 weight percent, the thermal decomposition of TPU/MWCNT/GNP rose by 9.75%. The specimen with the composition of 90/TPU/05/MWCNT/05/GNP demonstrated the greatest improvement in Young’s modulus in the current investigation, with a tensile test result of 286.66%. These results imply that the thermal stability of composite films was improved by the use of nanofillers. Additionally, this study showed that adding highly conductive nanofillers to a base polymer material can greatly improve the thermal properties of polymer composites to meet a range of applications, such as solar water heating, automotive, medical, telecommunications, aerospace, biomedical, renewable energy, microelectronic cooling devices, and healthcare. We think that the findings of this study could be useful in developing new materials for a variety of thermal management applications.
Author Contributions
Conceptualization, S.V. and N.K.; methodology, S.V. and N.K.; software, S.V. and S.P.; validation, S.V., N.K. and R.P.S.; formal analysis, S.V., N.K., R.P.S., S.R.P., R.V.M. and V.S.; investigation, S.V., N.K. and R.P.S.; resources, S.V., N.K., R.P.S., S.R.P., R.V.M., S.P. and V.S.; data curation, S.V., N.K., R.P.S., S.R.P., R.V.M., S.P. and V.S.; writing—original draft preparation, S.V., N.K., R.P.S., S.R.P., R.V.M. and V.S.; writing—review and editing, S.V. and S.P.; visualization, N.K. and R.P.S.; supervision, N.K., R.P.S. and S.R.P.; project administration, S.V., N.K. and R.P.S.; funding acquisition, S.V., N.K. and R.P.S. All authors have read and agreed to the published version of the manuscript.
Funding
This work was financially supported by the Science Engineering Research Board, New Delhi [CRG/2022/006881].
Data Availability Statement
The data will be made available on request.
Acknowledgments
The authors sincerely acknowledge Dr. B. R. Ambedkar National Institute of Technology, Jalandhar, and Shiksha Mandal’s Bajaj Institute of Technology, Wardha, for generously providing the necessary testing facilities to support this research work. Authors are also thankful to the Central Institute of Plastics Engineering and Technology (CIPET), Government of India Institute, Chandrapur, particularly the Polymer Division, for providing testing facilities.
Conflicts of Interest
Author Vaibhav Satone was employed by the company Godrej & Boyce Manufacturing Company. The remaining authors declare that the research was conducted in the absence of any commercial or financial relationships that could be construed as a potential conflict of interest.
Abbreviations
The following abbreviations are used in this manuscript:
| keff | Effective thermal conductive of polymer composites |
| Tg | Glass transition temperature |
| Tc | Crystallization temperature |
| Tm | Melting temperature |
| TPU | Thermoplastic polyurethane |
| MWCNT | Multi-walled carbon nanotube |
| GNP | Graphene |
| SEM | Scanning electron microscopy |
| TGA | Thermogravimetric analysis |
| DSC | Differential scanning calorimetry |
| MTPC | Mechanical testing of polymer composites |
| SSTM | Stead-state temperature measurement |
| ASTM | American Society for Testing and Materials |
| FDM | Fused deposition modeling |
| keff | Effective thermal conductivity of the composite (W m−1 K−1) |
| km | Thermal conductivity of the matrix material (TPU) (W m−1 K−1) |
| kf | Thermal conductivity of the filler material (MWCNT/GNP) (W m−1 K−1) |
| k1 and k2 | Thermal conductivity of phase-1 and phase-2 materials (W m−1 K−1) |
| Vf | Volume fraction of filler in the composite |
| Vm | Volume fraction of matrix material |
| V1 and V2 | Volume fractions of phase-1 and phase-2 materials |
| A | Shape-dependent parameter related to filler geometry |
| Β | Interaction coefficient between filler and matrix |
| Φ | Packing factor of filler particles |
| H | Particle shape factor (depends on filler geometry) |
| ϒ | Empirical correction factor related to filler dispersion |
| B, C | Model constants dependent on filler volume fraction |
References
- Aranburu, N.; Otaegi, I.; Guerrica-Echevarria, G. Mechanical, electrical, and adhesive synergies in melt-processed hybrid bio-based TPU nanocomposites. Polym. Test. 2023, 124, 108068. [Google Scholar] [CrossRef] [Scilit]
- Rigotti, D.; Dorigato, A.; Pegoretti, A. 3D printable thermoplastic polyurethane blends with thermal energy storage/release capabilities. Mater. Today Commun. 2018, 15, 228–235. [Google Scholar] [CrossRef] [Scilit]
- Chattopadhyay, D.K.; Raju, K.V.S.N. Structural engineering of polyurethane coatings for high performance applications. Prog. Polym. Sci. 2007, 32, 352–418. [Google Scholar] [CrossRef] [Scilit]
- Tersac, G. Chemistry and technology of polyols for polyurethanes. Milhail Ionescu. Rapra Technology, Shrewsbury, UK. Polym. Int. 2007, 56, 820. [Google Scholar] [CrossRef] [Scilit]
- Xiao, S.; Sue, H.J. Effect of molecular weight on scratch and abrasive wear behaviors of thermoplastic polyurethane elastomers. Polymer 2019, 169, 124–130. [Google Scholar] [CrossRef] [Scilit]
- Guo, Y.; Yang, X.; Ruan, K.; Kong, J.; Dong, M.; Zhang, J.; Gu, J.; Guo, Z. Reduced Graphene Oxide Heterostructured Silver Nanoparticles Significantly Enhanced Thermal Conductivities in Hot-Pressed Electrospun Polyimide Nanocomposites. ACS Appl. Mater. Interfaces 2019, 11, 25465–25473. [Google Scholar] [CrossRef] [Scilit] [PubMed]
- Wang, Q.; Zhang, Q.; Kang, Y.; Wang, Y.; Liu, J. An investigation of preparation of continuous carbon fiber reinforced PLA prepreg filament. Compos. Commun. 2023, 39, 101530. [Google Scholar] [CrossRef] [Scilit]
- Markandan, K.; Lai, C.Q. Fabrication, properties and applications of polymer composites additively manufactured with filler alignment control: A review. Compos. Part B Eng. 2023, 256, 110661. [Google Scholar] [CrossRef] [Scilit]
- Tambrallimath, V.; Keshavamurthy, R.; D, S.; Koppad, P.G.; Kumar, G.S.P. Thermal behavior of PC-ABS based graphene filled polymer nanocomposite synthesized by FDM process. Compos. Commun. 2019, 15, 129–134. [Google Scholar] [CrossRef] [Scilit]
- Thiyagu, C.; Manjubala, I.; Narendrakumar, U. Thermal and morphological study of graphene based polyurethane composites. Mater. Today Proc. 2019, 45, 3982–3985. [Google Scholar] [CrossRef] [Scilit]
- Mishra, D.; Pradhan, S.S.; S., G.S.; R., A.N.; Mohapatra, A.K. Capacity Building of Thermal Conductivity in Polymers and Their Composites: A Short Review of the Effect of Various Fillers in Their Composites. J. Macromol. Sci. Part B Phys. 2024, 64, 227–246. [Google Scholar] [CrossRef] [Scilit]
- Yan, D.-X.; Huang, H.-D.; Gao, J.-F.; Dai, K.; Zhang, W.-Q.; Li, Z.-M. A conductive carbon nanotube-polymer composite based on a co-continuous blend. J. Macromol. Sci. Part B Phys. 2013, 52, 167–177. [Google Scholar] [CrossRef] [Scilit]
- Carneiro, I.; Simões, S. Investigation of thermal stability of aluminum matrix nanocomposites using functionalized MWCNTs. Mater. Today Commun. 2023, 36, 106845. [Google Scholar] [CrossRef] [Scilit]
- Hu, D.; Liu, H.; Ma, W. Rational design of nanohybrids for highly thermally conductive polymer composites. Compos. Commun. 2020, 21, 100427. [Google Scholar] [CrossRef] [Scilit]
- Zheng, S.; Wang, Y.; Zhu, Y.; Zheng, C. Recent advances in the construction and properties of carbon-based nanofillers/polymer composites with segregated network structures. Mater. Today Commun. 2023, 36, 106773. [Google Scholar] [CrossRef] [Scilit]
- Maqbool, M.; Aftab, W.; Bashir, A.; Usman, A.; Guo, H.; Bai, S. Engineering of polymer-based materials for thermal management solutions. Compos. Commun. 2022, 29, 101048. [Google Scholar] [CrossRef] [Scilit]
- Nouh, S.A.; Ellabban, M.A.; Benthami, K.A.; Barakat, M.M. Exploring the Optical Behavior of Gamma Ray Irradiated Polycarbonate/Poly(Methyl Methacrylate)/Polyethylene Oxide Blend Films. J. Macromol. Sci. Part B Phys. 2024, 63, 663–677. [Google Scholar] [CrossRef] [Scilit]
- Zhang, B.; Wang, R. Poly(ionic liquid) Grafted MXene via Si-ATRP and its Polyurethane Composite Foam: Mechanical, Flame Retardant and Sensing Properties. J. Macromol. Sci. Part B Phys. 2023, 63, 909–929. [Google Scholar] [CrossRef] [Scilit]
- Ji, C.; Yan, C.; Wang, Y.; Xiong, S.; Zhou, F.; Li, Y.; Sun, R.; Wong, C.P. Thermal conductivity enhancement of CNT/MoS2/graphene−epoxy nanocomposites based on structural synergistic effects and interpenetrating network. Compos. Part B Eng. 2019, 163, 363–370. [Google Scholar] [CrossRef] [Scilit]
- Yu, B.; Zhou, Y.; Luo, Z.; Fan, J.; He, J.; Liu, Y.; Jin, X. Highly thermally conductive flexible insulated PI/BNNS@rGO nanocomposite paper with a three-dimensional network bridge structure. Appl. Surf. Sci. 2023, 630, 157457. [Google Scholar] [CrossRef] [Scilit]
- Vairagade, S.; Kumar, N.; Singh, R.P. Experimental investigations for enhancing the performance of hemispherical cavity receivers using additively manufactured heat exchangers. Energy Sources Part A Recovery Util. Environ. Eff. 2024, 46, 10494–10509. [Google Scholar] [CrossRef] [Scilit]
- Gnanasekaran, K.; Heijmans, T.; van Bennekom, S.; Woldhuis, H.; Wijnia, S.; de With, G.; Friedrich, H. 3D printing of CNT- and graphene-based conductive polymer nanocomposites by fused deposition modeling. Appl. Mater. Today 2017, 9, 21–28. [Google Scholar] [CrossRef] [Scilit]
- Kumar, N.; Jain, P.K.; Tandon, P.; Pandey, P.M. Additive manufacturing of flexible electrically conductive polymer composites via CNC-assisted fused layer modeling process. J. Braz. Soc. Mech. Sci. Eng. 2018, 40, 175. [Google Scholar] [CrossRef] [Scilit]
- Vairagade, S.; Kumar, N.; Singh, R.P. Recent advancements and applications in thermally conductive polymer nanocomposites. Polym. Technol. Mater. 2024, 63, 1371–1420. [Google Scholar] [CrossRef] [Scilit]
- ASTM C177−19; Standard Test Method for Steady-State Heat Flux Measurements and Thermal Transmission Properties by Means of the Guarded-Hot-Plate Apparatus. ASTM International: West Conshohocken, PA, USA, 2000; Volume 8, pp. 3–4.
- Wang, J.; Carson, J.K.; North, M.F.; Cleland, D.J. A new structural model of effective thermal conductivity for heterogeneous materials with co-continuous phases. Int. J. Heat Mass Transf. 2008, 51, 2389–2397. [Google Scholar] [CrossRef] [Scilit]
- Tan, J.F.; Jia, Y.J.; Li, L.X. A series-parallel mixture model to predict the overall property of particle reinforced composites. Compos. Struct. 2016, 150, 219–225. [Google Scholar] [CrossRef] [Scilit]
- Yu, Y.; Guo, F.; Xing, C.; Long, Y.; Hu, L.; Zhao, X.; Wang, Y. Thermal properties of hierarchical YSZ and LZO ceramic microspheres with multi-scaled voids investigated by using theoretical, experimental and simulation methods. Adv. Powder Technol. 2022, 33, 103879. [Google Scholar] [CrossRef] [Scilit]
- Cardoso, A.D.L.; de Argollo, R.M.; Costa, A.B. A prediction model of thermal conductivity of rock using measurements in biphasic mixtures. Rev. Bras. Geofis. 2015, 33, 5–17. [Google Scholar] [CrossRef] [Scilit]
- Tavman, I.H. Effective thermal conductivity of isotropic polymer composites. Int. Commun. Heat Mass Transf. 1998, 25, 723–732. [Google Scholar] [CrossRef] [Scilit]
- Pal, R. On the Lewis-Nielsen model for thermal/electrical conductivity of composites. Compos. Part A Appl. Sci. Manuf. 2008, 39, 718–726. [Google Scholar] [CrossRef] [Scilit]
- Chiang, C.R. An extended Mori-Tanaka’s micromechanics model. In Proceedings of the ICCM International Conference on Composite Materials, Kyoto, Japan, 9–13 July 2007; pp. 1–6. [Google Scholar]
- Wang, H.; Rao, Z.; Wang, W.; Liao, S. A reconstruction of Hamilton-Crosser model for effective thermal conductivity of nanofluids based on particle clustering and nanolayer formation. Case Stud. Therm. Eng. 2021, 26, 101051. [Google Scholar] [CrossRef] [Scilit]
- Kusy, R.P.; Corneliussen, R.D. The thermal conductivity of nickel and copper dispersed in poly(vinyl chloride). Polym. Eng. Sci. 1975, 15, 107–112. [Google Scholar] [CrossRef] [Scilit]
- Cheng, S.C.; Vachon, R.I. The prediction of the thermal conductivity of two and three phase solid heterogeneous mixtures. Int. J. Heat Mass Transf. 1969, 12, 249–264. [Google Scholar] [CrossRef] [Scilit]
- Wang, R.; Xie, C.; Luo, S.; Xu, H.; Gou, B.; Zeng, L. Preparation and properties of MWCNTs-BNNSs/epoxy composites with high thermal conductivity and low dielectric loss. Mater. Today Commun. 2020, 24, 100985. [Google Scholar] [CrossRef] [Scilit]
- Payam, A.F.; Payton, O.; Picco, L.; Moore, S.; Martin, T.; Warren, A.D.; Mostafavi, M.; Knowles, D. Development of fatigue testing system for in-situ observation of stainless steel 316 by HS-AFM & SEM. Int. J. Fatigue 2019, 127, 1–9. [Google Scholar] [CrossRef] [Scilit]
- Azadi, F.; Khonakdar, H.A.; Jafari, S.H.; Arjmand, M.; Wagenknecht, U.; Ruckdäschel, H.; Altstädt, V. The effect of tailoring morphology on rheology and dielectric properties of poly (lactic acid) /thermoplastic polyurethane/graphene oxide nanocomposites. Mater. Today Commun. 2022, 33, 104497. [Google Scholar] [CrossRef] [Scilit]
- Xu, Y.; Chen, M.; Ning, X.; Chen, X.; Sun, Z.; Ma, Y.; Qin, J.; Yu, J.; Zhang, Z.; Yang, L.; et al. The thermal stability and flammability of expandable graphite-filled polypropylene/thermoplastic polyurethane blends. J. Macromol. Sci. Part B 2014, 53, 756–768. [Google Scholar] [CrossRef] [Scilit]
- Shaker, A.; Khedewy, A.T.; Hassan, M.A.; El-Baky, M.A.A. Thermo-mechanical characterization of electrospun polyurethane/carbon-nanotubes nanofibers: A comparative study. Sci. Rep. 2023, 13, 17368. [Google Scholar] [CrossRef] [Scilit]
- Duan, C.; Long, F.; Shi, X.; Wang, Y.; Dong, J.; Ying, S.; Li, Y.; Cheng, Y.; Guo, J.; Xu, G.; et al. MWCNTs-GNPs Reinforced TPU Composites with Thermal and Electrical Conductivity: Low-Temperature Controlled DIW Forming. Micromachines 2023, 14, 815. [Google Scholar] [CrossRef] [Scilit] [PubMed]
- Bashpa, P.; K, B.; Francis, T. Enhanced dielectric and thermal properties of thermoplastic polyurethane/multi-walled carbon nanotube composites. Mater. Today Proc. 2022, 51, 2254–2259. [Google Scholar] [CrossRef] [Scilit]
- Kumar, S.; Gupta, T.K.; Varadarajan, K.M. Strong, stretchable and ultrasensitive MWCNT/TPU nanocomposites for piezoresistive strain sensing. Compos. Part B Eng. 2019, 177, 107285. [Google Scholar] [CrossRef] [Scilit]
- Jiao, Y.-H.; Wang, X.-L.; Wang, Y.-Z.; Wang, D.-Y.; Zhai, Y.-L.; Lin, J.-S. Thermal degradation and combustion behaviors of flame-retardant polypropylene/thermoplastic polyurethane blends. J. Macromol. Sci. Part B Phys. 2009, 48, 889–909. [Google Scholar] [CrossRef] [Scilit]
- Slater, C.; Davis, C.; Strangwood, M. Compression set of thermoplastic polyurethane under different thermal-mechanical-moisture conditions. Polym. Degrad. Stab. 2011, 96, 2139–2144. [Google Scholar] [CrossRef] [Scilit]
- Barick, A.K.; Tripathy, D.K. Thermal and dynamic mechanical characterization of thermoplastic polyurethane/organoclay nanocomposites prepared by melt compounding. Mater. Sci. Eng. A 2010, 527, 812–823. [Google Scholar] [CrossRef] [Scilit]
- Fang, C.; Yang, R.; Zhang, Z.; Zhou, X.; Lei, W.; Cheng, Y.; Zhang, W.; Wang, D. Effect of multi-walled carbon nanotubes on the physical properties and crystallisation of recycled PET/TPU composites. RSC Adv. 2018, 8, 8920–8928. [Google Scholar] [CrossRef] [Scilit]
- Tayfun, U.; Kanbur, Y.; Abacı, U.; Güney, H.Y.; Bayramlı, E. Mechanical, electrical, and melt flow properties of polyurethane elastomer/surface-modified carbon nanotube composites. J. Compos. Mater. 2017, 51, 1987–1996. [Google Scholar] [CrossRef] [Scilit]
- Li, R.; Xia, L.; Lyu, P.; Zhang, J.; Wang, Y.; Deng, B.; Zhang, C.; Liu, X.; Xu, W. High content filling, toughness, and conductive performance of thermoplastic polyurethane/carbon nanotubes composites prepared by constructing the compact interface. Compos. Commun. 2021, 28, 100948. [Google Scholar] [CrossRef] [Scilit]
- Wang, G.; Liao, X.; Zou, F.; Song, P.; Tang, W.; Yang, J.; Li, G. Flexible TPU/MWCNTs/BN composites for frequency-selective electromagnetic shielding and enhanced thermal conductivity. Compos. Commun. 2021, 28, 100953. [Google Scholar] [CrossRef] [Scilit]
- Albozahid, M.; Naji, H.Z.; Alobad, Z.K.; Saiani, A. TPU nanocomposites tailored by graphene nanoplatelets: The investigation of dispersion approaches and annealing treatment on thermal and mechanical properties. Polym. Bull. 2022, 79, 8269–8307. [Google Scholar] [CrossRef] [Scilit]
- Feng, F.; Zhao, X.; Ye, L. Structure and properties of ultradrawn polylactide/thermoplastic polyurethane elastomer blends. J. Macromol. Sci. Part B 2011, 50, 1500–1507. [Google Scholar] [CrossRef] [Scilit]
- Zhao, T.; Hu, Z. Opportunities and Challenges for the Development of Ultra-Thin Heat Pipe. Front. Energy Res. 2022, 10, 923454. [Google Scholar] [CrossRef] [Scilit]
- Fuentes del Toro, S.; Crespo-Sanchez, J.; Ayllón, J.; Rodríguez-Prieto, A.; Camacho, A.M. Mechanical performance of 3D-printed TPU auxetic structures for energy absorption applications. Polym. Test. 2025, 143, 108669. [Google Scholar] [CrossRef] [Scilit]
- Seki, Y.; Kizilkan, E.; Leşkeri, B.M.; Sarikanat, M.; Altay, L.; Isbilir, A. Comparison of the Thermal and Mechanical Properties of Poly(phenylene sulfide) and Poly(phenylene sulfide)-Syndiotactic Polystyrene-Based Thermal Conductive Composites. ACS Omega 2022, 7, 45518–45526. [Google Scholar] [CrossRef] [Scilit]
- Do, N.B.D.; Imenes, K.; Aasmundtveit, K.E.; Nguyen, H.V.; Andreassen, E. Thermal Conductivity and Mechanical Properties of Polymer Composites with Hexagonal Boron Nitride—A Comparison of Three Processing Methods: Injection Moulding, Powder Bed Fusion and Casting. Polymers 2023, 15, 1552. [Google Scholar] [CrossRef] [Scilit] [PubMed]
- Ivanov, E.; Kotsilkova, R.; Xia, H.; Chen, Y.; Donato, R.K.; Donato, K.; Godoy, A.P.; Di Maio, R.; Silvestre, C.; Cimmino, S.; et al. PLA/Graphene/MWCNT composites with improved electrical and thermal properties suitable for FDM 3D printing applications. Appl. Sci. 2019, 9, 1209. [Google Scholar] [CrossRef] [Scilit]
- Yang, L.; Li, S.; Zhou, X.; Liu, J.; Li, Y.; Yang, M.; Yuan, Q.; Zhang, W. Effects of carbon nanotube on the thermal, mechanical, and electrical properties of PLA/CNT printed parts in the FDM process. Synth. Met. 2019, 253, 122–130. [Google Scholar] [CrossRef] [Scilit]
- Kim, Y.A.; Kamio, S.; Tajiri, T.; Hayashi, T.; Song, S.M.; Endo, M.; Terrones, M.; Dresselhaus, M.S. Enhanced thermal conductivity of carbon fiber/phenolic resin composites by the introduction of carbon nanotubes. Appl. Phys. Lett. 2007, 90, 093125. [Google Scholar] [CrossRef] [Scilit]
- Olcay, H.; Kocak, E.D. The mechanical, thermal and sound absorption properties of flexible polyurethane foam composites reinforced with artichoke stem waste fibers. J. Ind. Text. 2022, 51, 8738S–8763S. [Google Scholar] [CrossRef] [Scilit]
- Singh, C.B.; Dey, T.K. Measurement of Thermo-physical Properties of Polymer Composites by Transient Hot Wire Technique. In Proceedings of International and INCCOM-6 Conference Future Trends in Composite Materials and Processing; Indian Institute of Technology Kanpur: Kanpur, India, 2007; pp. 2–9. [Google Scholar]
- Guo, Y.; Xu, G.; Yang, X.; Ruan, K.; Ma, T.; Zhang, Q.; Gu, J.; Wu, Y.; Liu, H.; Guo, Z. Significantly enhanced and precisely modeled thermal conductivity in polyimide nanocomposites with chemically modified graphene: Via in situ polymerization and electrospinning-hot press technology. J. Mater. Chem. C 2018, 6, 3004–3015. [Google Scholar] [CrossRef] [Scilit]

Disclaimer/Publisher’s Note: The statements, opinions and data contained in all publications are solely those of the individual author(s) and contributor(s) and not of MDPI and/or the editor(s). MDPI and/or the editor(s) disclaim responsibility for any injury to people or property resulting from any ideas, methods, instructions or products referred to in the content. |
© 2026 by the authors. Licensee MDPI, Basel, Switzerland. This article is an open access article distributed under the terms and conditions of the Creative Commons Attribution (CC BY) license.