


Abstract
The anisotropic mechanical behavior of laser powder bed fused (LPBF) IN718 results from the combined effects of crystallographic texture and grain morphology, although their individual contributions remain difficult to quantify. In this work, six representative volume elements (RVEs) are systematically compared using a unified EBSD–Dream3D–DAMASK crystal plasticity framework to separate the effects of texture and morphology. The microstructures include two EBSD-derived RVEs, two discretized columnar RVEs, and two discretized lamellar RVEs generated from identical orientation distributions. Predicted elastic moduli and yield strengths are validated against experiment, while Taylor factor analysis, directional effective grain size, slip compatibility, KAM, and local crystal plasticity fields are used to identify the governing deformation mechanisms. The results show that crystallographic texture predominantly controls the elastic response, whereas grain morphology governs the onset of plastic deformation. Lamellar RVEs provide the closest agreement with the experimental yield-strength anisotropy by reproducing the directional effective grain size, the connectivity of mechanically hard domains, and the resulting redistribution of stress and plastic strain. Furthermore, texture discretization preserves the dominant anisotropic trends while substantially reducing the computational cost of full EBSD reconstructions, establishing an efficient and physically meaningful framework for crystal plasticity simulations of LPBF materials.
1. Introduction
Laser powder bed fusion (LPBF) enables the simultaneous fabrication of complex geometries and the development of microstructures that cannot readily be obtained through conventional processing. Nevertheless, the repeated melting and rapid directional solidification inherent to LPBF commonly generate elongated grains, strong crystallographic textures and, consequently, direction-dependent mechanical properties. Ishimoto et al. [1] demonstrated that texture stability is governed primarily by competition among crystallographic growth directions during epitaxial solidification, particularly by the alignment of the underlying ⟨100⟩ direction with the laser scanning direction. Building on this principle, Gokcekaya et al. [2] produced single-crystal-like, polycrystalline and crystallographic lamellar microstructures (CLMs) in IN718 by modifying the processing conditions and showed that the melt-pool geometry and associated heat-flow direction controlled their formation. Hibino et al. [3] subsequently obtained analogous texture families in Hastelloy-X and confirmed that process-induced changes in texture, grain size and lamellar boundaries produced substantial variations in Young’s modulus and tensile response. Doğu et al. [4] further showed that these as-built microstructures may evolve during solution treatment through recrystallization, twinning and precipitate-limited grain growth. The wider process–texture relationships were systematized by Cobbinah et al. [5], while Gokcekaya et al. [6] emphasized the distinctive role of the CLM and its interfaces in strengthening LPBF IN718. These studies established that crystallographic anisotropy is not merely an unavoidable consequence of LPBF, but a microstructural feature that can potentially be engineered.
More recent investigations have expanded texture control beyond conventional changes in laser power and scanning speed. Pérez-Ruiz et al. [7,8,9,10] demonstrated that spatial beam shaping modifies the thermal field, melt-pool geometry, grain size and texture intensity of LPBF IN718, thereby extending the achievable range of mechanical properties. Wójcik et al. [11] showed in Ni-Mn-Ga alloys that scanning strategy can likewise generate layered textures with pronounced effects on functional and mechanical anisotropy, although the active deformation mechanisms differ from those of IN718. Al-Lami et al. [12] provided a particularly relevant observation by showing that bidirectional scanning without interlayer rotation produces spatially ordered distributions of coarse Goss-like grains, fine Cube-like grains and geometrically necessary dislocations. These heterogeneous distributions promoted localized roughening and strain concentration, whereas a chessboard strategy produced a more spatially uniform response. Thus, the macroscopic behavior does not depend only on the global orientation distribution function (ODF); the spatial arrangement of orientations, grain morphologies and pre-existing lattice misorientations can also influence local deformation. This distinction becomes especially important for CLMs, where crystallographic orientations are not randomly distributed but organized into alternating layers with specific interfaces.
Despite these advances, the relative contributions of texture, grain morphology and interfacial arrangement to mechanical anisotropy remain incompletely resolved. Ghorbanpour et al. [13] showed experimentally and numerically that grain structure and crystallographic texture produce plastic anisotropy in additively manufactured IN718, whereas tension–compression asymmetry additionally requires non-Schmid and latent-hardening effects. Fischer et al. [14] attempted to separate morphology from crystallography using virtual LPBF 316L microstructures and concluded that crystallographic texture exerted the stronger influence on the predicted elastic and plastic response. Eghtesad et al. [15], however, demonstrated that accurate full-field predictions for IN718 also require consideration of grain size and shape, precipitates, annealing twins, dislocation hardening and their interactions. More recently, Toursangsaraki et al. [16] quantified several strengthening contributions in LPBF IN718 and identified the directional grain-size effect as the largest contributor to tensile anisotropy within their formulation. Mayama et al. [17] showed that self-organized lamellar interfaces can suppress selected slip modes through elastic and plastic interactions between differently oriented layers, introducing a strengthening mechanism that cannot be represented by texture intensity alone. Lai et al. [18] similarly found that columnar morphology modifies yield and strain hardening through the direction-dependent effective grain size, while texture changes slip activation and dislocation multiplication. Pérez-Ruiz et al. [19,20,21] further showed that the combined effects of effective grain size, local misorientation and crystallographic arrangement can produce a nearly 2.5-fold difference in the fracture toughness of LPBF IN718. These findings are not necessarily contradictory: texture largely controls the crystallographic propensity for elastic deformation and slip activation, whereas morphology, interfaces and local defect structures govern the constraints under which such slip develops. Their individual roles therefore depend on both the mechanical response considered and the microstructural representation used to evaluate it.
Crystal plasticity provides a suitable framework for examining these coupled effects because it explicitly relates crystallographic orientation, slip-system activity and intergranular interactions to the homogenized response. Roters et al. [22,23] established DAMASK as a modular full-field platform for crystal plasticity and multiphysics simulations from single-crystal to component scales. Somlo et al. [24] subsequently demonstrated that periodic crystal plasticity RVEs could reproduce anisotropic yield surfaces for different additively manufactured alloys and support virtual mechanical testing. However, the reliability of such predictions depends strongly on how the underlying microstructure is represented. Azhari et al. [25] found that statistically equivalent RVEs constructed from three orthogonal EBSD sections could reproduce the homogenized tensile response obtained using more expensive realistic three-dimensional reconstructions, provided that the principal morphological and crystallographic descriptors were retained. Bulgarevich et al. [26] extended this concept by proposing a statistical reconstruction workflow that incorporates multiple grain populations, anisotropic grain shapes and both morphological and crystallographic orientation distributions in complex as-built LPBF microstructures. Kuna et al. [27] adopted a different process-informed route by transferring solidification microstructures into crystal plasticity models to predict residual stress, strain and intragranular misorientation. Nevertheless, increasing the physical detail of an RVE does not automatically guarantee agreement with every experimental descriptor. Nazari-Onlaghi et al. [28], for example, found that Taylor, ALAMEL and full-field CPFFT models captured the principal deformation-texture components of LPBF 316L but did not accurately reproduce their intensities, indicating that both interaction assumptions and omitted microscale mechanisms can affect the predictions. Collectively, these studies show that statistical, experimentally reconstructed and idealized RVEs may all reproduce selected macroscopic responses, but they do not establish whether they preserve the same directional anisotropy when the morphology and spatial arrangement of a nominally comparable texture are modified. The importance of retaining relevant local features becomes even clearer when crystal plasticity is extended from monotonic deformation to damage and cyclic loading. Cao et al. [29,30] showed that pore morphology and neighboring slip activity control fatigue-crack nucleation through highly localized stored energy and GND accumulation. Lyu et al. [31] demonstrated that the local crystallographic arrangement surrounding lack-of-fusion defects significantly affects the predicted cyclic shakedown limit. Lashari et al. [29] likewise related fatigue localization in a nickel-based superalloy to the combined influence of defects, grain size and orientation, whereas Zeng et al. [32] showed through a coupled CPFE–cohesive-zone model that grain orientation and grain-boundary strength govern the initiation and propagation of intergranular cracks. Although these works address failure rather than the monotonic anisotropy considered here, they reinforce a common methodological point: a microstructural representation may reproduce a global stress–strain curve while still failing to preserve the local interactions responsible for directional behavior.
Accordingly, a relevant unresolved question is not simply whether synthetic RVEs can reproduce the average mechanical behavior of LPBF materials, but which microstructural descriptors must be retained to reproduce their anisotropic response. Previous studies have generally evaluated realistic EBSD reconstructions, statistically equivalent RVEs or idealized morphologies separately. Building on previous efforts to distinguish crystallographic and morphological contributions [14,26], the remaining question is whether the level of microstructural detail required depends on the specific mechanical response being predicted. A systematic comparison under identical constitutive parameters and boundary conditions is still required to determine whether a discretized set of crystallographic orientations is sufficient, whether the lamellar spatial arrangement must be preserved, and how both simplifications compare with a direct EBSD-based representation. The present study addresses this question by comparing orientation-discretized, lamellar and EBSD-based RVEs of LPBF IN718 using the same full-field crystal plasticity framework. Their elastic and plastic responses are evaluated along several loading directions to quantify the extent to which crystallographic texture governs the predicted anisotropy and to identify the secondary contribution of grain morphology and spatial orientation arrangement. This comparison provides a basis for selecting computationally efficient RVEs without assuming a priori that equivalent ODFs necessarily produce equivalent directional mechanical responses.
2. Materials and Methods
2.1. Material Fabrication and Specimen Preparation
IN718 LPBF samples were fabricated using a Renishaw AM400 system (Renishaw plc, Wotton-under-edge, UK), employing an R0 scanning strategy. The R0 designation used in this study refers to a scanning strategy with a 0° hatch rotation angle between consecutive layers; thus, the laser scanning direction remains unchanged throughout the build. Within each layer, a bidirectional scanning sequence was employed, such that consecutive parallel hatch tracks were scanned in opposite senses (e.g., +X and −X). However, the hatch orientation was not rotated between successive layers. Therefore, the R0 designation refers specifically to a 0° hatch rotation angle between consecutive layers and should not be interpreted as unidirectional laser scanning. Specimens were sectioned and prepared for microstructural characterization and mechanical testing. The IN718 feedstock used for the LPBF experiments was supplied by Renishaw and consisted of gas-atomized powder with predominantly spherical particles. The nominal particle size range was 15–45 μm. Particle size distribution was evaluated following ASTM B822, with measured D10, D50, and D90 values of 18, 30, and 47 μm, respectively. These measurements were consistent with the nominal particle size range specified for the feedstock. Metallographic preparation included standard grinding and polishing procedures to obtain surfaces suitable for EBSD analysis. Six plates were manufactured to obtain tensile specimens (See Figure 1a). Three specimens were cut from each plate at 0°, 45°, and 90° using an ONA AX3 EDM machine (ONA Electroerosión S.A, Durango, Spain) (See Figure 1b).
Figure 1.
LPBF fabrication setup and experimental conditions. (a) As-built IN718 plates. (b) Building orientation, laser scanning direction (R0), specimen orientation, and reference coordinate system. (c) Fixed processing parameters and tensile specimen orientations considered in the study.
Each batch included three plates aligned with the X-axis (α = 180°), three with the Y-axis (α = 90°). The wall-based geometry was selected to minimize geometry-dependent thermal effects, residual stresses, and distortion that may arise when directly printing tensile specimens, particularly at 45°. It also provides more uniform conditions for the development of crystallographic texture and lamellar morphology, although at the expense of additional cutting and material waste. Tensile samples followed ASTM E8 subsize specifications and were tested using an INSTRON 8801. Experimental conditions are shown in Figure 1. The build plate was not heated, and the samples did not undergo heat treatment. Three independent tensile specimens were tested for each loading orientation (n = 3), corresponding to specimens extracted from each of the three manufactured plates. Strain was measured using an extensometer, and the tensile tests were performed at a strain rate of 1 × 10⁻³ s−1.
2.2. EBSD and Microstructural Characterization
Cross-sections perpendicular to the building direction (YZ and XZ planes) were prepared for microstructural characterization. Optical microscopy observations were carried out using a Leica 3DM, whereas SEM and EBSD analyses were conducted with a Sigma 500 Zeiss FESEM (Carl Zeiss Microscopy GmbH, Oberkochem, Germany) equipped with an Oxford C-NANO detector. Prior to characterization, the specimens were ground with SiC papers and polished using diamond pads (6, 3, and 1 μm), followed by etching with Marble’s reagent. For EBSD analysis, an additional polishing step was applied using 0.04 μm colloidal silica, followed by 30 min of vibratory polishing. EBSD data were acquired with a 2 μm step size, and grain boundaries were defined using a misorientation threshold of 12°.
Electron measurements were performed to characterize the crystallographic texture and grain morphology of the LPBF IN718 samples. The acquired data were processed to generate inverse pole figure (IPF) maps and to evaluate the orientation distribution within the microstructure. The orientation distribution function (ODF) was calculated from the EBSD data to quantify the crystallographic texture of the material. The analysis allowed the identification of dominant orientation components as well as secondary orientation contributions associated with finer microstructural features. Based on the ODF, a reduced set of representative orientations was defined to construct simplified microstructural models. In particular, a dominant orientation and an additional secondary orientation were selected to approximate the experimentally observed distribution, enabling a reduced-order representation of the texture.
2.3. Representative Volume Element (RVE) Construction and Crystal Plasticity Simulations
A rate-dependent phenomenological crystal plasticity framework was implemented using the phenopowerlaw constitutive model available in DAMASK 3. The simulations considered the 12 FCC slip systems belonging to the {111}⟨110⟩ family. The constitutive parameters were calibrated manually using the EBSD-based representative volume element (RVE) subjected to axial loading along the Y direction. A closer quantitative fit in the post-yield regime would require further calibration of the slip-hardening parameters; however, a common constitutive parameter set was intentionally retained for all RVEs to enable a controlled comparison of texture and morphology effects. Accordingly, the Y-direction response is regarded as the calibration condition and not as an independent validation case. The X, Z, and 45° loading directions were not involved in the calibration procedure and were therefore used as independent predictions to assess the predictive capability of the different RVE representations against the corresponding experimental measurements. Initial parameter values were adopted from Bulgarevich et al. [26] for IN738LC and subsequently adjusted to reproduce the mechanical response of LPBF IN718. The initial critical resolved shear stress (CRSS) was set to 230 MPa, while the saturation CRSS was fixed at 770 MPa. An initial hardening modulus of 400 MPa was employed together with a strain-rate sensitivity exponent of 5 and a hardening exponent of 1.4. A reference shear rate of 0.001 s−1 was used. Isotropic hardening was described through an extended Voce-type formulation using a slip interaction matrix hsl-sl= [1, 1, 1.4, 1.4, 1.4, 1.4, 1.4].
The crystal plasticity constitutive framework implemented in DAMASK is summarized in Table 1. The formulation comprises the multiplicative decomposition of the deformation gradient, the slip-rate and hardening evolution laws, and the definitions of the equivalent von Mises stress, equivalent plastic strain, and slip-system hardening modulus used to describe the plastic response of the material.
Table 1.
Crystal plasticity constitutive equations and material parameters used in the CPFEM simulations.
The elastic response was modeled assuming cubic anisotropic elasticity according to Hooke’s law for FCC crystals. The single-crystal elastic constants employed in the simulations were C11 = 243.9 GPa, C12 = 154.9 GPa, and C44 = 110.8 GPa, resulting in a Zener anisotropy factor of approximately 2.49. These values were obtained from experimental single-crystal data reported in the literature for Inconel 718 [15,17,18]. Batch-specific determination of these constants would require extracting and testing specimens from individual grains using specialized equipment, which was beyond the scope of the present study. Therefore, experimentally determined single-crystal elastic constants reported for IN718 were adopted.
All representative volume elements (RVEs) were constructed using a computational workflow based on MATLAB/MTEX, DREAM3D, and DAMASK 3. The simulation domain consisted of a spectral grid of 50 × 50 × 50 voxels with a spatial resolution of 10 µm/voxel, corresponding to a total physical domain of 500 × 500 × 500 µm3. The spectral solver “spectral_basic” available in DAMASK 3 was used for all simulations.
The EBSD-based RVE was generated from experimentally measured EBSD maps processed in MATLAB/MTEX 6.0.0 and exported as TXT files for DREAM3D and DAMASK processing. Grain morphology was represented using superellipsoidal grains, with grain-size and aspect-ratio statistics determined from the experimental characterization on the orthogonal XZ and XY planes. The experimentally measured crystallographic orientation distribution was also incorporated into the reconstruction. Thus, the resulting RVE represents a statistically reconstructed three-dimensional microstructure rather than a direct extrusion of a two-dimensional EBSD map. The EBSD-based RVE was additionally employed as the reference configuration for constitutive parameter calibration. The analyzed area corresponded to 500 × 500 µm2, and no cleaning filters were applied to the EBSD data prior to reconstruction.
Two discretized RVEs were constructed using ellipsoidal grains elongated along the Z direction with semi-axes A = 10, B = 1, and C = 1. In both cases, the dominant texture component corresponded to the Euler orientation (0, 45, 0) representing 80% of the total volume fraction. In the first discretized RVE, the remaining 20% of the volume fraction was assigned to the orientation (0, 0, 0), whereas in the second discretized RVE the secondary orientation corresponded to (0, 35, 45). The 80/20 volume fractions were derived from the experimental EBSD-based ODF by quantifying the volume associated with the two predominant orientation families in Euler space, yielding approximately 80% for the dominant ⟨0 45 0⟩ orientation and 20% for the secondary ⟨0 35 45⟩ orientation.
Two additional lamellar RVEs were generated in order to investigate the influence of grain morphology and crystallographic arrangement. Both microstructures consisted of vertically oriented lamellae parallel to the YZ plane. The coarse lamellae possessed a thickness of four voxels (40 µm) and were assigned the Euler orientation (0, 45, 0). The fine lamellae possessed a thickness of one voxel (10 µm). In the first lamellar RVE, the fine lamellae were assigned the orientation (0, 0, 0), whereas in the second lamellar RVE the fine lamellae corresponded to (0, 35, 45).
Periodic boundary conditions (PBCs), implicitly enforced by the spectral solver, were employed in all simulations. A total of ten loading cases were analyzed, including four axial loading conditions (X, Y, Z, and 45°) together with six shear loading cases. All simulations were performed using a strain rate of 0.002 s−1. The loading history consisted of two stages. The first stage corresponded to 20 increments over 4 s, reaching approximately 0.8% strain, while the second stage consisted of 50 increments over 50 s, reaching approximately 10% total strain. The deformation was imposed through the corresponding component of the deformation gradient tensor (F), while the macroscopic stress response was obtained from the volume-averaged Cauchy stress tensor.
The effective Young’s modulus was calculated from the slope between the origin and the midpoint of the stress–strain data corresponding to nominal strains below approximately 0.5%. The yield stress was determined using the conventional 0.2% offset criterion. All reported mechanical responses correspond to volume-averaged quantities computed over all integration points within the RVEs. Post-processing operations were performed using Python libraries including DAMASK, NumPy, and Pandas, while the final stress–strain datasets were exported in CSV format for each loading direction and simulation condition. All simulations were performed using the spectral_basic solver implemented in DAMASK 3.
2.4. Taylor Factor Analysis
To complement the full-field simulations, Taylor factor calculations were performed based on the crystallographic orientations obtained from EBSD. Both uniaxial and shear loading conditions were considered. The Taylor factor distributions were analyzed as a function of loading direction, providing a mean-field estimation of the anisotropic response. These results were used to establish a direct comparison with the trends obtained from the crystal plasticity simulations.
3. Results
The results are organized to evaluate the respective roles of crystallographic texture and grain morphology in controlling the anisotropic mechanical response. First, the ability of the discretized orientation distribution to reproduce the essential anisotropic behavior is assessed. Subsequently, the influence of the lamellar grain morphology is examined to quantify its directional contribution beyond that imposed by crystallographic texture. Finally, Taylor factor analysis combined with crystal plasticity simulations is used to distinguish the respective contributions of texture and morphology, providing a framework to identify when simplified microstructural representations are sufficient and when an explicit description of the lamellar morphology is required.
3.1. Microstructural Characterization
The LPBF IN718 microstructure produced using the R0 scanning strategy exhibits a pronounced columnar grain architecture aligned with the build direction, as shown in Figure 2a. Optical microscopy reveals that these columnar grains are not uniformly distributed but are organized into elongated lamellar bands extending parallel to the build direction. SEM observations (Figure 2b) further demonstrate a close correspondence between the lamellar grain boundaries and the melt pool geometry, indicating that the repetitive thermal cycles inherent to the LPBF process promote the formation of this characteristic grain architecture. The crystallographic characteristics of the lamellar structure are illustrated by the EBSD inverse pole figure (IPF) maps shown in Figure 2c,d. The YZ section reveals the continuity of the elongated grains along the build direction, while the XY section confirms their distribution within the layer plane, demonstrating the three-dimensional nature of the lamellar morphology.
Figure 2.
Experimental evidence supporting the lamellar representative volume element (RVE).The yellow dashed lines indicate the grain boundaries separating adjacent lamellar grains (a) Optical micrograph showing the elongated lamellar grain architecture. (b) SEM image highlighting the correspondence between lamellar grain boundaries and the melt pool morphology. (c) Inverse pole figure (IPF) map of the YZ plane. (d) IPF map of the XY plane. (e) Misorientation profiles measured along representative coarse and lamellar grains.
To assess the validity of the proposed lamellar representative volume element, local misorientation profiles were measured along representative coarse and lamellar grains (Figure 2e). The average misorientation remains below approximately 3° in both grain types, indicating that the crystallographic orientation is essentially preserved along the grain length. This observation supports the assumption that each lamellar grain can be represented by a single crystallographic orientation, thereby providing experimental justification for the idealized lamellar grain morphology employed in the crystal plasticity models. The crystallographic misorientation between each point and the reference orientation was calculated according to the following equations:
where is the misorientation matrix between the crystal orientation at point i, , and the reference crystal orientation, . The misorientation angle is denoted by , while and represent the crystal symmetry operators applied to the measured and reference orientations, respectively. The operator denotes the matrix trace, and the minimum operator selects the smallest crystallographically equivalent misorientation angle.
3.2. Orientation Distribution and Texture Characteristics
The orientation distribution function (ODF) derived from EBSD data (See Figure 3) reveals a strong crystallographic texture in the case without fine grains, characterized by a highly concentrated intensity around a dominant orientation component. This condition corresponds to a high texture index and is associated with a pronounced anisotropic mechanical response.
Figure 3.
Comparison between the EBSD-derived and discretized orientation distribution functions (ODFs) for the ⟨0 0 0⟩ and ⟨0 35 45⟩ texture conditions.
In contrast, the inclusion of fine lamellar grains (as observed in Figure 2) leads to a redistribution of the ODF intensity, with the emergence of secondary orientation components. These additional components broaden the orientation distribution and reduce the dominance of the primary orientation, resulting in a more distributed texture. This modification of the ODF is expected to reduce the degree of anisotropy and influence both the elastic and plastic response of the material.
The experimentally measured texture was further translated into two discrete ODF by selecting a finite set of representative crystallographic orientations that reproduce the main features of the continuous EBSD-derived ODF. This discrete orientation distribution serves as the basis for constructing representative volume elements (RVEs) with prescribed crystallographic textures. Such an approach enables the direct incorporation of the measured orientation distribution into crystal plasticity simulations, facilitating the assessment of the effect of texture evolution on the elastic and plastic mechanical behavior of the material.
3.3. Taylor Factor Maps and Anisotropy Characterization
The Taylor factor maps obtained from the EBSD-derived and discrete ODFs exhibit a close agreement (see Figure 4), indicating that the discrete representation accurately preserves the crystallographic characteristics governing the mechanical response. In both conditions, the spatial distribution of high and low Taylor factor regions remains consistent, confirming that the dominant orientation components and their relative contribution to the deformation behavior are retained after discretization. Minor local differences are expected due to the finite number of representative orientations used in the discrete ODF; however, these variations do not alter the overall Taylor factor distribution. Consequently, the discrete ODF provides a reliable approximation of the experimentally measured texture and is suitable for generating representative volume elements (RVEs) for subsequent crystal plasticity simulations.
Figure 4.
Taylor factor distributions as a function of loading orientation in the azimuthal coordinate system, calculated from the EBSD-derived and discretized orientation distribution functions (ODFs). The columns compare the EBSD-derived and discretized texture representations for the ⟨0 0 0⟩ and ⟨0 35 45⟩ texture conditions. The rows correspond to uniaxial deformation (top), shear stress in the XZ plane (middle), and shear stress in the XY plane (bottom).
3.4. Crystal Plasticity Simulation Results
Figure 5 presents the representative volume elements (RVEs) employed in the crystal plasticity simulations, which were generated following three different reconstruction strategies. Four RVEs were created from the discrete ODFs, including two with columnar grain morphologies generated in Dream3D using the representative crystallographic orientations and typical LPBF columnar grain structures, and two additional RVEs in which the same discrete orientations were assigned to lamellar grain morphologies representative of the experimentally observed fine-grain regions. The third group consists of two RVEs reconstructed directly from the EBSD data, preserving both the experimental grain morphology and crystallographic orientations. This methodology enables a systematic comparison of the influence of texture representation and grain morphology on the predicted mechanical response. In particular, the lamellar RVEs were introduced to assess whether incorporating the experimentally observed lamellar morphology improves the agreement with the experimental results, or whether the dominant crystallographic orientations alone are sufficient to accurately capture the anisotropic mechanical behavior.
Figure 5.
Representative volume elements (RVEs) employed in the crystal plasticity simulations. The six microstructural representations include discretized columnar and lamellar RVEs generated from the ⟨0 0 0⟩ and ⟨0 35 45⟩ reduced-order orientation distributions, together with the corresponding EBSD-derived RVEs preserving the experimental grain morphology.
As summarized in Table 2, the representative volume elements (RVEs) were intentionally designed to decouple the effects of crystallographic texture and grain morphology through a series of controlled comparisons. The EBSD-based RVEs serve as the reference microstructures, preserving both the experimental orientation distribution and grain morphology. The discretized RVEs retain the same overall crystallographic characteristics while reducing the orientation dataset to a representative set of texture components, thereby enabling the influence of texture discretization to be assessed. Finally, the lamellar RVEs preserve the same discretized orientation distribution but incorporate the elongated grain architecture characteristic of LPBF materials, allowing the effect of grain morphology to be evaluated independently of crystallographic texture. This hierarchical modeling strategy provides a consistent framework for interpreting the simulated mechanical response and for quantifying the relative contributions of crystallographic texture and lamellar grain morphology to the anisotropic behavior of LPBF IN718.
Table 2.
Characteristics and purpose of the representative volume elements employed in the crystal plasticity simulations.
3.5. Directional Anisotropy and Comparison Between RVE Representations and Experimental Results
Figure 6 presents the stress–strain curves predicted by the crystal plasticity simulations for the six representative volume elements under uniaxial loading along the X, Y, Z and 45° directions, together with the corresponding experimental responses. The curves provide the basis for determining the Young’s modulus and yield strength summarized in Figure 7 and allow a direct comparison of the influence of the different RVE reconstruction strategies on the predicted mechanical behavior. The goodness-of-fit of the simulated stress–strain curves against the experimental Y-direction response was quantified using the coefficient of determination (R2) up to 2% strain. The R2 values obtained for the Discrete ⟨000⟩, Discrete ⟨0 35 45⟩, Lamellar ⟨000⟩, Lamellar ⟨0 35 45⟩, and EBSD-based ⟨0 35 45⟩ RVEs were 0.916, 0.953, 0.912, 0.964, and 0.959, respectively.
Figure 6.
Predicted stress–strain curves obtained from crystal plasticity simulations for the six representative volume elements (RVEs), together with the corresponding experimental results. The responses are shown for uniaxial loading along the X, Y, Z, and 45° directions.
Figure 7.
Trend comparison between the experimental and simulated anisotropic mechanical properties. (a) Young’s modulus and (b) Yield strength as a function of loading orientation.
For all loading directions, the simulated responses exhibit the characteristic elastic-plastic behavior of LPBF IN718 and reproduce the directional dependence observed experimentally. The mechanical response varies considerably with the loading orientation, demonstrating the strong anisotropy induced by the crystallographic texture. Regardless of the RVE representation, the X direction consistently exhibits the lowest stiffness and yield strength, whereas the 45° loading direction produces the highest stress levels. The Y and Z directions present intermediate responses, although their relative magnitudes depend on the microstructural representation adopted.
The differences between the three reconstruction strategies become more evident after yielding. The discrete and lamellar RVEs generally predict similar stress–strain evolution, while the EBSD-derived RVEs tend to provide intermediate responses between both simplified representations. The largest discrepancies among the models occur for the Y and 45° loading directions, whereas the predicted responses along X remain comparatively close. In addition, the lamellar RVEs exhibit a more pronounced distinction between the Y and Z responses than the corresponding discrete columnar RVEs, particularly for the <0 35 45> texture condition.
Compared with the experimental curves, all numerical models reproduce the overall anisotropic trend but generally predict higher stresses after yielding, especially for the 45° loading direction. Nevertheless, the simulated curves preserve the same ordering of the loading directions observed experimentally, providing a consistent basis for extracting the Young’s modulus and yield strength presented in the following section.
Figure 7 compares the experimentally measured and simulated Young’s modulus and yield strength obtained from the different RVE reconstruction strategies. Overall, all simulation approaches reproduce the same directional trend observed experimentally, with the lowest values obtained along the X direction, intermediate values along the Y and Z directions, and the highest mechanical response under the 45° loading condition.
For Young’s modulus (Figure 7a), the three reconstruction strategies produce similar values in the X direction, with differences below approximately 15 GPa. Larger differences appear in the Y direction, where the lamellar RVEs predict the highest stiffness, followed by the discrete and EBSD-derived RVEs. In contrast, the Young’s modulus obtained along the Z direction remains nearly unchanged for all reconstruction methods, with values close to 195–200 GPa. The largest variation is observed for the 45° loading direction, where the discrete and lamellar RVEs predict values above 250 GPa, whereas the EBSD-derived RVEs remain close to 235 GPa. Compared with the experimental measurements, all simulations overestimate the Young’s modulus, particularly for the 45° direction. However, the experimental directional trend is preserved, including the higher stiffness in the Y direction relative to Z. Three tensile specimens were tested for each loading orientation (n = 3). The experimentally measured Young’s modulus values (mean ± standard deviation) were 126.9 ± 3.9, 189.0 ± 7.4, 180.0 ± 9.9, and 218.0 ± 5.6 GPa for the X, Y, Z, and 45° directions, respectively. The corresponding yield strengths were 606.7 ± 8.1, 615.8 ± 3.3, 574.1 ± 4.2, and 669.2 ± 6.2 MPa, respectively.
The yield strength results (Figure 7b) exhibit a similar behavior. All simulated RVEs predict the lowest yield strength along the X direction, followed by an increase in the Y direction, a slight reduction along Z, and the maximum values under 45° loading. The differences between reconstruction strategies are relatively small for the X and Z directions, whereas larger deviations are observed in the Y and 45° loading conditions. In particular, the lamellar RVE corresponding to the <0 35 45> texture predicts the highest yield strength in the Y direction, while both lamellar and discrete RVEs provide the highest values under 45° loading. The EBSD-derived RVEs consistently predict lower yield strengths than the corresponding discrete and lamellar models for the 45° direction, although they remain above the experimental measurements. To quantitatively assess the predictive capability of the different RVE representations, relative errors were calculated for the X, Z, and 45° loading directions, which were not involved in the constitutive parameter calibration. The mean relative errors in Young’s modulus were 6.72%, 10.81%, 6.92%, 11.31%, 5.35%, and 8.42% for the Discrete ⟨000⟩, Discrete ⟨03545⟩, Lamellar ⟨000⟩, Lamellar ⟨0 35 45⟩, EBSD ⟨000⟩, and EBSD ⟨0 35 45⟩ RVEs, respectively. The corresponding mean errors in yield strength were 14.56%, 14.59%, 14.95%, 14.65%, 9.64%, and 10.95%, respectively. Overall, the EBSD-based representations exhibit the lowest mean prediction errors across the independent loading directions.
Comparing the different reconstruction strategies, the discrete and lamellar RVEs produce nearly identical global trends for both Young’s modulus and yield strength. Nevertheless, noticeable differences appear in specific loading directions. For the <0 35 45> condition, the lamellar representation predicts a higher Young’s modulus in the Y direction than in the Z direction, whereas the discrete columnar RVE yields nearly identical values for these two loading directions. A similar tendency is observed for the yield strength. In contrast, the EBSD-derived RVEs exhibit directional responses that lie between the discrete and lamellar predictions for most loading directions.
To further support the mechanical trends observed in the crystal plasticity simulations, the Taylor factor distributions were analyzed through one-dimensional profiles extracted along the azimuthal and elevation directions (Figure 8a–c). In addition, representative Taylor factor values corresponding to the loading directions investigated in the RVEs (X, Y, Z and 45°) were determined from the orientation-dependent profiles and are summarized in Figure 8d.
Figure 8.
Taylor-factor-based assessment of the crystallographic representativeness of the discretized textures. Taylor factors calculated from the complete ODF and the ⟨0 45 0⟩–⟨0 0 0⟩ and ⟨0 45 0⟩–⟨0 35 45⟩ discretized textures are compared as a function of loading orientation: (a) variation with elevation angle in the XZ plane; (b) variation with elevation angle in the YZ plane; (c) variation with azimuthal angle in the XY plane; and (d) comparison of the Taylor factors for the experimental X, Y, Z, and 45° loading directions.
The angular profiles obtained from the discrete and EBSD-derived ODFs exhibit very similar distributions, with the maxima and minima occurring at nearly identical angular positions. This agreement confirms that the discrete ODF preserves the crystallographic characteristics of the experimentally measured texture while providing a simplified representation suitable for numerical simulations. Compared with the <000> condition, the <0 35 45> texture presents consistently higher Taylor factor values over most loading orientations, whereas the EBSD-derived ODF generally lies between both discrete representations.
The Taylor factor values extracted for the loading directions analyzed in the RVEs follow the same trend previously observed for the simulated mechanical properties. For all three crystallographic representations, the Taylor factor increases progressively from the X direction to the 45° loading direction, with intermediate values for Y and Z. Furthermore, the <0 35 45> condition consistently exhibits higher Taylor factors than the <000> condition, while the EBSD-derived texture provides intermediate values. This ordering agrees with the corresponding increase in Young’s modulus and yield strength obtained from the crystal plasticity simulations, providing crystallographic support for the anisotropic mechanical response presented in the previous section.
Overall, the Taylor factor analysis confirms that the evolution of the crystallographic texture identified from the EBSD measurements is consistently reflected in both the orientation-dependent Taylor factor and the simulated mechanical response. The close correspondence between these results establishes a direct link between the experimentally measured texture, the discrete RVEs employed in the simulations, and the predicted anisotropic mechanical properties.
4. Discussion
The elastic response exhibits a considerably more consistent anisotropic trend among the discrete, lamellar, and EBSD-based microstructural representations than the plastic response. As observed in Figure 6 the directional evolution of Young’s modulus remains nearly unchanged regardless of the microstructural representation. In all simulated conditions, the X direction exhibits the lowest stiffness, whereas the 45° direction consistently corresponds to the highest Young’s modulus. This preservation of the directional hierarchy indicates that the elastic response is predominantly governed by crystallographic texture rather than by the detailed spatial arrangement of the grains. Since the elastic stiffness of FCC materials is obtained from the rotation and homogenization of the single-crystal elastic tensor according to the orientation distribution function (ODF), the dominant texture component remains the primary descriptor controlling elastic anisotropy. Grain morphology slightly modifies the magnitude of Young’s modulus but does not alter the overall anisotropic trend, indicating that elasticity is essentially texture dominated.
A second important observation from Figure 7a is that the ⟨0 0 0⟩ orientation state reproduces the experimental Young’s modulus more accurately than the ⟨0 35 45⟩ condition. Since elastic deformation represents a volumetric average over the entire material, the measured stiffness is mainly controlled by the dominant crystallographic orientation rather than by local heterogeneities or secondary texture components. Consequently, the global ODF appears sufficient to capture the first-order elastic anisotropy of LPBF-IN718, whereas finer microstructural details play only a secondary role during elastic loading.
The situation changes considerably once plastic deformation begins. As shown in Figure 7b, all simulated microstructures predict the lowest yield stress along X and the highest resistance to plastic deformation close to the 45° direction. This behaviour is fully consistent with the crystallographic texture since loading along X is predominantly associated with orientations approaching ⟨001⟩, whereas Y and Z are closer to ⟨011⟩. According to Taylor theory for FCC materials, the ⟨001⟩ orientation facilitates slip activation whereas orientations approaching ⟨011⟩ require larger applied stresses to produce equivalent plastic deformation. Therefore, crystallographic texture establishes the intrinsic anisotropic resistance to yielding. An important feature revealed by Figure 7b is that the ⟨0 35 45⟩ condition consistently reproduces the experimental separation between the Y and Z directions more accurately than the ⟨0 0 0⟩ texture. This behaviour is observed for the discrete, lamellar and EBSD-based microstructures, indicating that the improved agreement originates primarily from the crystallographic orientation state rather than from the geometric representation itself. The rotated texture partially breaks the pseudo-symmetry between the transverse directions, increasing the directional dependence of yielding and producing a response that agrees more closely with the experimental measurements.
Despite the overall consistency between simulations and experiments, an important discrepancy appears in the X direction. Although the simulations predict a substantially lower yield stress in X than in Y, the experimental results indicate a much smaller X–Y difference. This suggests that the real LPBF-IN718 material contains additional strengthening or homogenizing mechanisms that are not fully represented in the idealized crystal plasticity simulations. Since the DAMASK RVEs already incorporate columnar grain morphologies, the reduced experimental X–Y contrast cannot be attributed solely to the existence of elongated grains. Instead, the discrepancy may originate from additional microstructural features present in the real material, including cellular substructures, low-angle boundaries, dislocation networks, precipitate heterogeneity, microsegregation, and local orientation gradients. Such features may introduce additional barriers to dislocation motion that partially compensate for the crystallographically favorable slip activation predicted along the ⟨001⟩-dominated X direction. However, this interpretation should be regarded as a hypothesis, since these microscale mechanisms were not explicitly considered in the present model, and further validation is required.
A possible explanation for the experimentally reduced X–Y anisotropy is associated with the directional interaction between the applied load and the columnar LPBF microstructure. Both X and Y correspond predominantly to transverse loading relative to the elongated columnar grains. Consequently, deformation along these directions interacts with a relatively similar density of effective microstructural barriers, including subgrain boundaries, cellular structures, and transverse crystallographic interruptions. These additional barriers may elevate the experimentally measured yield stress in X, thereby reducing the contrast with Y despite the crystallographic tendency for easier slip activation along ⟨001⟩. In contrast, loading along Z is more parallel to the columnar grain direction, allowing deformation to propagate through more continuous crystallographic paths with lower effective interruption density. As a result, the influence of these secondary strengthening mechanisms may become less pronounced in Z, preserving a response more directly controlled by crystallographic texture.
To further investigate the influence of grain morphology on the directional mechanical response, a directional effective grain size analysis was performed considering the crystallographic slip direction within each grain. Unlike the conventional equivalent grain diameter, this parameter represents the uninterrupted slip distance available along the loading direction and therefore provides a more physically meaningful descriptor for anisotropic plastic deformation. This behaviour becomes evident from Figure 9, where The results demonstrate that the effective grain size is systematically smaller under Y loading than under Z loading. The cumulative distribution functions reveal a clear shift toward shorter effective grain lengths in Y, indicating that deformation repeatedly intersects thin lamellar grains and encounters a larger number of grain boundaries. Conversely, loading along Z develops predominantly parallel to the elongated grain morphology, allowing slip to propagate through longer uninterrupted crystallographic paths before reaching a grain boundary. Consequently, the grain morphology generates a directional Hall–Petch effect by modifying the effective slip distance according to the loading direction rather than altering the conventional grain size itself. The directional effective grain size was determined by identifying, for each grain, the crystallographic slip system exhibiting the maximum Schmid factor under the prescribed loading direction. The selected slip direction was subsequently projected onto the EBSD observation plane and used to define a measurement line passing through the grain centroid. The directional effective grain size was then calculated as the length of the grain intercepted along this line, according to the following equations:
where is the loading direction expressed in the crystal reference frame of grain i, is the mean crystal orientation of the grain, is the loading direction in the sample reference frame, is the Schmid factor associated with slip system , and and denote the slip direction and slip-plane normal of the corresponding FCC slip system, respectively. The symbol represents the slip system exhibiting the maximum Schmid factor, while is the corresponding slip direction expressed in the sample reference frame. The vector is the normalized projection of the selected slip direction onto the EBSD observation plane. Finally, and are the intersection points between the measurement line and the grain boundary, and denotes the directional effective grain size, defined as the length of the grain intercepted along the projected slip direction. Unlike conventional scalar grain-size measures, which do not provide a unique directional length scale for the strongly columnar/lamellar microstructure considered here, explicitly incorporates grain morphology, crystallographic slip direction, and loading orientation.
Figure 9.
Determination of the directional effective grain size. (a) EBSD map showing the grain boundary network used for the analysis. (b) Cumulative probability distributions of the effective grain size for the Y and Z loading directions. (c,d) Schematic representation of the uninterrupted grain-intercept lengths used to define the effective grain size for loading along the Y and Z directions, respectively.
This directional grain size effect provides a direct geometrical explanation for the experimentally observed increase in yield strength under Y loading. Since the deformation path intersects a larger number of lamellar grains in the transverse direction, dislocation motion experiences a higher density of effective barriers than under Z loading, where the elongated grains contribute more uniformly to the overall deformation. More importantly, these results demonstrate that the anisotropic strengthening cannot be fully interpreted from crystallographic texture alone. Instead, it emerges from the combined interaction between texture and the spatial organization of the lamellar grain network, indicating that the effective grain size constitutes a directional microstructural parameter governed by grain morphology and loading direction. It should be emphasized that the Hall–Petch framework is used here only as an interpretative basis for the experimental microstructural analysis and is not explicitly incorporated into the crystal plasticity formulation. The directional effective grain length, , is independently obtained from the experimental IPF map to quantify the grain dimension available along a given direction. In the simulations, morphology-dependent effects emerge from crystallographic slip interacting with the spatial distribution of grain boundaries, neighboring orientations, and intergranular compatibility. The comparison with dslip therefore provides a physical parallel between the experimentally characterized directional morphology and the simulated mechanical response rather than an explicit Hall–Petch implementation.
The results additionally indicate that grain morphology exerts a considerably stronger influence on plastic anisotropy than on elastic anisotropy. While the elastic response remains relatively similar among discrete, lamellar, and EBSD-based microstructures, the yield stress exhibits substantially larger differences between the various microstructural representations. In particular, the lamellar microstructures tend to amplify the anisotropic plastic response. This suggests that the spatial connectivity and elongation of grains affect strain localization and deformation compatibility during plastic flow. In lamellar arrangements, neighboring grains possessing similar orientations may form preferential deformation channels or mechanically cooperative domains that alter the distribution of local stresses and strains. Consequently, the grain architecture appears to play a secondary role in elasticity but a much more pronounced role during the onset of plastic deformation.
The physical significance of the directional effective grain size is demonstrated by Figure 10. In Figure 10a compares the mean effective grain size measured along the Y and Z loading directions for the four microstructural representations, whereas Figure 10b directly compares the effective grain size ratio with the experimentally measured yield strength ratio. The effective grain size ratio shown in Figure 10b was calculated as the ratio between the mean directional effective grain sizes obtained for the Z and Y loading directions, ,/, using the procedure defined in Equations (11)–(16). For the experimental case (Exp), the effective grain size was determined from the grains identified in the experimentally obtained IPF map, whereas for the other microstructural representations it was calculated from the corresponding synthetically generated grains. A remarkable correlation is observed between both quantities. The lamellar representation provides the closest agreement with the experimental effective grain size ratio and simultaneously reproduces the experimentally observed Y–Z yield strength difference more accurately than the remaining models. Conversely, the discrete ODF representation predicts the smallest anisotropy in yield strength while exhibiting the largest effective grain size ratio. The EBSD reconstruction lies between both idealized representations and also exhibits intermediate mechanical behaviour. This strong correlation indicates that the directional effective grain size constitutes a physically meaningful descriptor linking grain morphology with macroscopic plastic anisotropy. Rather than acting as an isolated geometric parameter, the effective grain size captures how the spatial arrangement of the lamellar grains modifies the density of grain boundary intersections experienced by dislocations during plastic flow.
Figure 10.
Directional effective grain size and its relationship with yield strength anisotropy. (a) Mean effective grain size for loading along the Y and Z directions. (b) Comparison between the effective grain size ratio (Y/Z) and the corresponding yield strength ratio for the different microstructural representations.
Additional insight into the deformation mechanism is provided by Figure 11. Figure 11a,b present the grain boundary network coloured according to the slip compatibility factor (m′) for the Y and Z loading directions, respectively. Although the local distribution of compatibility varies throughout the microstructure, the overall tendency indicates that grain boundaries exhibit higher compatibility during Y loading than during Z loading. Figure 11d,e superimpose these compatibility maps onto the corresponding IPF microstructures, facilitating the identification of the crystallographic domains associated with high and low compatibility boundaries. This representation reveals that the lamellar grain architecture produces distinct compatibility patterns depending on the loading direction, suggesting that grain morphology influences slip transfer in addition to the crystallographic orientation itself. The cumulative probability distributions shown in Figure 11c provide quantitative confirmation of this trend, demonstrating that the overall m′ distribution is systematically shifted towards higher compatibility values under Y loading. Consequently, neighbouring grains are expected to accommodate plastic deformation more cooperatively in the transverse direction, whereas slip transfer becomes comparatively less favourable under Z loading.
Figure 11.
Slip compatibility and local crystallographic state of the lamellar microstructure. (a,b) Grain boundary slip compatibility (m′) maps for loading along the Y and Z directions, respectively. (c) Cumulative probability distributions of the slip compatibility factor (m′). (d,e) Superposition of the m′ maps on the corresponding IPF maps. (f) Kernel average misorientation (KAM) map showing the local crystallographic misorientation distribution within the lamellar grain structure.
A second and independent piece of evidence is provided by Figure 11f, which presents the KAM distribution in the undeformed material. The thin lamellar grains consistently exhibit higher local misorientation than the surrounding coarse grains, indicating that these regions retain larger lattice distortions after the LPBF process. Although the KAM measurements correspond to the as-built condition rather than the deformed state, the higher stored lattice curvature suggests that the lamellar grains may constitute mechanically more resistant regions during subsequent deformation. Together with the reduced effective grain size and the directional variation in the slip compatibility factor, these observations indicate that the lamellar grain network modifies the mechanical compatibility between neighbouring grains, thereby contributing to the experimentally observed plastic anisotropy.
Further insight into the underlying deformation mechanisms is provided by the local crystal plasticity fields shown in Figure 12. Although these fields correspond to the discrete microstructure, this representation offers a convenient framework for tracking the response of individual grains and identifying the micromechanical mechanisms governing the macroscopic behaviour. In particular, grains A, B and C, corresponding to the secondary ⟨0 35 45⟩ orientation domains, which exhibit greater resistance to deformation under the analyzed loading conditions, consistently develop higher von Mises stresses, higher evolved critical resolved shear stresses (CRSS), and lower equivalent plastic strains than the surrounding coarse grains under both Y and Z loading. The simultaneous occurrence of these three independent field variables identifies these grains as mechanically hard domains that resist slip activation while accumulating larger internal stresses. Although the discrete representation does not explicitly reproduce the continuous lamellar architecture observed experimentally, the EBSD microstructure reveals that these hard grains are actually arranged as elongated and spatially connected lamellar bands embedded within thicker grains. Consequently, under transverse loading, this interconnected lamellar network repeatedly interrupts the deformation path, forcing the neighbouring coarse grains to accommodate a larger fraction of the imposed plastic strain while the lamellar domains remain comparatively less deformed despite carrying higher stresses and CRSS values. This strain partitioning mechanism arises from the collective interaction between crystallographic texture, grain morphology and deformation compatibility, providing a physical explanation for the enhanced anisotropic plastic response observed experimentally.
Figure 12.
Crystal plasticity fields illustrating the micromechanical deformation mechanisms in the discrete microstructure. The first row presents the three-dimensional representative volume element together with the distributions of equivalent stress, equivalent plastic strain, and critical resolved shear stress (CRSS). The second and third rows show cross-sectional views for loading along the Y and Z directions, respectively. Representative grains A, B, and C are identified to facilitate the comparison of their mechanical response under the different loading conditions.
This interaction becomes particularly evident when comparing the Y and Z loading directions. Although grains A, B and C belong to the same secondary crystallographic orientation and would therefore be expected to exhibit similar intrinsic mechanical behaviour, the surrounding polycrystalline aggregate produces a markedly different behavior. Under Y loading, the imposed deformation repeatedly intersects mechanically hard lamellar domains, requiring the neighboring coarse grains to accommodate a larger fraction of the total displacement. Consequently, the coarse grains develop larger local plastic strains despite the higher macroscopic Young’s modulus and yield strength observed experimentally. In contrast, under Z loading, where deformation develops approximately parallel to the elongated grain morphology, neighboring grains contribute more uniformly to the overall deformation, resulting in a more homogeneous strain distribution. This mechanism provides a physical explanation for why the lamellar ⟨0 35 45⟩ representation reproduces the experimentally observed separation between the Y and Z responses more accurately than the corresponding discrete model. While both representations preserve essentially the same crystallographic orientation distribution, only the lamellar morphology fully captures the spatial connectivity of mechanically hard domains responsible for the directional redistribution of stress and plastic strain, demonstrating that the spatial connectivity of mechanically hard domains, rather than crystallographic texture alone, governs the directional redistribution of stress and plastic strain during yielding.
The EBSD-based models consistently produce intermediate behavior between the idealized simulations and the experimental results. This observation suggests that the EBSD reconstructions preserve important aspects of the real microstructural heterogeneity, including orientation dispersion, irregular grain morphologies, and local incompatibilities, which are partially lost in the simplified discrete and lamellar representations. Therefore, the EBSD-based simulations appear to provide a more physically realistic approximation of the actual LPBF microstructure while still preserving the dominant anisotropic trends predicted by crystal plasticity.
Finally, the present results demonstrate that the anisotropic mechanical response of LPBF-IN718 cannot be fully described by crystallographic texture alone. While the dominant texture governs the first-order elastic response and establishes the intrinsic crystallographic resistance to slip, the lamellar grain architecture controls how this crystallographic anisotropy is expressed during plastic deformation. By modifying the directional effective grain size, the mechanical compatibility between neighbouring grains, and the spatial redistribution of stresses and plastic strain, the lamellar network becomes a key microstructural feature governing the experimentally observed yield strength anisotropy. These findings demonstrate that accurate prediction of the mechanical behaviour of LPBF materials requires the simultaneous consideration of crystallographic texture and grain morphology rather than relying exclusively on conventional texture descriptors.
5. Conclusions
This study investigates the relative contributions of crystallographic texture and grain morphology to the anisotropic elastic and plastic behavior of LPBF IN718 through crystal plasticity simulations based on discrete, lamellar, and EBSD-derived microstructural representations. By systematically comparing idealized and experimentally reconstructed microstructures, the proposed methodology provides new insight into the micromechanical mechanisms governing anisotropic deformation and clarifies the respective roles of texture, grain morphology, and their interaction in determining the macroscopic mechanical response.
The key findings are summarized as follows:
- •
- The comparison between discrete, lamellar, and EBSD-based microstructural representations demonstrates that crystallographic texture discretization provides an efficient framework for capturing the first-order anisotropic mechanical response while substantially reducing the computational complexity associated with full EBSD reconstructions. The discrete representation successfully reproduces the dominant crystallographic trends and offers a convenient framework for identifying the governing micromechanical mechanisms. However, it underestimates the influence of grain morphology on plastic anisotropy because it does not preserve the spatial connectivity of the lamellar grain network. Incorporating lamellar grain morphology significantly improves the prediction of yield strength anisotropy while maintaining a simplified and computationally efficient microstructural description. Consequently, texture discretization combined with representative grain morphology constitutes a practical compromise between computational efficiency and predictive capability for crystal plasticity simulations of LPBF materials.
- •
- The elastic response is primarily governed by crystallographic texture. All microstructural representations preserve the same directional evolution of Young’s modulus, indicating that the dominant orientation distribution function (ODF) is sufficient to capture the first-order elastic anisotropy of LPBF IN718.
- •
- In contrast, the plastic response is considerably more sensitive to the crystallographic orientation state. While the dominant texture establishes the intrinsic resistance to slip activation, the ⟨0 35 45⟩ orientation state reproduces the experimentally observed separation between the Y and Z directions more accurately than the ⟨0 0 0⟩ condition.
- •
- Grain morphology plays a secondary role during elastic deformation but becomes a key factor controlling the onset of plasticity. The lamellar microstructure consistently provides the closest agreement with the experimental yield strength anisotropy, demonstrating that the spatial arrangement of grains significantly influences plastic deformation.
- •
- A directional effective grain size, defined as the uninterrupted slip distance along the loading direction, successfully explains the experimentally observed strengthening anisotropy. The close agreement between effective grain size ratios and yield strength ratios demonstrates that this parameter constitutes a physically meaningful descriptor linking grain morphology to macroscopic plastic behavior.
- •
- Slip compatibility analysis and KAM measurements reveal that the lamellar grain network modifies both the mechanical interaction between neighboring grains and the stored lattice distortion inherited from the LPBF process. Together, these mechanisms promote direction-dependent slip transfer and contribute to the observed anisotropic plastic response.
- •
- Crystal plasticity simulations show that mechanically hard lamellar domains accumulate higher stresses and CRSS while remaining comparatively less deformed than the surrounding coarse grains. Their spatial connectivity produces strain partitioning and directional stress redistribution, providing a physical explanation for the superior predictive capability of the lamellar microstructural representation.
Overall, the results demonstrate that the anisotropic mechanical behavior of LPBF IN718 cannot be accurately described by crystallographic texture alone. Instead, the macroscopic response emerges from the coupled interaction between crystallographic texture and the lamellar grain architecture, which together govern effective slip distance, deformation compatibility, and strain partitioning during plastic flow.
Author Contributions
Conceptualization, J.D.P.-R. and A.G.; methodology, J.D.P.-R. and J.P.; software, J.P. and J.D.P.-R.; validation, J.D.P.-R., J.P. and A.G.; formal analysis, J.D.P.-R.; investigation, J.D.P.-R. and J.P.; resources, A.G. and L.N.L.d.L.; data curation, J.D.P.-R.; writing—original draft preparation, J.D.P.-R.; writing—review and editing, J.D.P.-R., J.P., L.N.L.d.L. and J.B.; visualization, J.D.P.-R.; supervision, A.G., L.N.L.d.L. and J.B.; project administration, J.D.P.-R.; funding acquisition, L.N.L.d.L. All authors have read and agreed to the published version of the manuscript.
Funding
This research was partially funded by “Colombia científica—Pasaporte a la Ciencia—ICETEX”—Line of Focus: health, challenge 3: “Scientific and technological development for timely treatment,” and Colfuturo Scholarship grant.
Data Availability Statement
Data available on request due to restrictions (confidentiality reasons).
Acknowledgments
The authors gratefully acknowledge the financial support provided by the Spanish State Research Agency (AEI) through the NEOPHYM project, and by the Basque Government through the University Research Groups programme (grant IT1894-26). The authors gratefully acknowledge the support provided by the Colombia Científica Program—Pasaporte a la Ciencia, administered by ICETEX, under the Strategic Focus Health, Challenge 3: Scientific and Technological Development for Timely Treatment. The authors also acknowledge the support of Colfuturo through its doctoral scholarship program. The authors further thank the Advanced Aeronautics Manufacturing Centre (CFAA) for providing access to the facilities and equipment used for the experimental characterization.
Conflicts of Interest
The authors declare no conflicts of interest.
References
- Ishimoto, T.; Hagihara, K.; Hisamoto, K.; Nakano, T. Stability of Crystallographic Texture in Laser Powder Bed Fusion: Understanding the Competition of Crystal Growth Using a Single Crystalline Seed. Addit. Manuf. 2021, 43, 102004. [Google Scholar] [CrossRef] [Scilit]
- Gokcekaya, O.; Ishimoto, T.; Hibino, S.; Yasutomi, J.; Narushima, T.; Nakano, T. Unique Crystallographic Texture Formation in Inconel 718 by Laser Powder Bed Fusion and Its Effect on Mechanical Anisotropy. Acta Mater. 2021, 212, 116876. [Google Scholar] [CrossRef] [Scilit]
- Hibino, S.; Todo, T.; Ishimoto, T.; Gokcekaya, O.; Koizumi, Y.; Igashira, K.; Nakano, T. Control of Crystallographic Texture and Mechanical Properties of Hastelloy-X via Laser Powder Bed Fusion. Crystals 2021, 11, 1064. [Google Scholar] [CrossRef] [Scilit]
- Doğu, M.N.; Davut, K.; Obeidi, M.A.; Yalçın, M.A.; Gu, H.; Low, T.S.E.; Ginn, J.; Brabazon, D. Recrystallization and Grain Growth Kinetics of IN718 Manufactured by Laser Powder Bed Fusion. J. Mater. Res. Technol. 2022, 19, 4242–4257. [Google Scholar] [CrossRef] [Scilit]
- Cobbinah, P.V.; Matsunaga, S.; Yamabe-Mitarai, Y. Controlled Crystallographic Texture Orientation in Structural Materials Using the Laser Powder Bed Fusion Process—A Review. Adv. Eng. Mater. 2023, 25, 2300819. [Google Scholar] [CrossRef] [Scilit]
- Gokcekaya, O.; Ishimoto, T.; Nakano, T. Crystallographic Lamellar Texture Formation and Enhanced Mechanical Properties via Lamellar Interface in Ni-Based Inconel 718 Fabricated by Laser Powder Bed Fusionn. J. Smart Process. 2023, 12, 163–167. [Google Scholar] [CrossRef] [Scilit]
- Pérez-Ruiz, J.D.; de Lacalle, L.N.L.; Urbikain, G.; Álvarez, H.; Pacheco, J. Instantaneous Contact Area-Based Model for Shear Strength Sensitive Cutting Coefficients Characterization of Anisotropic Parts. Eng. Sci. Technol. Int. J. 2024, 52, 101650. [Google Scholar] [CrossRef] [Scilit]
- Pérez-Ruiz, J.D.; de Lacalle, L.N.L.; Urbikain, G.; Pereira, O.; Martínez, S.; Bris, J. On the Relationship between Cutting Forces and Anisotropy Features in the Milling of LPBF Inconel 718 for near Net Shape Parts. Int. J. Mach. Tools Manuf. 2021, 170, 103801. [Google Scholar] [CrossRef] [Scilit]
- Pérez-Ruiz, J.D.; Galbusera, F.; Caprio, L.; Previtali, B.; de Lacalle, L.N.L.; Lamikiz, A.; Demir, A.G. Laser Beam Shaping Facilitates Tailoring the Mechanical Properties of IN718 during Powder Bed Fusion. J. Mater. Process. Technol. 2024, 328, 118393. [Google Scholar] [CrossRef] [Scilit]
- Pérez-Ruiz, J.; González-Barrio, H.; Sanz-Calle, M.; Gómez-Escudero, G.; Munoa, J.; de Lacalle, L.L. Machining Stability Improvement in LPBF Printed Components through Stiffening by Crystallographic Texture Control. CIRP Ann. 2023, 72, 142–144. [Google Scholar] [CrossRef] [Scilit]
- Wójcik, A.; Chulist, R.; Szewczyk, A.; Morończyk, B.; Żrodowski, Ł.; Wróblewski, R.; Kowalczyk, M.; Kolano-Burian, A.; Zackiewicz, P.; Schell, N.; et al. Microstructure and Texture Control of Ni-Mn-Ga Magnetic Shape Memory Alloys Manufactured by Laser Powder Bed Fusion. Addit. Manuf. 2024, 86, 104225. [Google Scholar] [CrossRef] [Scilit]
- Al-Lami, J.; Dessolier, T.; Rogers, S.R.; Pirzada, T.; Pham, M.S. Dislocation Distribution, Crystallographic Texture Evolution, and Plastic Inhomogeneity of Inconel 718 Fabricated by Laser Powder Bed Fusion. Adv. Eng. Mater. 2025, 27, 2400524. [Google Scholar] [CrossRef] [Scilit]
- Ghorbanpour, S.; Alam, M.E.; Ferreri, N.C.; Kumar, A.; McWilliams, B.A.; Vogel, S.C.; Bicknell, J.; Beyerlein, I.J.; Knezevic, M. Experimental Characterization and Crystal Plasticity Modeling of Anisotropy, Tension-Compression Asymmetry, and Texture Evolution of Additively Manufactured Inconel 718 at Room and Elevated Temperatures. Int. J. Plast. 2020, 125, 63–79. [Google Scholar] [CrossRef] [Scilit]
- Fischer, T.; Hitzler, L.; Werner, E. Morphological and Crystallographic Effects in the Laser Powder-Bed Fused Stainless Steel Microstructure. Crystals 2021, 11, 672. [Google Scholar] [CrossRef] [Scilit]
- Eghtesad, A.; Knezevic, M. A Full-Field Crystal Plasticity Model Including the Effects of Precipitates: Application to Monotonic, Load Reversal, and Low-Cycle Fatigue Behavior of Inconel 718. Mater. Sci. Eng. A 2021, 803, 140478. [Google Scholar] [CrossRef] [Scilit]
- Toursangsaraki, M.; Du, D.; Wang, H.; Dong, A. Crystal Plasticity Quantification of Anisotropic Tensile and Fatigue Properties in Laser Powder Bed Fused Inconel 718 Superalloy. Addit. Manuf. 2024, 89, 104300. [Google Scholar] [CrossRef] [Scilit]
- Mayama, T.; Ishimoto, T.; Tane, M.; Cho, K.; Manabe, K.; Miyashita, D.; Higashino, S.; Kikukawa, T.; Yasuda, H.Y.; Nakano, T. Novel Strengthening Mechanism of Laser Powder Bed Fusion-Manufactured Inconel 718: Effects of Customized Hierarchical Interfaces. Addit. Manuf. 2024, 93, 104412. [Google Scholar] [CrossRef] [Scilit]
- Lai, R.; Zhao, J.; Lei, L.; Shi, L.; Wu, S.; Zhang, X. Revealing the Tensile Anisotropic Mechanisms of Additive Manufactured IN718 Alloy Based on Crystal Plasticity Modeling. Comput. Mater. Sci. 2025, 251, 113735. [Google Scholar] [CrossRef] [Scilit]
- Perez-Ruiz, J.D.; Velilla-Díaz, W.; Abasolo, M.; Gómez Escudero, G.; López de Lacalle, L.N. Effect of Microstructure and Crystallographic Texture on the Fracture Toughness Anisotropy of LPBF IN718. Materials 2025, 18, 3737. [Google Scholar] [CrossRef] [Scilit] [PubMed]
- Pérez-Ruiz, J.D.; López de Lacalle, L.N.; Velilla-Díaz, W.; Mesa, J.A.; Gómez, G.; Maury, H.; Urbikain, G.; Gonzalez, H. Evaluating the Feasibility of Using Crystalline Patterns Induced by PBF-LB to Predict Strength Enhancing Orientations. Mater. Des. 2025, 254, 114006. [Google Scholar] [CrossRef] [Scilit]
- Pérez, J.D.; Maury, H.; Bris, J.; Ojeda, M. Thermomechanical Modeling of a Sleeve Rehabilitation System for Pressure Pipes. J. Press. Vessel Technol. 2020, 142, 061302. [Google Scholar] [CrossRef] [Scilit]
- Roters, F.; Diehl, M.; Shanthraj, P.; Eisenlohr, P.; Reuber, C.; Wong, S.L.; Maiti, T.; Ebrahimi, A.; Hochrainer, T.; Fabritius, H.O.; et al. DAMASK—The Düsseldorf Advanced Material Simulation Kit for Modeling Multi-Physics Crystal Plasticity, Thermal, and Damage Phenomena from the Single Crystal up to the Component Scale. Comput. Mater. Sci. 2019, 158, 420–478. [Google Scholar] [CrossRef] [Scilit]
- Motaman, S.A.H.; Roters, F.; Haase, C. Anisotropic Polycrystal Plasticity Due to Microstructural Heterogeneity: A Multi-Scale Experimental and Numerical Study on Additively Manufactured Metallic Materials. Acta Mater. 2020, 185, 340–369. [Google Scholar] [CrossRef] [Scilit]
- Somlo, K.; Frodal, B.H.; Funch, C.V.; Poulios, K.; Winther, G.; Hopperstad, O.S.; Børvik, T.; Niordson, C.F. Anisotropic Yield Surfaces of Additively Manufactured Metals Simulated with Crystal Plasticity. Eur. J. Mech.-A/Solids 2022, 94, 104506. [Google Scholar] [CrossRef] [Scilit]
- Azhari, F.; Davids, W.; Chen, H.; Ringer, S.P.; Wallbrink, C.; Sterjovski, Z.; Crawford, B.R.; Agius, D.; Wang, C.H.; Schaffer, G. A Comparison of Statistically Equivalent and Realistic Microstructural Representative Volume Elements for Crystal Plasticity Models. Integr. Mater. Manuf. Innov. 2022, 11, 214–229. [Google Scholar] [CrossRef] [Scilit]
- Bulgarevich, D.S.; Nomoto, S.; Watanabe, M.; Demura, M. Crystal Plasticity Simulations with Representative Volume Element of As-Build Laser Powder Bed Fusion Materials. Sci. Rep. 2023, 13, 20372. [Google Scholar] [CrossRef] [Scilit] [PubMed]
- Kuna, L.; Birnbaum, A.J.; Teferra, K. A Framework for Predicting Residual Mechanical Response Fields for Laser Powder Bed Fusion at the Polycrystalline Length Scale. Addit. Manuf. 2023, 78, 103830. [Google Scholar] [CrossRef] [Scilit]
- Nazari-Onlaghi, S.; Li, G.; Vanmeensel, K.; Seefeldt, M. Deformation Texture in LPBF 316L Studied by Different Crystal Plasticity Models. Mater. Sci. Eng. A 2025, 924, 147769. [Google Scholar] [CrossRef] [Scilit]
- Lashari, M.I.; Li, W.; Mahmood, A.; Hu, Z.; Li, C.; Jin, Y.; Cao, X. Exploring the Mechanical Response, Interior Failure Behavior, and Life Prediction of GH4169 Superalloy Using Crystal Plasticity Modeling. J. Alloys Compd. 2025, 1044, 184431. [Google Scholar] [CrossRef] [Scilit]
- He, M.; Cao, H.; Liu, Q.; Yi, J.; Ni, Y.; Wang, S. Evolution of Dislocation Cellular Pattern in Inconel 718 Alloy Fabricated by Laser Powder-Bed Fusion. Addit. Manuf. 2022, 55, 102839. [Google Scholar] [CrossRef] [Scilit]
- Lyu, X.; Weber, F.; Gebhardt, C.; Chen, G.; Broeckmann, C. Crystal Plasticity Enhanced Direct Cyclic Analysis of Cyclic Behaviour of LPBF-Manufactured AISI 316L. Mater. Des. 2024, 240, 112864. [Google Scholar] [CrossRef] [Scilit]
- Zeng, G.; Huang, Z.; Deng, B.; Ge, R. Crystal Plasticity Finite Element Simulation of Tensile Fracture of 316L Stainless Steel Produced by Selective Laser Melting. Metals 2025, 15, 567. [Google Scholar] [CrossRef] [Scilit]
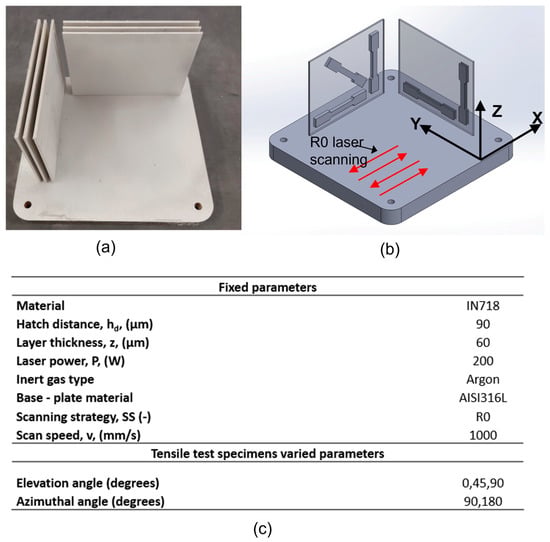
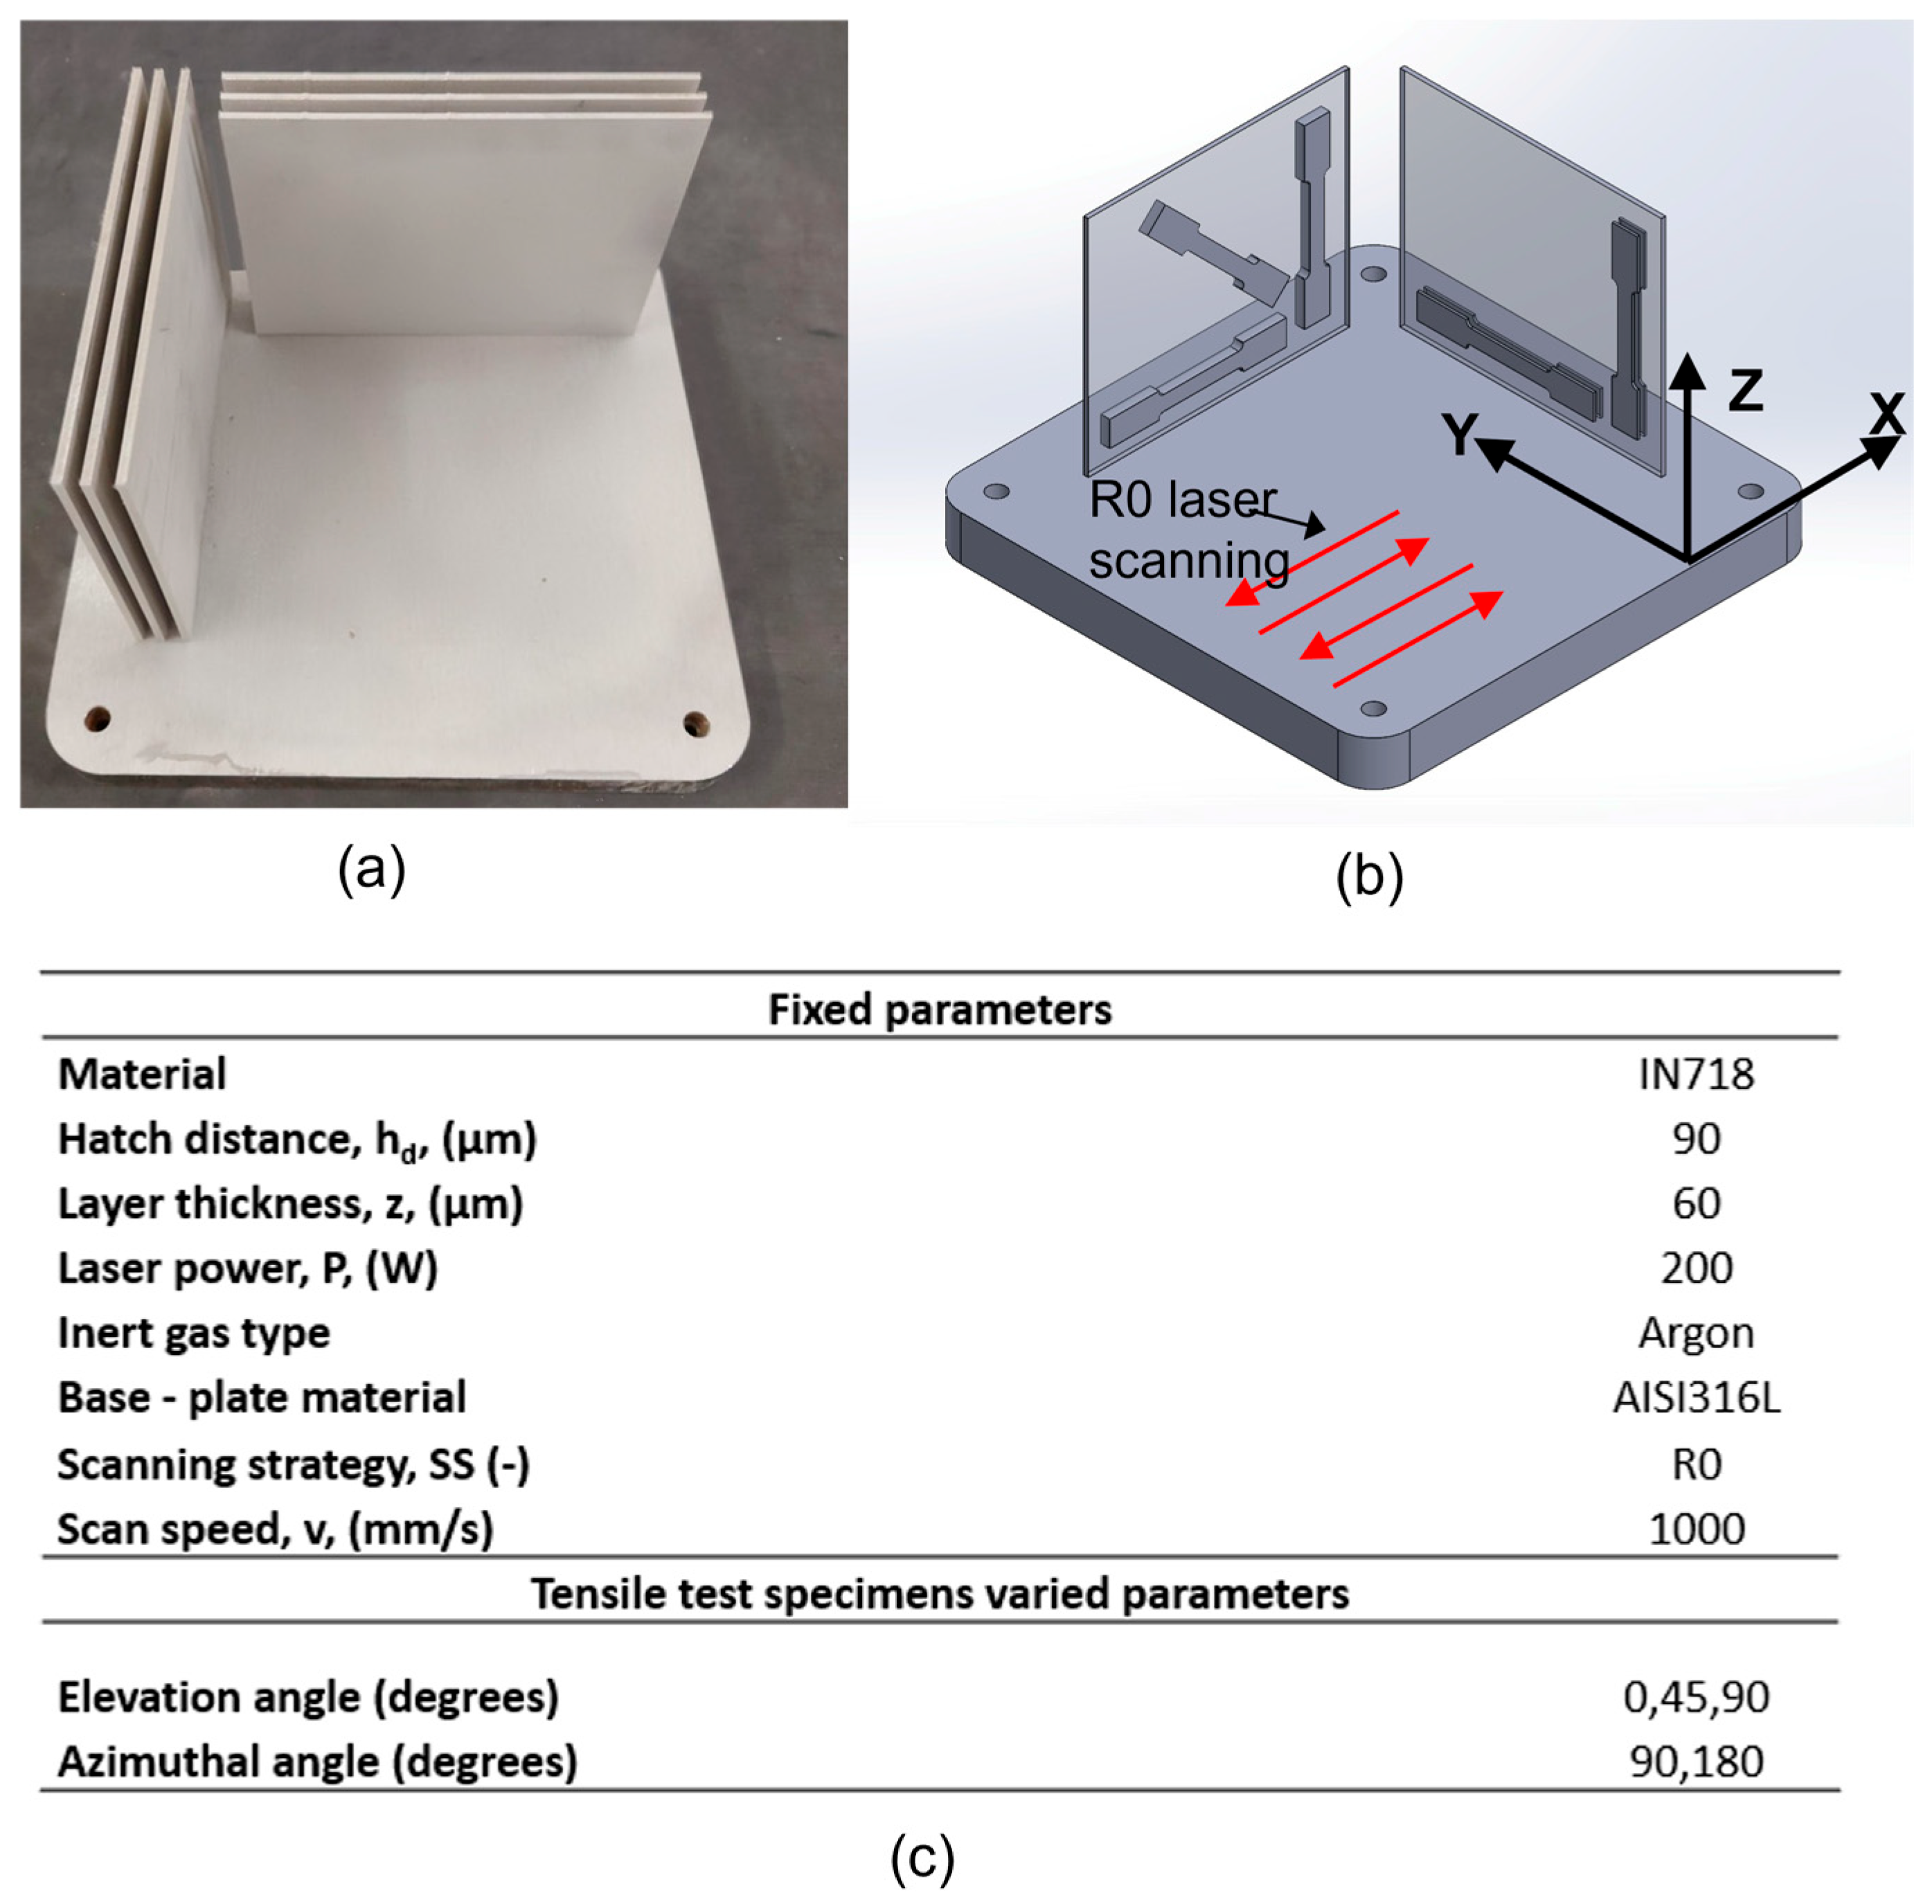
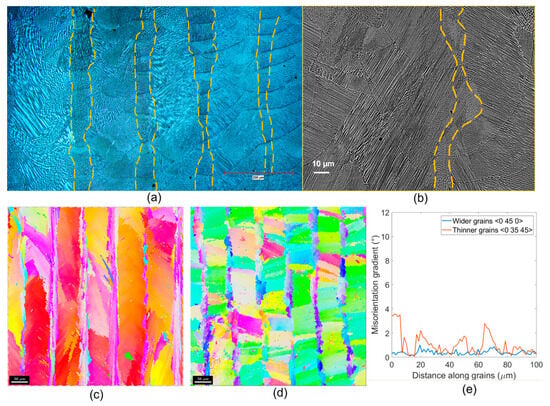
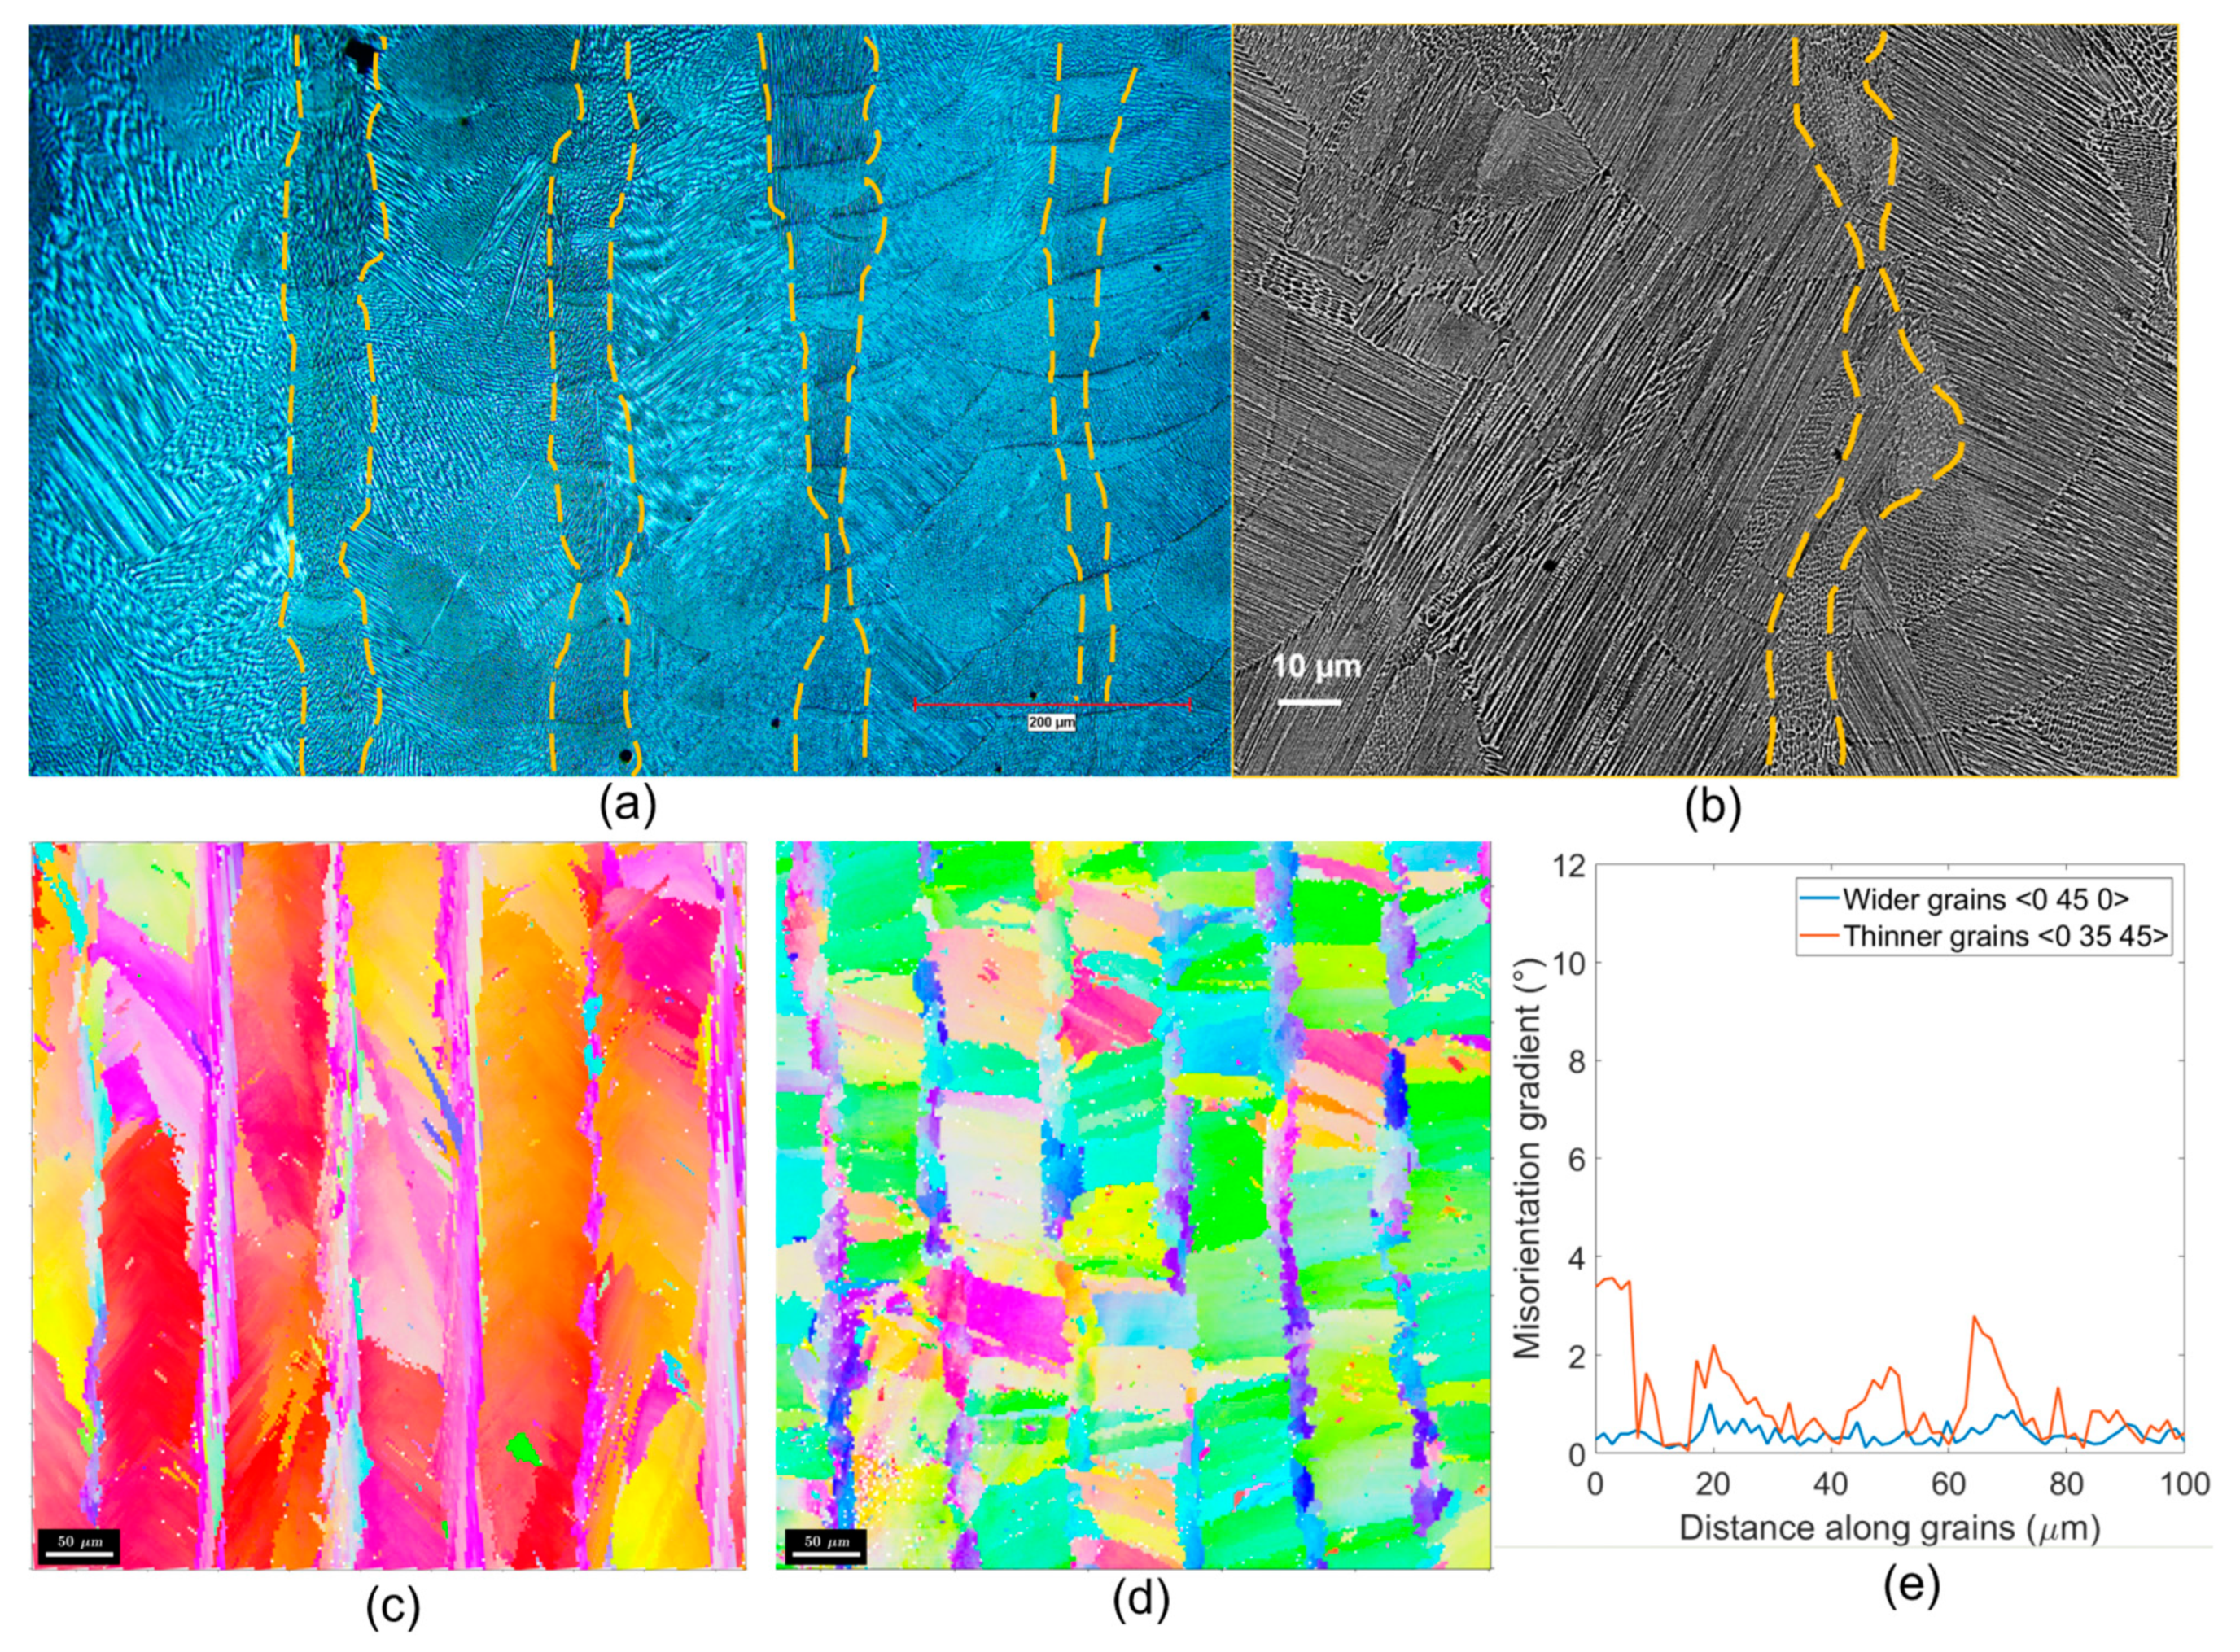
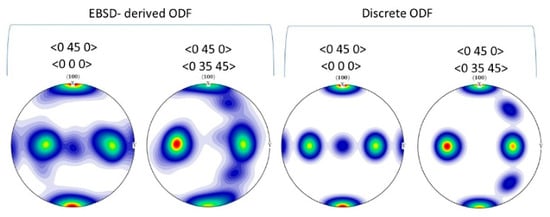
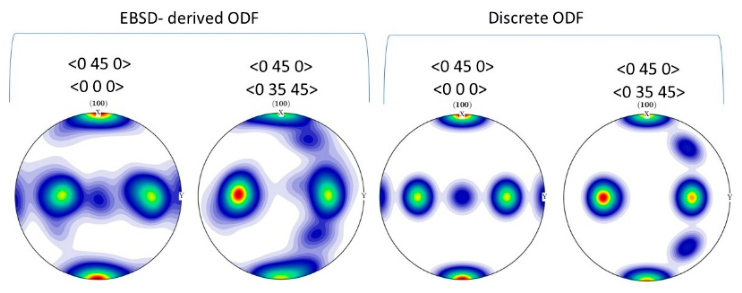
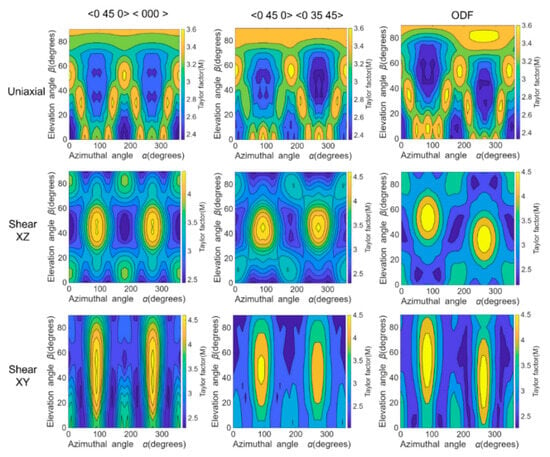
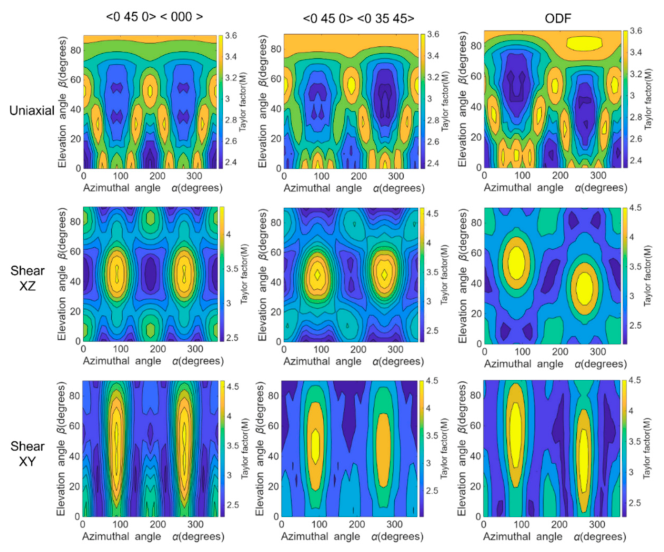
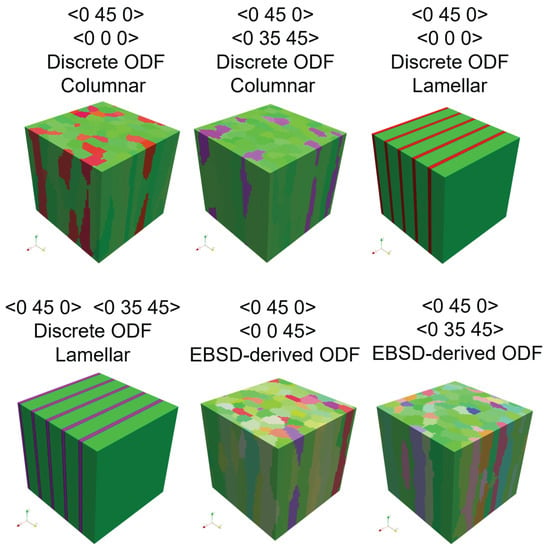
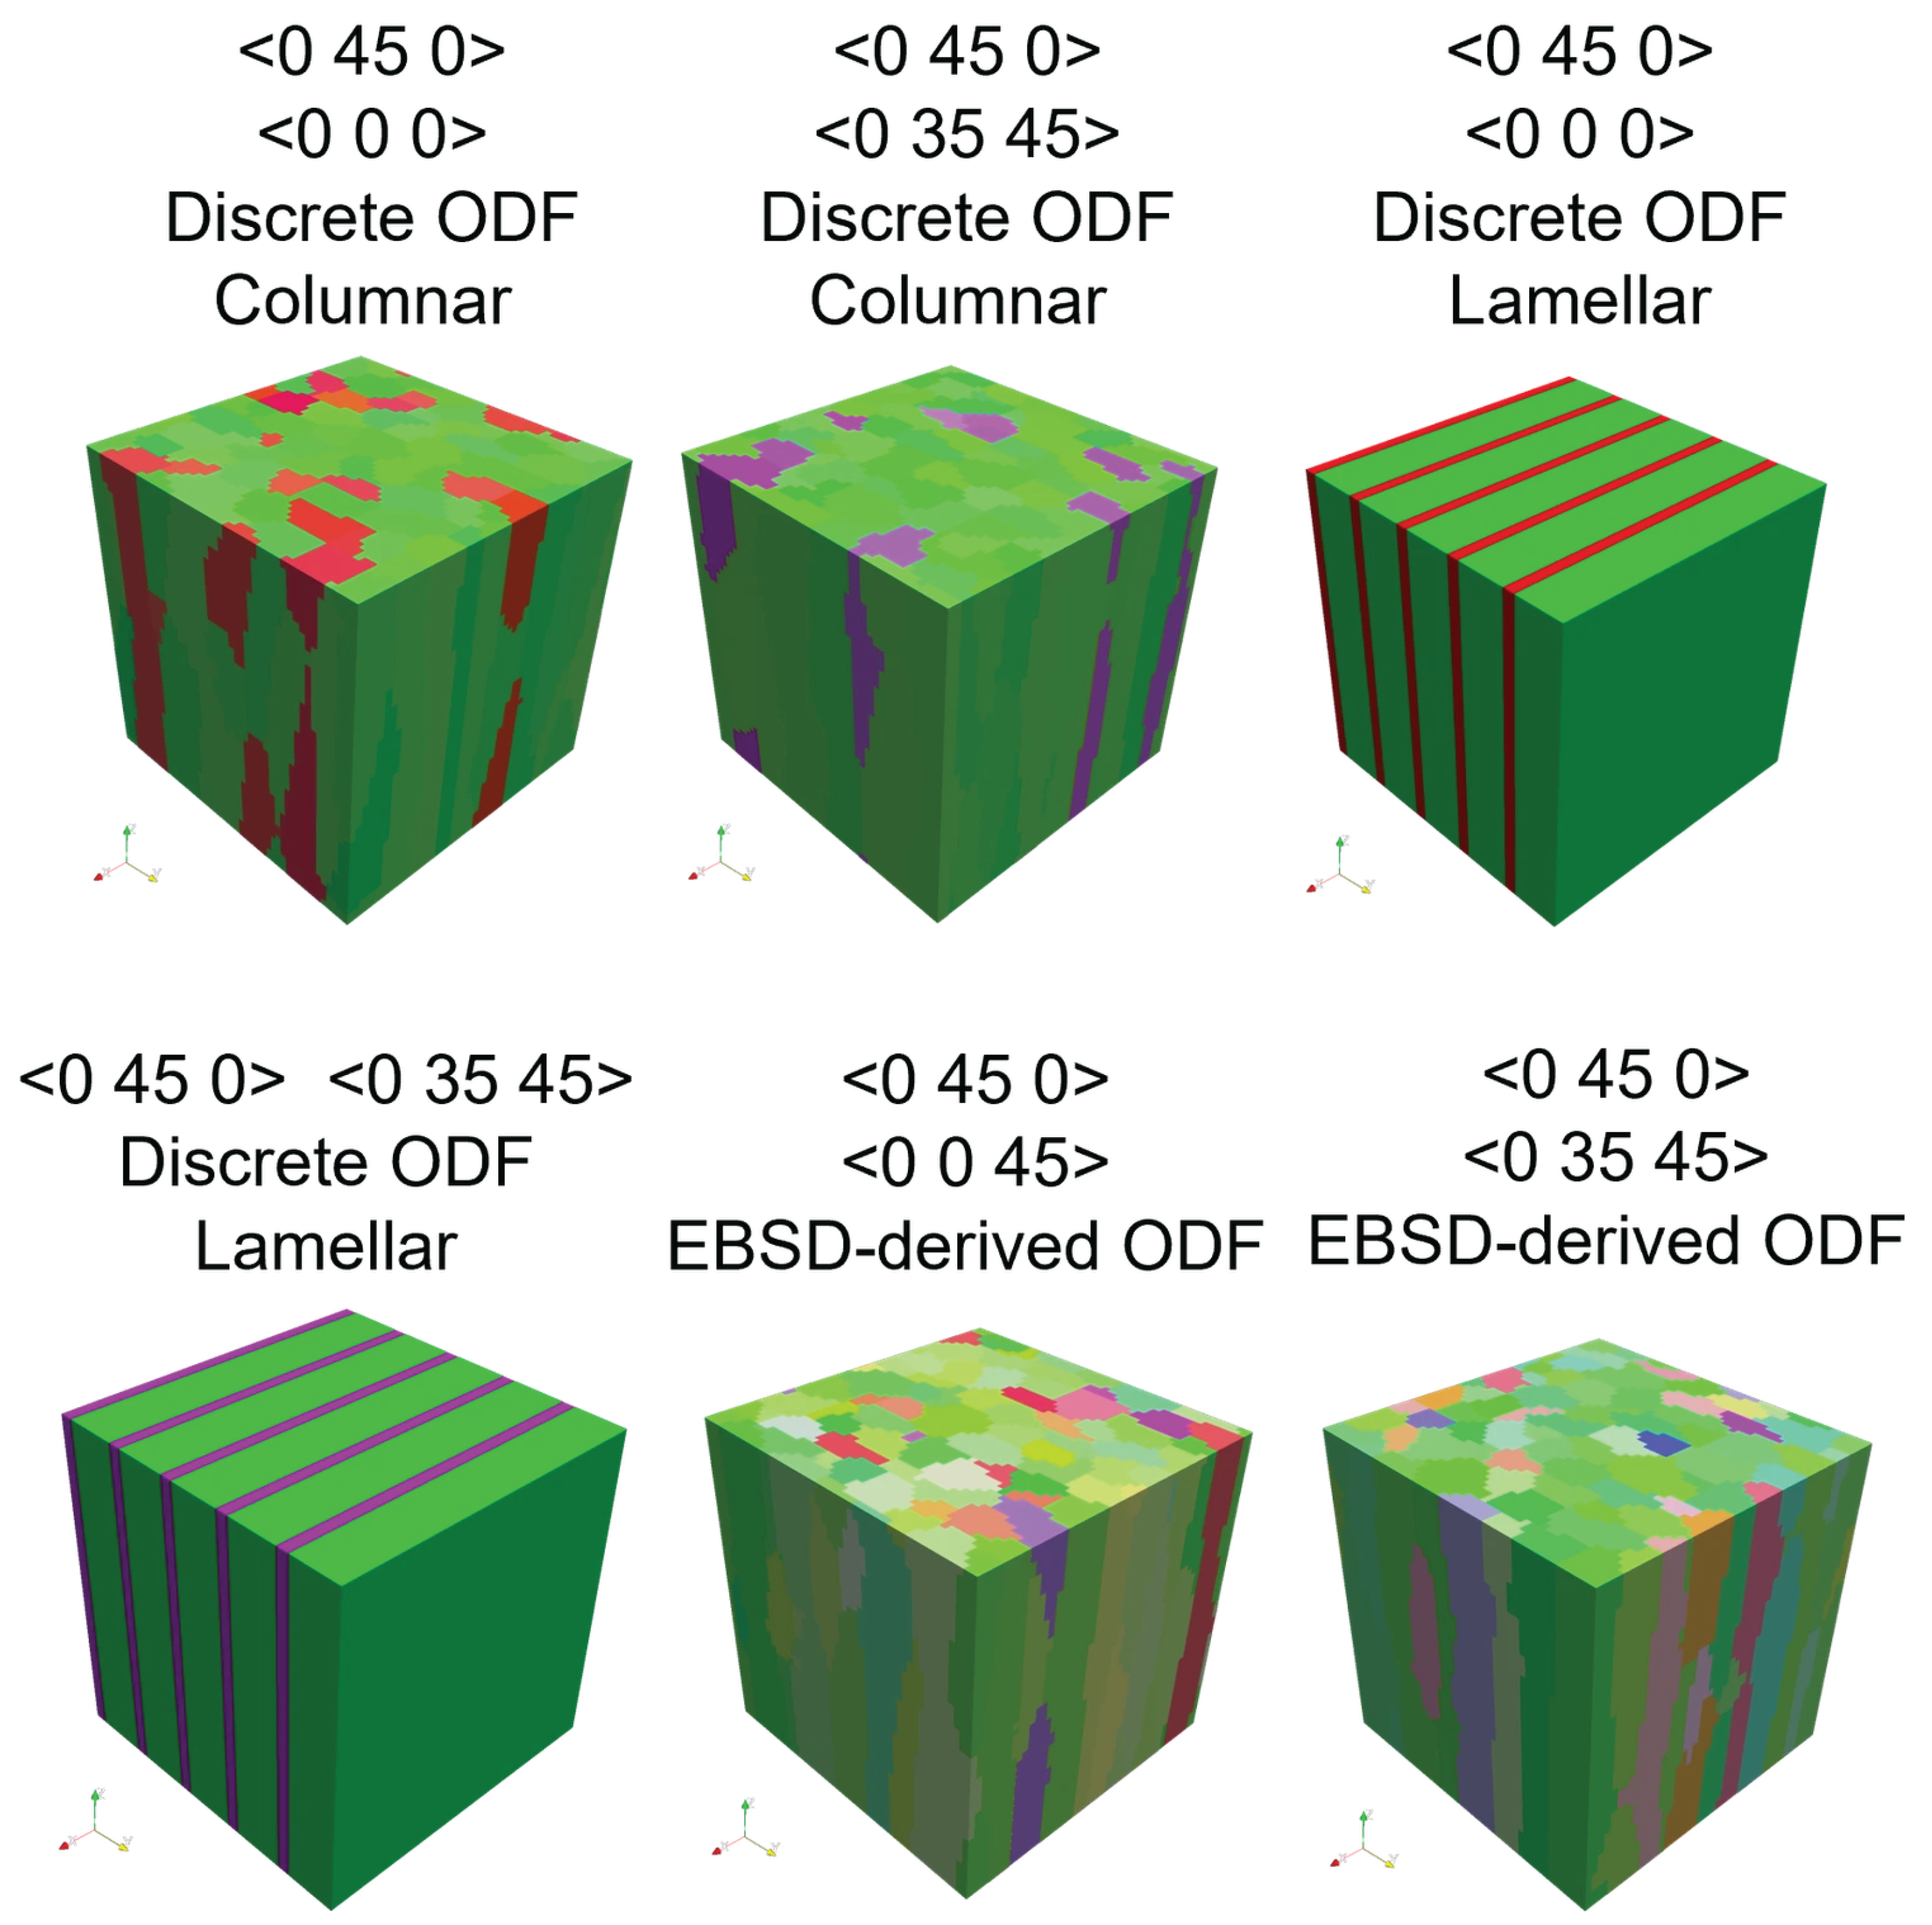
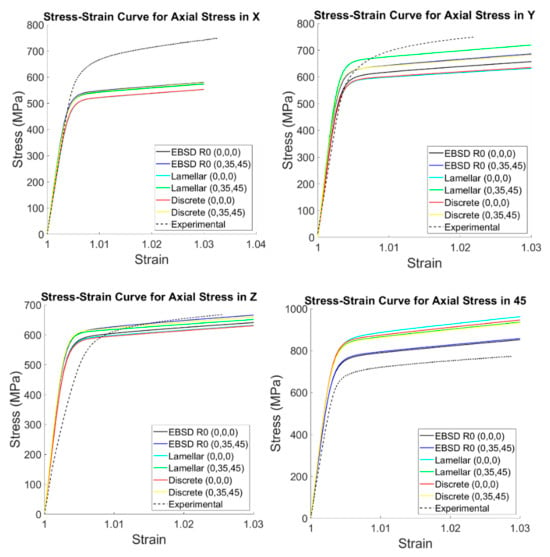
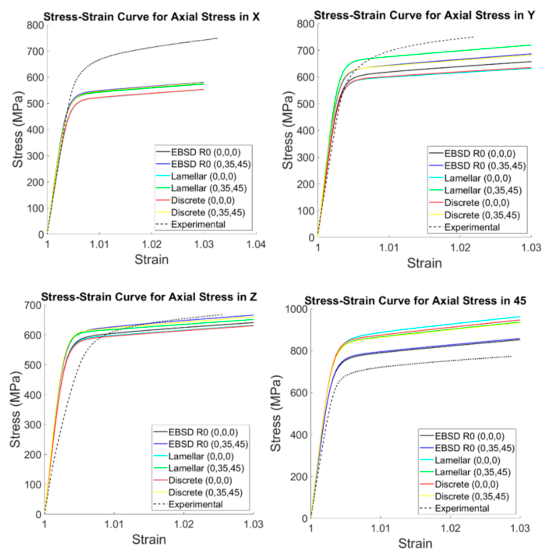
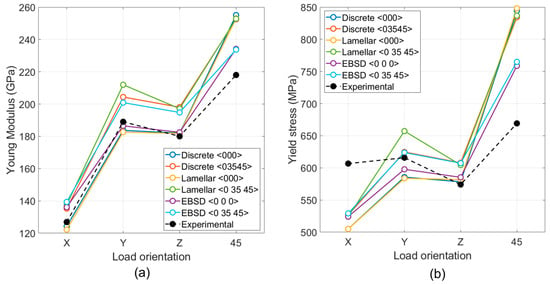
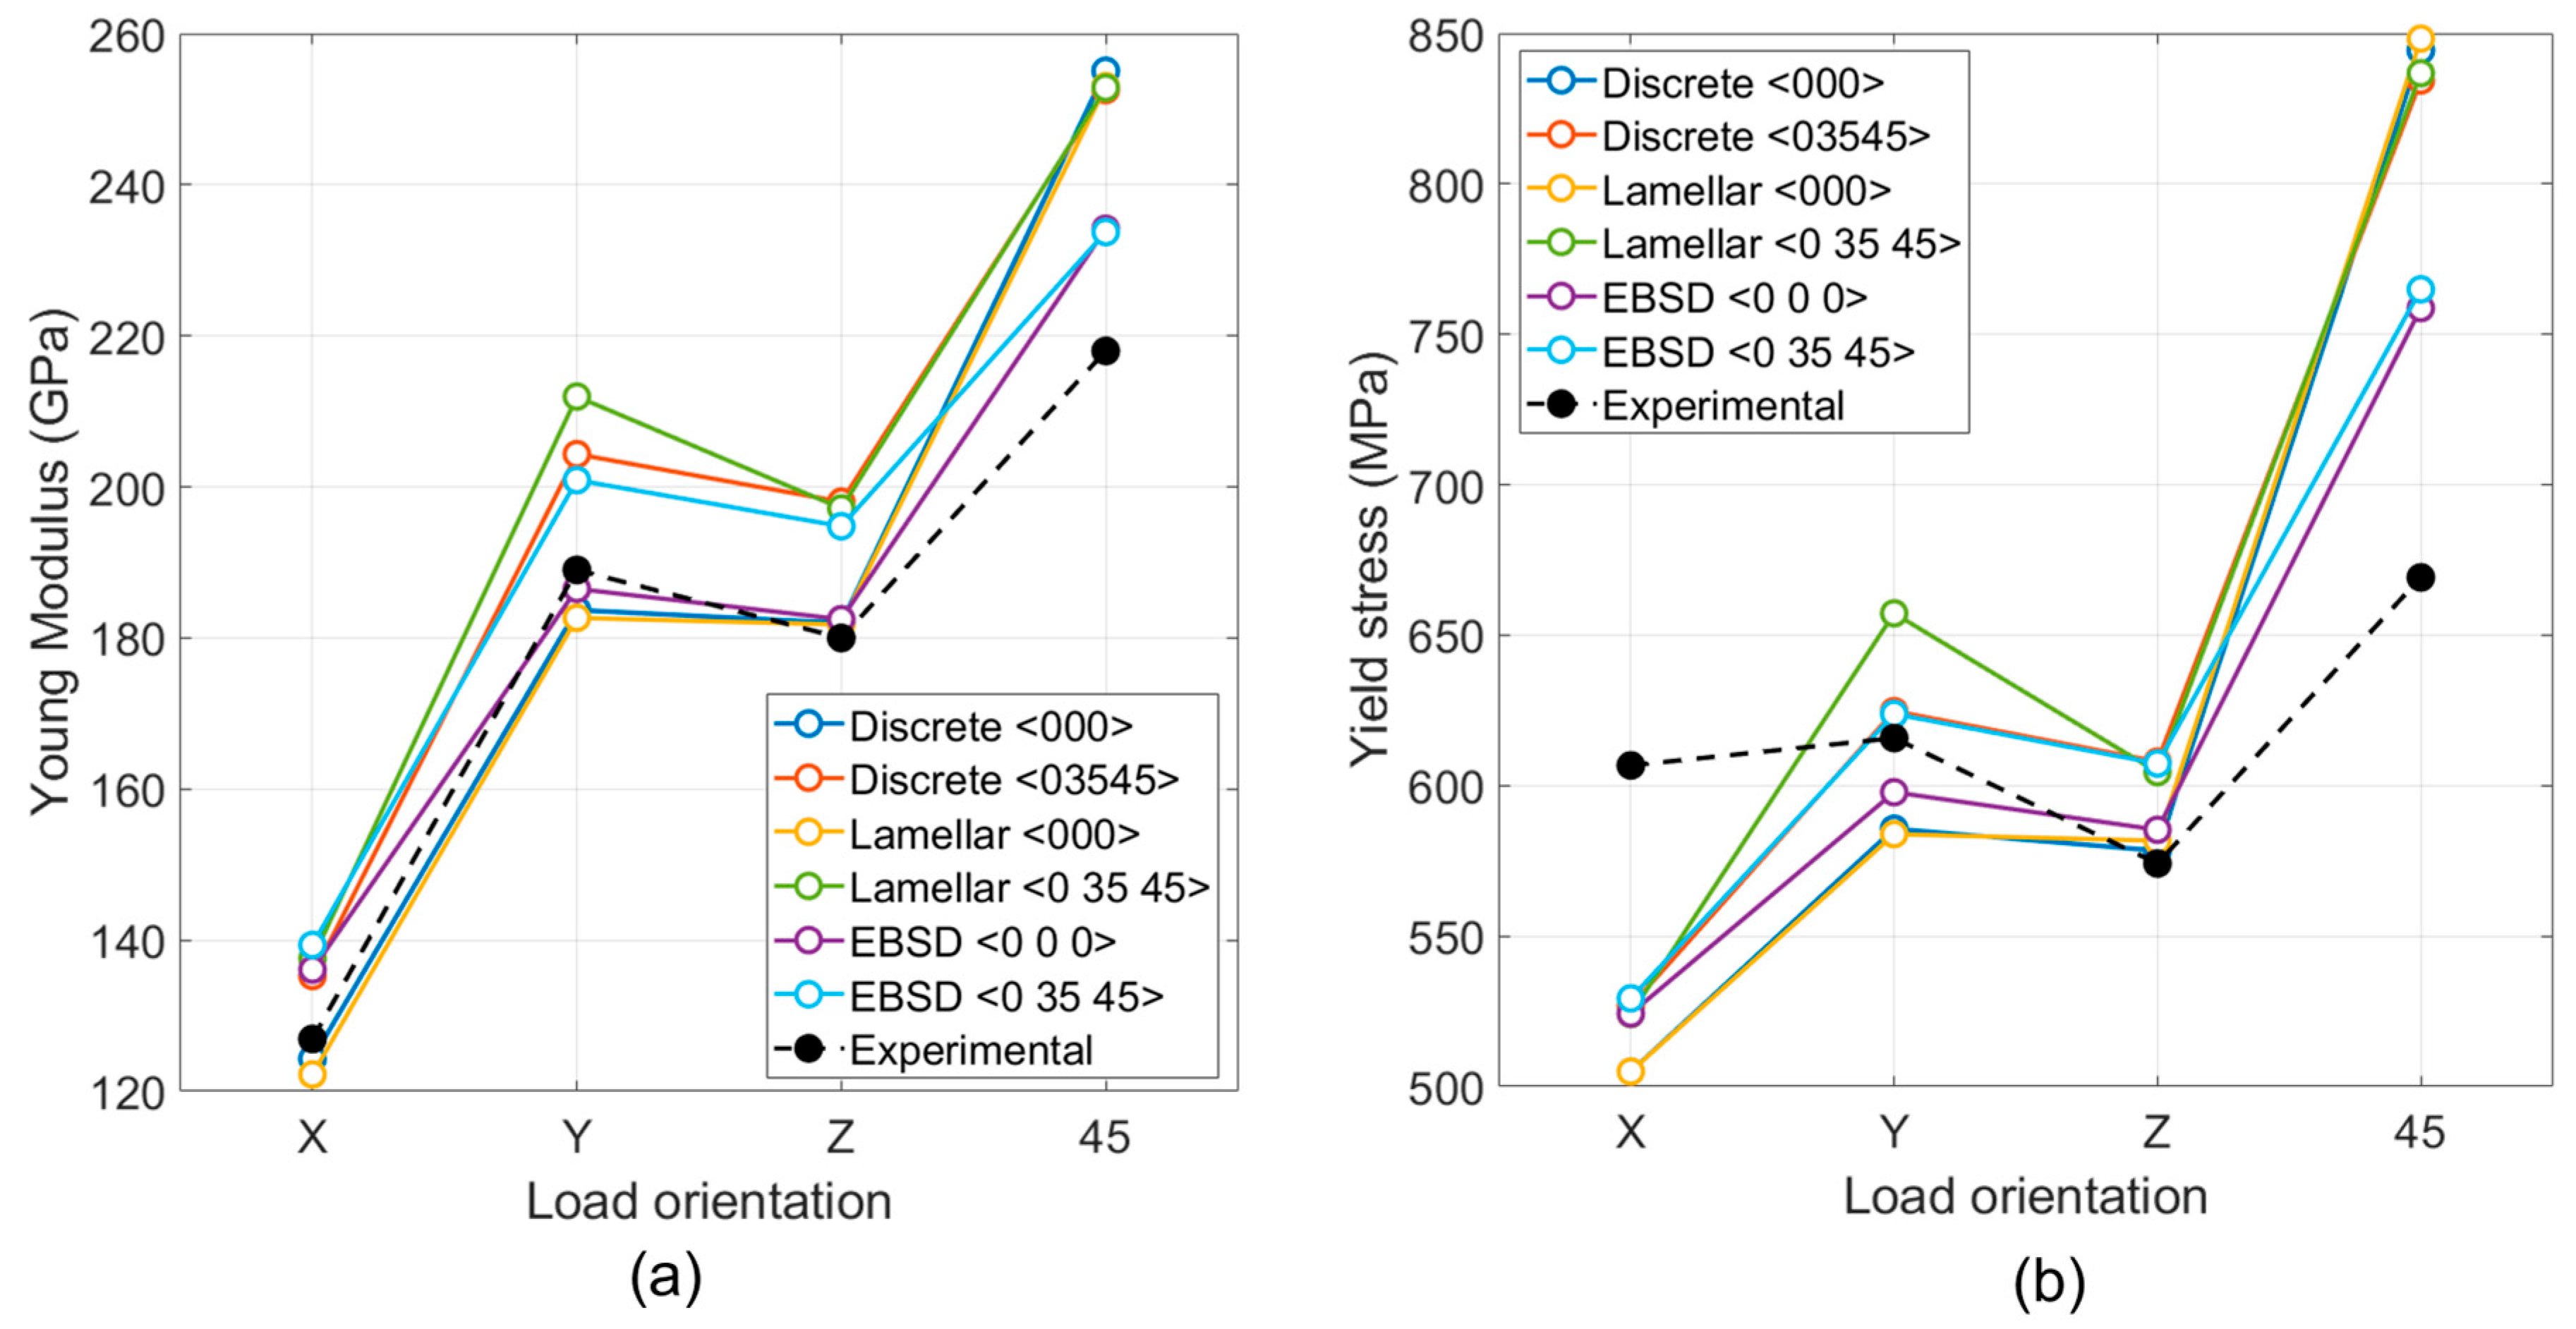
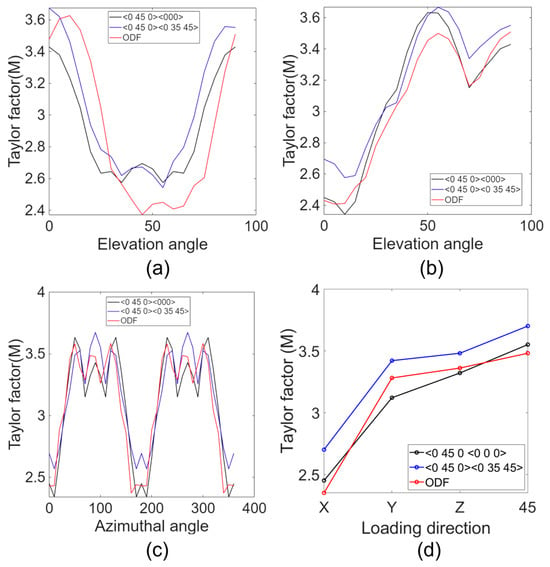
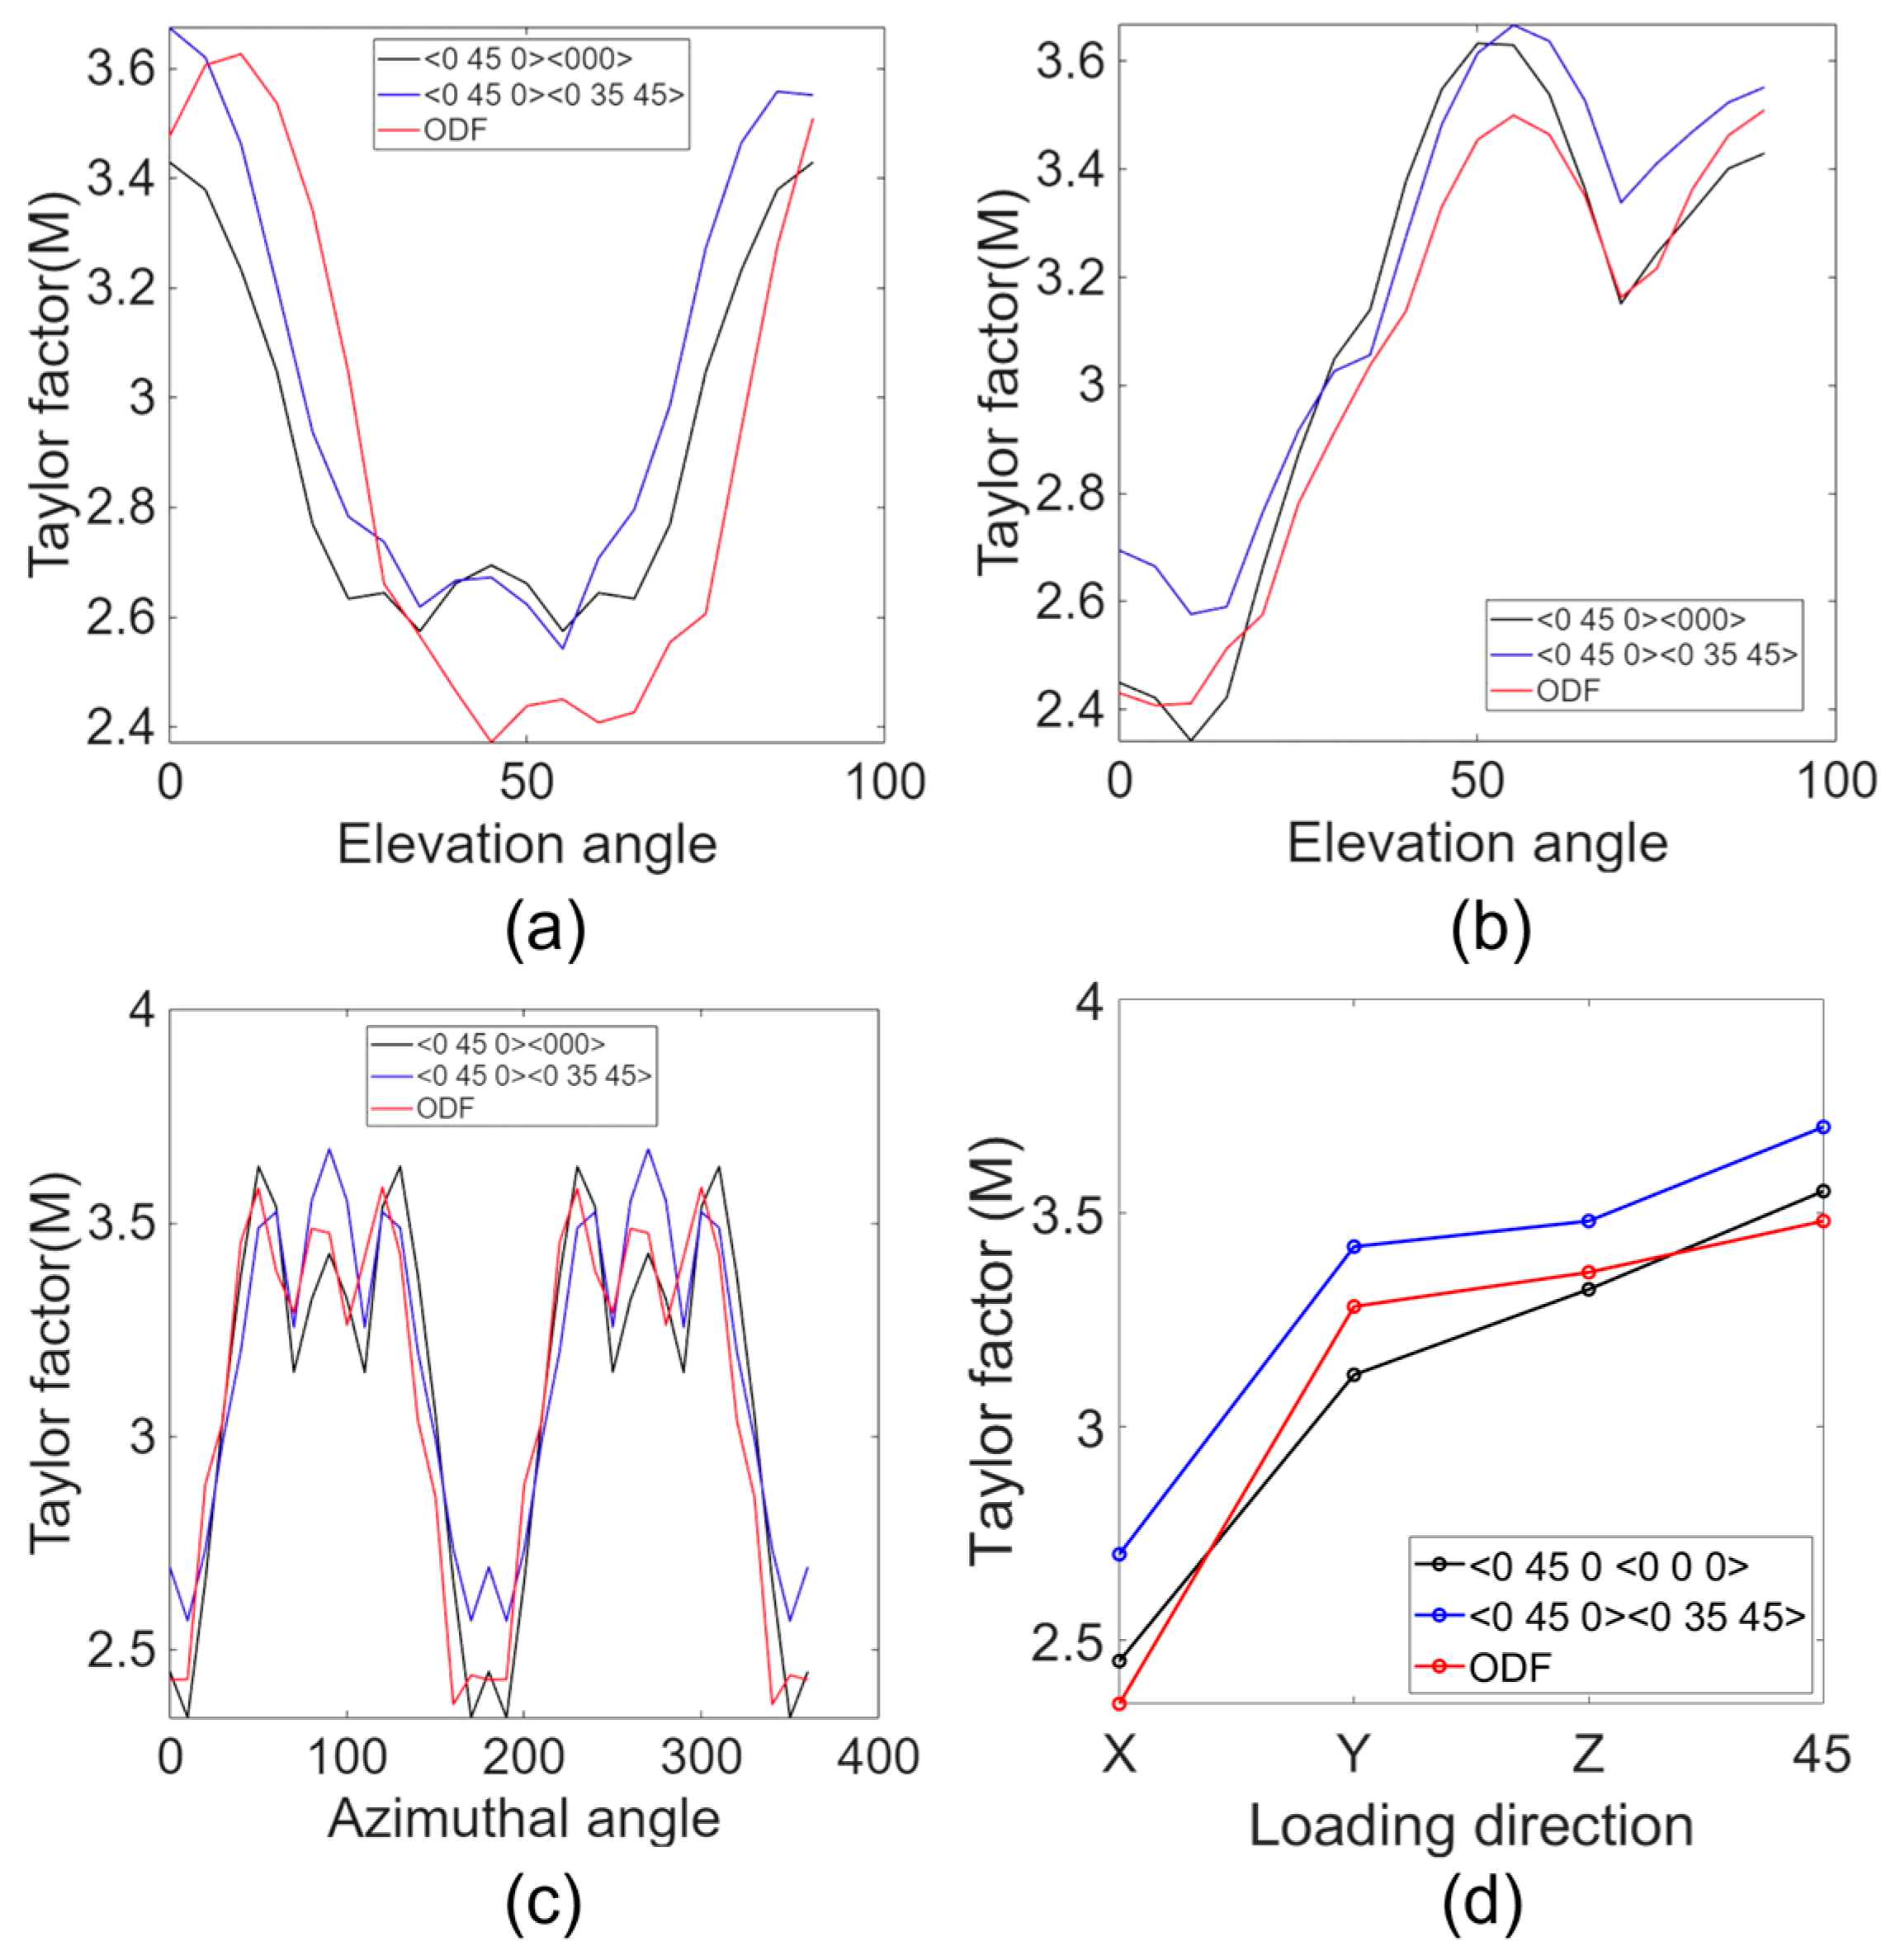
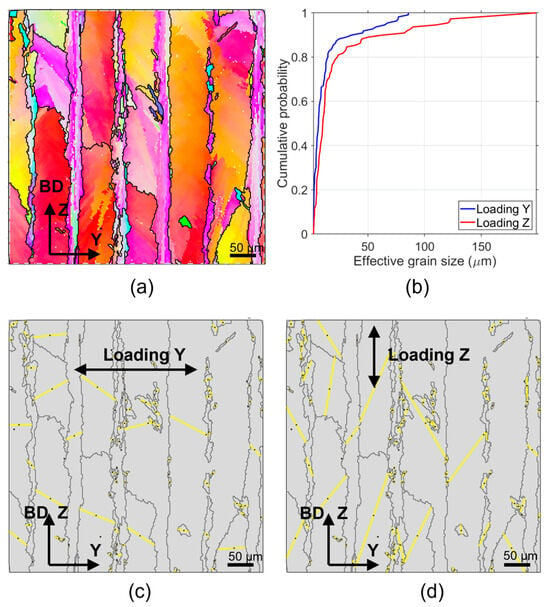
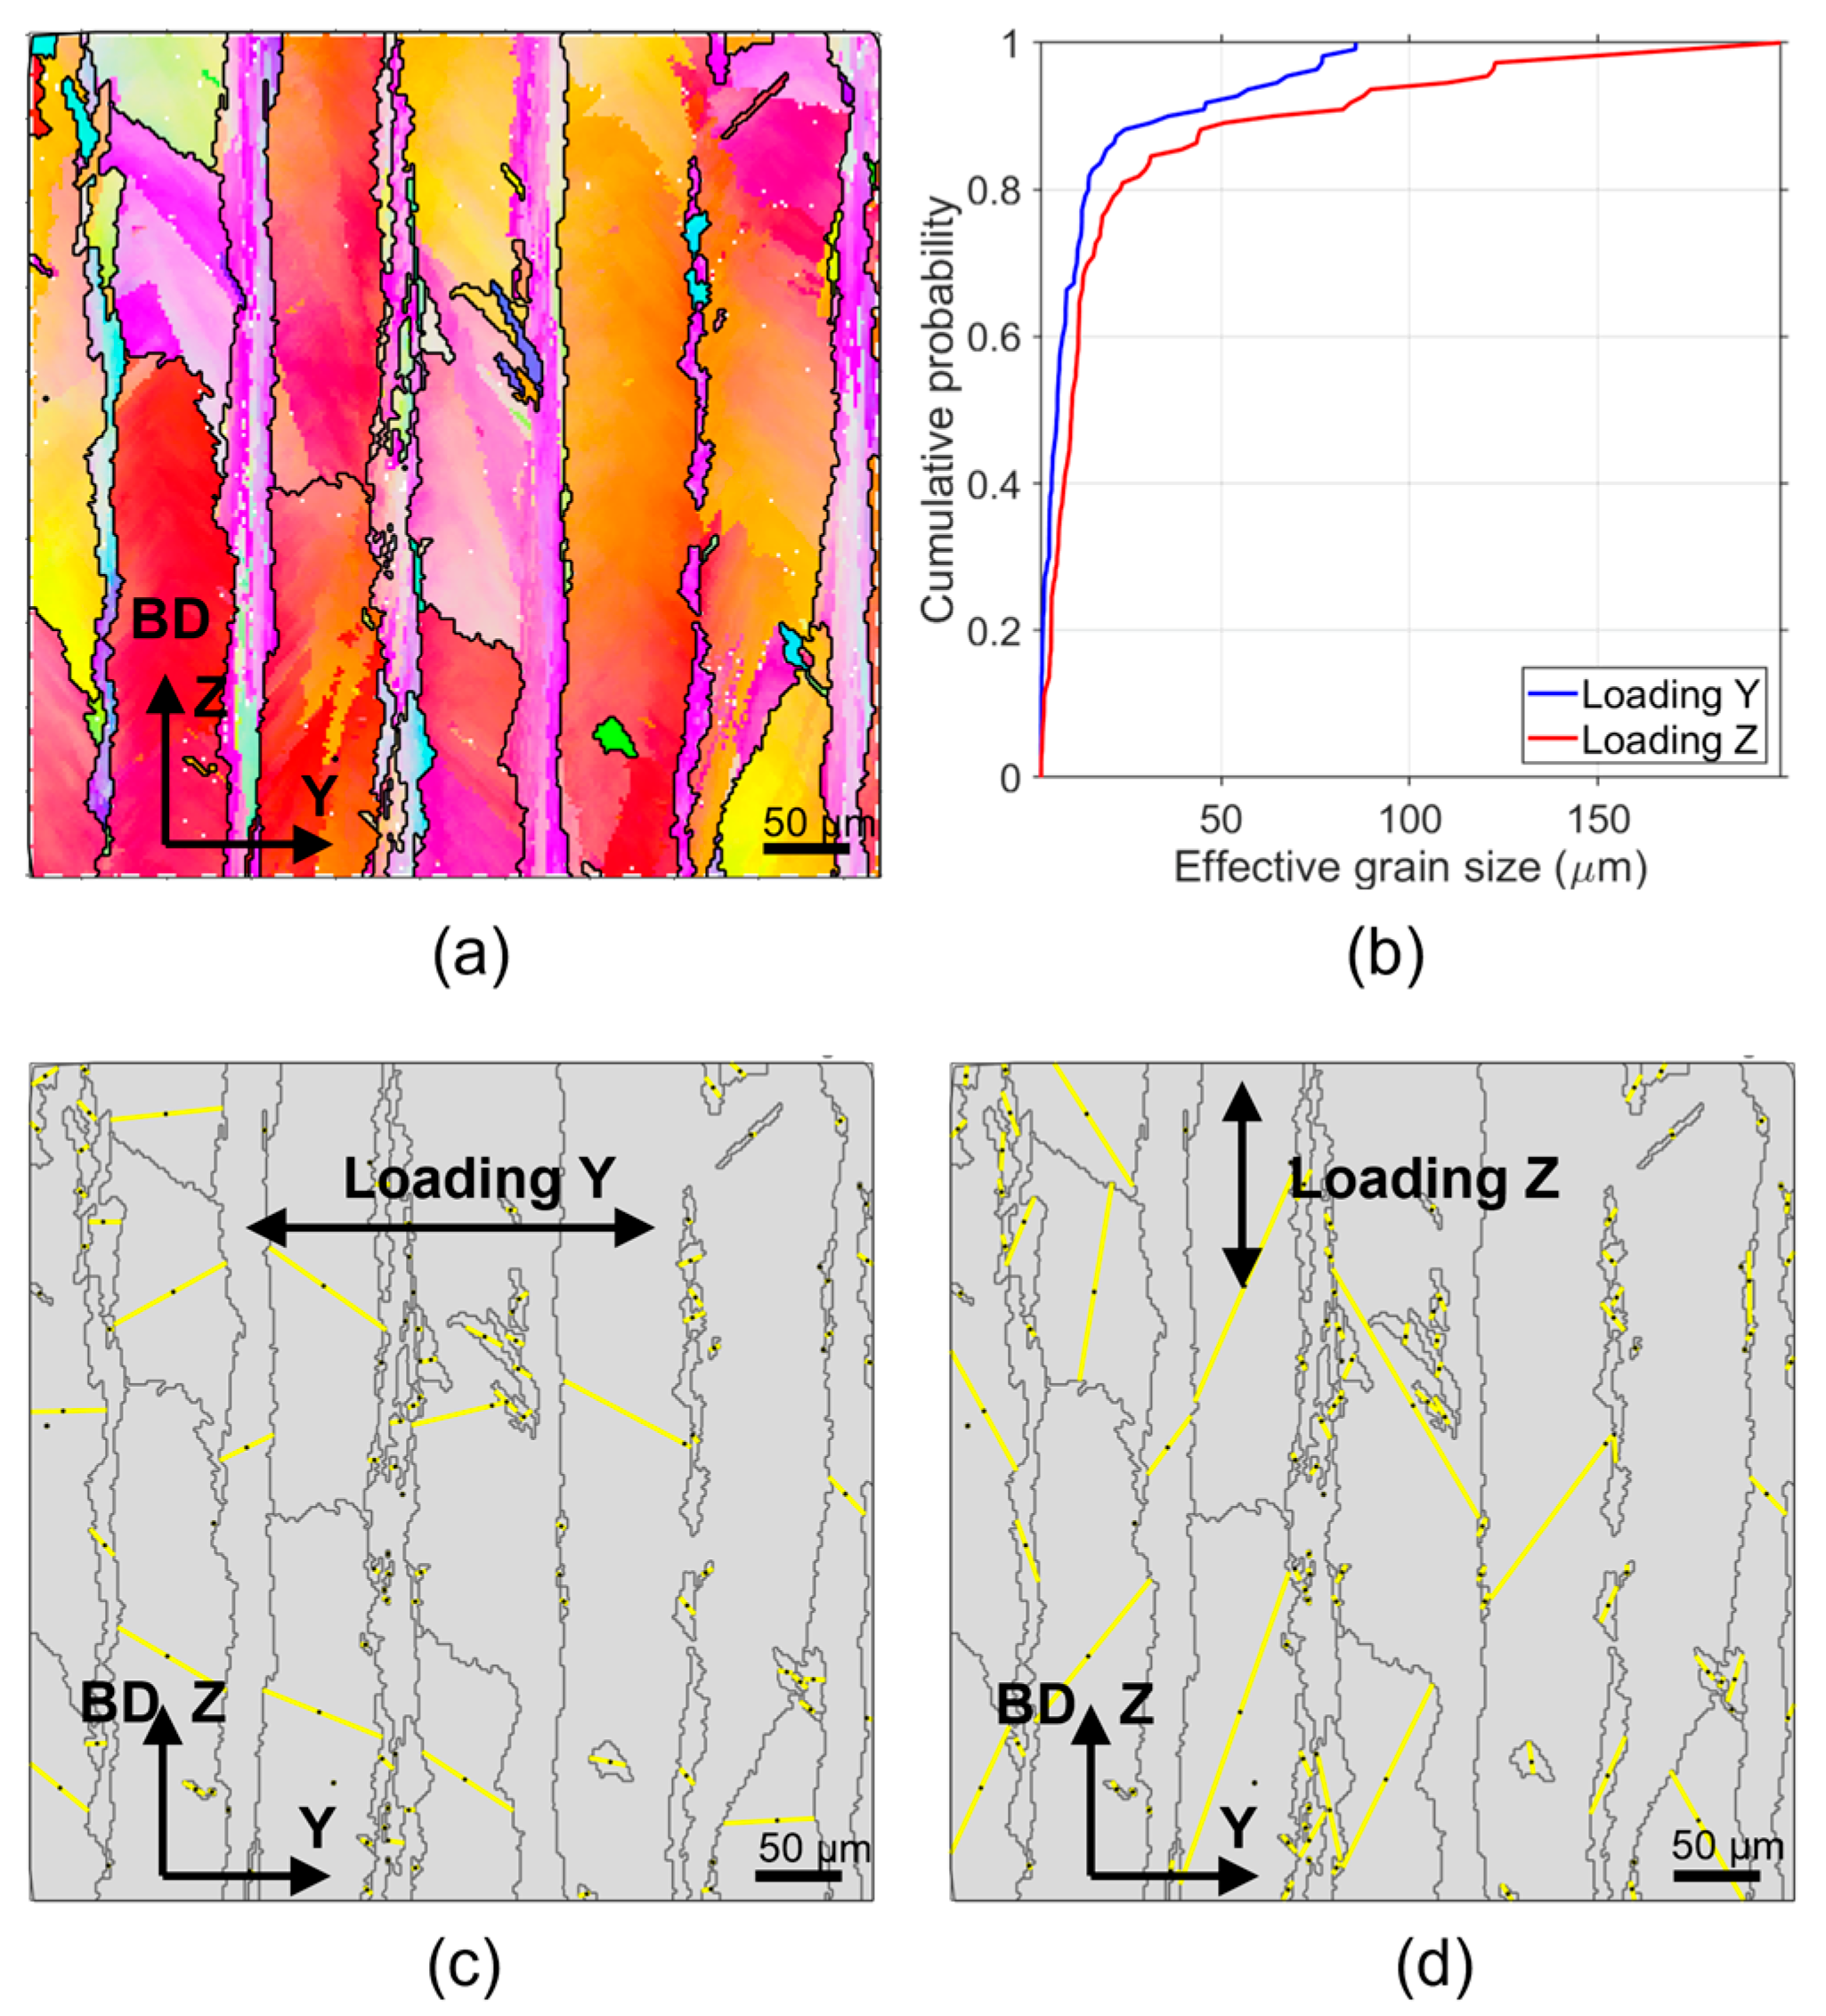
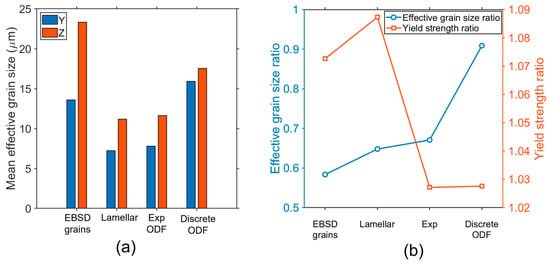
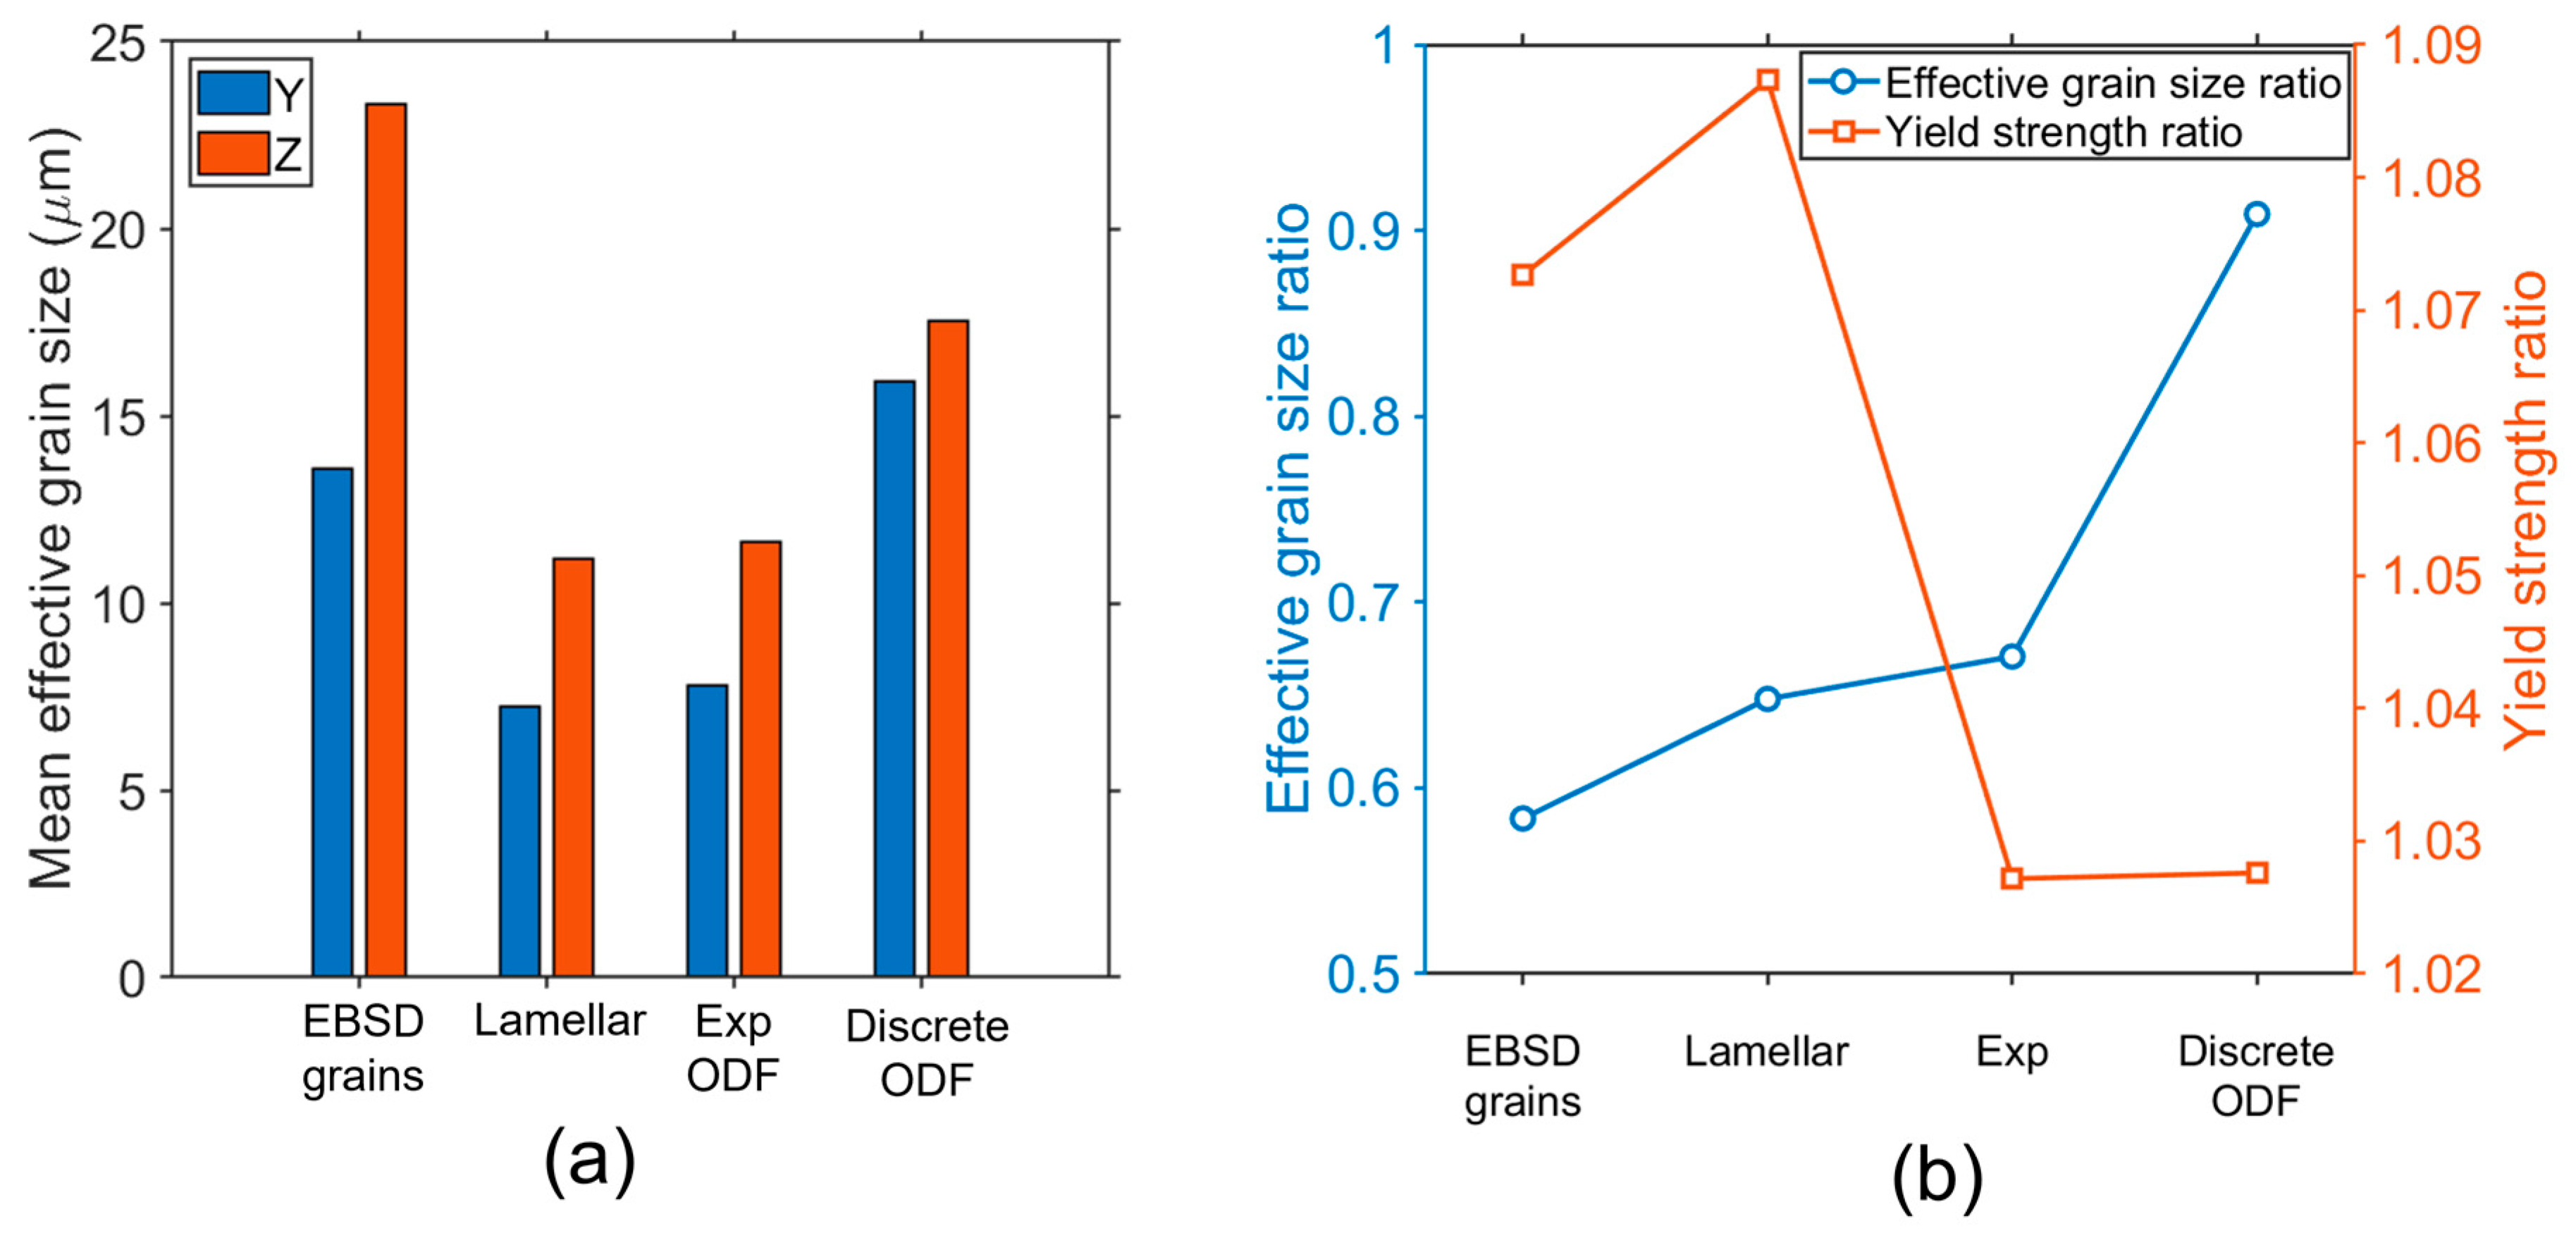
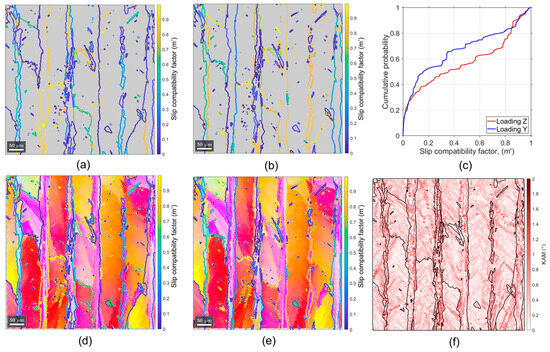
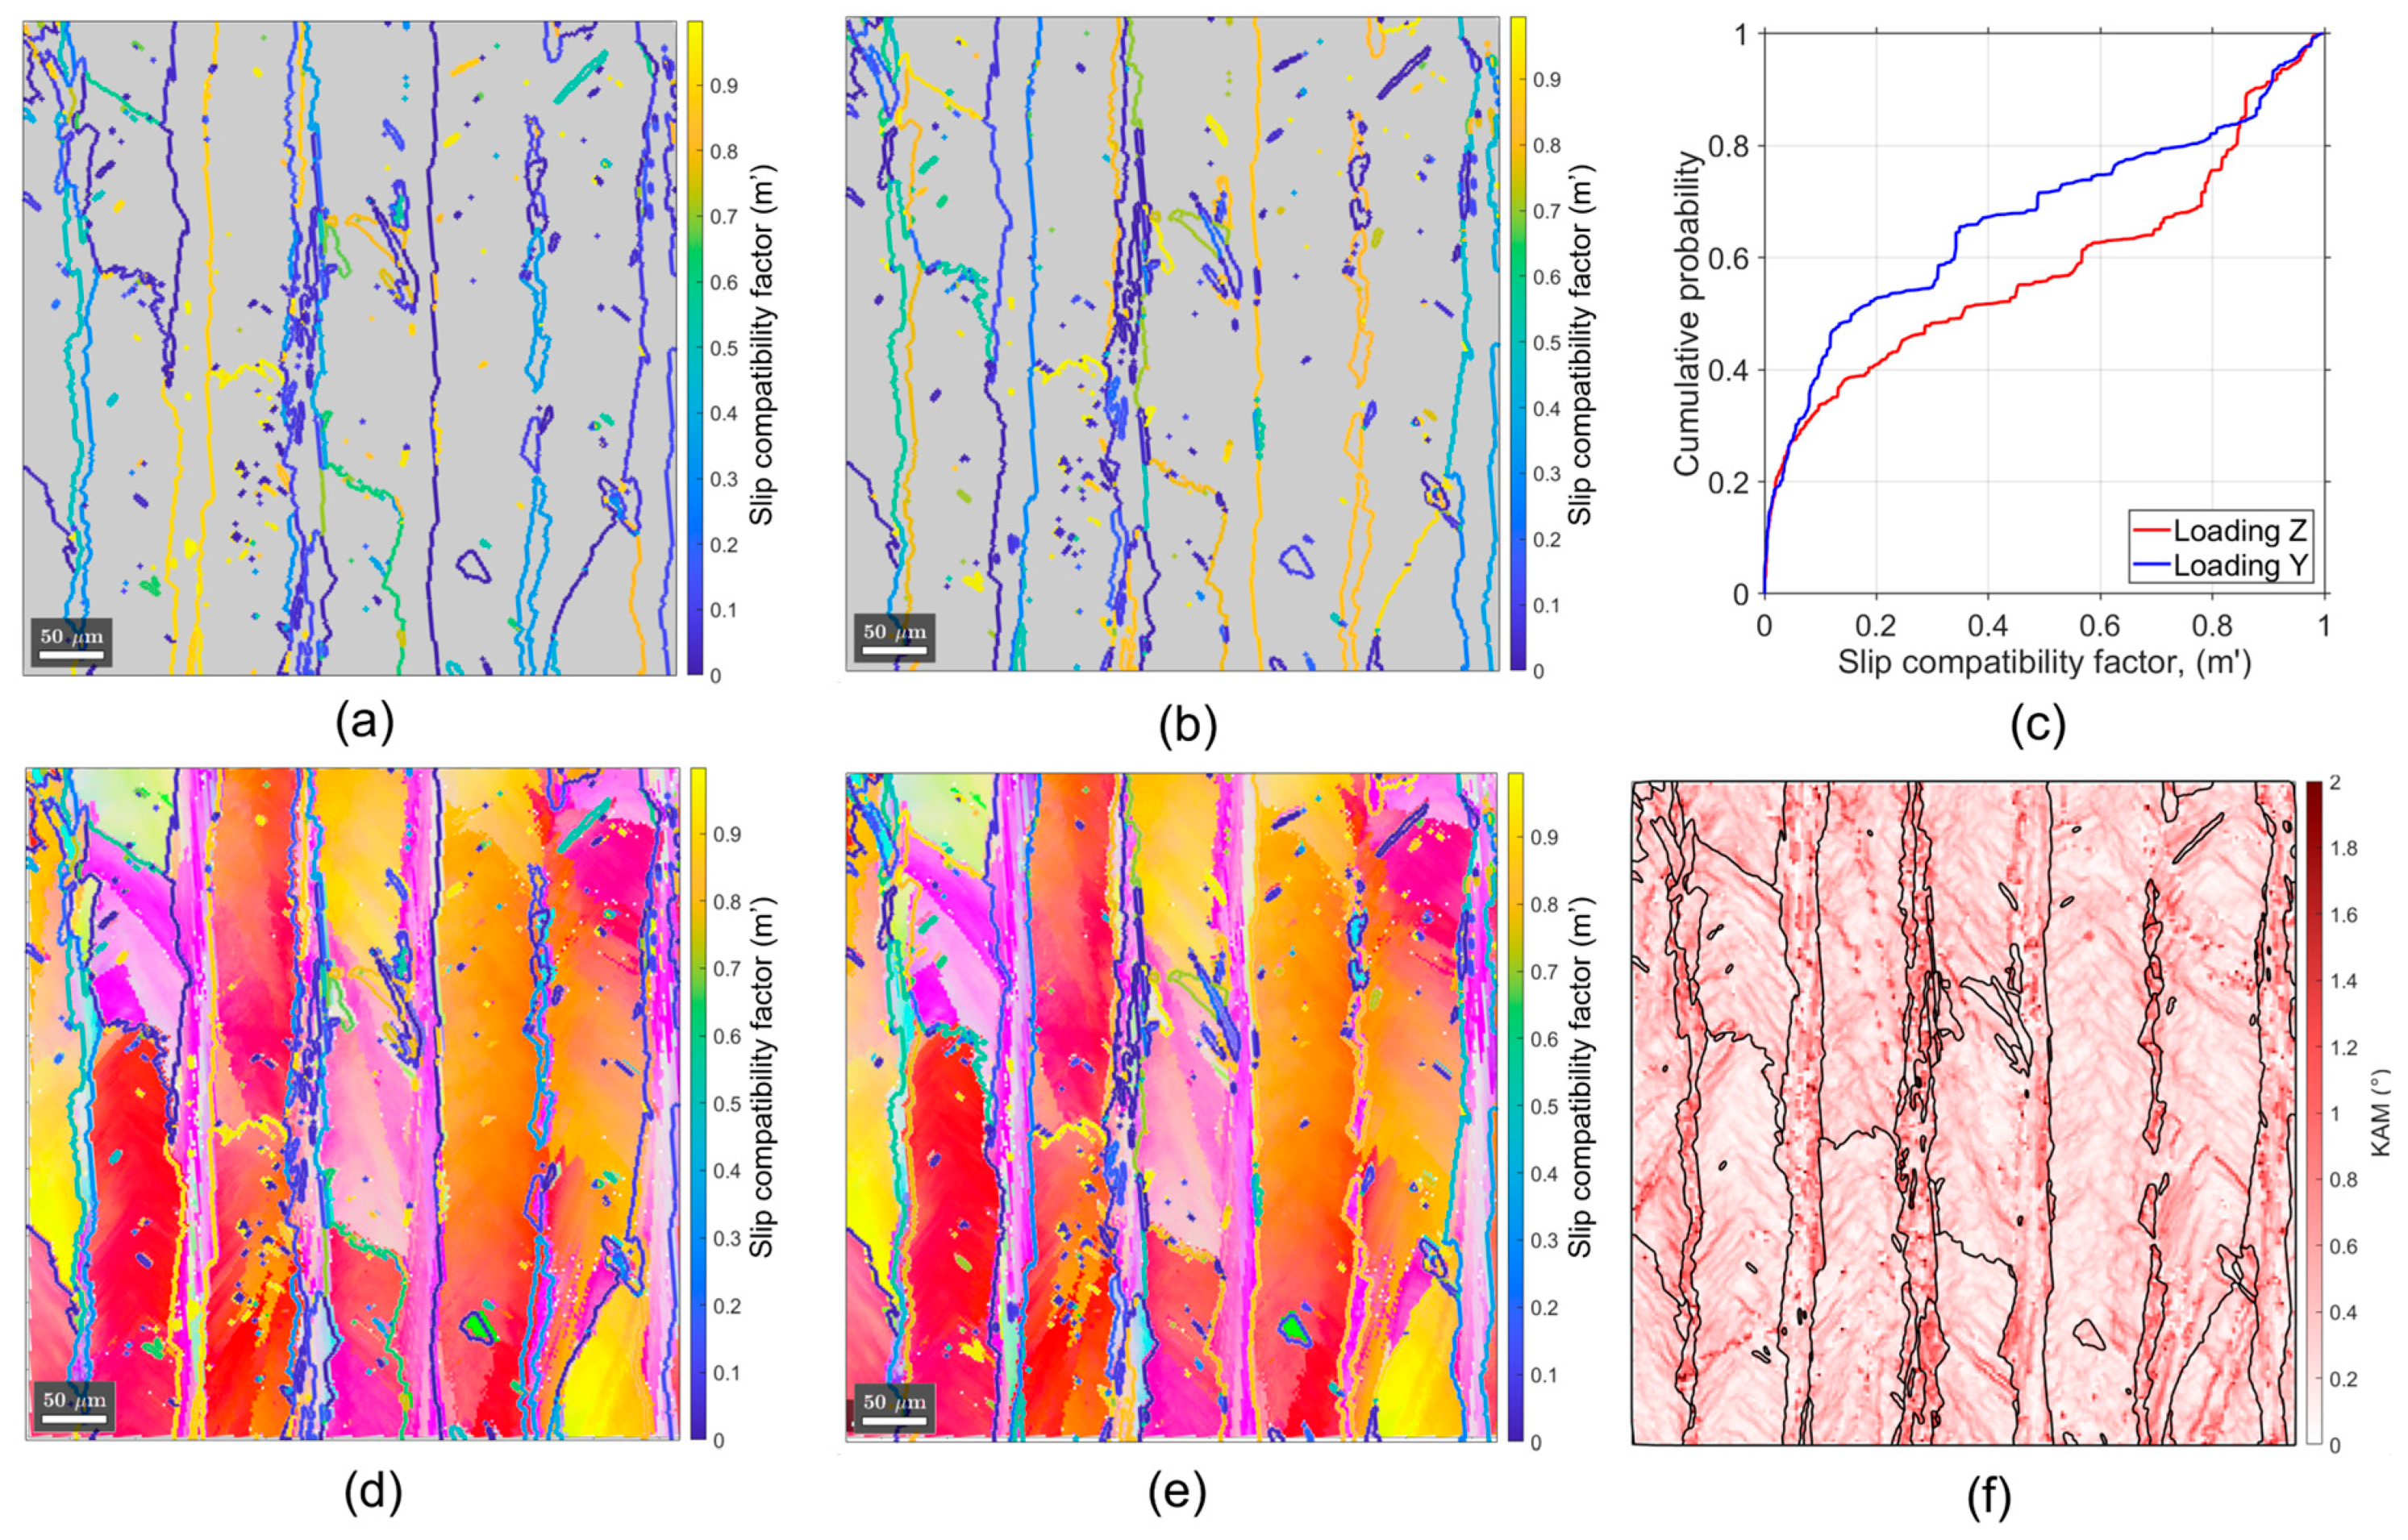
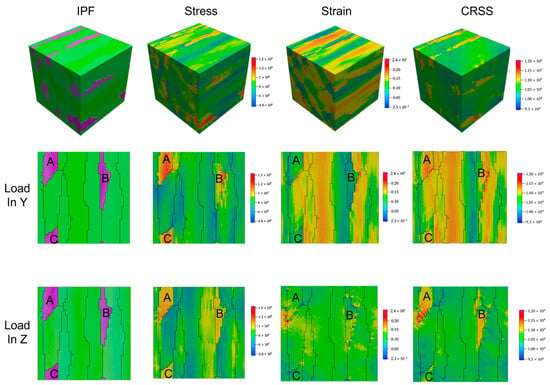
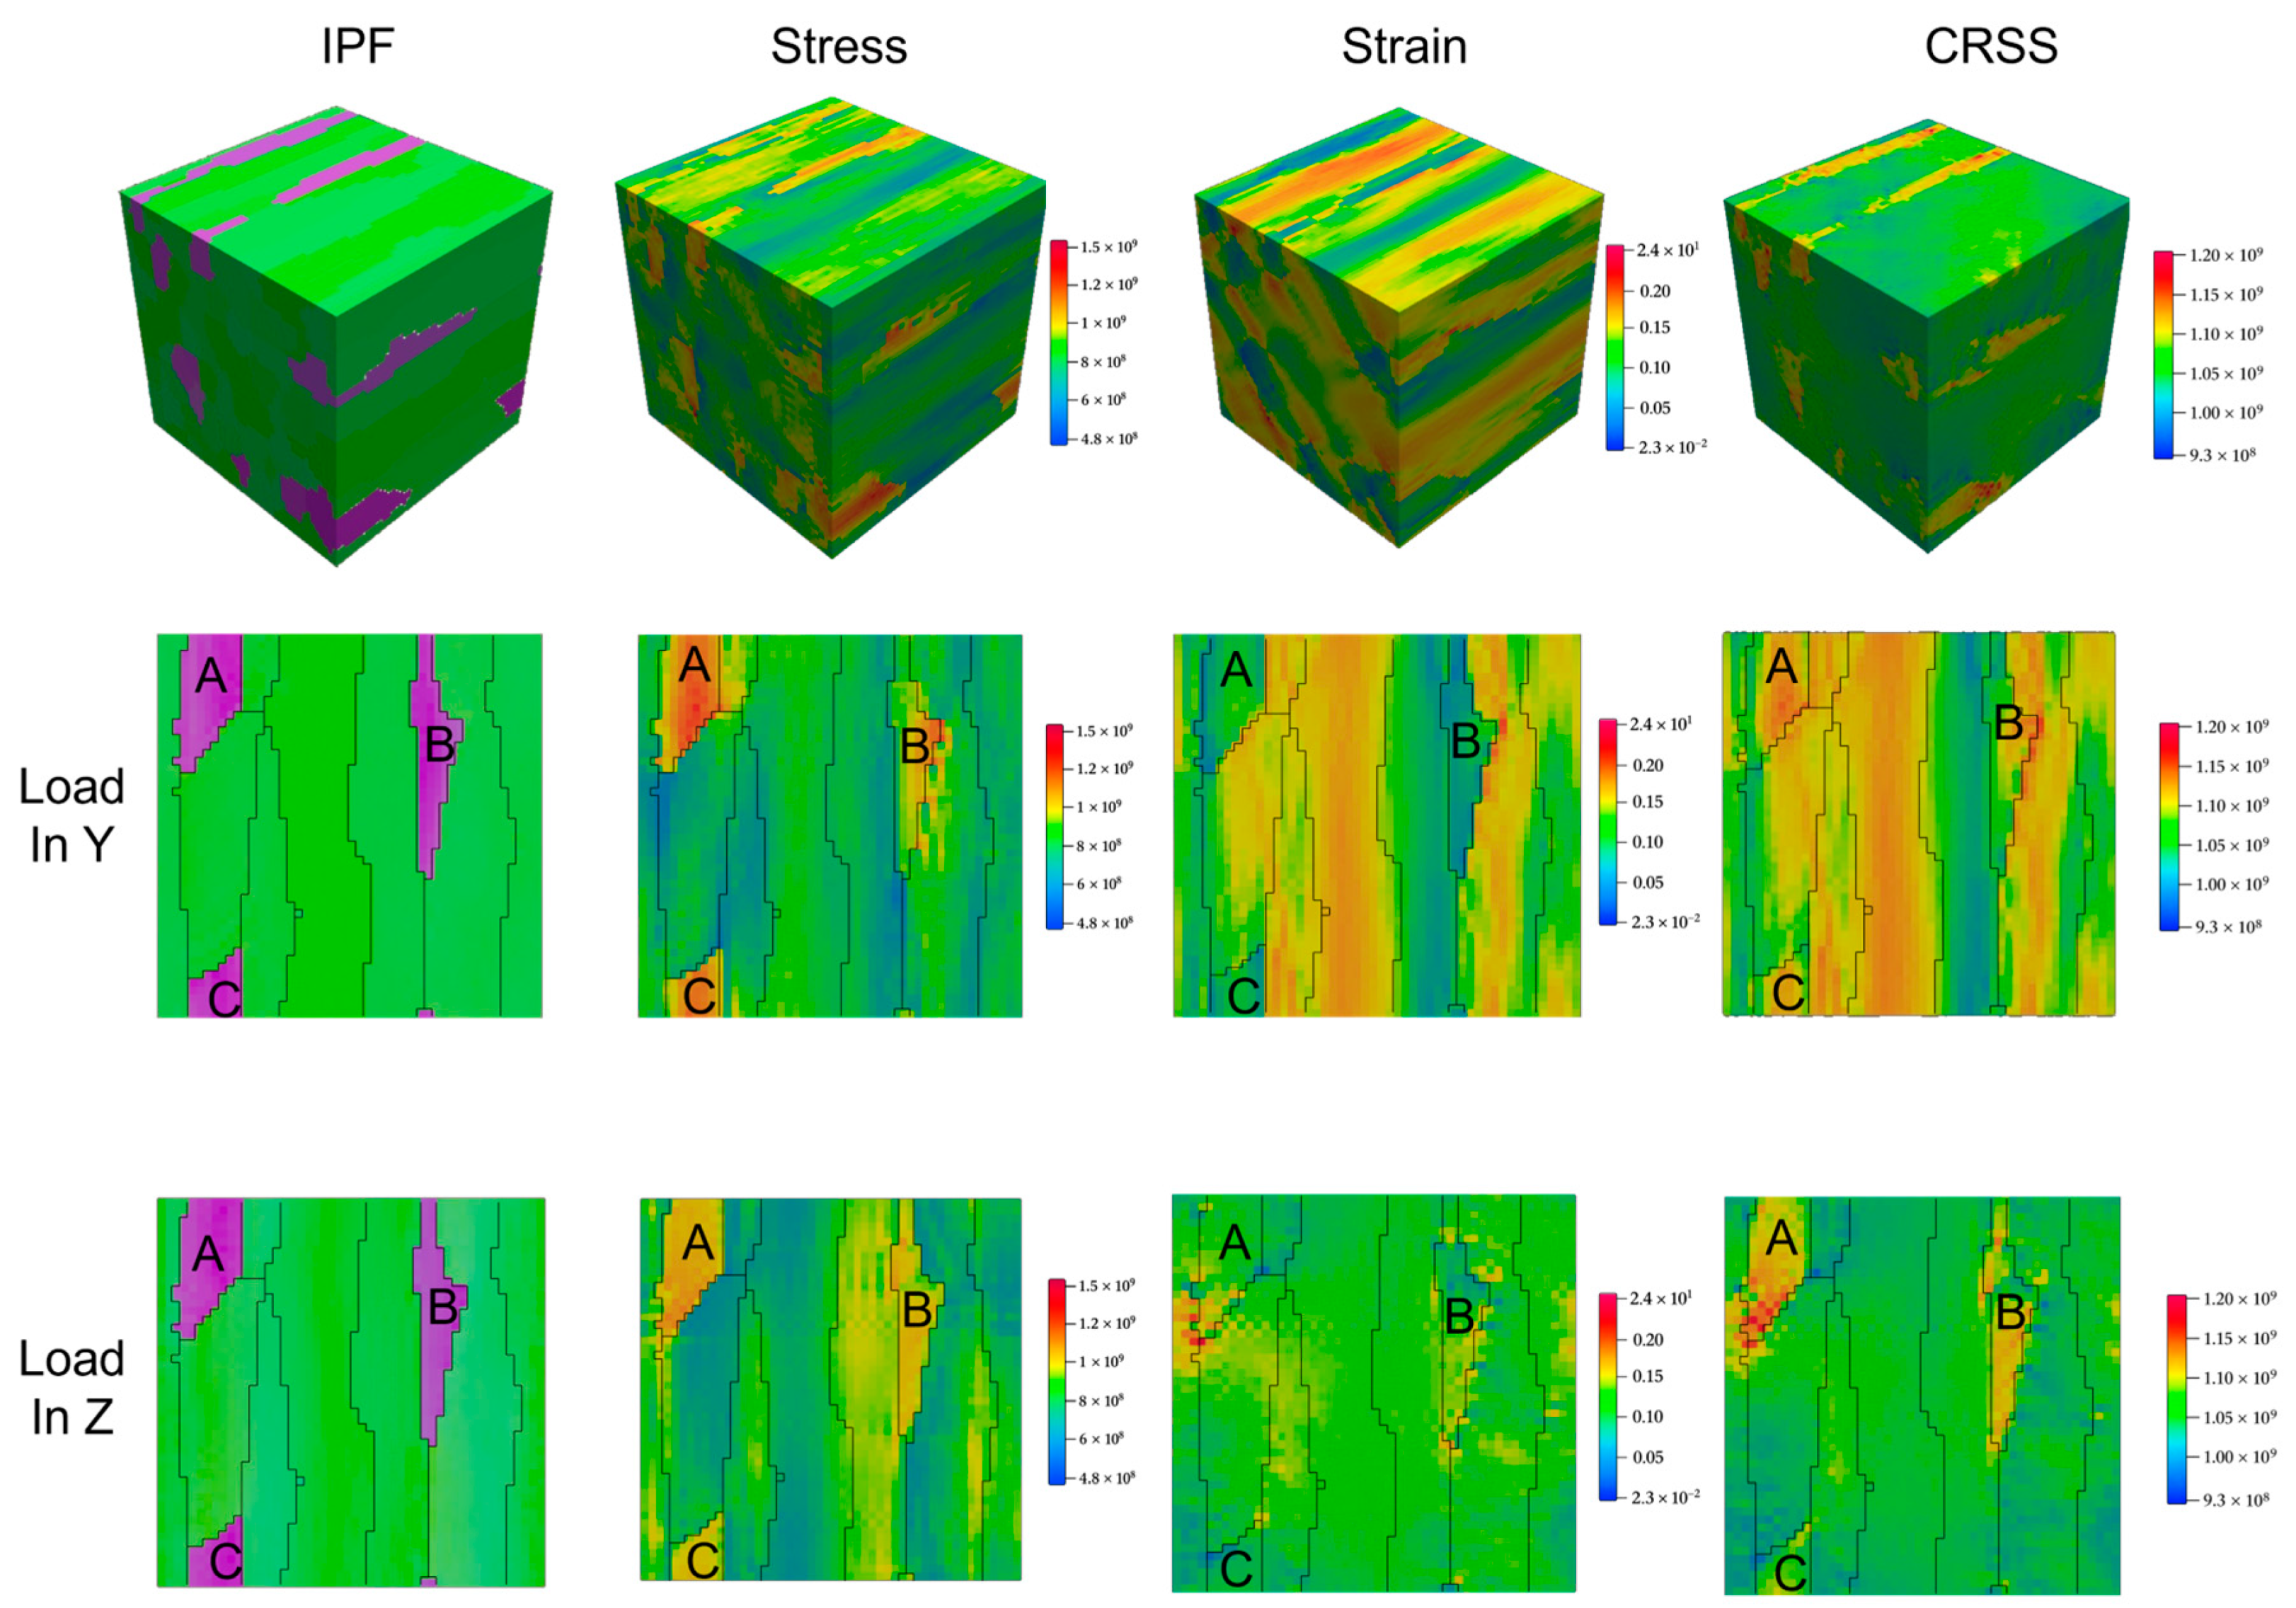

Disclaimer/Publisher’s Note: The statements, opinions and data contained in all publications are solely those of the individual author(s) and contributor(s) and not of MDPI and/or the editor(s). MDPI and/or the editor(s) disclaim responsibility for any injury to people or property resulting from any ideas, methods, instructions or products referred to in the content. |
© 2026 by the authors. Licensee MDPI, Basel, Switzerland. This article is an open access article distributed under the terms and conditions of the Creative Commons Attribution (CC BY) license.