


Abstract
Reliable process monitoring and quality evaluation for resistance spot welding (RSW) have become more important now than ever. An ultrasonic probe embedded into welding electrodes has enabled the acquisition of data about molten pool formation throughout welding, but automation of high-performance ultrasonic data analyses is still necessary to fully realize a monitoring system. This work proposes a two-stage deep learning (DL) approach for automated ultrasonic data analysis for RSW processing monitoring. The first stage conducts semantic segmentation on ultrasonic M-scan welding process signatures, yielding masks for identified molten pool and stack regions from which weld penetration measurements can be directly extracted, as well as expulsion occurrences throughout welding. From input images and segmentation outputs, the second stage directly estimates resultant weld nugget diameters using an additional neural network. Both stages leveraged architectures based on TransUNet, mixing elements of both convolutional neural networks (CNN) and vision transformers, and the effect of cross-attention for stack-up sheet thickness data fusion was investigated via an ablation study. Additionally, in the diameter estimation stage, the ablation study included alternative feature extraction architectures in the network and investigated the provision of M-scans to the model alongside segmentation masks. In both cases, cross-attention was determined to improve performance, and in the case of diameter estimation, providing M-scans as input was found to be beneficial in general. With cross-attention, the segmentation approach yielded a mean intersection over union (IoU) of 0.942 on molten pool, stack, and expulsion regions in the M-scans with 13.4 ms inference time. With cross-attention, diameter estimates yielded a mean absolute error of 0.432 mm with 4.3 ms inference time, representing a significant improvement over algorithmic approaches based on ultrasonic time of flight. Additionally, the approach attained >90% probability of detection (POD) at 0.830 mm below the acceptable diameter threshold and <10% probability of false alarm (PFA) at 0.828 mm above the threshold. These results demonstrate a novel production-ready application of DL in ultrasonic nondestructive evaluation (NDE) and pave the way for zero-defect RSW manufacturing.
1. Introduction
1.1. Resistance Spot Welding
RSW is a widely used industrial pressure welding process that joins metal sheets using heat generated at the contact surfaces between them [1]. It is highly advantageous due to its relatively low cost, low added weight, simplicity, flexibility, and throughput. However, RSW engineering is becoming increasingly challenging due to the use of advanced novel materials, dissimilar material combinations, and unconventional stack-ups [2,3,4].
RSW parts are still generally evaluated using destructive (e.g., peel test, cross-section) and nondestructive statistical methods. These statistical approaches are offline, slow, expensive, wasteful, and low–coverage. Statistical NDE in RSW most commonly involves portable ultrasonic inspection units with high-resolution 2D matrix probes that produce a detailed analysis of select welds. Besides being costly and inefficient, perfect traceability cannot be achieved with this approach, and corrective feedback loops afforded only by statistical post-process evaluations can be quite slow. Consequently, RSW process monitoring remains a highly desirable feature, yet it remains a critical challenge. Production application of such a technology would enable the inspection of every weld, advancing RSW to zero-defect manufacturing.
1.2. NDE for RSW
In the mid-1980s, RSW destructive tests started to be replaced by non-destructive methods, e.g., infrared thermography [5] or ultrasonic testing [6,7,8,9,10]. Ultrasonic assessment of welds using handheld portable devices became the standard for automotive manufacturing starting in the late 1990s. A method and system for inline RSW process monitoring [11,12] was subsequently developed, and this is the technology of focus in this study. In this approach, an embedded single-element ultrasonic sensor is installed into the welding tool, allowing the visualization of each interface in the welded stack within the scanning zone (e.g., stack outer interfaces, sheet interfaces, and liquid–solid base metal interfaces), as well as the monitoring and measurement of RSW process characteristics in real time. This approach not only enhances the reliability of the welding process but also minimizes downtime and reduces costs associated with post-production inspection and rework. Using single-element ultrasonics, a drawback of the approach is that it cannot directly measure diametrical molten pool growth dynamics.
1.3. DL in NDE
One of the most challenging aspects of an inline RSW process monitoring system is that it must be fully automated. The system must therefore be able to automatically and reliably derive important insights about the welding process and resultant welds from monitoring data. Insights that provide new value, e.g., by enabling trend analyses, predictive maintenance, identification and resolution of process non-conformances, and process optimization, are what shift NDE from a burden to a benefit.
With many NDE techniques and technologies, classical signal/image processing techniques fail to produce the desired performance in light of process instability and do not generalize to the wide variety of materials and geometries that are used today in real production. Thus, to achieve automatic and reliable extraction of insights about processes and products from NDE data, DL artificial intelligence (AI) has been increasingly investigated and deployed in inspection systems.
One of the widest applications of DL in NDE is for the identification and characterization of manufacturing defects from NDE data. Nowadays, defect characterization often uses machine learning (ML) or DL with classification, object detection, or segmentation approaches. For example, these approaches have been successfully applied to defect detection applications using depth scans [13], optical imaging [14,15], radiography [16,17,18,19,20], ultrasonic scanning [21,22,23,24,25], and multimodal inspections [26,27] for a wide variety of inspection subjects, including printed circuit boards, laser seam welds, additively manufactured products, concrete structures, and composite structures.
With respect to RSW, a main concern is insufficient nugget dimensionality (e.g., penetration into the outermost sheets, diameter, etc.). Thus, an automated means of extracting molten pool or nugget measurements from welds during or immediately after their formation would be highly beneficial. To that end, the use of DL was previously demonstrated for characterizing the RSW process and to measure the molten pool from ultrasonic M-scans, using an object detection approach [28,29]. Different stages of the welding process, molten pool maximum penetration measurements, and expulsion events (also known as “spatter”, the ejection of molten material from the workpiece due to immense heat and pressure buildup) could be inferred from bounding box outputs. However, resolving the different bounding boxes and their discrete nature limited the applicability of this work in real production. Kim et al. [30] developed a set of regression models that predicted tensile shear strength, indentation depth, expulsion occurrence, and weld failure mode from several parameters (e.g., material properties, dynamic resistance, etc.). Zhao et al. [31] used a combination of classical and deep ML techniques to predict nugget diameter from features extracted from dynamic resistance curves recorded during the welding process, while Bogaerts et al. [32] took a similar approach but extracted features automatically from the dynamic resistance curves via an autoencoder. Several attempts have been made to estimate a variety of weld quality factors from infrared data, for example, using classical ML methods on extracted features from cooldown data [33] or using semantic segmentation of video [34,35]. Toward real-time analysis of the RSW process, Scott et al. [36] developed a convolutional long short-term memory network monitoring maximum vertical molten pool size relative to the stack, as well as process events from A-scan sequences. Though this work demonstrated significant promise for real-time analysis and closed-loop feedback for adaptive welding, discrete events were of limited value as feedback, and the position of the molten pool throughout the welding process, though important, was not produced as output. Thus, the approach was cumbersome to apply, especially in highly asymmetrical welding configurations. Thus, as it stands, an automated approach for the analysis of ultrasonic data from RSW process monitoring, which can accurately characterize the internal structure of a weld throughout its formation and estimate its final size, would represent a significant step forward in RSW quality control, RSW process engineering and optimization, RSW process monitoring, and zero-defect RSW manufacturing.
An important challenge in DL applications in NDE is the fusion of data from different sources. Data fusion is commonly necessitated in NDE applications primarily because (1) NDE methodologies may be multi-modal, (2) NDE methodologies may be multi-view with overlapping or distinct coverage zones, and (3) there are typically properties known a priori about the inspection subject, which could be leveraged in data analysis (e.g., geometrical properties, material sound speeds, etc.). Due to the modeling flexibility afforded by deep learning, there are many different ways that data fusion can be achieved with neural networks (see [37] for a review). With the modern rise of transformer [38] architectures and particularly vision transformers for image processing tasks, e.g., [39,40,41], cross-attention [42] provides a natural mechanism for integrating alternative data sources into neural networks, as it allows a transformer network to modulate how it attends to one data source based on information extracted from another. Yan et al. [43] used cross-attention for data fusion in scanning laser weld optical process monitoring. Their approach leveraged the CrossVIT architecture [41] to identify keyhole and molten pool dynamics at the pixel level in the welding substrate. The CrossVIT architecture fuses encodings that are learned at different image resolutions, which not only improves performance but also improves inference speed, enabling pixel classification accuracy of >99% in their work. Cao et al. [44] used cross-attention to fuse photodiode and acoustic signals from monitoring the aluminum alloy laser welding process. Their cross-attention approach reciprocally modulated distinct branches in the network for processing acoustic and photodiode, drastically outperforming CNN-based approaches. In another multimodal application, Hua et al. [45] reciprocally fused optical images and acoustic signals for laser welding penetration measurement with 93.33% accuracy. Salah et al. [46], on the other hand, fused features derived from principal components analysis and thermographic signal reconstruction in a multi-stage attention mechanism for depth estimation and defect identification in pulsed thermography, yielding drastic improvements compared to other approaches. He et al. [47] used cross-attention mechanisms to fuse both multi-scale and multi-view image data for U-shaped nut-and-bolt defect detection in rail system NDE, outperforming other candidate models handily, especially when imaging conditions were not optimal. Eren et al. [15] used a variant of TransUNet [48] for the identification of seam weld joint geometry via semantic segmentation. TransUNet combines the preservation of fine details afforded by U-Net [49]—the longstanding standard architecture for semantic segmentation—with the ability to model long-range dependencies that is enabled by transformer architectures. Another benefit of the TransUNet architecture is that, relative to other approaches such as ViT and Swin transformers, it places computationally intensive transformer blocks into the base layer of the network where image dimensionality is minimal, which improves inference speeds dramatically. Lastly, having a transformer block enables data fusion via cross-attention as well, though Eren et al. [15] did not make use of this potential in their work.
1.4. Motivation
RSW manufacturers often have standards that define the quality of RSW joints by nugget penetration, and in-process measurements of molten pool growth dynamics can provide novel insights about welding processes, which simplify maintenance and improve process optimizations. For the reasons highlighted in Section 1.1, there is a strong need in the industry for RSW process monitoring, and any such solution must be fully automated due to industrial cycle time requirements. However, the existing approaches [28,29,36] for automated analysis of ultrasonic data from RSW process monitoring are insufficient due to their imprecision (afforded by object detection in [28,29] and by proportional measurements in [36]) and inability to provide stack and molten pool positional information at high temporal resolutions (e.g., 1 ms interval) throughout the welding process. Thus, a major motivation of this work is the need for a precise analysis of ultrasonic data from RSW process monitoring, yielding interface positions for the welded stack and molten pool throughout the entire welding process, from which penetration measurements into each sheet could be readily derived. Ideally, any such approach would maintain the capability of identifying expulsion occurrences and timings during the welding process, as demonstrated in the previous works.
Additionally, many automotive and other manufacturers define RSW quality standards based on nugget diameter, but existing ultrasonic process monitoring solutions are based on single-element ultrasonics, which do not enable the direct visualization of diametrical molten pool growth. Research has been previously conducted to relate stack interface dynamics to nugget diameter [50]. The approach correlated maximum ultrasonic time-of-flight deltas of stack interfaces throughout the welding process against weld diameters, and correlation performance was found to be strongly dependent on weld geometry and materials. Stack interfaces can normally be extracted by “peak tracing”, which involves left-to-right local searches of peaks in ultrasonic M-scan envelopes based on prior knowledge about the stack-up geometry, material sound speeds, and ultrasonic gating. However, intermittent ultrasonic contact conditions, destructive interference, and welding process dynamics can significantly hamper such algorithmic stack interface detection. Preliminary work conducted in this study (Figure 1) further indicated that the approach in [50] did not generalize to two RSW configurations used in automotive manufacturing, despite using manually identified stack interfaces as input, which are generally more reliable than those acquired by peak tracing. In these preliminary tests, the mean absolute error ranged from 1.038 to 1.45 mm, with R2 ranging from 0.565 to 784, indicating moderate correlation strength at best. Thus, a solution that more strongly links robust dynamic RSW process measurements to resultant weld nugget diametrical measurements would be an additional major advancement for this technology.
Figure 1.
Mean RSW nugget diameter estimates for a 2.0 mm + 1.6 mm (a,c,e) and 3.0 mm + 1.6 mm (b,d,f) stack-up, based on linear regressions of (a,b) first stack interface maximum delta, (c,d) last stack interface maximum delta, and (e,f) maximum delta between first and last stack interface.
1.5. Objectives
The main objective of this work was to develop and validate an automated approach for the post-process evaluation of ultrasonic M-scans from an RSW process monitoring system. To that end, the aims of the project were (1) to validate the ultrasonic process monitoring approach; (2) to correlate measurements extracted from the ultrasonic data to physical measurements indicative of weld quality; (3) to develop and validate an approach for the precise extraction of molten pool and stack interfaces, as well as expulsion event occurrences, from the ultrasonic M-scans; and (4) to develop and validate an approach for estimation of resultant weld nugget diameters from the RSW process monitoring data. The work resulted in the successful development of a data analysis pipeline for RSW ultrasonic process monitoring, wherein a general-purpose segmentation system identifies molten pool and stack interfaces in M-scan data and identifies expulsion events. RSW diameters are subsequently estimated only from mask data, and quality decisions are finally made from the diameter estimation outputs. To our knowledge, this is the first demonstration of such an approach capable of a high-performance, fully automated, comprehensive analysis of internal inspection data (ultrasonic or otherwise) acquired during the RSW process—in a manner that outpaces production and is industrially applicable. This work represents a breakthrough in RSW process monitoring, which can enable so-called “lights out manufacturing” as the system is integrated in-line with the manufacturing equipment and requires no human intervention to operate.
2. Materials and Methods
A brief summary of the experimental work is provided here, and details of the experimental procedures are provided in the following subsections. To automate the post-process evaluation of ultrasonic M-scans from RSW process monitoring, DL approaches were investigated for both (1) the extraction of molten pool and stack boundaries from which dynamic weld penetration data could be derived throughout the welding process, as well as expulsion event occurrences, and (2) the estimation of weld nugget diameter framed as a regression given the segmentation masks. Thousands of welds were developed for the various facets of the study (Section 2.1). The ultrasonic process monitoring system is described in Section 2.2. Physical measurements (Section 2.3) were extracted from a subset of the welds. The ultrasonic data were prepared such that key interfaces could be extracted from the samples, allowing further downstream processing, such as measurement extraction (Section 2.4). Ultrasonic measurements and cross-section measurements were correlated to validate the ultrasonic approach (Section 2.5). The ultrasonic data were used to develop the semantic segmentation models (Section 2.6) and models for nugget diameter estimation from the segmentation masks (Section 2.7). The end-to-end pipeline was evaluated on a held-out testing dataset (Section 2.7). The research work in this study is summarized in Figure 2, and the partitioning of the dataset for segmentation AI and diameter estimation AI development is summarized in Table 1.
Figure 2.
Summary of the study—main research activities (green boxes), datasets produced in the study (small blue boxes), and proposed ultrasonic data processing pipeline (top). Number of samples in each dataset is in parentheses and denoted n. Thick green arrow signifies the starting point. Finely dashed arrows indicate the flow of weld samples, long dashed arrows indicate the flow of ultrasonic data, and thick solid arrows indicate the flow of models and pipeline outputs.
Table 1.
Data partitioning summary for the AI developments in this study. Testing data was completely held out from any model training and validation.
2.1. Physical Sample Preparation
A sizeable dataset containing a total of 11,959 welds was produced in this study. All welds were developed with ultrasonic process monitoring enabled; thus, they were accompanied by ultrasonic M-scans and metadata automatically generated by the RSW process monitoring system. The dataset consisted of several subsets of RSW samples as described in Section 2.1.1 and Section 2.1.2.
2.1.1. Initial Lab RSW Dataset
An initial set of 10,723 welds was produced in a lab setting. These welds were designed to broadly and evenly cover materials, geometries, and process parameters that are observed in the automotive industry. The welds encompassed >100 sheet combinations, using mild and high-strength steel sheets of thicknesses ranging from 0.65 to 3.0 mm, in two-, three, and four-sheet configurations. Welding schedules included single- and multiple-impulse welds with total weld times from 75 to 1000 ms. Force ranged from 300 to 1000 kN, and current ranged from 6 to 13 kA.
2.1.2. Dataset from Reproduction of Industrial RSW
A total of 1236 welded samples were prepared on rectangular coupons to reproduce the production conditions existing at the industrial facility, but with contrived variability in process and outcomes. The rectangular 80 mm × 38 mm coupons were extracted from material batches used for current automotive part production with different thicknesses, as detailed below. These materials were then welded together in 4 different group combinations: (1) 3.0 mm CR300LA (top)—1.6 mm CR5 (bottom); (2) 1.6 mm CR5 (top)—3.0 mm CR300LA (bottom); (3) 2.0 mm Boron1300 (top)—1.6 mmCR5 (bottom); and (4) 1.6 mm CR5 (top)—2.0 mm Boron1300 (bottom). The nominal chemical compositions of CR300LA [51], CR5 [51], and Boron1300 (Personal Communication) steels are shown in Supplementary Table S1. The welding equipment included a C-type pneumatic welding gun with an Obara NSR200 welding controller (Obara, Hwaseong-si, Gyeonggi-do, Republic of Korea) mounted on a 90 kVA medium frequency and direct current (MFDC) machine (Supplementary Figure S1). The welding gun was equipped with an ultrasonic monitoring system for RSW called Real-time Integrated Weld Analyzer (RIWA; Tessonics Inc., Windsor, ON, Canada), and ultrasonic data acquisition is detailed in Section 2.2.
For this study, to induce variability in the welding process and outcomes, a base welding schedule was altered by varying the weld current in the range between 5500 A and 13,000 A, whereas the weld time and force applied to the electrodes were left stabilized at 300 ms and 480 daN, respectively. The samples were produced in five target groups regarding weld condition, four of which were based on weld diameters measured following a teardown test, as described in international and OEM internal standards (e.g., [52]). In this teardown test, targets are typically set according to minimum satisfactory, minimum undersized, and reference setup weld diameters. These targets were computed based on a relationship (1) of target nugget diameter D given the thickness of the thinnest sheet in the joint t and a desired factor k, where, for this study, k was chosen to be in the set {0, 2, 4, 6}.
D = k√t,
The fifth target category was that of expulsion, which occurs when molten material is expelled from the joint during welding. This category was targeted as it is a prevalent process issue in production RSW, which can yield non-conforming joints and is also easily observable in ultrasonic process monitoring data as a discontinuity in the data.
2.2. Ultrasonic Process Monitoring System for RSW
Ultrasonic data were collected using an inline real-time ultrasonic process monitoring system for RSW [53] (Figure 3). The system uses a 12 MHz single-element transducer embedded into the welding electrode and immersed in a stream of water. The electrode that houses the transducer is covered by a customized copper cap machined to a diameter of 6 mm [54]. The probe was designed and tested for robustness against welding conditions (e.g., temperatures, physical shock, etc.), and its lifespan is typically years of regular production usage. A pulse-echo A-scan is obtained every 1 ms, sampled at a frequency of 125 MHz. Gating of the ultrasonic data is based on total stack-up thickness, and the A-scans are stacked horizontally to form M-scan images.
Figure 3.
Schematic of welding and ultrasonic probe setup and corresponding A-scan obtained, before (a) and during (b) molten pool formation. Horizontally stacking A-scans obtained at a high sampling rate throughout welding yields M-scan (c). Key interfaces observed in A-scan and M-scan are identified numerically: cap–sheet (1), molten pool closest to probe (2), molten pool farthest from probe (3), sheet–cap (4), and sheet–sheet (5).
Comprehensive analyses of resultant ultrasonic M-scans provide information about the quality and acceptability of the resultant RSW from directly observed RSW process dynamics through the axis of the electrodes (the ultrasonically scanned region). It is important to emphasize that the single-element probe cannot directly measure RSW diameters. It is imperative that the monitoring system does not interfere with the welding process due to delays in inference given an M-scan, as any interference can cause costly production delays or production line shutdowns. Thus, the ultrasonic monitoring system must rapidly analyze the scan and make a decision on weld quality within <150 ms, i.e., during the time that the robot advances the welding gun to the next spot, in the fastest case.
2.3. Physical Measurements
This section describes the acquisition of all physical measurements used in this study for downstream correlation analyses against ultrasonic data, as well as the development of diameter estimation models (Figure 2).
2.3.1. Selection of Weld Samples for Cross-Sectioning
From the samples welded according to Section 2.1.2, a total of 95 joints were selected for examination by metallurgical cross-sectioning (Figure 2). The samples were cross-sectioned on a line crossing through the thinnest axis of the nugget, regardless of the nugget’s position. Nugget positioning was identified using an ultrasonic inspection system, the RSWA F2 (Tessonics Inc., Windsor, ON, Canada), a handheld device utilizing a 20 MHz, 52-element matrix transducer (Supplementary Figure S2a).
2.3.2. Cross-Sectioning Procedure
On completion of each RSW, the ultrasonic data collected from RSWA were examined to identify the region of interest for metallographic analysis, which was demarcated as a line on the welded coupon and used to position the cross-sectioning during metallographic preparation (Supplementary Figure S2b). The welded samples were then cross-sectioned precisely next to (~0.1 mm) the demarcation line using a Discotom-60 cut-off machine (Struers, Ballerup, Denmark) with a diamond blade. After cutting, the transverse cross-section of each welded coupon was hot-mounted with a LaboPress-3 mounting press using 15 mL of Purifast Red and 15 mL of Clarofast thermoplastic materials (Struers, Ballerup, Denmark). For automated preparation, six mounted specimens were then clamped in a specimen holder, which was then inserted into a Tegramin-30 automatic grinding and polishing system (Struers, Ballerup, Denmark). The specimens were first ground planar using 600-grit SiC paper with water as a lubricant. Specimens were polished using a 9 µm rigid composite disc with water as lubricant, followed by 3 µm and 1 µm DiaPro diamond suspensions (water-based) on synthetic polishing cloths. The detailed grinding and polishing parameters are summarized in Supplementary Table S2. Between each preparation step, the specimens (while still clamped in the holder) were cleaned ultrasonically in a Lavamin automatic cleaning unit (Struers, Ballerup, Denmark) using only water. The mirror-finished specimen surfaces were etched in a 2% Nital solution (98 mL of ethanol and 2 mL of HNO3) to reveal the characteristics of the different zones in the transverse cross-section of the RSW. It is noteworthy that in this metallurgical preparation process, careful attention was given to prevent overgrinding/polishing and ensure reaching a mirror surface finish on specimens at the location of the demarcation line in order to realize accurate alignment of the metallographic images with the corresponding ultrasonic datasets.
The etched samples were examined using an inverted Olympus GX71 optical microscope (Olympus, Mississauga, ON, Canada) equipped with a motorized XY translation stage for automated imaging. A series of digital images was processed across the entire surface of each specimen and then stitched/combined to obtain a panoramic view of the transverse weld cross-section (Figure 4 and Supplementary Table S3). The panoramic images were then analyzed to measure the identified features of interest in the different areas and nugget regions of the RSWs.
Figure 4.
Panoramic image of a representative transverse weld cross-section with measurements annotated for an acceptable quality (5.3 mm diameter) weld between a 1.6 mm CR5 steel sheet and a 2.0 mm Boron1300 steel sheet (bottom).
Microhardness measurements were conducted to inform the identification of nugget regions. Several specimens with ambiguous nugget regions (Supplementary Figure S3a) were selected for microhardness testing in accordance with [55]. Vickers microhardness measurements (linear profiles and maps; Supplementary Figure S3b,c) were performed on these selected transverse weld cross-sections using a Struers DuraScan 80 hardness tester (Ballerup, Denmark) equipped with an automated X-Y stage and testing cycle. Individual hardness indentations were measured on the polished specimen surfaces using a spacing of 0.5 mm and a 500 g load for a dwell time of 15 s. Two-dimensional (2D) hardness maps (Supplementary Figure S3c) were constructed using the ecos Workflow areaMASTER software. The minimum test point separation distance for all measurements was at least three times the diagonal measurement of the indent to avoid any potential effect of strain fields from the neighboring indents.
2.3.3. Peel Testing and Weld Diameter Measurement
Peel tests were conducted on 585 samples from the industrial RSW reproduction lab dataset to obtain diameter measurements according to [56,57] (Figure 2). The parts were loaded gradually and continuously until separation occurred on one of the sides of the joint (Supplementary Figure S4a). The weld diameter was taken as the average (denoted Davg) of the maximum (denoted Dmax) and minimum (denoted Dmin) dimensions measured perpendicular to each other (Supplementary Figure S4b). These measurements were recorded and used in the development of diameter estimation models (Section 2.7).
2.4. Ultrasonic Data Preparations
In preparation of the ultrasonic data for semantic segmentation AI development (Figure 2), M-scans were converted to grayscale images that were manually annotated at the subpixel level to indicate the stack and molten pool region boundaries (Supplementary Figure S5), as well as expulsion occurrence timings. For the industrial RSW reproduction lab dataset, masks were used to derive ultrasound-based measurements of the weld process, which were subsequently used for correlation analyses against physical measurements (Section 2.5). These annotations were also used to generate ground-truth masks for semantic segmentation (Section 2.6).
2.5. Correlations Between Cross-Section and Ultrasonic Measurements
The ultrasonic approach was validated by correlating the maximum ultrasonically measured penetration into each of the sheets throughout the welding process against physical measurements for the corresponding sheet, as well as the measured nugget diameter (Figure 2; Section 2.3.1). Linear and local regressions using locally weighted scatterplot smoothing (LOWESS) were used to evaluate and visualize relationships.
2.6. Segmentation AI Development
Semantic segmentation of ultrasonic M-scans (Figure 2) was conducted using a supervised DL approach, framed as multi-label semantic segmentation. The interface annotations discussed in Section 2.4 were converted to binarized stack and molten pool masks. Expulsion timings were converted to vertical bands in the M-scans, having an 11-pixel width in the mask data, centered about the expulsion timing. Subsequently, models were tasked with the classification of every pixel in an input M-scan as stack, molten pool, and expulsion independently. Semantic segmentation was conducted using an architecture based on TransUNet [15,48] (Figure 5). An ablation study was conducted to test the effect of stack-up sheet thickness data fusion on the modeling approach via cross-attention in the base of the network. Without cross-attention, only self-attention is used. Linear projections preceding the base are used as input directly into the multiheaded self-attention mechanism; query Q, key K, and value V are generated by multiplying inputs with learned weights WQ, WK, and WV, respectively. Instead, with cross-attention, sheet thickness data are used to derive Q, with K and V both originating from the learned patch embeddings of the ultrasonic M-scan.
Figure 5.
Semantic segmentation architecture based on TransUNet. A standard CNN is first used as a feature extractor from ultrasonic M-scans. Feature maps in the CNN are used as skip connections (dashed arrows) to the decoder cascading upsampler (CUP) via concatenation. The CNN base feature maps are patched and linearly projected to form embeddings, with additional learned positional embeddings added to the feature embeddings. The base layer is a transformer using multi-headed cross-attention to fuse sheet thickness data, followed by multi-headed self-attention. Transformer outputs are reshaped to be the same as the volume from which patch embeddings were derived, and then, they are added to this volume as input to the decoder CUP module, which essentially interleaves convolutions and 2D upsampling, before a final convolution to produce the final output.
Segmentation models were developed using all 10,723 weld samples from the initial lab dataset and 556/1236 samples from the industrial RSW reproduction lab dataset, amounting to 11,279 total samples (Figure 2). These samples were first partitioned (Table 1) into a cross-validation set (90% of samples, n = 10,151) and a testing set (10% of samples, n = 1128). The cross-validation set was used to train and validate the segmentation models using 5-fold Monte Carlo cross-validation, with 9135 samples (90% of cross-validation samples) used for training and the remaining 1016 samples (10% of cross-validation samples) used for validation. The models were trained for up to 150 epochs using Tensorflow [58] and Keras [59], using early stopping based on validation loss to prevent overfitting. Semantic segmentation performance was evaluated on the held-out testing dataset containing 1128 samples.
During training, testing, and downstream predictions, all ultrasonic M-scans were resized to 256 × 256 images using bilinear interpolation. Additionally, all M-scans were cropped horizontally to preserve the entirety of the welding time and vertically to preserve the entirety of the welded stack. Augmentation was applied only during model training. Augmentation consisted of random shifts of up to 30 pixels for all cropping edges, random M-scan contrast adjustments with a contrast factor in the range of [0.2, 1.5], and the addition of noise to the M-scans. Semantic segmentation performance was evaluated using an overall IoU value [60] between the hand-labeled ground truth and predicted masks, as well as the precision, recall, and F1 score for expulsion detection.
2.7. Diameter Estimation AI Development
Diameter estimation (Figure 2) was framed as a regression of log-scaled diameter measurements (minimum Dmin, maximum Dmax, and their mean Davg) extracted in Section 2.3.2, estimated only from input M-scans stacked with their molten pool and stack mask images extracted in Section 2.5. The neural network was derived from TransUNet, having a similar structure down to the base but with a densely connected decision-making layer following it (Figure 6). As with the segmentation approach, a small ablation study was conducted for diameter estimation, also with regard to the usage of cross-attention for sheet thickness data fusion. Additionally, the ablation study was designed to investigate whether also providing the original M-scan as input to the model was beneficial compared to solely the masks. Finally, as the M-scan image and the masks are different in nature, splitting the inputs and using distinct CNNs for each input was also investigated. The 585 peel-tested and measured samples from the industrial RSW reproduction lab dataset (as described in Section 2.3.3) were used for the cross-validation and testing of diameter estimation models (Table 1). In particular, of the 585 samples, 462 (80%) were used for cross-validation, while the other 123 (20%) were used for testing. Splitting into cross-validation and testing was conducted using a random stratified sampling approach to ensure that there was sufficient representation of the various weld types in the testing dataset, as the 585 samples consisted of 399 of the 3.0 mm + 1.6 mm stack-up and 186 of the 2.0 mm + 1.6 mm stack-up. For each of the five folds of cross-validation, 370 of the 462 cross-validation samples (80%) were used for training, while the remaining 92 samples (20%) were used for validation. The selected M-scans were pushed through their corresponding semantic segmentation model to obtain masks, and these masks were used as training input to the diameter estimation models alongside target diameter measurements from peel testing. All diameter estimation models were trained for up to 150 epochs, again on an Nvidia GeForce RTX 3090 using Tensorflow and Keras, using early stopping based on validation loss to prevent overfitting.
Figure 6.
Diameter estimation architecture derived from the TransUNet architecture (Figure 5). Key differences are (1) the potential for multiple CNNs as feature extractors from the image inputs, the outputs of which are concatenated prior to patch creation, and (2) a densely connected network that produces the output diameter estimates.
Using the most performant approach from the ablation study, all five resultant end-to-end ultrasonic data processing pipelines (Figure 2) were tested on the held-out testing dataset of 123 samples. No further preprocessing or augmentation was performed. Performance was evaluated and visualized using linear and local regressions using LOWESS between target and predictions, assessment of the mean absolute error, analysis of the residuals, and analysis of the POD and PFA by fitting logistic regressions to hit/miss data [61] given the absolute difference between the estimated nugget diameter and acceptable mean nugget diameter minimum threshold (5.1 mm).
3. Results and Discussion
The results of this work are presented as follows. The measurements acquired from cross-sectioning the industrial RSW lab reproduction samples are discussed in Section 3.1. The characteristics of the ultrasonic data attained from RSW process monitoring are explained in Section 3.2. Section 3.3 describes the observed relationships between measurements acquired from cross-sectioning versus those obtained ultrasonically. The performance of the DL approach for semantic segmentation of ultrasonic M-scans is detailed in Section 3.4. Finally, the performance of the approach for weld diameter estimation is highlighted in Section 3.5.
3.1. Physical Measurements from Cross Sections
The joint sample fabrication process outlined in Section 2.1.2 yielded a diverse dataset of welds, with coverage across possible weld diameters and thin sheet penetration measurements, suitable for the development and validation of models for both the semantic segmentation of ultrasonic M-scans and weld nugget diameter estimation. The welds spanned nugget diameters from 0.0 mm up to 7.3 mm in the 3.0 mm + 1.6 mm stack-up and up to 7.2 mm in the 2.0 mm + 1.6 mm stack-up, when measured through the nugget after cross-sectioning (Supplementary Figure S6). Waddell and Williams [62] suggested that weld nugget diameter minima were approximately 50% of electrode cap face diameter for zinc-coated sheets, testing electrode cap face diameters of 4.5–8.0 mm. In contrast, electrode caps with an initial contact face diameter of 6 mm were used in this study, and it was possible to produce welds in the <3 mm range, although there were relatively few. The difference in findings may be due to the asymmetry of the stack-ups, use of mild and high-strength steels, and tendency of uneven or non-circular nugget formation, which may have been caused by electrode misalignment, uneven cap wear, or other welding conditions [3,4,63].
Thick sheet penetration distributions (Figure 7a) were vastly different between the two stack-ups, as the molten pool always originated in the thicker sheet. Thin sheet penetration distributions were of similar shape for both weld types (Figure 7b) when measured through the nugget.
Figure 7.
Thick (a) and thin (b) sheet penetration distributions.
Thick sheet penetration measurements taken at the center of the nugget, compared to those taken at the thickest position of the nugget, yielded very strong linear correlations (R2 = 0.99, p = 1.5 × 10−94) in both stack-ups (Figure 8a). This was expected as the molten pool originates in the thicker sheet. In contrast, slightly weaker linear correlations were observed with respect to penetration measurements into the thin sheet in both stack-ups (R2 = 0.89, p = 8.9 × 10−47; Figure 8b). For the thin sheet measurements, strong discrepancies between many central and thickest penetration measurements, as well as clear bias and deviation from the y = x line of the LOWESS model, all indicate that the nugget formed asymmetrically and unevenly within the sheets for many welds. These findings corroborate the earlier assessment that diameter measurement discrepancies are due to uneven and non-circular nugget formation.
Figure 8.
Central (x-axis) versus thickest (y-axis) penetration measurements for thick sheet (a) and thin sheet (b) for both stack-ups.
3.2. Ultrasonic Data
The inline real-time ultrasonic process monitoring system produced M-scans that qualitatively appeared actionable relative to the target weld diameter (Supplementary Figure S7). Given thin sheet thickness t, in welds targeting a 0√t nugget diameter (i.e., no bond should form), molten pools generally either never appeared in the M-scan or appeared to only exist in the thicker sheet in which they originated. In welds with a 2√t target diameter, the molten pool generally appeared to just barely breach the thinner sheet. With 4√t and 6√t, molten pools were always observable, originated earlier in welding time, and penetrated further into the sheets. Lastly, in welds targeting the expulsion condition, scans exhibited at least one harsh discontinuity in all interfaces at various horizontal positions in the M-scan. These discontinuities are generally how expulsions manifest in the M-scans due to rapid loss of molten materials, rapid cooling, and sometimes sudden loss of ultrasonic coupling due to rapid movement of the welding substrate and/or the electrode tips, which can sometimes manifest in M-scans as a sudden drop in signal intensity and contrast.
3.3. Correlations Between Cross-Section and Ultrasonic Measurements
Thin sheet penetration measured via ultrasonic inspection was strongly related to the weld diameter measured by cross-sectioning, and ultrasonic measurements were found to strongly align with the corresponding cross-section measurements. These results highlight the soundness of using the ultrasonic monitoring system for extracting measurements from the welding process that are actionable in determining resultant weld quality.
The relationship between ultrasonic thin sheet penetration and cross-section diameter measurements was roughly linear at low penetration, with diminishing returns on diameter as the penetration increased, yielding a horizontal asymptote at approximately 7 mm of diameter (Figure 9a). Molten pool growth is generally expected to saturate along the axis of the welding electrodes more rapidly compared to diametrically, which means penetration generally precedes diametrical growth [62,64,65]. Additionally, as mentioned in Section 3.1, the weld diameter is known to be related to, and strongly limited by, the weld cap contact face diameter [62,65], and the initial diameter of the contact face was 6 mm. Caps degrade as welds are created, which leads to increased contact face diameter, resulting in an asymptote slightly above the initial cap contact face diameter of 6 mm; therefore, our results match expectations based on geometrical arrangement and previous modeling works [64]. Correlations between thin sheet penetration measured ultrasonically versus thin sheet penetration at the thickest region measured via the cross-section initially yielded a strong and significant linear relationship (R2 = 0.77, p = 7.6 × 10⁻³²; Figure 9b). Local regression also corroborated that the ultrasonic measurements aligned well with the cross-section measurements across the entire range, evidenced by the y = x line being within the 95% confidence interval of the local regression model across all penetration levels. Discrepancies between sample data and curves from local regression may be due to the fundamental differences between the two measurement approaches, i.e., the cross-section measurement was conducted along a plane perpendicular to the welded sheets, while the ultrasonic measurements aggregate information over the insonified region of the weld. Other factors that may influence these discrepancies are potential misidentification of the nugget region prior to cross-sectioning, molten pool characteristics throughout welding (i.e., off-centeredness, unevenness, geometry, size, ultrasonic reflectivity), and natural variance in welding dynamics.
Figure 9.
Relationships between cross-section diameter (a) and thin sheet penetration (b) measurements (vertical axes) and ultrasonic thin sheet penetration measurements (horizontal axes).
3.4. Semantic Segmentation of Ultrasonic M-Scans
Semantic segmentation using a DL approach proved to be extremely effective at extracting features from the ultrasonic M-scans that were indicative of weld quality (Figure 10). Over five cross-validation folds, the architecture both with and without cross-attention yielded stable learning curves (e.g., Supplementary Figure S8). The segmentation approach yielded performance improvements and greater stability (as evidenced by standard deviations) in almost all evaluated metrics by leveraging sheet thicknesses within the stack-up, which are always known in advance during production RSW (Table 2). With data fusion using cross-attention, the overall IoU was 0.9742 (standard deviation sd = 0.00051), molten pool IoU was 0.9216 (sd = 0.00134), stack IoU was 0.9866 (sd = 0.00043), and expulsion IoU was 0.8477 (sd = 0.00752). The approach without cross-attention was only marginally more performant for expulsion detection, having a slightly greater IoU of 0.8483 (sd = 0.001106) and F1 of 0.9612 (sd = 0.00334) but significantly better recall of 0.9538 (sd = 0.00839) than with cross-attention, which outperformed in terms of expulsion precision. In either case, modeling expulsions using segmentation as a vertical band performed incredibly strongly, improving the potential utility of the approach for process monitoring and feedback. It is possible that the approach could further benefit from the fusion of additional data in the modeling approach, e.g., parameters of the welding process or properties of the joined materials. For example, Neven et al. [66] observed segmentation performance improvements by integrating manufacturing process parameters via mid-level fusion, i.e., the fusion of multimodal data into the bottleneck features of the model.
Figure 10.
Representative segmented preprocessed (cropped and resized) and contrast-enhanced ultrasonic M-scans from the testing dataset spanning target nugget diameters (columns) and two weld types (rows). Molten pool (green), welded stack (blue), and expulsion (red) masks are superimposed.
Table 2.
Comparison of segmentation architectures with and without sheet thickness data fusion using cross-attention. Results are presented as mean over five cross-validation folds with standard deviation in parentheses. Best performance highlighted in bold for each performance metric.
Though the molten pool is always found within the stack boundaries when present, its position, time of emergence, and size dynamics can vary significantly from weld to weld. Consequently, it is far less predictable than the stack region. These factors make the molten pool region sometimes difficult to identify even for a human and likely contributed to the discrepancy in both the mean and variance of IoU versus the stack region. The segmentation models also tended to perform better and more consistently on scans with larger molten pool regions (Figure 11). To account for the fact that the molten pool’s size is far more variable and always smaller than the stack, the use of a loss function weighted inversely by region sizes in ground truth data could be used in future work to improve models.
Figure 11.
Molten pool IoU (y-axis) given molten pool region area in pixels (x-axis) for preprocessed (i.e., fixed 256 × 256 dimensionality) testing samples with a visible molten pool, for a representative cross-validation fold. Black line is median and grey region is 95% confidence interval by LOWESS.
Ultimately, semantic segmentation of the M-scans via DL proved to be a powerful means of extraction of features from the ultrasonic data. With an inference time of ~13.4 ms per M-scan on the Nvidia GeForce RTX 3090, this approach is applicable in production deployment, even if it is necessary to use alternative computing hardware (e.g., professional-grade GPUs, edge GPUs, etc.) due to production considerations such as power consumption, computing hardware form factor, system uptime, and reliability. The approach is likely not feasible on some embedded hardware, such as microcontrollers, due to computational time and memory constraints, and deployment on edge TPUs may be possible depending on supported data quantization. Rigorous hyperparameter searches and investigation into other network architectures may lead to the discovery of more performant configurations and could be pursued in future work. Though post-process segmentation of ultrasonic M-scans was demonstrated successfully in this work, the M-scans are collected as a sequence of A-scans and could be segmented instead in real time to produce closed-loop feedback for adaptive welding applications, e.g., by adapting the approach in [36] such that it instead provides real-time molten pool penetration measurements and predictions about the onset of expulsion conditions, which can be used by the weld controller to adapt welding parameters.
As the ultrasonically derived measurements in Section 3.3 correlated strongly with cross-section measurements and the segmentation models were trained on an expansive dataset, it is anticipated that information directly derived from semantic segmentation output masks (e.g., penetration into thinnest outermost sheet, penetration into the thickest outermost sheet, etc.) will strongly correlate with cross-section measurements of the same kind, regardless of welding configuration. However, it remains to be seen whether the models generated herein can generalize to welds involving other vastly different materials, such as aluminum alloys. Additionally, other joining processes related to RSW (e.g., resistance spot riveting, single-sided welding) may yield vastly different ultrasonic process monitoring data, so dedicated semantic segmentation models may be necessary to sufficiently cover such applications.
Despite best efforts to design the semantic segmentation dataset and models to be as general as possible, new materials, stack-ups, and welding schedules are increasingly used in production. Thus, the system should be validated in preliminary trials for new use cases, and additional training data could be used to tailor the model to a new use case as necessary. The system should also be monitored over time to ensure that performance does not degrade due to, e.g., mechanical failures of the manufacturing system, such as sudden misalignment after the robot crashes into a fixture or part, or migration from specified operating conditions of the probe, etc. In deployments, such a system should be evaluated for consistency across new use cases, and specific failure modes should be recorded, investigated, and resolved (e.g., by adding new data to the training dataset and re-training) when encountered.
3.5. Diameter Estimation from Segmentation Outputs
The results presented here were strictly computed using the held-out pipeline end-to-end testing dataset of 123 samples. The DL approach for RSW nugget diameter estimation from semantic segmentation outputs proved to be highly performant. Diameter estimation models converged well and demonstrated stable learning, though with some overfitting evident, likely due to the relatively small size of the dataset (e.g., Supplementary Figure S9). Davg, Dmax, and Dmin estimates were all strongly linearly correlated to their corresponding peel-test measurements, having a minimum mean R2 of 0.916 (sd = 0.019) when estimating Dmax using a standard CNN as the feature extractor and only masks as inputs (Table 3; Figure 12). As expected, the Dmax measurement generally yielded the greatest error, followed by Davg, with Dmin yielding the least error. For the Davg and Dmin measurements, the approach using a split CNN feature extractor with cross-attention in the base and additional M-scan inputs outperformed all other approaches, while the approach not leveraging M-scan inputs performed slightly better on estimating Dmax. Over the five cross-validation folds, linear regression on all size estimates yielded intercepts close to zero and slopes near one, demonstrating a very strong linear relationship about y = x. The worst mean absolute error was attained using only masks as input, without cross-attention and using a standard CNN feature extractor, having a mean of 0.665 (sd = 0.066) over the five cross-validation folds. This represents a significant improvement over methods based on time-of-flight that have been performed historically. Like with other measurements extracted from ultrasonic data, there were situations where lateral measurements were zero, while predicted lateral sizes were non-zero and vice versa. This is likely because there is difficulty in discerning in M-scans between the edge cases where the molten pool may or may not have barely breached the sheet interface, even for a human analyst. In terms of impact on weld quality decision-making, these discrepancies were ultimately a non-issue, as the nuggets were insufficient in any case. The Dmax (Figure 12c) and Dmin (Figure 12d) measurements followed similar trends. Owing to the observed performance, as well as the inference time of ~4.3 ms per weld on the Nvidia GeForce RTX 3090, this approach is also applicable in production deployment.
Table 3.
Comparison of diameter estimation architectures. Results are presented as mean over five cross-validation folds with standard deviation in parentheses. Best performance on R2 and mean absolute error (MAE) is highlighted in bold.
Figure 12.
Mean (a), maximum (c), and minimum (d) lateral size estimates and residuals for mean estimates (b) for a representative cross-validation fold of the most performant modeling approach, wherein M-scans were provided as input alongside segmentation masks, a split CNN was used as the feature extractor, and cross-attention was using the in network base to facilitate stack-up sheet thickness data fusion.
POD and PFA analyses (Table 4; Figure 13) on the most performant approach for diameter estimation showed that, across the five cross-validation folds for the entire end-to-end pipeline, the approach yielded 90% POD with 95% confidence (denoted POD90/95) when the mean nugget lateral size measurements were more than 0.830 mm below the threshold on average (sd = 0.335). PFA fell below 10% with 95% confidence (denoted PFA10/95) once the mean nugget lateral size measurements were more than 0.828 mm above the threshold on average (sd = 0.0795). In the worst cases, POD90/95 and PFA10/95 were 1.252 and 0.913, respectively. Considering diameter estimation usage downstream as binary pass/fail classification about the 5.1 mm threshold, the same approach yielded a precision of 0.937 (sd = 0.00612), recall of 0.951 (sd = 0.014), and F1 of 0.944 (sd = 0.00741). These results demonstrate that the proposed approach results in a high-performance, fully automated RSW process monitoring and quality control, which is ready to deploy in production systems.
Table 4.
POD/PFA results over five cross-validation folds—all values in mm.
Figure 13.
POD/PFA curves for a representative cross-validation fold. Unlike typical POD/PFA for defect detection, the results here are plotted by the absolute difference of the estimated mean lateral nugget size from nugget diameter thresholds.
As the diameter estimation models took as input the mask outputs from a semantic segmentation model, any upstream improvements to the semantic segmentation approach should improve diameter estimation performance. Like the segmentation models, diameter estimation models could benefit from similar modifications and a rigorous hyperparameter search. Contrasting with the proposed segmentation approach, which is highly generalized, it is expected that the diameter estimation approach would not be as generalizable. This is because many weld configurations (schedules, materials, stack-ups, electrode cap diameters, positions on parts, etc.) can yield very similar masks but have vastly different weld diameter outcomes. Thus, in production deployment, it is likely necessary that a dedicated diameter estimation model would be trained for a specific few use cases. Thus, this diameter estimation approach is most feasible in safety-critical applications involving materials and geometries that manufacturers struggle with. In such cases, the costs of model development could be justified by the importance of weld quality and the complexity of the joining application.
As [17] emphasized, in NDE applications of DL approaches, it is often observed that techniques are assessed solely using ML or computer vision performance criteria (e.g., IoU, Dice coefficient, mAP, ROC, accuracy, etc.). In cases aiming to demonstrate the applicability of ML to full automation of NDE data analyses, it is vital to evaluate the performance of the entire system from an NDE standpoint, and ML performance criteria alone can no longer suffice. Thus, this work differs from most in that a complete pipeline for automated NDE data interpretation was developed and evaluated—both at the level of its individual components and as a complete system.
The nature and magnitude of the data required for the development and validation of AI are important considerations for using a similar approach in other applications (e.g., with other joining technologies or NDE methodologies). It is expected that a relatively small set (e.g., 50–100) of additional RSW samples would be required to validate or tune the segmentation approach for new use cases, if necessary. On the other hand, validation or tuning of the diameter estimation approach will need far more examples, each having NDE data that are aligned with measurements obtained via destructive tests or alternative NDE approaches. RSW contrasts with many other joining technologies that may be far more difficult to control, less repeatable, more sensitive to process parameters, and subject to a greater variety of external factors. Consequently, for other joining technologies, there can be a much greater variety of failure modes observed in products; any AI approach requires significantly more data to sufficiently cover the various failure modes, and the manufacturing of examples to support dataset development can be very complicated. In such cases, the cost of dataset development for training and validation of such AI systems can be significant—perhaps even prohibitive.
4. Conclusions
In this work, the high-performance end-to-end automation of the analysis of ultrasonic data from RSW process monitoring was demonstrated. The main novelty of this work is that no other fully automated monitoring methodology—ultrasonic or otherwise—has been previously demonstrated or developed for the internal analysis of RSWs during their formation. In related works, Yang et al. [67] demonstrated an ultrasonic method for stainless steel RSW evaluation using DL for signal classification (as defect, e.g., failed bonding, expulsion, cavitation, and porosity; nugget, i.e., resolidified after melting and thereby bonded; corona, i.e., pressure-welded solid-state bond surrounding the nugget, non-welded, i.e., region where no bonding occurred; and background, i.e., where none of the other conditions exist). However, their approach differed in that the ultrasonic data were acquired offline and post-welding, with the sample immersed in water. Additionally, POD and PFA were not analyzed, and with the use of immersion spiral ultrasound, the production applicability of the approach is not clear.
The present study leveraged a large dataset consisting only of real data, and in many NDE applications, this is infeasible. In this work, as a consequence of solely using real data from a strategically designed large set of welds, the final end-to-end solution and its components are at a readiness level that they could be deployed in production systems and tailored for novel specific use cases as necessary. In contrast, related works relying on simulated data (e.g., from finite element modeling) can demonstrate proof of concept but may not demonstrate deployment readiness. For example, Yue et al. [68] devised an approach that used densely connected neural networks to predict resultant weld diameters given initial welding process and substrate parameters via transfer learning. They initially trained models with a large dataset of low-fidelity data from finite element modeling and subsequently fine-tuned models using high-fidelity empirical data. They found that a multi-fidelity model outperformed both low-fidelity and high-fidelity models in terms of prediction error and generalizability. A drawback of this approach is that its production applicability is unclear, as the modeling stage and empirical work assumed ideal conditions and did not address the main sources of RSW process instability.
In the current study, the investigated welds only consisted of mild- and high-strength steels with coated and uncoated sheets. The initial lab dataset contained two-, three-, and four-sheet stack-ups, which cover the vast majority of potential use cases, especially in automotive manufacturing. It is expected that the semantic segmentation approach will easily generalize to other welding configurations involving steels. Though it is possible that dedicated models would need to be developed to properly process welds involving aluminum alloys, leveraging stack-up sheet thickness data modulated by material sound speeds to obtain approximate sheet interface time-of-flight deltas in the proposed data fusion approach may alleviate issues of generalization using alternative materials and dissimilar material stack-ups.
In the present study, as opposed to directly estimating diameter measurements from M-scans, conducting the intermediate step of semantic segmentation provides the potential to store and visualize the mask outputs, e.g., on a monitor at the welding cell or during development. This is imperative for establishing the trustworthiness of the system, understanding its limitations, identifying its failure modes, and identifying issues with either manufacturing or NDE equipment that can lead to misjudgments of the products. Additionally, due to the modularity of the system, the semantic segmentation component can be improved without the necessity of modification to the downstream diameter estimation component. In the proposed approach, semantic segmentation models can also be repurposed easily, e.g., as a pre-trained model that is transferred to related tasks or similar monitoring applications. Lastly, there are applications where the diameter estimation component is unnecessary and the segmentation component can be used in a standalone manner—for example, in applications where penetration measurements are sufficient or in applications such as welding process engineering and optimization.
The findings from this work extend beyond the NDE technique (ultrasonic) and the joining technology (RSW) demonstrated herein. The increasing use of AI techniques to automate NDE data analysis stands to improve the value proposition of NDE for manufacturers by providing new data about parts and new closed-loop feedback mechanisms within manufacturing processes. The approach demonstrated in this work can also enable a novel post-process feedback loop by which recently completed welds influence the parameterization of subsequent welds. This is feasible based on the work conducted in this study, as the total inference time of the pipeline is only ~17.7 ms on the Nvidia RTX 3090—far below the fastest expected travel time of a weld gun to the subsequent weld of ~150 ms. The use of similar techniques in process monitoring systems to achieve in-process NDE data analyses (i.e., while the process is underway), despite having strong requirements and significant challenges (e.g., computational time constraints of ~1 ms per A-scan), can enable extremely fine-grained control of manufacturing processes. In turn, for many manufacturing processes, the dream of zero-defect manufacturing can soon become a reality.
Supplementary Materials
The following supporting information can be downloaded at https://www.mdpi.com/article/10.3390/jmmp10030101/s1, Figure S1: Experimental setup for data collection, comprised of a type C welding gun, MFDC welding controller, and an ultrasonic RIWA inspection system, installed at Tessonics Europe GmbH (Germany). Figure S2: Results from ultrasonic testing (a) and top view of representative resistance spot welded coupons showing the demarcation line identified using ultrasonic inspection for positioning the transverse cross-sectioning during metallographic preparation (b). Figure S3: Heat-affected zone micrograph close-up (a), hardness traversing linearly left to right (b), and hardness heatmap (c) for a 3.0 mm (bottom sheet) + 1.6 mm (top sheet) weld sample with ambiguous nugget boundary. Figure S4: Measurement of weld diameter (a) and peel test procedure schematics according to ISO 14270 (b). Figure S5: Ultrasonic M-scan image (left), scan annotated with stack (orange) and molten pool (blue) region boundaries as well as current-on (white vertical line) and current-off (black vertical line) events (middle), and resultant ground-truth masks overlayed on scan (right). Figure S6: Nugget cross-section diameter distributions for 3.0 mm + 1.6 mm (blue) and 2.0 mm + 1.6 mm (gold) stack-ups. Figure S7: Representative ultrasonic M-scans for welds spanning target nugget diameters (columns) and two weld types (rows). Figure S8: Example loss curve for segmentation model. Figure S9: Example loss curve for diameter estimation model. Table S1. Nominal chemical composition in wt. % of materials. Table S2. Detailed grinding and polishing steps & parameters. Table S3. Nugget zone measurement descriptions.
Author Contributions
Conceptualization, all authors; methodology, all authors; software, R.S. and L.B.; validation, all authors; formal analysis, R.S.; investigation, all authors; resources, all authors; data curation, all authors; writing, all authors; visualization, all authors; supervision, all authors; project administration, P.W. and R.G.M.; funding acquisition, P.W. and R.G.M. All authors have read and agreed to the published version of the manuscript.
Funding
This work was supported by the National Research Council Canada Industrial Research Assistance Program (NRC IRAP), grant 970784, as part of a 3 + 2 Canada–Germany international consortium on developing a “Smart Solution for Quality Control of Vehicle Assembly using an Ultrasonic Imaging Sensor with Embedded Artificial Intelligence”.
Data Availability Statement
Restrictions apply to the availability of these data. Some data were obtained from third parties and may be available upon request to the corresponding authors.
Acknowledgments
The authors would like to thank York Oberdörfer and the team at Tessonics Europe GmbH (Cologne, Germany) for the development and management of physical weld samples, in addition to guidance and correspondence throughout the project. Lastly, the authors would like to thank our colleagues at the Centre for Diagnostic Imaging Research (Windsor, Canada) for their contributions toward ultrasonic dataset preparation.
Conflicts of Interest
R.G.M. is the president and CEO of Tessonics Inc. The other authors affiliated with Tessonics Inc. are paid employees of the company.
References
- Kearns, W.H. Resistance and Solid-State Welding and Other Joining Processes, 7th ed.; American Welding Society: Doral, FL, USA, 1980; Volume 3, ISBN 0-87171-188-5. [Google Scholar]
- Dugmore, A. New Composites Target EV Application; SAE International Automotive Engineering: Warrendale, PA, USA, 2021. [Google Scholar]
- Zhao, D.; Vdonin, N.; Bezgans, Y.; Radionova, L.; Glebov, L. Correlating Electrode Degradation with Weldability of Galvanized BH 220 Steel during the Electrode Failure Process of Resistance Spot Welding. Crystals 2023, 13, 39. [Google Scholar] [CrossRef] [Scilit]
- Sexton, A.; Doolan, M. Effect of electrode misalignment on the quality of resistance spot welds. Manuf. Lett. 2023, 35, 952–957. [Google Scholar] [CrossRef] [Scilit]
- Schlichting, J.; Brauser, S.; Pepke, L.A.; Maierhofer, C.; Rethmeier, M.; Kreutzbruck, M. Thermographic testing of spot welds. NDT E Int. 2012, 48, 23–29. [Google Scholar] [CrossRef] [Scilit]
- Mansour, T.M. Ultrasonic inspection of spot welds in thin-gage steel. Mater. Eval. 1988, 46, 650–658. [Google Scholar]
- Denisov, A.; Shakarji, C.; Lawford, B.; Maev, R.; Paille, J. Spot weld analysis with 2D ultrasonic arrays. J. Res. Natl. Inst. Stand. Technol. 2004, 109, 233. [Google Scholar] [CrossRef] [Scilit]
- Liu, J.; Xu, G.; Gu, X.; Zhou, G. Ultrasonic test of resistance spot welds based on wavelet package analysis. Ultrasonics 2015, 56, 557–565. [Google Scholar] [CrossRef] [Scilit]
- Buckley, J.; Servent, R. Improvements in ultrasonic inspection of resistance spot welds. Insight Non-Destruct. Test. Cond. Monit. 2009, 51, 73–77. [Google Scholar] [CrossRef] [Scilit]
- Roberts, D.; Mason, J.; Lewis, C. Ultrasonic spot weld testing with automatic classification. Sci. Technol. Weld. Join. 2002, 7, 47–50. [Google Scholar] [CrossRef] [Scilit]
- Maev, R.G.; Ptchelintsev, A.A.; Mann, J.L. Transducer Built into an Electrode. U.S. Patent Number 6,297,467, 2 October 2001. [Google Scholar]
- Maev, R.G.; Chertov, A. Ultrasonic In-process Monitoring and Feedback of Resistance Spot Weld Quality. U.S. Patent Number 9,296,062, 29 March 2016. [Google Scholar]
- Li, D.; Li, C.; Chen, C.; Zhao, Z. Semantic Segmentation of a Printed Circuit Board for Component Recognition Based on Depth Images. Sensors 2020, 20, 5318. [Google Scholar] [CrossRef] [Scilit]
- Nowroth, C.; Gu, T.; Grajczak, J.; Nothdurft, S.; Twiefel, J.; Hermsdorf, J.; Kaierle, S.; Wallaschek, J. Deep Learning-Based Weld Contour and Defect Detection from Micrographs of Laser Beam Welded Semi-Finished Products. Appl. Sci. 2022, 12, 4645. [Google Scholar] [CrossRef] [Scilit]
- Eren, B.; Demir, M.H.; Mistikoglu, S. A new approach for detection of weld joint by image segmentation with deep learning-based TransUNet. Int. J. Adv. Manuf. Technol. 2024, 134, 5225–5240. [Google Scholar] [CrossRef] [Scilit]
- Wong, V.; Ferguson, M.; Law, K.; Lee, Y.; Witherell, P. Segmentation of Additive Manufacturing Defects Using U-Net. J. Comput. Inf. Sci. Eng. 2022, 22, 031005. [Google Scholar] [CrossRef] [Scilit]
- Tyystjärvi, T.; Virkkunen, I.; Fridolf, P.; Rosell, A.; Barsoum, Z. Automated defect detection in digital radiography of aerospace welds using deep learning. Weld. World 2022, 66, 643–671. [Google Scholar] [CrossRef] [Scilit]
- Virkkunen, I.; Miettinen, K.; Packalen, T. Virtual Flaws for nde Training and Qualification. In Proceedings of the 11th European Conference on Non-Destructive Testing, Prague, Czech Republic, 6–10 October 2014. [Google Scholar]
- Virkkunen, I.; Koskinen, T.; Jessen-Juhler, O.; Rinta-aho, J. Augmented ultrasonic data for machine learning. J. Nondestruct. Eval. 2021, 40, 4. [Google Scholar] [CrossRef] [Scilit]
- Tyystjärvi, T.; Fridolf, P.; Rosell, A.; Virkkunen, I. Deploying Machine Learning for Radiography of Aerospace Welds. J. Nondestruct. Eval. 2024, 43, 24. [Google Scholar] [CrossRef] [Scilit]
- Medak, D.; Posilović, L.; Subašić, M.; Budimir, M.; Lončarić, S. Automated Defect Detection From Ultrasonic Images Using Deep Learning. IEEE Trans. Ultrason. Ferroelectr. Freq. Control. 2021, 68, 3126–3134. [Google Scholar] [CrossRef] [Scilit]
- Medak, D.; Posilović, L.; Subašić, M.; Budimir, M.; Lončarić, S. DefectDet: A deep learning architecture for detection of defects with extreme aspect ratios in ultrasonic images. Neurocomputing 2022, 473, 107–115. [Google Scholar] [CrossRef] [Scilit]
- Guo, Y.; Xiao, Z.; Geng, L. Defect detection of 3D braided composites based on semantic segmentation. J. Text. Inst. 2023, 114, 574–583. [Google Scholar] [CrossRef] [Scilit]
- Zhang, S.; Zhang, Y. Automated weld defect segmentation from phased array ultrasonic data based on U-net architecture. NDT E Int. 2024, 146, 103165. [Google Scholar] [CrossRef] [Scilit]
- Kuchipudi, S.T.; Ghosh, D. Automated detection and segmentation of internal defects in reinforced concrete using deep learning on ultrasonic images. Construct. Build. Mater. 2024, 411, 134491. [Google Scholar] [CrossRef] [Scilit]
- Chen, Z.; Wang, Q.; He, Q.; Yu, T.; Zhang, M.; Wang, P. CUFuse: Camera and Ultrasound Data Fusion for Rail Defect Detection. IEEE Trans. Intell. Transp. Syst. 2022, 23, 21971–21983. [Google Scholar] [CrossRef] [Scilit]
- Zamiela, C.; Jiang, Z.; Stokes, R.; Tian, Z.; Netchaev, A.; Dickerson, C.; Tian, W.; Bian, L. Deep multi-modal U-Net fusion methodology of thermal and ultrasonic images for porosity. J. Manuf. Sci. Eng. 2023, 145, 061009. [Google Scholar] [CrossRef] [Scilit]
- Maev, R.; Chertov, A.; Scott, R.; Stocco, D.; Ouellette, A.; Denisov, A.; Oberdoerfer, Y. NDE in the Automotive Sector. In Handbook of Nondestructive Evaluation 4.0; Meyendorf, N., Ida, N., Singh, R., Vrana, J., Eds.; Springer: Cham, Switzerland, 2020. [Google Scholar] [CrossRef] [Scilit]
- Scott, R.; Stocco, D.; Chertov, A.; Maev, R.G. Using Deep Learning to Characterize Ultrasonic B-Scans. In Proceedings of the 30th ASNT Research Symposium, St. Louis, MO, USA, 20–23 June 2022. [Google Scholar]
- Kim, S.; Hwang, I.; Kim, D.Y.; Kim, Y.M.; Kang, M.; Yu, J. Weld-Quality Prediction Algorithm Based on Multiple Models Using Process Signals in Resistance Spot Welding. Metals 2021, 11, 1459. [Google Scholar] [CrossRef] [Scilit]
- Zhao, D.; Ivanov, M.; Wang, Y.; Du, W. Welding quality evaluation of resistance spot welding based on a hybrid approach. J. Intell. Manuf. 2021, 32, 1819–1832. [Google Scholar] [CrossRef] [Scilit]
- Bogaerts, L.; Dejans, A.; Faes, M.G.R.; Moens, D. A machine learning approach for efficient and robust resistance spot welding monitoring. Weld. World 2023, 67, 1923–1935. [Google Scholar] [CrossRef] [Scilit]
- Stavropoulos, P.; Sabatakakis, K.; Papacharalampopoulos, A.; Mourtzis, D. Infrared (IR) quality assessment of robotized resistance spot welding based on machine learning. Int. J. Adv. Manuf. Technol. 2022, 119, 1785–1806. [Google Scholar] [CrossRef] [Scilit]
- Zhou, J.; Wang, D.; Chen, J.; Feng, Z.; Clarson, B.; Baselhuhn, A. Autonomous nondestructive evaluation of resistance spot welded joints. Robot. Comput.-Integr. Manuf. 2021, 72, 102183. [Google Scholar] [CrossRef] [Scilit]
- Guo, S.; Wang, D.; Chen, J.; Feng, Z.; Guo, W. Predicting Nugget Size of Resistance Spot Welds Using Infrared Thermal Videos With Image Segmentation and Convolutional Neural Network. J. Manuf. Sci. Eng. 2021, 144, 021009. [Google Scholar] [CrossRef] [Scilit]
- Scott, R.; Stocco, D.; Chertov, A.; Maev, R.G. Real-time AI-driven interpretation of ultrasonic data from resistance spot weld process monitoring for adaptive welding. Mater. Eval. 2023, 81, 61–70. [Google Scholar] [CrossRef] [Scilit]
- Hussain, M.; O’nils, M.; Lundgren, J.; Mousavirad, J. A Comprehensive Review on Deep Learning-Based Data Fusion. IEEE Access 2024, 12, 180093–180124. [Google Scholar] [CrossRef] [Scilit]
- Vaswani, A.; Shazeer, N.; Parmar, N.; Uszkoreit, J.; Jones, L.; Gomez, A.N.; Kaiser, Ł.; Polosukhin, I. Attention Is All You Need. arXiv 2023, arXiv:1706.03762. [Google Scholar] [PubMed]
- Dosovitskiy, A.; Beyer, L.; Kolesnikov, A.; Weissenborn, D.; Zhai, X.; Unterthiner, T.; Dehghani, M.; Minderer, M.; Heigold, G.; Gelly, S.; et al. An Image is Worth 16x16 Words: Transformers for Image Recognition at Scale. In Proceedings of the IEEE/CVF Conference on Computer Vision and Pattern Recognition, New York City, NY, USA, 23–26 June 2021; pp. 45–67. [Google Scholar]
- Cao, H.; Wang, Y.; Chen, J.; Jiang, D.; Zhang, X.; Tian, Q.; Wang, M. Swin-Unet: Unet-Like Pure Transformer for Medical Image Segmentation. In Computer Vision—ECCV 2022 Workshops. ECCV 2022; Lecture Notes in Computer Science; Karlinsky, L., Michaeli, T., Nishino, K., Eds.; Springer: Cham, Switzerland, 2023; Volume 13803. [Google Scholar] [CrossRef] [Scilit]
- Chen, C.F.; Fan, Q.; Panda, R. CrossViT: Cross-Attention Multi-Scale Vision Transformer for Image Classification. In Proceedings of the IEEE/CVF International Conference on Computer Vision (ICCV), Montreal, QC, Canada, 11–17 October 2021; pp. 357–366. [Google Scholar]
- Soydaner, D. Attention mechanism in neural networks: Where it comes and where it goes. Neural Comput. Appl. 2022, 34, 13371–13385. [Google Scholar] [CrossRef] [Scilit]
- Yan, S.; Chen, B.; Gao, H.; Tan, C.; Song, X.; Wang, G. Cross-attention time-series multi-feature fusion vision transformer for joint formation monitoring in laser scanning welding. Mech. Syst. Signal Process. 2025, 229, 112531. [Google Scholar] [CrossRef] [Scilit]
- Cao, L.; Li, J.; Zhang, L.; Luo, S.; Li, M.; Huang, X. Cross-attention-based multi-sensing signals fusion for penetration state monitoring during laser welding of aluminum alloy. Knowl. Based Syst. 2023, 261, 110212. [Google Scholar] [CrossRef] [Scilit]
- Hua, L.; Xu, T.; Hu, P.; Jin, Y.; Ding, H.; Ma, S.; Lyu, F. An anti-interference attention fusion network-based weld penetration state recognition with multimodal data. Nondestruct. Test. Eval. 2025, 1–24. [Google Scholar] [CrossRef] [Scilit]
- Salah, M.; Werghi, N.; Svetinovic, D.; Abdulrahman, Y. Multi-Modal Attention Networks for Enhanced Segmentation and Depth Estimation of Subsurface Defects in Pulse Thermography. arXiv 2025. [Google Scholar] [CrossRef] [Scilit]
- He, J.; Wang, W.; Jin, X.; Li, H.; Liu, J.; Chen, B. Multiscale Cross-Attention CNN-Transformer Two-Branch Fusion Network for Detecting Railway U-Shaped Bolts & Nuts Defects. IEEE/ASME Trans. Mechatron. 2026, 31, 802–813. [Google Scholar] [CrossRef] [Scilit]
- Chen, J.; Lu, Y.; Yu, Q.; Luo, X.; Adeli, E.; Wang, Y.; Lu, L.; Yuille, A.L.; Zhou, Y. TransUNet: Transformers Make Strong Encoders for Medical Image Segmentation. arXiv 2021, arXiv:2102.04306. [Google Scholar] [CrossRef] [Scilit]
- Ronneberger, O.; Fischer, P.; Brox, T. U-Net: Convolutional Networks for Biomedical Image Segmentation. arXiv 2015, arXiv:1505.04597. [Google Scholar] [CrossRef] [Scilit]
- Andreoli, A.F.; Chertov, A.M.; Maev, R.G. Correlation between Peel Test and Real Time Ultrasonic Test for Quality Diagnosis in Resistance Spot Welding. Soldag. Insp. 2016, 21, 282–289. [Google Scholar] [CrossRef] [Scilit]
- ESB Group. ESB-Quality-Guide-V1.1-VDA239-100. Available online: https://cdn.esb-group.com/wp-content/uploads/2025/03/ESB-Quality-Guide-V1.1-VDA239-100.pdf (accessed on 15 January 2026).
- ISO 5821:2009; Resistance Welding—Destructive Tests of Welds—Failure Types and Geometric Measurements for Resistance Spot, Seam and Projection Welds. International Organization for Standardization: Geneva, Switzerland, 2009.
- Chertov, A.; Maev, R.G. Determination of Resistance Spot Weld Quality in Real Time using Reflected Acoustic Waves. Comparison with Through-Transmission Mode. In Proceedings of the 16th World Conference on NDT, Montreal, QC, Canada, 30 August–3 September 2004. [Google Scholar]
- Maev, R.G.; Chertov, A.M. Electrode Cap for Ultrasonic Testing. U.S. Patent Number 8,381,591, 26 February 2013. [Google Scholar]
- ASTM E384-22; Standard Test Method for Microindentation Hardness of Materials. ASTM International: West Conshohocken, PA, USA, 2022.
- ISO 14270:2016; Resistance Welding—Destructive Testing of Welds—Specimen Dimensions and Procedure for Mechanized Peel Testing Resistance Spot, Seam and Embossed Projection Welds. International Organization for Standardization: Geneva, Switzerland, 2016.
- AWSD8.9M:2012; Test Methods for Evaluating the Resistance Spot Welding Behavior of Automotive Sheet Steel Materials. American Welding Society: Miami, FL, USA, 2012.
- Abadi, M.; Ashish, A.; Paul, B.; Eugene, B.; Zhifeng, C.; Craig, C.; Greg, S.C.; Andy, D.; Jeffrey, D.; Matthieu, D.; et al. TensorFlow: Large-Scale Machine Learning on Heterogeneous Systems, version 2.7.0; Tensorflow: Mountain View, CA, USA, 2015. Available online: https://www.tensorflow.org (accessed on 15 January 2026).
- Keras, version 2.7.0; Keras: Mountain View, CA, USA, 2015. Available online: https://keras.io/ (accessed on 15 January 2026).
- Rahman, M.A.; Wang, Y. Optimizing Intersection-Over-Union in Deep Neural Networks for Image Segmentation. In Advances in Visual Computing, ISVC 2016; Lecture Notes in Computer Science; Bebis, G., Boyle, R., Parvin, B., Koracin, D., Porikli, F., Skaff, S., Entezari, A., Min, J., Iwai, D., Sadagic, A., Eds.; Springer: Cham, Switzerland, 2016; Volume 10072. [Google Scholar] [CrossRef] [Scilit]
- Annis, C. Nondestructive Evaluation System Reliability Assessment; MIL-HDBK-1823A; United States Department of Defense: Washington, DC, USA, 2009.
- Waddell, W.; Williams, N.T. Control of Resistance Spot Welded Quality Using Multi-Parameter Derived Algorithms for Zinc-Coated Sheets; Research Report EUR 17859; Technical Steel Research Programme; Commission of European Communities: Brussels, Belgium, 1997. [Google Scholar]
- Sheikhi, M.; Tale, M.V.; Usefifar, G.R.; Fattah-Alhosseini, A. Thermal Modeling of Resistance Spot Welding and Prediction of Weld Microstructure. Metall. Mater. Trans. A 2017, 48, 5415–5423. [Google Scholar] [CrossRef] [Scilit]
- Dickinson, D.; Tsai, C.L.; Jammal, O.A. Modeling of Resistance Spot Weld Nugget Growth—Applications for the Automotive Industry. SAE Int. J. Mater. Manuf. 1990, 99, 789–802. [Google Scholar]
- Zhang, H.; Senkara, J. Resistance Welding—Fundamentals and Applications; CRC Press: Boca Raton, FL, USA, 2005; ISBN 0-203-61639-1. [Google Scholar]
- Neven, R.; Goedemé, T.A. Multi-Branch U-Net for Steel Surface Defect Type and Severity Segmentation. Metals 2021, 11, 870. [Google Scholar] [CrossRef] [Scilit]
- Yang, L.; Chuai, R.; Zeng, H.; Geng, H.; Li, D.; Cai, G.; Xue, D.; Liu, C. Ultrasonic evaluation of stainless steel resistance spot welded based on deep learning. Nondestruct. Test. Eval. 2025, 41, 1566–1581. [Google Scholar] [CrossRef] [Scilit]
- Yue, Z.J.; Chen, Q.R.; Bao, Z.G.; Huang, L.; Tan, G.B.; Hou, Z.H.; Li, M.S.; Huang, S.Y.; Zhao, H.L.; Kong, J.Y.; et al. Improving RSW nugget diameter prediction method: Unleashing the power of multi-fidelity neural networks and transfer learning. Adv. Manuf. 2024, 12, 409–427. [Google Scholar] [CrossRef] [Scilit]
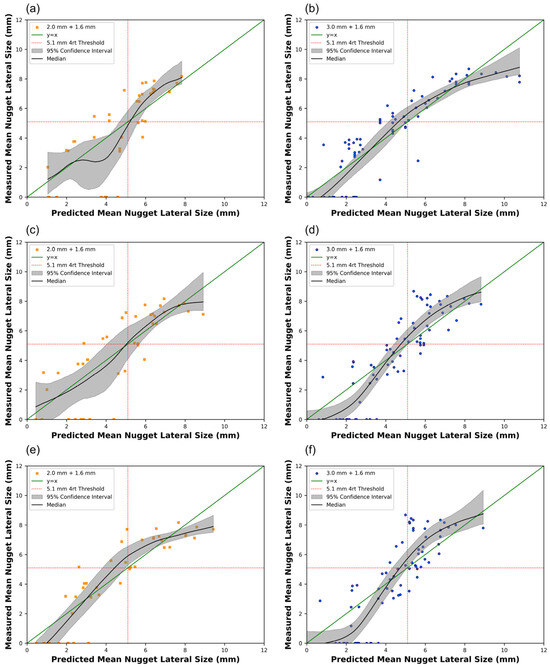
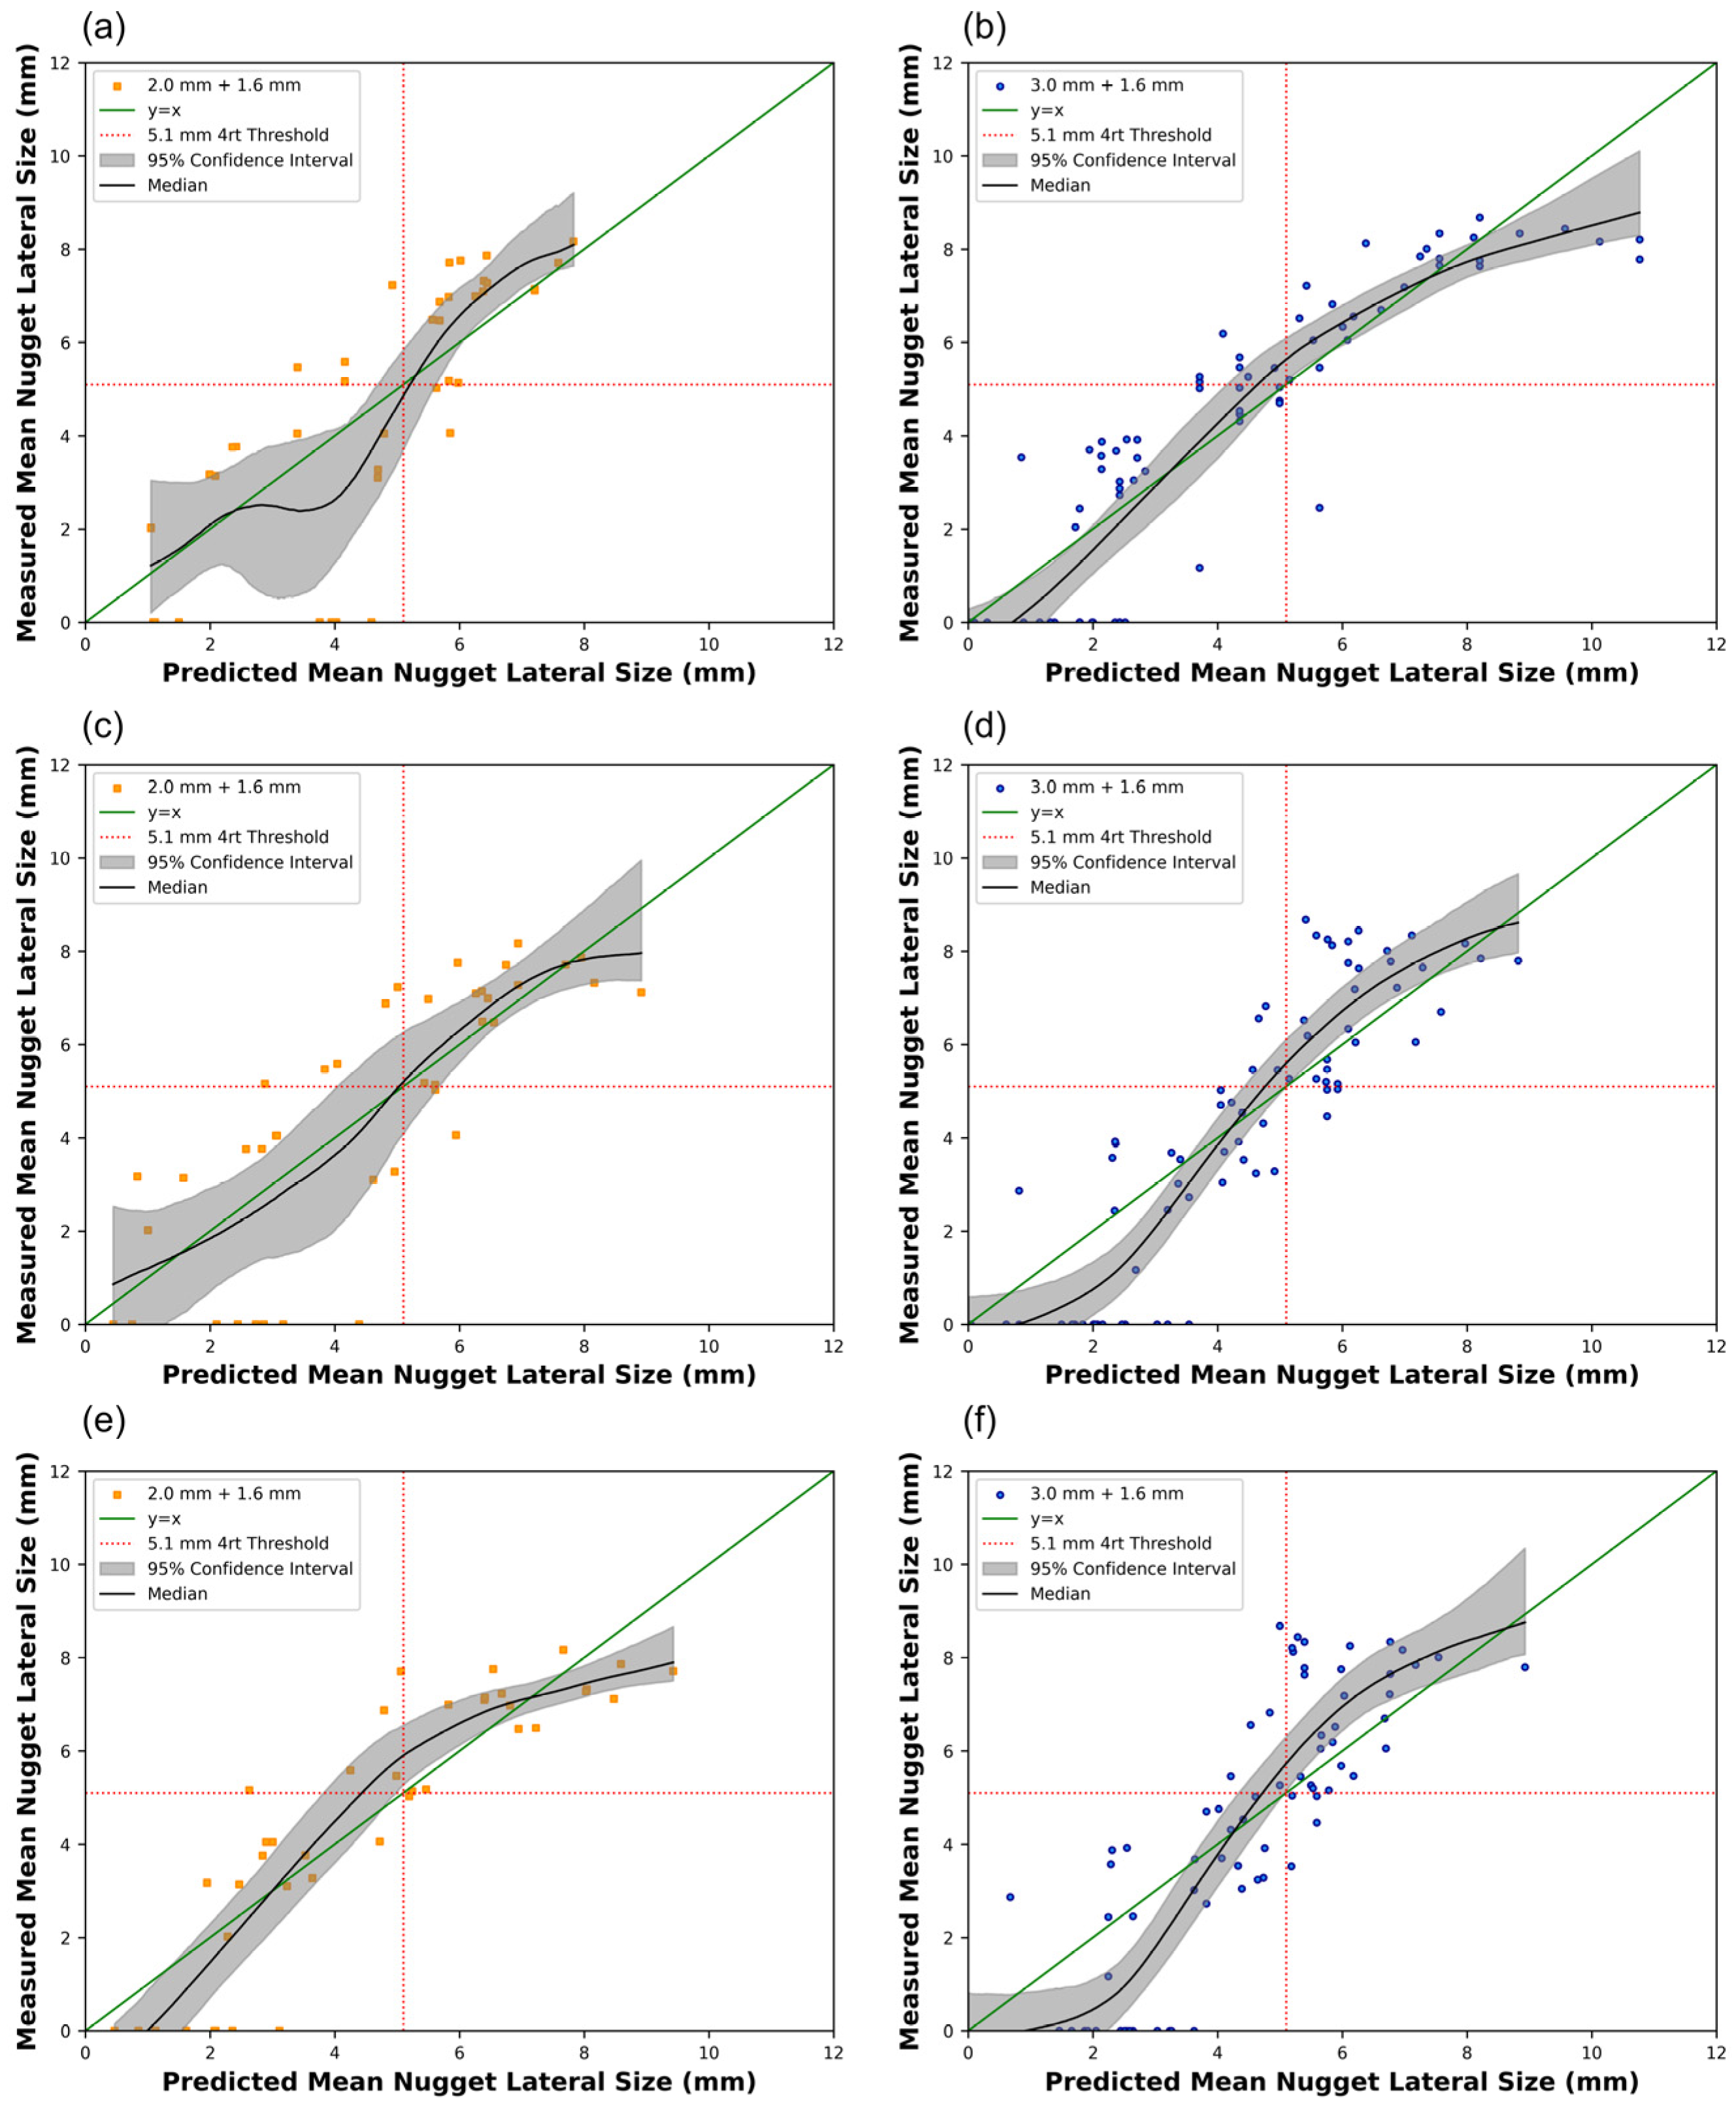
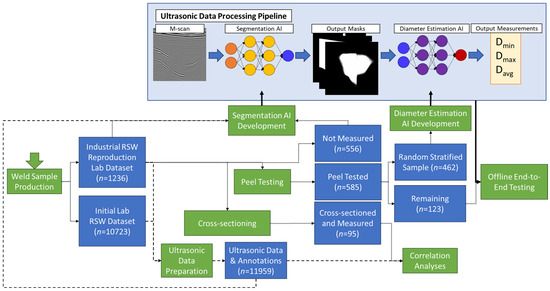
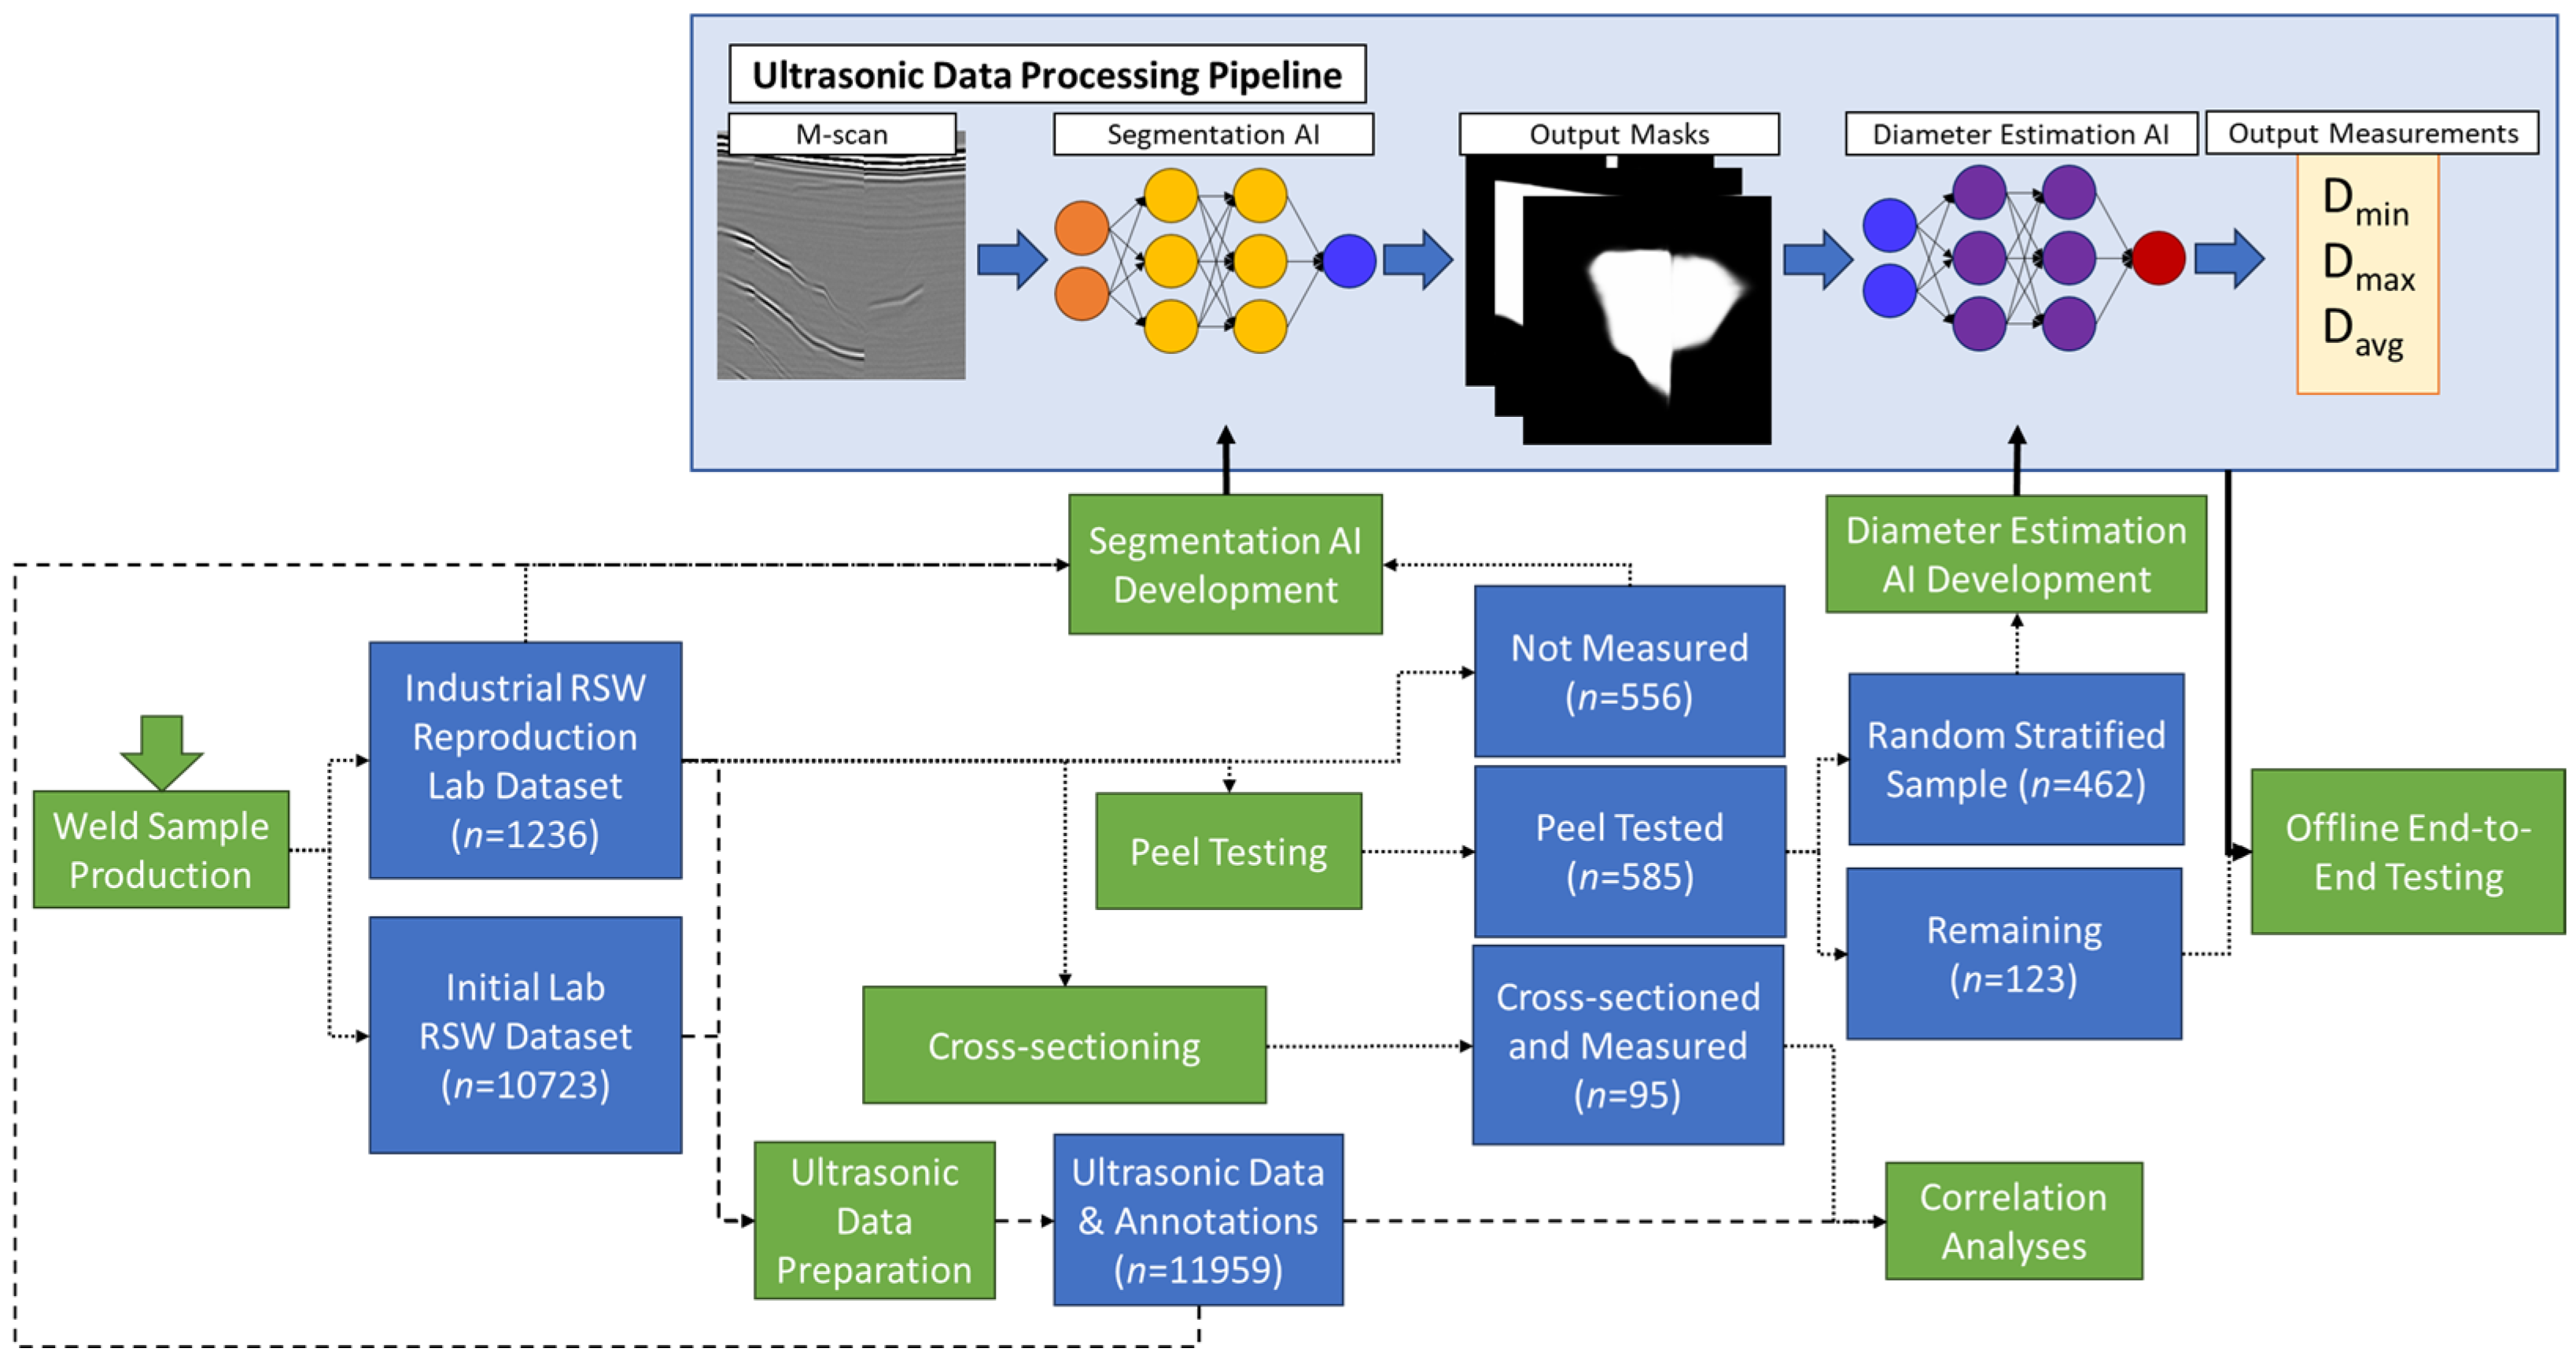
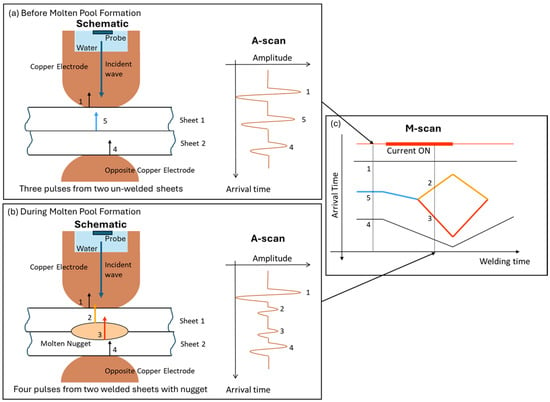
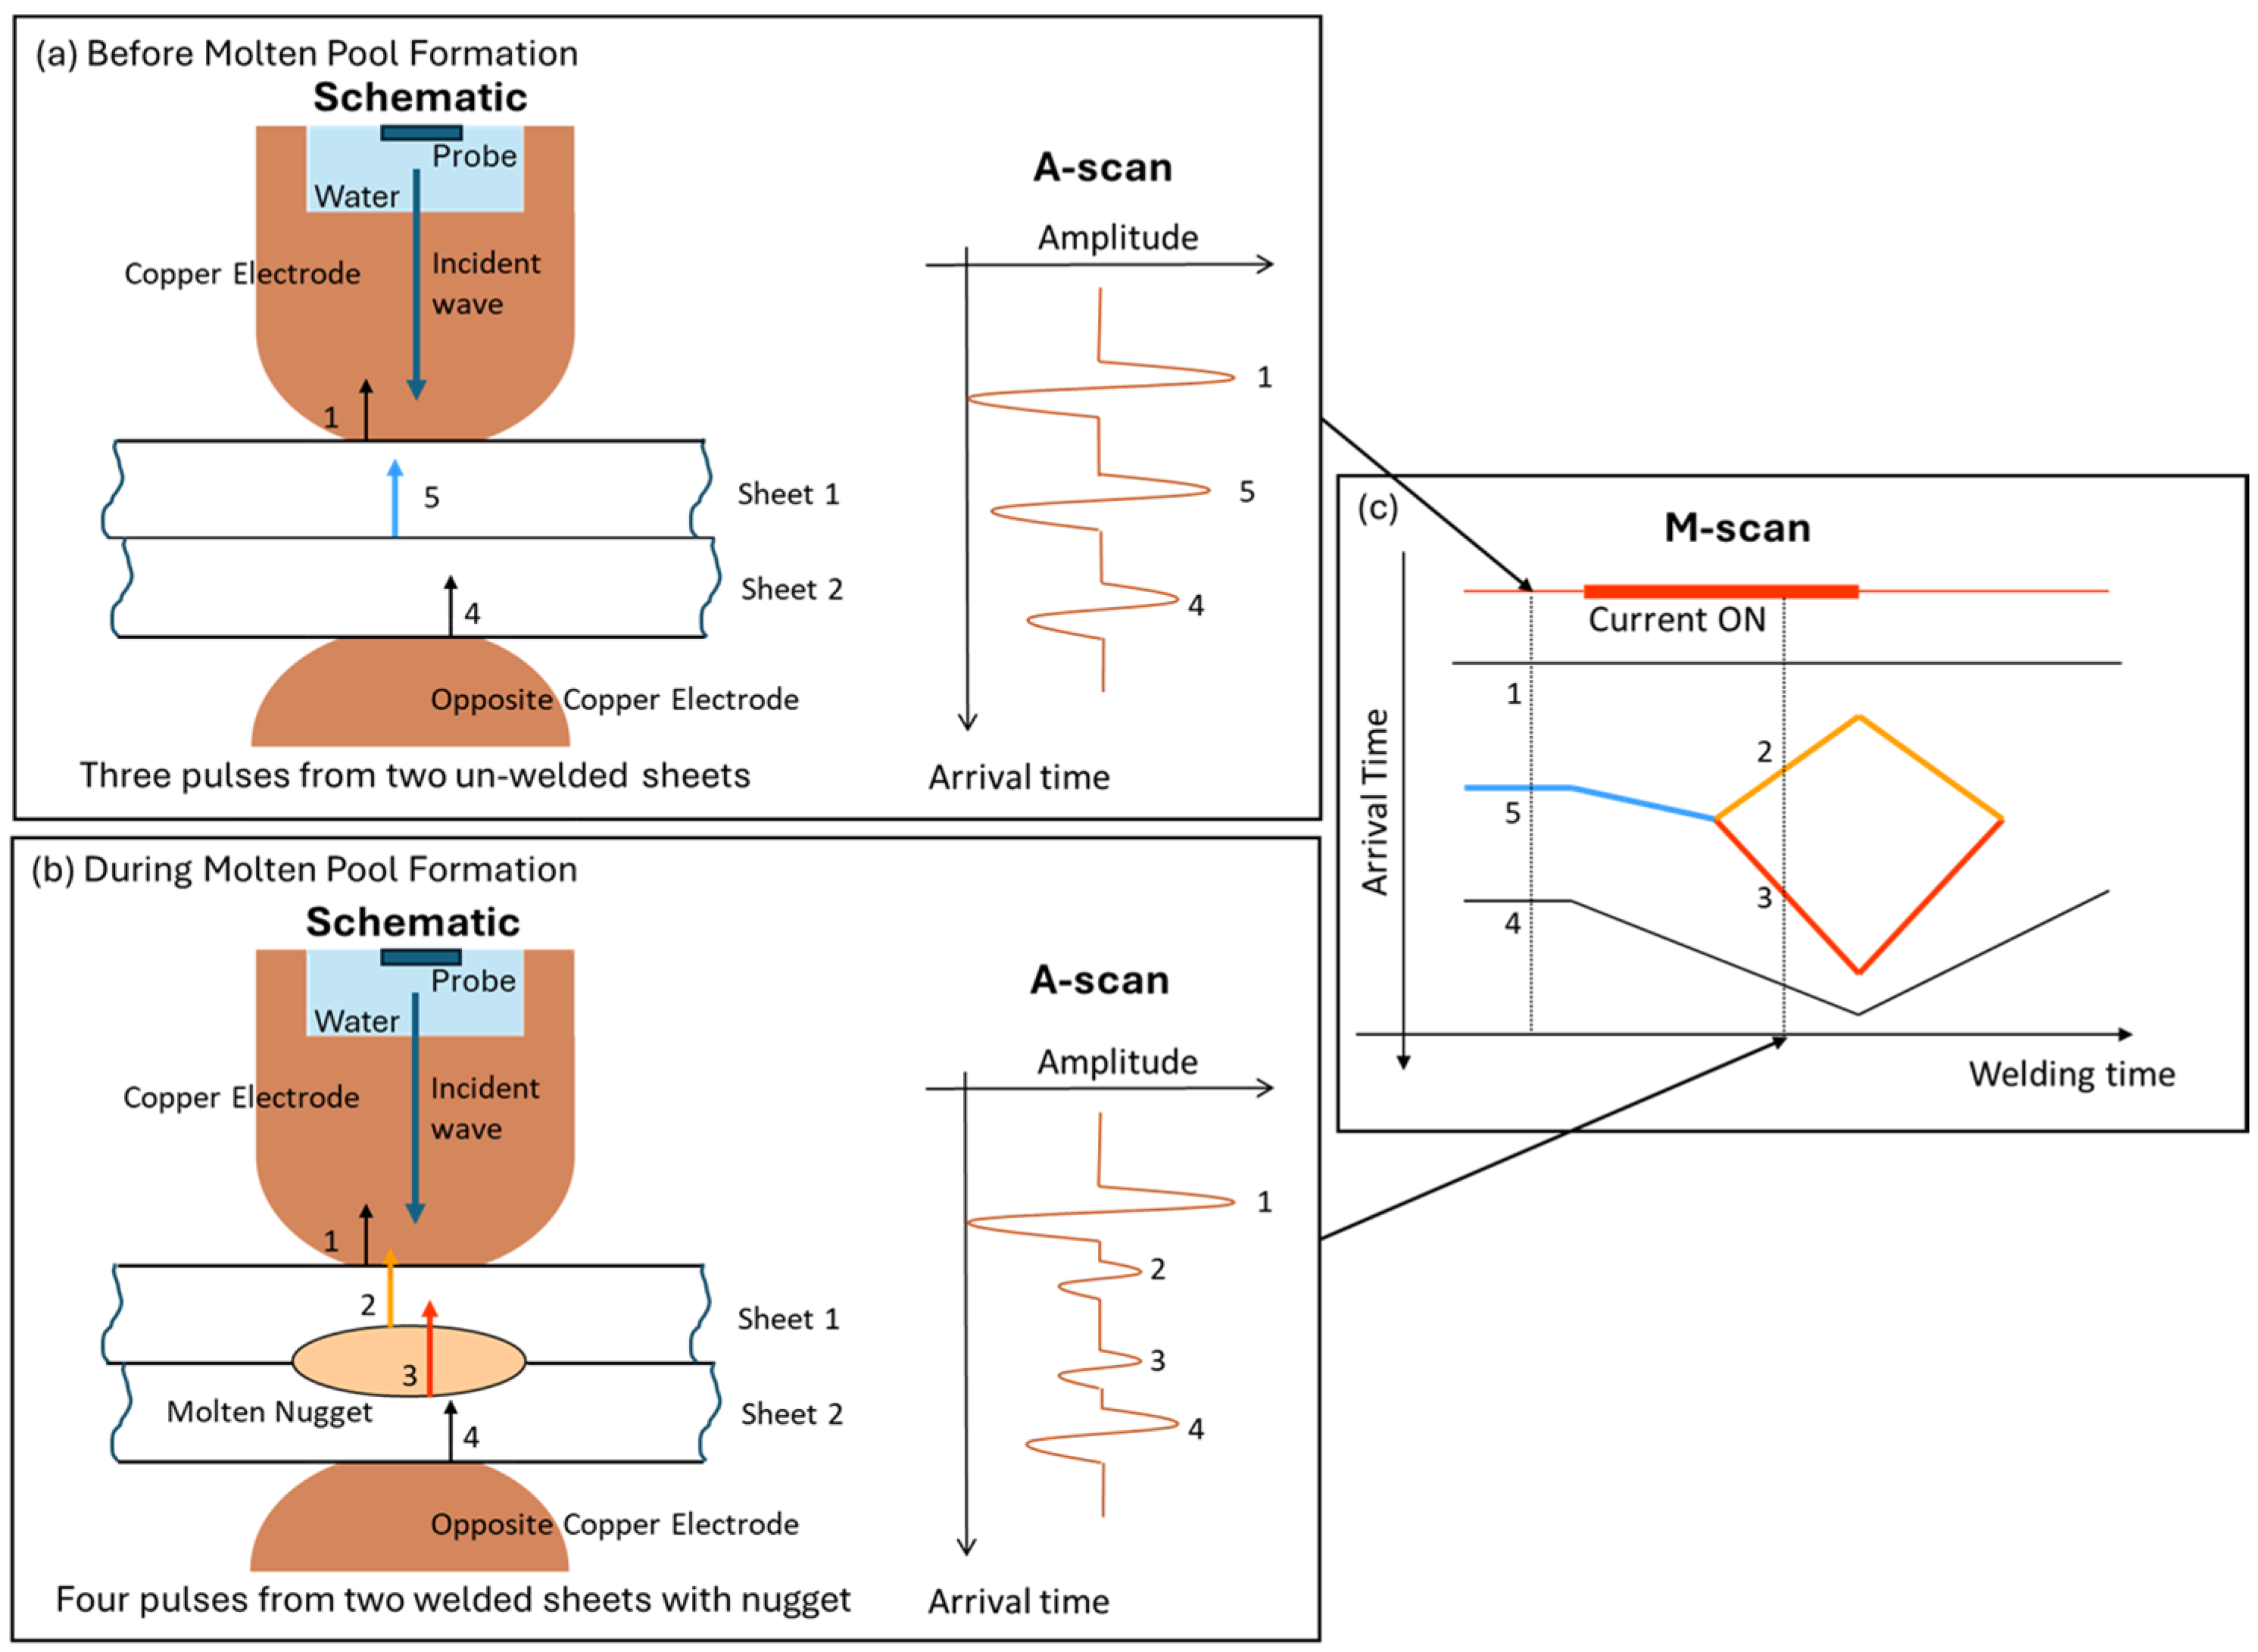
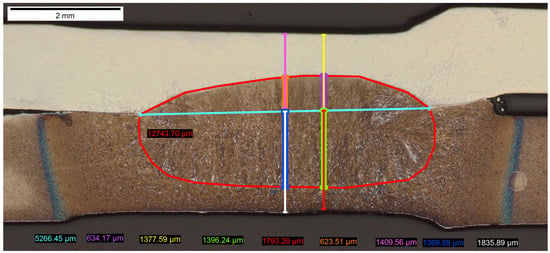
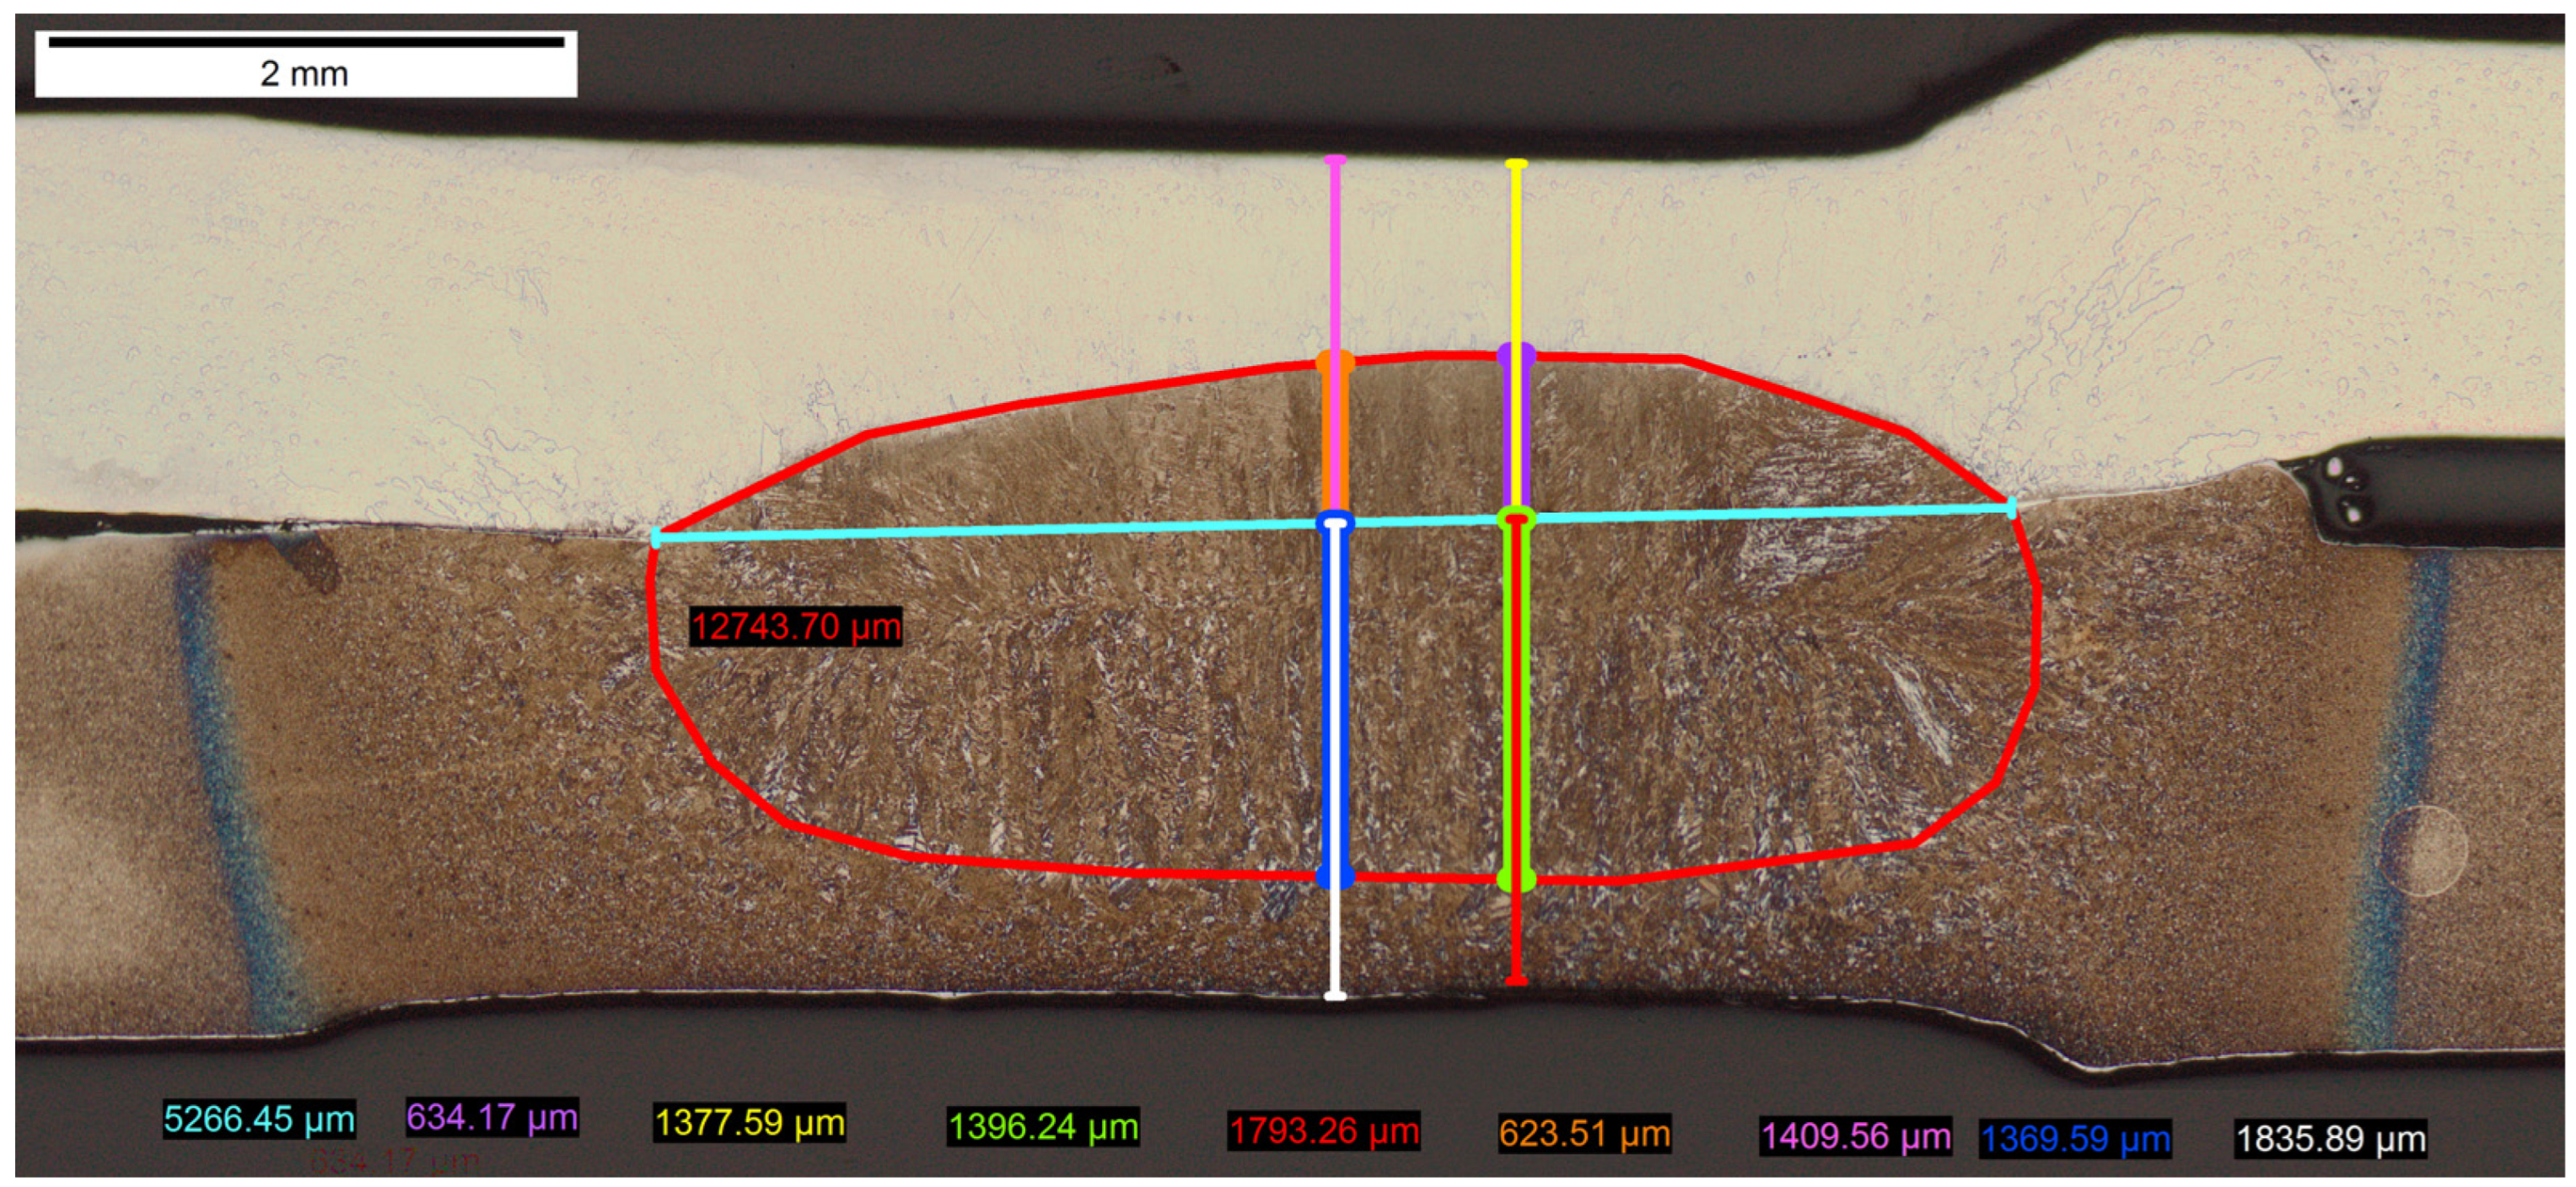
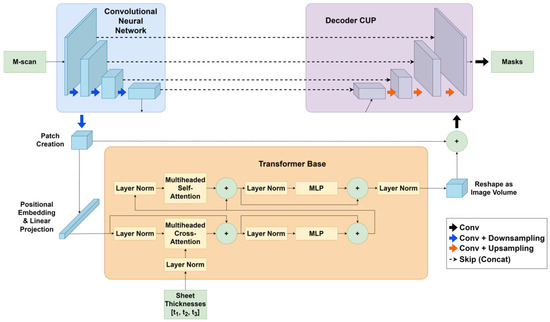
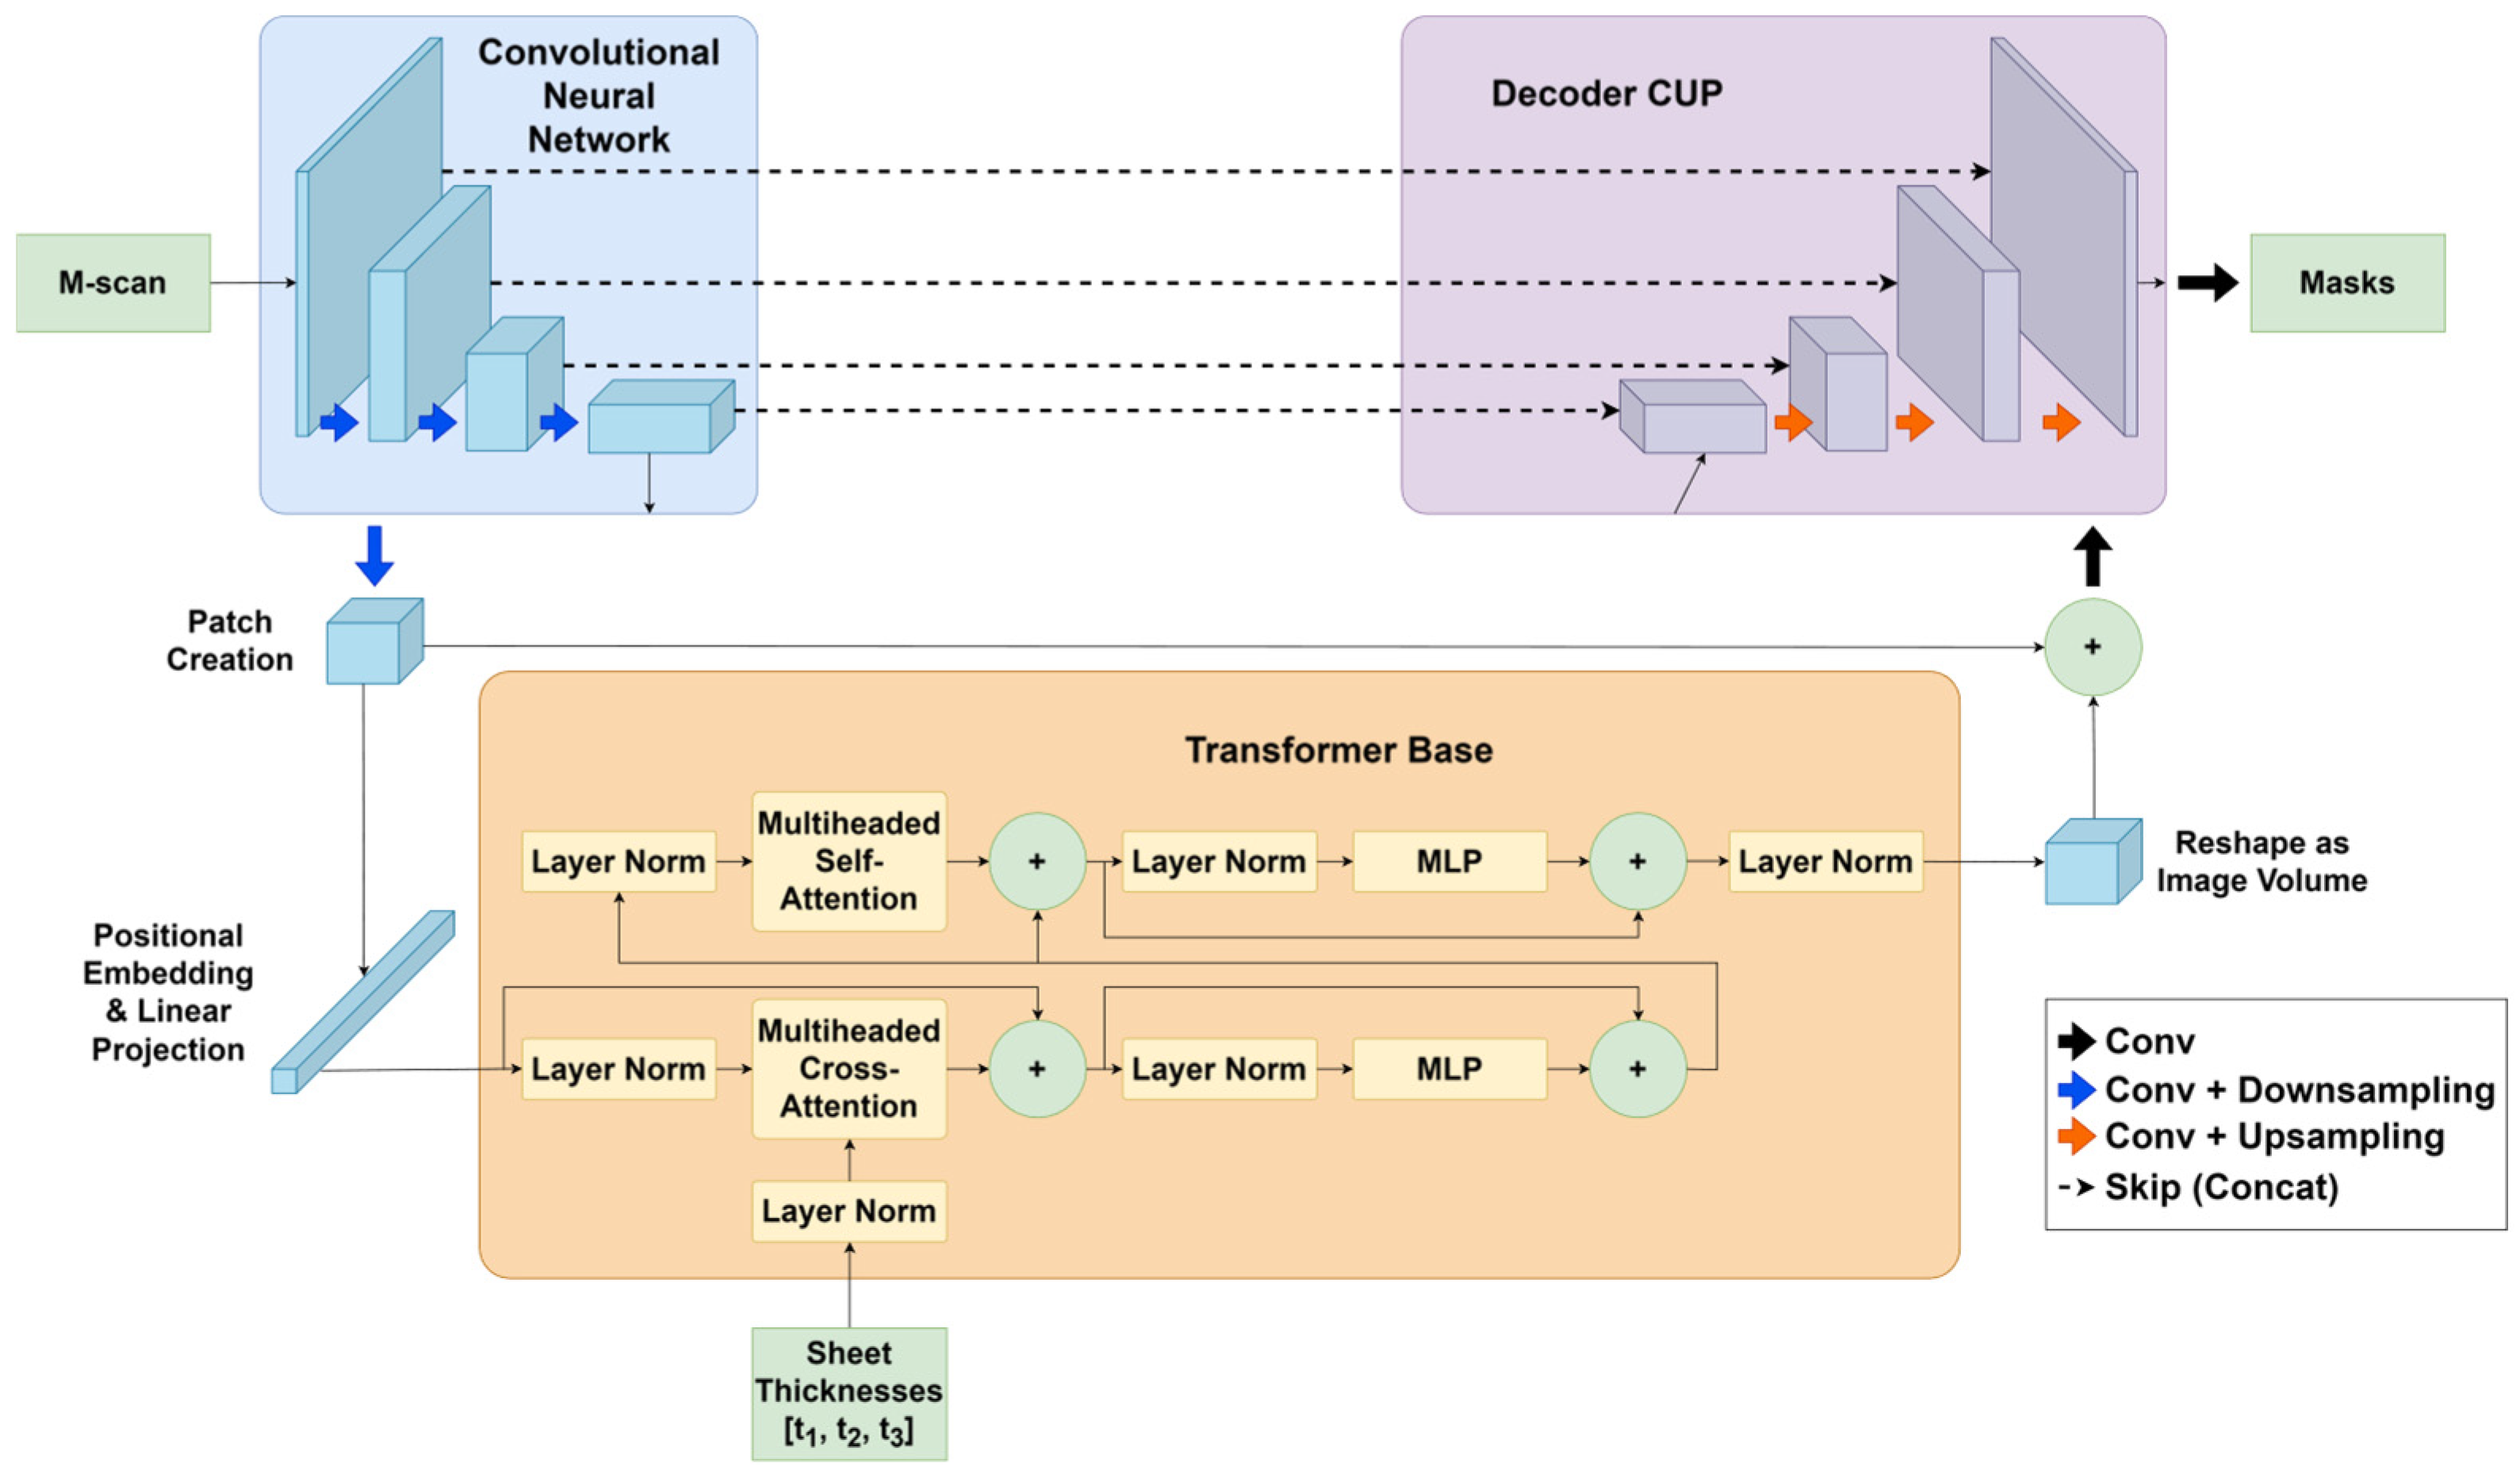
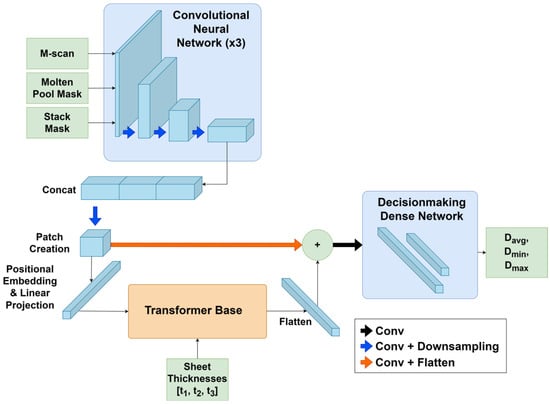
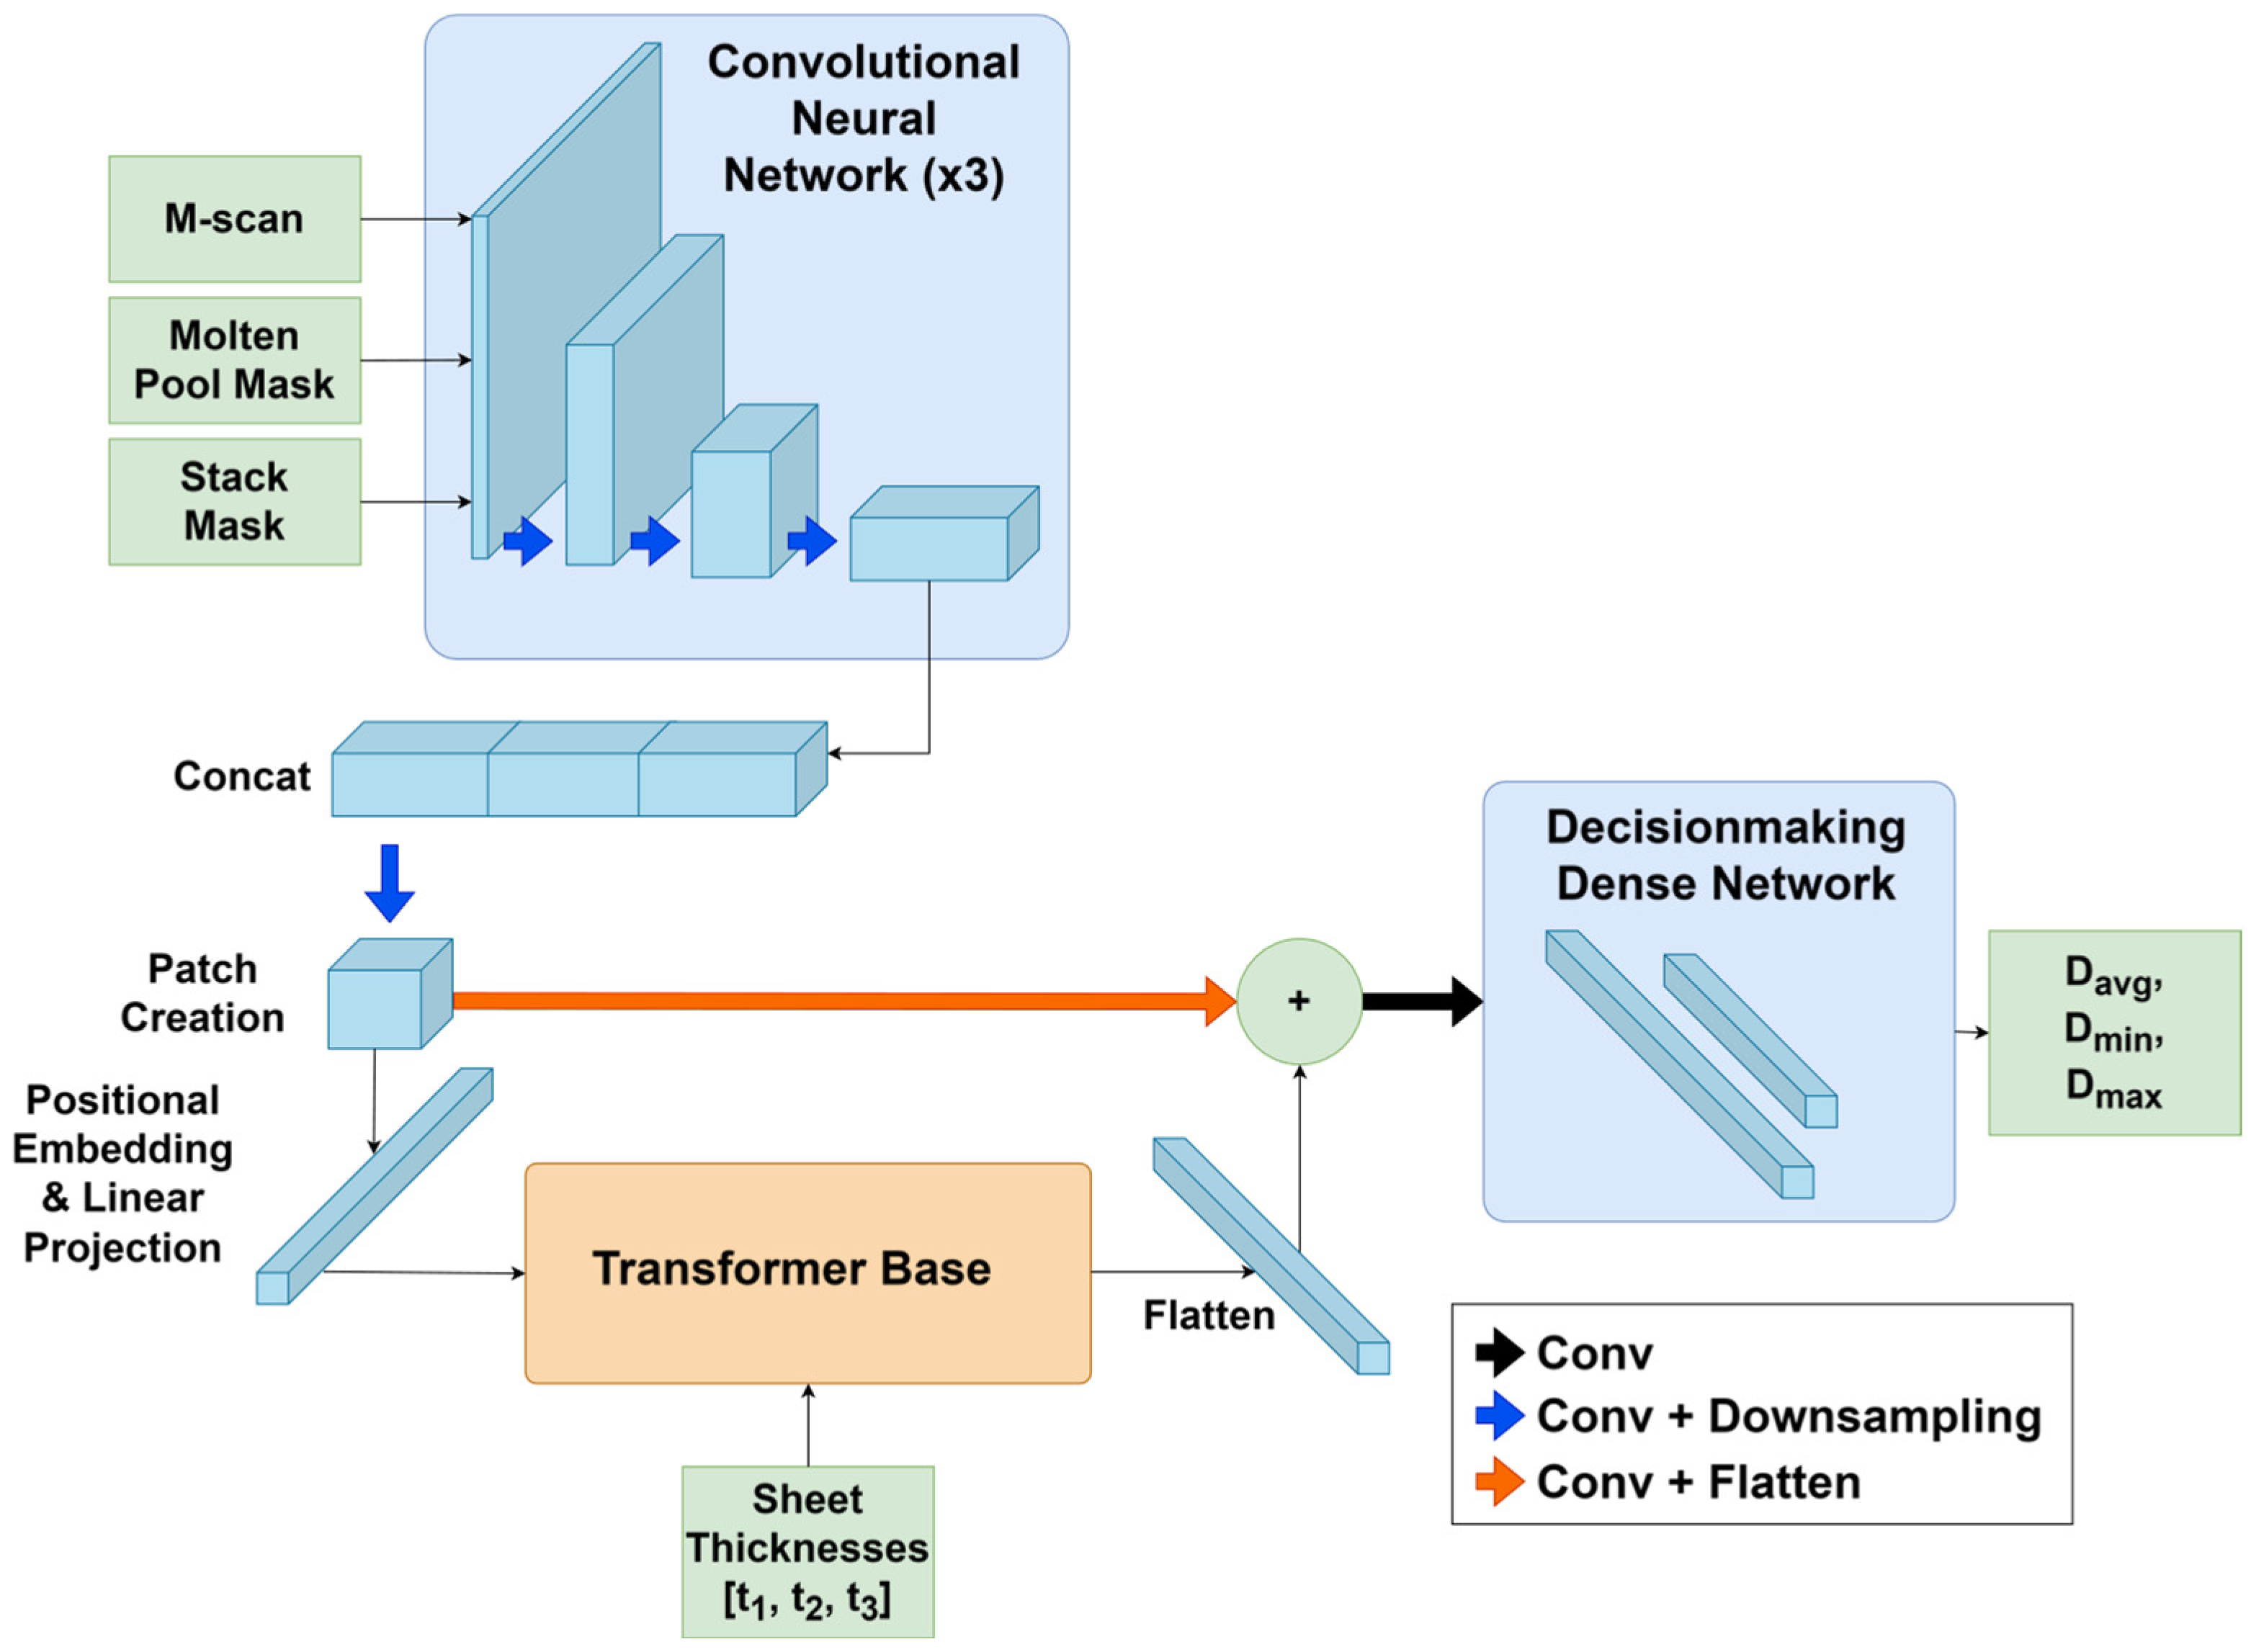
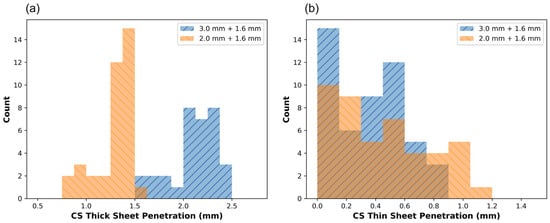
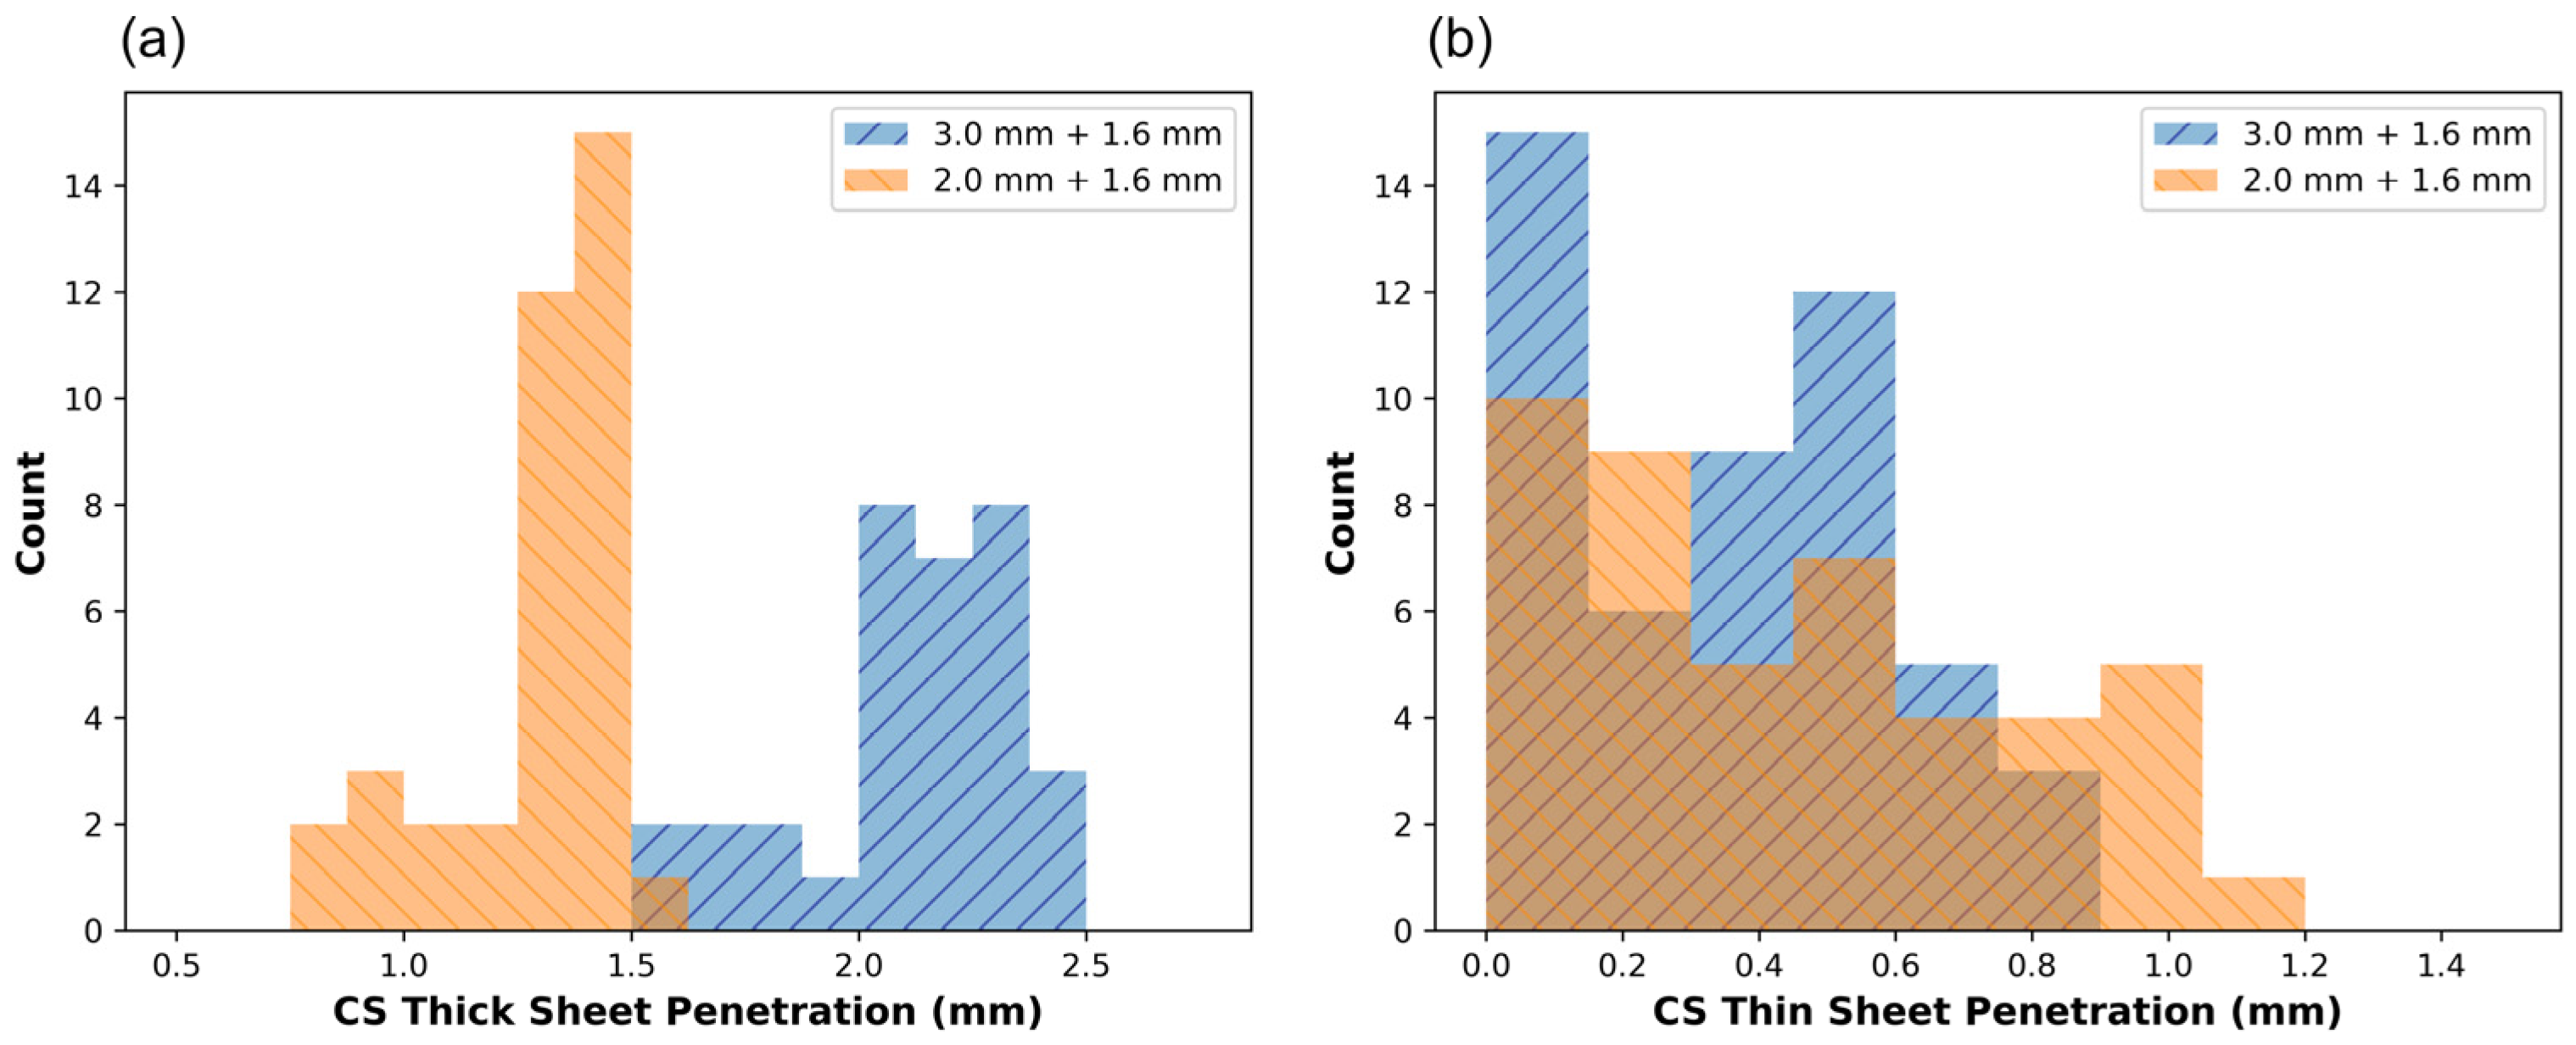
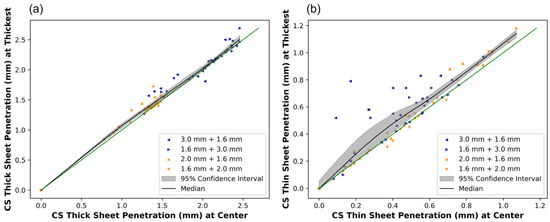
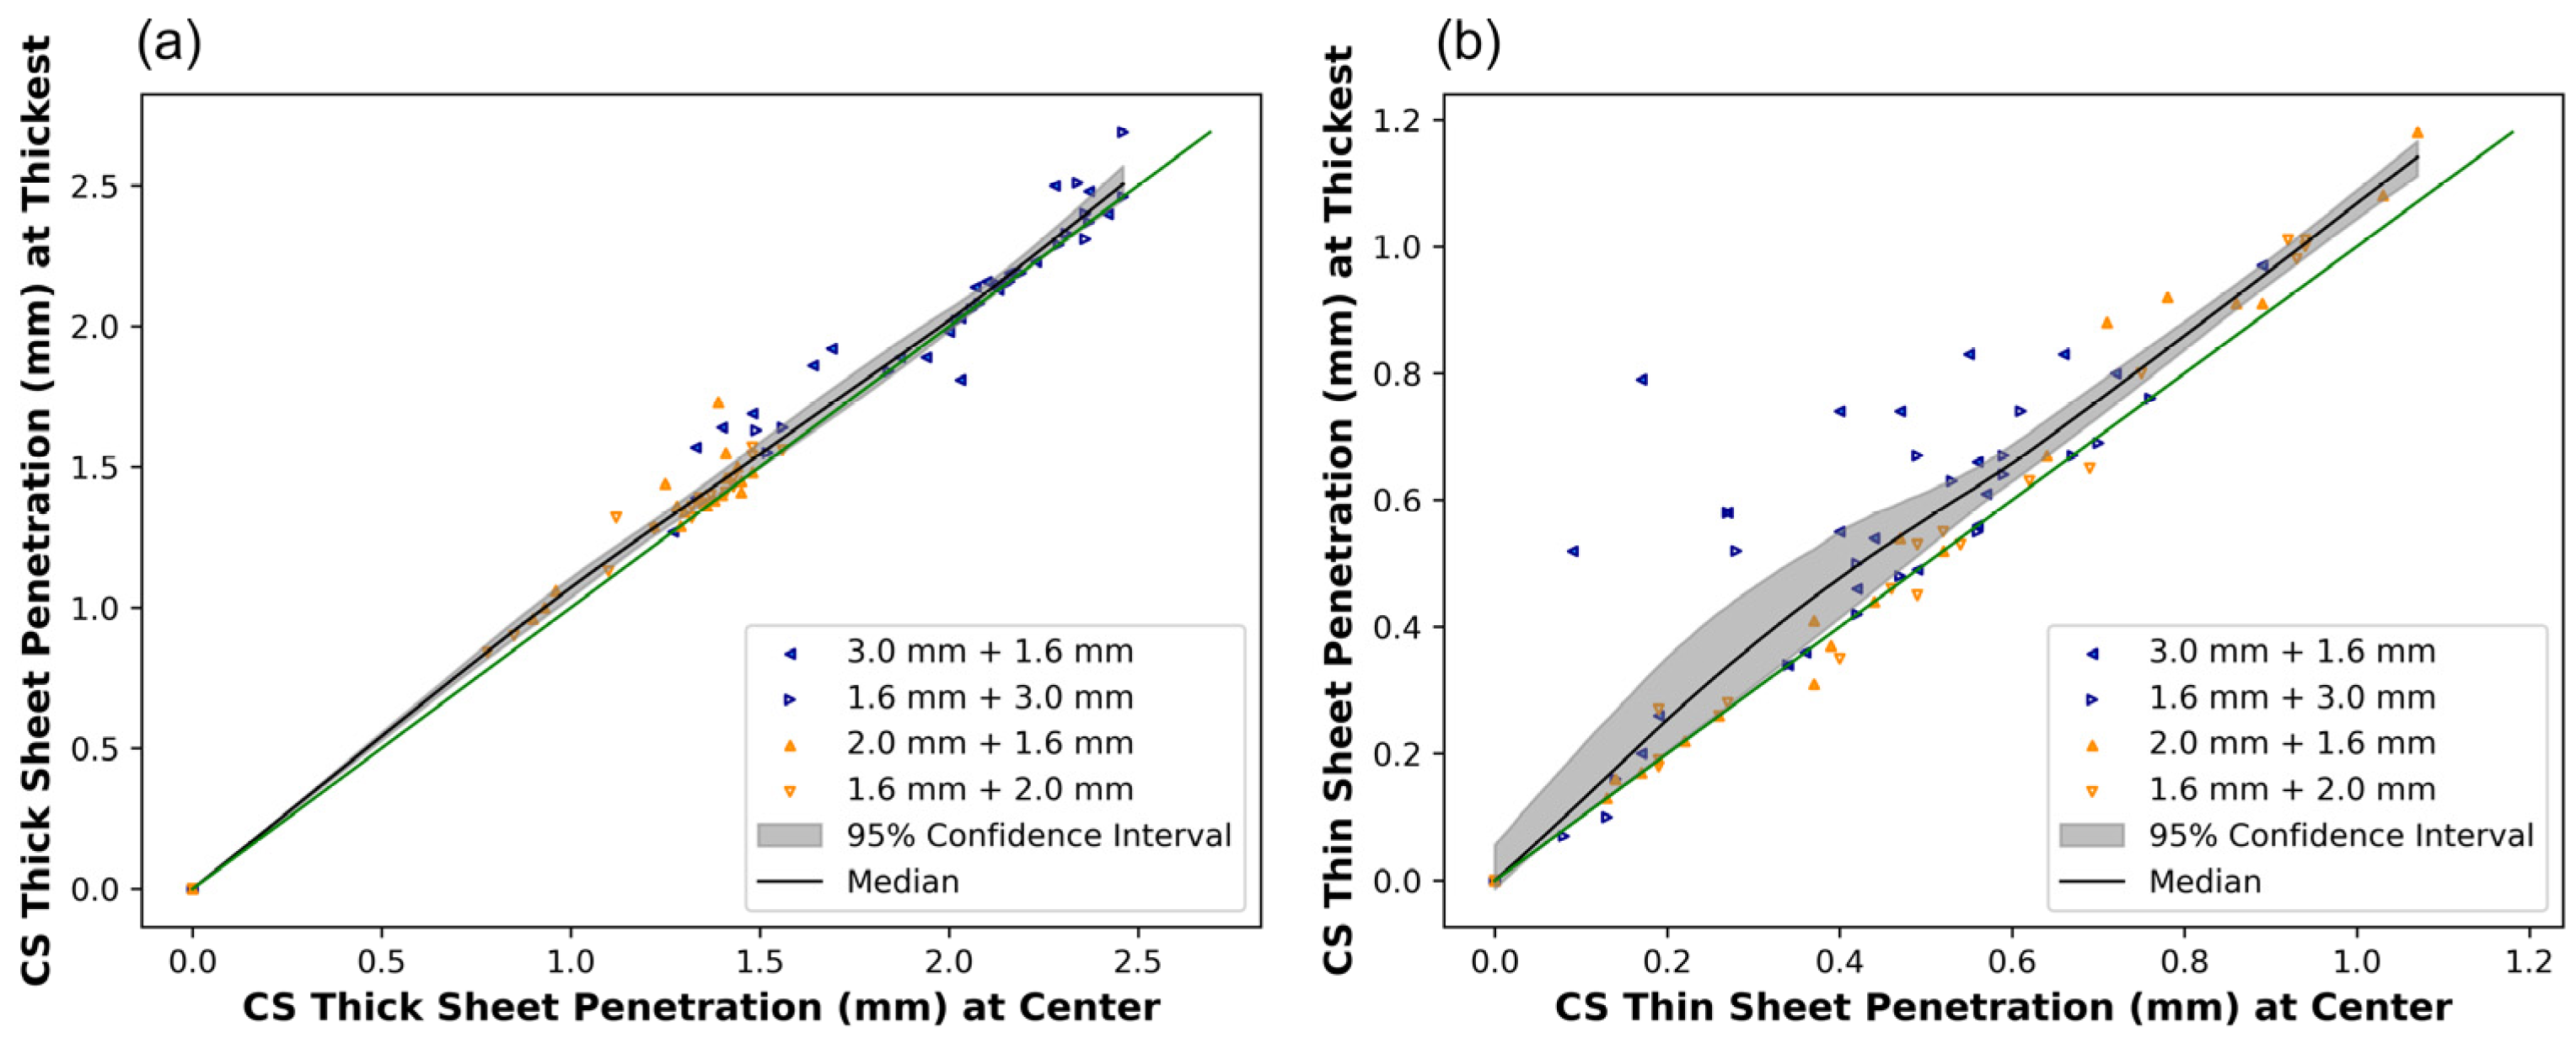
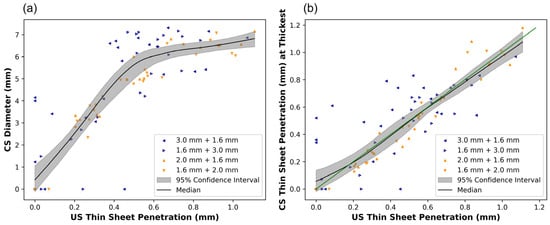
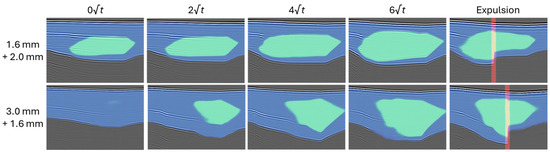
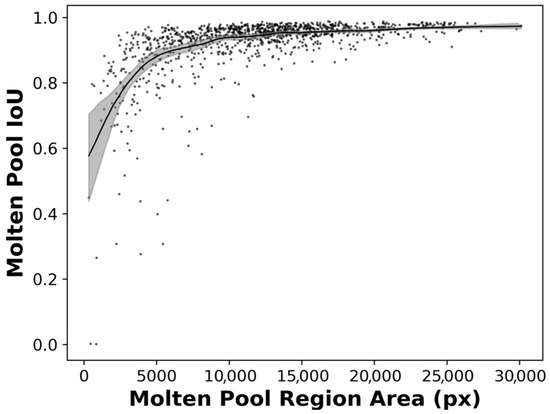
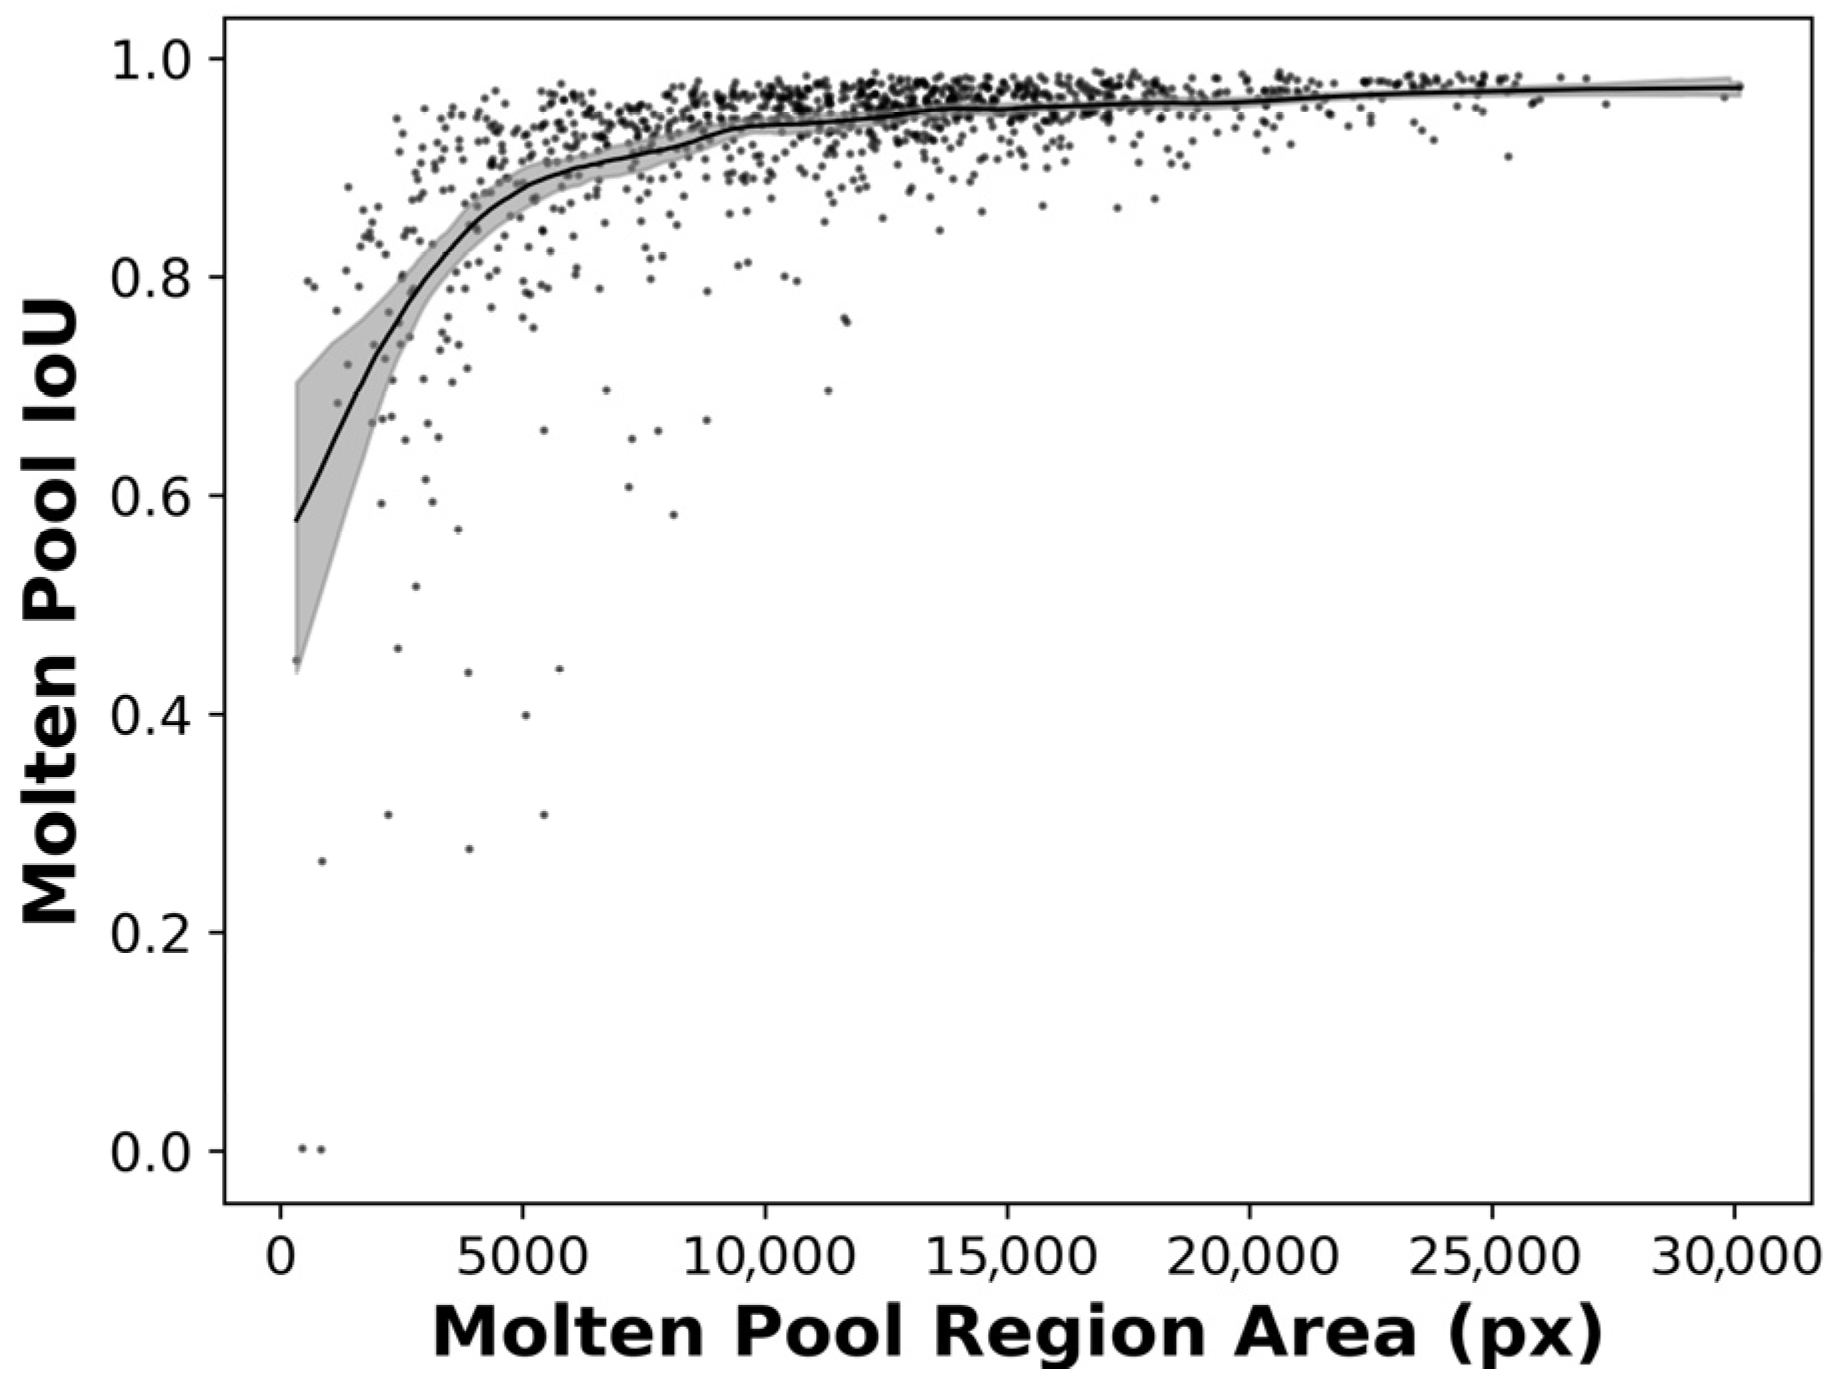
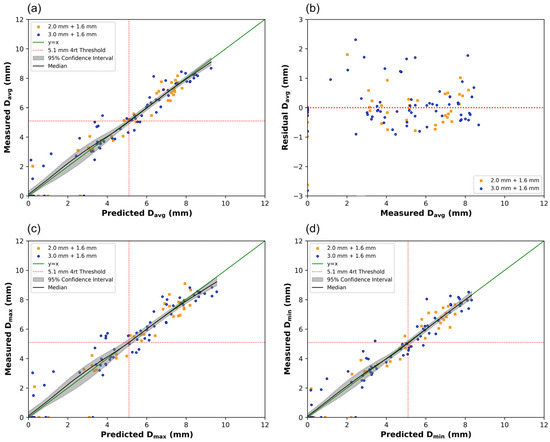
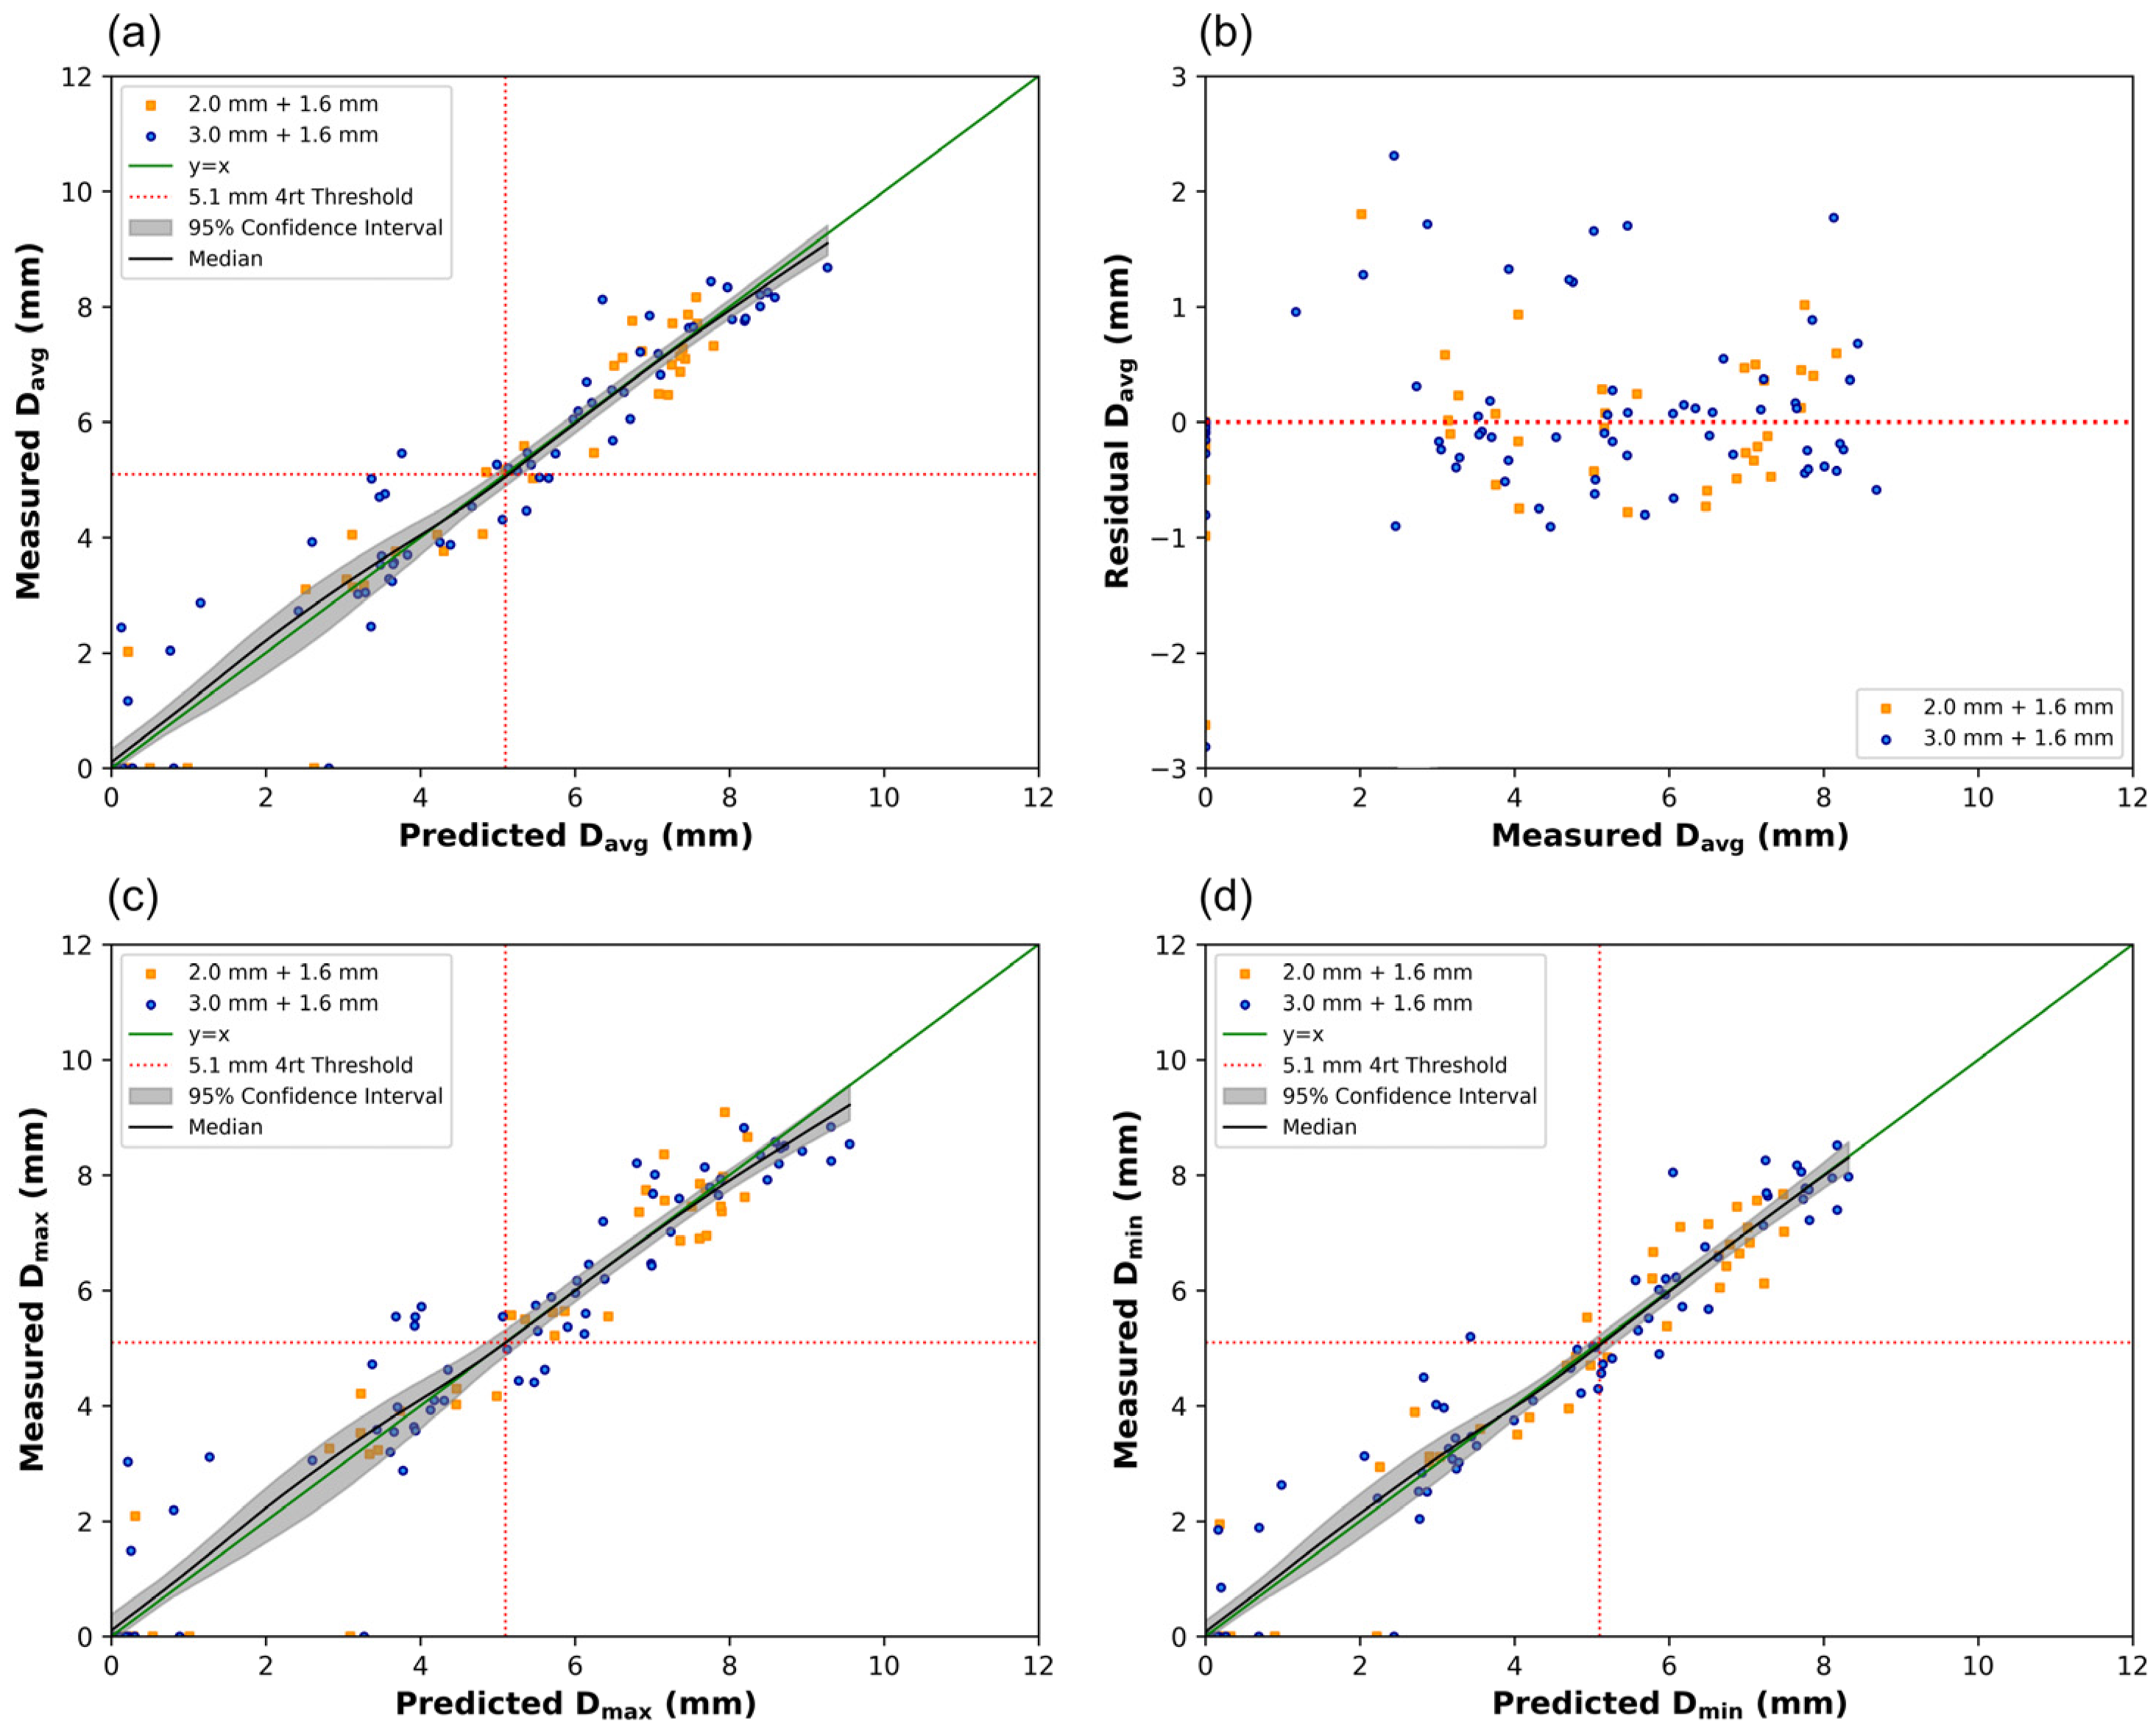
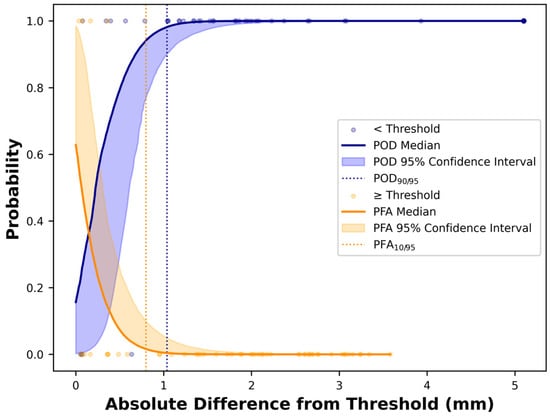
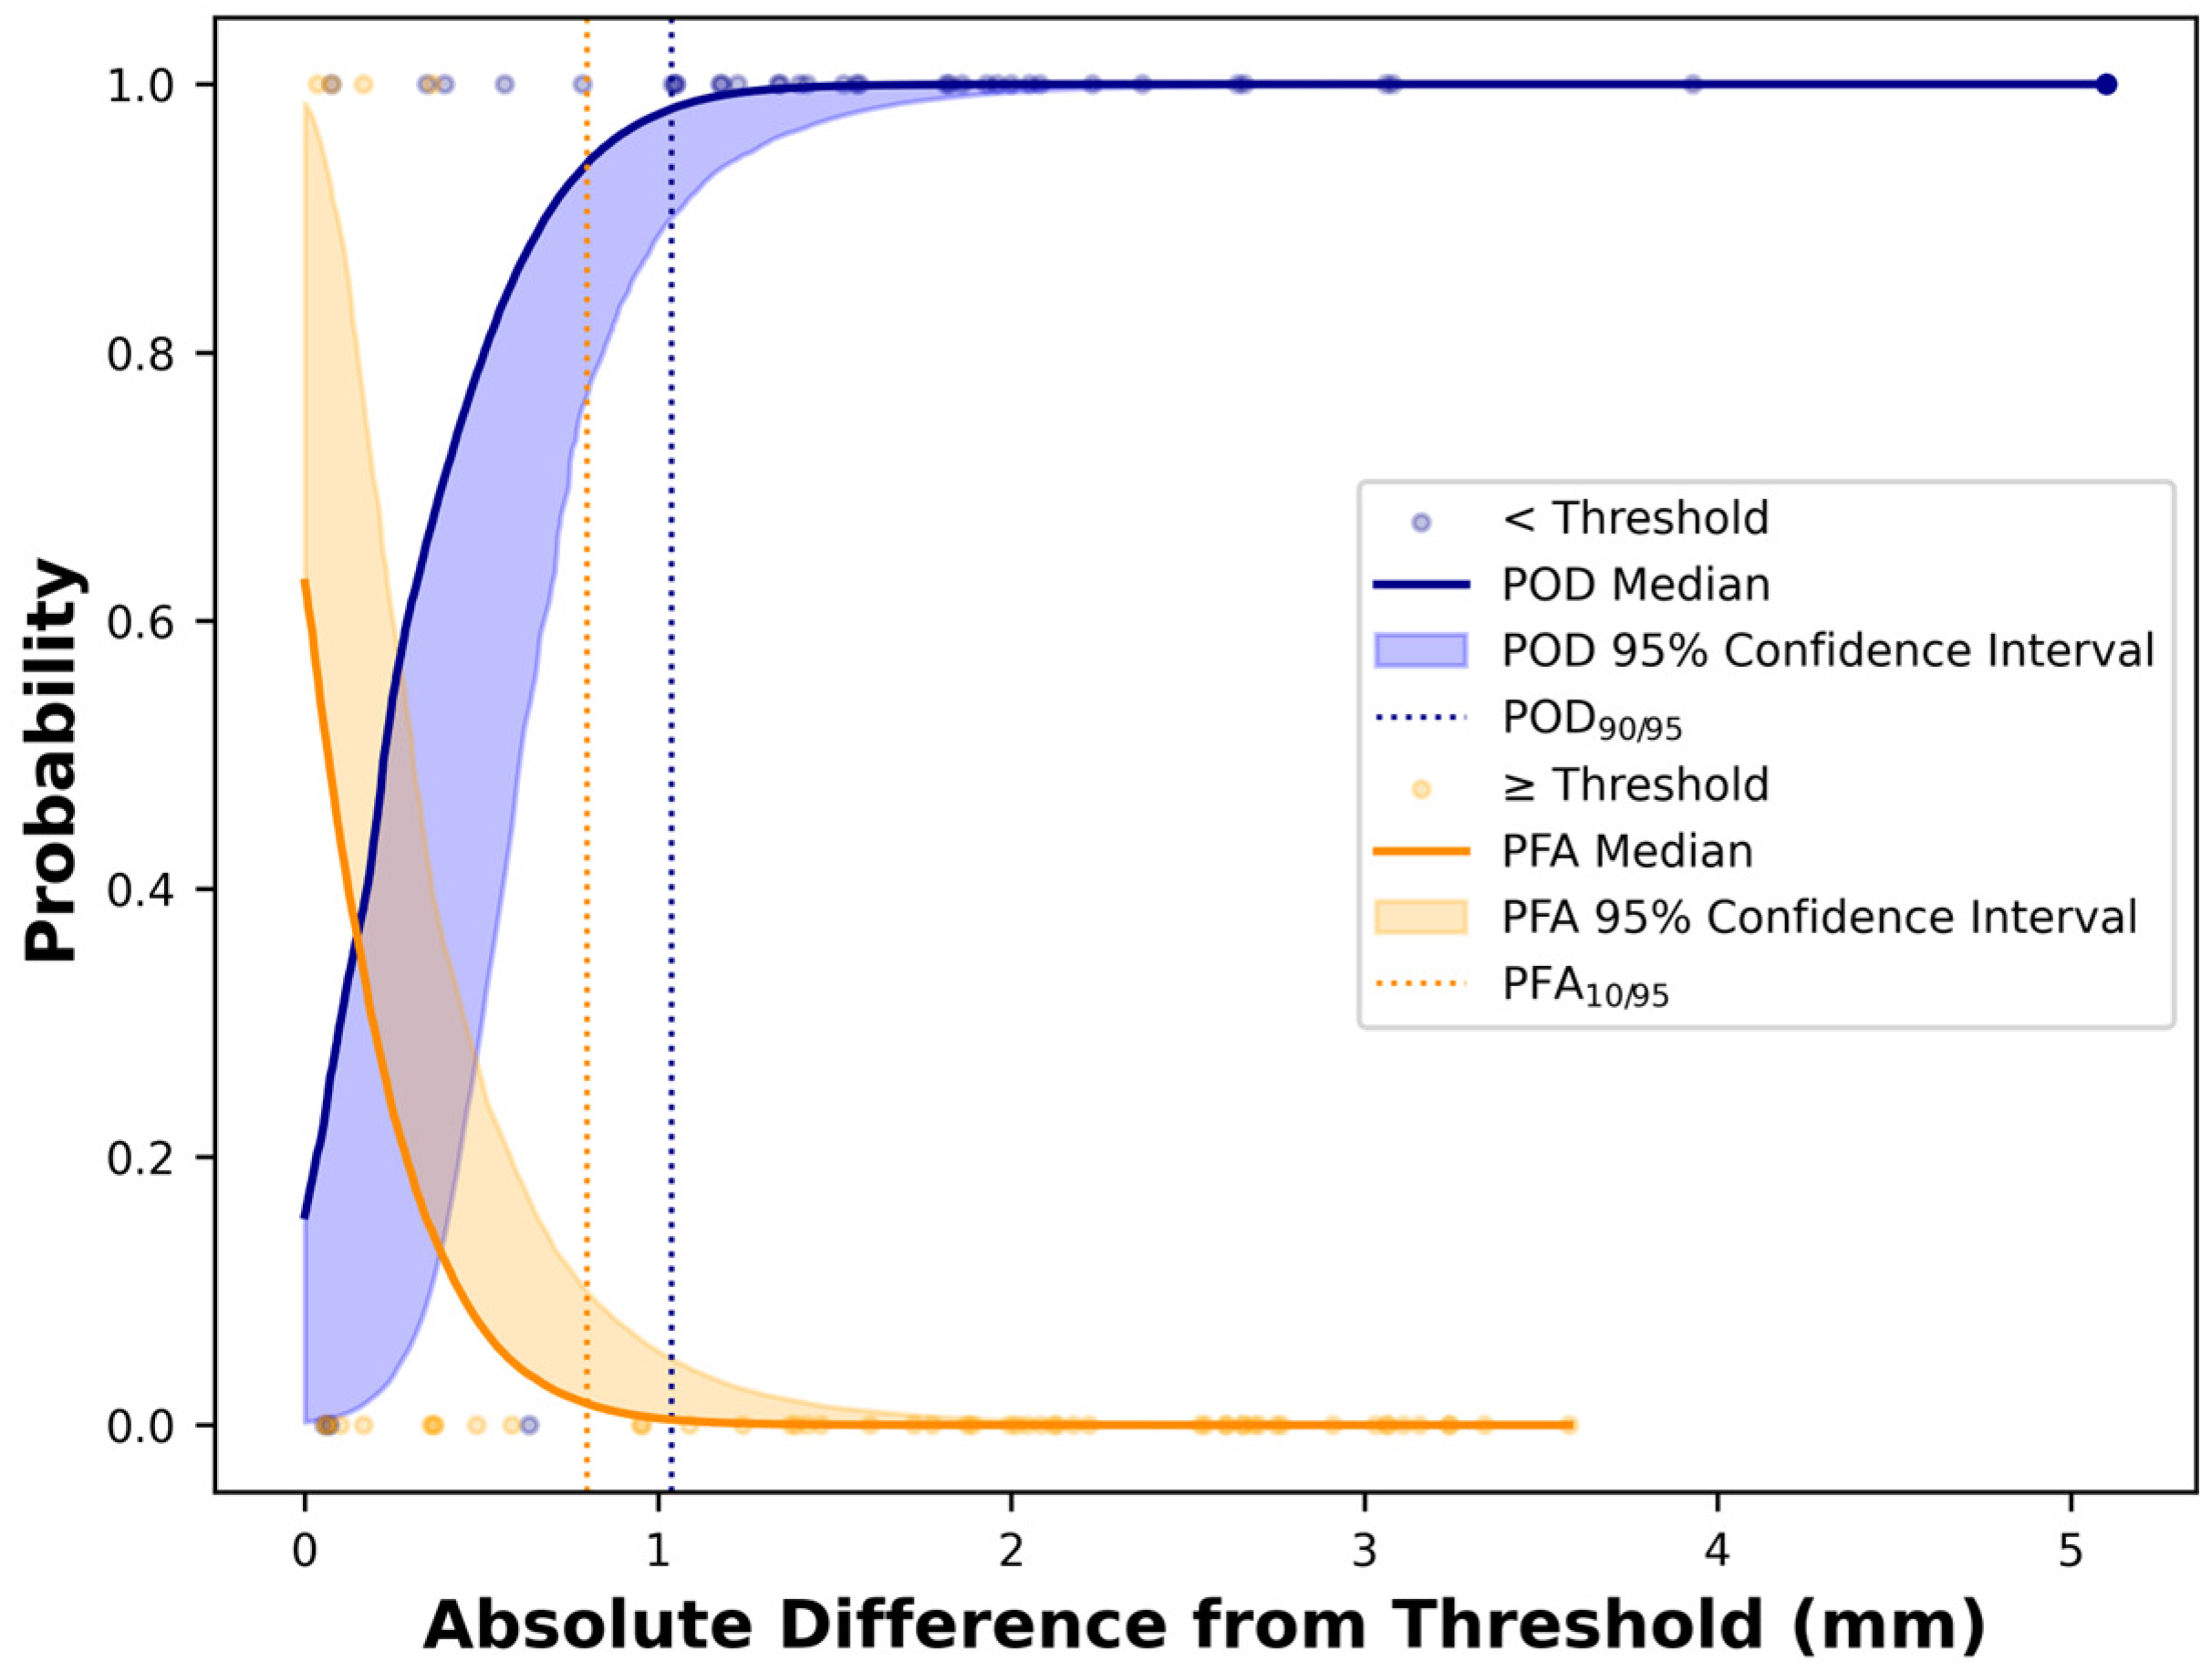

Disclaimer/Publisher’s Note: The statements, opinions and data contained in all publications are solely those of the individual author(s) and contributor(s) and not of MDPI and/or the editor(s). MDPI and/or the editor(s) disclaim responsibility for any injury to people or property resulting from any ideas, methods, instructions or products referred to in the content. |
© 2026 by the National Research Council of Canada and the authors. Submitted for possible open access publication under the terms and conditions of the Creative Commons Attribution (CC BY) license.