


Abstract
In this work, two distinct microstructural configurations were designed for wire arc additive manufacturing (WAAM) of 6061 Al alloy to elucidate the role of porosity in governing mechanical performance. The two samples exhibited contrasting porosity levels—an area fraction of 1.3% with an average pore size of 26.0 μm for one sample versus 3.4% and 29.8 μm for the other—while the low-porosity sample possessed coarser grains, higher dislocation density, and more densely distributed grain-boundary secondary phases, conventionally regarded as detrimental. Despite these unfavorable characteristics, the low-porosity sample had not only a higher ultimate tensile strength (183–190 MPa vs. 170–177 MPa) but also a substantially larger elongation (18.6–19.2% vs. 6.2–10.7%) and a drastically lower tensile anisotropy (3.2% vs. 42.1%). The elevated porosity of the high-porosity configuration introduced abundant stress concentration sites and provided preferential pathways for crack initiation and propagation, triggering premature fracture and severely curtailing the uniform plastic deformation stage. In contrast, the reduced porosity effectively suppressed crack nucleation, prolonged the uniform deformation stage, and fully compensated for the adverse effects of grain coarsening and secondary-phase coarsening. These results reveal a competing mechanism in as-deposited 6061 alloy, in which the ductility benefit of porosity suppression fully over-rides the classical detrimental effects of grain and secondary-phase coarsening, indicating that pore mitigation, rather than grain refinement, should be assigned the highest priority in the process optimization of WAAM Al alloys.
1. Introduction
Wire arc additive manufacturing (WAAM) has become one of the most promising techniques for fabricating large-scale and complex structural components owing to its high deposition rate, low cost, and high material utilization [1,2,3,4]. However, the rapid melting–solidification characteristics and complex thermal cycles inherent to the WAAM process lead to the formation of porosity defects, coarse columnar grains, element segregation, and severe mechanical anisotropy in Al alloys [2,5,6,7]. Among these issues, porosity has been regarded as one of the most critical defects that cause crack initiation, accelerate fracture failure, and sharply deteriorate ductility and service reliability.
A typical heat-treatable Al-Mg-Si alloy is 6061 alloy, which is widely used in aerospace, automotive, and transportation applications because of its balanced mechanical properties, good formability, and corrosion resistance [8,9,10,11,12]. Considerable efforts have been devoted to regulating the microstructure and mechanical properties of WAAM-fabricated 6061 alloy, primarily through post-deposition heat treatment, interlayer processing, and modified feedstock wires [13,14,15,16,17]. Among the available process variants, cold metal transfer (CMT) is currently the dominant arc mode for WAAM of aluminum alloys because of its low and stable heat input, controlled droplet transfer, and reduced spatter [18,19]. Recent process optimization studies have systematically examined how the wire feeding speed, welding speed, interlayer cooling time and other parameters affect the grain morphology, solidification texture, and secondary-phase distribution in the WAAM of Al alloys [19,20,21,22]. For example, Lekkala et al. [22] demonstrated that the wire feed rate was the dominant parameter influencing bead geometry, through a direct proportional relationship. Welding speed was the second most influential parameter. The resulting optimal settings were 8 m/min for wire delivery rate, 0.3 m/min for travel velocity, and 16 V for arc potential. Beyond the as-deposited state, secondary microstructural regulation routes, including longitudinal magnetic field assistance [20], interlayer coating with rare-earth or ceramic particles [21,23], and post-deposition friction stir processing [24], have been shown to refine grains, modify texture, and improve mechanical performance but at the cost of additional process complexity, modified feedstock, or extra equipment.
Porosity is widely recognized as the critical defect governing the mechanical performance of WAAM-fabricated aluminum alloys, particularly ductility and fatigue life [2,5,6,7]. A recent comprehensive review [25] classified porosity in wire arc DED Al alloys into three principal categories—hydrogen-induced gas pores, shrinkage cavities, and pores originating from elemental volatilization—with hydrogen-induced gas pores being the main type. Process parameters, such as wire surface condition, shielding gas flow, arc mode, and other factors, have all been shown to modulate the porosity level [25,26,27]. For example, Arana et al. [27] demonstrated that porosity can be reduced to below 0.035% of the area of Al-Mg samples manufactured by CMT-based WAAM with commercial filler metal wires by selecting the correct shielding gas (Ar + O2 + N2O mixtures) and deposition strategy (hatching).
Although the individual effects of porosity, grain size, and secondary-phase particles on the mechanical properties of WAAM-fabricated aluminum alloys have been widely documented, the interplay among these features under systematically varied heat input has not been quantitatively established. In particular, it remains unresolved whether the ductility gain achieved by suppressing porosity can compensate for the concurrent coarsening of grains and intergranular secondary phases [24,28,29,30,31].
In this work, two sets of wire feeding speed/welding speed were selected to fabricate 6061 alloy via WAAM. The microstructural features, especially the morphology, size and distribution of grains and secondary phases, of two samples were systematically investigated. Furthermore, the correlation between porosity and mechanical properties, particularly strength–plasticity synergy, was clarified. The mechanism underlying the distinct plasticity differences in WAAM-fabricated 6061 alloys with similar strengths was revealed. This study aims to provide a fundamental understanding and feasible process strategy for optimizing the microstructure and mechanical performance of WAAM-fabricated 6061 alloy.
2. Experimental Methods
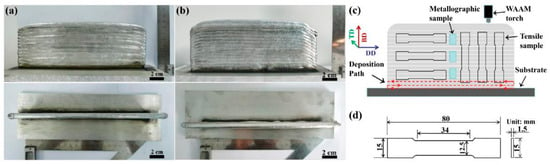
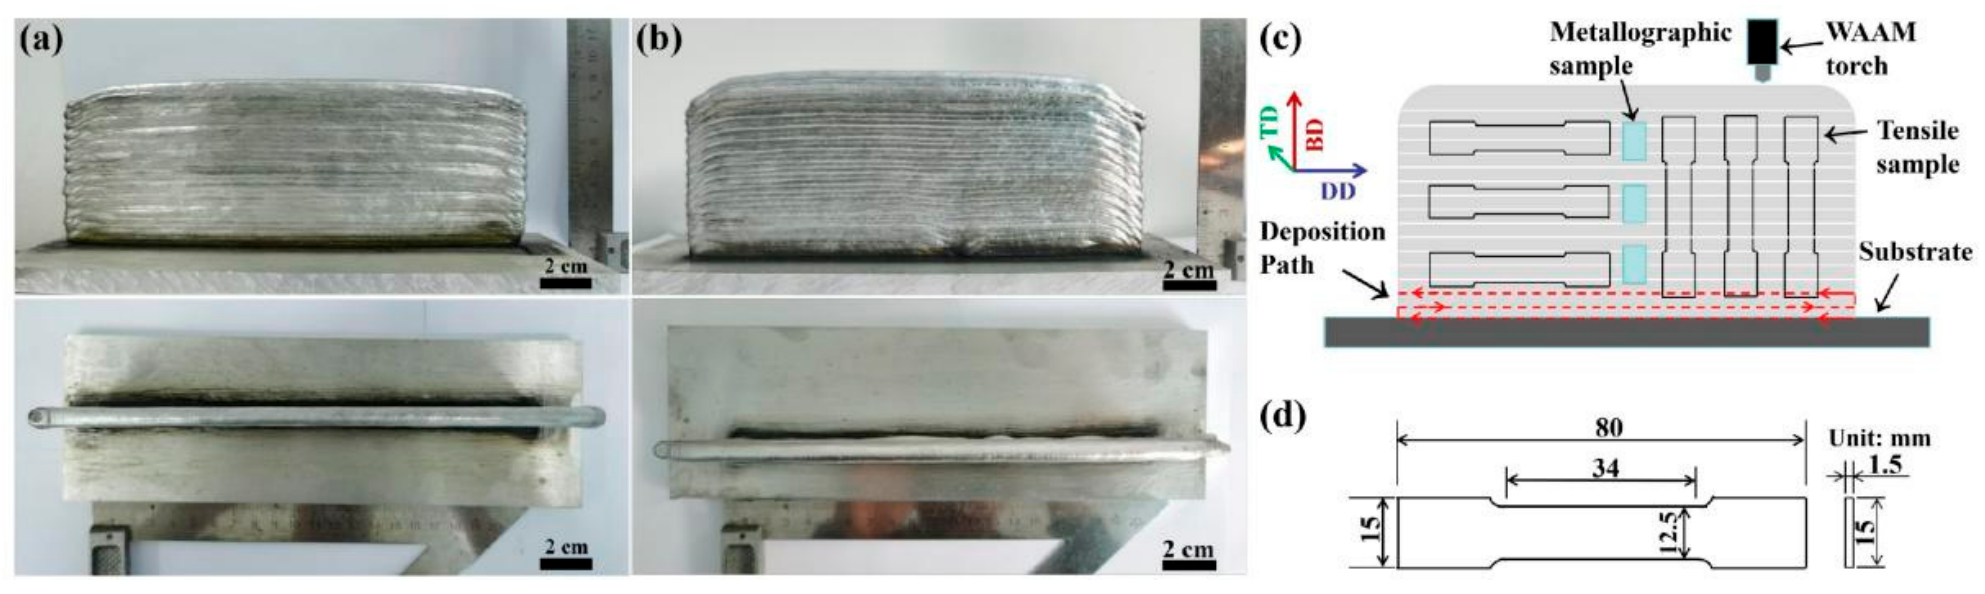
In this experiment, 6061 Al alloy welding wire with a diameter of 1.2 mm and an Al alloy welding substrate (250 mm × 80 mm × 10 mm) were adopted. The chemical composition of the welding wire is shown in Table 1. The wire arc additive manufacturing system was mainly composed of an ArcMan P1800 manufacturing unit (Nanjing Enigma Automation Co., Ltd., Nanjing, China), a Fronius TPS 4000 CMT Adv welding machine (Fronius International GmbH, Wels, Austria) and an ABB IRB 4600-40/2.55 six-axis industrial robot (ABB Robotics, Västerås, Sweden). The integrated welding forming mode was selected, with an interlayer cooling time of 90 s. Different wire feeding speeds (6 m/min and 7 m/min) and welding speeds (8 mm/s and 9 mm/s) were set to obtain the optimal microstructure (as summarized in Table S1), and 99.99% pure argon was used as the shielding gas with a flow rate of 20 L/min. The sample with a wire feeding speed of 6 m/min and a welding speed of 8 mm/s is labeled as sample 6/8. The sample with a wire feeding speed of 7 m/min and a welding speed of 9 mm/s is labeled as sample 7/9. Figure 1a,b show the photographs of the as-deposited 6/8 and 7/9 samples, respectively, showing the surface morphology and overall geometry of the deposited walls. Figure 1c is the schematic of the WAAM system and the deposition path, together with the build direction (BD), deposition direction (DD), and transverse direction (TD). After deposition, cubic metallographic samples (15 mm × 10 mm × 7 mm, Figure 1c) and tensile samples along the BD and DD (total length of 80 mm, gauge length of 34 mm, width of 15 mm, thickness of 1.5 mm, Figure 1d) were cut from the upper, middle and lower regions by wire cutting. After grinding and polishing with sandpaper, the metallographic samples were etched with Keller’s reagent, and their microstructures were observed under an optical microscope (OM, Zeiss Axio Imager A2m, Carl Zeiss Microscopy Deutschland GmbH, Göttingen, Germany) and a scanning electron microscope (SEM, FEI-XL30, FEI Company, Eindhoven, The Netherlands). Tensile tests along the BD and DD were carried out on a Shimadzu AG-I100 KN testing machine (equipped with an extensometer, Shimadzu Corporation, Kyoto, Japan) at a strain rate of 10−3 s−1, and parallel samples were taken from the upper, middle and lower regions for each group. The porosity was quantified by the OM images taken from the BD–TD planes of the top, middle and bottom layers of the samples. For each area, at least 3 OM micrographs were acquired (100×) for analysis. The black circular holes in the OM image were identified as pores and were segmented by gray-level thresholding using Adobe Photoshop CS6 13.0. The porosity was calculated as the total pore area divided by the total analysis area. The density of the WAAM-fabricated walls’ stable-state section was measured using the Archimedes drainage method according to the GB/T 3850-2015 standard [32], and the theoretical density of the material was taken as 2.70 g/cm3. Phase identification (powder) was performed using a Rigaku D/Max 2500 PC diffractometer (Rigaku Corporation, Tokyo, Japan) with Cu-Kα radiation, a scanning range of 20–90° and a scanning speed of 1°·min−1. Electron backscatter diffraction (EBSD) analysis was conducted on an FEI Nova400 SEM (FEI Company, Hillsboro, OR, USA) with a step size of 2.5 μm, and the data were processed with CHANNEL5.0 software. Transmission electron microscopy (TEM) observations were performed on a JEOL JEM-2100F transmission electron microscope (JEOL Ltd., Tokyo, Japan).
Table 1.
Chemical composition of 6061 Al alloy wire and substrate (wt.%).
Figure 1.
(a,b) Photographs of samples 6/8 (a) and 7/9 (b), showing surface morphology and overall geometry of deposited walls; (c) schematic of WAAM process; (d) schematic drawing of tensile specimen with dimensions.
3. Results
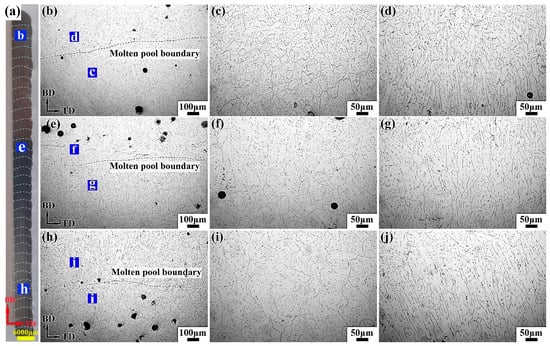
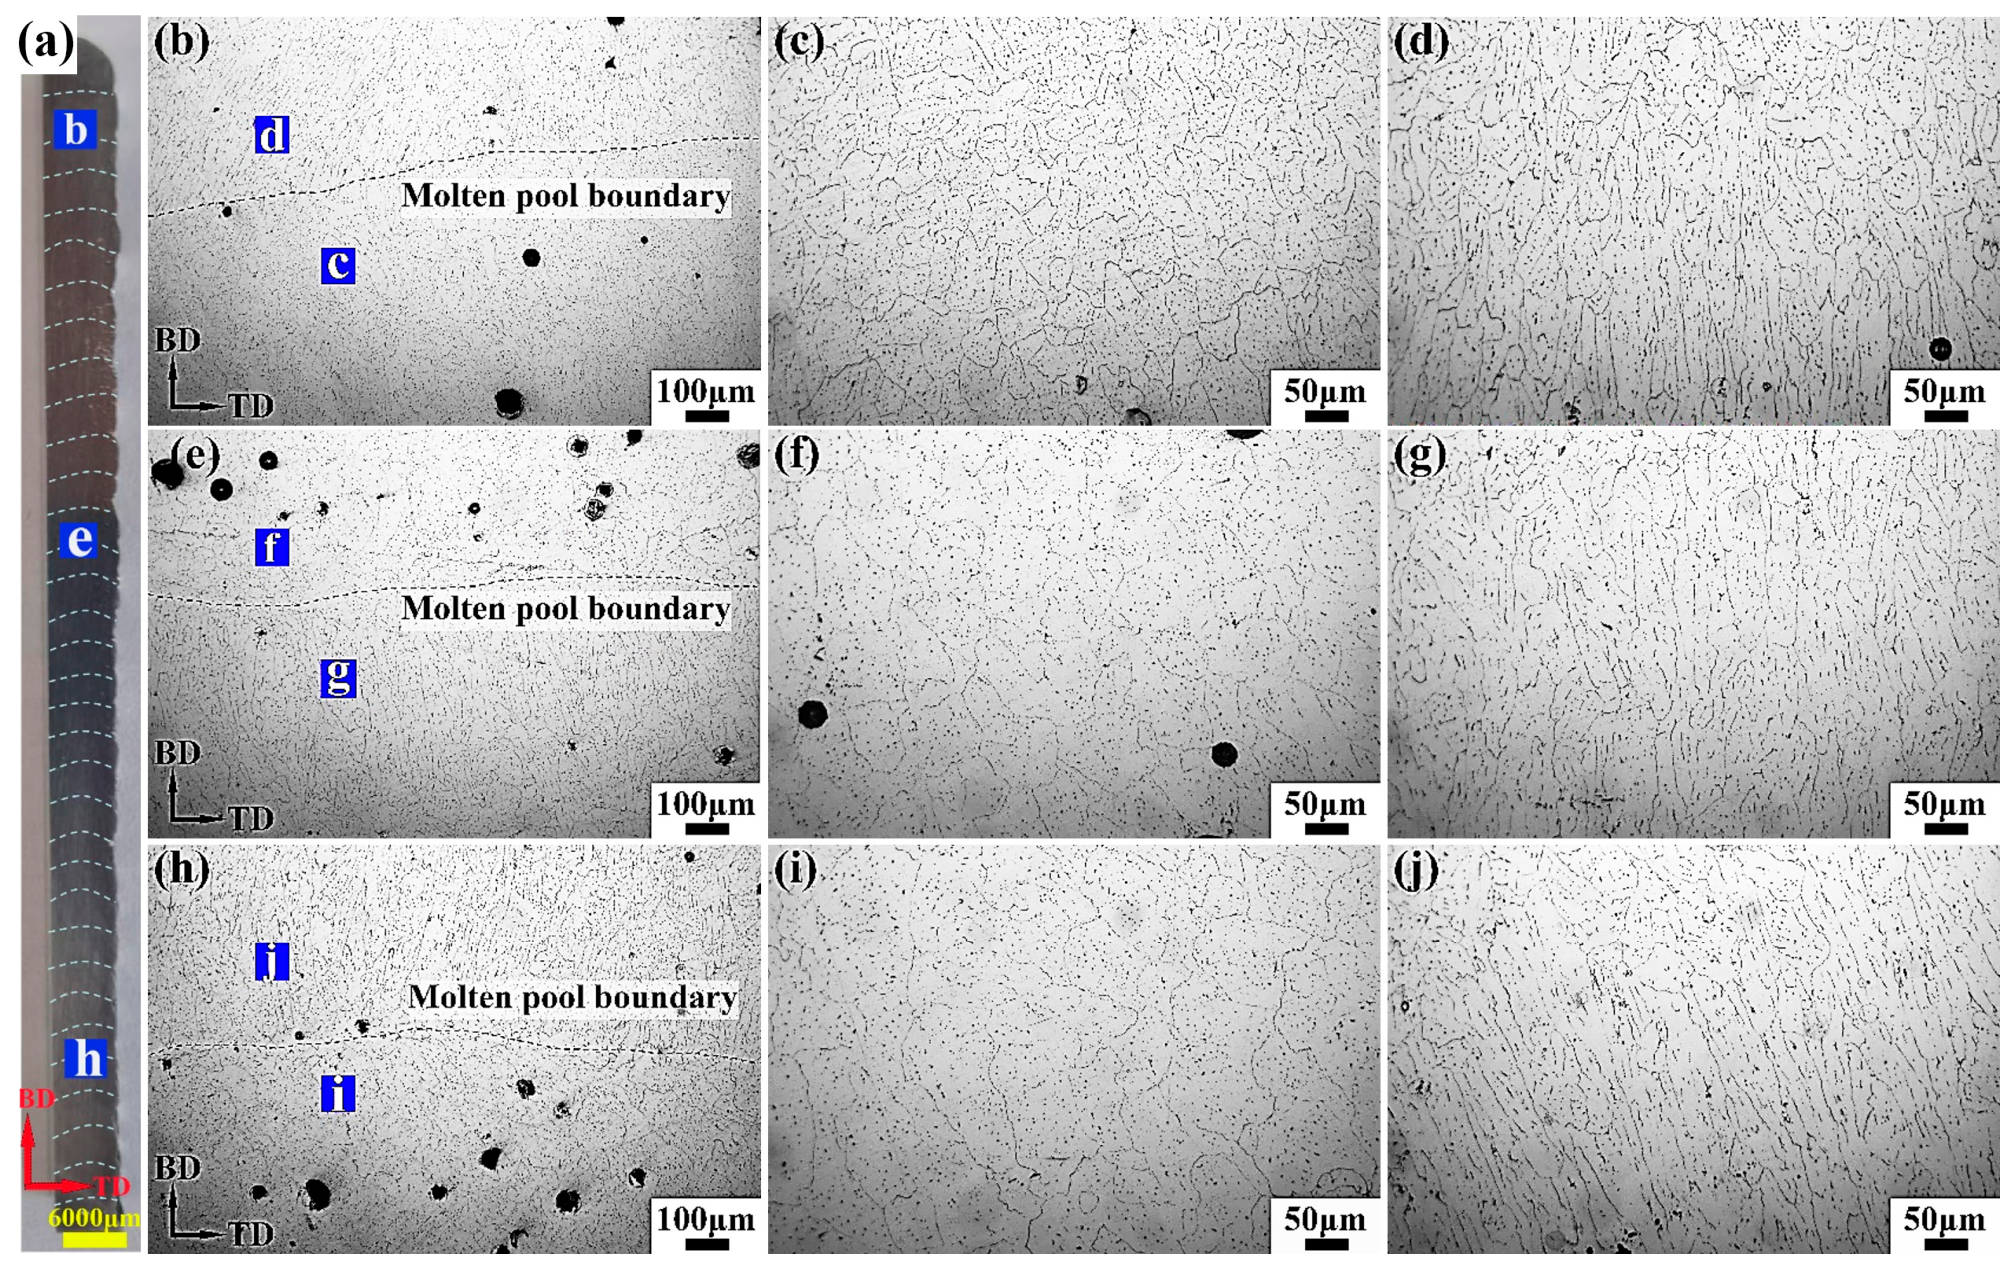
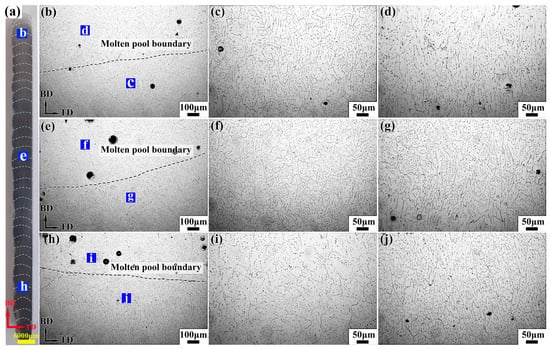
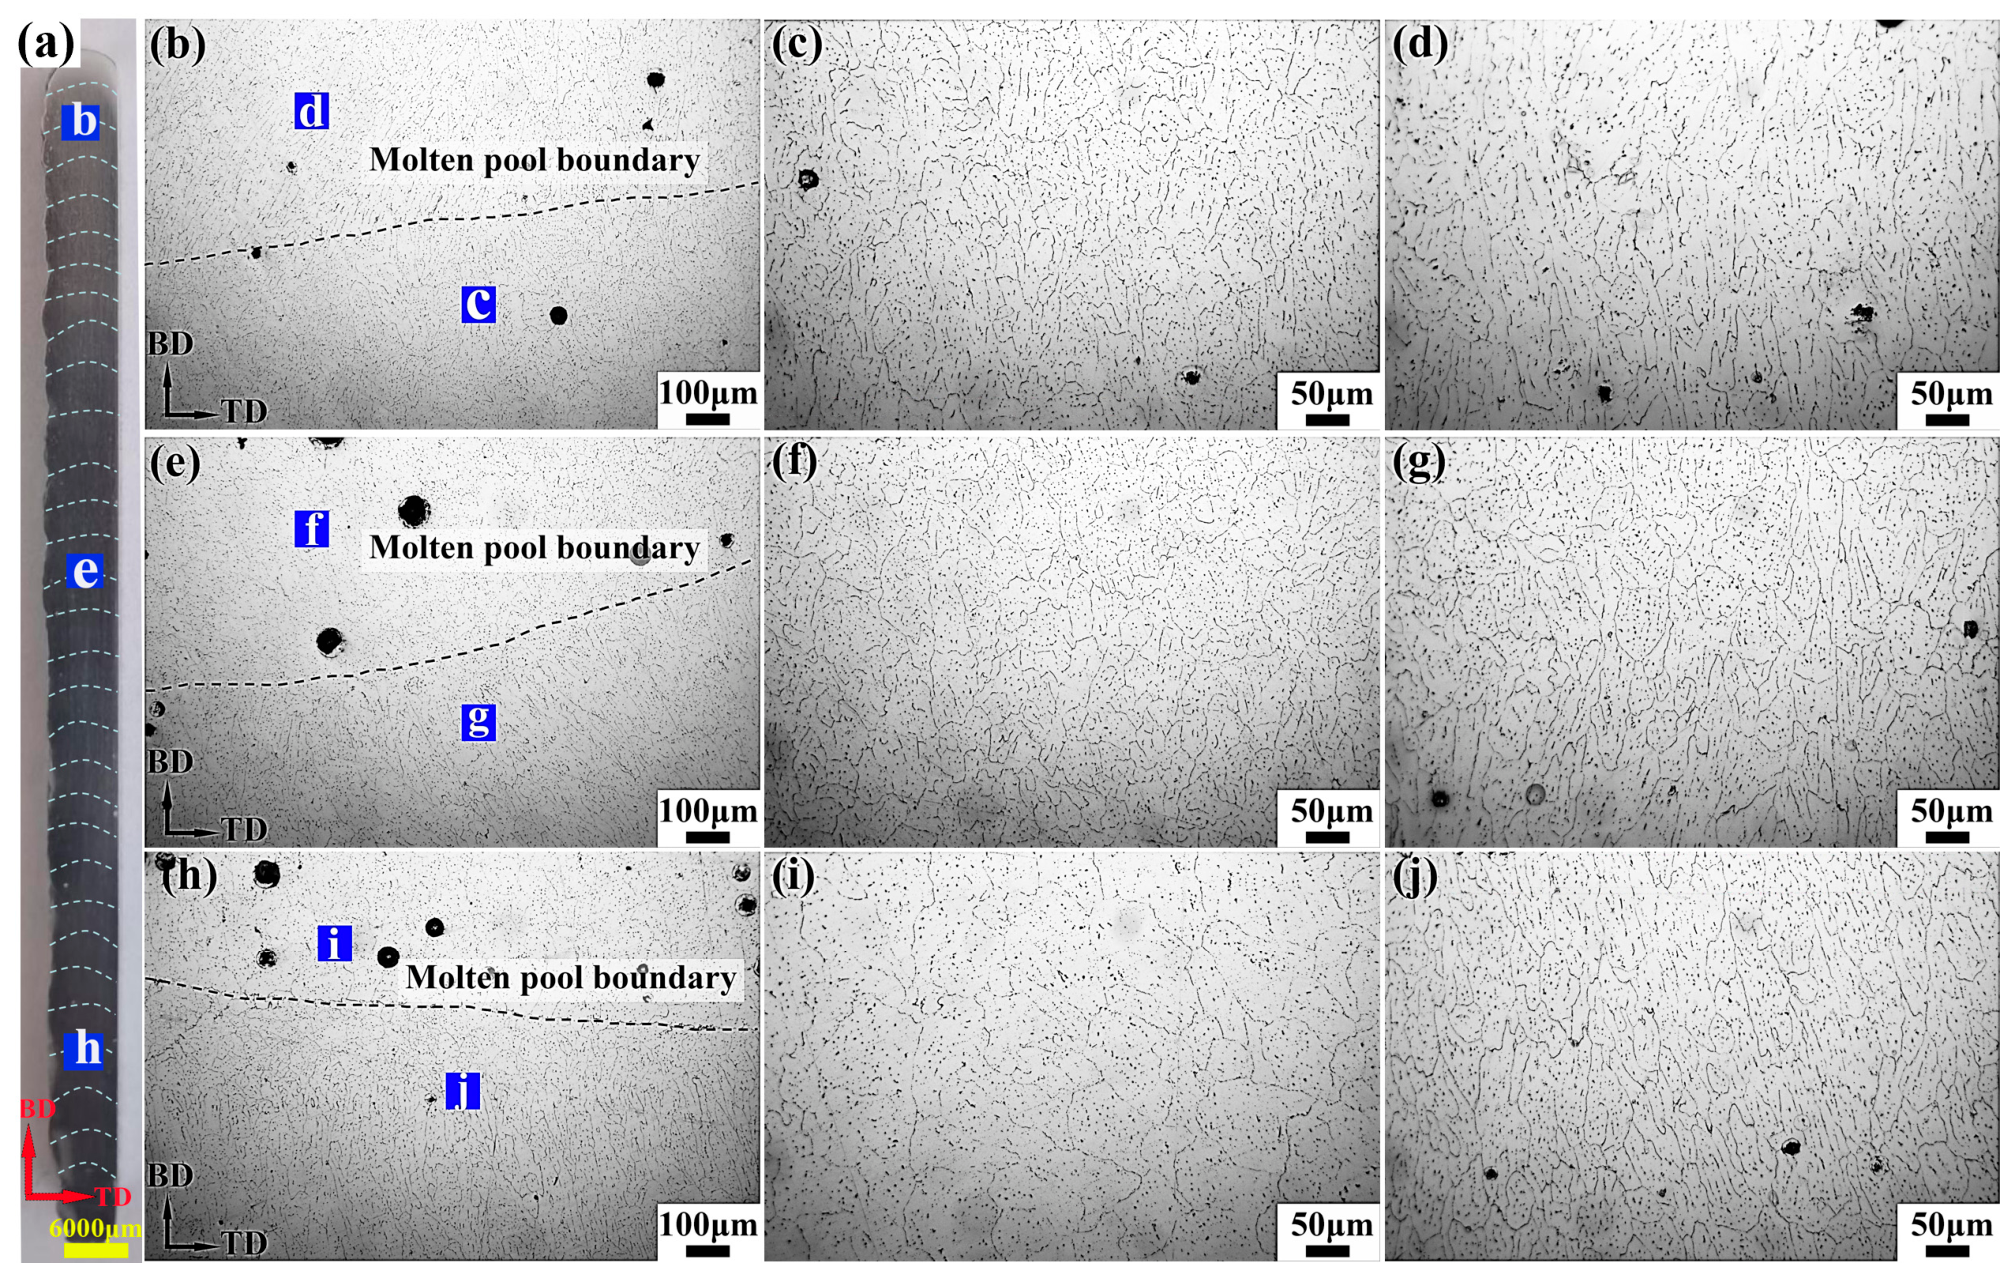
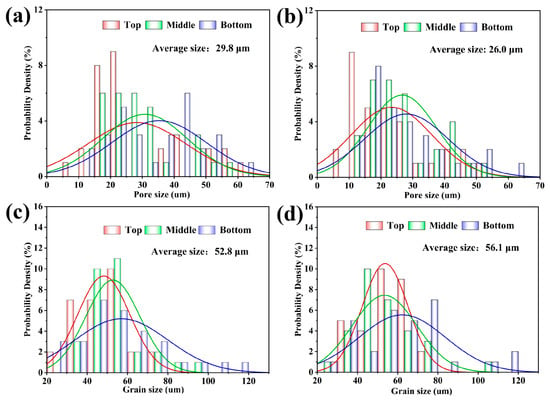
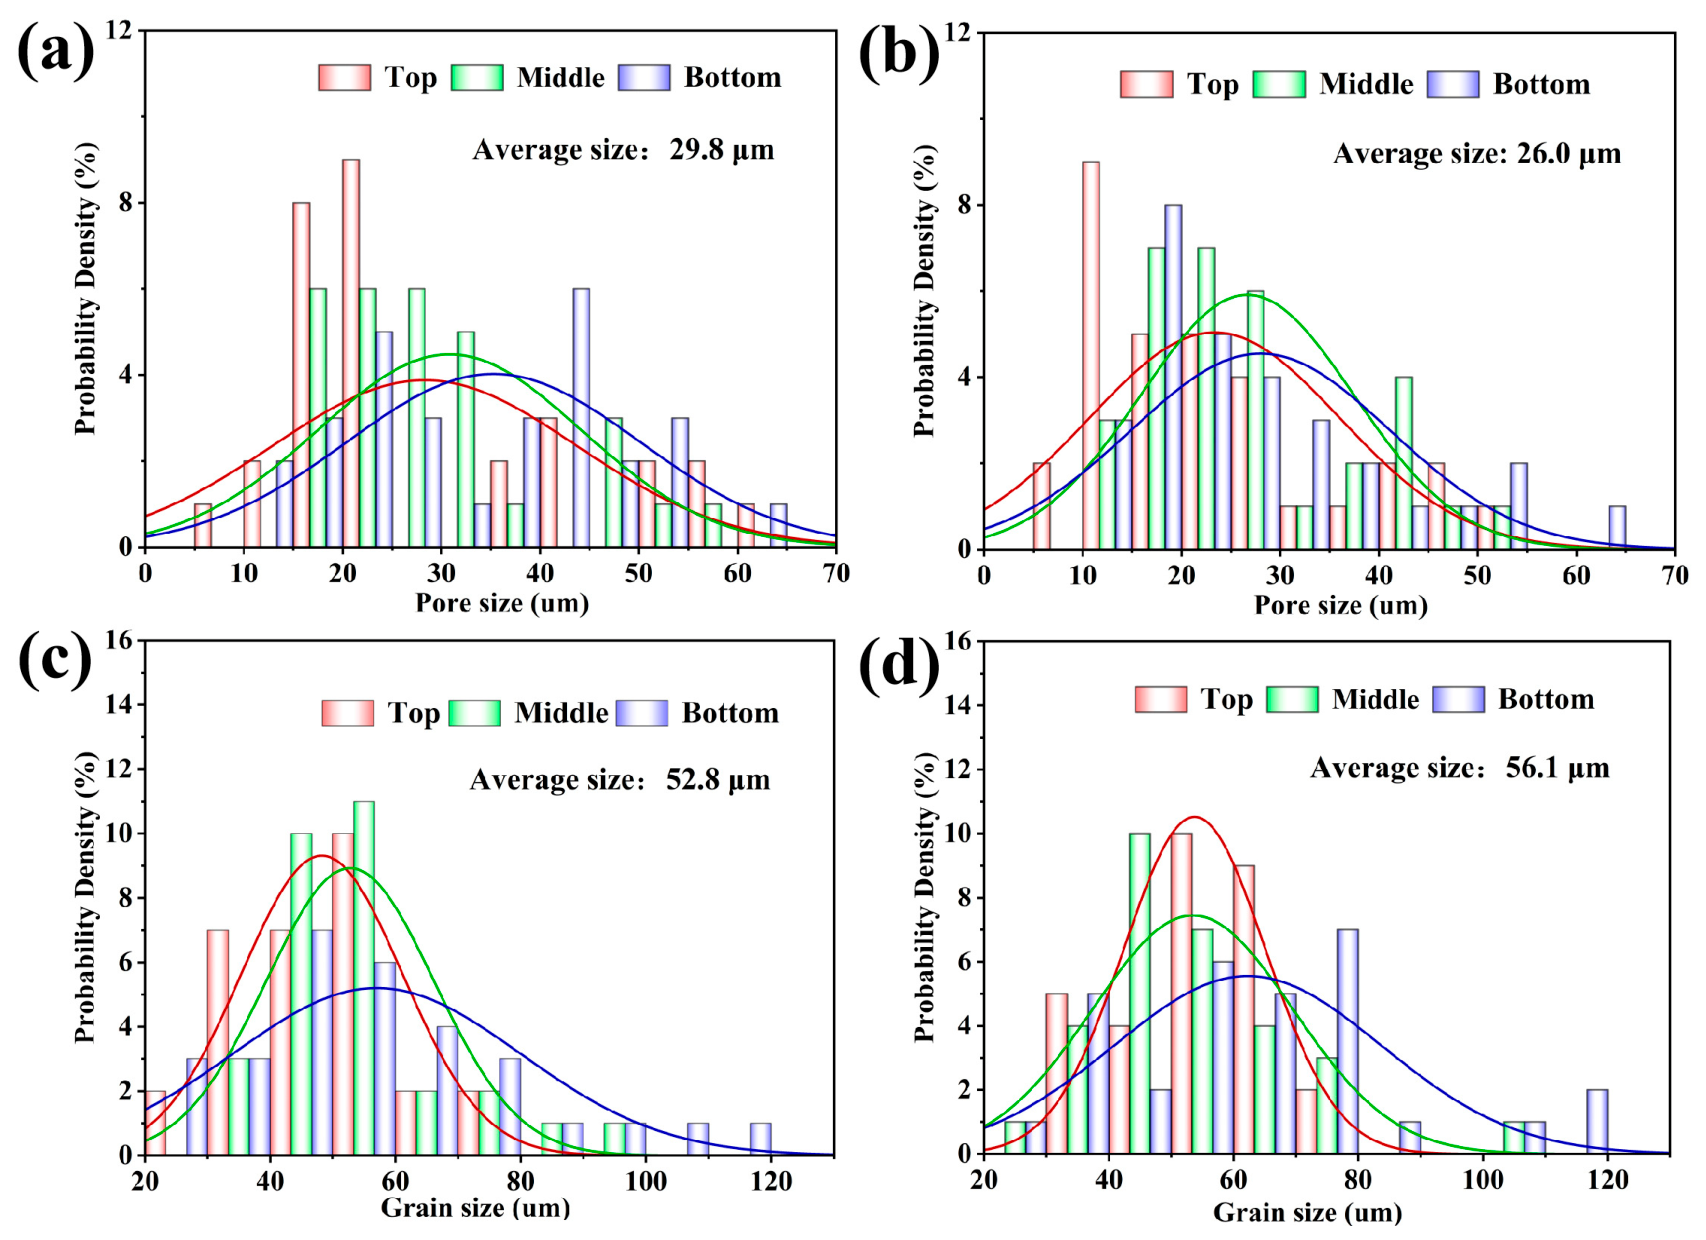
Figure 2 and Figure 3 present the macrographs and OM micrographs of samples 6/8 and 7/9, respectively, and Figure 4 and Table 2 show the corresponding pore size distribution and grain size distribution obtained from statistical analysis. It can be observed that pores existed at different heights in both samples, and their sizes gradually decreased with increasing height along the BD. According to the statistical results, the porosity and average pore size of sample 6/8 were 3.4% and 29.8 μm, respectively, while those of sample 7/9 were 1.3% and 26.0 μm, respectively. Both the porosity and average pore size of sample 7/9 were smaller than those of sample 6/8. Additionally, the densities of samples 6/8 and 7/9 (measured by Archimedes density measurements) were 2.604 g/cm3 and 2.631 g/cm3, respectively. This result had the same trend as the porosity results obtained by the statistical analysis of the OM images. Sample 6/8 had higher porosity and lower density. From the OM micrographs in Figure 2 and Figure 3, it is also evident that the grain size and morphology varied with height for both samples. In some regions, the grains were more equiaxed, while in other regions, they were more columnar. The equiaxed and columnar grain layers were alternately distributed. This is a common microstructural characteristic of 6061 Al alloy [13,17,24], arising primarily from the high-temperature gradient at the melt pool bottom that encourages grain growth along the BD and produces columnar grains, while the low-temperature gradient at the top facilitates equiaxed grain formation. Additionally, the average grain size of both samples gradually increased with increasing height. Based on the statistical data, the average grain sizes of samples 6/8 and 7/9 were 52.8 μm and 56.1 μm, respectively, with sample 6/8 exhibiting a smaller average grain size than sample 7/9.
Figure 2.
Macro structure (a) and micro structure (b–j) of sample 6/8 observed on BD–TD plane: (b–d) top layer; (e–g) middle layer; (h–j) bottom layer.
Figure 3.
Macro- structure (a) and micro structure (b–j) of sample 7/9 observed on BD–TD plane: (b–d) top layer; (e–g) middle layer; (h–j) bottom layer.
Figure 4.
The distribution of pore size (a,b) and grain size (c,d) of samples 6/8 (a,c) and 7/9 (b,d).
Table 2.
The average pore sizes and average grain sizes of the top layers, middle layers, and bottom layers in samples 6/8 and 7/9.
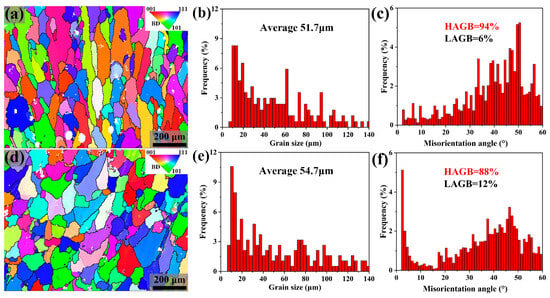
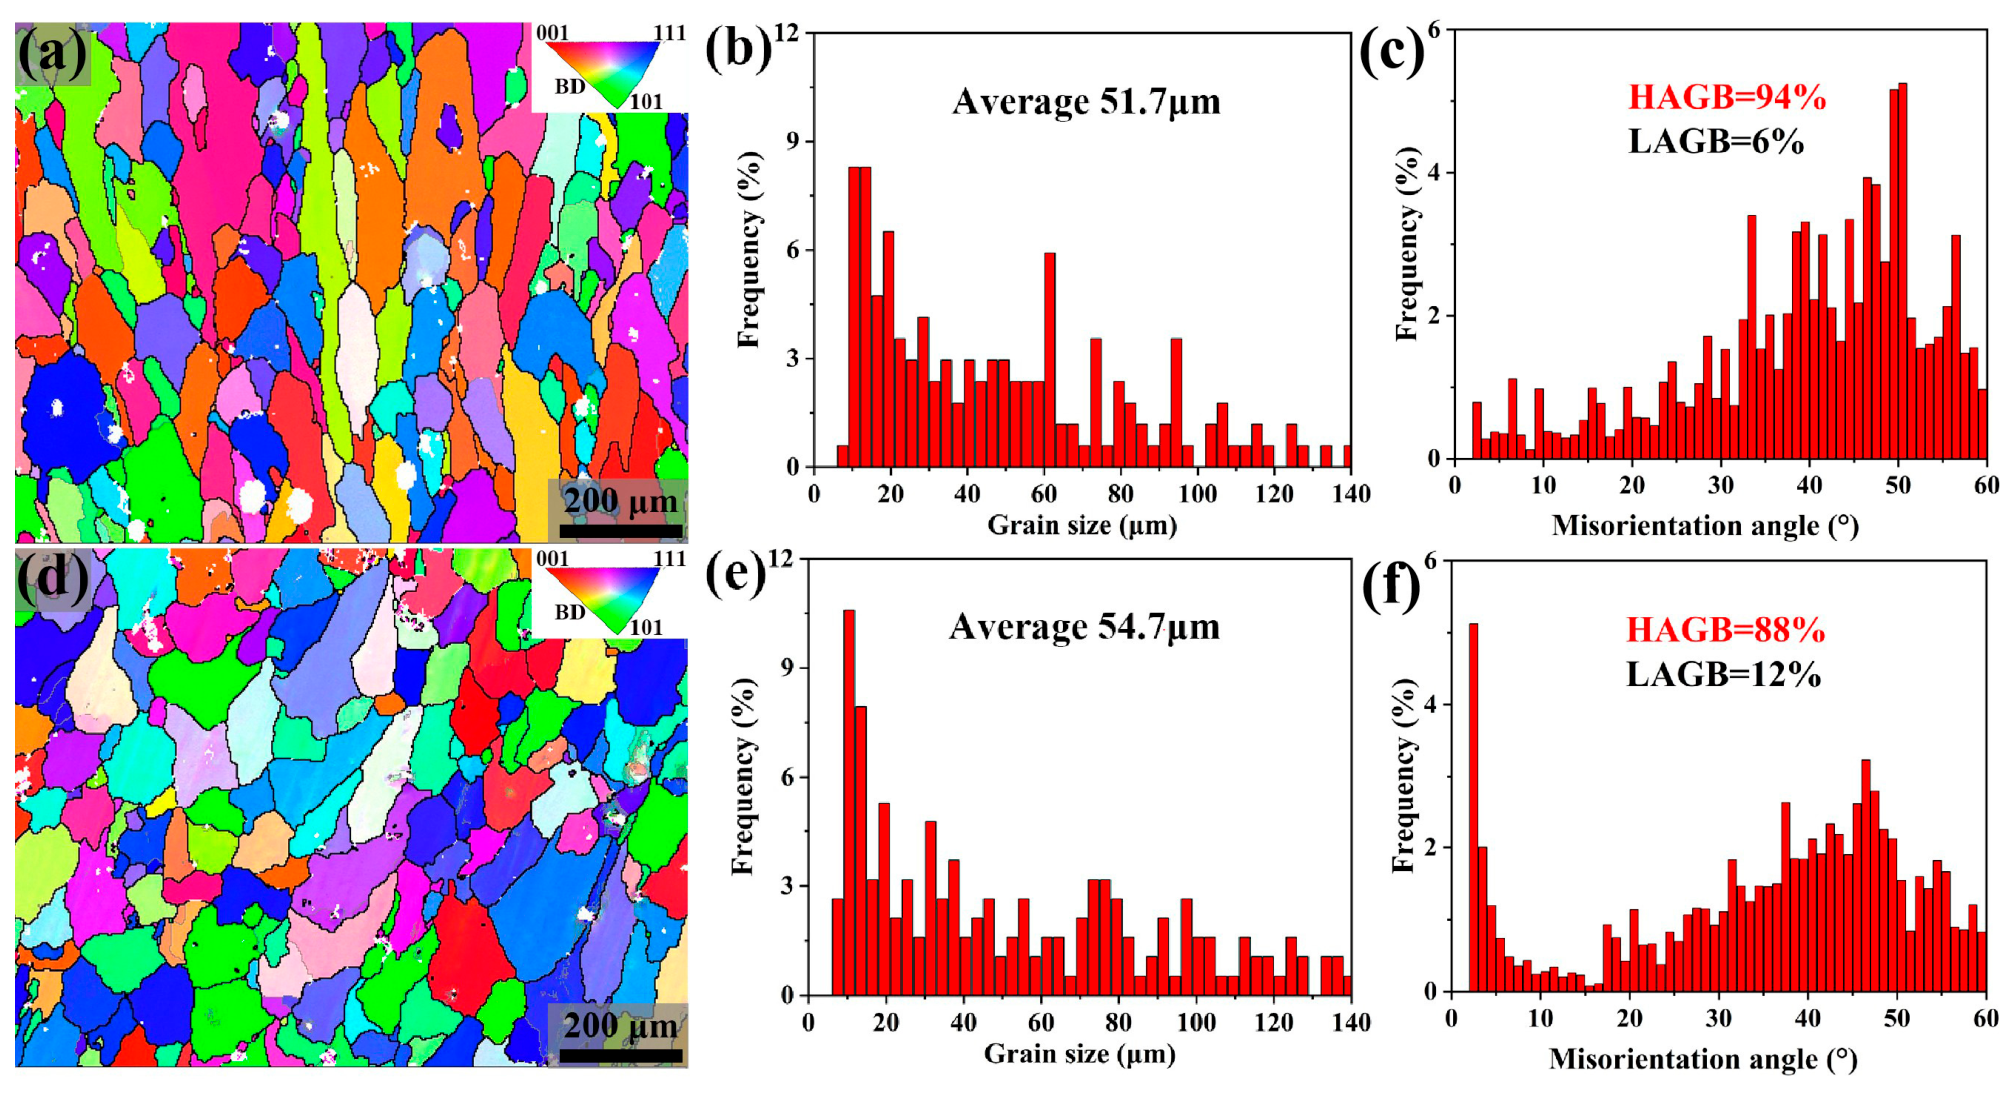
Figure 5 presents the EBSD-IPF maps of the central regions of the 6/8 and 7/9 samples, along with the corresponding grain size distributions. According to the EBSD data, the average grain sizes of the 6/8 and 7/9 samples were 51.7 μm (Figure 5b) and 54.7 μm (Figure 5e), respectively, which were slightly smaller than those obtained from OM observations (Figure 4). This discrepancy is mainly attributed to the fact that some fine grains were difficult to resolve in OM images, leading to an overestimation in the statistical results. Despite the slight deviation between the EBSD and OM data, both datasets confirm that sample 6/8 had a smaller average grain size than sample 7/9. The misorientation angle distributions (Figure 5c,f) show that the fraction of LAGBs (2–10°) was markedly higher in sample 7/9 (12%) than in sample 6/8 (6%). This indicates that the higher heat input in sample 7/9 produced a higher residual dislocation content in the as-deposited state.
Figure 5.
EBSD results of 6/8 (a–c) and 7/9 (d–f) samples: (a,d) EBSD-IPF maps, (b,e) grain size distributions, and (c,f) misorientation angle distributions.
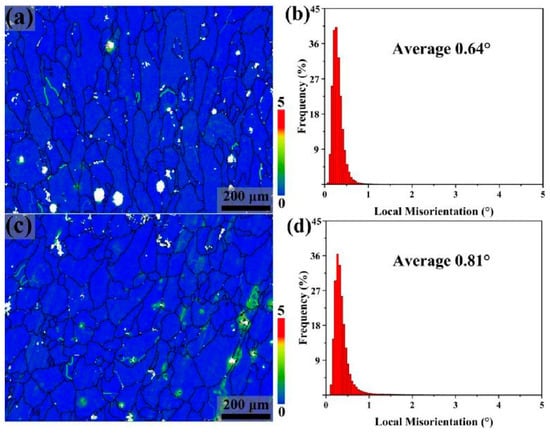
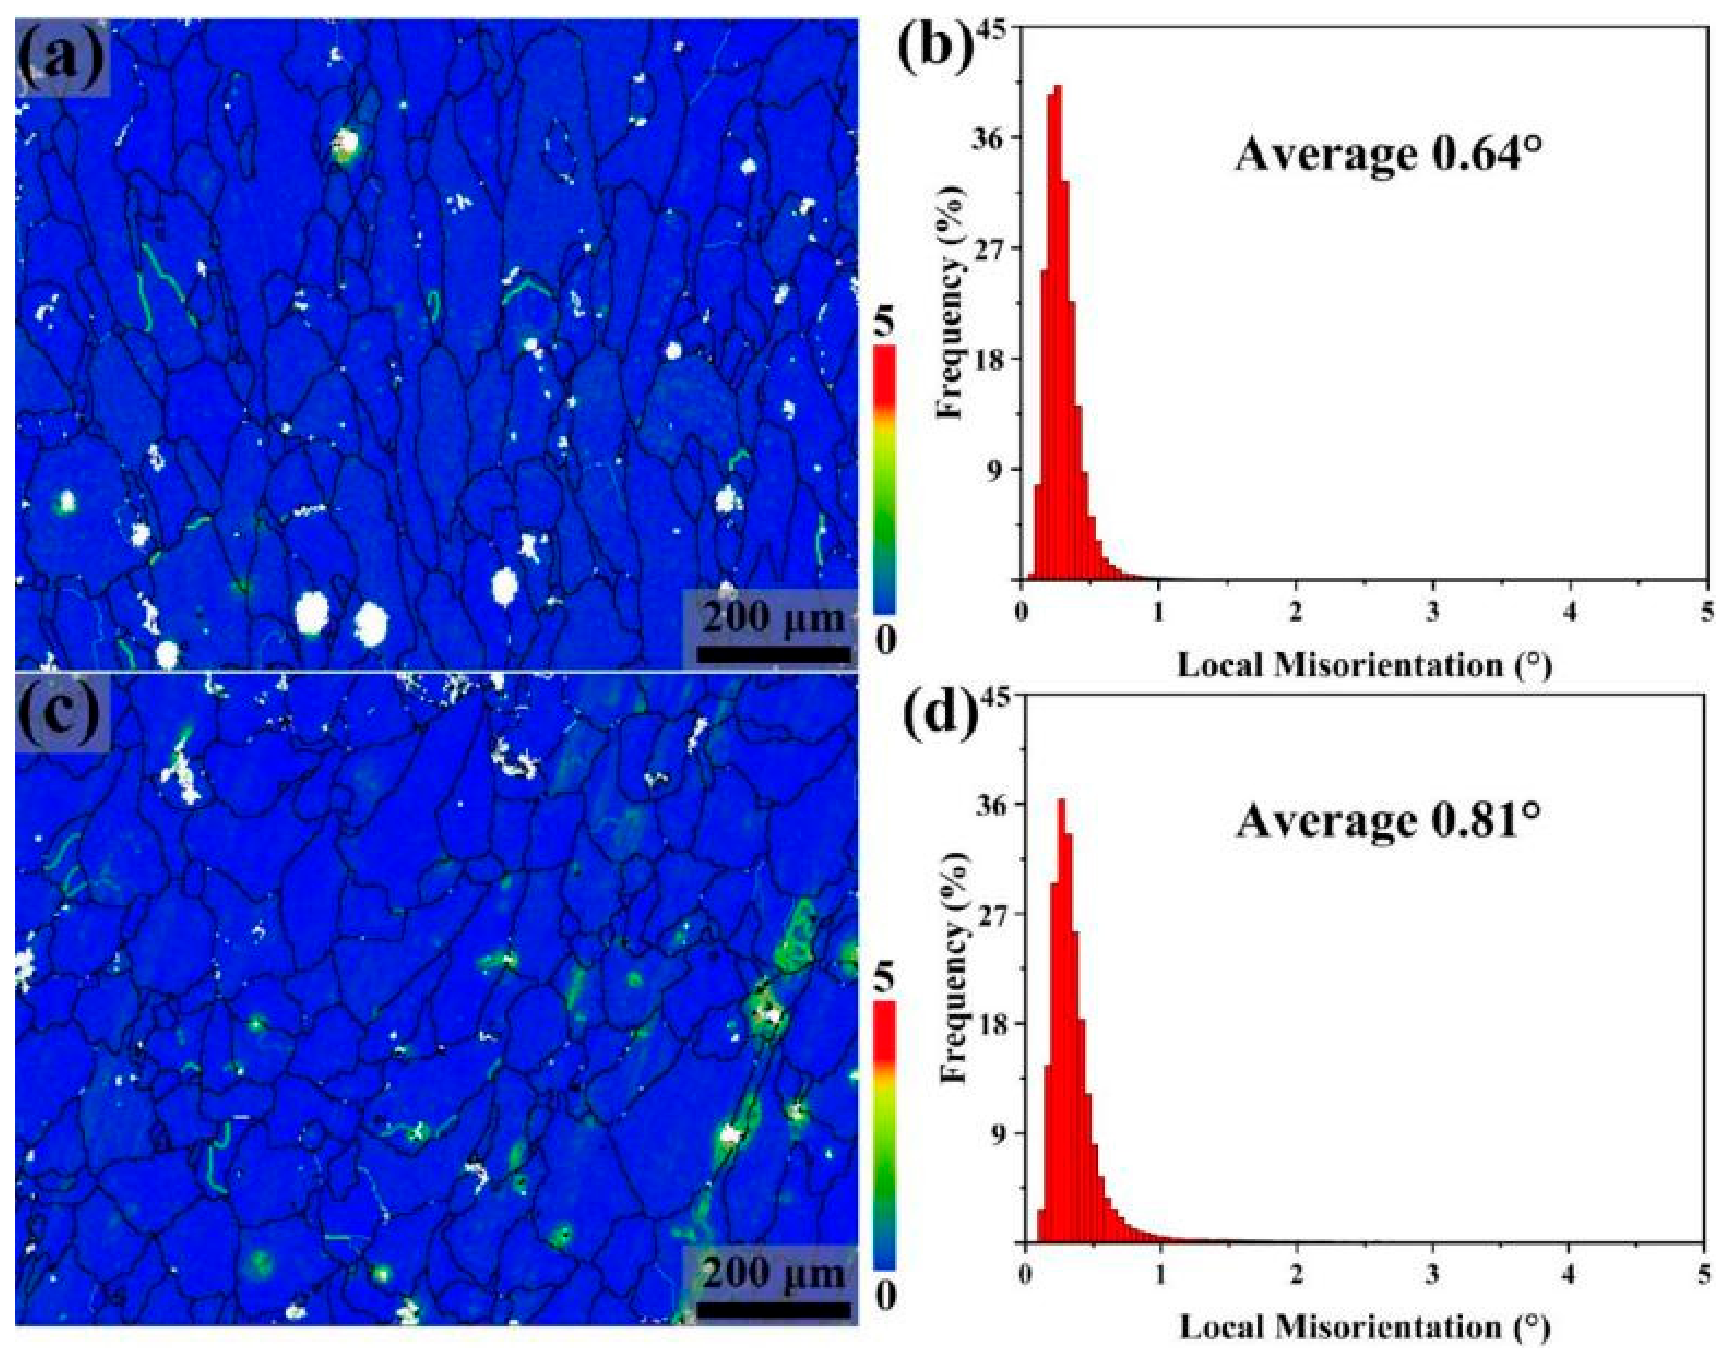
Figure 6 shows the KAM maps derived from the EBSD data. It can be seen that in both the 6/8 and 7/9 samples, the grains exhibited generally low local misorientation angles, indicating that the overall deformation degree was relatively small, and the dislocation density was low. However, some regions with higher local deformation were observed near certain grain boundaries and pores, leading to locally increased dislocation densities. The average local misorientation angles of the 6/8 and 7/9 samples were 0.64° and 0.81°, respectively, suggesting that sample 7/9 possessed a higher overall dislocation density.
Figure 6.
KAM maps (a,c) and local misorientation distributions (b,d) of 6/8 (a,b) and 7/9 (c,d) samples.
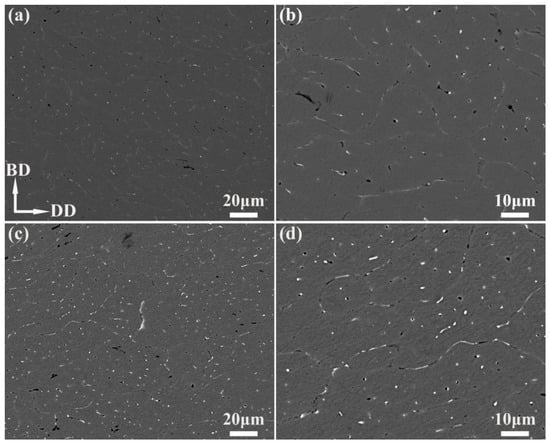
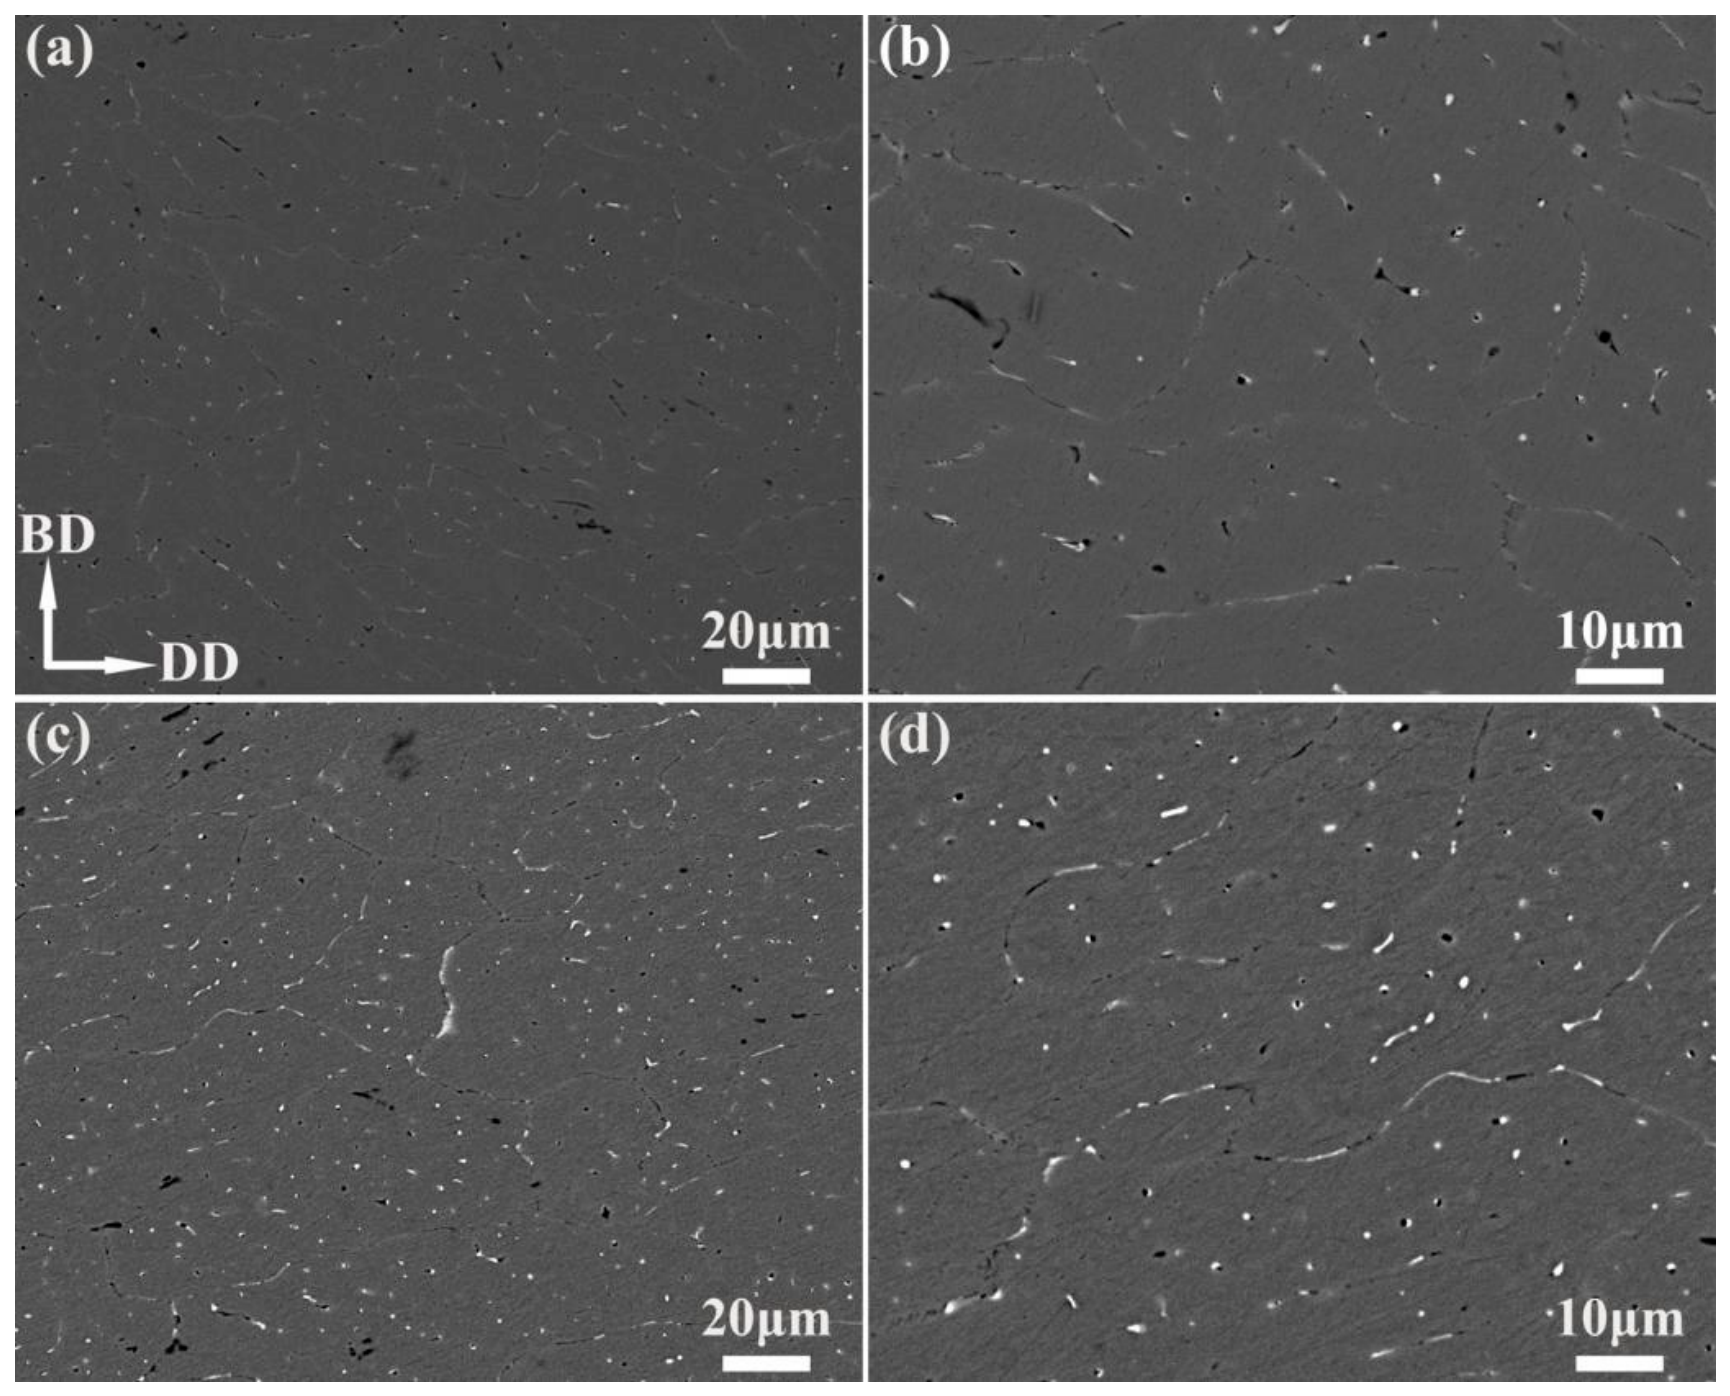
From the SEM images in Figure 7, the characteristics of the secondary phases in both samples can be observed. In both the 6/8 and 7/9 samples, a large number of secondary phases formed along the grain boundaries, and some of them fell off during metallographic sample preparation, leaving black strip-like voids. In addition, numerous micron/submicron-sized blocky secondary phases (white) and near-spherical/spherical pores (black) were also distributed within the grains. Statistical analysis revealed that in sample 6/8, the average size, area fraction, and number density of intragranular blocky secondary phases ere 0.88 μm, 0.43%, and 1.9 μm−2, respectively, while in sample 7/9, the corresponding values ere 0.66 μm, 0.78%, and 2.2 μm−2. Notably, both the area fraction and number density of intragranular blocky secondary phases in sample 7/9 were higher than those in sample 6/8.
Figure 7.
SEM images of 6/8 (a,b) and 7/9 (c,d) samples.
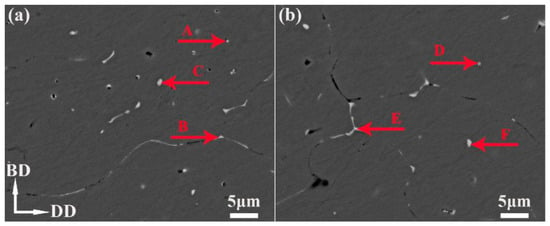
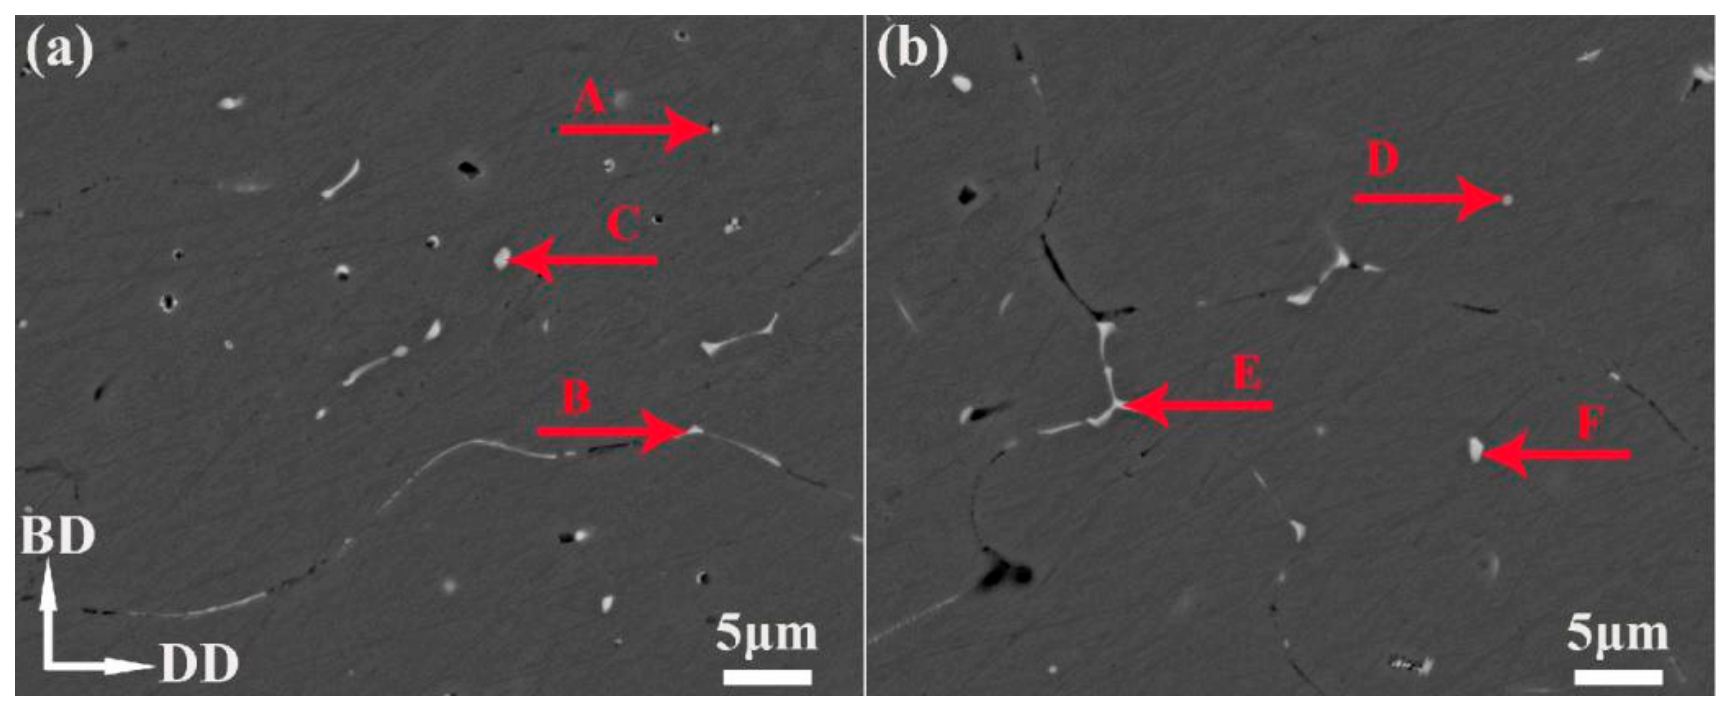
Figure 8 presents the SEM images used for EDS characterization, and Table 3 lists the corresponding EDS data. It can be observed that in both the 6/8 and 7/9 samples, two main types of secondary phases formed at the grain boundaries: one rich in Mg and Si (points A and D) and the other rich in Fe and Si (points B and E). In addition, the blocky phases formed within the grains also exhibited enrichment in Fe and Si (points C and F). According to the relevant literature [33,34,35], the grain-boundary precipitates with high Mg and Si contents are likely the Mg2Si phase, while the secondary phases with high Fe and Si contents, both at the grain boundaries and within grains, are most probably Al-Fe-Si intermetallic compounds [13,14,36].
Figure 8.
The SEM images of 6/8 (a) and 7/9 (b) samples for EDS measurement.
Table 3.
EDS results corresponding to points in Figure 8.
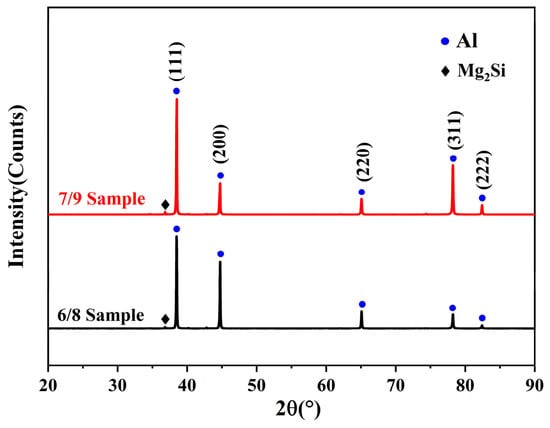
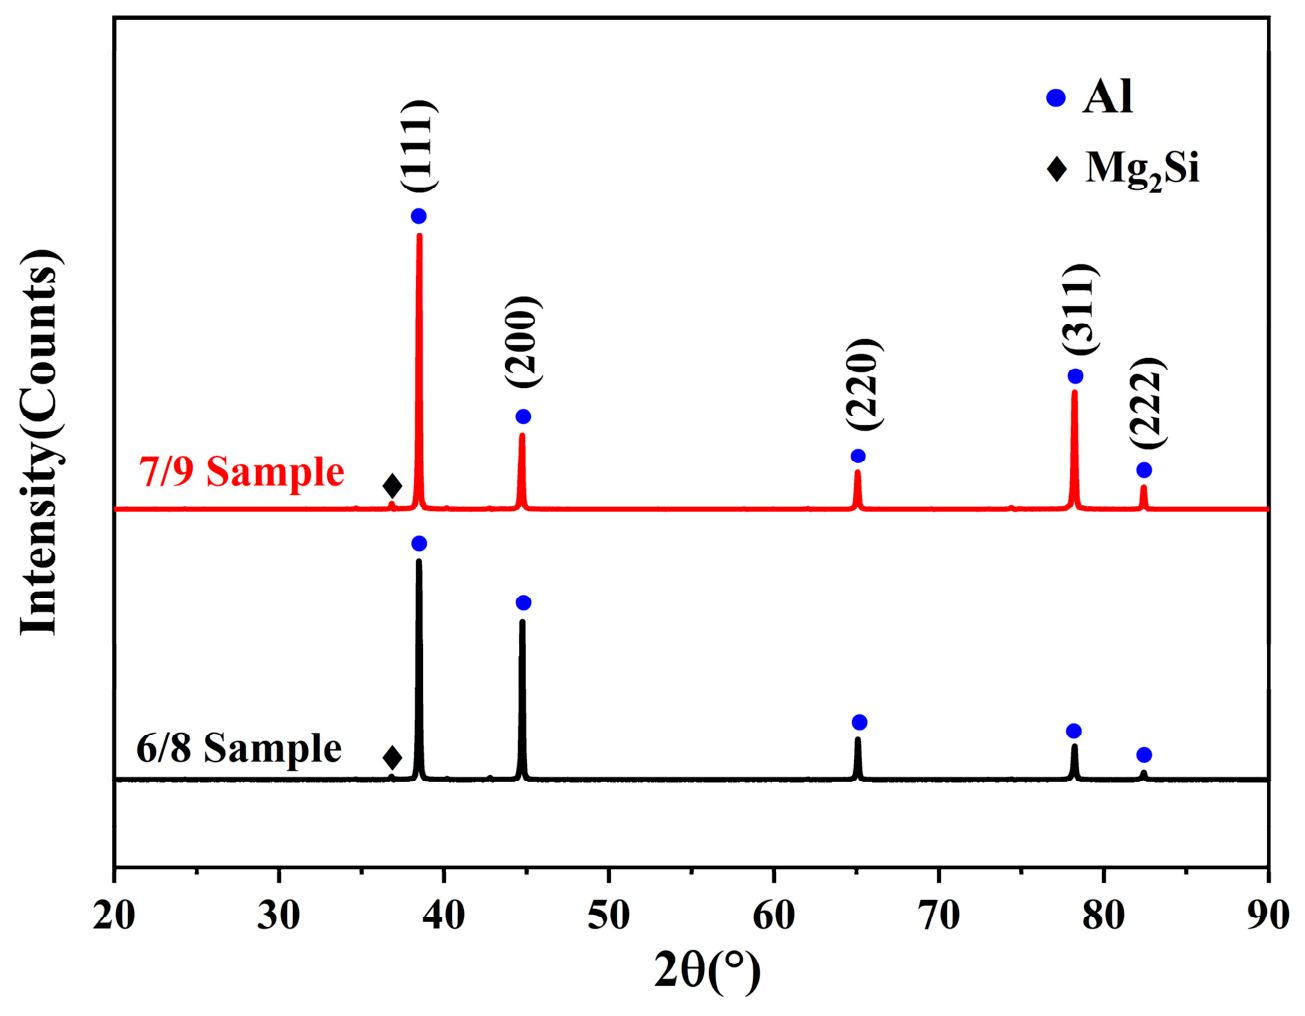
Figure 9 shows the XRD patterns of the 6/8 and 7/9 samples. It can be seen that in both samples, in addition to the characteristic peaks of the Al matrix, diffraction peaks corresponding to the Mg2Si phase were also observed, which directly confirmed that the grain-boundary secondary phases with high Mg and Si contents were Mg2Si. However, no characteristic peaks of other secondary phases were detectable in the XRD patterns, which could be attributed to their relatively low contents in the samples, requiring further analysis combined with the subsequent TEM data.
Figure 9.
XRD patterns of samples 6/8 and 7/9.
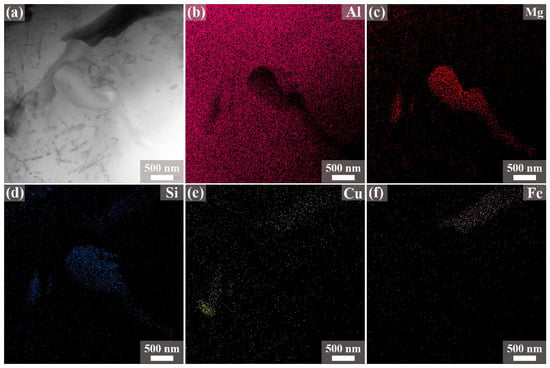
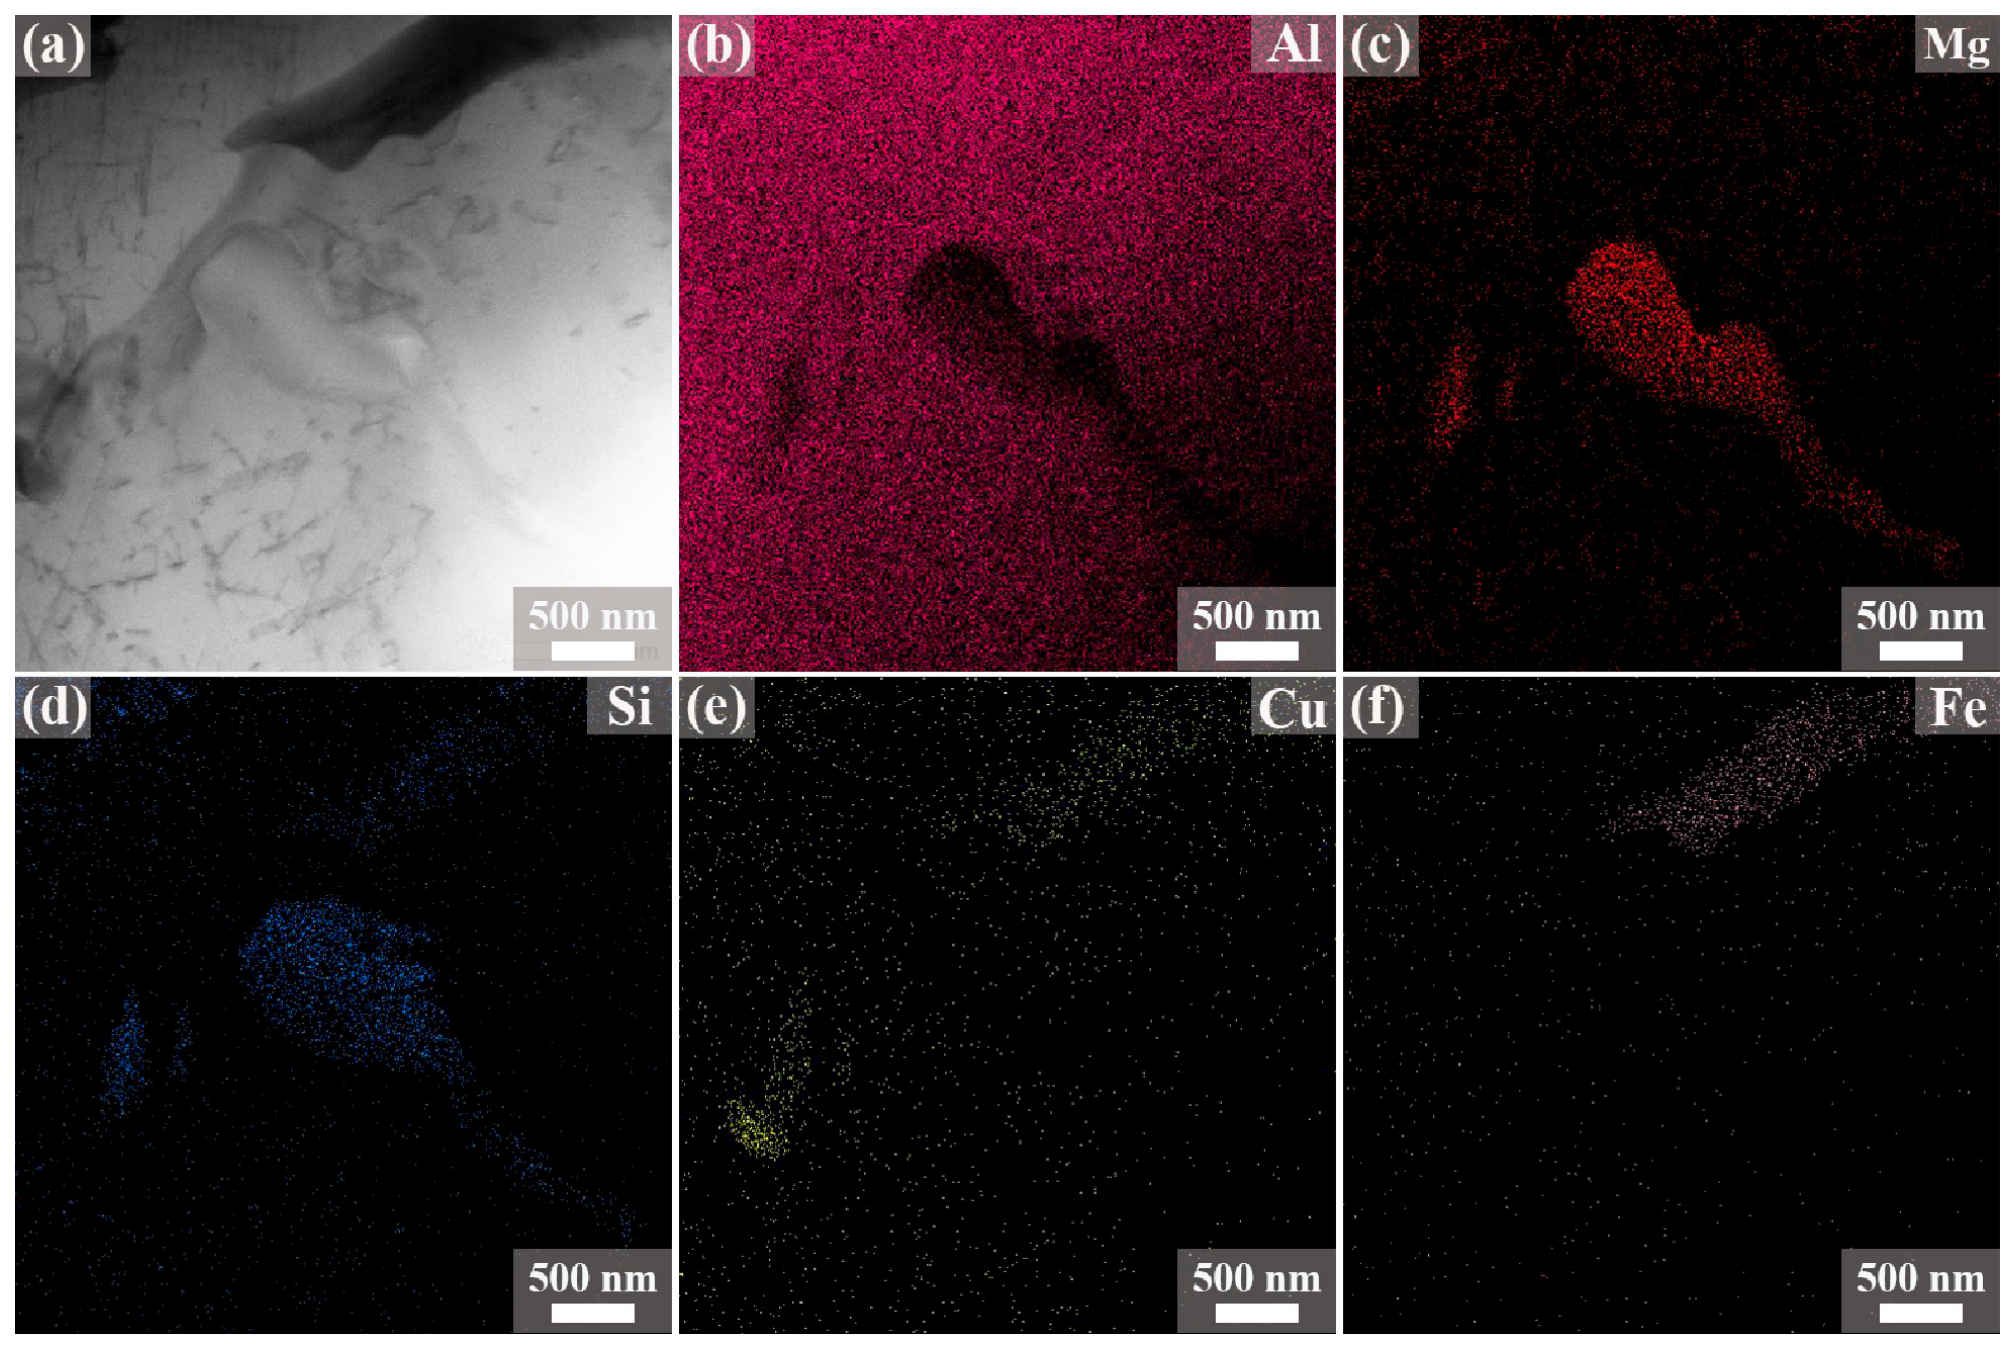
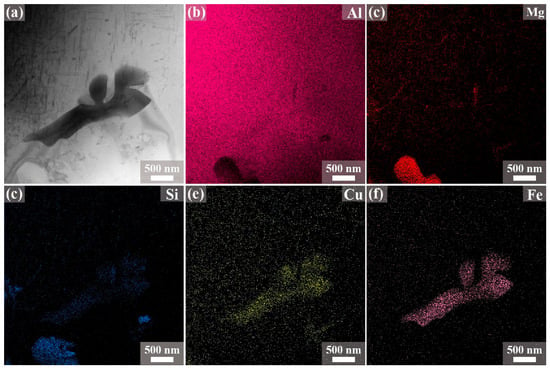
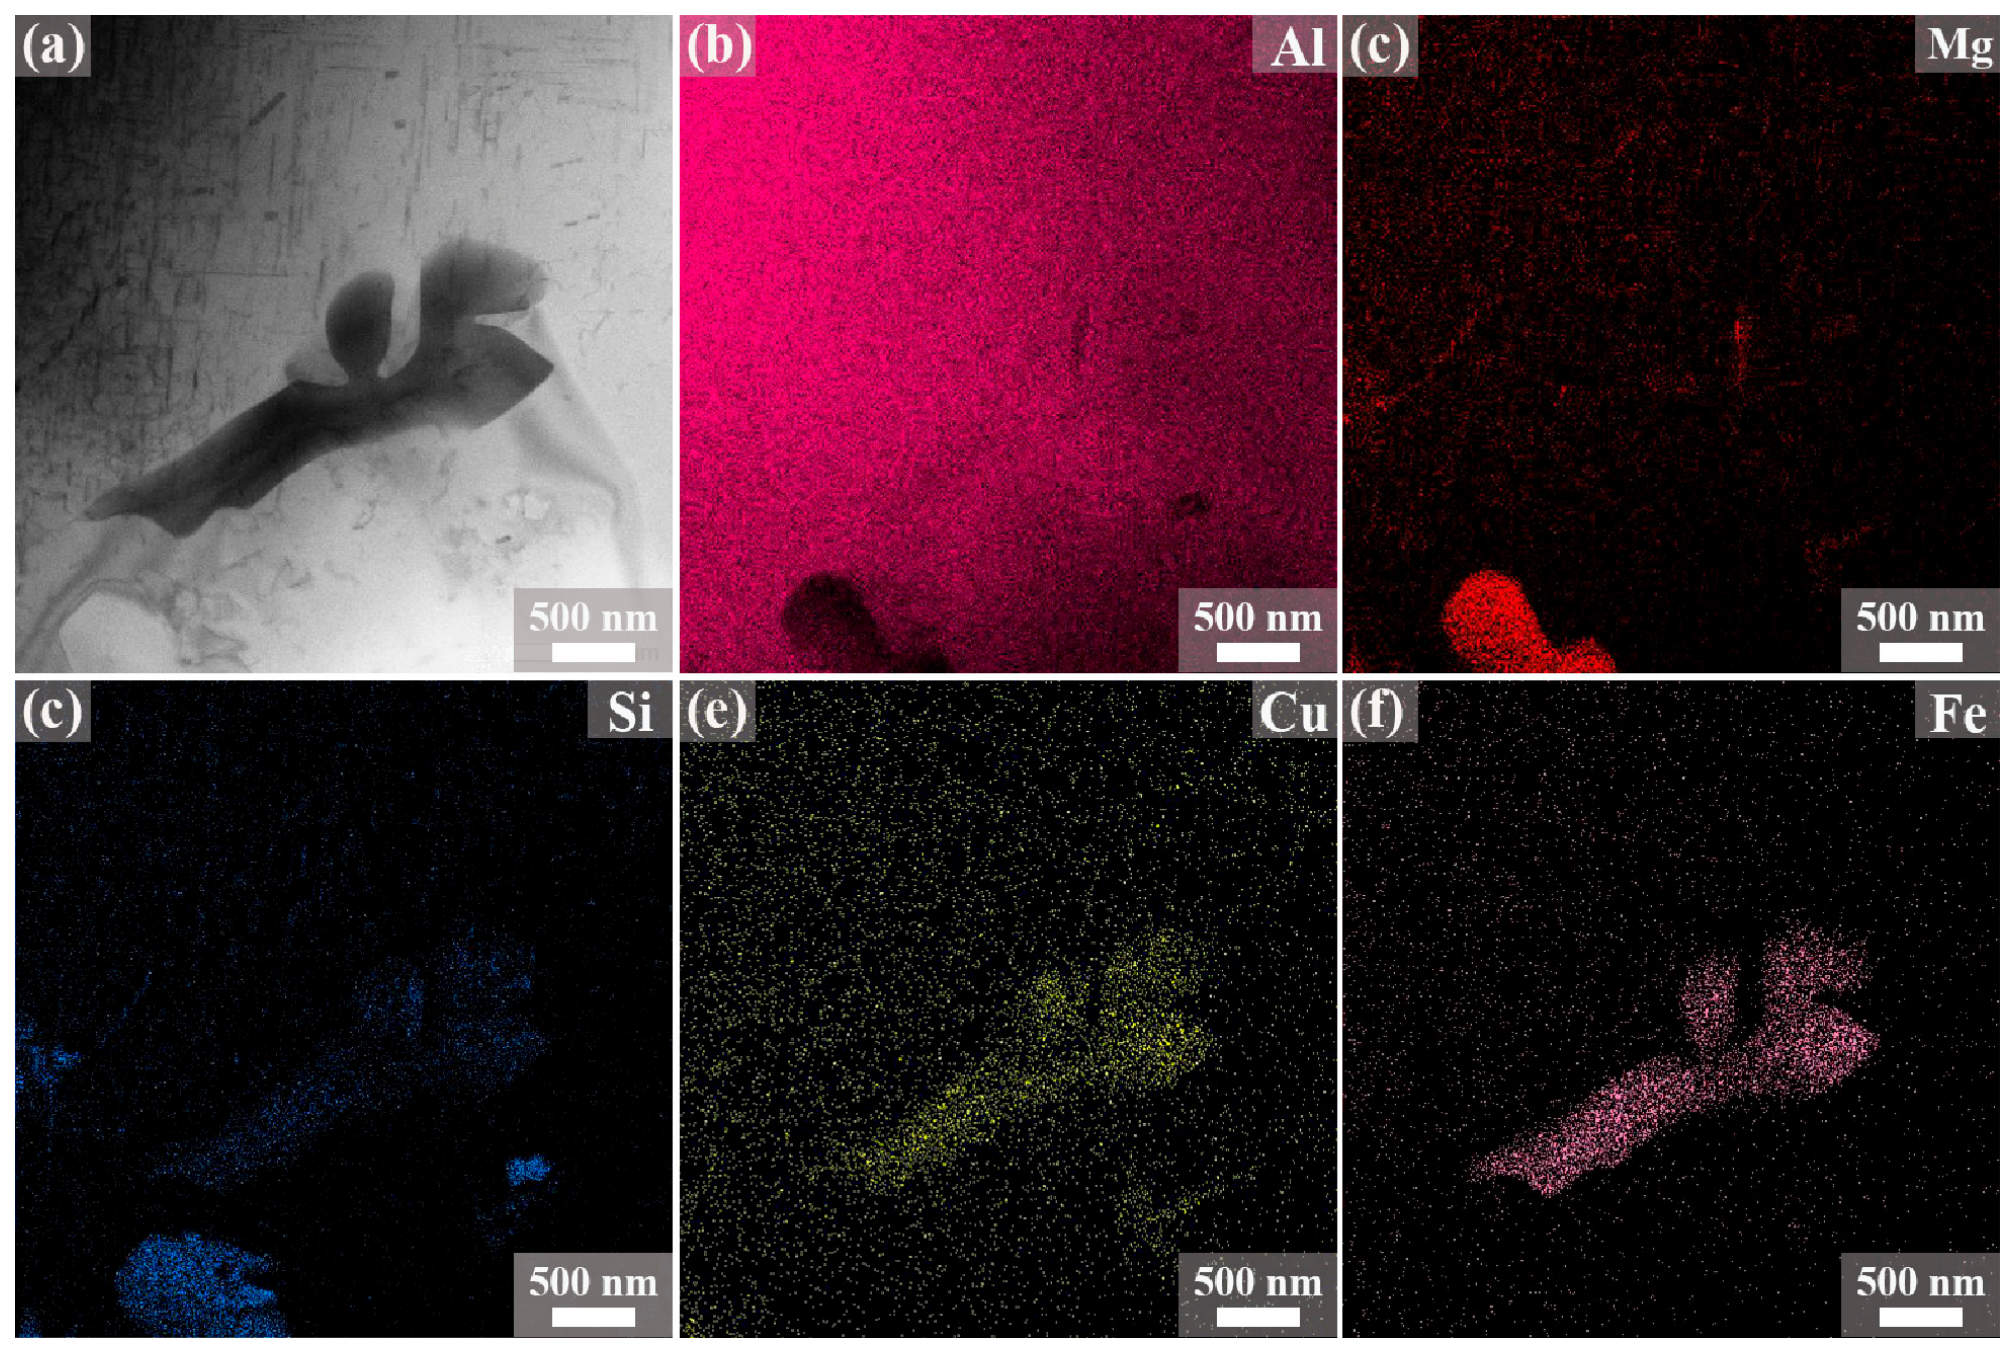
Figure 10 and Figure 11 present the TEM images and EDS data of samples 6/8 and 7/9, respectively. It can be observed that the coarse micron/submicron-sized second phases in both samples were classified into two types: one type was rich in Mg and Si, and the other was rich in Cu, Fe, and Si. According to the relevant literature [13,14,33,34,35,36], these two types correspond to the Mg2Si phase and Al-Fe-Si intermetallic compounds, which are commonly found in 6061 Al alloy. In addition, nanoscale elongated rod-like and blocky secondary phases were also observed in both samples. Based on the EDS data, both of these nanoscale phases were identified as Mg2Si. In sample 6/8, the average length, average width, and number density of these nanoscale Mg2Si precipitates were 96.1 nm, 29.1 nm, and 0.16 nm−2, respectively. In sample 7/9, the corresponding values were 119.8 nm, 51.0 nm, and 0.39 nm−2. Although the nanoscale Mg2Si phases in sample 7/9 were slightly larger in size than those in sample 6/8, their number density was significantly higher. However, for the Al-Fe-Si-rich particles, we were not able to obtain a reliable SAED pattern due to the limited numbers of such particles. Consequently, the specific stoichiometry of the Al–Fe–Si phase could not be definitively assigned in the present work.
Figure 10.
TEM image (a) and EDS results (b–f) of sample 6/8.
Figure 11.
TEM image (a) and EDS results (b–f) of sample 7/9.
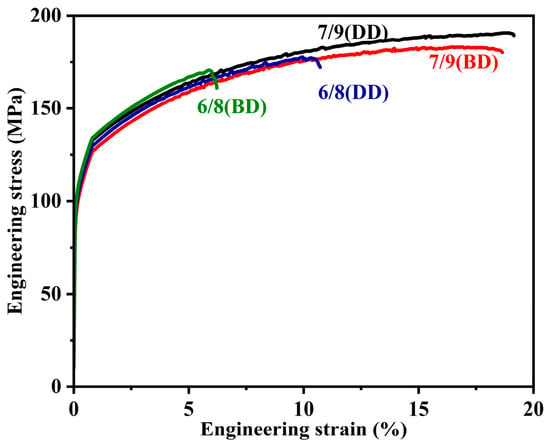
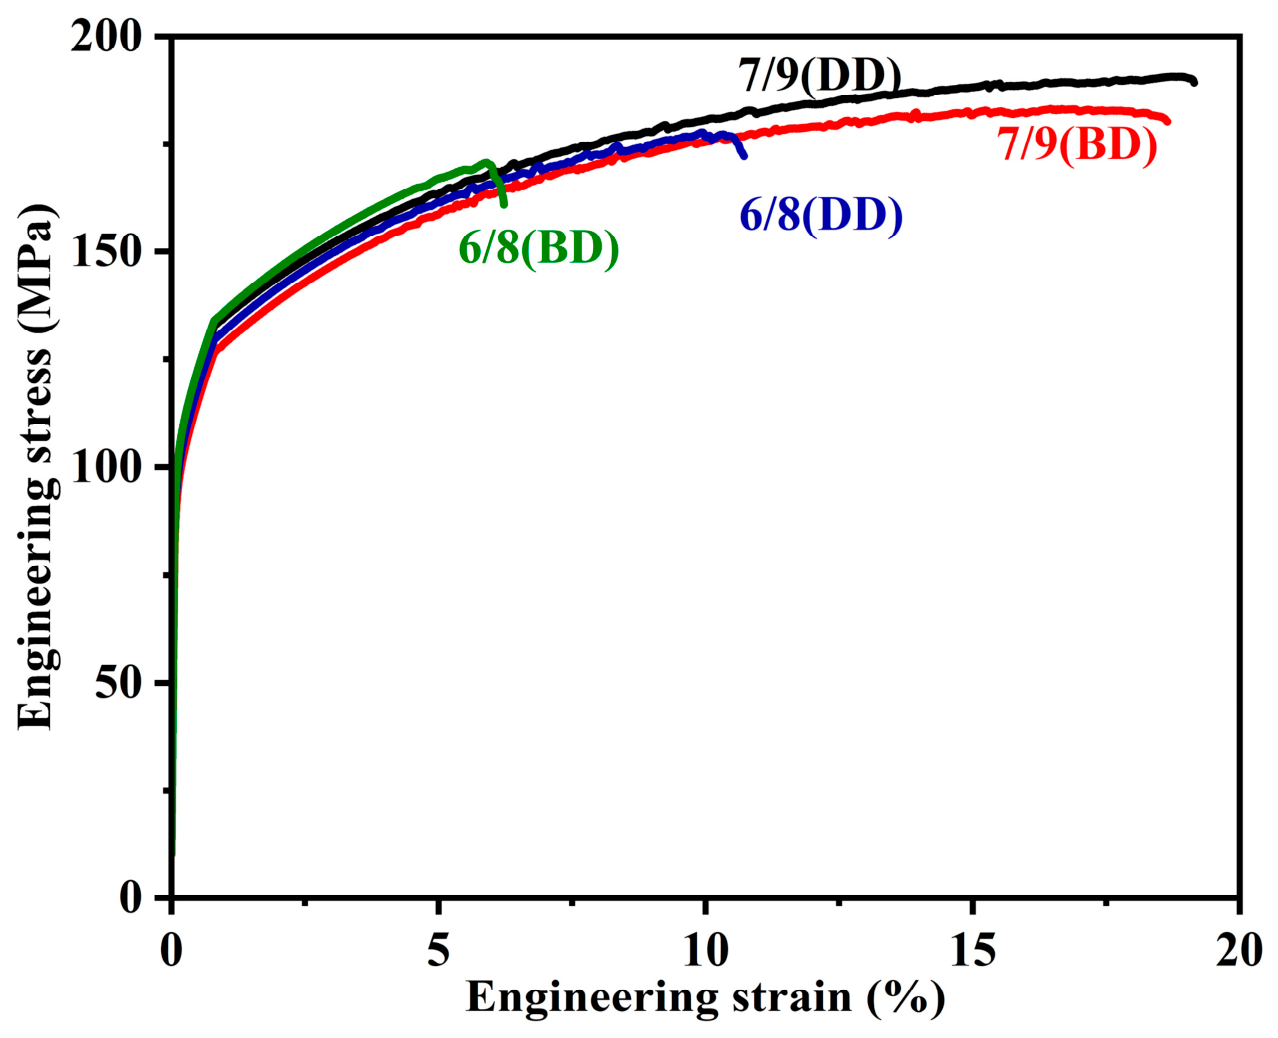
The tensile tests (Figure 12 and Table 4) showed that the ultimate tensile strength (UTS) and yield strength (YS) were comparable between the two samples. The UTS of sample 7/9 ranged from 183 to 190 MPa, and the YS ranged from 106 to 111 MPa. For sample 6/8, the UTS was 170–177 MPa, and the YS was 108–113 MPa. However, the elongation differed drastically: that of sample 7/9 was 18.6–19.2% higher than that of sample 6/8 (6.2–10.7%). Meanwhile, anisotropy was dramatically suppressed in sample 7/9, with only 3.2% elongation difference between the BD and DD directions, in contrast to a 42.1% difference in sample 6/8.
Figure 12.
Tensile curves of samples 6/8 and 7/9.
Table 4.
Tensile properties of samples 6/8 and 7/9.
4. Discussion
4.1. Microstructural Evolution Mechanisms Under Varying Process Parameters
The two parameter sets (samples 6/8 and 7/9) differed in heat input. Sample 6/8 was fabricated with a wire feeding speed of 6 m/min and a welding speed of 8 mm/s, while sample 7/9 was produced with a wire feeding speed of 7 m/min and a welding speed of 9 mm/s. In WAAM, the heat input (HI) is determined by the arc voltage (U), welding current (I), and travel speed (v) according to HI = ηUI/v, where η is the thermal efficiency [37,38]. In the present work, during deposition, the average currents for samples 6/8 and 7/9 were 96 A and 103 A, respectively, while the average voltage was 11.7 V for both samples. Therefore, the 7/9 condition yielded a moderately higher heat input per unit length compared with the 6/8 condition. This difference in heat input profoundly influences the thermal history experienced by each deposited layer, which collectively governs the evolution of grain size, secondary-phase precipitation, and porosity.
Sample 7/9 exhibited coarser grains (54.7 vs. 51.7 μm) owing to the reduced cooling rate and intensified in situ thermal cycling associated with higher heat input [29,37,39]. Each subsequent deposition pass subjected underlying layers to cyclic reheating that could locally exceed the recrystallization temperature, promoting grain growth particularly in the bottom layers (61.1 vs. 57.4 μm). The higher KAM (0.81° vs. 0.64°) reflects elevated geometrically necessary dislocation densities from greater thermal contraction stresses [29,37]. For coarse precipitates, sample 7/9 had smaller but more numerous particles (0.66 μm, 2.2 μm−2 vs. 0.88 μm, 1.9 μm−2), explained by enhanced nucleation driven by greater solute supersaturation outcompeting grain growth [40,41]. For nanoscale Mg2Si, the 7/9 condition promoted larger precipitates (119.8 × 51.0 nm) and higher density (0.39 nm−2) through increased supersaturation and accelerated solute diffusion during intensified thermal cycling [42,43]. The lower porosity in sample 7/9 (1.3% vs. 3.4%) arose from hydrogen degassing: hydrogen solubility drops over an order of magnitude upon solidification [44]. The higher heat input extends the liquid pool lifetime, slows the solidification front allowing bubble escape, and facilitates bubble coalescence and flotation via buoyancy [44,45].
4.2. Competing Effects of Porosity, Grain Size, and Secondary-Phase Characteristics on Ductility of As-Deposited 6061 Alloys
Sample 7/9 exhibited coarser grains, a higher density of dislocation, and densely distributed secondary phases compared with sample 6/8. According to the traditional Hall–Petch relationship and precipitation strengthening mechanism [46,47,48], coarser grains and larger brittle secondary phases are generally considered detrimental to plastic deformation, as they reduce grain boundary strengthening and easily concentrate stress [49,50,51]. These two factors would be expected to lower the ductility of sample 7/9. However, the experimental elongation results are completely the opposite, indicating that other factors played a decisive role in controlling the ductility of WAAM-fabricated 6061 alloy. The most critical distinction between the two samples lies in porosity. Sample 6/8 possessed a high porosity of 3.4%, characterized by numerous irregular pores and microdefects distributed inside the alloy and along grain boundaries. In contrast, the porosity of sampled 7/9 was only 1.3%, which was more than 60% lower.
The decisive role of porosity in controlling the ductility of the as-deposited WAAM-fabricated 6061 alloy can be understood from three complementary viewpoints. First, among the microstructural variables that differed between samples 6/8 and 7/9, porosity was the only one whose variation was consistent with the observed elongation trend: the classical factors—grain size (Table 2), secondary-phase dimensions (Figure 7, Figure 10 and Figure 11), and dislocation density (Figure 5 and Figure 6)—all predicted inferior ductility for sample 7/9, in direct contradiction with the experimental results. Second, pores act as the strongest pre-existing stress concentrators [52], initiating void growth at the earliest stages of plastic deformation, whereas the much smaller intergranular secondary phases act as secondary crack nucleation sites whose effect on the fracture strain is subordinate [44,53,54]. Third, the pore volume fraction (3.4% vs. 1.3%) controls the inter-pore ligament size and thereby the macroscopic strain at which void coalescence and plastic localization occur. Taken together, these results demonstrate that, for as-deposited WAAM-fabricated 6061 alloy, pore mitigation is far more decisive for ductility than grain refinement, secondary-phase and dislocation control.
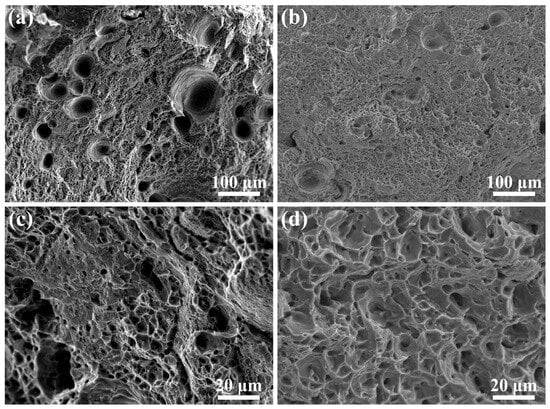
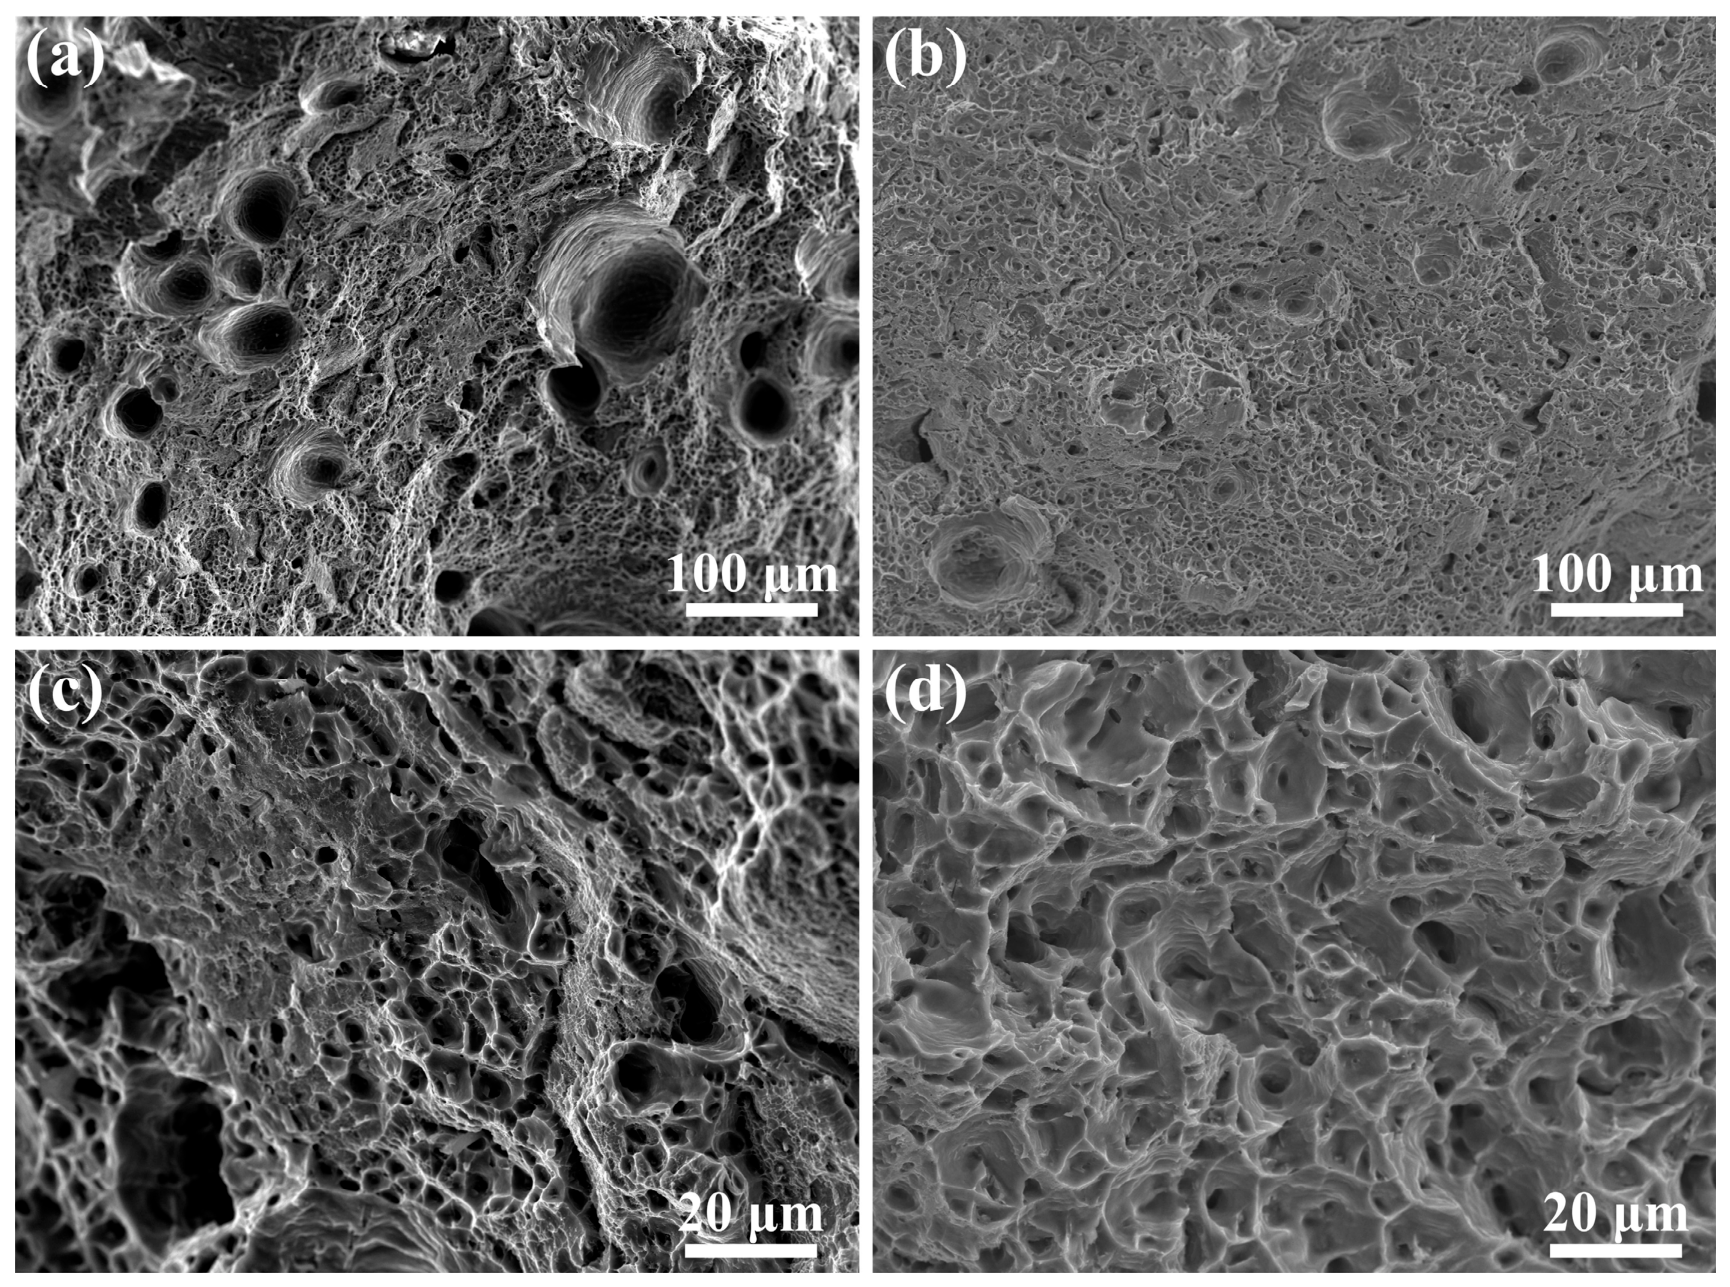
To verify this analysis, the fracture surfaces of samples 6/8 and 7/9 are shown in Figure 13. The fracture surface of sample 6/8 shows numerous pores and a mixed flat/porous morphology, with cracks emanating directly from exposed pores, whereas the fracture surface of sample 7/9 was dominated by fine and deep dimples, confirming that failure in sample 6/8 was controlled by pore nucleation, while sample 7/9 failed due to conventional ductile void coalescence in the matrix.
Figure 13.
Fracture surfaces of samples 6/8 (a,c) and 7/9 (b,d): (a,b) low magnification; (c,d) high magnification.
Table 5 compiles the tensile properties of WAAM-fabricated Al alloys reported in the literature [14,55,56,57,58,59,60] alongside the present results. It can be seen that lower porosity is generally associated with higher elongation, indicating that the plasticity of the alloy is more strongly correlated with porosity than with factors such as grain size. This demonstrates that, for ductility, porosity suppression through process parameter adjustment alone can substitute for far more complex and costly microstructure regulation routes. It is noteworthy that most of the literature lacks a comprehensive comparison of the effects of factors such as alloy grain size, secondary-phase fraction, dislocation density, and porosity on alloy plasticity. The present work therefore provides a systematic account of the relative weight of porosity in the as-deposited WAAM-fabricated 6061 microstructure–property hierarchy.
Table 5.
Comparison of the tensile properties of WAAM-fabricated Al alloys reported in the literature [14,55,56,57,58,59,60] and the present work.
The present results clearly demonstrate that porosity plays a dominant role in determining the ductility of as-deposited WAAM-fabricated 6061 Al alloy, even when grain coarsening and secondary-phase coarsening are unfavorable. Reducing porosity can effectively compensate for the adverse effects of coarser microstructure and significantly improve ductility without sacrificing strength. This finding provides a new perspective that controlling porosity should be prioritized over grain refinement or secondary-phase regulation for optimizing the strength–ductility synergy of WAAM-fabricated 6061 Al alloy.
5. Conclusions
This work systematically investigated the role of porosity in controlling the ductility of WAAM-fabricated 6061 Al alloy by comparing two sets of process parameters. The key conclusions are summarized as follows:
- Sample 7/9 exhibited coarser grains, a higher density of dislocation, and densely distributed second phases compared with sample 6/8, which are theoretically harmful to ductility. Nevertheless, its porosity was reduced to only 1.3%, in contrast to 3.4% for sample 6/8 sample. Despite this coarser and seemingly less favorable microstructure, sample 7/9 had higher ultimate tensile strength (183–190 MPa vs. 170–177 MPa), together with a markedly higher elongation (18.6–19.2% vs. 6.2–10.7%) and a drastically reduced elongation anisotropy between the DD and BD (3.2% vs. 42.1%).
- The abundant pores in sample 6/8 acted as stress concentration sites and rapid crack propagation paths, which triggered early fracture and severely shortened the uniform plastic deformation stage, resulting in lower ductility. The lower porosity of sample 7/9 inhibited early crack nucleation and prolonged uniform plastic deformation. This effect compensated for the adverse influence of grain coarsening and larger secondary phases, achieving excellent strength–ductility synergy.
- This work suggests that reducing porosity is more critical than refining grains and regulating the secondary phase for enhancing ductility within the parameter window investigated. The abundant pores in sample 6/8 acted as the dominant crack initiation sites and shortened the uniform deformation stage, whereas their suppression in sample 7/9 permitted ductile failure governed by matrix void coalescence. Reasonably adjusting parameters to suppress pore formation provides an effective and practical strategy for developing high-performance WAAM-fabricated Al alloys.
Supplementary Materials
The following supporting information can be downloaded at: https://www.mdpi.com/article/10.3390/jmmp10110482/s1, Table S1. Average porosity under different process parameters.
Author Contributions
Conceptualization, H.Z., R.L. and Z.Z.; Methodology, H.Z. and Z.L.; Software, Y.Z., P.Y. and S.L.; Validation, Y.S., P.Y., S.L. and Z.L.; Formal analysis, S.L. and Z.L.; Investigation, H.Z. and Y.S.; Resources, H.Z., Z.Z., Y.Z. and J.Z.; Data curation, H.Z., Y.S. and Y.Z.; Writing—original draft, H.Z.; Writing—review & editing, H.Z. and R.L.; Visualization, Y.S.; Supervision, R.L., Z.Z. and G.Q.; Project administration, R.L. and G.Q.; Funding acquisition, H.Z., R.L. and G.Q. All authors have read and agreed to the published version of the manuscript.
Funding
This work was supported by the National Natural Science Foundation of China (grant Nos. 52171121 and 52201131), Youqing Cultivation Program of Shenyang University of Chemical Technology (2022YQ006), and Liaoning Provincial Key R&D Program Project (No. 2025JH2/102700008).
Data Availability Statement
The original contributions presented in this study are included in the article. Further inquiries can be directed to the corresponding author(s).
Conflicts of Interest
The authors declare no conflict of interest.
References
- Li, J.; Wang, Z.; Chen, M.T.; Su, A.; Zhao, O. Wire arc additively manufactured aluminium alloy open sections: 3D geometric analysis and compressive behaviour. Thin-Walled Struct. 2026, 224, 114687. [Google Scholar] [CrossRef] [Scilit]
- Kesarwani, S.; Yuvaraj, N. Optimization of CMT-WAAM process parameters to minimize the porosity and surface roughness in bimetallic wall of aluminium alloys. Weld. World 2025, 69, 989–1002. [Google Scholar] [CrossRef] [Scilit]
- Omiyale, B.; Olugbade, T.; Abioye, T.; Farayibi, P. Wire arc additive manufacturing of aluminium alloys for aerospace and automotive applications: A review. Mater. Sci. Technol. 2022, 38, 391–408. [Google Scholar] [CrossRef] [Scilit]
- Sinha, A.K.; Pramanik, S.; Yagati, K.P. Research progress in arc based additive manufacturing of aluminium alloys—A review. Measurement 2022, 200, 111672. [Google Scholar] [CrossRef] [Scilit]
- Sahoo, S.; Adinarayanappa, S.M.; Rajendran, A. Investigation of defect formation and nozzle behaviour in WAAM of aluminium alloy under different process parameters. Prog. Addit. Manuf. 2025, 10, 9621–9635. [Google Scholar] [CrossRef] [Scilit]
- Habib, N.; Vafadar, A.; Guzzomi, F. A comparative study of aluminium properties manufactured using additive friction stir deposition (AFSD) and wire arc additive manufacturing (WAAM). Prog. Addit. Manuf. 2025, 10, 8963–8983. [Google Scholar] [CrossRef] [Scilit]
- Srinivas, M.N.; Vimal, K.; Manikandan, N.; Sritharanandh, G. Parametric optimization and multiple regression modelling for fabrication of aluminium alloy thin plate using wire arc additive manufacturing. Int. J. Interact. Des. Manuf. 2026, 20, 4543–4553. [Google Scholar] [CrossRef] [Scilit]
- Nourian, A.; Schwartz, T.; Boese, S.; Müftü, S. Effects of process parameters on cold spray deposition of Al-6061 alloy. J. Therm. Spray Technol. 2022, 31, 2517–2536. [Google Scholar] [CrossRef] [Scilit]
- Lal, C.; Dhiman, B.; Tejyan, S.; Singh, V. Aluminum 6061 alloy and metal matrix composites: A bibliometric analysis (1973–2023). Mater. Today Proc. 2024, in press. [Google Scholar] [CrossRef] [Scilit]
- Khalfallah, A.; Azzeddine, H.; Baudin, T.; Brisset, F.; Huang, Y.; Langdon, T.G. Texture and microstructural evolution in an Al-6061 alloy processed by high-pressure torsion. Mater. Charact. 2024, 212, 114020. [Google Scholar] [CrossRef] [Scilit]
- Singh, S.P.; George, D.T.; Xavier, A.A.J.; Raja, G.A. Effect of heat treatment on the hardness behaviour of the aluminium 6061 alloy. Mater. Today Proc. 2023, in press. [Google Scholar] [CrossRef] [Scilit]
- Chaudhary, B.; Jain, N.K.; Murugesan, J.; Patel, V. Friction stir powder additive manufacturing of Al 6061 alloy: Enhancing microstructure and mechanical properties by reducing thermal gradient. J. Mater. Res. Technol. 2023, 26, 1168–1184. [Google Scholar] [CrossRef] [Scilit]
- Doumenc, G.; Couturier, L.; Courant, B.; Paillard, P.; Benoit, A.; Gautron, E.; Girault, B.; Pirling, T.; Cabeza, S.; Gloaguen, D. Investigation of microstructure, hardness and residual stresses of wire and arc additive manufactured 6061 aluminium alloy. Materialia 2022, 25, 101520. [Google Scholar] [CrossRef] [Scilit]
- Chi, Y.; Murali, N.; Liu, J.; Liese, M.; Li, X. Wire arc additive manufacturing (WAAM) of nanotreated aluminum alloy 6061. Rapid Prototyp. J. 2023, 29, 1341–1349. [Google Scholar] [CrossRef] [Scilit]
- Wang, F.; Wei, J.; Wu, G.; Qie, M.; He, C. Microstructural modification and enhanced mechanical properties of wire-arc additive manufactured 6061 aluminum alloy via interlayer friction stir processing. Mater. Lett. 2023, 342, 134312. [Google Scholar] [CrossRef] [Scilit]
- Lekkala, N.; Prasad, K.S. Investigation of Mechanical and Microstructural Characteristics of Aluminum 6061 through Wire Arc Additive Manufacturing under As-Deposited and Post-Heat-Treated Conditions. J. Mater. Eng. Perform. 2025, 34, 25519–25527. [Google Scholar] [CrossRef] [Scilit]
- Doumenc, G.; Courant, B.; Couturier, L.; Paillard, P.; Girault, B.; Pirling, T.; Cabeza, S.; Moya, M.J.; Gloaguen, D. Investigation of residual stresses and modeling of tensile deformation in wire-arc additive manufactured 6061 aluminum alloy: Diffraction and elastoplastic self-consistent model. Mater. Sci. Eng. A 2024, 890, 145891. [Google Scholar] [CrossRef] [Scilit]
- Meena, R.P.; N, Y.; Vipin. A review on wire arc additive manufacturing based on cold metal transfer. Mater. Manuf. Processes 2024, 39, 1315–1341. [Google Scholar] [CrossRef] [Scilit]
- Vimal, K.; Srinivas, M.N.; Rajak, S. Wire arc additive manufacturing of aluminium alloys: A review. Mater. Today 2021, 41, 1139–1145. [Google Scholar] [CrossRef] [Scilit]
- Hu, Y.; Chen, F.; Cao, S.; Fan, Y.; Xie, R. Preparation and characterization of CMT wire arc additive manufacturing Al-5% Mg alloy depositions through assisted longitudinal magnetic field. J. Manuf. Processes 2023, 101, 576–588. [Google Scholar] [CrossRef] [Scilit]
- Fan, Y.; Chen, F.; Cao, S.; Hu, Y.; Xie, R. Effect of coating submicron-sized La2O3 particles on regulating grain structure and mechanical properties of 6061 aluminum alloy CMT welded joints. Mater. Today Commun. 2024, 38, 107764. [Google Scholar] [CrossRef] [Scilit]
- Lekkala, N.; Prasad, K.S.; Rao, C.S. Analysis of the influence of deposition parameters on wire arc additive manufacturing of aluminium 6061 using ANN. Eng. Res. Express 2026, 8, 065505. [Google Scholar] [CrossRef] [Scilit]
- Hu, Y.; Chen, F.; Cao, S.; Fan, Y.; Xie, R. Improvement of microstructure and mechanical properties of CMT wire arc additive manufacturing Al-Si alloy deposition via interlayer coating TiC nanoparticles. Mater. Today Commun. 2024, 38, 107851. [Google Scholar] [CrossRef] [Scilit]
- Guo, G.; Wei, J.; Wu, G.; Kang, C.; He, C. Achieving high strength and fatigue performance of wire-arc additive manufactured 6061 aluminum alloy via interlayer friction stir processing and heat treatment. Mater. Lett. 2024, 370, 136844. [Google Scholar] [CrossRef] [Scilit]
- Yi, H.; Yang, L.; Jia, L.; Huang, Y.; Cao, H. Porosity in wire-arc directed energy deposition of aluminum alloys: Formation mechanisms, influencing factors and inhibition strategies. Addit. Manuf. 2024, 84, 104108. [Google Scholar] [CrossRef] [Scilit]
- Subadra, S.P.; Mayer, E.; Wilke, R.N.; Alaparthi, S.; Marquardt, A.; Marzoli, L.; Yapici, G.G.; Sheikhi, S. Process–Porosity–Property Relationships in Directed Energy Deposition (DED-Arc) of Al-Mg-Si Alloy. J. Mater. Eng. Perform. 2026. [Google Scholar] [CrossRef] [Scilit]
- Arana, M.; Ukar, E.; Rodriguez, I.; Iturrioz, A.; Alvarez, P. Strategies to reduce porosity in Al-Mg WAAM parts and their impact on mechanical properties. Metals 2021, 11, 524. [Google Scholar] [CrossRef] [Scilit]
- Sui, C.; Liu, Z.; Ai, X.; Liu, C.; Zou, Z. Effect of ultrasonic vibration on grain size and precipitated phase distribution of 6061 aluminum alloy welded joint. Crystals 2022, 12, 240. [Google Scholar] [CrossRef] [Scilit]
- Su, C.; Chen, X.; Gao, C.; Wang, Y. Effect of heat input on microstructure and mechanical properties of Al-Mg alloys fabricated by WAAM. Appl. Surf. Sci. 2019, 486, 431–440. [Google Scholar] [CrossRef] [Scilit]
- Zhang, M.; Jiang, T.; Feng, X.; Xie, Y.; Su, Y.; Sun, Z.; Wang, W.; Xu, Y.; Li, W. Investigation on in-situ tensile behaviors of 6061 aluminum alloy fabricated by wire additive friction stir deposition. J. Alloys Compd. 2024, 1008, 176780. [Google Scholar] [CrossRef] [Scilit]
- Wang, Y.; Zhou, X.; Xiong, X.; Yuan, Y.; Bai, X.; Fu, J.; Wu, H. Numerical simulation of heat and mass transfer in wire arc additive manufacturing of TiC particle reinforced 6061 aluminum alloy. Int. Commun. Heat Mass Transf. 2025, 161, 108454. [Google Scholar] [CrossRef] [Scilit]
- GB/T 3850-2015; Impermeable Sintered Metal Materials and Hardmetals—Determination of Density. Standards Press of China: Beijing, China, 2015. (In Chinese)
- Xu, W.; Ming, G.; Hui, C. Wire arc additive manufacturing of Al-Si-Mg aluminum alloy through wire−powder synchronous deposition. Trans. Nonferrous Met. Soc. China 2025, 35, 701–714. [Google Scholar] [CrossRef] [Scilit]
- Li, C.; Gu, H.; Wang, W.; Wang, S.; Ren, L.; Wang, Z.; Ming, Z.; Zhai, Y. Effects of magnesium on the microstructure and properties of Al–Si alloy deposited by wire and arc-based additive manufacturing. Mater. Technol. 2021, 36, 793–798. [Google Scholar] [CrossRef] [Scilit]
- Li, C.; Gu, H.; Wang, W.; Wang, S.; Ren, L.; Wang, Z.; Ming, Z.; Zhai, Y. Effect of heat input on formability, microstructure, and properties of Al–7Si–0.6 Mg alloys deposited by CMT-WAAM process. Appl. Sci. 2019, 10, 70. [Google Scholar] [CrossRef] [Scilit]
- Yuan, T.; Sha, Y.; Wang, S.; Yang, S.; Zhao, C.; Shan, H.; Chen, S. Microstructure evolution and mechanical properties of friction stir additive manufacturing for Al-6061 alloy builds under thermal cycling. J. Alloys Compd. 2025, 1027, 180559. [Google Scholar] [CrossRef] [Scilit]
- Kou, S. Welding Metallurgy; Cambridge University Press: Cambridge, UK, 2003; pp. 223–225. [Google Scholar]
- DebRoy, T.; Wei, H.L.; Zuback, J.S.; Mukherjee, T.; Elmer, J.W.; Milewski, J.O.; Beese, A.M.; Wilson-Heid, A.; De, A.; Zhang, W. Additive manufacturing of metallic components–process, structure and properties. Prog. Mater. Sci. 2018, 92, 112–224. [Google Scholar] [CrossRef] [Scilit]
- Kurz, W.; Fisher, D. Fundamentals of Solidification, 4th ed.; Trans Tech Publications: Wollerau, Switzerland, 1998. [Google Scholar]
- Deschamps, A.; Brechet, Y. Influence of predeformation and ageing of an Al–Zn–Mg alloy—II. Modeling of precipitation kinetics and yield stress. Acta Mater. 1998, 47, 293–305. [Google Scholar] [CrossRef] [Scilit]
- Bardel, D.; Perez, M.; Nelias, D.; Deschamps, A.; Hutchinson, C.R.; Maisonnette, D.; Chaise, T.; Garnier, J.; Bourlier, F. Coupled precipitation and yield strength modelling for non-isothermal treatments of a 6061 aluminium alloy. Acta Mater. 2014, 62, 129–140. [Google Scholar] [CrossRef] [Scilit]
- Edwards, G.A.; Stiller, K.; Dunlop, G.L.; Couper, M.J. The precipitation sequence in Al–Mg–Si alloys. Acta Mater. 1998, 46, 3893–3904. [Google Scholar] [CrossRef] [Scilit]
- Murayama, M.; Hono, K. Pre-precipitate clusters and precipitation processes in Al–Mg–Si alloys. Acta Mater. 1999, 47, 1537–1548. [Google Scholar] [CrossRef] [Scilit]
- Samuel, A.M.; Samuel, E.; Songmene, V.; Samuel, F.H. A review on porosity formation in aluminum-based alloys. Materials 2023, 16, 2047. [Google Scholar] [CrossRef] [Scilit]
- Vreeman, C.J.; Krane, M.J.M.; Incropera, F.P. The effect of free-floating dendrites and convection on macrosegregation in direct chill cast aluminum alloys: Part I: Model development. Int. J. Heat Mass Transf. 2000, 43, 677–686. [Google Scholar]
- Zhang, L.; Liu, C.; Xie, H. Hall–Petch relation and grain boundary slipping in AlMgSc alloys with fine equiaxed grain structure. Mater. Charact. 2022, 194, 112472. [Google Scholar] [CrossRef] [Scilit]
- Yang, J.; Yuan, L.; Zhang, H. Hall-Petch relationship in multiscale cellular structures of Al-Si alloy fabricated by laser powder bed fusion. Mater. Today Commun. 2024, 40, 109518. [Google Scholar] [CrossRef] [Scilit]
- Banerjee, S.; Gogoi, S.; Siddiqui, H.R.; Kirtania, S.; Kashyap, S.; Bhadra, R. Development of Hall-Petch and Hollomon models for thermo-mechanically treated Al-Cu-Mg alloys with trace additions of Sn. Adv. Mater. Process. Technol. 2024, 10, 2895–2917. [Google Scholar] [CrossRef] [Scilit]
- Kumar, N.S.; Pramod, G.; Samrat, P.; Sadashiva, M. A critical review on heat treatment of aluminium alloys. Mater. Today 2022, 58, 71–79. [Google Scholar] [CrossRef] [Scilit]
- Chen, M.; Liu, S.; He, K.; Zheng, X.; Jia, G. The effect of precipitate-free zone on mechanical properties in Al-Zn-Mg-Cu aluminum alloy: Strain-induced back stress strengthening. J. Alloys Compd. 2023, 969, 172426. [Google Scholar] [CrossRef] [Scilit]
- Li, Q.; Qin, J.; Jiang, D.; Yi, D.; Wang, B. Precipitate coarsening and mechanical properties in 6082 aluminium alloy during long-term thermal exposure. J. Alloys Compd. 2022, 909, 164819. [Google Scholar] [CrossRef] [Scilit]
- Biswal, R.; Syed, A.K.; Zhang, X. Assessment of the effect of isolated porosity defects on the fatigue performance of additive manufactured titanium alloy. Addit. Manuf. 2018, 23, 433–442. [Google Scholar] [CrossRef] [Scilit]
- Li, J.; Jiang, P.; Geng, S.; Xiong, J. Numerical and experimental study on keyhole dynamics and pore formation mechanisms during adjustable-ring-mode laser welding of medium-thick aluminum alloy. Int. J. Heat Mass Transf. 2023, 214, 124443. [Google Scholar] [CrossRef] [Scilit]
- Yang, B.C.; Chen, S.F.; Song, H.W.; Zhang, S.H.; Chang, H.P.; Xu, S.W.; Zhu, Z.H.; Li, C.H. Effects of microstructure coarsening and casting pores on the tensile and fatigue properties of cast A356-T6 aluminum alloy: A comparative investigation. Mater. Sci. Eng. A 2022, 857, 144106. [Google Scholar] [CrossRef] [Scilit]
- Das, P.; Savinov, R.; Bandari, Y.; Roy, S. Evolution of microstructure and tensile behavior as a function of build height in nano-treated aluminum alloy deposited via wire arc additive manufacturing. Mater. Sci. Eng. A 2026, 960, 150070. [Google Scholar] [CrossRef] [Scilit]
- Jeon, M.S.; Huang, Y.; Kam, D.H.; Oh, M.S.; Lee, K.A. Interlayer integrity and mechanical anisotropy of WAAM-processed Al-Mg alloys. J. Alloys Compd. 2025, 1042, 184124. [Google Scholar] [CrossRef] [Scilit]
- Zhang, J.; Zhuo, X.; Shi, M.; Qiao, Y.; Wang, Y.; Zhang, Z.; Li, J. Near Immersion active cooling assisted WAAM of 5356 aluminum Alloy: Formability and microstructural evolution. J. Mater. Res. Technol. 2025, 38, 5657–5667. [Google Scholar] [CrossRef] [Scilit]
- Gierth, M.; Henckell, P.; Ali, Y.; Scholl, J.; Bergmann, J.P. Wire arc additive manufacturing (WAAM) of aluminum alloy AlMg5Mn with energy-reduced gas metal arc welding (GMAW). Materials 2020, 13, 2671. [Google Scholar] [CrossRef] [Scilit]
- Wieczorowski, M.; Pereira, A.; Carou, D.; Gapinski, B.; Ramírez, I. Characterization of 5356 aluminum walls produced by wire arc additive manufacturing (WAAM). Materials 2023, 16, 2570. [Google Scholar] [CrossRef] [Scilit]
- Wang, D.; Lu, J.; Tang, S.; Yu, L.; Fan, H.; Ji, L.; Liu, C. Reducing Porosity and Refining Grains for Arc Additive Manufacturing Aluminum Alloy by Adjusting Arc Pulse Frequency and Current. Materials 2018, 11, 1344. [Google Scholar] [CrossRef] [Scilit]

Disclaimer/Publisher’s Note: The statements, opinions and data contained in all publications are solely those of the individual author(s) and contributor(s) and not of MDPI and/or the editor(s). MDPI and/or the editor(s) disclaim responsibility for any injury to people or property resulting from any ideas, methods, instructions or products referred to in the content. |
© 2026 by the authors. Licensee MDPI, Basel, Switzerland. This article is an open access article distributed under the terms and conditions of the Creative Commons Attribution (CC BY) license.