


Highlights
What are the main findings?
- Under the simulated scenarios, the grid-constrained airspace configuration systematically generates a higher number of conflicts than the free route concept, and these conflicts are more difficult to resolve.
- More freedom in the vertical dimension reduces the overall number of conflicts with respect to a layered strategy and improves the rate of conflicts that can be resolved.
What is the implication of the main finding?
- A rigid grid-based structure may be suboptimal under the high traffic densities anticipated in the future.
- Premature imposition of artificial structures, in the absence of demonstrated performance gains, may limit the safety, efficiency, and scalability potential of the emerging urban air mobility ecosystem.
Abstract
Cities are increasingly addressing mobility challenges by restricting road traffic, particularly traditional road vehicles that generate greenhouse gas emissions. As an alternative, unmanned aircraft systems (UASs) are emerging as a promising solution for future mobility, offering fast, quiet, cost-effective and environmentally friendly operations. For last-mile delivery, small drones operating at low altitudes are considered especially promising and are already being deployed in some urban areas. According to the EU Drone Strategy 2.0, drone services could generate a market of 14.5 billion and create 145,000 jobs in Europe by 2030. As this sector is still in its early stages, there is a significant uncertainty about the optimal organisation of urban air traffic. In this paper we present a realistic prognosis of how unmanned traffic over a city will utilise the urban very-low-level airspace and assess it using two concepts of operations, with non-structured or structured airspace, both aiming to facilitate the coexistence of competitors sharing the same urban low level airspace. The two concepts are evaluated with delivery operations at scale for a large and densely populated European city. Results for a normalised scenario of 3500 daily operations show that structured airspace produces more conflicts than non-structured airspace (e.g., 316 vs. 54, respectively), and that only for the non-structured airspace can all conflicts be solved with a simple strategic altitude reassignment (vs. 10% of unresolved conflicts for structured airspace). The artificial organisation of slim urban airspace may limit the scalability of business delivery while not reducing the conflict rate.
1. Introduction
The population in urban areas is constantly growing, and it is estimated that by 2050 nearly 68% of the global population will live in cities [1], generating an additional demand for freight and services. It is worth mentioning that approximately 20–30% of urban road traffic is generated by last-mile delivery operations, which typically involve small parcels transported by bicycles or motorbikes [2]. Underpinned by the framework of sustainable urban mobility plans (SUMPs), cities and regional authorities began to set a range of measures to combat the negative effects of urban freight transportation. Despite these efforts, specific policies targeting the last-mile delivery in urban areas are still very scarce [3]. Among the viable solutions proposed to reduce the environmental footprint of urban logistics, several studies highlight the potential of adopting electric vehicles for last-mile deliveries. However, their widespread implementation is associated with multiple challenges, including limited battery range, long charging times, high acquisition costs, and the scarcity of adequate charging infrastructure [4]. These constraints have motivated the exploration of alternative delivery modes that can alleviate road congestion and reduce emissions.
Urban logistics chains are commonly divided into three main operational segments. First-mile logistics refers to the initial movement of goods from producers, suppliers, or fulfilment facilities to warehouses, consolidation centres, or distribution centres. Middle-mile logistics refers to the transfer of goods between logistics nodes, such as warehouses, sorting centres, local depots, and urban consolidation centres. Last-mile logistics refers to the final delivery stage, in which parcels are transported from a local depot, retailer, distribution centre, or micro-fulfilment facility to the final customer or delivery point. Drones may potentially support each of these segments under different assumptions: larger cargo unmanned aircraft systems (UASs) may be suitable for middle-mile hub-to-hub transport, whereas small UAS are more naturally aligned with last-mile delivery of lightweight parcels in dense or congested urban environments. The present study focuses on this latter case.
Other delivery modes can also contribute to more sustainable urban logistics, including small electric delivery vehicles, cargo bikes, and autonomous delivery robots. Small electric vehicles can carry larger loads than UAS, but they still depend on the road network and may be affected by congestion, parking limitations, and access restrictions. Cargo bikes are well suited to dense urban areas because they are flexible, low-emission, and easier to park, although their range, payload, and speed are limited. Delivery robots can support short-distance deliveries in pedestrian areas or controlled environments, but they require suitable ground infrastructure and operate at low speed. Compared with these ground-based alternatives, UASs can avoid road congestion and provide faster point-to-point delivery for lightweight parcels, but they are limited by payload, range, weather sensitivity, noise, privacy concerns, infrastructure needs, and airspace regulation. Therefore, UASs should be considered as a complementary option within urban logistics systems rather than as a replacement for all ground-based delivery modes.
Within this last-mile logistics context, UASs, commonly referred to as drones, have emerged as a promising complementary solution capable of offering faster and more flexible operations, particularly in congested or hard-to-access urban environments. For instance, the aerial service company Manna has tested and operated drone delivery services in several locations, including Moneygall, Oranmore, Balbriggan, Blanchardstown, and Cork in Ireland, as well as Helsinki, Finland, and Texas, United States [5]. More recently, Manna partnered with Deliveroo to launch drone deliveries from Blanchardstown, Dublin 15, serving customers within a 3 km local delivery radius [6,7]. Similar initiatives are taking place in Australia and the United States (US) with Wing in partnership with Walmart [8], in Texas with Amazon Prime Air [9], and in Switzerland (RigiTech [10]). However, in all these cases, only a single delivery operator is currently using the urban airspace. In recent years, UAV use has expanded from last-mile logistics to include precision farming, disaster management [11], search and rescue (SAR) [12], and the rapid delivery of emergency medical supplies [13]. Public acceptance for these operations is highly context dependent: while ’drones for good’—such as those used by trusted authorities for lifesaving and medical purposes—enjoy high levels of legitimacy, private or commercial applications often face greater scrutiny regarding privacy [14,15], noise [16,17], and safety [15].
To enable the broader development of commercial drone-based delivery systems, regulatory frameworks are being established worldwide to ensure safe and competitive environments where multiple private companies can operate simultaneously. In Europe, the U-space regulation [18] states the rules for the management of the so called innovative air mobility (IAM) which includes not only small unmanned aerial vehicles but also (manned and unmanned) electrical aircraft with vertical take-off and landing capabilities (eVTOL). In the United States, a closely related concept, Advanced Air Mobility (AAM), is being developed, supported by an ongoing legislative initiative (the FAA’s Part 108) aimed at enabling commercial beyond visual line-of-sight (BVLOS) operations. In this context, the drone traffic management system is referred to as Unmanned Aircraft System Traffic Management (UTM) in the United States [19], with national variants such as JUTM in Japan [20], K-UTM in Korea [21], and UTM–UAS in Singapore [22], while China has adopted the term UOMS (UAS Operation Management System) [20].
Nevertheless, the current regulatory frameworks still make routine commercial drone delivery difficult to deploy at scale since repeated urban operations typically require operational authorisation, risk assessment, qualified personnel, and compliance with digital traffic-management services where applicable.
In this evolving regulatory landscape, both the European and US approaches converge toward the provision of fully digitalised traffic management services to enable beyond visual line-of-sight (BVLOS) UAS operations. However, neither framework currently prescribes a predefined airspace structure for organising low altitude urban traffic. In Europe, the U-space Regulation [18] defines four mandatory services, among which the Flight Authorisation Service is responsible for strategic deconfliction of planned operations. Future regulatory evolutions are expected to introduce requirements for tactical deconfliction services to manage in-flight conflicts. Similarly, several technologically advanced countries including Japan, Australia, China, and the United Arab Emirates are adopting similar UTM based frameworks aligned with digital service provision and progressive integration of higher levels of automation.
In line with ICAO guidance, most regulatory jurisdictions have introduced altitude limitations defining what is commonly referred to as very-low-level (VLL) airspace. This upper boundary segregates low altitude operations from conventional aviation, which generally operates above such altitudes, thereby minimising potential safety risks. The VLL airspace can be described as a three-dimensional volume reserved primarily for unmanned and innovative air mobility operations, anticipated to scale significantly in the coming years. However, there are still uncertainties about the operational characteristics of this traffic, as well as the organisation of the airspace volume.
Across regulatory frameworks, two main principles consistently emerge: first, access to VLL airspace should remain open to operators that demonstrate compliance with defined safety and performance requirements; second, traffic management should rely on digital service provision. This digitalisation is considered essential given the projected growth and density of unmanned traffic, particularly in urban environments. This level of traffic would undoubtedly exceed the practical limits of human-based air traffic control [23]. These services are typically envisioned as being deployed at a local or regional level, covering urban, suburban, or metropolitan areas.
A further important element of this ecosystem concerns the infrastructure supporting last-mile operations, commonly referred to as vertiports, droneports, or vertihubs. Although regulatory and research efforts have begun to address the safety aspects of operations in these facilities [24], current operational deployments for small-scale delivery services often rely on relatively simple ground infrastructure, such as rooftops or designated parking areas.
The objective of this work is to provide a realistic assessment of how unmanned traffic could occupy urban VLL airspace and to assess the effectiveness of two distinct airspace organisation concepts. The first concept follows the approach commonly found in academic studies, where traffic is highly structured, but the underlying urban terrain is not considered. To address this limitation, we introduced a common reference altitude applied consistently across the entire network. The second concept reflects current UAS operational practices, in which operators optimise individual flight routes, operate without a formal airspace structure, and ensure compliance with VLL regulations. In this latter case, particular attention was given to accounting for the terrain below when generating trajectories, in order to better approximate realistic vertical profiles of flight. FR is evaluated using two vertical organisation options: a continuous-altitude configuration, which provides maximum vertical freedom, and a layered configuration, referred to as Layered Free Route (LFR), which applies the same discrete vertical structure and conflict-resolution approach as CA. This additional FR configuration enables the influence of horizontal airspace organisation to be assessed separately from the effect of vertical discretisation.
The contribution of this work is twofold, comprising both theoretical and empirical aspects. From a theoretical perspective, we introduce a traffic generation framework that explicitly models last-mile drone delivery operations performed simultaneously by multiple operators. The framework provides a methodology for analysing the interaction between competing delivery operators and different airspace organisation concepts, including a novel ground-aware vertical concept, within a common simulation environment. The new concept aims to address operators’ individual economic interests by obtaining lower and faster paths. From an empirical perspective, the proposed framework is applied to a realistic urban case study to evaluate two alternative airspace organisations, namely structured and unstructured airspace, under varying traffic demand levels. This assessment is carried out in terms of operator costs (expressed as flight time) and Air Traffic Management (ATM) workload (expressed as the number of potential conflicts that need to be solved), allowing for the identification of potential trade-offs.
The paper is organised as follows: Section 2 provides the state of the art on the previous proposal for VLL airspace organisation, identifying existing gaps and areas for improvement. Section 3 provides the methodology for the drone traffic generation. Section 4 and Section 5 present the use cases and their results respectively. Further, Section 6 provides some discussion about the results and the limitations. Finally, conclusions are found in Section 7.
2. Literature Review
Urban airspace at the very low level (VLL) constitutes a shared and non-expendable spatial resource. Most current national regulations impose altitude limitations to reduce interactions with conventional aviation, which generally operates above 500 feet above ground level [25,26,27]. As a result, the upper boundary of the VLL airspace is typically constrained to approximately 120–150 m.
Although regulations generally do not specify a lower altitude limit for operations within VLL airspace, the high density of urban obstacles, such as buildings, rooftop installations, trees, utility poles and cables, lighting masts, antennas, cranes, and elevated infrastructure, requires maintaining a safety margin above the surface. Additional considerations include noise and visual disturbance to residents, as well as public safety perception, which often drives air traffic to higher altitudes. Consequently, the usable volume of VLL airspace is highly limited and must be efficiently managed to allow large-scale operations.
Urban air operations at scale encompass both UAS for parcel delivery and eVTOL aircraft for passenger transport. According to the review by Kellermann et al. [28], the main expected benefits include reductions in traffic congestion and commuting times. Other social advantages include enhanced healthcare services, improved effectiveness of search and rescue missions, and rapid delivery of small, time-critical parcels. The study concludes that the availability and efficient use of urban airspace are essential prerequisites for the realisation of urban air mobility.
While regulations worldwide impose vertical constraints on VLL airspace, they generally do not provide any guidance regarding its horizontal organisation. As a result, the design of urban airspace structures has been largely explored by academic and research institutions, which have proposed and analysed various organisational concepts.
For example, Doole et al. [29] proposed organising the airspace over Manhattan, New York City, into multiple altitude layers drawing inspiration from the conventional Air Traffic Management (ATM) hemispheric rule (i.e., cruising aircraft above flight level FL240 operate at even or odd flight levels depending on their magnetic track). Their approach considers up to 20 vertical layers, separated by 50 feet, with traffic segmented by velocity, based on the fact that reducing relative velocities decreases the probability of conflicts. In addition, the proposed air traffic network follows the city street layout, in order to mitigate privacy concerns and facilitate potential synergies with ground transportation systems, as delivery drones could operate along corridors aligned with existing infrastructure. Within this layered framework, two operational concepts are introduced: a one-way configuration, in which all layers associated with a given “street” share the same direction of travel, and a two-way configuration, in which alternating layers support opposite traffic directions. Direction changes are performed by transitioning to an intermediate layer located 25 ft above or below the cruising layer before entering the target layer with the desired heading. Although the study presents pioneering work in this field, it has some substantial limitations for real-world application. Namely, the proposed layered structure assumes flat terrain, neglecting any terrain slope when defining layer altitudes. Furthermore, the fact that the horizontal layout is created over the streets of the city makes the study ignore buildings and other urban obstacles. Finally, the analysis focuses exclusively on the cruise phase of the flight, without considering departure and arrival as important manoeuvres.
In a similar vein, Wang et al. [30] explored network design in the VLL airspace of Singapore. The authors proposed a grid-based multi-layer route network with altitude levels ranging from 150 ft to 250 ft with an increment of 25 ft. Static urban obstacles, derived from a global digital surface model, are protected by geofences with a fixed keep-out margin, resulting in fewer constraints at higher altitudes. While obstacles are explicitly considered, vertiport and delivery site elevations are assumed to be uniform, and no explicit conflict assessment is performed. Focusing exclusively on drone delivery operations, ref. [31] proposed a layered VLL airspace design in which UAS are constrained to operate between buildings and above road networks, particularly in areas with tall structures. This approach is motivated by regulatory altitude limits and societal concerns related to privacy and noise. The layered structure is intended to mitigate emergent congestion effects at high traffic densities through strict layer assignment rules [32]. Although obstacles are considered in the simulations, terrain slope is neglected, limiting the generality of the approach beyond flat urban environments (such as New York City).
Unlike previous studies focusing on drone operations in VLL airspace, passenger transport applications at the metropolitan scale have also been investigated. For instance, the study of Wang et al. [33] analysed the vertiport locations in the Greater Bay Area, a region comprising 11 densely populated cities in China. The proposed airspace structure is defined as a network of direct routes (including take-off and landing operations) connecting candidate vertiports. The network design is evaluated for a total of 216 potential vertiport locations, from which 30 are ultimately selected based on economic viability and their ability to accommodate high passenger demand expected between cities. In a subsequent extension of this work [34], the authors conclude that corridor-based airspace designs are the most suitable for minimising impacts on both citizens and the environment. However, these studies do not address the scalability of operations and are primarily focused on passenger transportation within inter-urban airspace. For the São Paulo region, ref. [35] presented an optimised route network for four-seat eVTOL aircraft, with the objective of reducing travel costs through optimisation of speed, altitude, and origin–destination pairs. Although take-off and landing altitudes are considered, terrain effects during the cruise phase are neglected, and all proposed operating altitudes lie above the VLL. As an extension of the concept, Kar et al. [36] designed multimodal air corridors for highly dense Indian cities by aligning aerial routes with existing ground transportation networks. Artificial intelligence techniques are employed to identify congested corridors and optimal vertiport locations; however, trajectory definitions, altitude allocation, and terrain slope are not explicitly modelled.
Several review studies systematised these airspace design concepts. A comprehensive survey in [37] classified the proposed airspace structures into air–matrix, air–network, air–tube, and unstructured categories, and evaluates them in terms of safety, efficiency, and computational and communication requirements. Similarly, ref. [38] identified gridding, stratification, and networking as the main analytical approaches to VLL airspace design, and further distinguished between free flight, corridor-, tube-, and lane-based models. For each category, relevant collision risk assessment principles are discussed.
Traffic demand assumptions and scalability remain open challenges. Studies such as [29,39] relied on synthetic traffic scenarios to estimate UAS demand in cities such as Manhattan and Vienna, exploring a wide range of traffic densities. These works typically assume homogeneous vehicle performance, fixed cruise speeds, and constant cruise altitudes, neglecting take-off, landing, and terrain-induced altitude variations. Reported results indicate increasing delays and conflict rates as traffic density grows, highlighting the need for more scalable airspace designs.
Uncertainty also persists regarding separation minima and conflict management strategies. Fixed horizontal and vertical separation thresholds are commonly assumed [29,39,40], while dynamic separation concepts have been proposed in projects such as BUBBLEs. Conflict-resolution approaches range from centralised strategic planning to fully distributed tactical control, with hybrid strategies generally demonstrating improved safety performance under dense traffic conditions [39].
Despite the extensive body of literature, terrain slope is largely ignored in existing VLL airspace design approaches. Flights are typically assumed to operate at constant geometric altitudes, with altitude changes occurring only during turns. An exception is the Labyrinth project [41], which demonstrated UTM services using terrain-following altitude references; however, experiments revealed ambiguity and safety concerns related to altitude definition. The ICARUS project [42] subsequently emphasised the need for a common altitude reference to avoid altitude confusion, but it focus on manned aviation barometric altitude versus global navigation satellite systems altitude.
This work addresses this gap by comparing how traffic at scale routing is performing in two contrasting airspace configurations: a structured, multi-layer network defined relative to a common altitude reference, and a minimally constrained horizontal airspace inspired by free route ATM concepts with reference to underlying terrain, with all operations restricted to the VLL as imposed by current regulations.
3. Modelling Future Air Delivery Demand
This section presents the methodology used to generate future urban drone-delivery traffic and to evaluate its interaction with alternative VLL airspace organisations. First, the assumed delivery-demand structure and mission pattern are defined. Then, the airspace-organisation concepts considered in the study are introduced. Finally, the conflict-management logic used to further assess the resulting traffic scenarios is described.
3.1. The Demand: Urban Air Delivery Operations at Scale
A future urban drone-based delivery system is expected to accommodate a high demand, potentially reaching several thousand operations per day within a single metropolitan area. This demand is assumed to be served by multiple distribution centres (DCs), each representing the operational hub of an independent delivery company managing its own drone fleet.
Each delivery trajectory is individually planned by the respective operator, subject to regulatory and operational constraints, including the avoidance of restricted or sensitive areas (e.g., critical infrastructure zones). All missions follow a given pattern: departures originate from a DC, parcels are delivered to an assigned urban destination, and the drone subsequently returns to the same DC. Thus, drone trajectories are defined using a three-phase flight plan: (i) a vertical take-off phase to reach the cruise altitude within the VLL airspace; (ii) a cruise phase to reach destination; (iii) and a vertical landing to land at the delivery location. The return flight follows the same three-phase structure, departing seconds after the landing at destination. This three-phase operational scheme is illustrated in Figure 1. Hover-based delivery concepts, in which the drone remains airborne while lowering the parcel, are not included in this work, but the concept and the results are very similar.
Figure 1.
Schematic representation of the three-phase delivery flight plan.
Parcel destinations are spatially distributed across the city according to a probability distribution proportional to population density of the area, thereby reflecting realistic demand patterns. This assumption is adopted as an approximation of residential parcel-delivery demand since areas with higher population density are expected to generate a larger number of potential home-delivery requests. However, population density captures only one component of urban delivery demand. Other factors, such as workplace and employee density, commuting and travel patterns, retail activity, and the location of parcel lockers or pick-up points, may also influence the spatial distribution of deliveries. These additional demand drivers are not explicitly modelled in the present work and are left for future extensions of the traffic-generation framework. All missions are constrained by the drone’s operational range, ensuring feasibility of the complete round trip.
3.2. Airspace Structure
The design of the airspace structure can be regarded as one of the barriers (layers of defense) in the Swiss cheese model of safety. According to this model, accidents are prevented through multiple, partially independent layers of protection, each with inherent imperfections [43]. In this context, airspace structure acts as a strategic barrier by organising traffic flows in a way that reduces the likelihood of conflicts before tactical interventions are required.
Routing consists of finding a feasible air trajectory between an origin and a destination. To this end, two different concepts are proposed, based on two distinct airspace structures: free route (FR) airspace and constrained airspace (CA). These structures differ in the organisation of drone trajectories in the horizontal domain and adopt specific strategies for the vertical profile.
These two concepts were selected as representative bounding cases rather than as an exhaustive description of all possible VLL airspace designs. The FR concept represents a flexible operator-centred approach, in which each operator plans trajectories according to its own operational objectives while satisfying regulatory and environmental constraints. Conversely, the CA concept represents a more structured approach, in which the organisation of traffic is constrained to increase predictability and facilitate management. Other airspace-organisation concepts have been proposed in the literature [37,44]. These alternatives are not all modelled separately here since the objective of this study is to compare the main trade-off between operator-efficient routing and strategically constrained traffic organisation. Nevertheless, an intermediate alternative, the Layered Free Route (LFR), is introduced to separately assess the impact of the horizontal and vertical strategies.
3.2.1. Vertical Strategies
The cruise heights are selected by the drone operators but are constrained to remain within the specified minimum and maximum bounds, , of the VLL airspace. In the vertical dimension, two strategies are considered:
- Layered strategy: A common altitude reference is adopted throughout the entire VLL airspace, and the available vertical space is divided into discrete altitude layers. Drone cruise altitudes are assigned to one of these predefined layers. This strategy is applied in the CA concept and in the intermediate layered configuration of the FR concept.
- Free strategy: Altitude is referenced to the underlying terrain, which varies continuously along the trajectory. Drone operators may freely select the cruise altitude within the VLL limits, without being restricted to predefined vertical layers. The use of the ground as reference for the VLL flights is more respectful with the conventional aviation regulation, especially for aircraft flying under visual flight rules. This strategy is applied in the conventional FR configuration.
The combination of the FR horizontal organisation with the layered vertical strategy is referred to as layered free route (LFR). This configuration enables a direct comparison with CA since both use the same vertical reference and discrete-layer structure.
3.2.2. Constrained Airspace
The constrained airspace CA configuration is designed to represent a structured and regulated operational environment, consistent with most airspace structures proposed in the literature. The CA is modelled as a grid-based network composed of predefined East–West and North–South corridors. These corridors are uniformly spaced and directionally assigned to ensure flow separation, such that adjacent parallel routes operate in opposite directions. For example, if one corridor is assigned a north–south flow, the neighbouring corridor operates in the south–north direction.
The grid-based network is internally represented as a directed graph. The intersections between the East-West and North-South corridors function as nodes in the airspace network, allowing changes in direction. The edges represent unidirectional segments of the corridors connecting adjacent nodes. The graph accommodates restricted areas by eliminating the nodes and edges of the graph that fall within any of them.
The trajectory planning within this network is performed using the A* optimisation algorithm [45]. This pathfinding method, widely recognised for its computational efficiency in grid-like environments, identifies the shortest feasible route between an origin and a destination while adhering to the network constraints. It was selected because the CA routing problem is formulated as a static shortest-path problem on a directed grid-based graph, for which A* provides an efficient and deterministic solution while preserving optimality with respect to the defined cost function when an admissible heuristic is used. The algorithm supports flexible cost function formulations. In the current implementation, the cost function f prioritises minimal Euclidean distance between origin (a) and destination (b) while also penalising turns. This can be expressed at node (n) level as
where is the actual cost from the origin a to node n and is an admissible heuristic (a lower bound on the remaining cost from n to the destination b). The incremental cost penalises both distance and turning:
where is the incremental cost of the previous node , is the distance from the pervious node to the current one n (the length of the edge), weights turn penalties, and is the track angle change from to n. This formulation favours straighter, fewer-turn routes, reflecting the lower cornering speeds achievable in the corridor network.
The heuristic is chosen as straight-line (Euclidean) distance to the destination b:
Figure 2 shows an example of the A* optimisation on a grid-based network. Note that the resulting best path depicted in orange minimises the number of turns.
Figure 2.
A* pathfinder with a directional track-based grid.
Each flight proceeds directly from its origin to the nearest node of the predefined grid, follows the grid network to the node closest to the destination, and then leaves the grid to fly directly to the final delivery location.
The trajectory’s vertical profile within the CA follows the layered strategy referenced to the area’s most restrictive obstacle, resulting in trajectories that maintain a constant height above this reference. Cruise altitudes in the CA are restricted to discrete “layers”, each specified as a constant offset above the reference. The operator’s choice of cruise height is converted into the closest layer from the set of available layers.
Figure 3 illustrates a representative delivery operation in the CA. Figure 3a depicts the grid-constrained horizontal route from the distribution centre to the delivery destination and the corresponding return path. Due to the grid’s directionality, the return path is different from the outbound leg. Figure 3b shows that the vertical profile is restricted to a discrete layer—i.e., a constant offset above a unique reference—rather than following the terrain.
Figure 3.
Constrained airspace flight example: horizontal map view and vertical vs. time.
3.2.3. Free Route Airspace
Inspired by the Free Route and Trajectory-Based Operation concepts in conventional aviation, the FR structure proposed in this work provides a high degree of flexibility to drone operators in the process of trajectory planning. This airspace structure reflects a concept of operations which allows for almost direct routing and, consequently, has the potential to reduce flight time and energy consumption. It reflects a concept of operations aligned with current industry practices, where operators tend to fly by a direct (often shortest) path.
The length of the cruise phase is given by a valid destination, which needs to be at a distance between . It can have up to route waypoints, with turns limited to degrees. Under the FR airspace concept, drones are allowed to land directly at parcel destination locations; the use of dedicated vertiports is therefore not required.
The trajectory is the line connecting consecutive route waypoints. The FR horizontal concept is assessed through the two proposed vertical strategies, i.e., layered and free:
- Free route airspace with free vertical strategy. The combination of the FR horizontal organisation with the free vertical strategy is referred to as FR. The drone operator’s decision about cruise height is simulated with a random function between the height limits provided . Then, for each route waypoints, altitude is calculated as the sum of the terrain elevation at the route waypoint plus the target flight cruise height. In an uneven terrain, the trajectory will most possibly consist on cruise segments with climb/descend slopes. Strictly following the terrain along the entire route may not be operationally efficient since the urban terrain may be highly irregular (inducing too frequent climbs and descents). It may also occur that, at certain points along the trajectory, the actual height becomes significantly greater than expected due to the presence of a valley on the ground below. In a similar way, it might also happen that an obstacle is found in the middle of a 3D path defined by a route segment. As a solution, we have defined a vertical threshold () and a new waypoint is added when the separation between the flight path and the terrain is more than the threshold, both in positive or negative values.
Figure 4 illustrates an example of a delivery flight route. The upper part of Figure 4a presents the trajectory in horizontal domain, which is assumed to be identical for the outbound and return legs. The route is nearly straight, reflecting the assumption that operators aim to minimise distance and flight time. The destination is located in a residential area characterised by high population density. The bottom part (Figure 4b) shows the evolution of the trajectory altitude over time (blue line) in comparison with the underlying surface altitude (in green). Blue crosses indicate the initially generated waypoints, while green circles denote additional waypoints inserted to ensure that the vertical separation between the flight path and the terrain remains within the prescribed threshold.
Figure 4.
Route flight example: horizontal map view and vertical vs. time.
- Free route airspace with vertical layered strategy. The combination of the FR horizontal organisation with the layered vertical strategy is referred to as LFR. In this configuration, the horizontal trajectory is generated following the same direct-routing principles as in FR, while the vertical organisation follows the strategy adopted in CA. A common altitude reference is therefore used throughout the entire airspace, rather than the continuously varying underlying terrain. The available vertical domain between and is divided into a set of discrete layers, and the cruise altitude selected for each flight is restricted to one of these predefined levels. Consequently, LFR retains free horizontal routing while imposing the same vertical discretisation and altitude-reference assumptions as CA. Accordingly, an illustrative LFR trajectory would exhibit the horizontal profile shown in Figure 4a and the vertical profile shown in Figure 3b.
3.3. Conflict Assessment
Conflict management is defined by ICAO [46] as the function that limits, to an acceptable level, the risk of collision between aircraft and hazards, such as other aircraft, terrain, weather, wake turbulence, etc. A conflict arises when the applicable separation minima are predicted to be compromised. Conflict management is applied in three layers: (a) strategic conflict management; (b) separation provision; and (c) collision avoidance. Under the current EU U-space regulatory framework, strategic deconfliction is included as part of the mandatory UAS Flight Authorisation Service. More advanced, tactical conflict detection and resolution services acting as separator and collision avoidance systems are not still in place, although efforts are being made by regulators and standardisation bodies.
In [29] a conflict is defined as a predicted loss of separation that can occur when the horizontal and vertical separation distances between two aircraft, in this case, drones, are expected to be less than the established separation requirements. Conflicts are anticipated intrusions, predicted with some ’look-ahead’ time. Although specific separation minima for dense urban drone operations remain under discussion, there is a general consensus that both separation distances and look-ahead times gradually decrease across the conflict management hierarchy, from strategic to tactical layers.
In this study, a simplistic deconflicting service is implemented at the strategic layer, provided as a digital service that ensures that flight plans do not create a loss of separation before take-off. Two aircraft are considered to be in conflict if they are separated less than an specific distance (), but only if their altitude difference is less than . Additionally, conflicts happening inside the delivery centre influence area, defined with a cylinder of radius R, are disregarded. Figure 5 illustrates the conflict region of an aircraft.
Figure 5.
Definition of the conflict region.
At the planning phase, when a conflict is detected, a deconfliction action is initiated. The avoidance action consists of a random reassignment of height within the available vertical limits . In CA and LFR (both using layered vertical strategy), the reassigned altitude is set to the nearest available layer. If the conflict remains unresolved after 10 additional altitude adjustments, it is marked as an unsolved conflict. With an active tactical deconfliction service on duty, the flight could be accepted. Without it, those flights should not be accepted until the operator updates it.
4. Simulation Setup
This section defines the simulation setup used to evaluate the proposed urban drone-delivery scenarios. It first introduces the Madrid case-study area and the simulated U-space volume, then describes the assumed delivery operators, drone fleets, and demand-generation process. Finally, the different scenarios and conflict-detection parameters used in the simulations are presented.
4.1. Geographic Area
This work is based on a futuristic drone delivery traffic in the city of Madrid, Spain. Madrid is a city with almost million people, the largest city in Spain. It has a very crowded area surrounded by the M30 speedway, suburbs on the North, East and South and a mountain protected area in the West. Commercial activity starts at 8–9 in the morning and ends at 6–7 in the evening.
The U-space airspace area is defined as the official limits, described as a polygon containing the city of Madrid. No flight is allowed outside of the defined polygon. The polygon limiting the airspace is shown in Figure 6a, in green colour. The heights of the cruise phases are limited between m and m. The minimum 45 m height is set to leave some space between flights and the population to mitigate annoyance. The maximum of 90 m is set to leave space for potentially faster human-onboard innovative air mobility traffic.
Figure 6.
The simulated Madrid U-space airspace: in green the municipality extension and in purple the flight restricted areas.
There are several forbidden areas in which the delivery drones are not allowed to fly. The most significant ones are El Pantio, a large natural area in the North-West, the Royal Square Palace and Moncloa. Other excluded areas are military areas or airports. All of them are provided by ENAIRE, the Spanish ANSP, in its platform to facilitate the coordination for the flights of drones [47]. In addition to the published forbidden areas, four scenario-specific exclusion areas are included within the core of the city. These areas are not considered legally forbidden; rather, they are introduced to avoid locations where overflight would be less efficient or less suitable, such as areas with high-rise buildings requiring additional climb and descent manoeuvres, and areas where other UAS operations or locally sensitive urban activities may be expected. These are the CEPSA buildings, the Santiago Bernabeu soccer stadium surroundings, and two popular squares: Plaza Castilla and Plaza España. All of these areas are shown in Figure 6b in purple.
4.2. Drone Delivery Operators
We assume a high air delivery demand, with thousands of operations per day, provisioned from five large distribution centres (DC), named as Inner, South, West, Uber and Wing. Among the five DCs considered in this study, the locations of Uber and Wing correspond to actual logistics hubs associated with these operators. The other three locations were introduced by the authors. Because both the Uber and Wing hubs are located in the eastern part of Madrid, using only these facilities would have resulted in an uneven concentration of drone traffic over certain areas of the city. To avoid this effect, the additional DCs were placed to the west and south of the city centre (West and South) and within it (Inner). This strategy also enabled the investigation of a more balanced network with a wider range of origin–destination patterns.
The decision to locate most DCs around the city centre reflects the tendency for logistics facilities to be situated on the outskirts of major cities while still providing efficient access to urban centres. In addition, the proposed distribution of DCs locations is consistent with the results of the expert survey conducted within the MUSE project [48], where more than 80% of respondents indicated that delivery distribution centres should be geographically distributed across the metropolitan area to support future drone and delivery operations.
The value of R is set to 50 m for all.
Figure 7 shows the initial setup.
Figure 7.
Madrid ground view: City centre and distribution centres.
The type of drones that compose the fleet of an operator is limited in this work to two models: the Amazon Octocopter (AMZ8) and the DJI Matrice 400 (M400). The use of two drone types demonstrates the flexibility of the proposed framework when dealing with vehicles with different operational characteristics while keeping the number of operational scenarios limited. The Amazon Octocopter was selected because it is one of the most widely referenced delivery drone concepts in the literature and was developed specifically for last-mile parcel delivery, with a payload capacity of approximately 2.3 kg. The DJI Matrice 600 was originally selected because it has been extensively used in research and industrial applications as a heavy-lift multirotor platform capable of carrying larger payloads. As this model is now deprecated we switch to its successor, the Matrice 400, an improved version with larger endurance and higher performance.
Their performances are shown in Table 1. These values are taken from technical descriptions available and, when no data was available, from the analysis of our flight logs. We add a limitation on the total number of operation, set to 10 operations per drone and per day, assuming that some maintenance is needed after them.
Table 1.
Selected drones and their performance parameters. HZ: horizontal, CL: climb, DS: descent.
The delivery operators have each a large operational capability, set to 120 drones per hour. This number is an assumption that allowed us to reach our target of 3500 flights per day. This was considered sufficiently dense traffic for the experts advisory board and is in line with previous works: 100 aircraft per hour in corridors by [21].
The drone delivery is allowed from 7 a.m. to 9 p.m., and the peak hour for the deliveries is set to 5 p.m., which were considered by local experts to be business and peak hours respectively as well as convenient for avoiding night flights. The time of departure of the flights uses a Gaussian distribution probability function centred at the peak hour and with a standard deviation of 4 h.
Static population density of Madrid is used as a proxy for the parcel destination location, thus the probability of a flight to deliver at a point in the city is proportional to the people living there. The average people per square kilometre at district level is extracted from the Spanish Instituto Nacional de Estadística. The use of static density data may underestimate the demand generated at commercial and industrial areas, but the dynamic density data is not easily available and changing by nature.
4.3. Demand Generation
Realistic traffic demand is generated using the GEMMA tool, an in-house tool developed by Polytechnic University of Catalonia (UPC), which synthesises unmanned traffic scenarios based on predefined operational rules and a set of probabilistic assumptions. It is designed to generate realistic unmanned traffic operations by processing fully parameterised inputs, such as geographic area perimeters, no-fly zones, fleet sizes, and specific drone performance data like cruise speeds and endurance. The tool was substantially upgraded during the execution of the SESAR MUSE project to support two primary IAM missions: last-mile parcel delivery and emergency transport of medical samples [49]. GEMMA outputs accurate 4D trajectories, discretised at 1 s intervals, while simultaneously performing conflict detection. To verify that the generated trajectories are representative of realistic drone operations, the traffic generation module was tested by analysing several key flight parameters, including altitude, speed, and acceleration profiles. These parameters were graphically inspected and compared with actual flight performance data collected by UPC and other project partners during the large-scale flight demonstrations conducted within the CORUS-XUAM project [50]. Moreover, MUSE partners used the GEMMA trajectories for further analysis, helping in detecting non-conformance behaviours. In addition to the verification of the generated trajectories, the traffic scenarios generated for two different ConOps were evaluated during two MUSE stakeholder validation campaigns involving experts from the UTM and aviation field [48]. GEMMA is configured with the two airspace structures presented below, with the following characteristics.
In FR and LFR the length of the cruise phase is randomly selected between km and km. It can have up to route waypoints, with turns limited to degrees. The vertical threshold to follow the terrain in FR, , is set to 15 m.
In CA the grid-based network is represented by a graph. The graph is set in such a way that the nodes are regularly separated 200 m, creating ’horizontal’ corridors with alternate directions, from west to east and from east to west. The same thing happens with the ’vertical’ corridors, having alternate directions from north to south and south to north. The penalty for turns is set to five times the angle of turn in radians.
On the vertical dimension, the CA and the LFR can hold several layers, separated vertically by 15 m. To ensure safe clearance against ground obstacles, the vertical height of each layer is measured above the highest underlying obstacle within the full network area. As a consequence, the levels of the layered network are flat in terms of GNSS altitude. For safety reason the vertical layers of the grid-based network are shifted from the previous one by 10 m both to the north and to the east.
GEMMA uses a stochastic process to generate the demand. With the parameter describing the delivery operators (their location and number of drones) and the list of drone models, GEMMA creates the specific fleet of the operator. The process enters into an iterative process to stochastically select a drone from the fleet, a time of departure, a potential destination and a route. A number of checks decide if the route is possible or not. If it is considered correct, the route is accepted and further processed as it will be explained below. If not, the full route is disregarded and the process continues until each drone of the operators fleet has been used 10 times.
The checks that GEMMA does to validate the correctness of the route are:
- The drone is available (not in use) for the full time of the flight.
- The route distance (round-trip) is within the limits of the drone range.
- The destination has a population density greater than a random value between the minimum and the maximum densities of the city.
Due to the stochastic nature of the traffic generation, such as departure times, destinations, and altitudes, each simulation instance yields a different demand scenario. To ensure statistical robustness and account for this variability, 10 independent repetitions are conducted for each airspace structure and vertical strategy combination.
4.4. Scenario Definition
Drone delivery operations are simulated using two horizontal airspace organisations, FR and CA, and two vertical strategies, layered and free. Each implemented combination of horizontal organisation and vertical strategy defines an airspace scenario. Three scenarios are considered: CA with the layered vertical strategy, FR with the free vertical strategy, and FR with the layered vertical strategy, the latter being referred to as LFR. Each scenario is evaluated under different levels of vertical stratification to explore the effects of airspace organisation, vertical structure, and vertical availability on conflict probability.
Four different values for are tested, leading to four different vertical limits when generating the demand. The selected values were assessed and validated by experts from the UTM and Urban Air Mobility domains during the stakeholder validation campaign conducted as part of the MUSE project [48]. From a very narrow VLL vertical dimension to a wider one:
- 1.
- BOTTOM: Drones are assigned at height 45 m.
- 2.
- LOW: Heights are randomly assigned within the range 45–60 m.
- 3.
- MEDIUM: Heights allocation spans the range 45–75 m.
- 4.
- HIGH: The most vertically dispersed configuration, with drones operating at randomly assigned heights between 45 m and 90 m.
These scenarios are designed to quantify how incremental increases in vertical dispersion can affect conflict probability in a high-dense traffic environment.
In the case of the CA and LFR configurations, which are structured via discrete altitude layers, the generated heights of the flight demand for each vertical stratification need to be adapted. This is done by selecting from the available layers, that with the altitude closest to the desired height.
Thus, the number of layers of the CA and LFR and for the four vertical stratifications are: for BOTTOM, only one grid layer at 45 m; for LOW, two layers defined at 45 m and 60 m; for MEDIUM, three layers at 45 m, 60 m, and 75 m; and for HIGH, an additional layer is added at 90 m.
Each of the three airspace scenarios is evaluated under the four vertical stratification levels, resulting in a total of twelve simulation cases. Table 2 summarises the combinations of horizontal configuration and vertical strategy defining each scenario, together with the vertical stratification levels explored.
Table 2.
Definition of the evaluated airspace scenarios.
4.5. Conflict Detection Setup
The conflict volume (see Figure 5) is set with a distance m and an altitude difference of m. The horizontal threshold is selected as a relatively small proximity criterion to allow the assessment of very dense traffic scenarios without excessively filtering feasible simultaneous operations. The vertical threshold m is selected consistently with the layered structure of the CA concept, providing a vertical separation margin between aircraft assigned to consecutive cruise layers.
5. Simulation Results
This section shows the results of the demand generated and its characteristics, and compares the free route (FR) (with layered and free vertical strategies) and constrained airspace (CA) structures, each evaluated under multiple vertical stratification scenarios as summarised in Table 2.
5.1. Demand Generation
The traffic demand performed in GEMMA has a certain degree of variability and the results from one simulation to another depend on a random seed but also on the capabilities of the generator to find a suitable flight to be performed by a free drone. When the airspace structure changes, some of the flights may not be possible and the traffic generated can be different. For this reason, we have generated 10 different runs for each combination of airspace structure and vertical separation strategy, but all of them use the same input parameters, except the random seed. The total number of air delivery operations is around 3500 per day.
Figure 8 presents the hourly demand profile for the Constrained Airspace, Bottom scenario. The figure shows two main indicators: the number of operations (in light blue) and the maximum traffic, i.e., the maximum number of simultaneous operations (in dark blue). For each indicator, the line represents the median value across the 10 repetitions, the markers indicate the mean, and the shaded area (envelope) spans the minimum and maximum values observed. The figure shows a consistent temporal pattern across repetitions, with negligible demand during night hours, a gradual increase from early morning, and a clear peak between 15:00 and 18:00.
Figure 8.
Number of operations and maximum traffic distribution along the day.
This behaviour is representative of all other combination of airspace structure and vertical stratification (see Appendix B to find all Figures), indicating that the stochastic demand generation process yields stable temporal distributions.
5.1.1. Operations per Operator
Figure 9 shows the number of operations at Operator-level under constrained airspace (CA, blue), layered free route (LFR, orange) and free route (FR, green) across vertical stratifications (BOTTOM, LOW, MID, and HIGH). For each operator–scenario pair, the box represents the interquartile range (IQR) of the number of completed daily operations observed across the 10 stochastic repetitions, while the whiskers extend to the most extreme values within 1.5 times the IQR. Values beyond the whiskers are shown as individual outliers. The black horizontal line inside each box indicates the median, whereas the white diamond marks the mean.
Figure 9.
Number of operations per operator.
Across all settings, differences among operators remain relatively limited, with most medians lying approximately between 340 and 370 operations/day. The generally narrow interquartile ranges indicate limited variability across stochastic repetitions, while the close agreement between means and medians suggests that the distributions are, in most cases, reasonably symmetric and not strongly affected by extreme values. Overall, the boxplots therefore indicate consistent results across seeds while also making the spread and occasional outlying repetitions directly visible.
5.1.2. Distance per Operator
Figure 10 illustrates the operator-level mean flight distance under constrained airspace (CA, blue), layered free route (LFR, orange) and free route (FR, green) across vertical stratifications (BOTTOM, LOW, MID, and HIGH). For each operator–scenario pair, the box represents the IQR of the per-run mean flight distance over the 10 stochastic repetitions. The whiskers extend to the most extreme observations within 1.5 times the IQR, while observations beyond the whiskers are shown individually as outliers. The black horizontal line inside each box indicates the median, and the white diamond marks the mean across runs.
Figure 10.
Mean distance per operator.
Overall, operator effects are modest and largely overshadowed by airspace design. However, the west and south operators exhibit longer flight distances than the other operators under both CA and LFR. This difference is associated with the lower elevation of their distribution centres, which requires a longer climbing phase to reach the assigned cruise layer.
FR and LFR systematically yield shorter routes than CA in most settings consistent with the additional routing freedom enabling more direct paths. No systematic differences are observed between FR and LFR, with any small variations remaining within the operator- and run-level variability. This is expected because both scenarios use the same horizontal free routing organisation and differ only in their vertical strategy.
Across operators and stratifications, the boxes are generally narrow and the means remain close to the corresponding medians, indicating limited variability across stochastic repetitions and relatively stable central values. The figure shows that airspace structure, not the operator, is the primary driver of route length, with FR and LFR enabling shorter trajectories.
5.1.3. Time per Operator
Consistent with the distance results, Figure 11 shows that the mean flight time is systematically lower under Free Route and Layered Free Route than under Constrained Airspace for all operators and vertical stratifications.
Figure 11.
Mean time per airspace configuration and per operator.
The time penalty in CA is larger than the distance penalty because CA not only produces longer trajectories but also introduces more and sharper turns where cornering speeds are reduced.
The figure reinforces that airspace design dominates operator identity in determining flight trip time, with FR and LFR enabling faster trajectories. Nevertheless, some operator-specific differences remain. In particular, the West and South operators show longer flight times under both CA and LFR, mainly because their distribution centres are located at lower elevations, resulting in longer climb phases to reach the assigned cruise layer.
Table 3 shows the average values over the 10 runs of the number of flights, the flight distance and the flight time. Overall, compared with CA, FR results in flight distances that are approximately 17.2–18.4% shorter and flight times that are 17.7–19.2% lower. In contrast, the differences between LFR and FR are marginal, remaining below 2% across all evaluated cases.
Table 3.
Summary of flight operations, total flight distance, and total flight time for the evaluated scenarios.
5.2. Conflict Assessment
Given that the number of operations in each simulation run may be different, all reported results (e.g., total conflicts and unsolved conflicts) are normalised to a common operational baseline of 3500 drone operations. This normalisation ensures fair and consistent comparison across all cases, regardless of inherent variability in the generated traffic demand.
5.3. Number of Conflicts
Figure 12 shows the range of total conflicts for each combination of airspace structure (CA, LFR and FR) and vertical separation startification. CA information is shown in blue, LFR information in orange, and FR information in green. Each box represents the interquartile range of the total number of conflicts observed across the 10 repetitions, the whiskers extend to the most extreme values within times the interquartile range, and values beyond the whiskers are shown as individual outliers. The white diamond denotes the mean, and the horizontal black line inside each box indicates the median.
Figure 12.
CA vs. LFR vs. FR conflicts.
The CA structure consistently leads to a higher number of conflicts compared to the LFR and FR structures under equivalent vertical separation strategies. This is mainly caused by the spatial concentration of traffic imposed by the gridded network. In LFR and FR, operators can generate more direct and spatially dispersed trajectories between each origin and destination. In contrast, the CA concept constrains all flights to a limited set of predefined corridors and intersections, which increases traffic density along common edges and around network nodes. As a result, different missions that would be spatially separated in the FR case may be forced to share the same corridor segments in the CA case, increasing the probability of potential conflicts.
The differences between LFR and FR are comparatively small; however, the number of conflicts is systematically higher in LFR. This behaviour can be attributed to the different vertical strategies adopted by the two configurations. In LFR, cruise altitudes are restricted to a set of predefined layers, which concentrates flights at a limited number of vertical levels. Conversely, FR allows cruise heights to take any value within the available vertical limits, favouring a greater initial dispersion of trajectories in the vertical domain and, consequently, reducing the probability of potential conflicts. A particular case is the BOTTOM configuration, for which both LFR and FR have only one nominal cruise-height option. Despite this apparent similarity, FR still results in fewer conflicts. This difference is mainly associated with the terrain-following procedure used in FR. The vertical trajectory is generated with respect to the underlying terrain and adjusted according to the vertical threshold . As a result of this piecewise approximation of the terrain profile, trajectories with the same nominal cruise height may fly at slightly different absolute altitudes along some portions of their routes. This additional vertical dispersion can resolve some potential conflicts that would remain in LFR, where flights are constrained to the same predefined altitude layer.
Moreover, in all the scenarios (CA, LFR and FR), the number of conflicts decreases steadily as vertical availability increases from BOTTOM to HIGH. This highlights the importance of vertical dispersion in mitigating traffic density and supporting conflict avoidance. Thus, FR with HIGH separation achieves the lowest conflict levels across all scenarios.
These results suggest that vertical flexibility and unconstrained routing significantly reduce the conflict probability.
5.4. Characterisation of the Conflicts
This section analyses the minimum distance at the closest point of approach during a conflict and the duration of the conflict, measured as the time interval during which the safety volume around a drone is violated.
Figure 13 presents the range of average minimum conflict distances for each combination of airspace structure and vertical separation stratification. For each of the 10 simulation repetitions within a configuration, the mean of the minimum distances observed across all conflicts is computed, representing the typical proximity at which conflicts occur (prior to any deconfliction). The boxplots represent the distribution of these per-run averages: the box spans the IQR, the black horizontal line indicates the median, and the white diamond denotes the mean. The whiskers extend to the most extreme observations within times the IQR, while values beyond the whiskers are shown individually as outliers.
Figure 13.
CA vs. LFR vs. FR distance in conflicts.
Across all vertical stratifications, CA consistently exhibits shorter conflict distances than both LFR and FR. Conflict distances in CA remain approximately between 5 and 7 m, whereas those observed under LFR and FR are generally around 12–13 m. This behaviour is consistent with the characteristics of the grid-based organisation adopted in CA. By constraining trajectories to a limited set of predefined corridors and nodes, traffic becomes spatially concentrated, particularly around grid intersections, increasing the likelihood that conflicting aircraft encounter each other at shorter separation distances. In contrast, the greater horizontal freedom available in LFR and FR allows trajectories to remain more spatially dispersed.
Within CA, the conflict distance increases from BOTTOM to MID, while the HIGH configuration remains at a similar level to MID, suggesting that the effect of increasing vertical availability eventually stabilises. In contrast, no clear monotonic trend with vertical stratification is observed for LFR or FR, whose mean and median conflict distances remain relatively stable across the four configurations. Differences between LFR and FR are comparatively small and do not follow a systematic trend, further suggesting that the vertical strategy has a limited influence on conflict distance compared with the effect of the horizontal airspace organisation.
Figure 14 shows the range of average duration of conflicts for each combination of airspace structure and vertical separation stratification. For each of the 10 simulation repetitions within a given configuration, the mean duration of all identified conflicts is computed, based on the time during which drones remain within each other’s protected volume (prior to the application of any deconfliction strategy). As in Figure 13, the boxes represent the IQR of these per-run averages, the black line indicates the median, the white diamond denotes the mean, the whiskers extend to the most extreme observations within times the IQR, and observations beyond the whiskers are shown as outliers.
Figure 14.
CA vs. LFR vs. FR time in conflicts.
For all vertical stratifications, the mean and median duration of conflicts is consistently higher in CA compared to LFR and FR. This indicates that when conflicts occur in structured airspace, they tend to persist for longer periods, due to trajectory alignment and flow convergence within the fixed grid corridors. Conversely, conflicts in LFR and FR are generally shorter in time duration, suggesting that the randomised and spatially dispersed routing reduces the persistence of encounters, even before any resolution manoeuvres are applied.
Within CA, both the mean and median conflict duration decrease as the available vertical airspace increases from BOTTOM to HIGH, although the reduction becomes smaller for the MID and HIGH configurations. This suggests that distributing traffic among a larger number of altitude layers reduces not only the occurrence of conflicts but also their persistence. In contrast, LFR and FR show only minor variations across the vertical stratifications and no clear monotonic trend. Moreover, the differences between LFR and FR are small and not systematic, indicating that conflict duration is influenced primarily by the horizontal airspace organisation rather than by the choice between layered and free vertical strategies.
5.5. Conflict Resolution
Figure 15 illustrates the number of conflicts and the percentage of unsolved conflicts for each vertical stratification under the CA, LFR, and FR scenarios. The data shown in each pie chart represents the average across five simulation repetitions, previously normalised to 3500 drone operations per case. The radius of each pie chart is proportional to the total number of conflicts.
Figure 15.
Total number of conflicts vs. unresolved conflicts.
Each pie chart is split into solved (light blue—CA, orange—LFR or green—FR) and unsolved (dark red) conflicts. This allows a direct comparison of both the number of conflicts and the effectiveness of vertical resolution strategies across the scenarios.
The CA scenario consistently exhibits the largest number of conflicts and the highest proportion of unresolved conflicts. In the BOTTOM case, 1088 conflicts are identified and all of them remain unresolved since only one cruise layer is available and no vertical manoeuvre can provide the required separation. As additional vertical layers become available, both the number of conflicts and the proportion of unresolved conflicts decrease substantially. The conflict count decreases from 832 in LOW to 706 in MID and 628 in HIGH, while the corresponding proportion of unresolved conflicts decreases from 42% to 24% and 10%, respectively. These results demonstrate that increasing vertical availability improves both conflict prevention and conflict-resolution capability in the structured airspace.
The LFR scenario shows a substantially lower number of conflicts and a higher resolution efficiency than CA, despite using the same discrete vertical layers and vertical conflict-resolution strategy. The number of conflicts decreases from 292 in BOTTOM to 161, 119, and 88 for LOW, MID, and HIGH, respectively. At the same time, the percentage of unresolved conflicts falls from 100% in BOTTOM to 8% in LOW, 1% in MID, and 0% in HIGH. The comparison between CA and LFR is particularly relevant because their vertical organisation and resolution mechanisms are equivalent. The better performance of LFR therefore indicates that the horizontal organisation also affects the ability to resolve conflicts. In the grid-based CA, traffic is concentrated along common corridors and intersections, producing more persistent and geometrically constrained encounters, whereas the more dispersed trajectories of LFR provide more favourable conditions for vertical resolution manoeuvres.
FR provides the lowest number of conflicts and, in general, the highest conflict-resolution efficiency. The number of conflicts decreases from 230 in BOTTOM to 142 in LOW, 86 in MID, and 62 in HIGH. While all conflicts remain unresolved in BOTTOM, the unresolved proportion decreases to only 3% in LOW, and all conflicts are successfully resolved in both MID and HIGH. Compared with LFR, the improvement in resolution effectiveness is relatively small but systematic where differences remain. This can be associated with the continuous vertical freedom available in FR, which allows conflict-resolution altitudes to be selected within the available vertical range rather than being restricted to a finite set of predefined layers.
The BOTTOM configuration constitutes a particular limiting case. For CA and LFR, only one altitude layer at 45 m is available, while for FR the admissible cruise-height interval also collapses to a single nominal value of 45 m. Consequently, none of the three scenarios provides sufficient vertical freedom to perform a conflict-resolution manoeuvre, and 100% of the detected conflicts remain unresolved. Once additional vertical space becomes available, however, the proportion of unresolved conflicts decreases rapidly, particularly for LFR and FR.
Overall, the results show that both horizontal airspace organisation and vertical availability influence conflict-resolution performance. Increasing the available vertical space substantially improves the ability to resolve conflicts in all three scenarios, while the comparison between CA and LFR demonstrates that horizontal free routing provides an additional benefit even when the same layered vertical strategy is applied. The additional continuous vertical freedom provided by FR further improves performance, although the differences with respect to LFR become small when sufficient vertical layers are available.
Distribution of Resolution Attempts
Figure 16a–c show the distribution of the number of altitude change attempts required to resolve conflicts, for the CA, LFR, and FR scenarios, respectively. Each boxplot aggregates the resolution attempts associated with the conflicts identified across the simulation repetitions for each vertical stratification.
Figure 16.
Number of attempts when solving conflicts.
The vertical axis represents the number of resolution attempts triggered by conflict events. The white diamond indicates the mean, the horizontal line inside the box marks the median, and the box itself represents the interquartile range (IQR). Whiskers extend to 1.5 times the IQR, and values beyond that are plotted as outliers.
No resolution attempts are performed in the BOTTOM configuration. In this case, the available vertical domain provides only one admissible cruise-altitude option, leaving no vertical space for a resolution manoeuvre. Consequently, the conflict-resolution algorithm cannot propose an alternative altitude, and all detected conflicts remain unresolved.
For the remaining vertical stratifications, most conflicts require only a small number of resolution attempts. Nevertheless, differences between the three airspace scenarios can be observed. In CA (Figure 16a), the distribution remains relatively stable from LOW to HIGH, with mean values slightly above two attempts. The interquartile range generally extends between approximately one and three attempts, while a limited number of conflicts require substantially more iterations, reaching the maximum of 10 attempts. The persistence of these higher values even when additional layers become available is consistent with the constrained geometry of the grid, where traffic sharing the same corridors and intersections may offer fewer effective alternatives for vertical resolution.
The LFR scenario (Figure 16b) shows a gradual reduction in the number of attempts as vertical availability increases. Although some conflicts in LOW and MID still require a relatively large number of attempts, the central part of the distribution remains concentrated around one or two attempts. In HIGH, both the mean number of attempts and the occurrence of cases requiring many iterations are reduced. Since LFR uses the same layered vertical strategy as CA, this improvement highlights the benefit of the less constrained horizontal trajectory organisation, which generally provides more favourable encounter geometries for conflict resolution.
A similar but more pronounced trend is observed for FR (Figure 16c). The number of attempts decreases progressively as the available vertical range increases. While LOW still presents a distribution comparable to the other scenarios, MID and particularly HIGH are strongly concentrated around a single resolution attempt, with only a small number of conflicts requiring repeated altitude changes. This behaviour reflects the additional flexibility provided by the continuous vertical strategy, which allows the algorithm to select alternative cruise altitudes without being restricted to a predefined set of layers.
6. Discussion
Last-mile logistics represents a rapidly expanding segment of the global supply chain, within which small UAS are increasingly proving valuable for the transport of lightweight, time-critical payloads. As electrically powered platforms, UAS offer a sustainable complement to existing multimodal transportation networks, advancing low-carbon mobility while mitigating terrestrial traffic congestion. UAS operators are progressively expanding their operational footprint across diverse urban centres worldwide. Nowadays, determining horizontal routes that minimise ground and air risk represents the primary operational challenge for those drone operators. However, as traffic density increases and operations become fully automated, particularly in cities characterised by complex topography and heterogeneous building heights, the optimisation of the vertical dimension of flight may emerge as the more critical challenge.
Currently, UAS operations are generally carried out within airspace volumes allocated exclusively to a single operator, and therefore conflicts between competing operators remain limited. How multiple operators will share urban airspace at scale is still largely undefined. What is foreseen, however, is that UAS traffic management will rely on digital services provided by certified third parties under defined contractual and regulatory frameworks. Established primarily to enforce operational segregation between UAS and crewed aviation, another central regulatory consideration is the definition of the VLL limit. Operating as a low-altitude boundary beneath conventional flights, VLL is defined in terms of height relative to the ground, water, or uppermost limit of structures. However, regulatory frameworks frequently lack explicit guidelines for interpreting these vertical ceilings over non-flat terrain. Correspondingly, most academic literature assumes an idealised, planar topography when proposing airspace designs to optimize high-density traffic flows. In this study, layered and grid airspace structures (LFR and CA) are conceptualised to generalize existing proposals in the literature and benchmark their efficiency against standard UAS operations.
Although future traffic patterns are still surrounded by uncertainties, current urban aerial delivery operations largely resemble the FR concept developed in this study. There are some exemptions related to the drop-off procedure adopted by some operators, who perform deliveries by hovering above the destination, as well as to the flight distances, which are presently kept shorter than those considered in this paper for economic efficiency. Typically, drone operators use a single vehicle model and a fixed cruise altitude for all flights. Publicly available information on how these operations adapt to underlying terrain is limited; nevertheless, our terrain-referenced approximation based on a 15 m vertical deviation threshold for replanning the flight was found to provide a stable vertical flight profile while maintaining safety margins.
Overall, the results indicate that high airspace volume availability reduces the computational and operational burden of the resolution process, particularly in the free-route configurations. The comparison between CA and LFR suggests that horizontal organisation also affects resolution efficiency since both employ the same layered vertical strategy but LFR generally requires fewer attempts. Finally, the comparison between LFR and FR shows the additional benefit of continuous vertical freedom, which becomes especially evident in the MID and HIGH configurations.
Several limitations of this study must be considered prior to generalising its conclusions. First, the scope was restricted to specific airspace geometries, omitting alternative topologies documented in the literature, such as varying corridor or layer separations, non-orthogonal grid orientations, irregular spatial boundaries, and non-uniform grid densities. Second, conflict detection relied on a static, fixed-volume safety buffer, paired with a very simple resolution scheme that omits advanced strategies like dynamic rerouting, velocity adjustment, or departure delay. Third, synthetic traffic profiles were generated under stylised assumptions regarding operator fleet sizes, limited number of vehicle types, Gaussian temporal demand distributions, and static population density data. Finally, the complexity of the traffic flow and the general introduction of slant flight segments produced by the free route strategy has not been considered. Access to empirical UAS delivery demand datasets and operational UAS flight practices is crucial to partially overcome these limitation in future work. To support open research and benchmarking in VLL airspace design, the current generated trajectory datasets have been made fully available in the Zenodo public digital data repository.
Although structured airspace has historically been proposed to better organise the traffic flow and support human-centric conflict management in conventional aviation, it may not necessarily provide the same benefits in highly automated, digitally managed UAS environments. In the context of unmanned traffic management, artificial spatial constraints may introduce unnecessary complexity that compromises both safety and operational efficiency. Suggested by these results, a cautious and evidence-based approach to VLL airspace design appears as imperative and presents a crucial input to institutions responsible for VLL design. The premature imposition of artificial structures, in the absence of demonstrated performance gains, may limit the safety, efficiency, and scalability potential of the emerging urban air mobility ecosystem.
7. Conclusions
This paper investigated how large-scale drone delivery traffic could be accommodated and organised within very-low-level (VLL) urban airspace. Two strategies in vertical and two in horizontal summarised in three scenarios were evaluated and compared: a free route (FR), in which drones are allowed to follow more direct paths, a layered free route (LFR), in which the vertical freedom was reduced into a number of layers, and a constrained airspace (CA) configuration, where drones operate within a structured, directional grid of layered corridors. In addition, different options of vertical availability were analysed, ranging from no margin to more flexible (45 m). Conflicts were defined as predicted loss-of-separation based on fixed horizontal and vertical thresholds, and a simplistic and naive strategic deconfliction mechanism was implemented by adjusting flight height. The results are consistent across all tested scenarios: the tested directional grid configuration, under the selected altitude-layers and conflict-resolution assumptions, generated longer flight times, more conflicts and more difficult to solve, than the tested free route configurations. Allowing more altitude flexibility reduces the overall number of conflicts in all configurations and improves the rate of conflicts that can be resolved. Under the most flexible vertical setting, the FR concept achieved the lowest conflict count (62 conflicts, compared to 627 in the CA case) and resolved all detected conflicts within the simulated scenario, whereas approximately 10% of conflicts remained unresolved under the CA configuration.
The safe design of VLL airspace represents a critical strategic challenge for municipalities, aviation regulators, and air navigation service providers. A key question concerns whether to impose a prescriptive airspace structure or to allow more flexible operational models. The results of this research suggest that rigid airspace structures should be carefully evaluated and optimised before implementation, rather than assumed to improve scalability. Structured airspace inherently concentrates traffic within the available grid or corridors. As a consequence, even minor velocity differences between vehicles operating along the same corridor can increase both the likelihood and the duration of conflicts compared to free route configurations.
Future work is needed to adequately find the most optimised airspace design that benefits drone operators business. Such design must also ensure safety, including a robust conflict detection, and an efficient deconfliction process. Societal acceptance is the third input that must be considered in the final formulation. In all three aspects, the vertical dimension has not been sufficiently explored, although the terrain surface plays a major role. Further research needs to be done to generalize different terrain orographies and provide optimal solutions of the VLL design.
Author Contributions
Conceptualisation, J.K., M.M., J.L., A.S.-S. and C.B.; Methodology, J.K., J.L. and A.S.-S.; Software, M.M., J.L., D.d.l.T. and C.B.; Validation, J.K., M.M., J.L., D.d.l.T. and C.B.; Formal analysis, M.M., A.S.-S. and C.B.; Investigation, J.K., M.M., J.L., D.d.l.T., A.S.-S. and C.B.; Resources, J.K.; Data curation, M.M., J.L. and C.B.; Writing—original draft, J.K., M.M. and C.B.; Writing—review and editing, J.K., M.M., D.d.l.T., A.S.-S. and C.B.; Visualisation, M.M. and C.B.; Supervision, J.K. and C.B.; Project administration, J.K.; Funding acquisition, J.K. All authors have read and agreed to the published version of the manuscript.
Funding
This work has been partially funded by grant PID2023-152053OB-C21 funded by MICIU/AEI/10.13039/501100011033 and, by “ERDF A way of making Europe”. This work was supported by the MUSE project (Measuring U-Space Social and Environmental Impact). This project has received funding from the SESAR 3 Joint Undertaking (SESAR 3 JU) under grant agreement No. 101114858. The JU receives support from the European Union’s Horizon Europe research and innovation program and the SESAR 3 JU members other than the Union. The results reflect only the authors’ views, and the SESAR 3 JU is not responsible for any use that may be made of the information it contains.
Data Availability Statement
The original contributions presented in this study are included in the article. The full dataset, with all generated trajectories, is publicly available for download at Zenodo (https://doi.org/10.5281/zenodo.22097402).
Conflicts of Interest
The authors declare no conflicts of interest.
Appendix A. Summary of Obtained Results
Table A1.
Summary of metrics for constrained airspace (CA) and free route (FR) across vertical configurations.
Appendix B. Hourly Demand for All Scenarios
Figure A1, Figure A2, Figure A3, Figure A4, Figure A5, Figure A6, Figure A7, Figure A8, Figure A9, Figure A10, Figure A11 and Figure A12 show the hourly traffic demand for all scenarios.
Figure A1.
CA-Bottom.
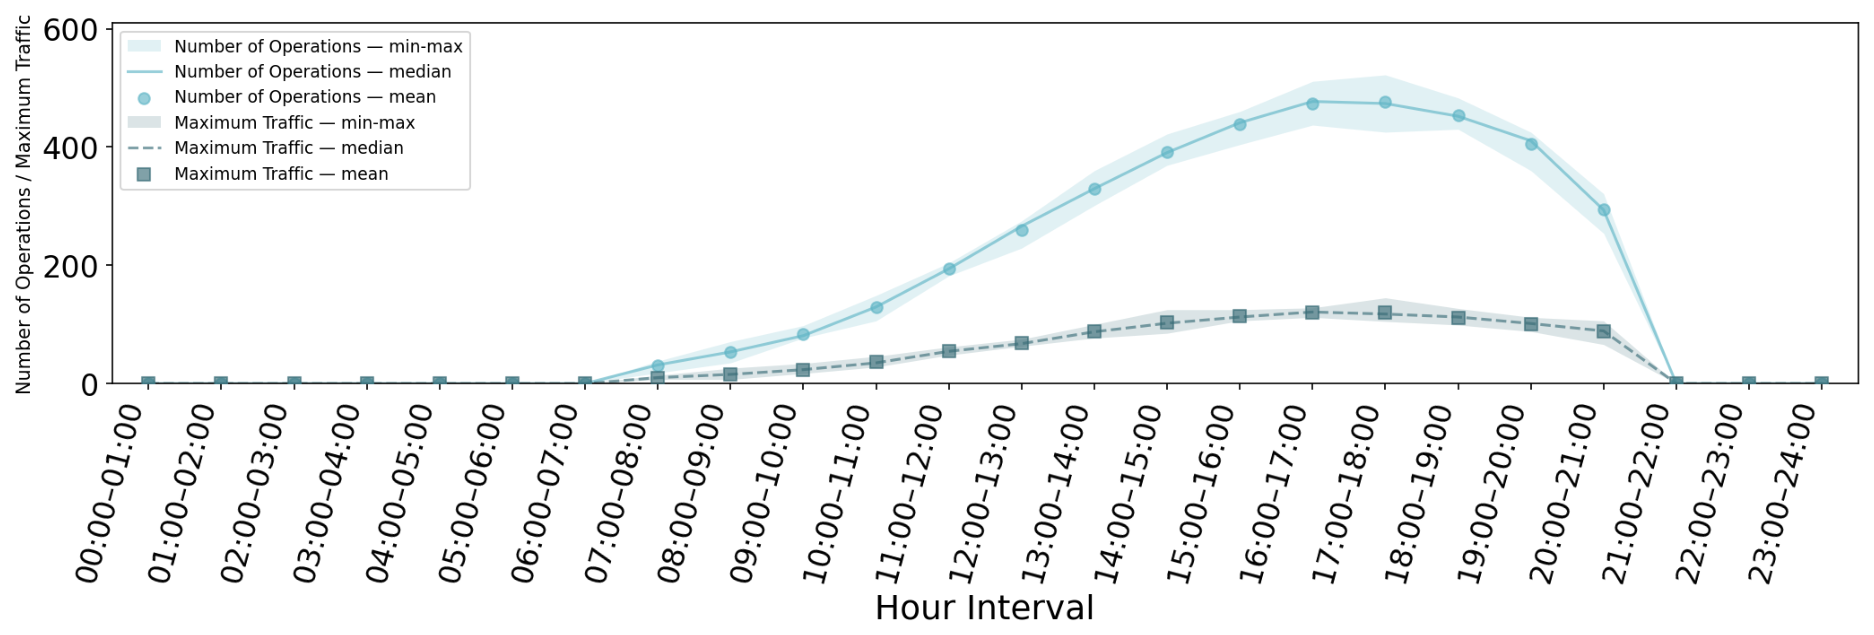
Figure A2.
CA-Low.
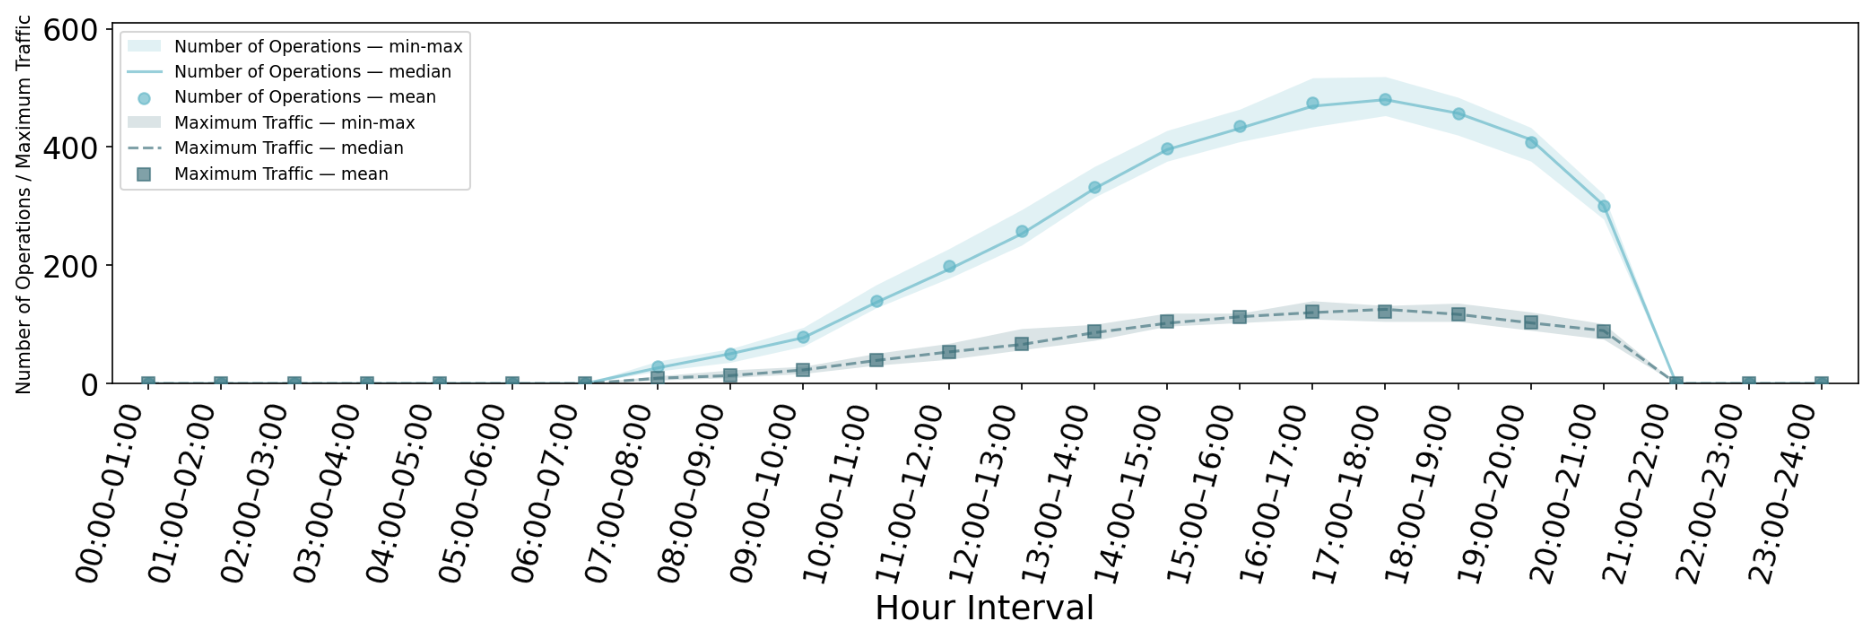
Figure A3.
CA-Mid.
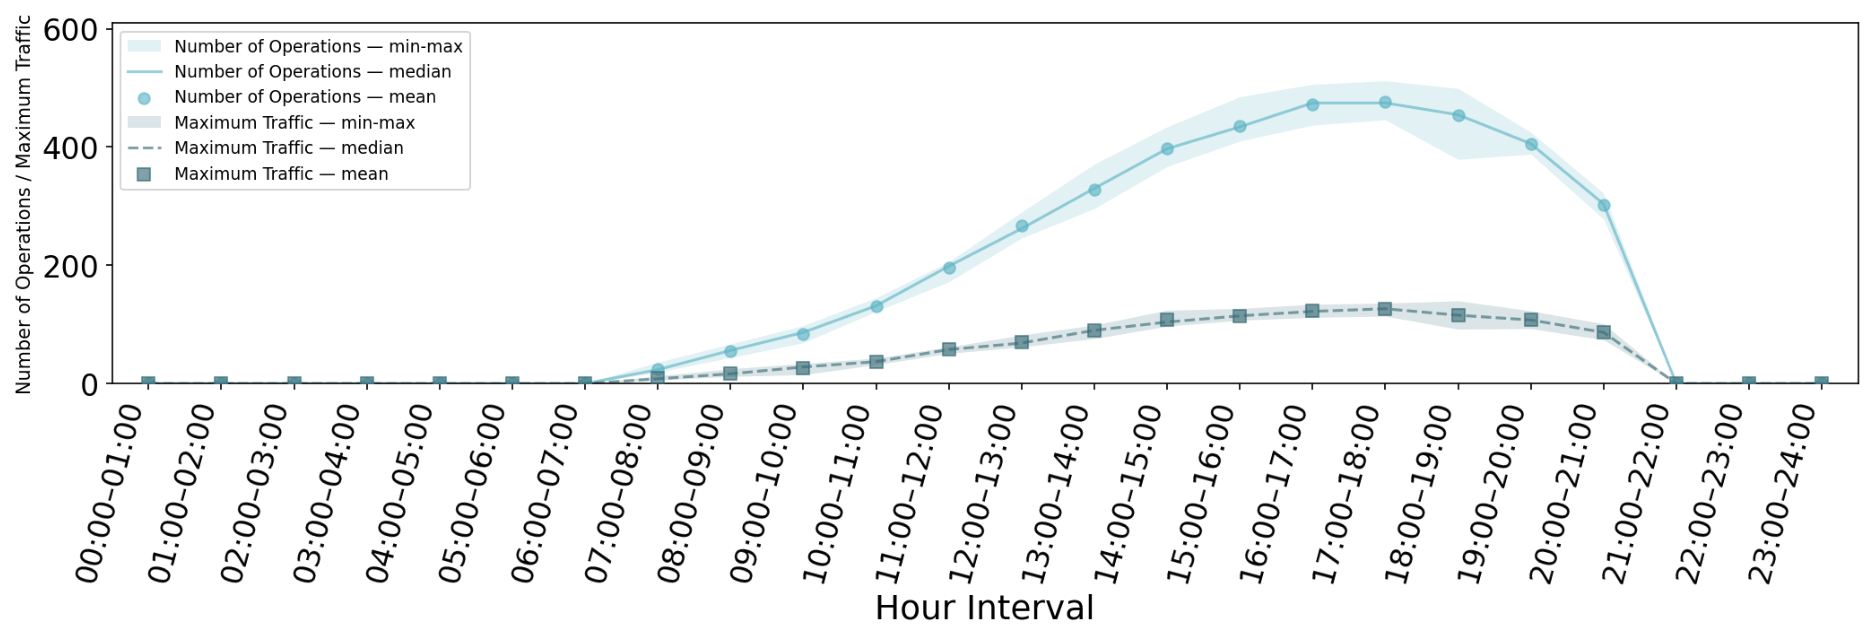
Figure A4.
CA-High.
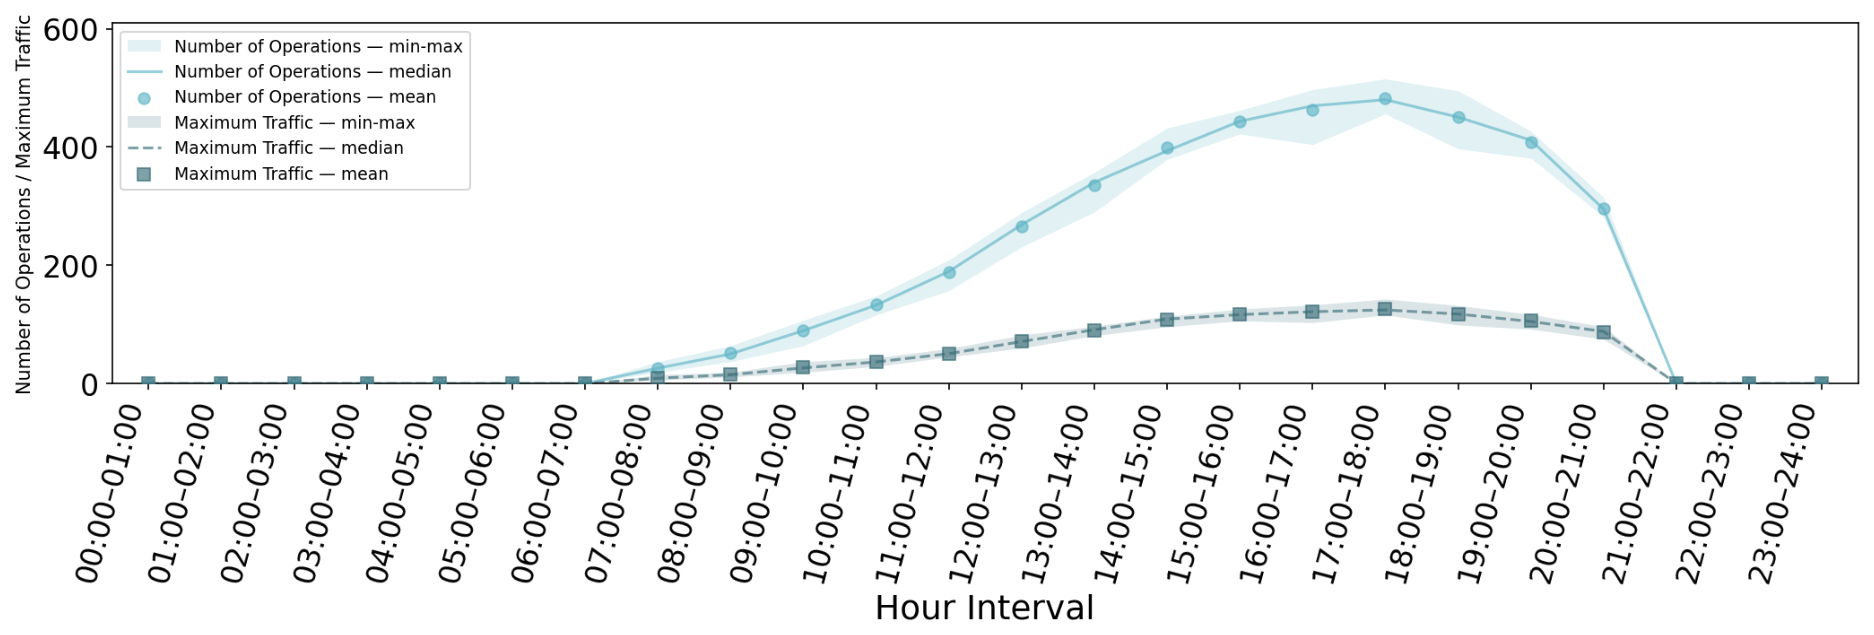
Figure A5.
LFR-Bottom.
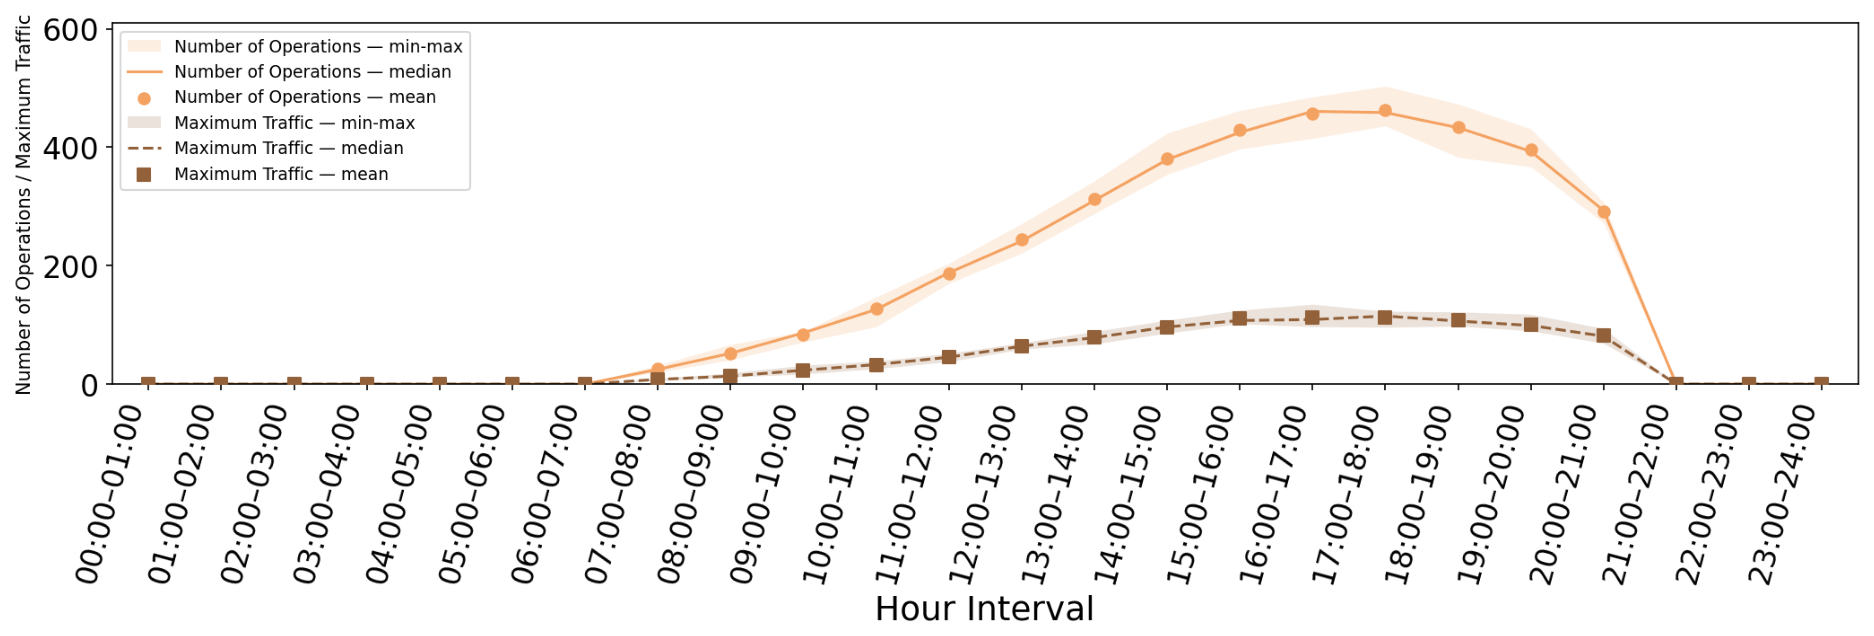
Figure A6.
LFR-Low.
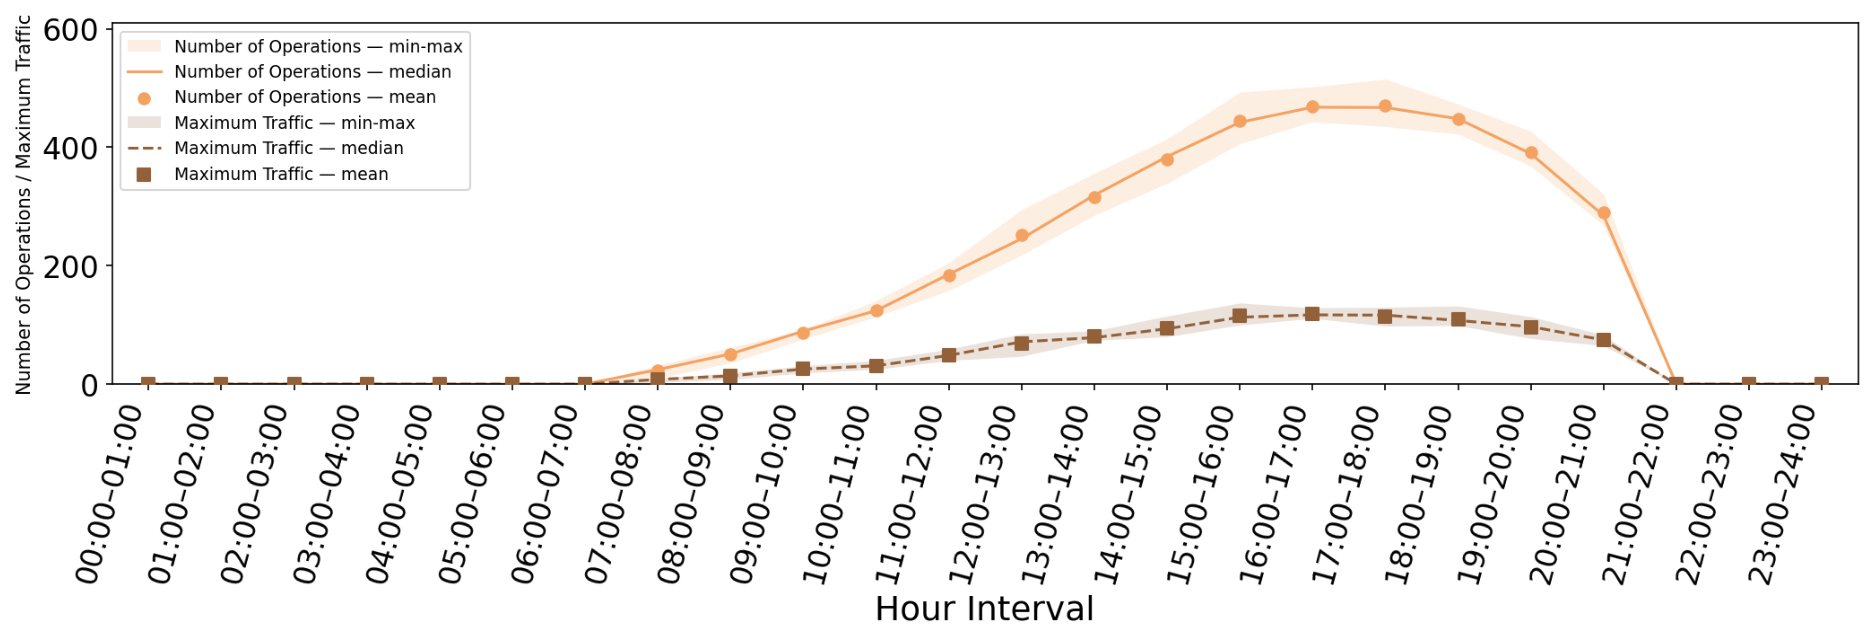
Figure A7.
LFR-Mid.
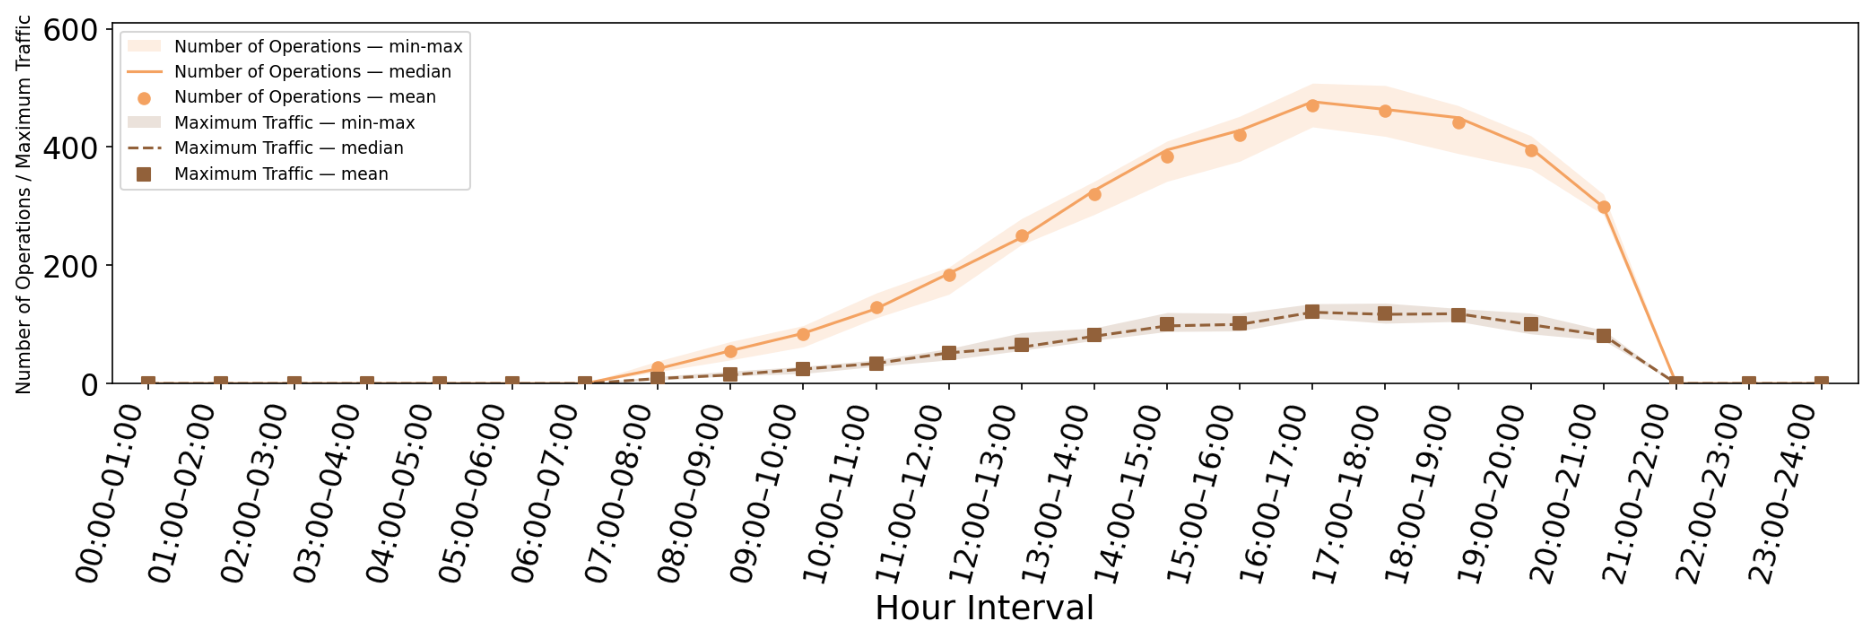
Figure A8.
LFR-High.
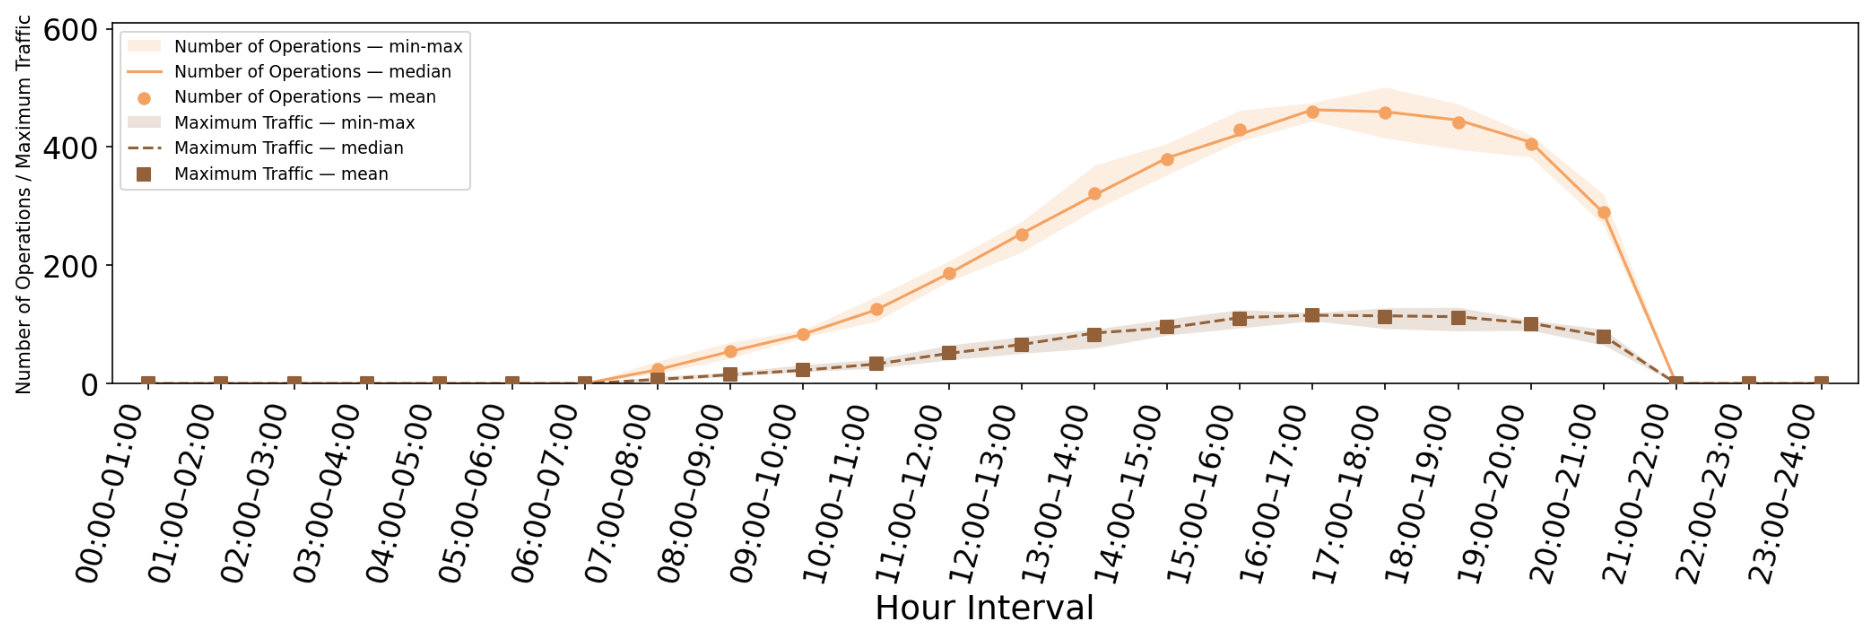
Figure A9.
FR-Bottom.
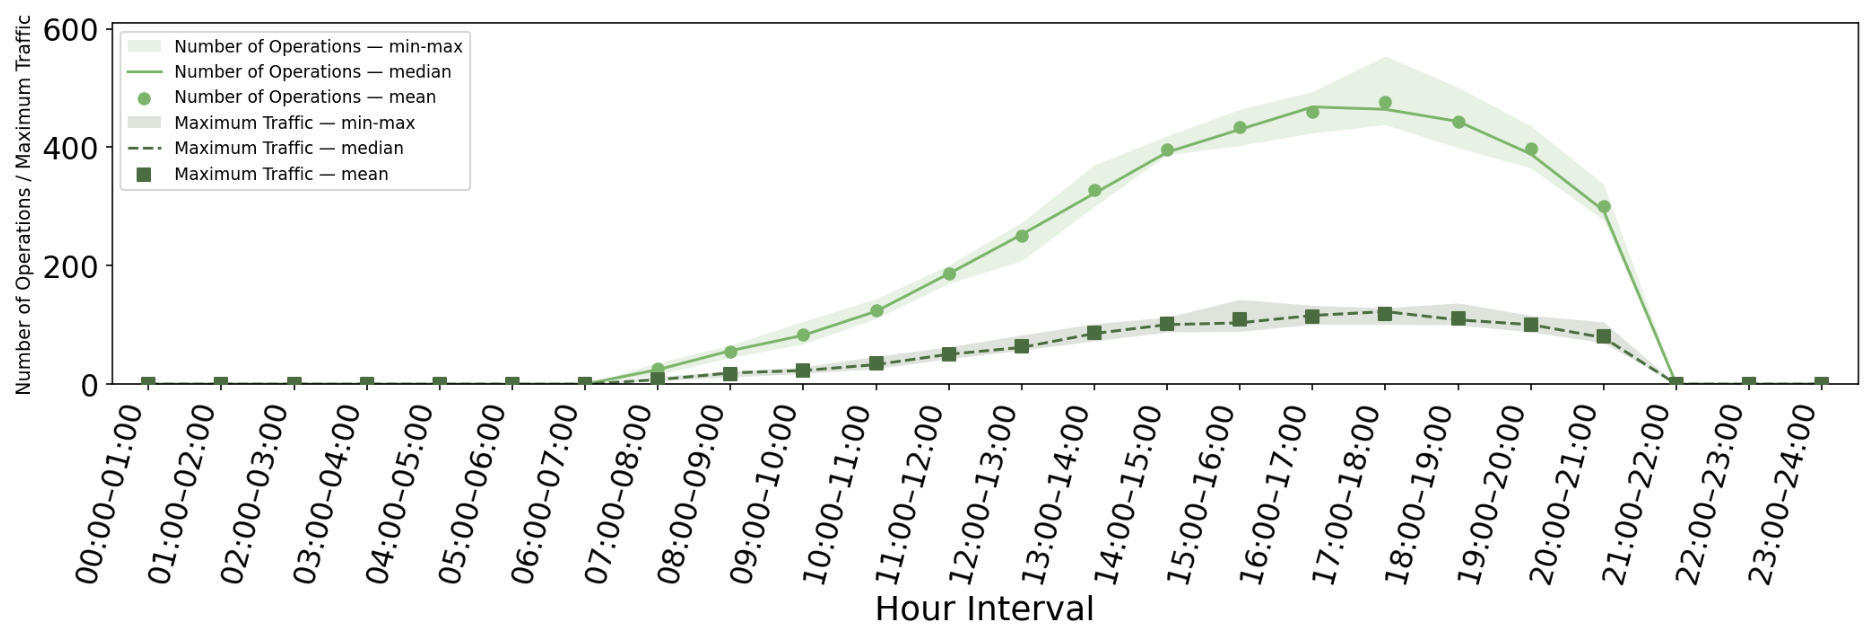
Figure A10.
FR-Low.
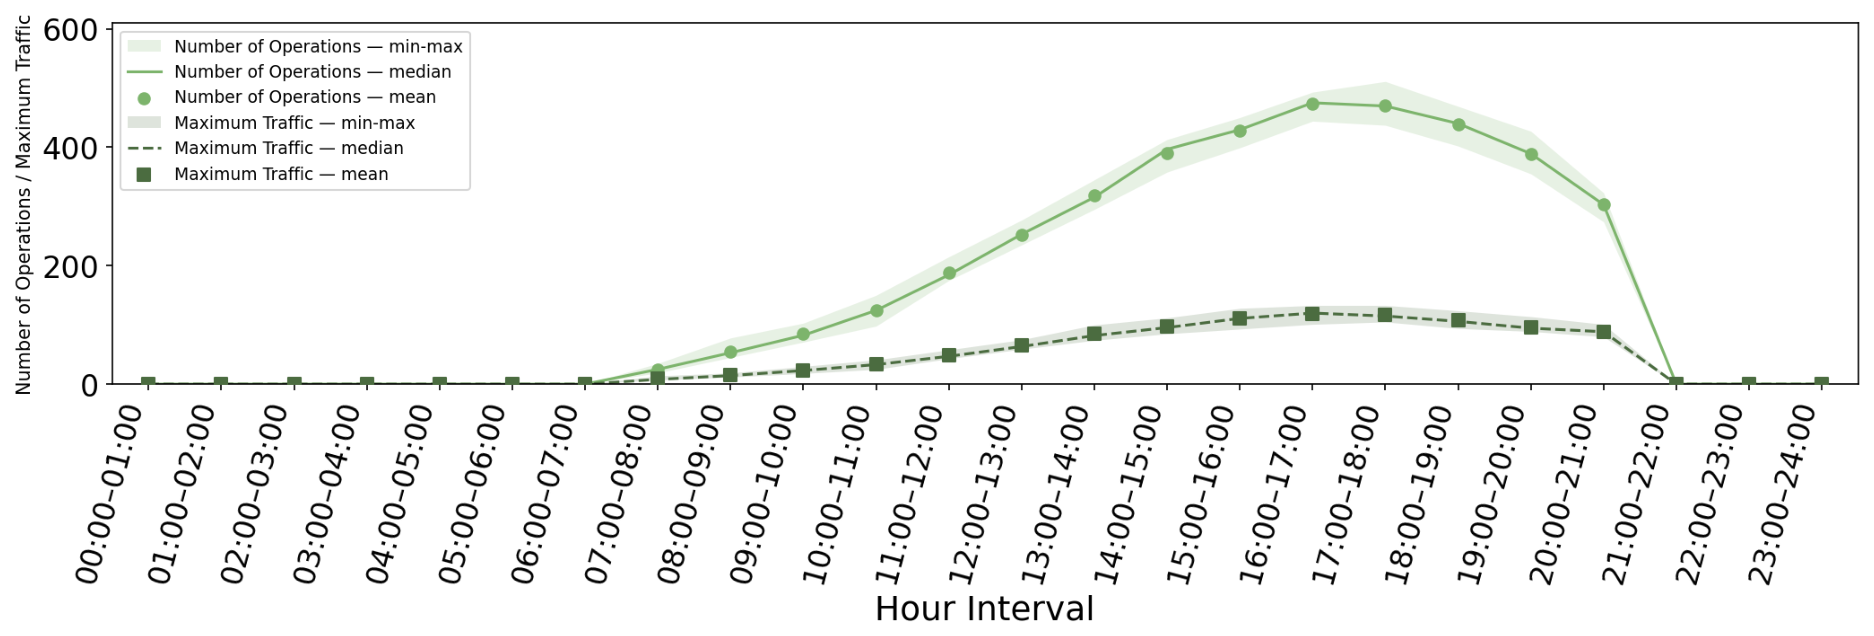
Figure A11.
FR-Mid.
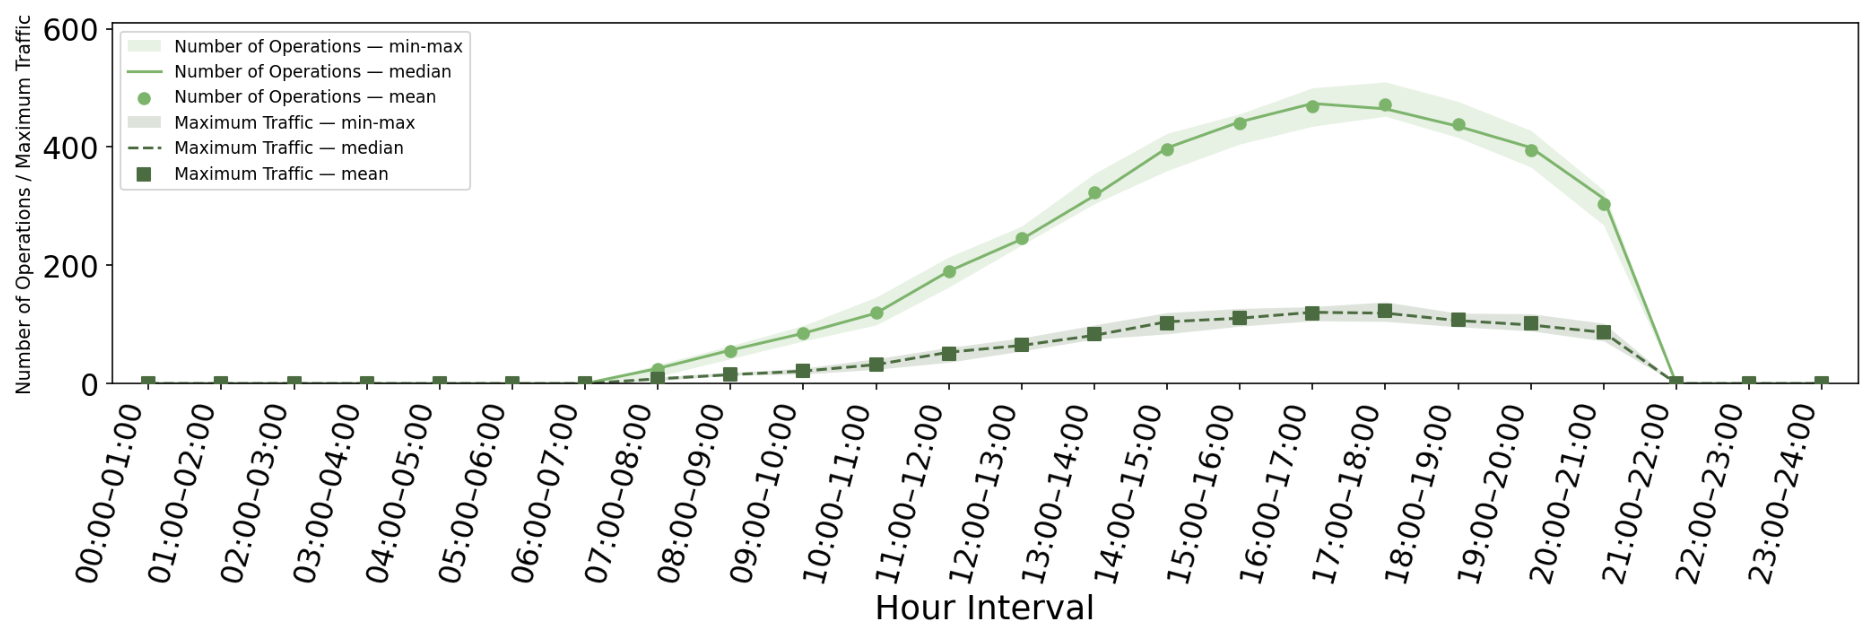
Figure A12.
FR-High.
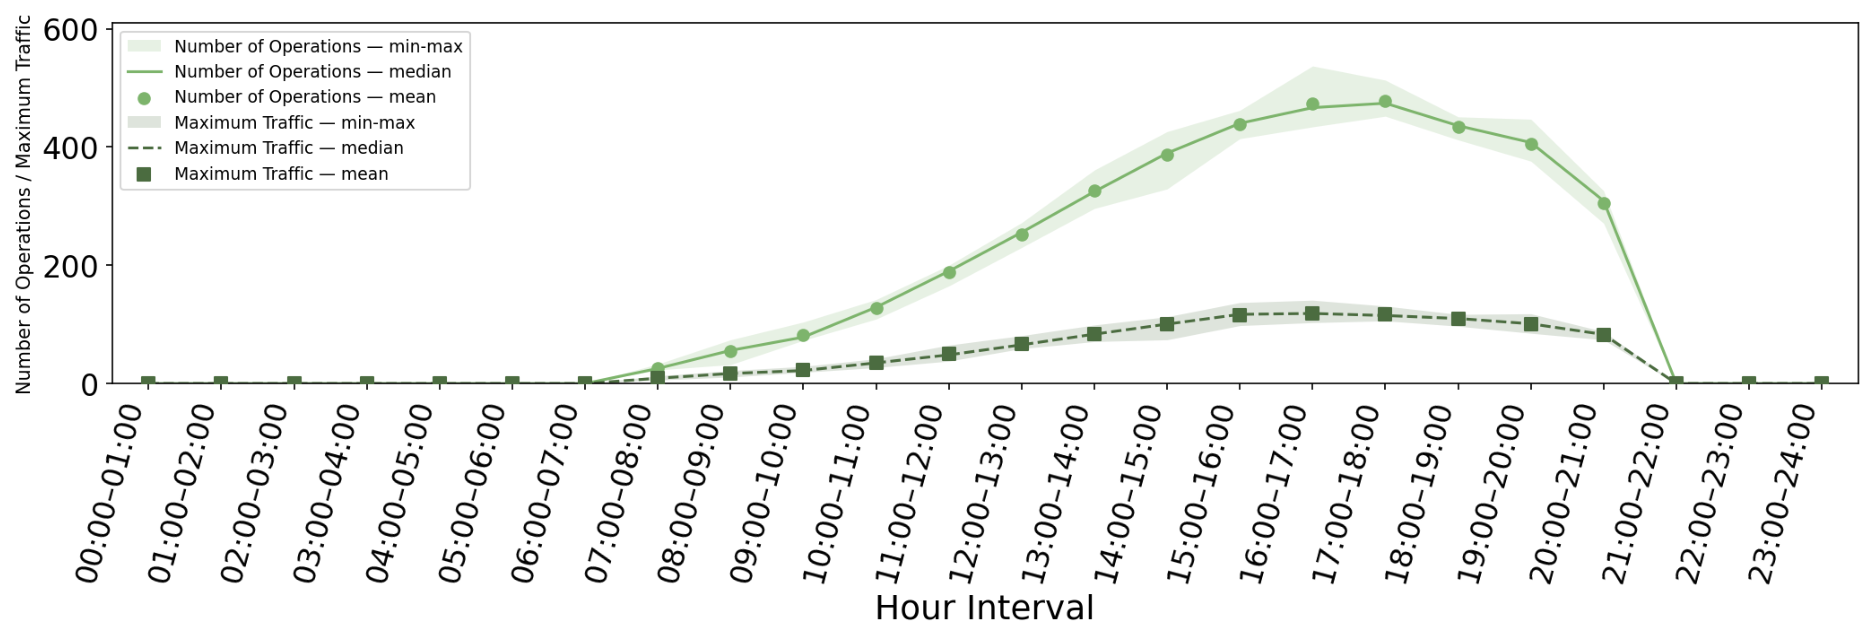
References
- United Nations. World Urbanization Prospects: The 2018 Revision: Key Facts. 2018. Available online: https://www.un.org/development/desa/pd/content/world-urbanization-prospects-2018-revision-key-facts (accessed on 30 June 2026).
- Konrad, S. How to Make Last Mile Deliveries More Efficient (and Green): The Challenge. 2021. Available online: https://citychangers.org/how-to-make-last-mile-deliverie-more-efficient/ (accessed on 23 August 2026).
- Mantecchini, L.; Nanni Costa, F.P.; Rizzello, V. Last Mile Urban Freight Distribution: A Modelling Framework to Estimate E-Cargo Bike Freight Attraction Demand Share. Future Transp. 2025, 5, 31. [Google Scholar] [CrossRef] [Scilit]
- Bosona, T. Urban freight last mile logistics—Challenges and opportunities to improve sustainability: A literature review. Sustainability 2020, 12, 8769. [Google Scholar] [CrossRef] [Scilit]
- Manna Air Delivery. Manna Air Delivery Announces Pause of Delivery Operations in Dublin and Cork. 19 June 2026. Available online: https://www.manna.aero/blog/dublin-cork-announcement (accessed on 30 June 2026).
- O’Brien, C. Deliveroo Tests Drone Deliveries with Manna Partnership. 5 June 2025. Available online: https://www.irishtimes.com/business/2025/06/05/deliveroo-tests-drone-deliveries-with-manna-partnership/ (accessed on 30 June 2026).
- Deliveroo. DELIV-AIR-ROO? Deliveroo Launches Drone Deliveries in Dublin, Taking the Consumer Experience to New Heights. 5 June 2025. Available online: https://deliveroo.co.uk/more/news-articles/project-chopper-launch (accessed on 30 June 2026).
- Wing Aviation LLC. Walmart Orders Delivered in as Little as 30 min. 2026. Available online: https://wing.com/walmart (accessed on 30 June 2026).
- Amazon. Drone Delivery FAQs. 2026. Available online: https://www.amazon.com/gp/help/customer/display.html?nodeId=T3jxhuvPfQ629BOIL4 (accessed on 30 June 2026).
- RigiTech. RigiTech Performs BVLOS Flights over Lake Geneva in Switzerland. RigiTech News, 31 October 2022. Available online: https://rigi.tech/rigitech-performs-bvlos-flights-over-lake-geneva-in-switzerland/ (accessed on 30 June 2026).
- Daud, S.M.S.M.; Yusof, M.Y.P.M.; Heo, C.C.; Khoo, L.S.; Singh, M.K.C.; Mahmood, M.S.; Nawawi, H. Applications of drone in disaster management: A scoping review. Sci. Justice 2022, 62, 30–42. [Google Scholar] [CrossRef] [Scilit] [PubMed]
- Lyu, M.; Zhao, Y.; Huang, C.; Huang, H. Unmanned aerial vehicles for search and rescue: A survey. Remote Sens. 2023, 15, 3266. [Google Scholar] [CrossRef] [Scilit]
- Ganić, E.; Krstić Simić, T.; Baena, M.; Mocholí, D.; Alonso, M.; LeGriffon, I.; Ruaud, E.; Barrado, C. D3.1 MUSE U-Space Environmental and Social Performance Framework. MUSE Project Deliverable D3.1. 2024. Available online: https://ec.europa.eu/research/participants/documents/downloadPublic?documentIds=080166e509b72d6e&appId=PPGMS (accessed on 23 August 2026).
- Ganić, E.; Alonso, M.; Baena, M.; Simić, T.K.; Kuljanin, J.; Barrado, C. Assessing Privacy Concerns in Urban Air Mobility: A Parcel Delivery Case Study in Madrid. Transp. Res. Procedia 2026, 94, 272–281. [Google Scholar] [CrossRef] [Scilit]
- Altawy, R.; Youssef, A.M. Security, privacy, and safety aspects of civilian drones: A survey. ACM Trans. Cyber-Phys. Syst. 2016, 1, 1–25. [Google Scholar] [CrossRef] [Scilit]
- European Union Aviation Safety Agency. Study on the Societal Acceptance of Urban Air Mobility in Europe; Technical Report; European Union Aviation Safety Agency (EASA): Cologne, Germany, 2021.
- Aalmoes, R.; Tojal Castro, M.; Sieben, N.; Roosien, R. Drone noise in my backyard: The challenges for public acceptability. In Proceedings of the Inter-Noise and Noise-Con Congress and Conference Proceedings; Institute of Noise Control Engineering: Wakefield, MA, USA, 2023; Volume 265, pp. 4987–4993. [Google Scholar]
- European Commission. Commission Implementing Regulation (EU) 2021/664 of 22 April 2021 on a regulatory framework for the U-space Text with EEA relevance. Off. J. Eur. Union 2021, L 139, 161–183. Available online: https://eur-lex.europa.eu/eli/reg_impl/2021/664/oj/eng (accessed on 30 June 2026).
- Whitley, P. Unmanned Aircraft Systems (UAS) Traffic Management (UTM) Concept of Operations; Federal Aviation Administration: Washington, DC, USA, 2020.
- Balakrishnan, K.; Polastre, J.; Mooberry, J.; Golding, R.; Sachs, P. Blueprint for the Sky: The Roadmap for the Safe Integration of Autonomous Aircraft; Airbus UTM: San Francisco, CA, USA, 2018; Volume 675. [Google Scholar]
- Kim, Y.; Bae, J. Risk-based uav corridor capacity analysis above a populated area. Drones 2022, 6, 221. [Google Scholar] [CrossRef] [Scilit]
- Salleh, M.F.B.M.; Low, K.H. Concept of Operations (ConOps) for Traffic Management of Unmanned Aircraft Systems (TM-UAS) in Urban Environment. In AIAA Information Systems-AIAA Infotech @ Aerospace; American Institute of Aeronautics and Astronautics, Inc.: Reston, VA, USA, 2017. [Google Scholar] [CrossRef] [Scilit]
- Commission Implementing Regulation (EU). Communication from the Commission to the European Parliament, the Council, the European Economic and Social Committee and the Committee of the Regions ‘A Drone Strategy 2.0 for a Smart and Sustainable Unmanned Aircraft Eco-System in Europe’. 2022. Available online: https://eur-lex.europa.eu/legal-content/EN/TXT/?uri=celex:52022DC0652 (accessed on 23 August 2026).
- Lamb, T.L. Emergent Themes of Operational Safety at Urban Air Mobility at Vertiports: The Stakeholder Perspective. Ph.D. Thesis, Embry-Riddle Aeronautical University, Daytona Beach, FL, USA, 2024. [Google Scholar]
- Federal Aviation Administration. 14 CFR Part 107–Small Unmanned Aircraft Systems. In Code of Federal Regulations; Federal Aviation Administration: Washington, DC, USA, 2016. [Google Scholar]
- European Commission. Commission Implementing Regulation (EU) 2019/947 of 24 May 2019 on the rules and procedures for the operation of unmanned aircraft. Off. J. Eur. Union 2019, L 152, 45–71. [Google Scholar]
- National Diet of Japan. Civil Aeronautics Act (Act No. 231 of 1952, as Amended Regarding Unmanned Aircraft); Ministry of Land, Infrastructure, Transport and Tourism (MLIT): Tokyo, Japan, 1952.
- Kellermann, R.; Biehle, T.; Fischer, L. Drones for parcel and passenger transportation: A literature review. Transp. Res. Interdiscip. Perspect. 2020, 4, 100088. [Google Scholar] [CrossRef] [Scilit]
- Doole, M.; Ellerbroek, J.; Knoop, V.L.; Hoekstra, J.M. Constrained urban airspace design for large-scale drone-based delivery traffic. Aerospace 2021, 8, 38. [Google Scholar] [CrossRef] [Scilit]
- Wang, Z.; Delahaye, D.; Farges, J.L.; Alam, S. Route network design in low-altitude airspace for future urban air mobility operations: A case study of urban airspace of Singapore. In Proceedings of the International Conference on Research in Air Transportation (ICRAT 2020), Tampa, FL, USA, 19–23 June 2022. [Google Scholar]
- Morfin Veytia, A.; Badea, C.A.; Patrinopoulou, N.; Daramouskas, I.; Ellerbroek, J.; Lappas, V.; Kostopoulos, V.; Hoekstra, J. U-space utilisation of airspace under various layer function assignments and allocations. Drones 2023, 7, 444. [Google Scholar] [CrossRef] [Scilit]
- Sunil, E.; Hoekstra, J.; Ellerbroek, J.; Bussink, F.; Nieuwenhuisen, D.; Vidosavljevic, A.; Kern, S. Metropolis: Relating Airspace Structure and Capacity for Extreme Traffic Densities. In Proceedings of the ATM Seminar 2015, 11th USA/EUROPE Air Traffic Management R&D Seminar, Lisbon, Portugal, 23–26 June 2015. [Google Scholar]
- Wang, Z.; Lv, D.; Jia, S.; Wang, K.; Qu, X. Urban air mobility network design and operations strategy in an urban agglomeration. Transp. Res. Part E Logist. Transp. Rev. 2025, 203, 104316. [Google Scholar] [CrossRef] [Scilit]
- Wang, S.; Liu, H.; Rinaldi, M.; Tsang, Y.P. Evaluating the impact of air corridors on the environment and public interests. Transp. Res. Part D Transp. Environ. 2025, 143, 104732. [Google Scholar]
- Fregnani, J.A.T.G.; Balvedi, G.C. AIR TRANSPORT NETWORK OPTIMIZATION APPLIED TO URBAN AIR MOBILITY OPERATIONS WITH AN EVTOL. ResearchGate, 2025. Available online: https://www.researchgate.net/publication/396864502_AIR_TRANSPORT_NETWORK_OPTIMIZATION_APPLIED_TO_URBAN_AIR_MOBILITY_OPERATIONS_WITH_AN_eVTOL (accessed on 23 August 2026).
- Kar, S.K.; Mathew, D.J.; John, A.M. Air Traffic Management as a Service for Urban Air Mobility in Indian Cities: A Study for Scalable and Adaptive Design Framework for Optimizing Airspace over Rail, Metro, and Roads; Design Research Society: Edinburgh, UK, 2025. [Google Scholar]
- Lee, U.J.; Ahn, S.J.; Choi, D.Y.; Chin, S.M.; Jang, D.S. Airspace designs and operations for UAS traffic management at low altitude. Aerospace 2023, 10, 737. [Google Scholar] [CrossRef] [Scilit]
- Yang, J.; Wang, Y.; Hang, X.; Delahaye, D. A review on airspace design and risk assessment for urban air mobility. IEEE Access 2024, 12, 157599–157611. [Google Scholar] [CrossRef] [Scilit]
- Veytia, A.; Badea, C.; Ellerbroek, J.; Hoekstra, J.; Patrinopoulou, N.; Daramouskas, I.; Lappas, V.; Kostopoulos, V.; De Vries, V.; van Ham, J.; et al. Metropolis II: Benefits of Centralised Separation Management in High-Density Urban Airspace. In Proceedings of the 12th SESAR Innovation Days, Budapest, Hungary, 5–8 December 2022. [Google Scholar]
- Ho, F.; Geraldes, R.; Gonçalves, A.; Rigault, B.; Oosedo, A.; Cavazza, M.; Prendinger, H. Pre-Flight Conflict Detection and Resolution for UAV Integration in Shared Airspace: Sendai 2030 Model Case. IEEE Access 2019, 7, 170226–170237. [Google Scholar] [CrossRef] [Scilit]
- Fas-Millán, M.Á.; Pick, A.; Río, D.G.D.; Tineo, A.P.; García, R.G. Implementing and testing a U-space system: Lessons learnt. Aerospace 2024, 11, 178. [Google Scholar] [CrossRef] [Scilit]
- ICARUS Consortium. ICARUS: Integrated Common Altitude Reference System for U-Space. 2024. Available online: https://u-spaceicarus.eu/ (accessed on 7 July 2026).
- Reason, J.; Hollnagel, E.; Pariès, J. Revisiting the Swiss cheese model of accidents. J. Clin. Eng. 2006, 27, 110–115. [Google Scholar]
- CORUS Consortium. U-Space Concept of Operations. Concept of Operations D6.3, SESAR Joint Undertaking, 2019. Edition 03.00.02. Grant Agreement No. 763551. Available online: https://ec.europa.eu/research/participants/documents/downloadPublic?documentIds=080166e5c8b46d99&appId=PPGMS (accessed on 23 August 2026).
- Hart, P.E.; Nilsson, N.J.; Raphael, B. A Formal Basis for the Heuristic Determination of Minimum Cost Paths. IEEE Trans. Syst. Sci. Cybern. 1968, 4, 100–107. [Google Scholar] [CrossRef] [Scilit]
- Doc, I. Global Air Traffic Management Operational Concept; International Civil Aviation Organization: Montreal, QC, USA, 2005. [Google Scholar]
- ENAIRE. ENAIRE Drones Web Application for UAS Geographical Zones and Drone Flight Planning. 2026. Available online: https://drones.enaire.es/ (accessed on 30 June 2026).
- MUSE Consortium. Case Study Report. Project Deliverable D5.1 Edition 00.07, SESAR 3 Joint Undertaking. Grant Agreement No. 101114858, 2025. Available online: https://ec.europa.eu/research/participants/documents/downloadPublic?documentIds=080166e5253dca49&appId=PPGMS (accessed on 23 August 2026).
- MUSE Consortium. U-space Environmental and Social Impact Assessment Toolset. Project Deliverable D4.1 Edition 00.05, SESAR 3 Joint Undertaking. Grant Agreement No. 101114858, 2024. Available online: https://ec.europa.eu/research/participants/documents/downloadPublic?documentIds=080166e51ac6a0f5&appId=PPGMS (accessed on 23 August 2026).
- CORUS-XUAM Consortium. Very Large-Scale Demonstration (VLD) Project. Available online: https://www.eurocontrol.int/project/corus-xuam (accessed on 7 July 2026).
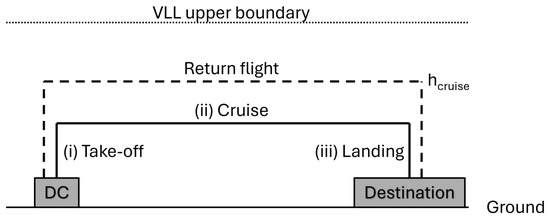
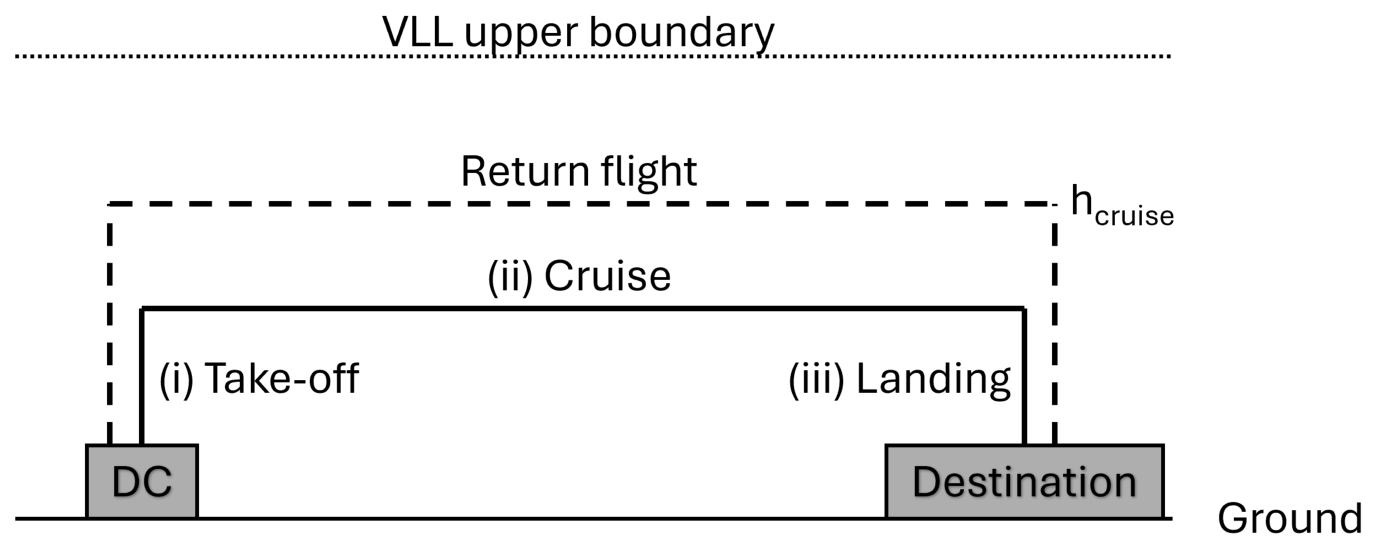
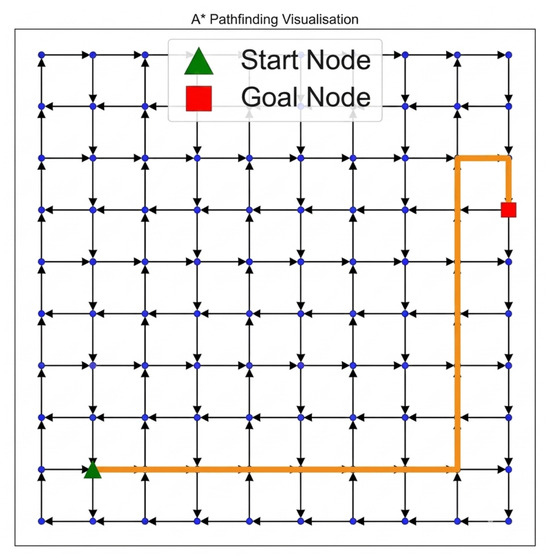
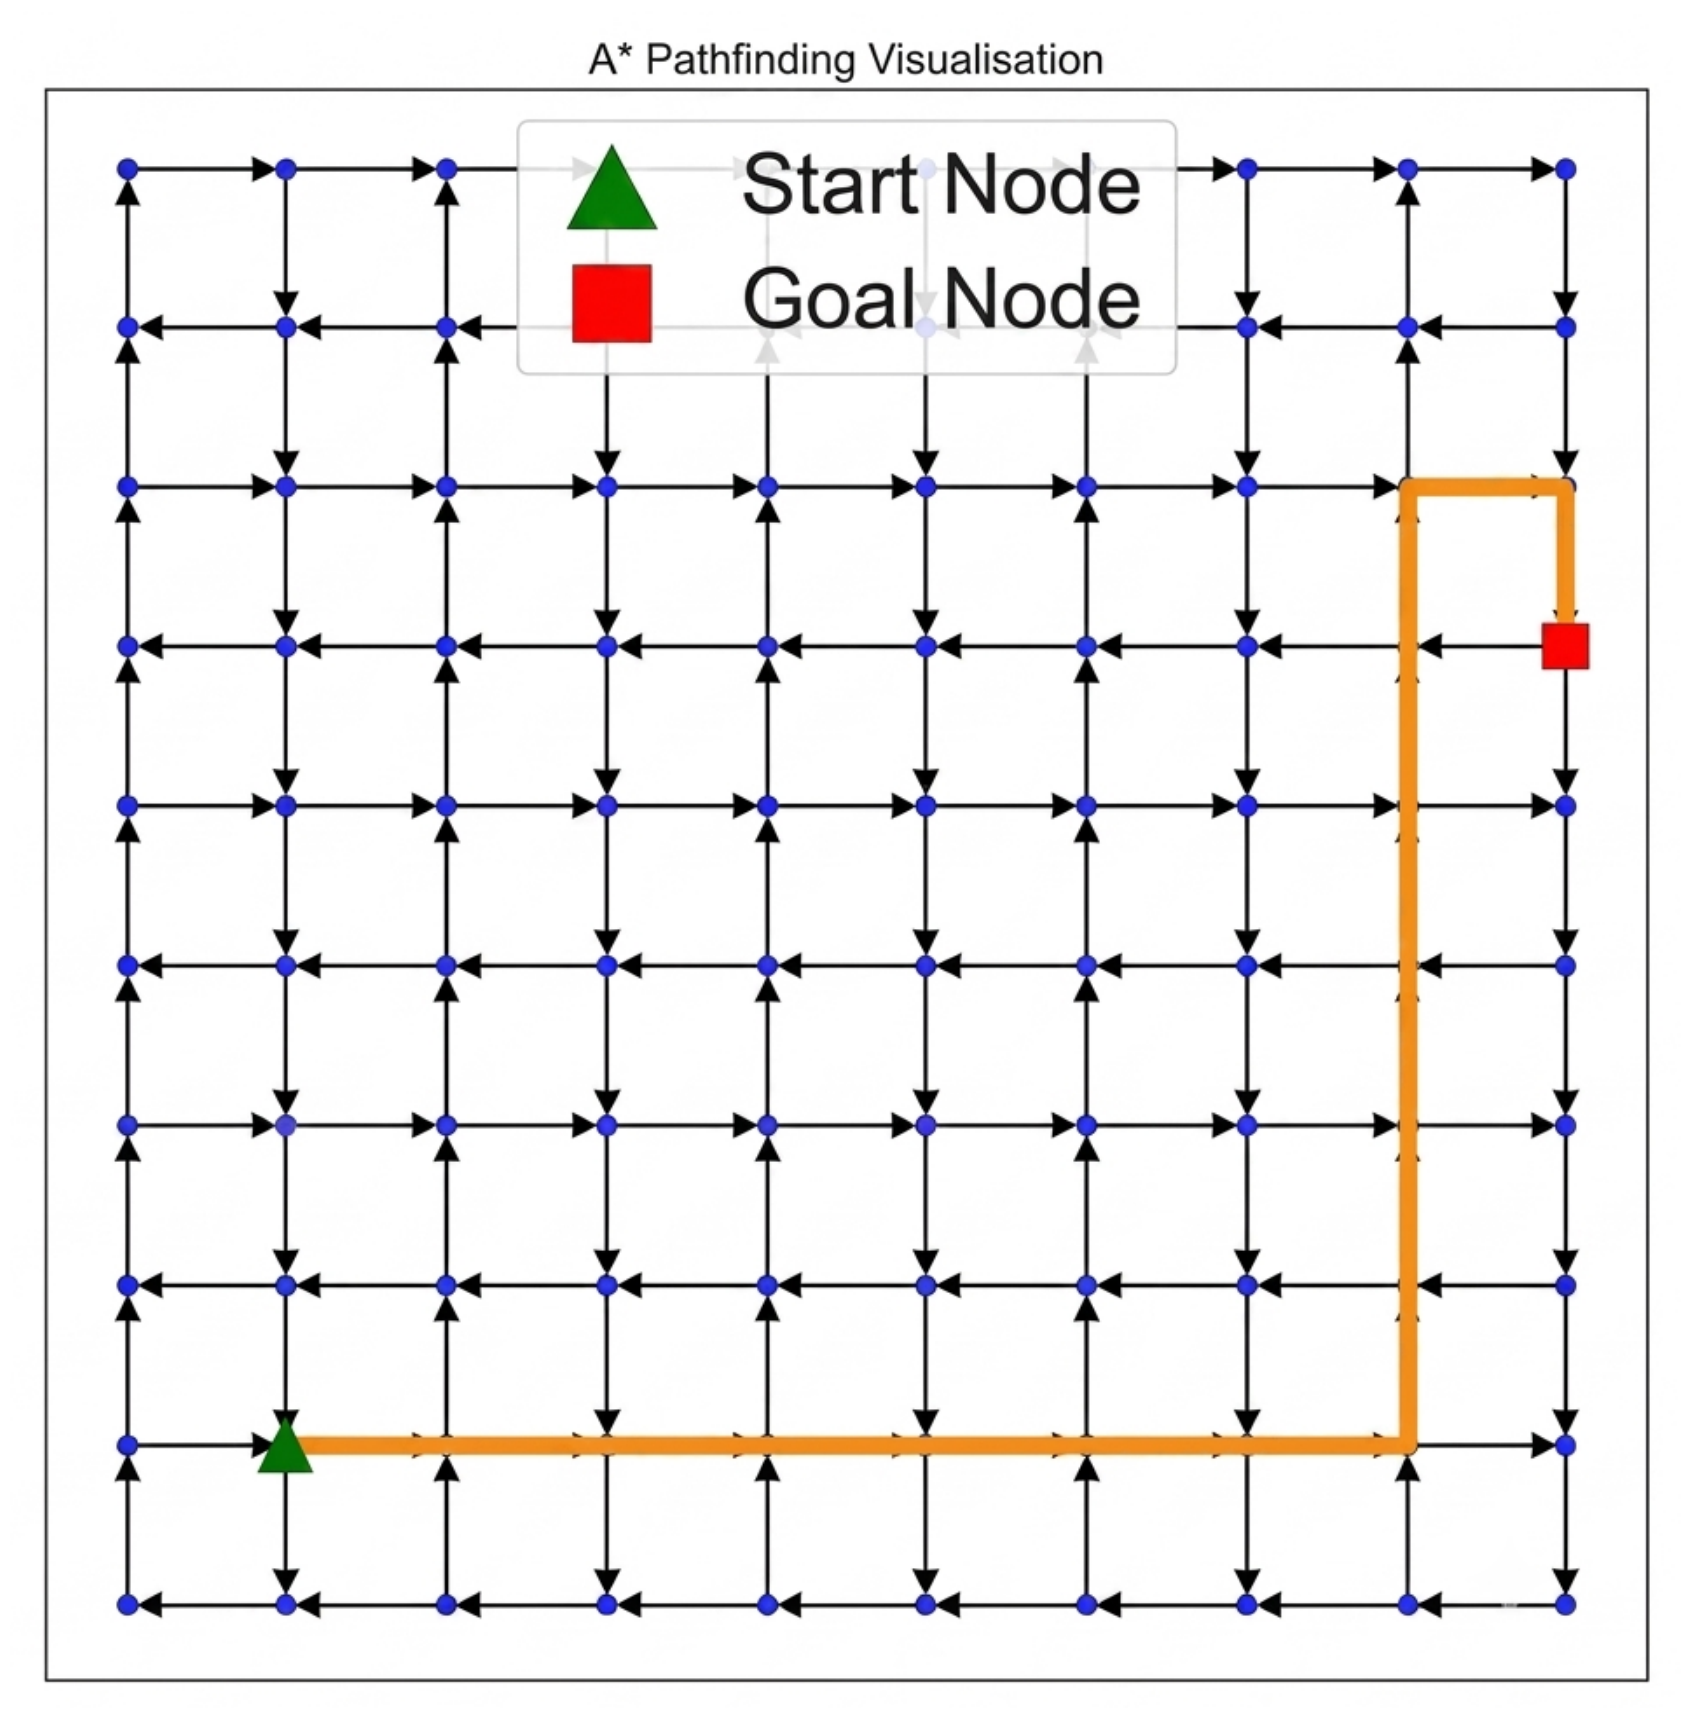
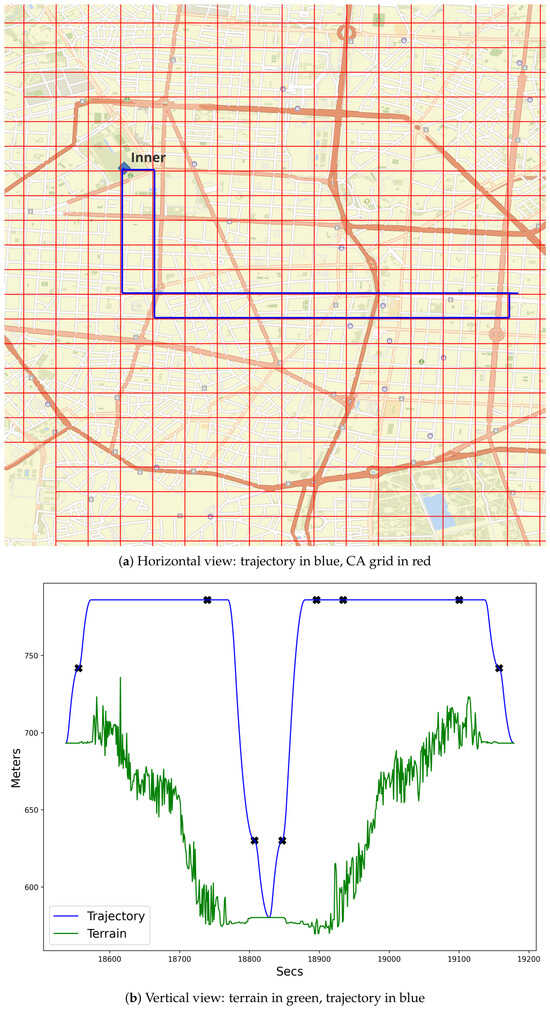
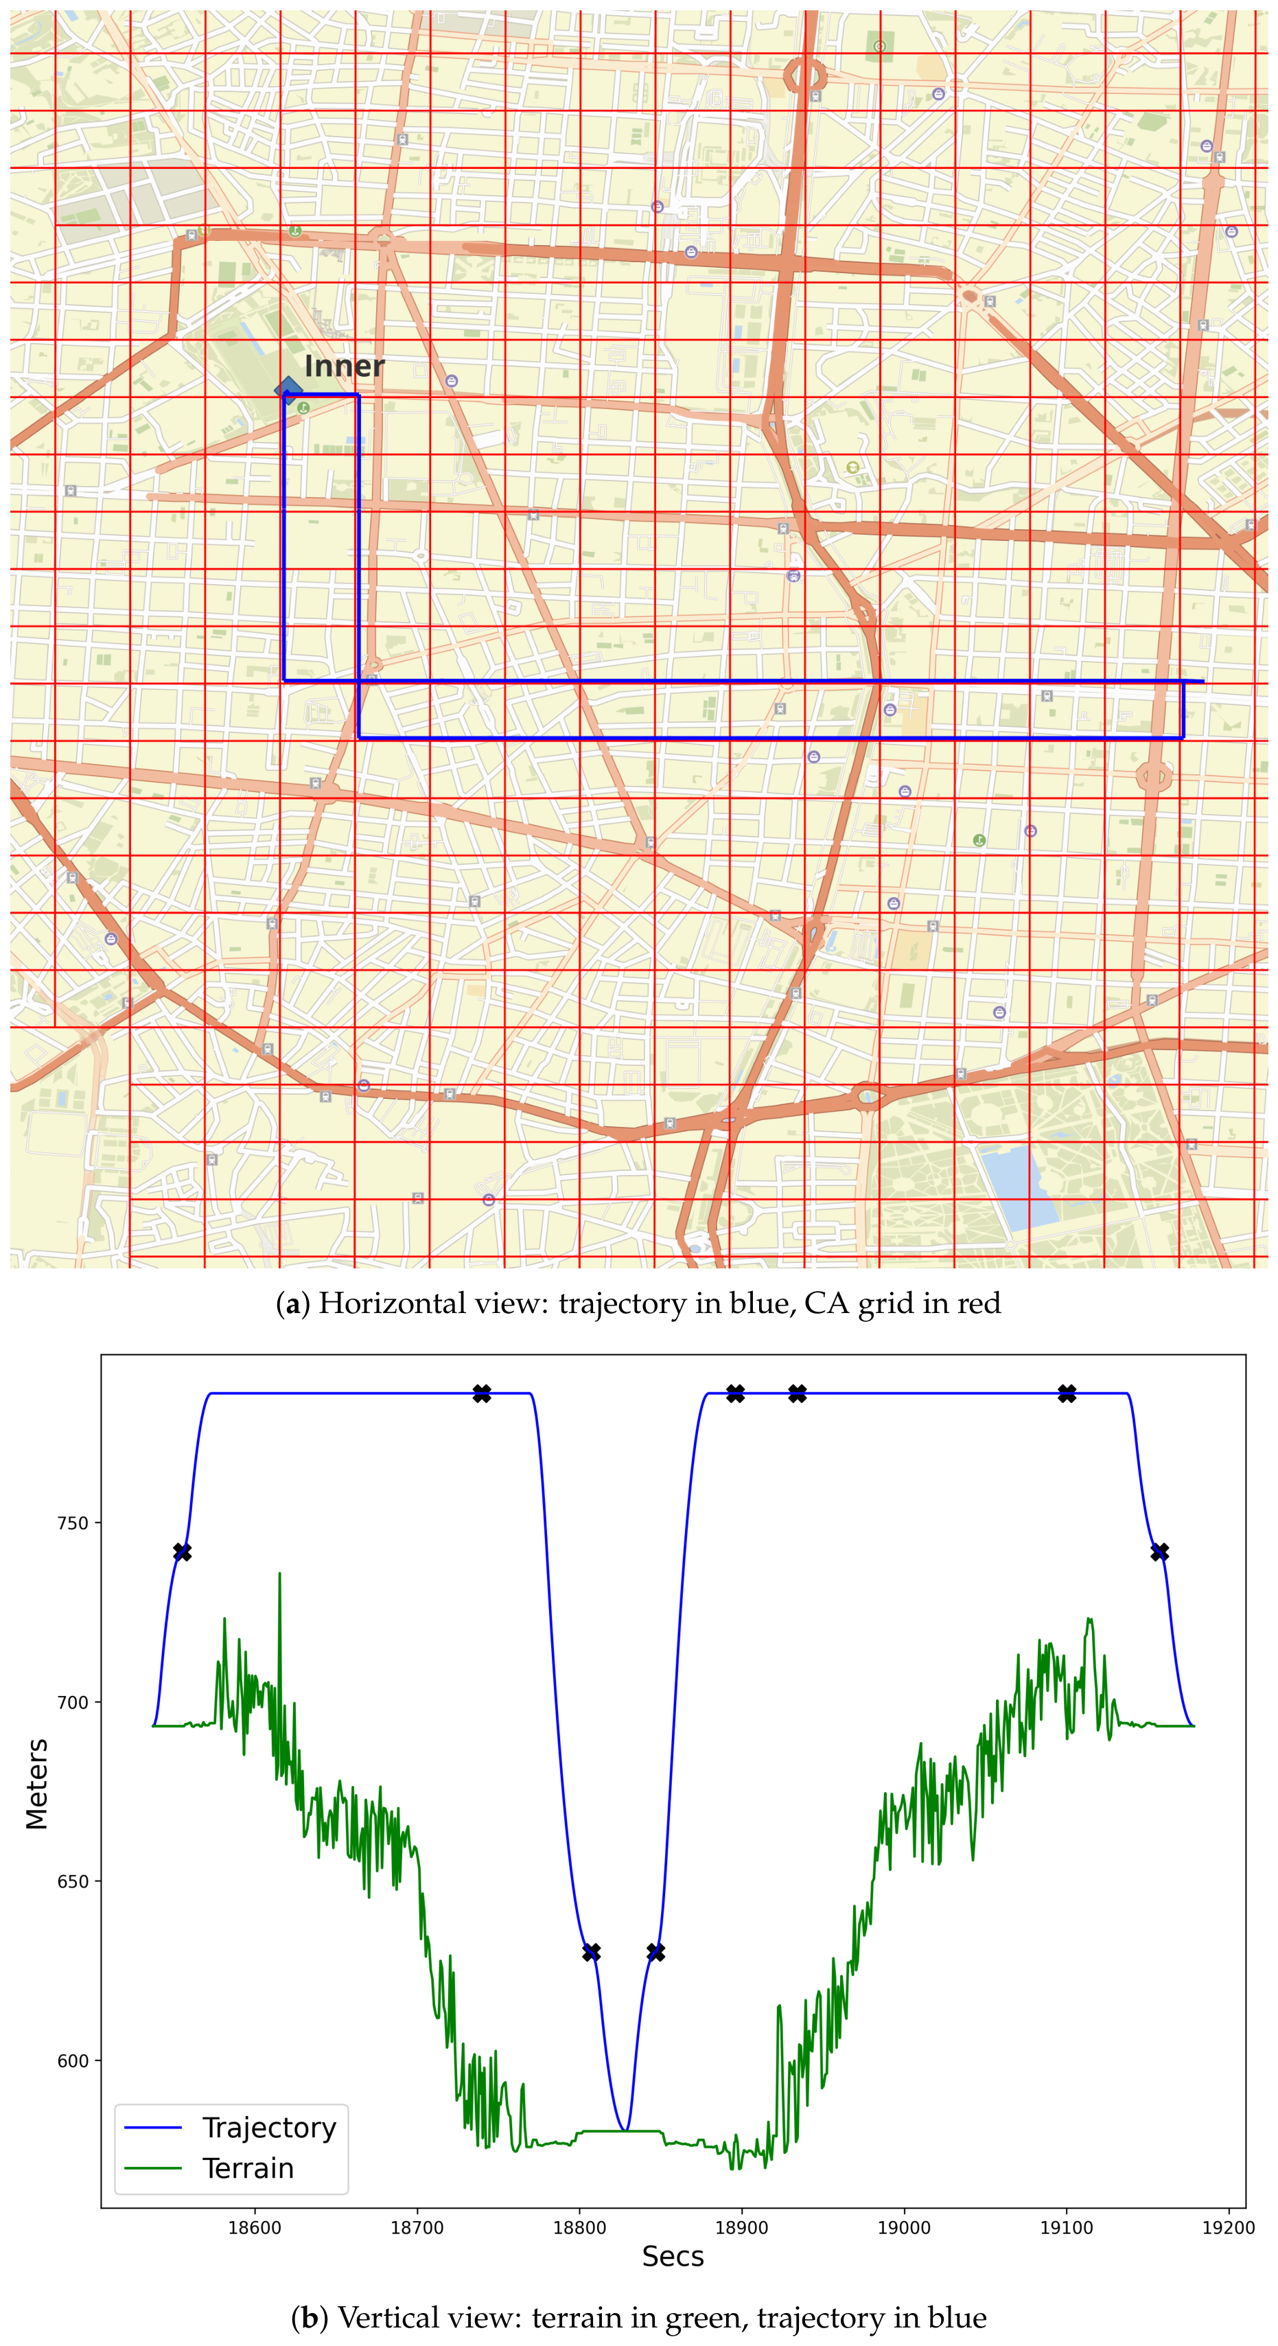
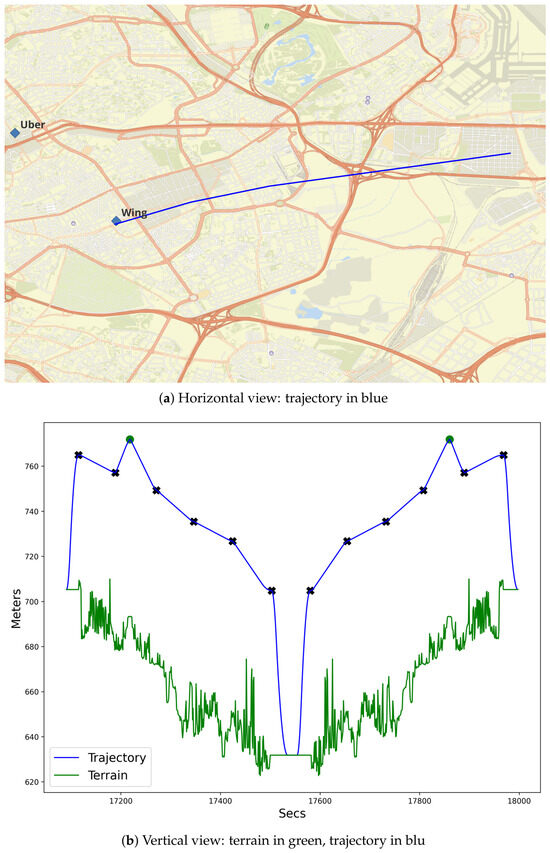
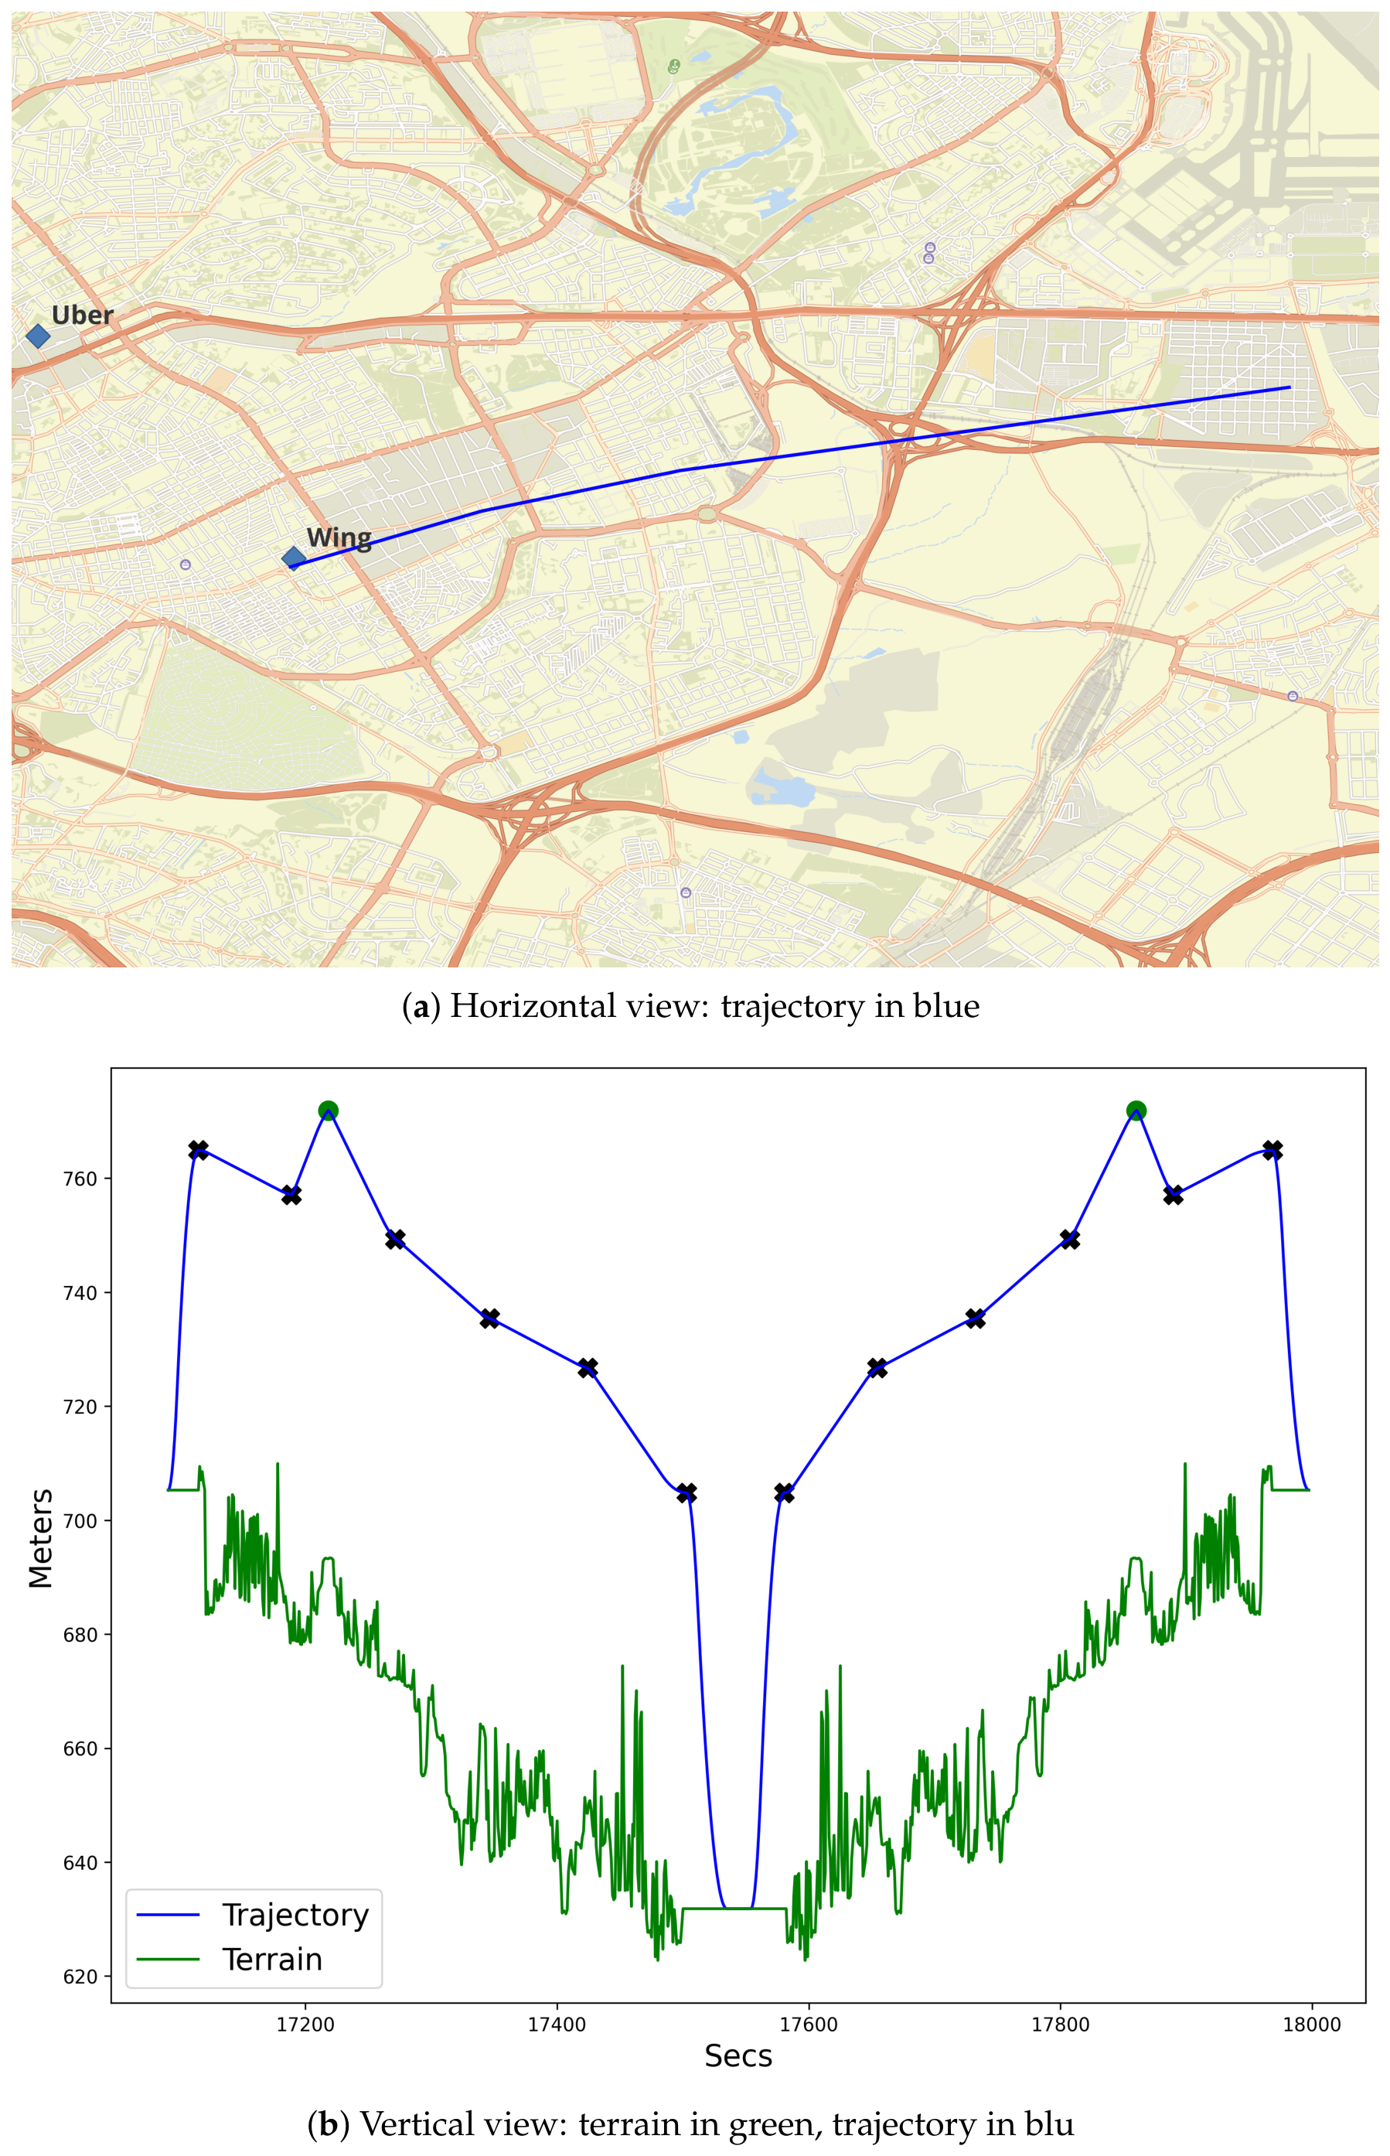
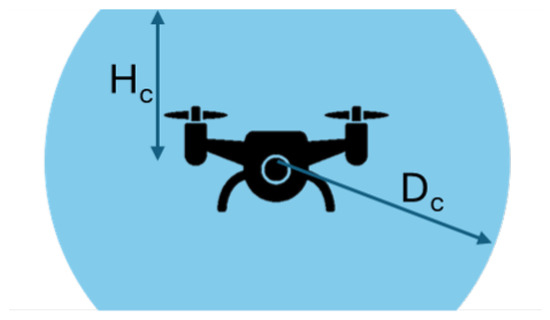
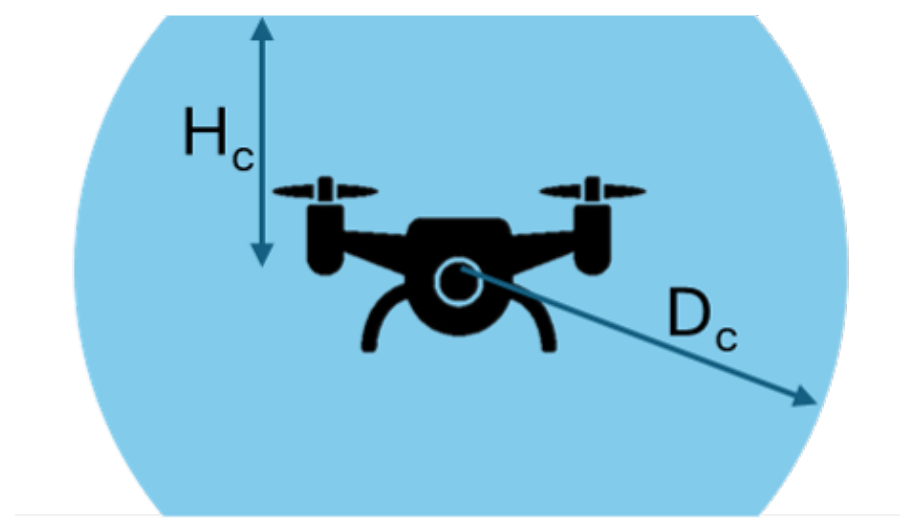
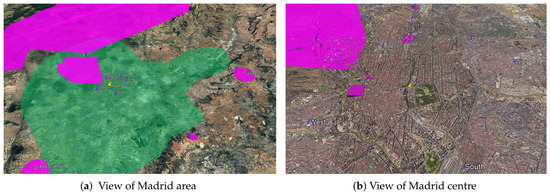
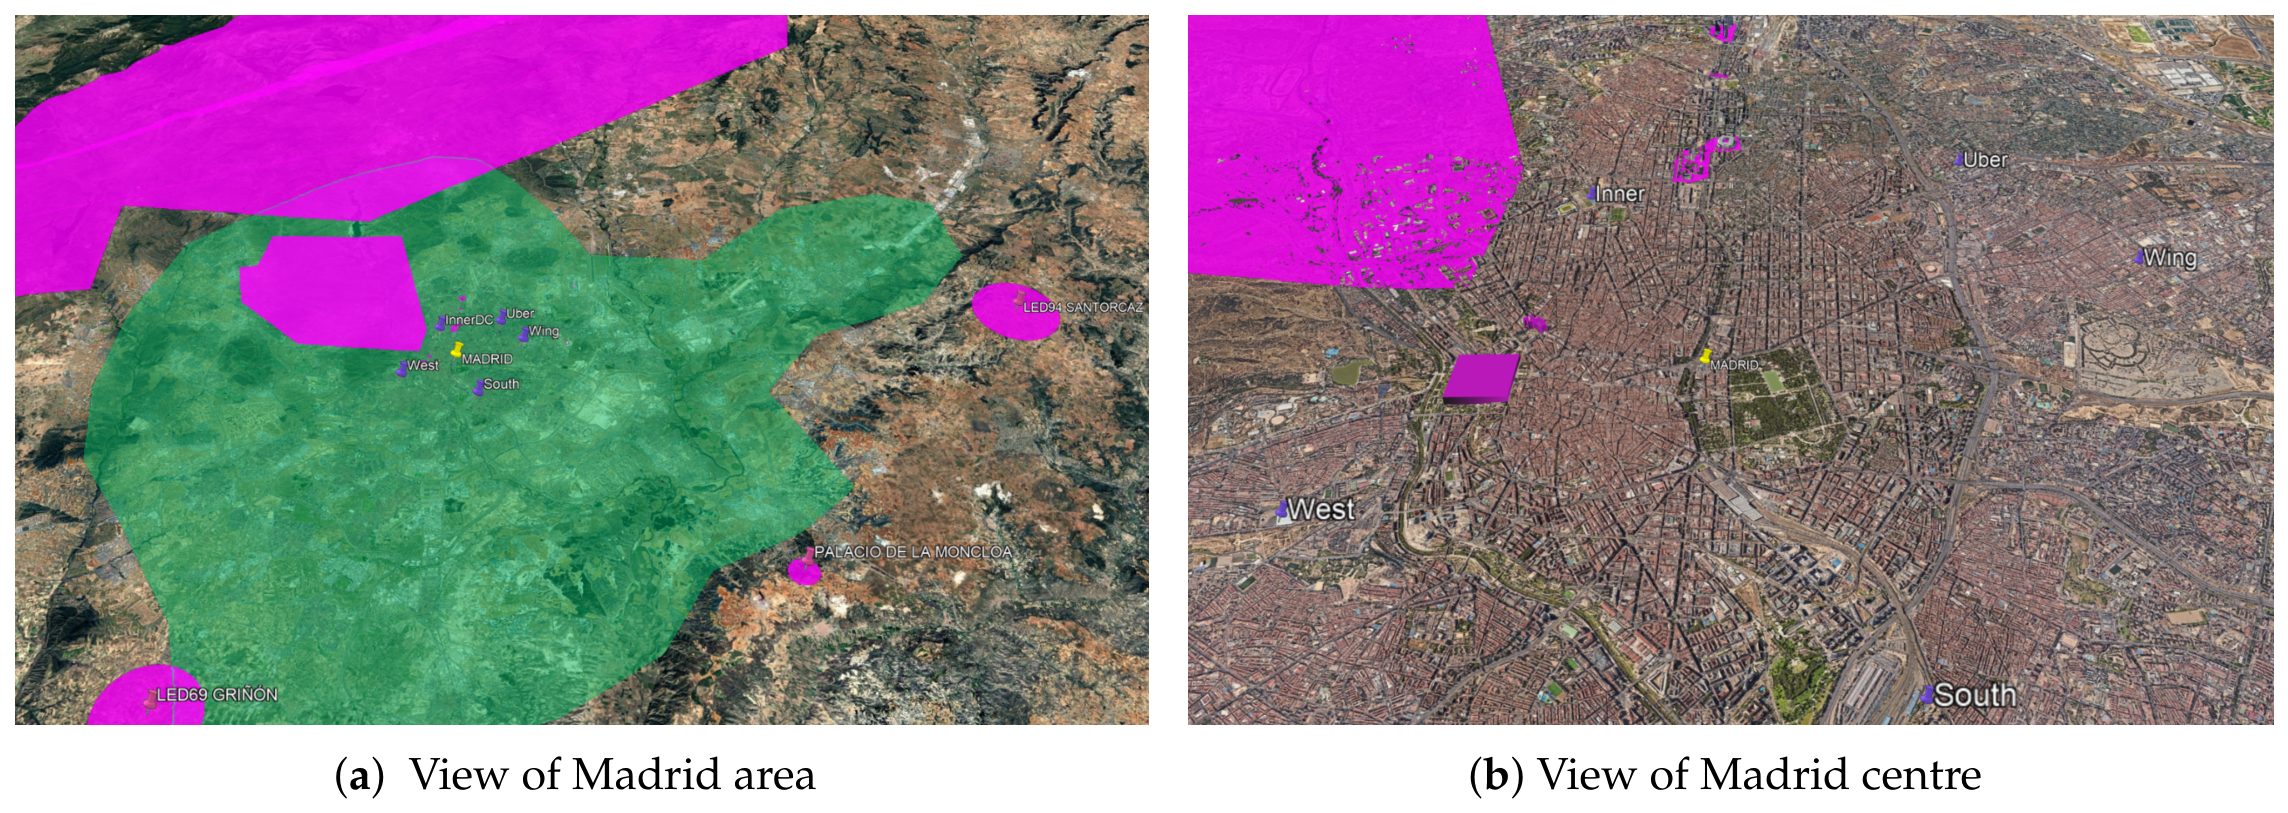
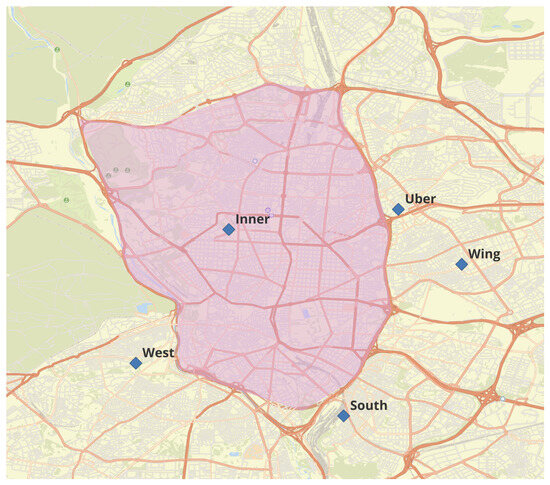
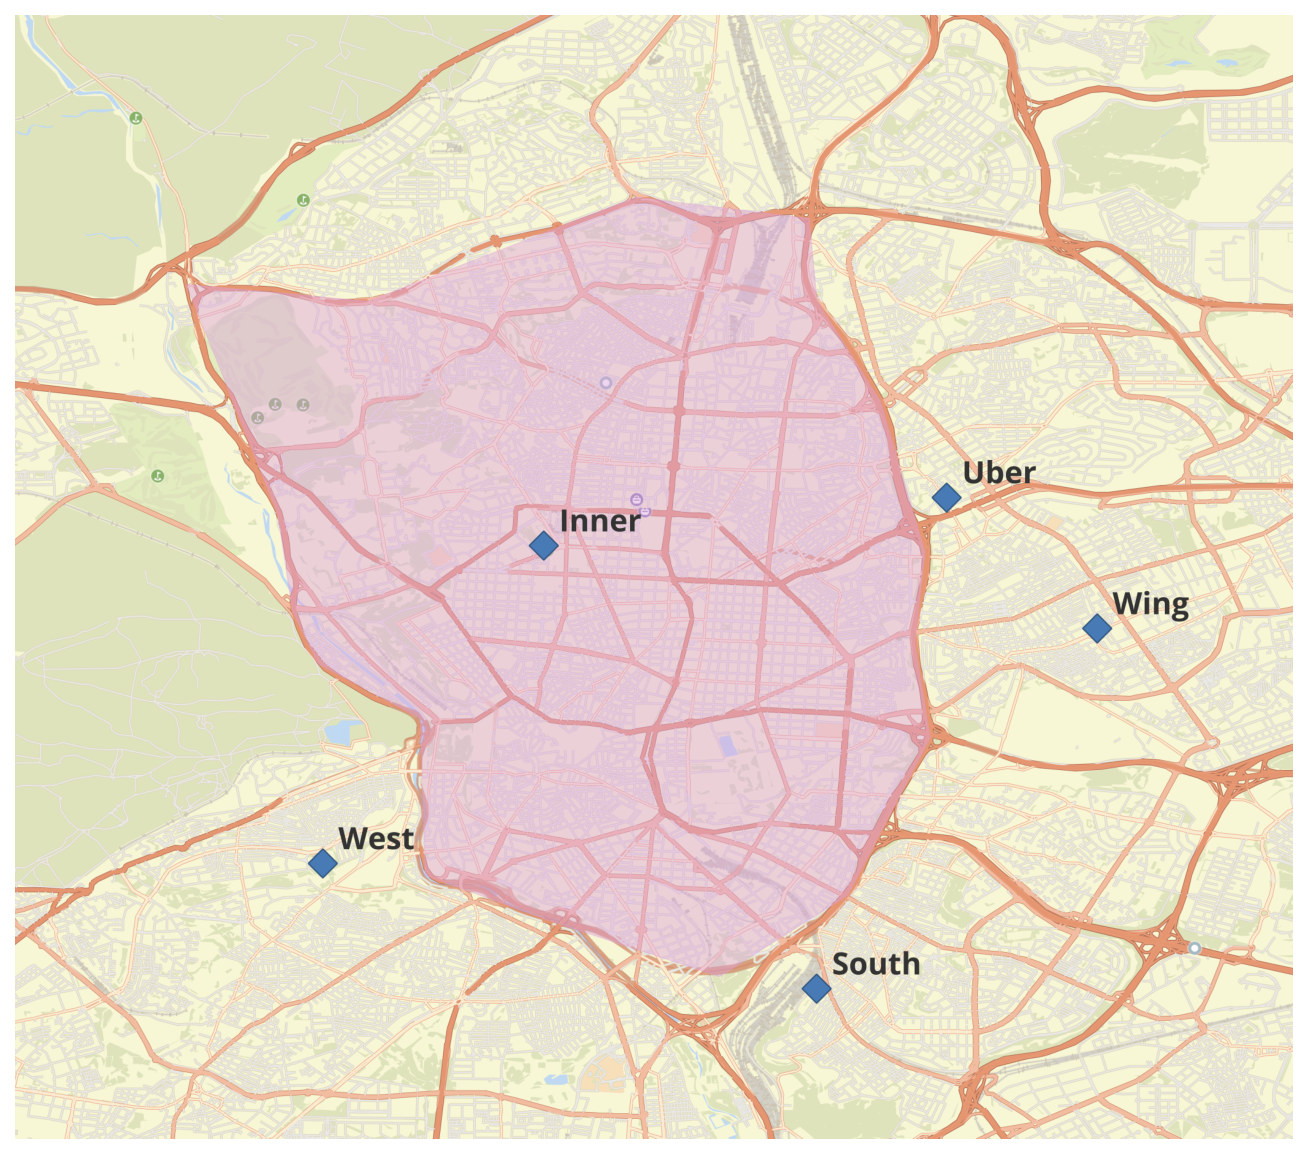
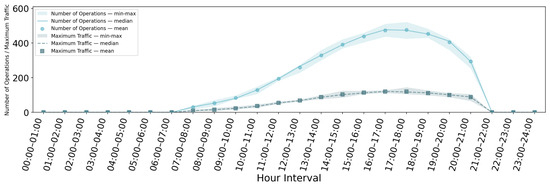
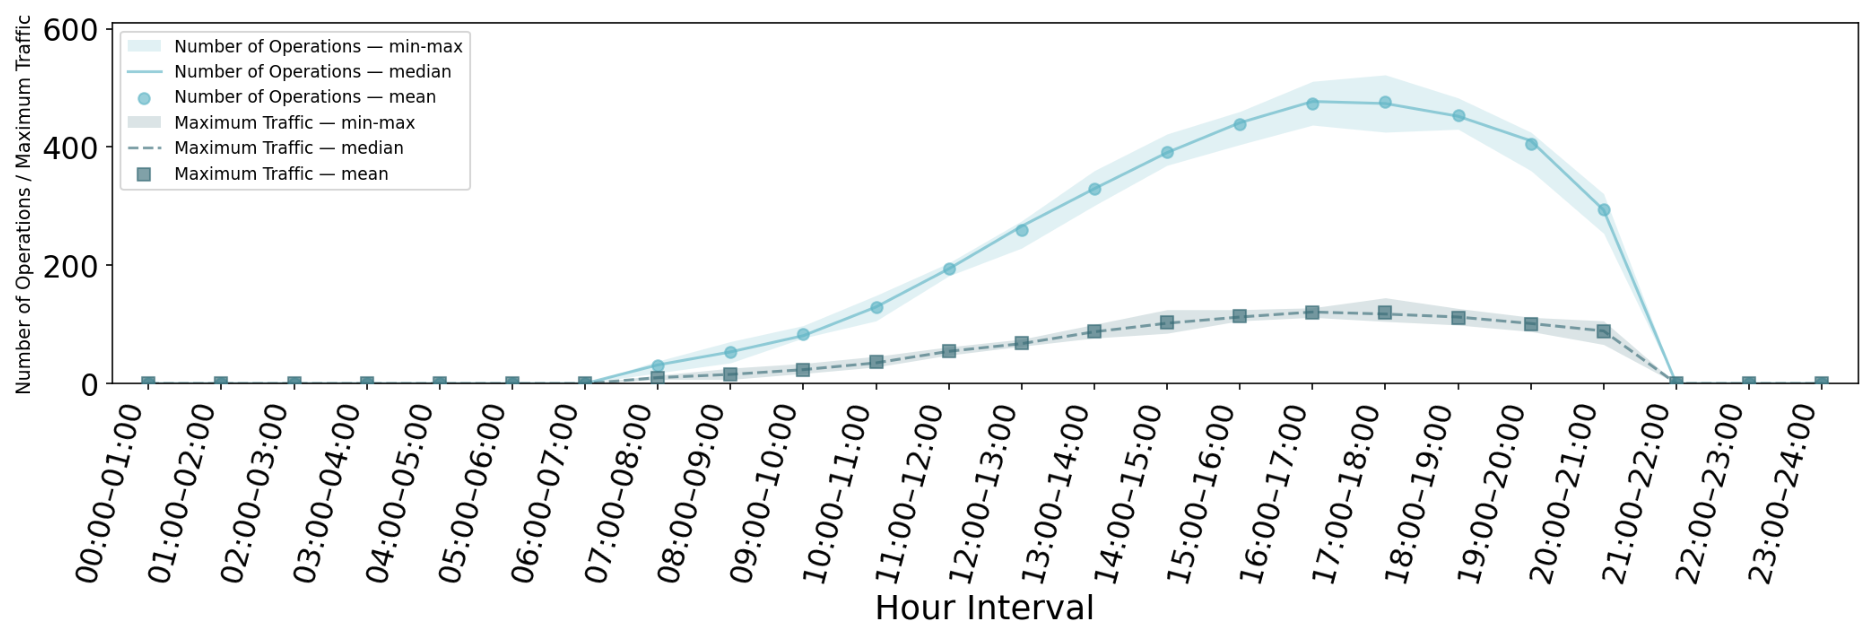
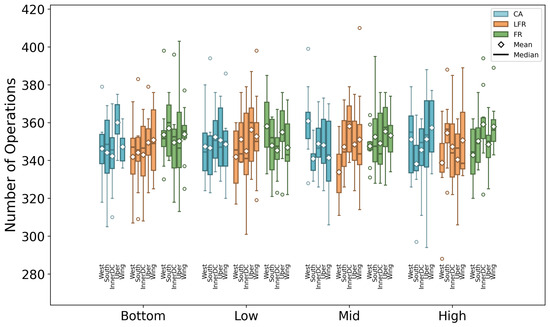
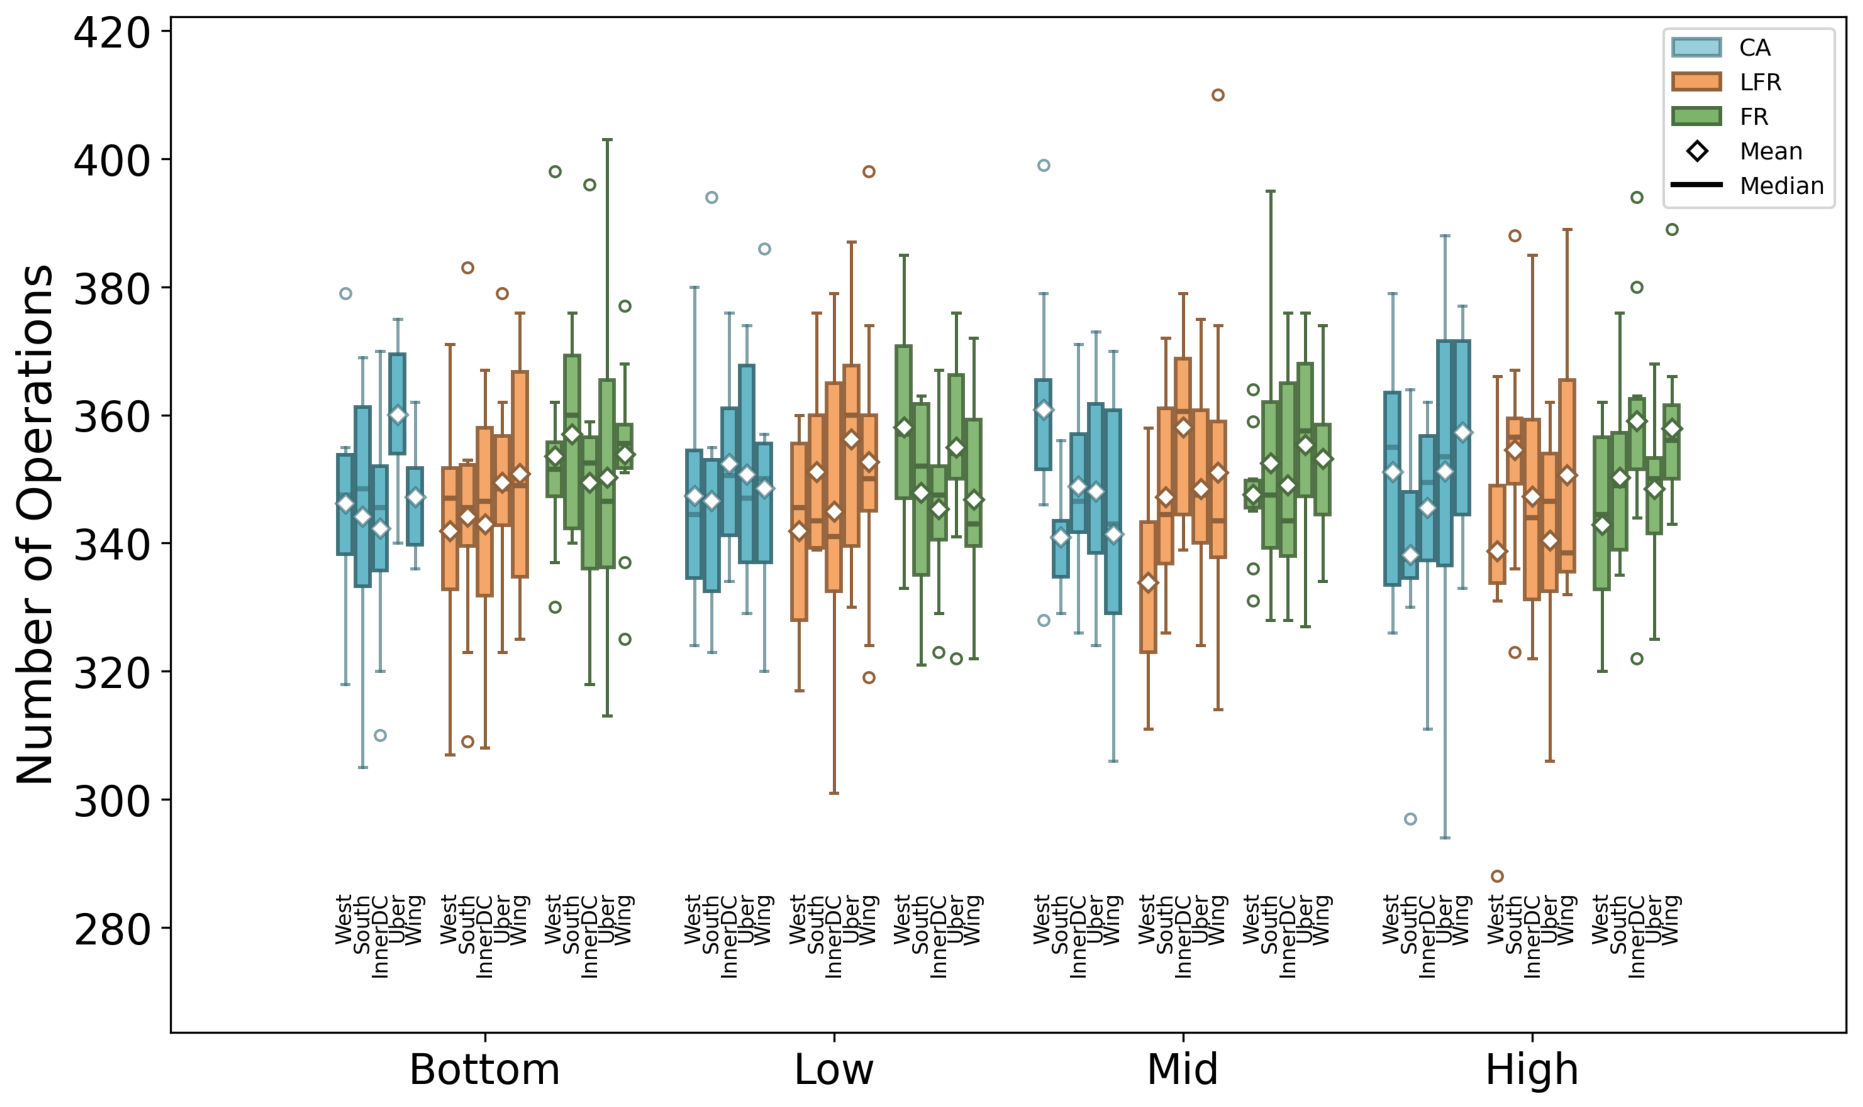
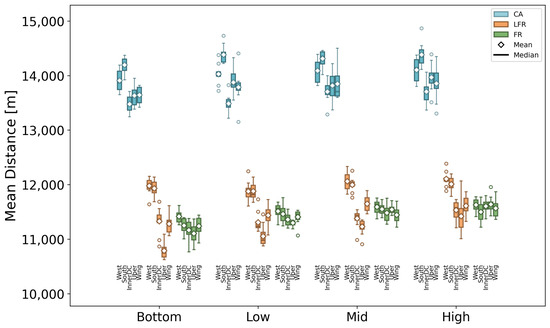
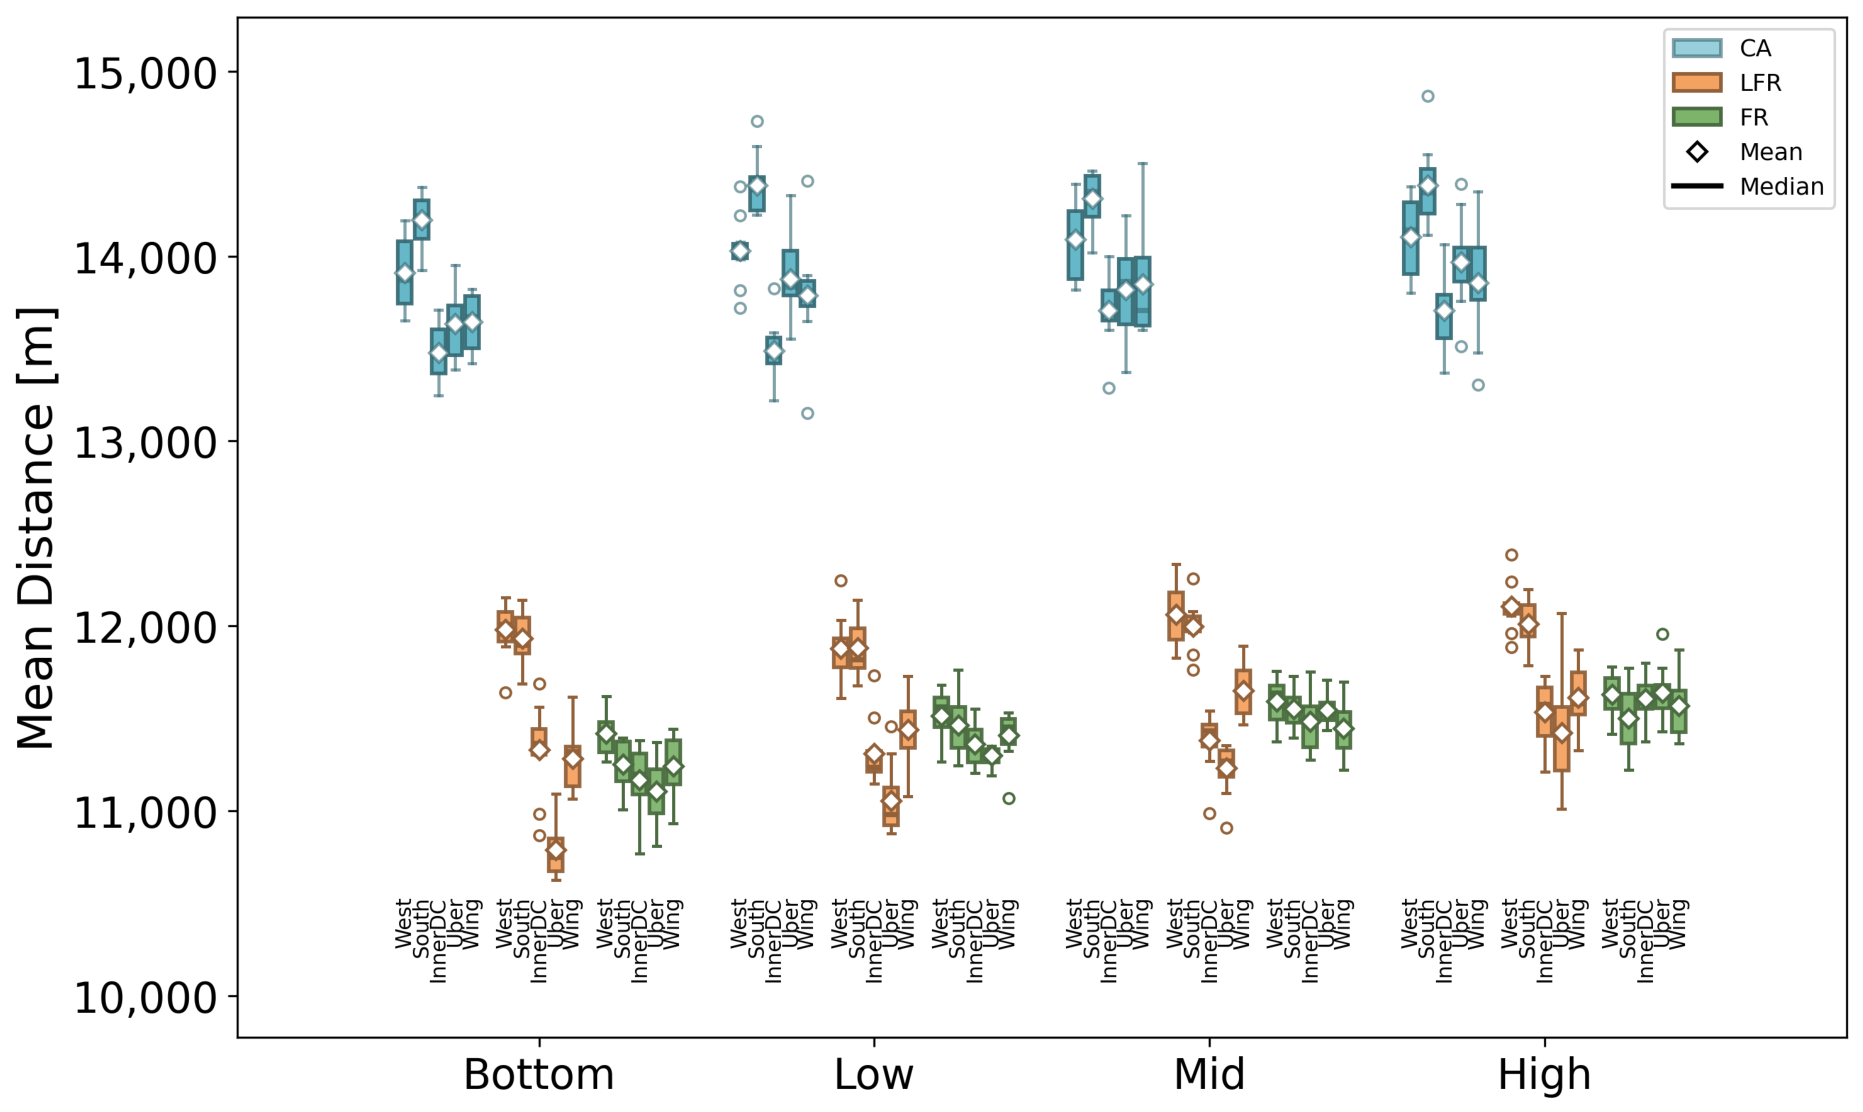
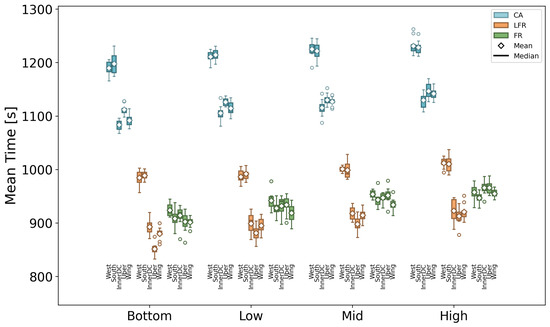
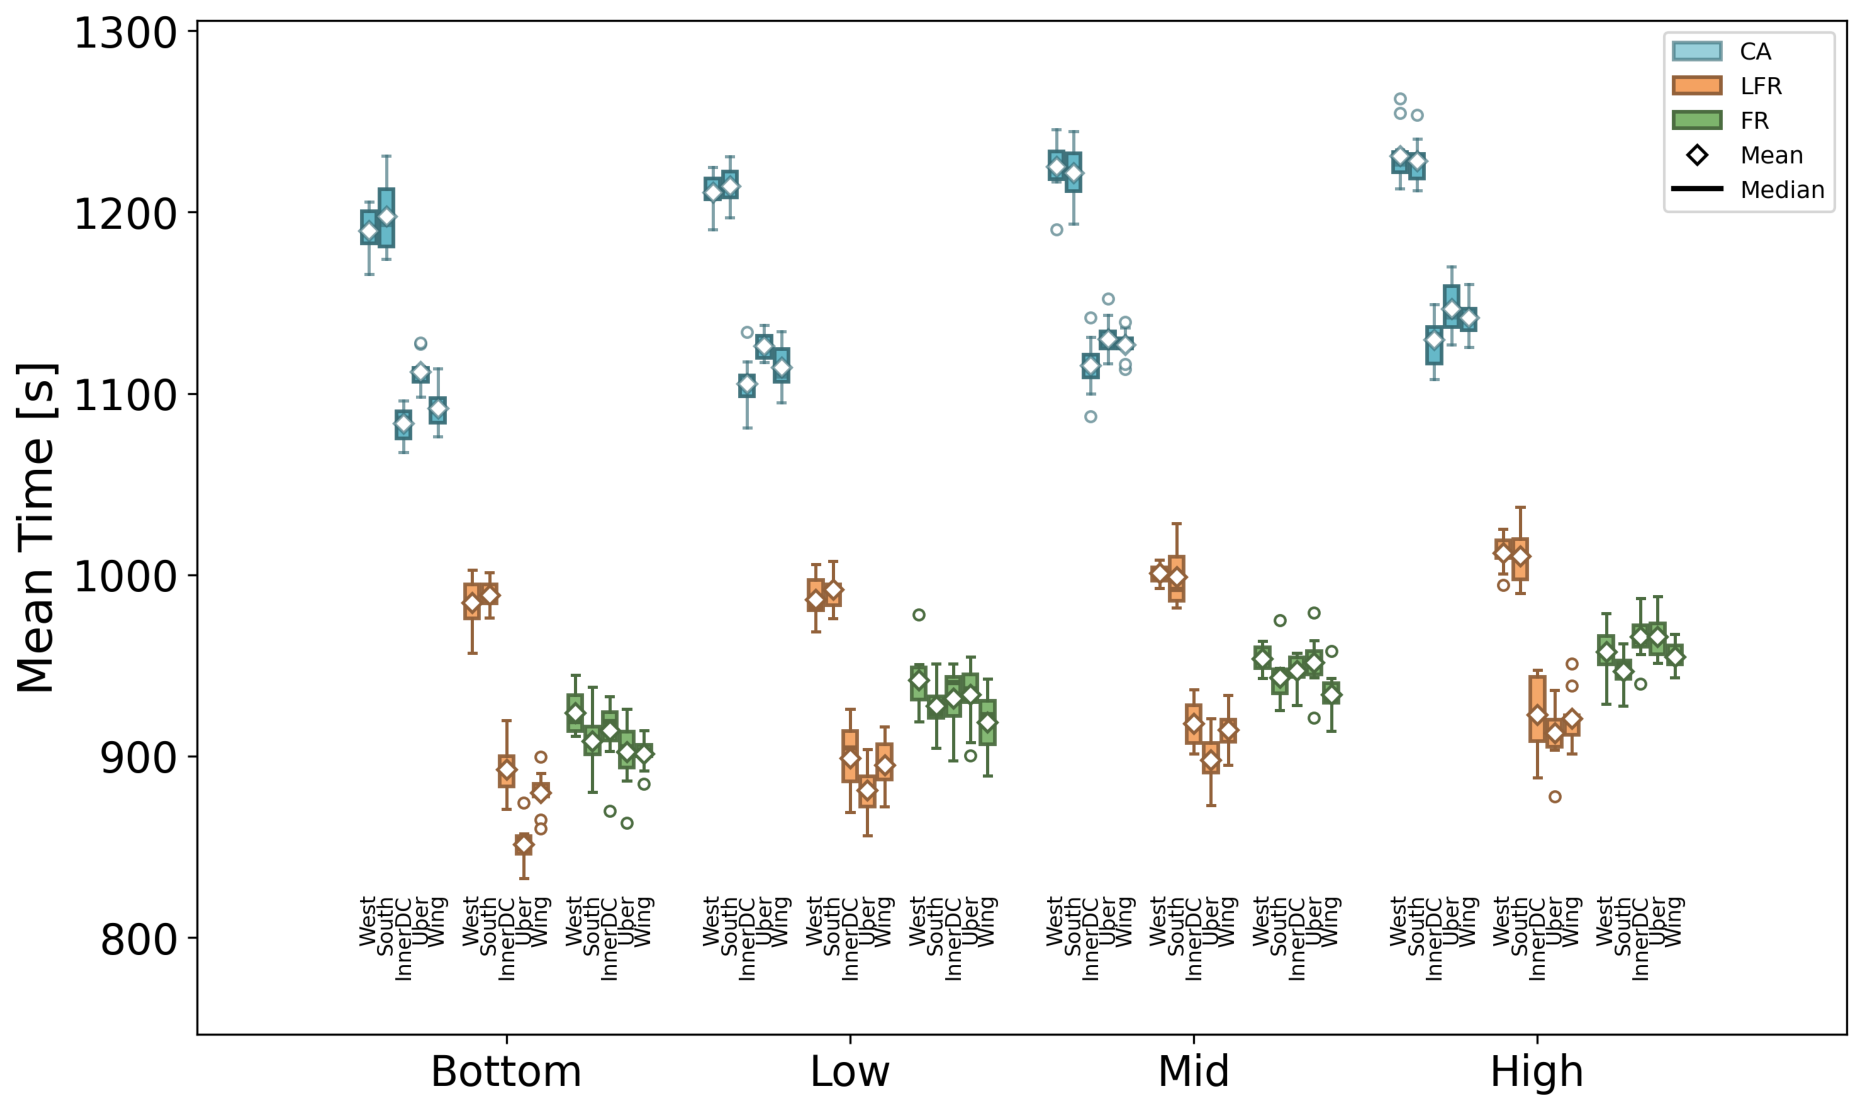
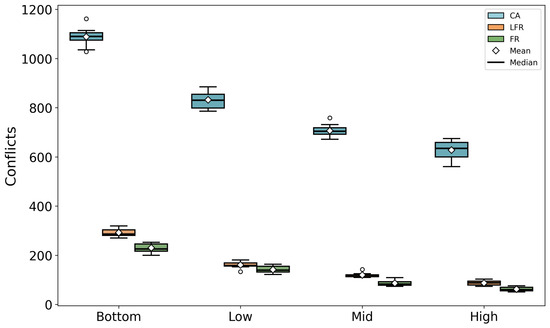
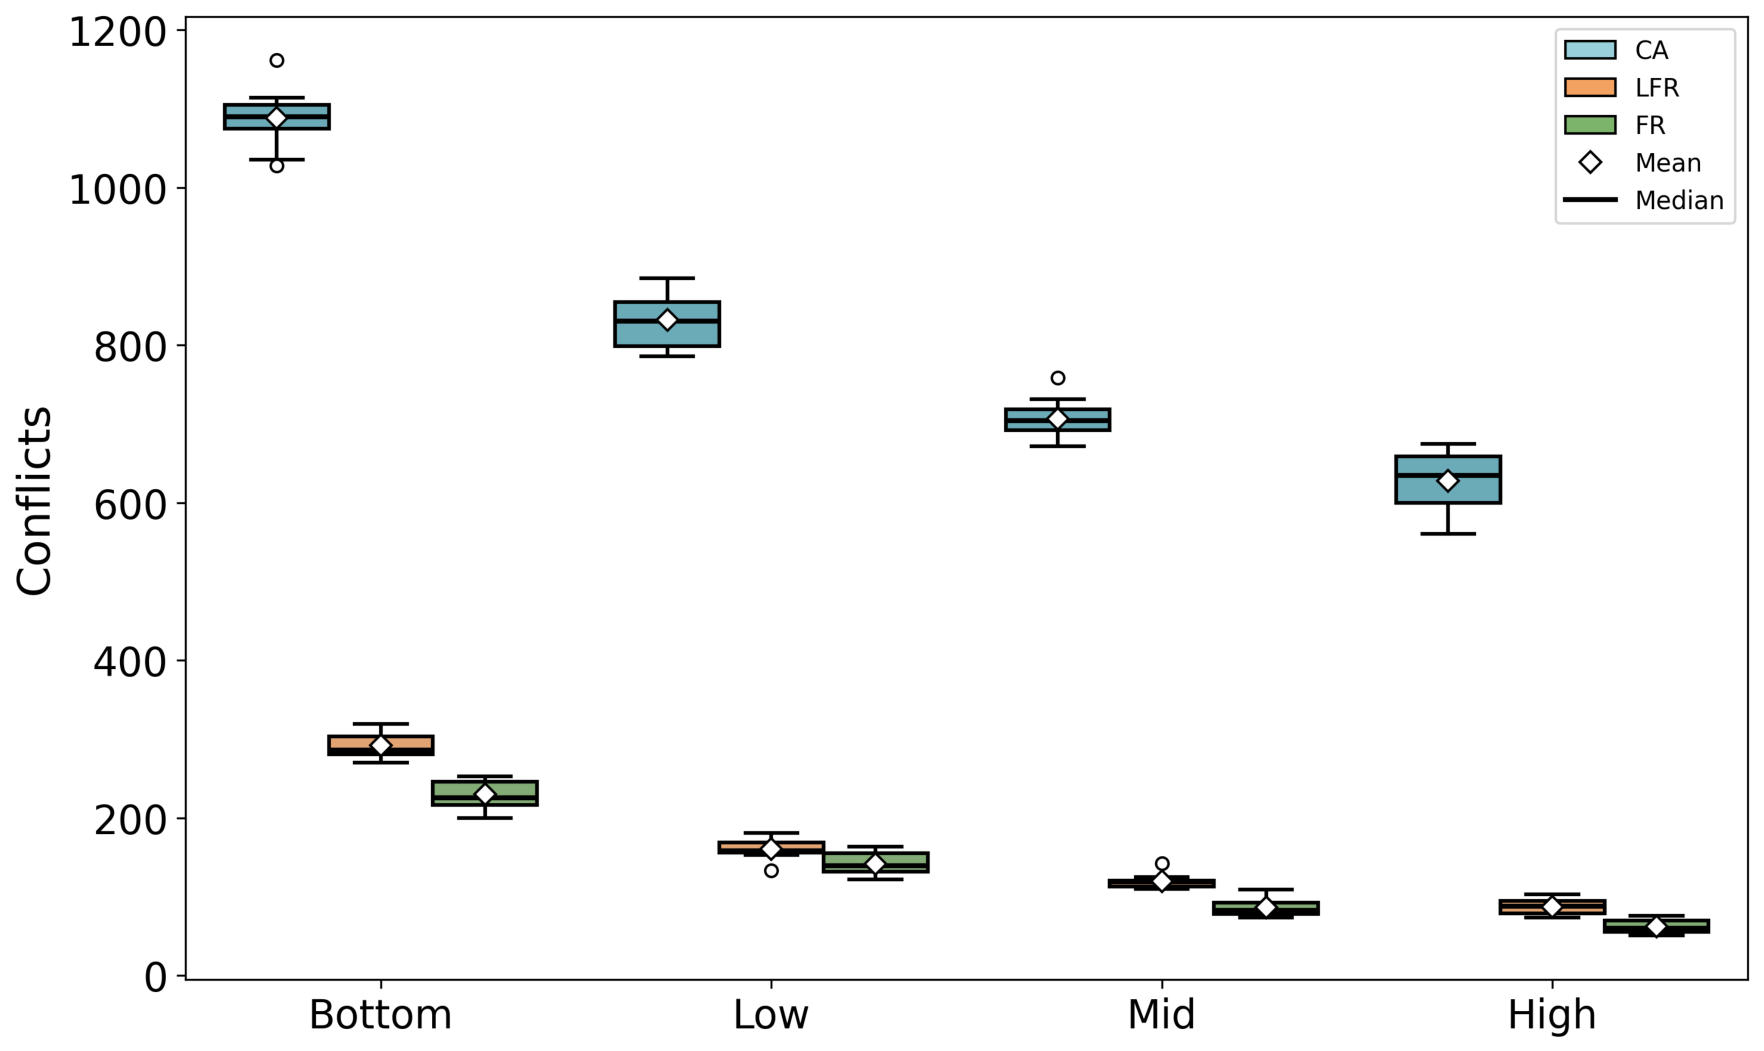
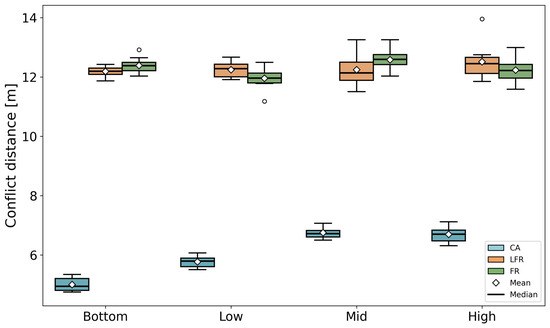
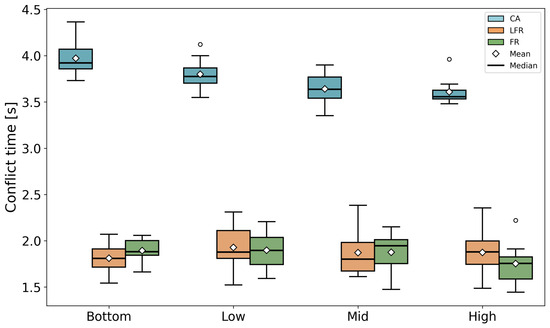
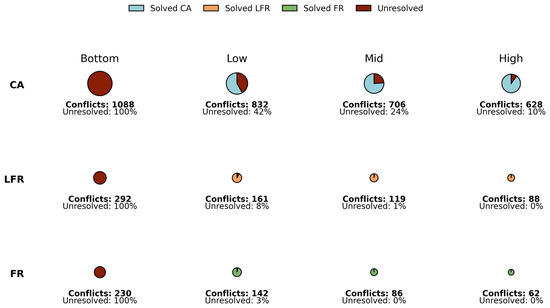
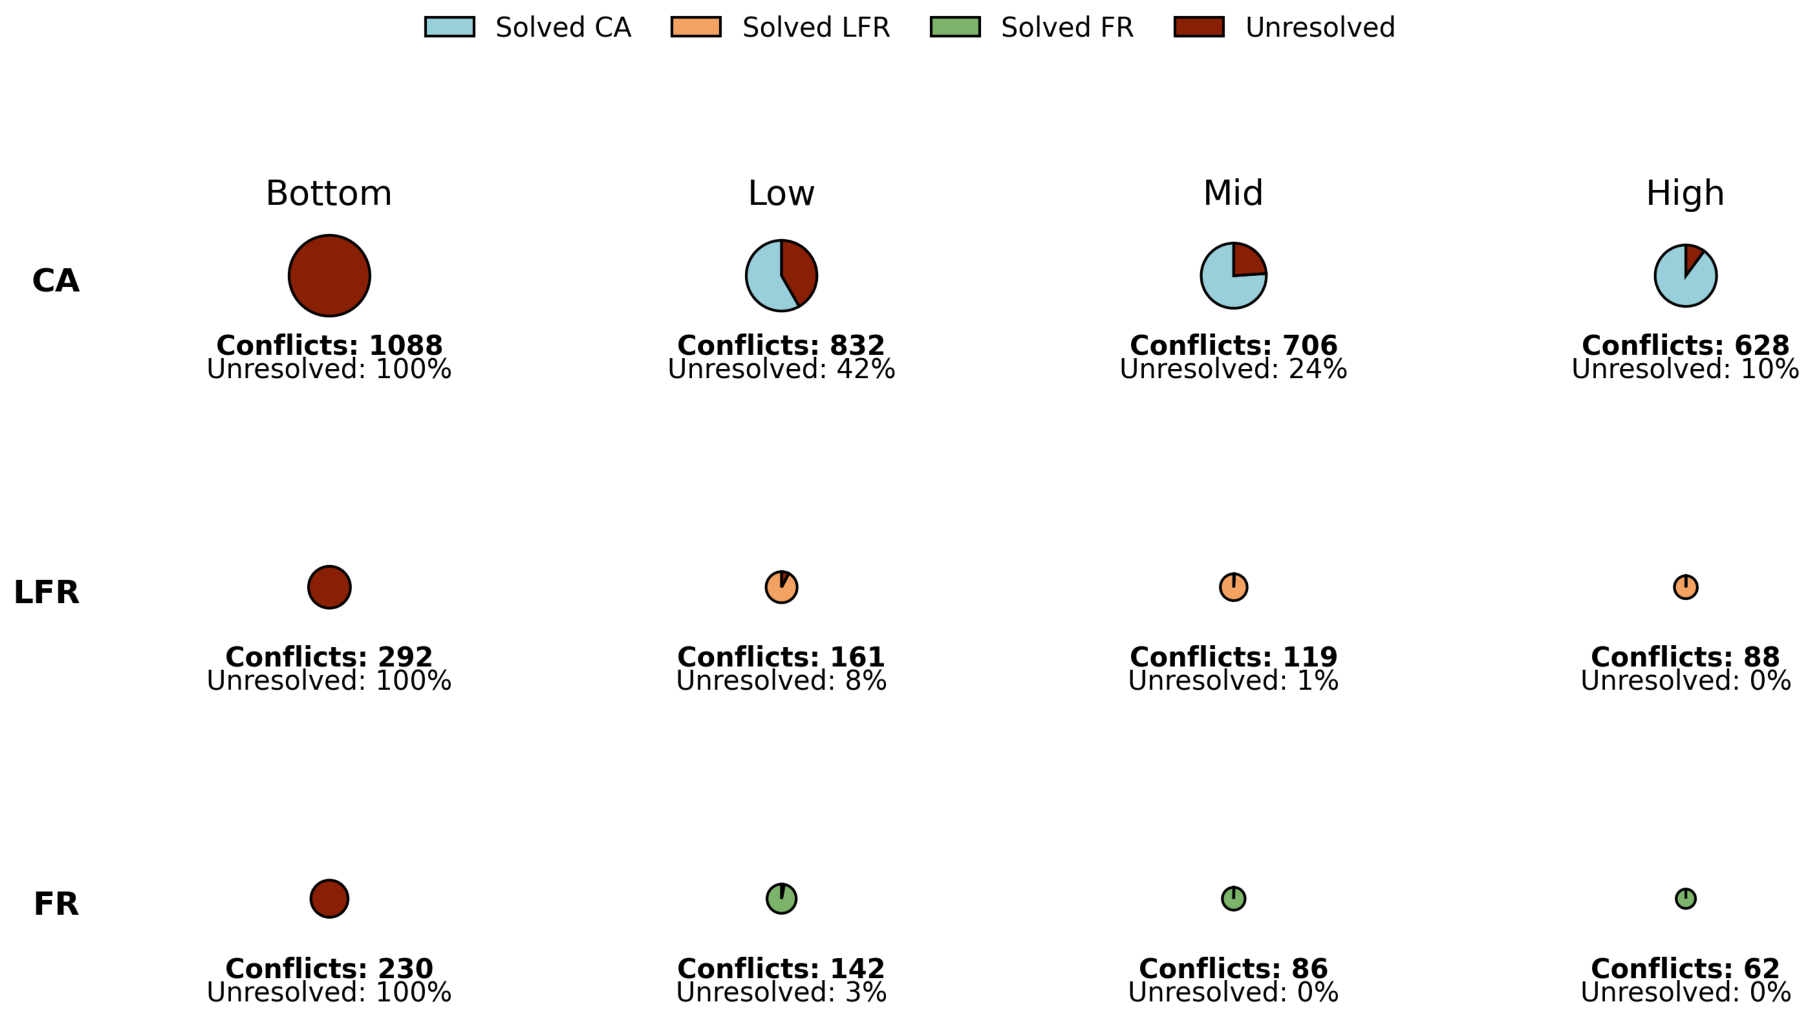
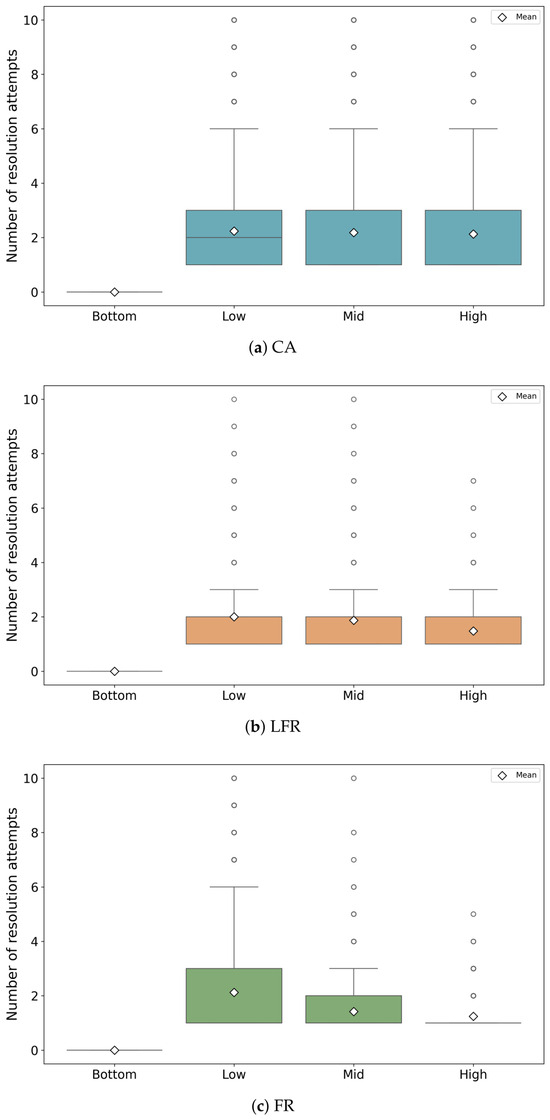
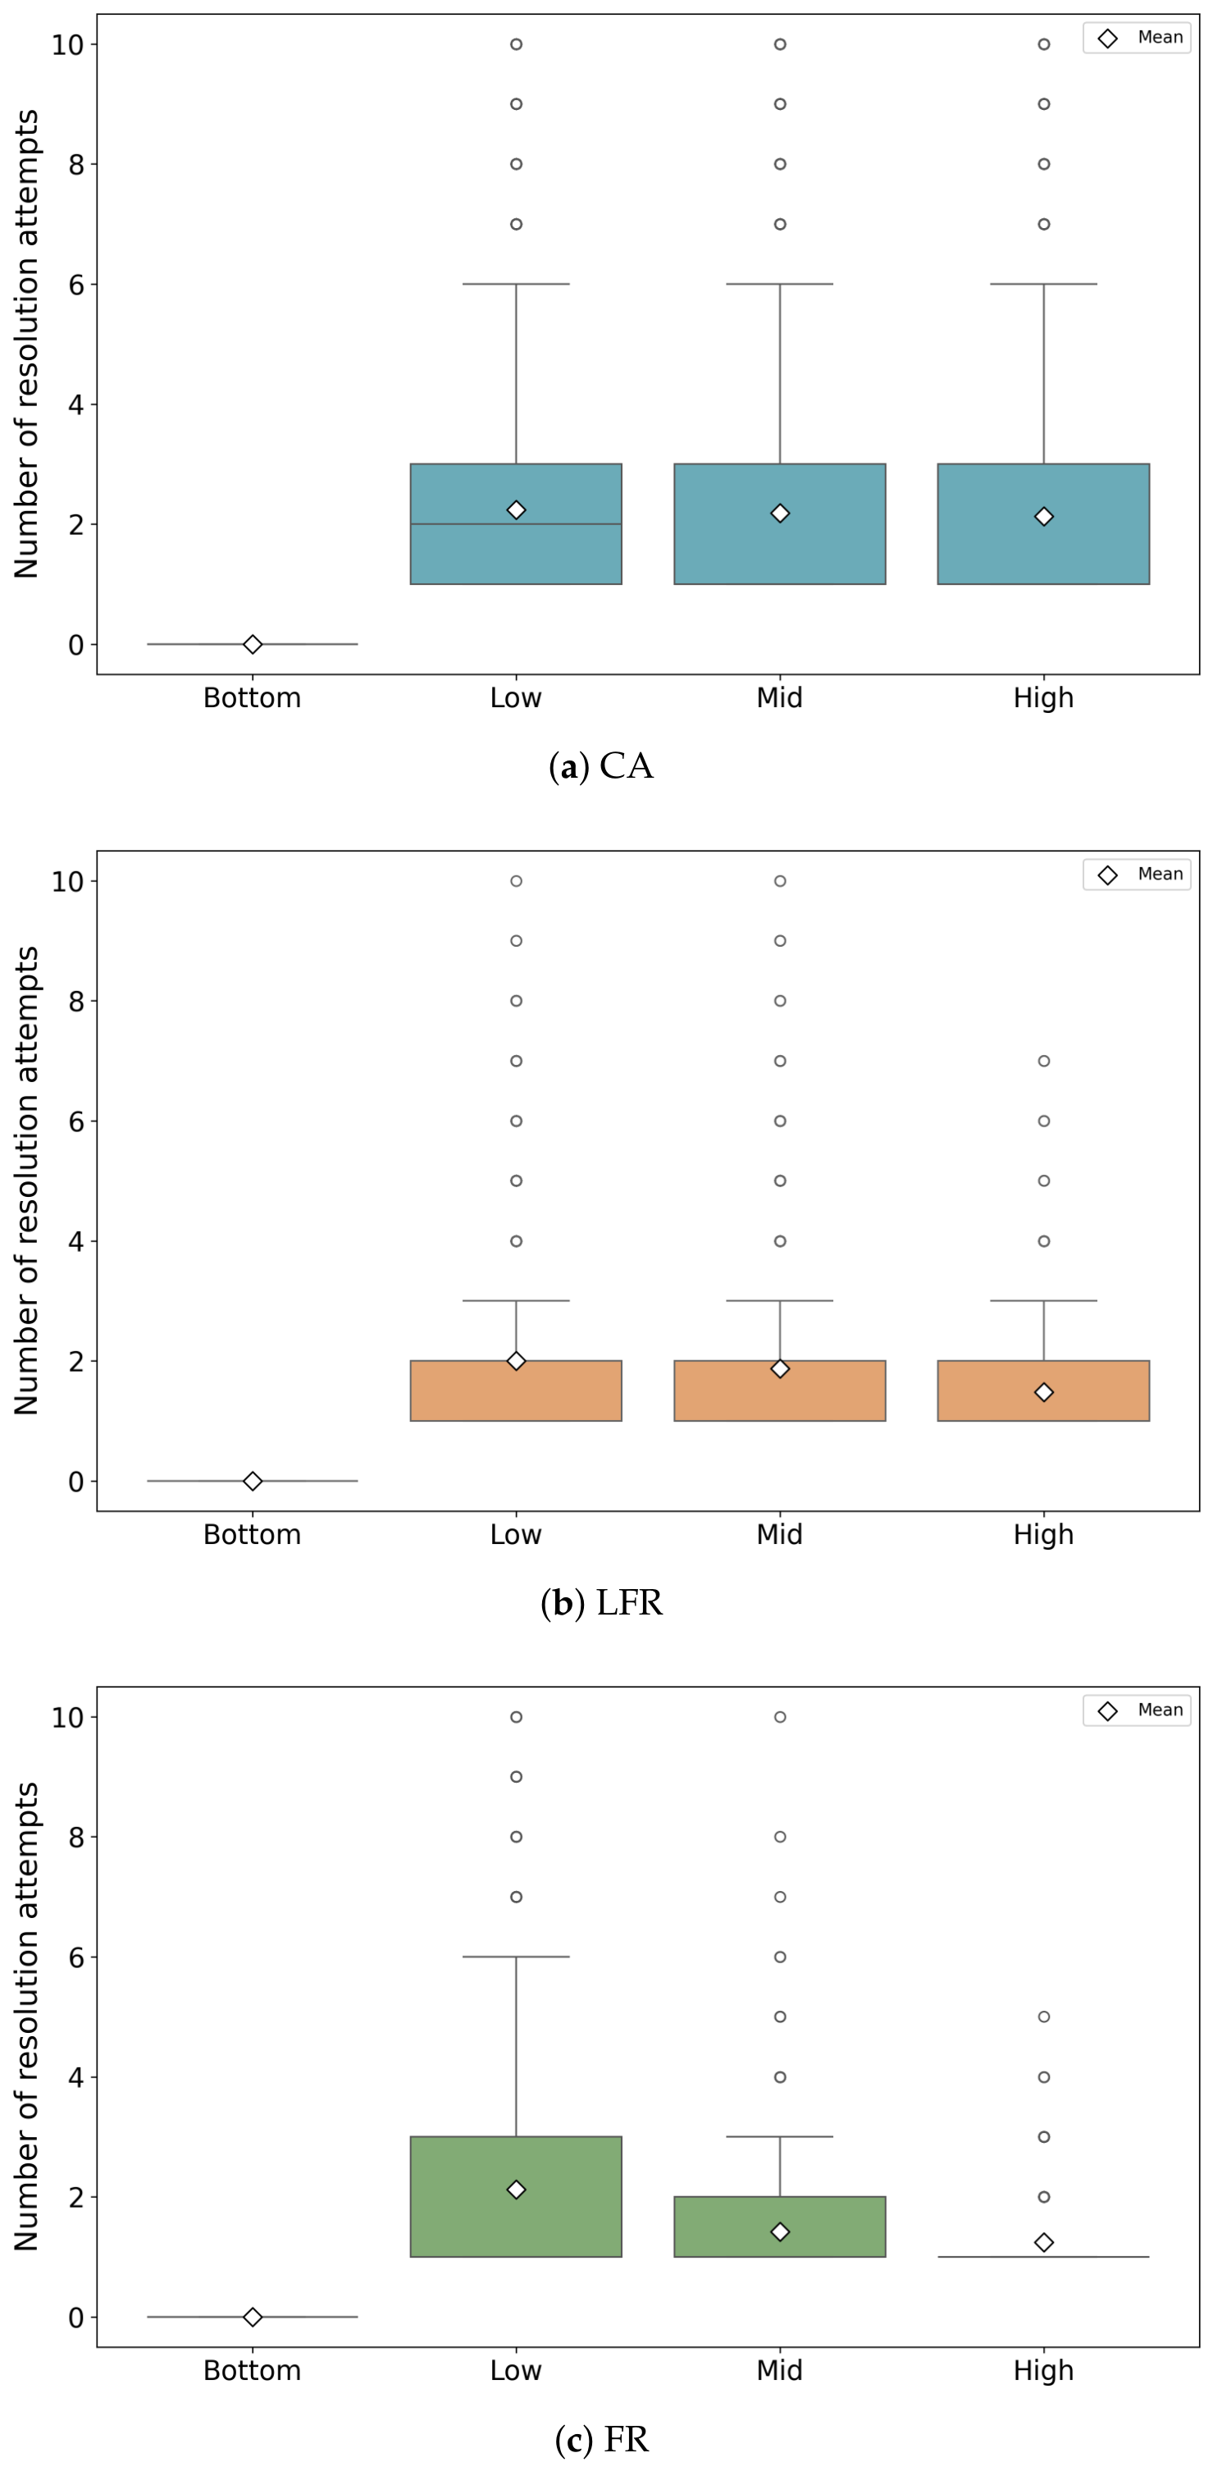

Disclaimer/Publisher’s Note: The statements, opinions and data contained in all publications are solely those of the individual author(s) and contributor(s) and not of MDPI and/or the editor(s). MDPI and/or the editor(s) disclaim responsibility for any injury to people or property resulting from any ideas, methods, instructions or products referred to in the content. |
© 2026 by the authors. Licensee MDPI, Basel, Switzerland. This article is an open access article distributed under the terms and conditions of the Creative Commons Attribution (CC BY) license.