


Highlights
What are the main findings?
- The paper presents an innovative hybrid methodology including steps covering qualitative analysis (NIST–ISO integration) and quantitative assessment (multi-layer hierarchical process based on AHP) of risks associated with drone-assisted services and applications.
- A five-layer hierarchy model is established to model the dependencies among the defined risk elements, to identify potential failure scenarios, and quantify their impact.
What are the implications of the main findings?
- The study presents two generic scenarios exemplified by drone-assisted applications to demonstrate their applicability in quantifying risk events.
- Cumulative risk contribution is computed and used in systematically assessing and prioritizing the most critical risk contributors to system performance degradation. In addition, a comparative analysis reveals the sensitivity of risk ranking to variations in AHP scoring.
Abstract
The rapid integration of UAVs (Unmanned Aerial Platforms) introduces new operational capabilities but also raises critical challenges. This paper presents a quantitative risk assessment approach for evaluating the risks related to drone-assisted systems. The methodology combines established standards with the principles of the multi-criteria hierarchy concept. First, a qualitative analysis is performed to identify and register the required risk elements. Following this, a hierarchical model is developed to model the dependencies between systems’ components, environmental factors, structural limitations, and operational uncertainties. An AHP-based (Analytic Hierarchy Process) process is applied to enable elements quantification. To demonstrate the applicability and feasibility of the proposed methodology, two different drone-assisted systems are examined, showcasing their effectiveness in evaluating critical risk elements and computing cumulative risk contribution to quantify and prioritize potential risk events. The results indicate the significance of the methodology in ranking the verified risk elements and identifying those that made the greatest contribution to system failure. As revealed, power- and weather-related elements are among the most significant contributors to performance deterioration. In addition, operator-related factors significantly contribute to the system’s overall functional performance, especially when it is manually controlled. Finally, a comparative analysis underscores the sensitivity of risk ranking to variations in AHP scoring.
1. Introduction
Unmanned aerial systems (UAS) have become a highly popular technology, revolutionizing applications across the military, civilian, and commercial sectors [1]. These flying robots have promoted the development of several applications owing to their ease of deployment, low maintenance costs, high mobility, and ability to hover [2]. Such systems have been utilized as platforms for delivering multiple emerging technologies, such as Internet connectivity [3], mobile communications delivery [1,4], surveillance for border or essential side monitoring [1], emergency broadband services for disaster relief [5,6], navigation augmentation [7], atmospheric research [8], border control [9], and delivery of goods [10,11]. The advent of UAS has brought significant benefits; however, their widespread use has introduced serious challenges that hinder deployment. Specifically, when operating in an open environment under conditions of uncertainty, aerial systems are exposed to numerous natural, man-made, and structural threats, impeding the accomplishment of their objectives and degrading their performance. According to [12,13], UAS can be vulnerable to hardware attacks (adversarial direct access to the drone’s components), wireless attacks (violation of the communication link to capture data or gain full control of the vehicle), and sensor spoofing (jamming or GPS spoofing) (Global Positioning System). Furthermore, the deployment of aerial systems might indicate a significant number of other safety hazards and risks. System loss or failure, loss of control, loss of transmission, collision with terrestrial or aerial objects, failure or loss of navigation system, rotor failure or malfunction, take-off and landing incidents, damage caused by harsh weather and environmental conditions, and power failure are some examples of hazards stated in [14,15,16]. With this in mind, aerial systems should be considered as dynamic cyber–physical systems of systems containing multiple components: sensors, communications, as well as computation and control modules that communicate using wireless communication channels [1,17,18,19]. The multi-variety and complex factors implemented in their utilization make aerial systems more prone to safety and security risks that might jeopardize their performance and resilience. Thus, assessing performance, reliability, and resilience should be considered as a core requirement. Without a clear understanding of the potential risks, the use of aerial systems, especially for commercial and civilian applications, will not be possible at an acceptable level.
1.1. Problem Statement
Risk management is one of the main steps in nearly all projects and organizational processes. In the UAS field, it is necessary to employ a comprehensive risk analysis methodology, based on the objective of their utilization [20]. Such analysis should be an ongoing process of assessing risks that exist to regulate safe application and ensure the system’s effective functioning under uncertain and hazardous conditions. Over the years, various methodologies and frameworks have been proposed to assess and to show how risk assessment concepts have been conceptualized. Among the generic and well-regarded risk assessment frameworks are NIST SP800-30 (National Institute of Standards and Technology—Special Publication 800-30) [21], ISO/IEC 27005 (International Organization for Standardization/International Electrotechnical Commission) [22], EBIOS (Expression of Needs and Identification of Security Objectives) [23,24], ENISA (European Union Agency for Network and Information Security) [23], OCTAVE (Operationally Critical Threat, Asset, and Vulnerability Evaluation) [25], CRAMM (CCTA Risk Analysis and Management Method) [26], FAIR (Factor Analysis of Information Risk) [27,28] and SORA (Specific Operations Risk Assessment) [29,30] (the reader may refer to the related guidebooks regarding their methodology, principals, and main objectives of the frameworks). Table 1 provides a summary of the established frameworks and compares them with each other as well as with the proposed approach.
Table 1.
Comparison of risk assessment frameworks.
From the information outlined in Table 1, it is shown that there exists a variety of frameworks and standards that are aimed at helping organizations and enterprises in assessing and managing risks. The literature review revealed that SORA is the only methodology targeting drone flights, though it is a qualitative approach covering only safety-related aspects of drone operations within the context of fatal accidents. The other frameworks refer to a number of different applications, such as complex critical infrastructures, interdependent systems, organizations, or organizational services. In a similar way, some frameworks are considered enterprise-wide approaches, such as OCTAVE and FAIR, while some others are considered institutional standards, such as ISO and NIST. Moreover, it is pointed out that some of the frameworks could be implemented independently (ISO, NIST, CRAMM, and OCTAVE) while others could serve as guidelines outlining other published standards (ENISA) or as supplementary tools compliant or integrated with other frameworks (EBIOS and FAIR). The “one-size-fits-all” approach of existing frameworks may fail to accommodate the processes and requirements of aerial systems. In addition, while the established frameworks have their benefits, they need to be better suited to the unique requirements, peculiarities, and complexities of advanced aerial systems to serve the objective of the study, that is, modeling the dependencies among drone-related risk parameters to quantify and prioritize risk scenarios. With this in mind, it is concluded that standards such as ENISA, EBIOS, and FAIR, which serve as guidelines or as supplementary tools compliant or integrated with other frameworks, should not be considered and examined as distinct frameworks. It should be more appropriate to examine them as complementary approaches to the standard they are compliant with, i.e., ISO/IEC 27005 or NIST 800-30. Regarding CRAMM, even though it identifies risks through an asset–threat–vulnerability analysis, it is not suitable for this study because it is a software-based framework that (1) does not support an exhaustive assessment of every threat to every asset, and (2), on the vulnerability front, does not address detailed technical, system-specific vulnerabilities [31]. As for the OCTAVE standard, which also examines critical assets, potential threat scenarios, and vulnerabilities, it is not selected because it focuses on enterprise-wide case studies and mainly targets critical internal business services.
Finally, as for SORA, which is used to assess UAS-related operations, it cannot be considered appropriate to be employed for this specific study. The reason is that its main purpose is to address safety risks related to accidents in the air (collision with other UAVs or manned aircraft) or accidents on the ground. In addition, through SORA’s process, only operational parameters are considered, i.e., airspace information, nearby airports, flight geography, population density, drone’s wingspan, etc. [32]. Furthermore, the outcome of the process is a qualitative identification of specific operational safety objectives in terms of the specific operation. To practically showcase the above-mentioned limitations and justify that the SORA framework is not suitable for this paper’s objective, a conceptual scenario is presented. Table 2 summarizes the basic steps of the SORA framework, which are used to evaluate the risks of a drone-assisted system utilized for package delivery services. The first column illustrates the steps followed to apply the framework, as these are provided by the related guidebooks [29,32]. The second column of the table provides the resulting outcomes and the specific scenario requirements. Outcomes are verified by following the instructions provided by the guidebooks.
Table 2.
SORA framework—conceptual implementation.
Summarizing the outcomes of the SORA framework, it is deduced that indeed the specific methodology is a risk assessment approach directed towards drone operations. However, it is designed to establish a qualitative level of confidence in terms of safety. Despite that, operational safety objectives are identified and assessed during the final step of the approach; these are limited to risk parameters such as operators’ expertise and training, existing regulations, human errors, and environmental conditions. Other risk parameters, such as system components and sub-systems, structural limitations, adversarial actions, and the dependencies among them, are not considered. Consequently, the complexity and increasing interdependencies specific to complex drone-based systems make the SORA approach not suitable to serve this study’s objective.
Apart from that, many researchers have proposed methodologies, particularly for quantitative risk assessments of systems or critical infrastructures and processes. Reviewing several references that address the issue, different approaches have been proposed: the probability theory [33], stochastic theory (Markov processes, semi-Markov processes, branching processes), Petri nets theory, Bayesian Networks [34], the theory of fuzzy sets [33] (pp. 19–27), [35,36], Analytic Hierarchy Process (AHP), Fuzzy Analytic Hierarchy Process (FAHP), and Fuzzy Comprehensive Evaluation (FCE) [37].
Many studies have explored the risk assessment of aerial systems. For instance, the authors in [1] discussed the Federal Aviation Administration (FAA) pre-flight assessment process in which a Safety Management System (SMS) is implemented for the identification of risks and the adoption of a risk mitigation strategy to ensure the safe flight of a UAS [38]. Additionally, researchers in [39] introduced a safety assessment process framework for UAVs using Petri nets. Moreover, the authors of [15] aimed to develop a qualitative scheme for risk assessment of UAVs based on specific services and communication infrastructure. Their aim was to provide a preliminary assessment framework to describe and formalize a UAV’s risk assessment. Similarly, ref. [40] presented a four-phase qualitative risk assessment model for an aerial system. The proposed model was implemented to assess the safety of a quadcopter drone [41]. Additionally, researchers in [42] deal with the complex human–machine environment, aiming to identify, classify, and mitigate the errors of human factors involved in aerial system accidents. Also, the authors of [43] proposed a computational framework for decision-making under uncertainty to facilitate the autonomous and safe operation of small drone-like unmanned aerial systems. The framework is based on the identification of risk factors, such as dynamic obstacles and battery drains, the estimation of the likelihood of occurrence, and the classification of feasible trajectories according to the level of safety. Furthermore, ref. [16] presents a preliminary safety risk assessment through the application of a qualitative safety risk management process followed by a Bayesian Network-based probabilistic risk estimation methodology. In addition, ref. [44] deals with a qualitative assessment of risks, vulnerabilities, and safety countermeasures of aerial systems deployed to support the transportation industry. Additionally, ref. [1] proposed a framework for the safety assurance of drones over the Internet. More precisely, it provided a functional safety methodology for drone crashes based on a qualitative safety analysis followed by a quantitative approach using Bayesian Networks (BN). Reference [45] introduced a framework named Unmanned Aircraft System Traffic Management (UTM) Risk Assessment Framework (URAF) developed to provide real-time safety evaluation and tracking capability by utilizing Bayesian Belief Networks (BBNs). In addition, the authors in [46] provided a cybersecurity threat analysis and modeling of an aerial system. By following a goal-oriented approach for security analysis, they constructed a threat model based on threat-related concepts to describe potential attacks on the system and possible paths pertaining to these threats. Finally, using network simulation analysis, they attempted to estimate the likelihood of each attack and how different attacks would affect the system. Furthermore, references [47,48] presented a quantitative and qualitative risk analysis of UAV flights for construction job sites. Initially, a qualitative risk assessment was presented by combining a theoretical approach (reviewing aviation regulations and safety specifications of UAV flights on a construction job site) and a Monte Carlo simulation to evaluate fatality risks. Apart from that, references [49,50] deal with the application of AHP as a component of a mixed-hazard analysis methodology related to aerial-based systems. The authors of [49] proposed a methodology that integrates hazard identification and expert judgment. On the other hand, ref. [50] proposed a mixed-methods approach that relied on a comprehensive literature review and multicriteria decision-making to evaluate the safety of drone-assisted projects. Also, the authors in [13] presented a security assessment methodology for UAV services, based on the generic risk assessment standard of NIST 800-30, complemented with a penetration testing technique. Finally, a very recent study presented in [51] demonstrates a hierarchical model to quantitatively assess drone-related risks based on a probabilistic Bayesian Network. Their model establishes causal pathways between a number of drone-related vulnerabilities and attempts to quantify risks based on calculated probabilities of performance indicators, namely safety, mission success, and third-party risk.
Summarizing the approaches mentioned above regarding the presented quantitative risk-aid theories shows that, even though there is literature describing risk assessment-related models, there is limited work done towards developing a modeled framework taking into consideration the factors consisting of the concept of ‘Risk’: assets, vulnerabilities, threat sources, and impact. In addition, corresponding authors mostly deal with safety and security hazardous situations and related probabilities of occurrence without mentioning them. Moreover, limited references deal with the connections and dependencies between the system’s assets, the matching vulnerabilities, the potential threat sources, and the possible impact. This paper builds on the previous work presented in this section and proposes a practical model to evaluate and improve the effective deployment of drone-assisted systems, targeting a variety of UAS and quantitatively assessing the system’s performance. Specifically, the study follows a combination of approaches: (i) a qualitative analysis of risk factors, followed by a (ii) quantitative assessment. By applying qualitative analysis, it produces the basis to gain all the necessary information (hazards and risk elements identification, dependencies among them, etc.) to conceptualize the quantitative component and determine the input data required to initialize the risk assessment. Subsequently, the quantitative approach is achieved by the implementation of a methodology that is identified as suitable and appropriate for application to a specific UAV-type scenario and capable of providing numerical values for each identified risk element and potential failure scenarios. The proposed methodology facilitates risk quantification using an identifiable set of factors based on a predefined set of requirements within the scope of the executed scenario.
1.2. Contribution
Motivated by the gap identified in the literature stating that none of the commonly used risk assessment techniques strictly target aerial systems within the context of risk elements of assets, vulnerabilities, threats, likelihood, and impact, this paper expects to contribute to the body of knowledge and be significant in a number of ways. The main contribution of this study is to provide a straightforward and effective risk assessment methodology. Particularly, the aim of the proposed approach is to demonstrate how qualitative risk analysis and a multi-criteria hierarchy approach, combined with the fundamentals of pairwise comparisons, could be applied and integrated to systematically identify and evaluate failure scenarios and related risk factors in drone-assisted applications. In summary, this study contributes to the field of UAV performance and resilience as follows:
- Provides fundamental knowledge on UAV-based technologies, weaknesses, challenges, and threat sources. This is an essential prerequisite for (1) understanding interactions between systems’ components, environmental factors, structural limitations, and operational uncertainties, (2) identifying and quantifying risk hazards of aerial platforms.
- Illustrates a feasible risk assessment approach directed towards and tailored for drone-assisted services by integrating established risk assessment standards and a multi-criteria hierarchy approach following the principles of pairwise comparisons. The goal is to decompose the identified hazards into risk elements, establish dependencies among them, assign numerical values, and finally to quantify risk elements and risk events that made the greatest contribution to the system’s operation.
- Presents two generic scenarios considering a drone-assisted delivery system and a system utilized for disaster site-monitoring as testbeds to verify the applicability and suitability of the proposed methodology. The goal is to provide a useful tool for practitioners and operators, during the planning phase, to identify possible risks, quantify their impact according to the mission’s parameters (e.g., services, type of aerial platform, area of operation, weather, regulations, and operator’s skills), and proactively take measures to mitigate them.
The remainder of this paper is organized as follows: Section 2 provides a summary of the concept of risk assessment and the terminology surrounding risk. In addition, it provides a brief overview of the frameworks selected for conducting the risk assessment. The proposed risk assessment methodology is described in detail in Section 3. Section 4 presents a generic use case scenario to demonstrate the applicability and feasibility of the proposed method. Section 5 evaluates the most important findings of the research. Section 6 discusses the broader application of the proposal and validates the model by examining another conceptual scenario. Additionally, Section 6 compares the outcomes of both scenarios and provides a brief analysis of the sensitivity of risk ranking to the AHP scoring. Finally, Section 7 summarizes the main points of the study and provides concluding remarks and prospects for future work.
2. Literature Review and Background
2.1. Concept of Risk Assessment: Definitions of Risk, Performance, and Resilience
Risk is considered a function of the adverse impacts that would arise if a circumstance or event occurs, and the likelihood of occurrence [21]. In a similar way, the authors in [52] consider risk as the combination of what can happen, the probability of happening, and the consequence (impact) if it does happen. Additionally, authors in [53] integrate the terms of ‘Asset’ and ‘Vulnerability’ into the explanation of risk, in order to express the entity upon which impact could be assessed to deal with. Also, they highlight that the term ‘threat’ by itself is insignificant in the absence of underlying vulnerabilities. Consequently, risk (R) should be expressed as a function of likelihood (L) of a threat event (T), exploiting the vulnerability (V) and its severity, measured as its outcome impact (I), on an asset (A).
Equation (1) below expresses the definition of risk as stated in [53].
where R is the risk, V denotes the exploited vulnerability, Ti signifies the specific threat event, Li indicates the likelihood of the specific threat event to be initiated and have an adverse impact, A represents the affected asset, and Ii refers to the outcome impact on that asset due to the specific threat. The subscript (i) is employed to distinguish between the different potential threat events (i = 1, 2, 3, 4,…, N).
Below is a summary of the elements consisting of the concept of risk:
- Risk, as defined above and stated in [21,53].
- Asset is any tangible or intangible valuable unit of a system, including hardware, software, interfaces, data and information, system mission, processes, personnel support, image or reputation, system and data criticality and sensitivity [54]. Also, the environment/environmental conditions that the system resides in and the dependencies among the other assets should also be considered as assets.
- Vulnerability is a weakness of an asset due to the lack of or ineffectiveness of controls that could be exploited by a threat source [22]. A vulnerability could also emerge naturally as systems’ functions evolve, the environment of operation changes, new technologies emerge, or new threats arise [21].
- Threat is any circumstance or event with the potential to harm assets such as information, processes, and systems via unauthorized access, destruction, disclosure, or modification of information, equipment, and service.
- Likelihood of occurrence is the probability that a given threat can exploit a given vulnerability [21,22].
- Impact from a threat event defines the magnitude of harm that can be expected to result from the consequences [21]. Such impact is assessed in terms of the system’s performance and resilience.
Apart from the concept of risk, performance and resilience are defined as follows:
- Performance defines the ability of a system to function properly under normal or slightly disturbed operating conditions due to man-made, structural, or natural adverse events.
- Resilience is considered the measurement of the minimum level of performance of a system at which the system is able to counteract the effects of a threat event and keep maintaining its key functionalities [55]. Resilience is related to the mitigation strategies that are in place, which are enhancing the system’s ability to absorb the consequences of a threat.
Moreover, authors in [55] state that a vulnerability is a weakness or limitation of a system that could be exploited by a threat event, thus affecting its performance. Vulnerability is also related to threat and resilience in an inverse way: high vulnerability generally leads to greater impacts once a threat event occurs. Also, the higher the vulnerability, the lower the resilience.
The relationship between all these terms is summarized in Figure 1 below. As shown, a system functions properly until a risk event happens (a threat event exploits a system’s vulnerability). The higher the vulnerability, the greater the impact on the system’s performance should be. However, if effective controls are in place, then performance should not be decreased below the minimum acceptable level [56].
Figure 1.
Risk–performance–resilience relationship.
Consequently, the proposed approach aims at evaluating and prioritizing risk elements and dynamically changing failure scenarios. This should enable the identification of the most critical risk contributors that have the greatest impact on the system’s performance. In addition, it should empower the improvement of awareness of risks and take proactive measures and mitigation strategies for increasing the resilience of drone-based applications and services.
2.2. Selecting the Most Appropriate Risk Assessment Approach
The aim of this paper is to suggest a hybrid methodology for the risk analysis of drone-based services. To conduct the qualitative analysis, we apply an asset-based approach that could serve the main objective of the study of constructing a risk assessment methodology based on the risk elements of assets, threats, vulnerabilities, and impact [22]. Such an approach empowers the identification and classification of the risk elements with an emphasis on critical assets and highlights the dependencies and interactions among them. Consequently, if all valid combinations of assets, threats, and vulnerabilities can be enumerated within the scope of the assessment, then all the risk events can be identified and evaluated. From the comparison illustrated in Table 1, it is concluded that NIST 800-30 and ISO/IEC 27005frameworks could serve this study’s objective (see last row of the table) if applied independently or in combination. Specifically, both frameworks describe a similar approach of examining risk and conducting risk assessment: emphasizing the identification of critical assets first, and then building outward in terms of how their weaknesses and limitations are exposed and possibly exploited by threat sources. Moreover, both frameworks have been established for serving critical information systems. Furthermore, while most of the other frameworks are supplementary tools compliant or integrated with ISO/IEC 27005 and NIST 800-30, the latter ones provide the foundation for the development of an effective risk management approach, both containing the definitions and the necessary practical guidance for assessing and mitigating risks [23]. Section 2.3 provides the reader with detailed information regarding the integration of both frameworks and how their combination is considered suitable to serve the objective of the research.
To fulfill the quantitative part of the proposed methodology, the Analytic Hierarchy Process (AHP) is implemented [57,58,59]. AHP combines qualitative analysis with quantitative investigation [60]. The main idea is the abstraction of a system into several levels and the decomposition of the objective into a set of elements [61,62,63]. In a typical hierarchy, the top level reflects the focus of the problem. The elements at each level are of the same order of magnitude and must be capable of being related to some or all the elements in the next higher level [64,65]. The pairwise comparisons between the elements in each layer are conducted starting at the top of the hierarchy and working down. The preferences between two elements are initially expressed verbally, then translated into an absolute numerical scale from one to nine [59]. Finally, the relative weight of each element and the composite weights are calculated by aggregating the weights through the hierarchy. Within the context of this paper, AHP should serve as an appropriate method for decomposing risk into elements, arranging them into a hierarchy, and evaluating them [64,66,67]. Each layer should consist of elements of the same order (assets, vulnerabilities, threats, and impact). Also, the hierarchical structure should serve as the basis for demonstrating the dependencies and connections among the different risk elements. Therefore, from a risk assessment perspective, AHP should facilitate the grouping of the risk elements and their establishment into layers. Furthermore, the ability of AHP to serve as an effective method combining qualitative investigation with quantitative analysis could assist their comparison and evaluation based on their criticality, importance, and the level of risk they pose to the successful deployment of an aerial-assisted system [50,68]. Ultimately, the evaluation of the composite weights should assist in establishing and quantifying the failure scenarios threatening the performance of the system.
2.3. NIST–ISO Standards for Risk Assessment
As illustrated in Table 1 and justified in Section 2.1, NIST and ISO frameworks fit best in meeting the objective of the paper in identifying and establishing risk parameters of critical assets, vulnerabilities, threats, and the dependencies among them in order to quantify and prioritize risks. Both frameworks could sharpen the proposed risk assessment process and create an enhanced methodology, allowing the building of a comprehensive risk assessment approach in a couple of ways. At first, neither standard is used as supplementary to other standards; they rather provide the foundation for the development of a risk assessment methodology, which can be applied independently or in combination [13,23,69,70,71]. In addition, NIST 800-30 is developed targeting general federal information systems and information systems implemented in law enforcement-related scenarios. On the other hand, ISO/IEC 27005is designed to assist in the proper implementation of information security based on a risk management approach. Moreover, the NIST approach is a more prescriptive and tactical method, while the ISO framework provides a high-level, flexible international guideline not only for technology-related risk factors, but for people and processes, as well. Furthermore, combining and implementing the explanatory recommendations, lists, and tables outlined by both documentations should be useful for the collection of the qualitative information needed during the qualitative component of the proposed risk assessment process. Table 3 delineates and compares the basic steps of ISO/IEC 27005 and NIST SP 800-30. It also illustrates the steps of the combined version of the proposed risk analysis approach.
Table 3.
Comparison of NIST 800-30 and ISO/IEC 27005.
As shown from the information summarized in Table 3, the implementation of the NIST 800-30 and ISO/IEC 27005frameworks leads to the identification and registration of the elements required for the risk assessment process. In this paper, a combination of the two frameworks should support the intention of the qualitative stage for the implementation of an asset-based approach and the enumeration of the combinations among the system’s assets, threats, and vulnerabilities within the scope of the risk assessment. The following steps should be implemented: risk identification, asset identification, threat source and threat event identification, vulnerability identification, likelihood determination, impact determination, and risk evaluation. Each step is adjusted and modified to serve the study as below: (1) risk scenarios identification, which is mentioned but not analyzed in any of the 2 frameworks, should be conducted through a comprehensive analysis of related articles; (2) likelihood and impact determination should not be applied in the way supported by these frameworks (in a qualitative or semi-quantitative way) but through the implementation of the pairwise comparisons; and (3) risk evaluation should be conducted through the quantitative component of the proposed approach.
How these steps should serve the objectives of the paper is presented in Section 3.1.
2.4. Analytic Hierarchy Process for Risk Assessment
According to the reviewed literature, AHP is applicable and suitable for conducting quantitative risk assessment. Authors in [64] proposed a multi-layer, AHP-based assessment to evaluate and prioritize risk factors influencing project management through pairwise comparisons. Similarly, authors in [67] aimed to evaluate uncertain factors such as weather changes, aircraft failures, and employee status, all of which contribute to the occurrence of aviation accidents through the implementation of an AHP risk assessment model. Likewise, authors in [72], cited in [67], implemented a mixed-method approach to identify and evaluate risks of productivity management in construction projects. Apart from that, authors in [73] established a two-layer hierarchy to evaluate confidentiality, integrity, and availability (CIA triad) of information systems. Also, a probability distribution approach was applied to identify vulnerabilities and threats and to calculate the associated risk levels. A different approach is followed by authors in [74,75]: they employ a three-layer AHP scheme followed by the application of Fuzzy Comprehensive Evaluation (FCE) aimed at assessing the risks of an information system. In the same way, Fu and Zhou in [76] and Lee in [37] combined AHP with FCE for information security risk evaluation through the formation of a three-layer hierarchy consisting of assets, threats, vulnerabilities, and safety measures. Beyond the literature mentioned above, some other references in which authors were proposing AHP as a risk assessment approach are listed below: Mustafa and Al-Bahar [65] investigated the subject of risk assessment in construction projects. By presenting an AHP scheme for classifying various sources of risk, they introduced a layer consisting of different levels of risk. Moreover, Tsai and Huang [77] presented a risk assessment method for wireless networks. Through the design of a four-layer analytical hierarchy, they attempt to structure dependencies from the perspectives of the risk, security requirements, attacks, and controls. Furthermore, Zhao et al. [78] developed a synthetic risk assessment model based on AHP theory to evaluate hazards. Practically, their model determines the impact weights of probability and severity by using pairwise comparison matrices and calculates risk by evaluating them. In addition, Siddayao, Valdez, and Fernandez [63] proposed a model for flood risk analysis based on Fuzzy AHP to calculate the relative weights of different flood risk factors. In [58], Aminbakhsh, Gunduz, and Sonmez proposed a framework to assist in safety risk assessment and accident/injury prevention by adopting AHP conjointly with the cost of safety (COS) model. Fundamentally, a safety risk management framework was presented for effective administration of safety risks by using a multi-criteria comparison technique. The proposed approach used the AHP method to decompose the decision problem into a hierarchy of more easily comprehended sub-problems to compare the risk factors and to assign weights, allowing their reliable prioritization. Besides that, references [49,50] dealt with the application of AHP as a component of a mixed-hazard analysis methodology related to aerial-based systems. Authors in [49] proposed a systematic methodology, which integrated hazard identification, expert judgment, and risk assessment for preliminary hazard analysis in a drone-assisted inspection system. Authors in [50] proposed a mixed-methods approach that relied on a comprehensive literature review and multicriteria decision-making to compare and evaluate the identified risk causal factors.
3. Proposed Risk Assessment Methodology
The purpose of the paper is to conduct a risk assessment methodology for a drone-based system, mainly focusing on civilian drone-assisted operations. At first, the potential risk factors need to be identified, and then risks are ranked based on their magnitude. A core requirement is the identification and registration of the risk elements, which the drone-based system might encounter during an operation. To formulate the combined risk factor sets, each of the potential factors that affect the system’s utilization needs to be determined. That being so, a drone-assisted system is considered to be an integrated system with operators, equipment, and environment. According to [50], resilience and performance of a system are affected by a set of parameters related to the behavior of the different components of the system. Consequently, considering the integration of a drone-assisted system, the performance of the system is affected by various factors that are part of this system. According to this, the risk hazards associated with drone application are classified into five categories, based on their sources: (1) drone-related, (2) environment-related, (3) operators-related, (4) mission-related, and (5) operating area-related. Our methodology consists of two main components: the qualitative component, implemented by the application of the basic guidelines of NIST and ISO standards, and the quantitative component, employed by the execution of the basic principles of the AHP. The first approach involves assessing various conditions that can affect the system’s performance. We conduct a comprehensive analysis of risk hazards in combination with the analysis based on NIST [21] and ISO [22] standards. Our aim is to identify the hazardous conditions, along with their possible causes and their consequences, that affect the effective operation of the system. In addition, employed assets are listed, associated vulnerabilities are documented, potential threats are recognized, and possible impact effects are associated with those threats, in terms of resilience and performance requirements. The second approach is a quantitative estimation method based on AHP, which is used to model the risk factors related to drone-assisted system operation and to evaluate the risk scenarios threatening the system’s performance and resilience. A multi-layer hierarchy is designed based on the outputs of the qualitative analysis. The implemented AHP is used to estimate the level of importance of each risk element. It also enables the formation of relations between them. This model defines the relationship between the elements of one layer with elements of a nearby layer, and most importantly, enables the employment of the importance of each layer’s elements with all other related elements. In other words, the importance of each risk factor is calculated using the AHP approach and is correlated and affected by the importance of all the associated hierarchy elements. Given these considerations, the proposed approach empowers the final ranking of the verified failure scenarios and their impact, considering defined connections. Also, the quantitative approach enables us to identify high-risk pathways, detect and classify the most influential factors. In what follows, we will present the hybrid methodology by first describing the qualitative component of the proposed methodology, followed by the AHP-based component. Workflow is illustrated in Figure 2.
Figure 2.
Proposed methodology workflow.
3.1. Identification of Drone-Related Risks
Prior to the application of the NIST–ISO assessment, the potential hazards threatening the system’s performance, as well as the causal factors, are identified through a comprehensive review of relevant scientific publications. Such references were identified and studied by mostly using scholarly databases named Google Scholar, IEEE Explore, MDPI, and ScienceDirect. The selection of the available references was made among the most recently published articles and conference reports that discuss the risks associated with the use of drone-based systems. As revealed from the literature, the diverse application of aerial systems poses different types of risk:
- Aerial Component-related risks: These are the risks associated with the aircraft and sensors mounted on it [50]. Inappropriate pre-flight inspection is a reason leading to a system’s failure [79]. Furthermore, deterioration in the performance of the aircraft due to sensor malfunctions should be considered as an aircraft-related risk [17]. Other risk sources related to the aerial component include errors in the navigation system [1], flying close to buildings or at a low altitude [16,49,80], lack of necessary and high-performing technical features [50], and rotor failures [80,81].
- Power efficiency-related risks: An ineffective power source is an issue under investigation. Current types of drones carry batteries for short-term flights [82]. So, energy consumption is an important challenge drone-assisted systems face [83]. Also, since aerial systems are battery-powered, limited energy or unreliable power management poses risks such as power loss, limited flight range, limited processing capabilities, and restrictions on flight time [2,84].
- Environment-related risks: Environmental conditions pose a challenge to aerial systems and have become a tough and cardinal challenge (wind, temperature, icing, precipitation, hurricanes, etc.) [1,2,80,81]. The environment can negatively impact the system’s performance by creating situations that can lead to disruptions and mission failures [2,85]. Harsh weather conditions significantly increase the possibility of failure [12,14,15]. Rain, snow, and extreme temperatures can threaten components such as sensors, frames, and propellers, causing malfunctions, failure, or navigation problems [49]. Also, high illumination could disrupt the vision of both the operator and the system’s sensors, leading to accidents [50].
- Human operator-related risks: Proper utilization and safe operation during a system’s deployment are highly dependent on the skills of the operator [80,81]. Despite that, the operator’s role can be limited to commanding and monitoring the system’s activities; this does not make the system immune to human-triggered disruptions [85]. Lack of experience could make operators nervous, potentially leading to unsuccessful navigation. In addition, insufficient training might cause improper utilization and navigation of the system [79]. Moreover, lack of awareness, fatigue, and stress are factors that lead to accidents [1,80].
- Area of operation-related risks: Airspace density is an important factor that might lead to hazardous events. Flying objects could strike the aircraft and cause damage, or even worse, leading to crashes [50]. Additionally, deploying an aerial system over unknown zones or diverse environments poses risks such as physical attacks, unauthorized control by malicious entities, or cyber-attacks from hackers to gather data or steal the equipment [2]. Furthermore, operating a drone-assisted system over non-segregated airspace increases the risk of mid-air collisions, resulting in fatal accidents [86].
- Mission-related risks: These are harmful incidents that might arise from a specific type of operation. For instance, operating to accomplish sensitive missions such as border patrolling or intelligence, surveillance, and reconnaissance requires the implementation of additional countermeasures to safeguard sensitive information; violation of such measures could lead to mission failure. Additionally, faulty operation leading to aerial systems falling from higher altitudes or flying very close to people could have a greater adverse effect on people or structures on the ground. Similarly, the absence of predefined operating procedures could cause misunderstanding and concern for the operators [50].
- Communication-related risks: Aerial systems are extremely dependent on wireless transmissions for navigation and information exchange [87]. Wireless communication is a primary target for cyberattacks [13]. These attacks aim at intercepting information or gaining access to the system [88,89]. Lack of efficient security mechanisms, inadequate protection measures, or authentication techniques carries risks such as inappropriate control, breaking the encryption of the communication to capture data [1,88,90];
- Regulation-related risks: In protecting safety, security, and privacy, specific regulations should be put in place. Safeguarding citizens’ lives, the free circulation of drones within specific boundaries should be the primary target of regulations [84]. Non-compliance with existing regulations, such as unauthorized trespassing or flying below the minimum altitude, or even carrying a payload heavier than required, is a key risk factor that increases the probability of lethal consequences [49,50,79,80]. Moreover, unregulated drone traffic densities entail a high risk of collision with other flying objects [91].
The qualitative analysis concludes with the integration of the NIST–ISO standards. Through this step, the risk elements are established. Considering the definition of risk defined by Equation (1), the steps stated in Section 2.3 are as follows:
- Asset identification: Asset analysis is performed by counting the entire system. Relationships between assets and importance in mission accomplishment are also defined. Comprehensive illustration and justification should be presented in a forthcoming section.
- Vulnerability Identification: Assets are examined separately, and a list of vulnerabilities that could be exploited is defined. The product of this phase should be applied to the evaluation of the importance and criticality of each vulnerability. Lists provided by [22] could be used as supportive material and a guideline.
- Threat’s identification: Identified risk hazards are decomposed, and relevant threats are documented. Threats are classified into the categories listed in Table 4. This allows experts to correlate threats and vulnerabilities and to establish the required relationships and dependencies. The lists of typical threats provided by [21,22] help with the identification and documentation of the drone-related threats.
- Impact Determination: The adverse impact of threat events on a specific asset is determined. According to [21,92], the impact on an information system is characterized by a set of security requirements. However, considering the issues surrounding aerial platforms’ performance, an extensive set of requirements is defined: confidentiality, integrity, availability, reliability, safety, survivability, and maintainability.
Table 4.
Threat classification.
The analysis is presented in a forthcoming section. The workflow risk analysis is conducted in a qualitative manner. A quantitative analysis in the form of a hierarchical multi-layer technique is implemented to enhance the qualitative analysis.
3.2. Quantitative Component
In this part, we propose the quantitative element of the methodology, which is based on a multi-layer hierarchy approach. In using the AHP to model the risk events, a hierarchical structure to represent their quantification problem is needed. To model the interactions between systems’ components, environmental factors, structural limitations, and operational uncertainties, a multi-level structure of the risk elements is established. The qualitative outputs of the previous process are used as inputs at this phase. Also, essential pairwise comparisons are performed. AHP is implemented as follows. The reader may refer to references [59,61,63] for background information.
3.2.1. Qualitative Outputs Are Organized in a Hierarchical Manner
The elements of the hierarchy are specified. The selected qualitative outputs are assets, vulnerabilities, threats, and requirements [52,53]. These elements are classified and organized into a 5-layer hierarchy. Figure 3 illustrates a generalized form of hierarchy.
Figure 3.
Multi-layer hierarchy (generalized form).
3.2.2. Schematic Representation of the Decision Hierarchy
A multi-layer hierarchy is formed based on the risk elements identified and classified through the qualitative processes. As stated above, the elements of assets, vulnerabilities, threats, and performance requirements are organized and presented as different layers of the hierarchy. Among them, multiple connections and relationships are detected and demonstrated. As illustrated in Figure 3, the top layer of the model represents the overall goal of the hierarchy: impact severity, which threatens the system’s performance and resilience. The 2nd layer represents the assets that contribute to the system’s function, thus used to evaluate assets. The 3rd layer represents the vulnerabilities identified by the asset; each vulnerability inherits context from its parent asset. The 4th layer is constructed to introduce threat sources intimidating the entire system; in the diagram, they are linked across multiple vulnerabilities, forming a many-to-many relationship. Finally, the 5th layer is constructed to introduce the requirements denoting the system’s performance and resilience. Their placement at the bottom of the hierarchy reflects a goal-decomposition approach, i.e., these requirements must be met to maintain system functionality despite threats. This cross-layering association of elements is realistic and reflects the true nature of hazards, i.e., hierarchy effectively captures how vulnerabilities, threat sources, and performance requirements relate to each asset under the common goal of impact severity. In addition, it follows the logic of the references cited above, which use AHP as a component of mixed-hazard analysis methodology for the quantitative analysis of risks and the evaluation of the related risk factors.
3.2.3. Establishment of Relationships
The hierarchical structuring of the proposed model is aligned with the AHP principles [59]. The system is abstracted into several layers, and the objective of the problem is decomposed into different sets of elements. The first layer of the hierarchy reflects the objective of the problem. The other layers represent the elements consisting of the problem. Each layer consists of elements that share the same properties. In addition, the elements of each layer are capable of being related to some or all the elements in the next level [64,65].
The hierarchy captures how vulnerabilities, threat sources, and performance requirements relate to each asset. Therefore, the first layer of the proposed model represents the quantification of risks in terms of impact severity. Then the breakdown from the first layer to the other layers of the hierarchy follows the logic of the function of risk, defined in [52,53], which quantifies the adverse impact on an asset caused by the exploitation of a known vulnerability when a threat event occurs. Consequently, the 2nd layer of the hierarchy consists of the assets of the system on which the risk should have an adverse impact. The 3rd layer represents the vulnerabilities of the system. Vulnerabilities are limitations of the assets; therefore, they are directly connected to the 2nd layer. In addition, different assets should share the same vulnerability; thus, there might be many-to-many connections between the 2nd and the 3rd layer [21]. Additionally, threats are placed at the 4th layer, directly connected to vulnerabilities. This layer illustrates the elements that take advantage of the system’s weaknesses. Each threat could exploit one or more vulnerabilities; consequently, multiple connections between the 3rd and the 4th layer should be established [21]. Finally, the 5th layer denotes performance requirements that are impacted by the executed threats. Every requirement can be affected by more than one threat, so a many-to-many relationship grid should be established.
A detailed analysis of the application of the constructed relationships and dependencies is presented in Section 4.
3.2.4. Pairwise Comparison Matrices
The Analytic Hierarchy Process is used to compare the importance of two elements and to establish a judgment matrix. The dimensions of the matrix depend on the number of factors. In this paper, it is implied to establish 4 matrices: one for each layer. In each hierarchical level, the weights of the elements are calculated by performing the pairwise comparison process between the elements of each layer, according to their contribution to reaching the main objective of the hierarchy [73]. Equation (2) is a general form of the comparison matrix:
where A is the pairwise comparison matrix, n is the number of compared elements, and aij is the comparison scoring between the elements ai and aj. Subscripts (i) and (j) represent the rows and columns of the matrix, respectively. In addition, aji is the reciprocal element whose value is equal to 1/aij.
3.2.5. Scaling Pairwise Comparison Matrices
To derive priority matrices, comparisons need to be converted into integers. The values within the matrix are ratios between the elements. Also, values are determined based on the importance of each element in reaching the objective of the hierarchy. In creating the pairwise comparison matrix in this study, the fundamental AHP comparison scale from 1 to 9 is employed. This scale indicates how much one element is more important than another [57]. Table 5 presents the numerical scale values and their equivalent intensities (verbal statements). Finally, a square matrix where each element value ranges from 1/9 to 9 is derived. The diagonal elements of the matrix are always equal to 1, whereas the non-diagonal elements capture the perceived relative importance of the corresponding elements [63]. To establish the importance of a risk element in the same layer, the following approaches are used as guidelines:
Table 5.
Fundamental scale for pairwise comparison.
- The importance of every asset is evaluated based on its criticality, the way it contributes to mission accomplishment, and the level of its susceptibility to threats. The more susceptible an asset is to multiple threat sources, the greater the possibility of failure; thus, it is considered more critical.
- A vulnerability is considered to be of greater importance compared to another vulnerability based on the ease of its exploitation and on the level of its possible impact. Hence, its importance, over the other vulnerabilities, is weighted based on the number and criticality of the affected assets and also on the related threat sources; the more threat events expose a specific vulnerability, the higher the level of concern.
- Every threat event is characterized by a level of effectiveness and capability [21]. Capability is used to evaluate the threat’s criticality. Therefore, the more assets are affected by the initiation of a threat event, the higher the level of criticality of this specific threat source (higher criticality, more importance).
- According to [21], the likelihood of a threat event is not defined as a function in the statistical sense. Instead, assessors assign a score based on available evidence. Consequently, in this study, the likelihood of a threat event is embedded and evaluated through pairwise comparisons of the elements of Layers 3 and 4.
- Impact is categorized by performance and resilience objectives and assessed based on the level of adverse effect [21,92]. Following the dynamic flow of information through the different layers of the hierarchy, the level of impact is power-driven by the number of vulnerabilities exploited, the number of threat events intimidating the mission, and the quantity of requirements that are exposed.
3.2.6. Calculating Priority Vector and Consistency Ratio
The Consistency Ratio (CR) is used to measure the consistency in the pairwise comparison and also to evaluate the quality of expert judgments [37,63]. According to [37,61,63], for different matrix sizes, the acceptable CR values have been set as 0.05 for a 3-by-3 matrix, 0.08 for a 4-by-4 matrix, and 0.1 for larger matrices. However, supposing that all knowledge has to be consistent contradicts the principle of experience, which requires continued adjustment in understanding. In the AHP, it is unrealistic to expect the assessors to provide consistent pairwise comparisons. The reason is that inconsistency itself is substantial because, without it, novel knowledge, which might possibly lead judgments to change preference order, cannot be admitted. Thus, the objective of developing a wide-ranging, consistent framework depends on admitting some inconsistency but not exceeding the threshold of 0.10. However, as discussed in [93], there are several other consistency checks not associated with this threshold. It is also criticized that in the case of a large number of elements, the CR values defined by Saaty fall above 0.10 because of the application of the 9-point scale. According to Saaty [59], the CR can be estimated as follows:
where CI is the consistency indicator, and RI is a random index that is dependent on the sample size n, as shown in Table 6.
Table 6.
Random consistency index (RI).
Using the same approach, for the constructed matrices, CI is computed according to the following formula [59]:
where λmax is the maximum eigenvalue and n is the number of elements of each matrix. λmax is obtained as follows:
and,
In Equations (5)–(7) above, A is the comparison matrix resulting from (2), W is the stemmed vector of relative weights, Wij is the relative importance of the element aij, I is the identity matrix, and X is a matrix obtained from the sum of the values of each column of matrix A.
To obtain the eigenvector of the comparison judgment matrix W, we divide the elements of each column of matrix A by the sum of that column. Then, to obtain the vector of relative weights (eigen vector), we add the elements in each resulting row (to obtain a ‘row sum’) and divide this sum by the number of elements in the row.
For a greater understanding, the next section will describe a practical application of the formulas and present the above procedure with numerical examples.
3.2.7. Calculating Local Weights
The resulting vector W comprises the relative weights of the elements in each layer. The relative weight of an element indicates its local weight and represents the importance of this element compared with the other elements that meet at the same level. Nevertheless, this does not mean that an element that is ranked as of higher importance in its layer will necessarily have the highest priority in the risk assessment of the entire system. Considering the proposed many-to-many relationships between elements, the local weights at each layer should be propagated across the hierarchy. For example, assume the local weight of vulnerability in layer 3. According to the number of assets linked to this vulnerability, the outcome importance should be changed, either decreased or increased. Bearing in mind what is mentioned above regarding layering and dependencies among the elements of the hierarchy, it is necessary to implement the calculation of global weights. According to [59], multiplying the locally derived weights by the weights of the elements of the upper layer (parent layer) results in a global weight.
3.2.8. Calculating Global Weights
As Saaty mentioned in [59], when relative measurements are used in AHP and when the priorities of the elements of the different layers are set in advance, the final ranking at each layer depends on the number of elements of the nearby layers. To evaluate the final ranking of all elements of the hierarchy, a global weight is implemented. According to [49,59], the global weight is the total importance of each element. The global weight is calculated by a typical AHP based on the hierarchy relationship of an element with its parent element (upper layer’s relationship) and the cascading local weights [94]. The global weight is equal to the product of the local weight of this element and the local weight of its parent element [50,58,95]. Additionally, when an element is related to more than one element in its upper layer, the global weight results from the summation of the contributions of these multiple elements. As depicted in Figure 3, the first layer represents the objective of the hierarchy. The global weights of the assets are calculated by multiplying the local weights of Layer 2 (Asset Layer) by the weights of its upper layer. Considering that Layer 1 represents the objective of the hierarchy, its derived local scale is considered to be the unit. Therefore, according to the previous paragraph, it is equal to the assets’ local weights. Regarding the calculation of the global weights of the vulnerabilities, the following equations are applied. In Equation (8), a vulnerability is associated with one asset; thus, its global weight is calculated by multiplying its local weight by the local weight of the connected asset. In Equation (9), it is assumed that an identified vulnerability is related to two assets. In this case, the global weight of this specific vulnerability results from the summation of the products of the local weights of the vulnerability and the local weights of these two assets:
where is the global weight of vulnerability Vi, is the local weight of vulnerability Vi, and are the local weights of assets Ai and Aj.
Similarly, Equations (8) and (9) are adapted to calculate the global weights for threat sources and requirements. Equations (10) and (11) illustrate the general form of the equations for estimating the threat sources’ and requirements’ global weights, respectively:
In Equation (10), is the global weight of threat Ti, is the local weight of threat Ti, and are the global weights of vulnerabilities Vi and Vj.
Similarly, in Equation (11), is the global weight of requirement Ri, is the local weight of requirement Ri, and are the global weights of threats Ti and Tj.
Calculating global weights is important because, with relative measurement, the calculated importance of any element might change when new elements are added or deleted from any layer [59]. For example, assume that a new threat is identified. Based on the proposed methodology and the dependencies between the elements across the different layers, it is obvious that the ranking of the threat sources within the same layer would be altered, and also the final ranking of the risk requirements should be affected as well. In conclusion, the proposed methodology implements two different types of variables: local weights that reflect the relative importance among the elements within the same layer and global weights. This function allows the propagation of relative importance across layers and enables the comparison of all elements compared to the goal of the hierarchy.
3.3. Defining Risk Chains
At this stage, the identified risk hazards can be described as a chain of elements. According to [52,53], every recognized risk event is a function of an asset threatened by a threat, which in turn exploits a known vulnerability and has an adverse effect on the asset in terms of resilience and performance. Therefore, considering the general form of the proposed hierarchy (see Figure 3), every risk event is described by an asset–vulnerability–threat–requirement chain. Each chain starts with the objective of the framework, follows a route through every layer, and ends at a requirement by connecting one element per layer. Each chain denotes a risk chain and represents a specific risk scenario that threatens system performance. For example, assuming the possible risk hazard of ‘low temperature might decrease the battery life of drones’, as mentioned in [49]. Following the procedure of the qualitative analysis, it is concluded that the affected asset is the airborne component (drone/UAV). In addition, the possible threat source that might affect the asset is extreme weather conditions (low temperature) [21]. Additionally, the potential vulnerability that might be exploited is the ineffective power source. This is justified by the literature review. Temperature is considered to be the most influential indicator affecting the capacity of lithium-ion batteries. Specifically, cold weather can cause the battery to drain faster [96], while extreme heat can lead to overheating issues [97]. Finally, the impact of the outcome on the system’s performance should be either on the system’s maintainability or survivability. In addition, it could be mentioned that extreme weather conditions could not only exploit an ineffective power source, but also another vulnerability, that is, defective components. In these cases, multiple risk paths can be identified and classified. Therefore, different vulnerabilities and threat sources can be defined and assigned to each resulting chain. This fact substantially strengthens what is documented in [21], namely that the development of threat scenarios should exploit one or more vulnerabilities, and that a set of vulnerabilities can be exploited by one or more threats. A detailed analysis of the possible risk hazards, risk chains, and implemented risk elements is provided in Section 4 through the conceptual scenario.
3.4. Cumulative Risk Contribution—Risk Ranking
There is a need for a more defensible overview of the risk elements, how they drive total risk, and can elucidate how a system’s performance and resilience are affected. For this study, cumulative risk is employed. Specifically, cumulative risk evaluates the combined effects of multiple risk elements on the performance and the resources of a system [98]. As mentioned in [99], the term ‘cumulative risk’ refers to the combined risks from aggregate exposures to multiple risk parameters. By the definition given above for this thesis’s model, the following features are considered: identified risk parameters are acting together rather than individually, thus exposing the system to numerous risk events; the aggregation of the risk elements results in the evaluation of risks. The resulting outcome refers to the combined risk elements from exposure, via all relevant pathways through multiple layers. It is applied to evaluate the portion of influence that each risk element has on the top-level layer of the hierarchy (“Impact Severity”), after the propagation of relative weights. Additionally, the combination of the risk elements across a single pathway empowers the estimation of every risk chain (risk event). Similarly, the process enables the evaluation of the most critical risk contributors and the quantification and prioritization of the identified risk scenarios. The cumulative risk contribution is calculated as follows:
- Compute local weights following the steps of Section 3.2.6 and Section 3.2.7.
- Estimate global weights through the application of Equations (8)–(10).
- Selected the desired risk chain from the outcomes of the previous procedure conducted for the risk chain definition.
- Calculate the amount of influence of each element on its connected elements at a lower layer (parent to child node). To obtain a common numeric range/scale, and to allow aggregation into a final score, linear normalization of the global/local weight scoring is applied [100,101]. Equation (12) expresses a general form of the function of weight normalization in the case of multiple parent nodes (i.e., multiple elements of a higher layer connected to a single element of a lower layer):
- Multiply all proportional influences across a single pathway, starting from the assets layer and concluding in the requirements layer. To better understand the above process, numerical examples are provided in the following section of the study, based on the illustrative use case scenario.
Numerical examples are provided in Section 4 for a better understanding of the above process.
4. Methodology Implementation—Conceptual Scenario
To demonstrate the proposed approach, a conceptual drone-based delivery scenario is used to validate its effectiveness and applicability, as the drone delivery service is becoming an emerging topic for different companies and purposes [102]. This case is merely illustrative. The proposed framework may serve as the basis for other drone-assisted system applications across different types of drones. Specifically, it is assumed that a multi-rotor drone is deployed to serve a single customer in an urban area [13,103,104,105]. The system is deployed during daylight hours. The package to be delivered should not weigh more than 30kg. In addition, special consideration should be given to avoid damaging the parcel or degrading its contents. Therefore, rainy and windy weather, as well as extreme temperatures, pose considerable risk. During dispatch through a stationery warehouse, the parcel is loaded [104,106]. Additionally, the GPS coordinates of the destination are set, and a reliable communication channel is established [2]. Finally, the route of the drone is planned considering the flight distance, speed, weight of the payload, and external factors, such as wind speed and temperature [21,22]. The drone flies to the destination/customer throughout the shipment phase. The flight altitude is not considered higher than 200 m. A drone can fly over people, highways, and streets. When possible, the path of the drone is planned above non-populated zones, and it might also fly over people to use the shortest path [1]. This is the most critical phase because the drone is exposed to significant risk sources such as weather conditions, barriers interfering with its route, undesirable obstacles, bad control, equipment malfunctions, unpredictable failures, and malicious attacks [104]. Finally, the drone reaches its destination and landings occur. This process poses several risks, including malicious attacks, unintentional package drops, accidental damage to the package, and human injuries. As shown in Figure 2, the first component of the methodology is the systematic use of all available information from journal articles, conference papers, surveys, and reports to analyze the system. The goal is to identify and classify potential hazardous events and to decompose the system into sources: (i) equipment, (ii) area of operation, (iii) mission, (iv) environmental conditions, (v) communication means, (vi) humans’ involvement, and (vii) relationships. Figure 4 summarizes the conceptual scenario described above. The different steps of the package delivery process are illustrated. Also, the image lists potential risk hazards.
Figure 4.
Drone-assisted delivery system.
4.1. Establishment of Risk Parameters
In what follows, the qualitative component is implemented. Following the systematic process described in Section 3.1, the required risk parameters are established. All parameters and related dependencies are retrieved from different sources and framework guidebooks (i.e., SORA, NIST, ISO). Their verification has been presented in articles published in well-established journals and conferences referenced in the paper: (i) system’s assets, (ii) vulnerabilities, (iii) possible threats, and (iv) associated impacts.
These parameters are used in the next step of the methodology to build up the hierarchy.
- Assets’ Identification: This is the primary and most important step in an asset-based approach [21,22]. An aerial system is an interconnected system of systems, composed of a ground control system, airborne unit (including embedded sensors and subsystems), and a communication link [13,19,107,108]. In addition, human administration is considered a component of this system [17,83]. Also, environmental conditions (weather), area of operation, and regulations are external elements outside the boundaries of the system that are capable of influencing its state. These should be considered as significant elements in governing the utilization of an aerial system and potential sources of hazardous events. Consequently, for this study, the system’s assets are Airborne Component, Ground Control Station, Communication Links, Regulations/Policies, Environmental Conditions, Operator, and Area of Operation.
- Vulnerabilities’ Identification: The outlined vulnerabilities denote the system’s limitations and susceptibilities due to the lack of or ineffectiveness of controls. Through the analysis, the potential vulnerabilities are as follows: Ineffective Power Source, Power Consumption, Defective Components, Wrong Handling, Susceptibility to Wireless Attacks, Susceptibility to Weather Conditions, Lack or Violation of policies/regulations, Faulty Operation, Lack of Operators’ Skills/Training/Expertise, and Susceptibility to Adversarial Actions. The identified vulnerabilities associated with the system’s assets are presented in Table 7 (see also Supplementary Material S1 for reference). As shown, several vulnerabilities are linked to multiple assets. Weaknesses are expected to be exploited sequentially or simultaneously; therefore, it is important to record multiple connections.
- Threats’ Identification: Possible attacks, failures, man-made and natural events that compromise the system’s functioning are defined along with their association with the identified vulnerabilities. Table 8 presents threats threatening the system’s performance along with the exploited vulnerabilities (see also Supplementary Material S1 for reference) [22]. Each threat is classified into one of the categories listed in Table 4. The identified threats are the most frequently mentioned in the literature: Power Failure, Equipment Failure, Control Loss, Wireless Attacks, Extreme Weather Conditions, Collision with Objects, Unsuccessful Navigation, and Physical Attacks.
- Likelihood Determination: Likelihood is treated as a score based on judgment; therefore, its estimation is embedded in the pairwise comparisons of vulnerability and threat importance. Comparisons are analyzed at the next step of the framework through the utilization of the quantitative component.
- Impact Determination: Impact of a threat event is the magnitude of harm expected to occur in the system after the exploitation of a vulnerability. According to [21] the adverse impact of a threat might be capable of harming anyone of the system’s sources: for the system’s mission, a possible impact could be the inability to perform a specific function, for an asset could be a damage to it or the loss of the asset, for a human admin could be the damage of image or reputation due to lack of proper education or policies’ violation, for the relationships could be any relational harm. The association between the identified threats and their potential impact on the related requirements of Confidentiality, Integrity, Availability, Reliability, Safety, Survivability, and Maintainability is demonstrated in Table 8. Additionally, Supplementary Material S1 (Tables S3 and S4) provides information and a comprehensive explanation of the established requirements.
Table 7.
Vulnerabilities (in association with the assets).
Table 8.
Threats (in association with the vulnerabilities and potential impact).
In summary, each threat source affects one or more assets, a single threat might exploit more than one vulnerability, and a single vulnerability could be exploited by more than one threat; the more assets are affected, the higher the probability for the threat event to have an adverse impact; the more vulnerabilities are exploited, the higher the risk for the system to not accomplish its mission.
4.2. Multi-Layer Hierarchy Model Application
The quantitative component is focused on the defined risk elements and, through the hierarchical methodology, attempts to quantify the classified hazardous events. AHP is applied to transform subjective preferences into measurable weight values in order to quantify the performance of the aerial system [64].
4.2.1. Hierarchy Construction
The identified risk factors are organized in the five-layer hierarchy model presented and comprehensively described in Section 3.2.2, following the generalized form of hierarchy of Figure 3.
4.2.2. Dependencies Definition
The use-case hierarchy model is presented in Figure 5. It considers the definition of risk and reflects the dependencies and relationships between the risk factors of each layer as presented in Table 7 and Table 8. Moreover, it addresses the dynamics of a critical drone-assisted system, following the proposed approaches and guidelines presented above in Section 3.2.3 and Section 3.2.5.
Figure 5.
Drone-assisted system’s hierarchy model.
4.2.3. Pairwise Comparison
After all the elements are identified and categorized, pairwise comparisons are performed. For this study’s purposes, the verification of all pairwise comparisons has been presented in the reviewed literature referenced in the paper. The proposed approach has been employed due to the limited availability of data targeting the scenarios examined, and also due to limited access to experts. The AHP scoring, which has been used to validate the proposed methodology, was based on the scenario’s requirements and specific scoring criteria. Both requirements and scoring criteria are described and analyzed within the text in the following paragraphs. In addition, statistical data and models found in a limited number of references were used to justify the requirements and the judgments as well. Explanations and statistical data are provided and cited in the text below. Comparison scoring is described in Section 4.2.4.
- Layer 1: Framework’s Objective
The first layer of the hierarchy represents the main goal or objective of the framework. Specifically, it defines the primary aim of the structure, which is the impact of the severity of the identified risks on the performance of the drone-assisted delivery system. Starting by clearly stating this top-level goal, the frame of the decision problem is set up. Subsequent layers break down the hierarchy into different risk elements and extend it to the lower layers.
- 2.
- Layer 2: Assets Layer
- Airborne Component: It refers to the aircraft and the flying element of the system [84]. It consists of various subsystems such as frame, motors, propellers, flight controller, battery, and sensors [83,84]. It is the central component and enabling technology; therefore, it is likely to be perceived as the most important asset [104]. Regarding its comparison with the communication medium, it can be said that the drone itself is the actual asset performing the operation; thus, it is considered of moderate importance over the medium. Similarly, compared to the environment, despite the fact that it heavily influences the drone’s performance, the drone slightly favors it, owing to the mechanisms that allow the operation of the system under extreme weather conditions.
- Ground Control Stations: It is a land-based system equipped with specialized software and hardware [13]. It is the primary interface to communicate with, remotely control, and exchange data with the airborne component [84]. It plays a critical role, whether the aircraft is controlled automatically or manually by the human operator [11,104,106]. Therefore, compared with the communication medium, both are considered to be of equal importance. Additionally, compared to operators, the control station is the primary interface between the human and drone; therefore, it is considered to be of equal importance. However, one can assess the operator as more important than the control station if unskilled and untrained personnel can result in mission failure. In addition, compared to the environment, the latter is generally considered to be more crucial for drone performance.
- Communication Links: As mentioned in Section 4.1, the communication link is an asset of the aerial system, enabling bidirectional data exchange between the airborne component and controller [109]. However, environmental conditions (rain, temperature, and wind) can affect the connection between the aerial component and controller; consequently, the environment takes precedence over communications in this comparison. Additionally, different wireless attacks can violate communication links [2,15,90]. Regarding a possible drone crash, reference [110] states a rate of 11%, while [1] mentions a considerable failure rate of up to 14% owing to degraded communication quality.
- Regulations/Policies: Relevant policies have been developed to ensure that the drone operators, whether recreational or professional, have a clear understanding of what is allowed under certain conditions [2,111,112]. The examination of regulations and policies as independent components is critical because violation of these rules might lead to the loss of drone management, unauthorized access to the equipment, or a probable crash. Regulations govern the way the drone operates; thus, the operator slightly favors them because he has to ensure that the drone functions within regulations. Under specific scenario assumptions, regulations are not considered a significant factor compared with other assets.
- Environmental Conditions: Several studies have revealed that weather robustness is an essential gap and of high priority that may affect the ambitions to expand drone operations [113]. High wind speeds, rain, snow, and weather fluctuations might have an adverse impact on the drone’s frame and disturb its electronic circuits, sensors, and communication channels [14,15,16]. It is well known that bad weather conditions prevent the system from operating. Also, the capability to resist certain weather conditions is determined by the specifications of the drone [2]. Therefore, compared to other assets, environmental conditions favor them, except for the aerial component.
- Operators: These people perform activities related to the drone’s mission [84]. As a system asset, human operators involve skills, expertise, mental and physical health, and training [49]. Unskilled and untrained operators, who are unable to adapt to area limitations, might result in mishandling and mission failure. Therefore, the operator is typically considered as important as the area of operation. However, the operator should adapt to and work within the constraints of the area of operation; hence, the operator’s importance is assessed slightly higher.
- Area of Operation: Area of operation is an external element that can influence the system’s performance. Areas of operation should be urban or suburban, mountainous or lowland, friendly or hostile. Different characteristics result in an assessment of hazardous events differently. However, according to [110], changes in the operating environment have a minimal effect on the system operation (5%). Regarding the tested scenario, for a drone-based system utilized under relatively controlled conditions, the area of deployment has little to no effect on the pairwise comparison. However, regarding unknown zones or diverse environments, the area of operation should be considered a vital factor for successful deployment; therefore, its importance should be evaluated accordingly.
- 3.
- Layer 3: Vulnerabilities Layer
- Ineffective Power Source: The power source of drones is a key challenge under investigation [83]. According to several professionals [114], battery efficiency varies based on the battery chemistry, manufacturer specifications, and operational conditions (discharge rates, environment, airflow, etc.). Temperature is the most influential factor for lithium-ion batteries [96,97]. As [115] revealed, the optimal operating temperature of a lithium-ion battery is 20–50 °C. However, outside this range, the capacity should decrease by 50% faster in some cases [116]. Considering that the current limitations on batteries constrain system autonomy, a power source is a vulnerability of great concern, which is more essential than almost all other possible vulnerabilities. It is no coincidence that the authors of [1,87] attributed possible drone crashes to the loss of electrical power and propulsion at a percentage of up to 38%.
- Power Consumption: This vulnerability is related to the power source of the system. When an aerial system is utilized to accomplish a mission, the energy consumed by the system depends on the aircraft’s aerodynamics, weather conditions, altitude/air density, payload, flight path (take-off consumes the most energy), and speed [117,118]. Testing these factors on the physics-based models mentioned in [119,120,121], it was discovered that power consumption and its alteration during flight time must be considered to ensure that the drone successfully reaches its destination and accomplishes its delivery mission. For this reason, power consumption is considered to be of high importance except when compared to weather conditions and wireless attacks.
- Defective Components: This study considers aircraft (including sensors, batteries, and circuits), ground control station, and communication medium as the most critical components with defects [13,84]. These components play a crucial role in the drone’s performance. Each of these may increase the attack surface, thus posing potential sources of hazardous situations. Consequently, the defective components should be weighted as unpredictable factors of major importance. References [1,80] documented a high percentage of failures. Reference [1] mentions a range of failure from 6% to 63%, while a study in [80] indicates that the accident probability due to malfunctions or technical deficiencies related to the power source lies between 55% and 63%. In a similar way, reference [110] indicates that the highest causal factors leading to loss of control are equipment and manufacturing failures, which occur at a rate of 34%.
- Wrong Handing: This refers to improper human intervention; in this study, it is a vulnerability associated with operators’ training and expertise [21,22]. Therefore, its importance is assessed according to the way the system is controlled. As mentioned in [2], the rate of a possible crash due to autopilot controller failure is approximately 23%. Otherwise, in the case of manual flight control, the evaluation of wrong handling should vary from low (14% according to [110]) to medium (22% according to [87] and 35.3% according to [80]). It can even reach very high importance due to the high mishap rate of up to 65%. Wrong handling mostly occurs due to the operator’s error. Moreover, as mentioned by [122], human contribution to drone accidents is evaluated at 40% in case of erroneous control during the ‘on task’ phase (i.e., conducting its mission) and at 55% in case the operator aims to contribute to failure recovery. For this scenario, it is assumed that the airborne component accomplishes its mission automatically; hence, the importance of this potential vulnerability is weighted accordingly, depending on the factor with which it is compared.
- Susceptibility to Wireless Attacks: Wireless attacks can violate communication links and sensors [12,90]. Attacks, such as GPS Spoofing or Signal Jamming, can cause deviations, erratic movements, or even unexpected behaviors [123,124]. Moreover, inadequate authentication mechanisms and weak encryption protocols can cause man-in-the-middle attacks, eavesdropping attacks, denial-of-service attacks, or malware attacks, thus threatening communication links [13]. Considering that countless attacks of different sophistication are threatening communication links, it should be concluded that susceptibility to wireless attacks is of essential importance. Similarly, in comparing this vulnerability with the statistical data from the two relevant studies [1,87], it is stated that at a rate of 9% and 14%, respectively, there is a possibility of a system crash due to security attacks.
- Susceptibility to Weather Conditions: Temperature affects the battery, wind speed can cause trajectory deviation, and rain might affect the drone’s circuits [49]. According to [113], global drone flyability is the highest in warm and dry continental regions. Also, it is noted that the most limiting weather factor is precipitation. Moreover, common drones have an operational temperature range of 0 to 40 °C and a maximum wind speed resistance of 10 m/s. Furthermore, the sensors and circuits are sensitive to moisture, rain, and precipitation [50]. In addition, ice and snow accretion may cause problems for propellers. The analysis in [1] indicates that the possibility for a drone to crash owing to the weather effect lies within the range of 5% to 18%. In a similar way, reference [110] reveals that environmental factors have a contribution of 14%, leading to loss of control. Having said that, weather conditions are examined and are of at least moderate importance.
- Lack or Violation of Policies and Regulations: The existence of regulations should be considered an important part of a drone-based delivery system in and around cities [125]. The violation of these rules may lead to a loss of drone management. In addition, inadequate traffic management or ineffective estimation of drone density in low-altitude airspaces increases the probability of lethal consequences [79]. According to [1], the percentage of possible drone crashes caused by air traffic management failure is low, ranging from 2% to 8%, or up to 9% due to inadequate regulations or violations [122]. In addition, the violation of security controls, empowering physical attacks, depends on the area of operation and the type of mission. For this scenario, it is assumed that there is no violation of any aviation or security controls; thus, this vulnerability is considered to be of minimal importance.
- Faulty Operation and Lack of Expertise/Training/Skills: This type of weakness indicates the system’s inability to operate properly owing to external factors, such as adversarial attacks, weather conditions, or erroneous control [12,90,123,124]. Operator’s experience is a significant factor contributing to accidents. According to [110], the highest number of accidents occurs among operators with total flying experience within 20–99 h (35%), while the lowest number of accidents is found among those with total flying experience of 1000+ hours (3%). However, as was mentioned above about ‘Wrong Handling’, the mission of a drone-based delivery system can be achieved through manual operation or automatically. Therefore, the possibilities of these kinds of vulnerabilities being exploited are significantly reduced, and their importance is weighted accordingly, because the examined system operates automatically.
- Susceptibility to Adversarial Actions: These types of attacks target hardware components and intend to compromise the system’s functionalities, i.e., bombing, gunshots, mission surveillance or reconnaissance, equipment interference, or physical attacks [13,21]. The lack of control and security restrictions makes a system prone to such attacks [84]. However, in this scenario, adversarial attacks should not be considered as an important factor compared to vulnerabilities such as weather conditions, defective equipment, and power consumption. Nevertheless, it could be compared with a lack of expertise and policy violations, and is of moderate importance in terms of the level of impact in case of exploitation.
- 4.
- Layer 4: Threats Layer
- Power Failure: Battery provides the necessary power for extended flight durations [13,83,109]. Any technical or structural failure is considered a threat [22]. Therefore, a possible power failure is classified as a threat that, if it occurs, should directly exploit vulnerabilities, such as an ineffective power source or high-power consumption. In addition, power failure is indirectly associated with vulnerabilities such as susceptibility to wireless attacks and weather conditions (due to increased power consumption from deviations or erratic movements). The percentage of 38% accounts for a possible drone crash owing to a power failure, and should not be considered negligible [1]. The rate of 14%, as stated in [110], for power loss should not be considered insignificant. Given that the limited capacity of drone batteries is considered a challenge [83] and that the effects of such a threat might involve the entire system, it is concluded that power failure is of essential or strong importance.
- Equipment Failure: It occurs depending on the durability of the system. Vulnerabilities, including defective components (battery, circuits, structure), susceptibility to weather conditions (rain, snow, temperatures, or even high wind might harm the circuits, battery, or structure of the drone), and adversarial actions (equipment destruction or damage) might be exploited. Consequently, a possible failure, especially a breakdown of the aerial component, might threaten the successful completion of the mission, and its effects should be extensive. Therefore, ‘Equipment Failure’ should be considered of strong importance, as the crash rate reported in [1] ranges from 6% to 63%.
- Control Loss: Loss of system control is an erroneous action taken by the operator and might take advantage of vulnerabilities such as wrong handling, faulty operations, and lack of expertise. In addition, high power consumption, weather conditions, susceptibility to wireless attacks, and violation of aviation regulations are vulnerabilities associated with control loss. Under different circumstances, it might be of essential or strong importance, although, based on the assumptions that have been set, most of these factors are controllable. Hence, compared with other threats, control loss might be considered of minor importance.
- Wireless Attacks: They might threaten communication means, controllers, and sensors, leading to severe consequences [13,90]. Their importance is assessed in consideration of the essentiality of communication means and the fact that susceptibility to wireless attacks is of great concern. Considering the possibility of up to 14% for a system to crash due to security attacks, it should be concluded that susceptibility to wireless attacks is judged accordingly [123,124,126].
- Extreme Weather Conditions: Weather conditions, as a hazard threatening a system [21], should always be carefully considered. For the tested scenario, it is assumed that the weather conditions are ideal for a drone to accomplish a flight. Having in mind what is already mentioned above for the susceptibility to environmental conditions, weather is evaluated as of at least moderate importance, and consequently, capable of affecting the successful completion of a package delivery.
- Collision with objects: This is a considerable threat, particularly when deploying a system above an urban area. The probability of a mid-air collision varies from 2% to 38% [1]. Also, the likelihood of a drone crashing due to its inability to avoid a collision is low, up to 5%. Similarly, the probability of other aerial components approaching a drone-assisted system and leading to an accident was approximately 30% [80]. Moreover, regarding a possible accident due to a collision, reference [110] states a percentage of 8%. As shown, the estimation varies and depends on factors such as object density, embedded collision avoidance sensor, and the drone’s trajectory. Therefore, for our study, collision is considered of some importance, because the impact will have severe consequences, such as equipment damage, loss of lives, injuries to unsuspecting bystanders, or package destruction.
- Unsuccessful Navigation: Linked directly to Wrong Handling, it is assumed that the aerial component accomplishes its mission automatically; hence, its importance is reviewed as of minor concern. However, unsuccessful navigation of a drone-based system is indirectly associated with other vulnerabilities, such as Susceptibility to Weather Conditions, Susceptibility to Wireless Attacks, or High Power Consumption; thus, its importance is weighted accordingly [50,82,83].
- Physical Attacks: These types of attacks target hardware components [13]. In addition, they aim to cause physical damage, usurp control, steal the cargo, disrupt the mission, or interfere with sensitive equipment on the system. For the examined scenario, the system is utilized under relatively controlled conditions; thus, the importance of physical attacks is lessened. It favors only over control loss and unsuccessful navigation, because the level of its impact should affect the entire mission. Under different scenario requirements under diverse environmental conditions (i.e., transportation of valuable materials, critical surveillance missions), physical attacks should be considered an important factor for the successful accomplishment of the mission.
- 5.
- Layer 5: Requirements Layer
For the evaluation of the requirements, the linked threats and the impact of each requirement are considered (see Table 4 and Table 5 and Supplementary Material S1 for reference). For instance, regarding ‘Confidentiality’, the qualitative analysis revealed that it is violated by ‘Wireless Attacks’ and ‘Physical Attacks’. Similarly, ‘Availability’ is shown to be endangered if the system is spoofed, penetrated, suspended, disrupted, or physically tampered with and cannot operate as expected. Following the hierarchy in Figure 5, ‘Availability’ is violated by almost all the identified threats. Therefore, when ‘Availability’ is compared to ‘Confidentiality’, it is considered of essential or very strong importance. Apart from that, ‘Confidentiality’ and ‘Availability’ are two pillars representing a critical balance where excessive security (high confidentiality) can hinder user access (low availability). However, when it comes to critical aerial systems, strict access rules might improve secrecy yet can block urgent needs, such as emergency system utilization. In addition, the importance of safety relies on the fact that in the event of an accidental or adversarial threat, the system itself is going to be in a difficult situation, as well as human lives [127]. Therefore, when it comes to human losses or injuries, ‘Safety’s’ importance outweighs all the studied requirements. According to this approach, the requirements are weighted as follows:
- Confidentiality: Unauthorized access to the system’s equipment and communication links’ disclosure (due to wireless attacks [13,90]) are the identified threats capable of intimidating confidentiality. Considering the importance of these threats and the examined scenario, confidentiality does not seem to be very important in affecting the resilience and performance of the system.
- Integrity: With reference to the hardware, integrity denotes tampering with the equipment, for instance, malicious or accidental destruction of components [128]. Therefore, Wireless Attacks, Unauthorized Access, and Weather Conditions are possible threats that can violate the system’s integrity. Comparing the importance of confidentiality and integrity, it seems that they lag behind other requirements by a similar level. Nevertheless, when it comes to the comparison between them, integrity is slightly favored over confidentiality owing to its connection to the important factor of Weather Conditions.
- Availability: As qualitative analysis reveals, availability is an extremely important parameter for a drone-based system to be ‘ready to operate’ [129,130]. Hence, when compared to Confidentiality and Integrity, it is considered essential or of very strong importance. In addition, compared to Safety, when it comes to human losses or injuries, Safety’s importance outweighs all the studied requirements. Also, regarding the comparison of Availability with Survivability and Maintainability, both favor Availability, and the reasons will be explained below.
- Safety: The importance of safety relies on the fact that in the case of an accidental or adversarial threat, the system and possibly human lives should be in a difficult situation [127]. Therefore, the possibility of causing fatalities upgrades its importance over other requirements and makes Safety the highest priority.
- Reliability: This is closely related to Availability [128,129,130]. Additionally, it is a key factor that determines the operational efficiency of drones [131,132]. Based on the facts and assumptions made for the specific case study, Reliability favors Confidentiality and Integrity, is equal to Availability, and finally, is characterized as subservient to the remaining requirements.
- Maintainability: It is restored easily to normal operating conditions after a hazardous event, increasing the probability of the system being available and reliable [133,134]. Considering that the hazards that are threatening the system’s normal operation are among the most highly rated ones (Equipment Failure, Wireless Attacks, Collision with Objects, Weather Conditions), it is concluded that the comparison favors maintainability over almost all the other requirements.
- Survivability: This is a subset of resilience. It indicates the capability of the system to fulfill its mission, even in the presence of any threat [135,136]. For a drone-based system that operates in an open environment, ensuring Survivability with robust and consistent controls is considered the most important. Therefore, when it comes to comparing Survivability to the other requirements, it favors all of them, thus increasing the likelihood of a successful mission accomplishment.
4.2.4. Scaling Matrices
According to the analysis provided in Section 3.2.4 and Section 3.2.5, matrices are established. The elements of each level of the hierarchy were rated using the fundamental comparison scales [59] (see also Table 5). Table 9 presents the comparison matrix formulated for the assets’ layer. Scoring is provided based on the comparison criteria analyzed above. Following the construction of the assets’ comparison matrix, the matrices for Layers 3, 4, and 5 are also formulated based on the explanation thoughts described in the above-mentioned paragraphs (matrices formulated for layers 3, 4, and 5 are presented in Supplementary Material S2—Tables S5–S8).
Table 9.
Second layer—pairwise comparison matrix.
4.2.5. Calculating Priority Vectors and Consistency Ratio
After establishing the pairwise comparison matrices, priority vectors are calculated. This is performed by following the procedure described in Section 3.2.6. For illustration purposes, a demonstration is given in calculating the priority vector of the assets’ layer: for value normalization, values in Table 9 are divided by the sum of the elements of the column they belong to. Then, the sum of the elements in each resulting row (to obtain a ‘row sum’) is divided by the number of elements in the row, thus resulting in the relative importance of this element. Assuming the risk element of Airborne Component (see shaded row of Table 10), 0.30 + 0.3103 + 0.2222 + 0.1818 + 0.4615 + 0.2338 + 0.1579)/7 gives 0.2668, which is the relative importance of Airborne Component. Similarly, the relative importance of all assets is calculated. Table 10 presents the normalized values of the pairwise comparisons of Layer 2. In addition, the last column illustrates the calculated priority vector.
Table 10.
Second layer—normalized pairwise comparison matrix.
To ensure the consistency of comparisons, Equations (3)–(5) are used to calculate CRs. Table 9 and Table 10 provide the required values of the priority vector and column sum. The resulting λmax, n, CI, and CR values are listed in Table 11.
Table 11.
Consistency check.
For illustration purposes, the calculation of the CR value for the assets’ matrix is presented below:
- Recall from Equation (5),
- Recall from Equation (4), = = 0.0804
- Recall from Equation (3), = = 0.0609
From the value analysis, it is deduced that the CR is less than the acceptable values (CR < 0.1); hence, the judgment is consistent.
4.2.6. Calculating Local Weights
In AHP, the calculated relative priorities (estimation is conducted through the previous step) within the same layer of the hierarchy consist of the local weights [95]. Figure 6 summarizes the calculated local weights for all risk elements.
Figure 6.
Layered visualization of local and global weights.
4.2.7. Calculating Global Weights
As explained in Section 3.2.8, it is necessary to calculate the global weights of each element. According to [95], global weight quantifies the overall importance within the entire hierarchy of elements. In addition, the global weight of an element is distributed among its connected child nodes (elements of the immediately below layer). Similarly, the global weight of any element is calculated from the product of its local weight and the global weight of its parent element (element of the immediately above layer) [95]. Starting with Layer 1 (hierarchy’s objective or root of the hierarchy), both the global and local weights sum up to 100%; thus, both the global and local weights of its child layer coincide [95]. Therefore, regarding the assets’ weight, which is the child layer of the objective, the calculated relative weights of assets are also considered global. In regard to the global weights of vulnerabilities, threats, and requirements, these are estimated by applying Equations (8)–(11). Table 12 presents sample calculations for estimating vulnerability, threat, and requirements’ global weight. Calculations are conducted by applying the propagation of weights across the hierarchy (see Supplementary Material S3 for mathematical analysis and calculations for all elements). Figure 6 summarizes global weights. Also, it presents the propagation of local and global weights across the hierarchical model.
Table 12.
Global weights (sample calculations).
4.3. Define Risk Chains
Following the process described in Section 3.3, specific risk events are reported. Every risk event is described by a chain of Asset - Vulnerability - Threat - Requirement, which starts from the objective of the hierarchy, follows a pathway through every layer, and ends at a requirement. By analyzing the connections between the risk elements, as these are formed and presented in Figure 5, 147 pathways are confirmed. Table 13 summarizes the total risk chains in which each risk element is involved. By counting the risk chains per layer, their sum is 147 (Supplementary Material S4 illustrates all the registered pathways). From the analysis of data shown in Table 13, it is observed that the leading nodes through which the majority of the chains are passing from are as follows: the ‘Airborne Component’ (36 paths), followed by ‘Communication Links’ (29 paths) and ‘Environmental Conditions’ (26 paths), in the assets’ layer. As for the 3rd layer, the vulnerability of ‘High Power Consumption’ (30 paths) and ‘Wrong Handling’ (27 paths) are the leading nodes. Regarding the threats’ layer, ‘Unsuccessful Navigation’ (33 paths) and ‘Wireless Attacks’ (24 paths) gather most of the pathways. Regarding the 5th layer of requirements, it is noted that most of the risk chains lead to the requirement of ‘Availability’ (45 paths), followed by the 27 paths which end at the requirement of ‘Safety’. The requirements with the least number of routes terminating in these are ‘Confidentiality’ and ‘Integrity’ (8 paths, respectively). Nonetheless, the number of risk chains is not necessarily the determining factor for the risk level. One risk element might influence many risk paths of little importance, whereas another element might contribute to fewer risk chains but of greater importance. Each element of the hierarchy contributes an amount of risk to each of its associated chains, based on its global importance. Thus, the combination of element contributions leads to the estimation of cumulative risk contribution. In addition, the aggregation of the chain’s cumulative risk contribution of the risk that passes through a specific node assesses the total contribution of the node to the overall impact.
Table 13.
Risk chain sum total and associated aggregated risk.
4.4. Cumulative Risk Contribution—Risk Ranking
Based on the procedure described in Section 3.4, the contribution of each element to its associated risk chains is computed by applying Equation (12), taking into account the calculated weights of Figure 6. In addition, the cumulative risk contribution for every chain was assessed, allowing the ranking of the identified risk events. Finally, the impact of the severity of each risk element was evaluated by aggregating the risk chains involved. Here is an illustrative example: from the hierarchy of Figure 5, assume the pathway of Environmental Conditions–Susceptibility to Weather Conditions–Unsuccessful Navigation–Safety. Recalling from Figure 6, the global weights of the three threats are Control Loss = 0.0112, Unsuccessful Navigation = 0.0110, and Collision with Objects = 0.0040. Starting from the node of Safety, it is linked to the threats of Control Loss, Unsuccessful Navigation, and Collision with Objects. According to Equation (12), the proportion of influence of Unsuccessful Navigation on Safety is calculated at 0.42 as follows:
Similarly, we estimate the proportion of influence of Susceptibility to Weather Conditions on the examined chain. To do this, we examine the vulnerabilities involved in Unsuccessful Navigation, Susceptibility to Weather Conditions, High Power Consumption, Wrong Handling, Susceptibility to Wireless Attacks, Faulty Operation, Lack of Expertise/Training/Skills, and Physical Attacks. Considering their global weights (see Figure 6), the sum was 0.203. Hence, the share of affection for Susceptibility to Extreme Weather Conditions, which corresponds to Unsuccessful Navigation, was 0.0948/0.203 = 0.47. Finally, we estimate the influence of the asset of Environmental Conditions that feeds the examined pathway. The assets involved are Environmental Conditions and Communication Links. The sum of their global weights was 0.2715 + 0.1422 = 0.4137; thus, the volume of affection linked to Environmental Conditions was 0.2715/0.4137 = 0.656. Finally, the cumulative risk of path Environmental Conditions–Susceptibility to Weather Conditions–Unsuccessful Navigation–Safety was 0.656 0.47 0.42 0.0093 = 0.0012. This value indicates the proportion of risk owing to this specific sequence of elements. The same process was applied to calculate the cumulative risk contribution for all pathways (see the last column of Table S14 in Supplementary Material S4 for reference). In addition, Figure 7 depicts the 40 most significant risk chains with the highest cumulative risk contribution.
Figure 7.
Overall ranking of the 40 most hazardous risk chains (based on cumulative risk).
Apart from that, the total contribution of each element to the overall severity impact is evaluated by aggregating the cumulative risk of the chains passing through this element. That is, Table 13 illustrates the aggregated risk contribution per element in parentheses. Analyzing the cumulative risk contribution and aggregated values per element empowers experts to identify high-risk pathways and detect the most influential elements of the hierarchy.
5. Analysis of Results
By applying the pairwise comparison for estimating the relative weight, it was revealed that Environmental Conditions are perceived as the most significant asset at 0.2715, followed closely by the Airborne Component at 0.2668. Communication Links, Ground Control Station, Operator, Regulations/Policies, and Area of Operations complete the order of importance with scores of 0.1422, 0.1156, 0.0936, 0.0620, and 0.0483, respectively. These findings confirmed the significant role of weather conditions in the deployment of a drone-based system and their impact on its performance [113]. Additionally, the ranking of the airborne component as the second most important factor strengthens the literature reviewed regarding its prominent position as an enabling technology, especially for systems providing delivery services [104]. For the third layer, Susceptibility to Weather Conditions was shown to be of the highest importance at 0.2292. This is justified because weather is a poorly resolved factor that affects the ambitions to expand drone operations by the adverse effect on drone endurance, performance, avionics, sensors, and aerodynamics [113]. Ineffective power source is the next most important vulnerability, followed closely by Defective components, Susceptibility to wireless attacks, and High-power consumption. Susceptibility to adversarial actions, Wrong handling, Lack of expertise/training/skills, Faulty operation, and Lack or violation of policies/regulations are rated with the lowest score. Regarding the threat sources’ layer, Power Failure is identified to bear more impact than the other elements, with a score of 0.2152. This goes off well because, given the limited capacity of drone batteries, the power source is considered a challenge still under investigation [83,110]. In addition, Extreme Weather Conditions, Wireless Attacks, Collision with Objects, and Equipment Failure were similar with scores of 0.2028, 0.1580, 0.1273, and 0.1133, respectively. These findings verify what was already reviewed in the literature and reported above: (i) countless wireless attacks threaten the communication links of a drone-based system [2,12,13,90], and (ii) weather conditions as a hazard threatening a system are always unpredictable, well-thought-out, and, most importantly, capable of disturbing almost all components of the system [113]. Finally, Physical Attacks, Control Loss, and Unsuccessful Navigation are ranked as less important because, for the purposes of this study, they are assumed to be within manageable levels.
However, in a different scenario, the contribution of these factors should be assessed differently. For instance, the contribution of these elements to the performance of a manually controlled system should be calculated accordingly. Finally, at the requirements layer, the elements were ranked from the most significant to the least important as Safety, Survivability, Maintainability, Availability, Reliability, Integrity, and Confidentiality. As shown, the requirement of Safety was perceived as the most significant element with a score of 0.3545. Safety is considered a factor that relies on the fact that in the case of an accidental or adversarial threat event, both the system and human lives should be in a difficult situation [2,127]. Next, the model processes the derived local weights to estimate the global weights [95,137]. By checking the weights presented in Figure 6, there were elements whose importance had been altered. As already said in Section 4.2.7, the local weight of assets (Layer 2) corresponds to the global ones [95]. Therefore, the asset ranking remains as follows: Environmental Condition, Airborne Component, Communication Links, Ground Control Station, Operator, Regulations/Policies, and Area of Operations. Regarding the third layer’s elements, Susceptibility to Weather Conditions was still perceived as a vulnerability with the highest global weight. This is supported by considering the dependencies and relationships depicted in Figure 5, given that Susceptibility to Weather Conditions is linked to Environmental Conditions, which is scored as the most important asset. Defective Components, High Power Consumption, and Ineffective Power Source were the next most important vulnerabilities. Contrary to what was calculated, the propagation of relative weights, from the asset’s layer to the vulnerabilities’ layer, causes an upgrade to the importance of Defective Components and High Power Consumption, whereas at the same time, the priority of Susceptibility to Wireless Attacks and Ineffective Power Source is reduced. The explanation given regarding the degradation of the Susceptibility to Wireless Attacks is that the latter is associated with the asset of Communication Links (ranking third among assets), whereas the importance of Defective Components and High Power Consumption depends on their association with Environmental Conditions and Airborne Component. Regarding the threat sources, Power Failure, Extreme Weather Conditions, and Wireless Attacks remain the highest priority. Additionally, it is noteworthy that although Collision with Objects is a threat source related to equipment damage, loss of lives, or injuries to unsuspecting bystanders, its global weight was downgraded and finally placed in the penultimate position. This can be justified when considering the vulnerabilities associated with Collision with Objects, given that they are in the last positions of the ranking. Similarly, the threat of Control Loss was evaluated as of higher importance. This can be explained by the increased dependence on multiple vulnerabilities. Ultimately, referring to performance requirements, as marked, Survivability is scored as the most substantial requirement, unlike ‘Safety’, which was originally ranked as the most important requirement. This can be explained by reviewing the established dependencies. As shown, Survivability (i) is impacted by the highest scored threats of Power Failure and Extreme Weather Conditions, (ii) which in turn expose the top-rated vulnerabilities of High Susceptibility to Extreme Weather Conditions, Defective Components, and Ineffective Power Source, and (iii) the affected assets are the Drone and the Environmental Conditions. Furthermore, the reduction in Safety’s ranking could be explained by the fact that the risk elements that are linked to it and joined under the arrows representing its dependencies have been defined by the lowest-rank elements of Control Loss and Unsuccessful Navigation.
As for aggregated risk, the total number of risk chains is not necessarily the determining factor. The global importance of each element and the corresponding cumulative risk contribution of each chain define the level of risk. As listed in Table 13, the Airborne Component, Communication Links, and Environmental Conditions direct the most risk chains. However, as revealed by the aggregated risk, the asset with the greatest influence is Environmental Conditions (0.02186). Similarly, checking out the vulnerability layer indicates that High Power Consumption, Wrong Handling, and Susceptibility to Weather Conditions are directing most of the risk chains. The three most dominant vulnerabilities are Susceptibility to Weather Conditions (0.02196), High Power Consumption (0.01477), and Ineffective Power Source (0.009). Likewise, the three leading threat sources are Unsuccessful Navigation, Wireless Attacks, and Control Loss, while in terms of influence, Extreme Weather Conditions (0.01739), Power Failure (0.01711), and Unsuccessful Navigation (0.00611) seem to be the most significant. Finally, regarding the requirements of performance, Availability, Safety, and Reliability have the highest appearance in risk paths, whereas Survivability (0.01791), Maintainability (0.01188), and Availability (0.00991) are the most influential elements. From the analysis of the cumulative risk contribution, it is deduced that Environmental Conditions, followed by the Airborne Component, are the leading assets of the chains depicted in Figure 7 (see Supplementary Material S4 for reference). Specifically, the chains that include Environmental Conditions–Susceptibility to Weather Conditions–Power Failure and Environmental Conditions–Susceptibility to Weather Conditions–Extreme Weather Conditions are evaluated as the weightiest risk chains. Moreover, the chains that involve Environmental Conditions, the vulnerability of Susceptibility to Weather Conditions, and the threat sources of Extreme Weather Conditions and Power Failure have a significant effect on the system’s survivability (complications in fulfilling the mission, even under hazardous conditions), maintainability (inability to be restored to normal operating conditions after a failure), and reliability (failure to accomplish a specific mission under the determined objective tasks). Additionally, when coming to the asset of Aerial Component, it is revealed that the chains Airborne Component–Ineffective Power Source–Power Failure and Airborne Component–Ineffective Power Source–Extreme Weather Conditions are evaluated as the next most significant hazardous chains that affect the system. Specifically, when threat sources such as Power Failure and Extreme Weather Conditions expose the vulnerabilities of the system, the requirements of Survivability and Maintainability are affected. Lastly, regarding the Communications Links, it seems that their involvement with the system’s risk is limited only to Wireless Attacks and Weather Conditions; consequently, they have a smaller overall input than the assets of Environmental Conditions and Airborne Component. Furthermore, regarding the reported weaknesses of these systems, it seems that Susceptibility to Weather Conditions is the most frequent and impactful vulnerability. Checking out the hierarchy, it can be said that Susceptibility to Weather Conditions is only connected to Environmental Conditions and Communication Links on the left. However, its association with numerous risk chains is due to its connection with many dominant threat sources, such as Power Failure, Control Loss, Extreme Weather Conditions, and Unsuccessful Navigation. Similarly, vulnerabilities such as High Power Consumption, Ineffective Power Source, and Defective Components are also the elements most involved in risk chains. Additionally, concerning the risk elements of the threat sources’ layer, it appears that Extreme Weather Conditions and Power Failure are typically the most substantial contributors, followed by Equipment Failure and Wireless Attacks. Control Loss and Unsuccessful Navigation were the least involved elements, concentrated only on safety-oriented paths. Closing, the requirements of Survivability and Maintainability seem to be prominent, as expected, and are powered by influential threats such as Power Failure and Extreme Weather Conditions. In addition, Safety appears within the most hazardous chains but influences the risk chains only via Unsuccessful Navigation and Control Loss. Regarding the requirements of Availability and Reliability, the outcomes revealed that they are mainly shown through Power Failure and Equipment Failure. Integrity and Confidentiality appear in fewer pathways (related to Communication Links and data disruption through Wireless Attacks) and have a low-risk contribution.
6. Discussion
6.1. General
The mixed-method approach and hierarchical arrangement of risk elements enable us to conduct systematic identification and evaluation of potential hazardous events. The hazards were investigated through a comprehensive literature review and qualitative risk analysis. They were also decomposed into essential risk elements stemming from the broader environment in which aerial systems evolve, such as assets, weather conditions, human involvement, and executed processes and services. Then, a multi-criteria hierarchy model was used to incorporate the relative weights and relationships between the identified risk elements. It also drove their propagation across the different layers of the hierarchy, estimated their global importance, and enabled the identification of the most significant factors contributing to the system’s failure. The identification of high risk chains and the detection of the most influential elements can empower specialists to decide on the required actions: (i) invest in hardening, redundancy, and maintenance of the most influential assets; (ii) design or develop appropriate controls for the most significant weaknesses; (iii) prioritize detection, prevention, and response for the most powerful threat sources; (iv) strengthen the controls mapped to the most heavily impacted requirements. For the generic scenario of the drone-assisted delivery system, weather-related elements are identified as one of the most significant risk contributors. Therefore, weather-hardening strategies should be among the top levers for improving the system’s resilience and performance; weather forecasting, following weather-avoidance guidelines, or implementing a go/no-go logic to help practitioners ensure the successful completion of the mission. In addition, power robustness appears to be the second most important axis for ensuring the sustainability of the system and successful mission accomplishment. Taking measures to ensure the battery’s health and quality, careful planning of the route by considering all those parameters that affecting power consumption, adjusting drone’s speed and altitude while flying in case of an unexpected hazardous incident to achieve system’s performance degradation, and defining the acceptable margins of power consumption (or remaining battery energy) per planned route are some of the best practices to safeguard system’s performance.
Apart from that, as illustrated by the constructed hierarchy, threat sources such as Unsuccessful Navigation, Control Loss, and Collision with Objects influence the requirement of Safety. Although Safety was assessed locally as highly important, its global importance was downgraded because its contributors were evaluated as insignificant threats. Nevertheless, targeted safety controls should be implemented, even if the system performs automatically and its route is predefined. Thus, accurate and reliable positioning systems are required. Also, points with a high concentration of people should be avoided. Operators must be carefully selected so that they are fully trained and able to respond immediately to a hazardous situation that is developing negatively. However, flight path optimization should be considered to avoid known obstacles and define a power-efficient route. Finally, measures should be taken to protect the system from wireless attacks. Despite this, the analysis of the illustrative case scenario has shown that wireless attacks and susceptibility to such threats were not among the most important factors, compared to weather conditions and battery efficiency. Literature reviews have shown that cyber-attacks remain a challenge [2,13,46,83]. Countermeasures such as strong authentication algorithms and effective encryption keys should be implemented to protect the communication link between the controller and the airborne component. Most importantly, protection from GPS spoofing or signal jamming should also be applied. Such attacks are likely to occur. According to [12,90,123], wireless attacks, in the form of GPS spoofing or signal jamming, can disrupt the drone’s communication or control systems and sensors, leading to deviations, crashes, unexpected behaviors, and erratic movements. Therefore, measures to counter jamming and spoofing threats are suggested for implementation: anti-jamming add-on devices, embedded software on board the UAV, and resilient positioning, navigation, and timing systems are available on the market for detecting signal navigation threats [138].
6.2. Drone-Based Site Monitoring Scenario
To validate the proposed multi-layer hierarchical model, a second conceptual drone-assisted scenario is illustrated and examined. In this scenario, the mission is exemplified by a drone-based system deployed for disaster site monitoring. The system is required to hover and capture real-time video over a period of time. It is assumed that an earthquake struck a suburban area, collapsing a significant number of residential structures. In addition, it caused damage to some key infrastructure buildings. In the aftermath of the earthquake, a drone-based system is deployed to provide real-time video and images to the first responders in order to help them evaluate the magnitude of the damage. Moreover, nearby rescue teams are assessing the information collected by the system so as to identify potential search areas. The drone is controlled manually by a highly skilled operator capable of managing the system safely and securely. In addition, the operator ensures that the critical zone is covered and also that possibly inaccessible areas are identified and mapped. Moreover, weather conditions are normal, not affecting the flyability of the system. Furthermore, due to the type of the mission, it is required that the system perform data and image analysis on board and stream video in real time. Likewise, reliable communication between the airborne component and the ground control station is established to transmit high-resolution, real-time videos. Figure 8 summarizes the conceptual scenario described above. Also, the image lists potential risk hazards.
Figure 8.
Site monitoring scenario.
We apply the quantitative component by following the steps of the proposed methodology presented in Figure 2. Hierarchy diagram and dependencies between the risk parameters are already presented and analyzed in Section 4.2.3 and depicted in Figure 5. The pairwise comparisons are carried out based on the scenario requirements presented in the previous paragraph. Additionally, comparisons are made in relation to the judgements presented in Section 4.2.3. However, comparing the requirements of the drone-delivery scenario and the requirements of this scenario, it is revealed that there are significant differences that are affecting the scoring of the comparisons. Pairwise comparisons between the risk parameters are facilitated based on the following scoring criteria:
- Assets’ pairwise comparisons: The Airborne Component is still the enabling technology; thus, it is favored over all the other components. Ground Control Station and communication links play a critical role in controlling the drone and transmitting real-time video. Area of operation and Regulations and policies are considered of minor importance compared to the other assets. Environmental conditions are facilitating the system’s flyability and consequently are not favored over all the other assets. Finally, the operator is considered a significant risk parameter since the success of the mission is strongly dependent on their skills and expertise.
- Vulnerabilities’ pairwise comparisons: An ineffective power source is still a key challenge, which is a vulnerability of great concern. Power consumption is of high importance when considering that hovering and live streaming are high-energy-consuming operations. Components such as the Airborne Component, Ground Control Station, and communication link are still vulnerable to failures; therefore, the vulnerability of defective components is considered of major importance. Wrong handling is a considerable factor since the aerial system is manually controlled. Susceptibility to wireless attacks is of minor importance considering that the system operates to support a mission to a damaged area, thus the possibility of adversarial actions is lessened. Susceptibility to weather conditions is an important factor; however, for the specific scenario, it has minimal impact on the operation. Lack or violation of policies and regulations is still considered to be of minimal importance. Faulty operation and lack of operator’s expertise/training/skills are of equal importance compared to wrong handling and compared to each other, as well. However, compared to other vulnerabilities, such as susceptibility to wireless attacks or weather conditions should be considered of some importance (due to the requirements of the specific scenario, i.e., the execution of a wireless attack is not considered for this scenario, and weather conditions facilitating flyability). Finally, susceptibility to adversarial actions is not considered an important factor.
- Threats pairwise comparisons: As in the drone-based delivery scenario, Power Failure and Equipment Failure are critical risk parameters whose effect might involve the entire system; therefore, they are assessed as of essential or strong importance. In contrast to the previous scenario, Control Loss and Unsuccessful Navigation are assessed as of essential or strong importance due to the fact that the system is manually controlled. As for Wireless Attacks, the probability of being executed during the aftermath of a natural disaster is at the lowest possible level. Bearing in mind that the scenario is examined under normal weather conditions, extreme weather conditions are assessed as of some importance depending on the parameters they are compared with. Penultimately, Collision with Objects is a considerable threat. Hovering above or close to damaged terrestrial infrastructures to capture real-time videos requires careful handling and maneuvers in tight spaces. So, the risk of crashing or colliding with an object is probable. Finally, the importance of Physical Attacks targeting hardware components of the system is lessened under the requirements of the specific scenario.
- Requirements’ pairwise comparisons: Confidentiality is related to physical attacks and the disclosure of communication links. Considering that these types of attacks are assessed in the previous paragraph as of minor importance, then confidentiality is also assessed as of minor importance, thus not affecting the system’s performance. In a similar way, Integrity is also assessed as of low importance. As for Availability, which states the readiness of the system is considered as of essential or very strong importance, except if compared to Safety, Survivability, and Maintainability. Regarding safety, its importance relies on its relation to injuries and fatalities. Therefore, it is considered the highest possible order of affirmation over the other requirements. Reliability, which is a key factor that determines the operational efficiency of drones, is closely related to Availability and is assessed in a similar way. When it comes to Maintainability and the easy restoration to normal operating conditions after a hazardous event, it is obvious that its criticality outweighs the importance of the rest of the requirements. Lastly, Survivability takes precedence over the other requirements to guarantee mission accomplishment in contested environments.
Following the process illustrated in Section 4.2.4, the pairwise comparison matrices are established. Comparison numerical values are assigned based on the scenario requirements and the scoring criteria, as these are defined in the previous paragraphs. Then the new local and global weights are calculated. In addition, consistency checks are conducted by calculating the CR values for the newly established matrices. All calculations and processes related to the site-monitoring scenario are executed by following the steps presented in Section 4.2.5, Section 4.2.6 and Section 4.2.7 (Supplementary Material S5 summarizes the established pairwise comparison matrices and presents the calculated local and global weights). Finally, following the final steps of the methodology (see Section 4.3 and Section 4.4), the risk chains for the site-monitoring scenario are defined, and the related cumulative risk contribution is calculated. Table 14 summarizes the 40 most hazardous risk chains.
Table 14.
Disaster site monitoring scenario—40 most hazardous risk chains.
From the analysis of the local weights summarized in Supplementary Material S5, it is deduced that for the site-monitoring scenario, Airborne Component is perceived as the most significant asset at 0.2814, followed closely by the Operator at 0.2099. For the 3rd layer, Ineffective Power Source is shown to be of the highest importance at 0.182, followed closely by High Power Consumption at 0.171. Lack of expertise/skills/training, which is linked to the Operator, is the next most important vulnerability. Regarding the threat sources’ layer, Power Failure was identified to bear more impact than the other elements, with a score of 0.213. In addition, Unsuccessful Navigation, Control Loss, Collision with Objects, and Equipment Failure are prioritized with scores 0.201, 0.104, 0.135, and 0.129, respectively. As for Wireless Attacks, Extreme Weather Conditions, and Physical Attacks, these threats are ranked as the most insignificant compared to the other threats. Finally, in the requirements layer, the elements are ranked from the most significant to the least important as follows: Safety, Survivability, Maintainability, Reliability, Availability, Integrity, and Confidentiality. As shown, the requirement of Safety is perceived as the most critical element with a local weight of 0.286. Regarding the ranking of the risk parameters based on their global importance, the analysis revealed again that there are elements whose importance had been altered. And this happened because of the dependencies between the elements of the hierarchy (see Figure 5) and the propagation of the parent nodes’ weights. In summary, regarding the assets’ layer, the assets’ local weight corresponds to their global weight. Regarding the third layer’s elements, Defective Components, Higher Power Consumption, Wrong Handling, and Ineffective Power Source are perceived as the most important vulnerabilities with a global score of 0.790, 0.663, 0.552, and 0.509, respectively. As for the threat events, Unsuccessful Navigation has the highest global importance among the other threats. Power Failure, Control Loss, and Equipment Failure complete the top four most significant threats. Finally, regarding the requirements, Safety has the highest global importance (0.0214), followed by Availability (0.0141) and Survivability (0.0122).
From the analysis of the data presented in Table 14, it is deduced that Airborne Component and Operator are the leading assets of the illustrated risk chains. The risk chain with the highest cumulative risk contribution is the Airborne Component–High Power Consumption–Unsuccessful Navigation–Safety, with a score of 0.002766. The risk chain Operator–Lack of Expertise/Training/Skills–Unsuccessful Navigation–Safety is the first to appear in the table, which has the Operator as the leading asset (ranked in the fifth place). Its cumulative risk score is 0.001644. Comparing both chains, it is shown that they have Unsuccessful Navigation as a common threat and Safety as a common requirement. Regarding the other chains that involve the Airborne Component, the vulnerabilities of High Power Consumption and Ineffective Power Source are among the highest contributors. As for the chains considering the Operator, the vulnerabilities that are mostly contributing to the cumulative risk are Lack of Expertise/Training/Skills and Faulty Operation. As for the threats that mostly appear in the risk chains presented in Table 14, these include Unsuccessful Navigation, Control Loss, Equipment Failure, and Power Failure. Finally, regarding the requirements, Safety contributes to the most risk chains, followed by the requirement of Survivability.
As can be seen from the above analysis, the Airborne Component is the most important asset of the system. Therefore, measures should be taken to ensure its proper functioning. Apart from that, specific controls should be designed to guarantee that all systems, sub-systems, and sensors embedded on the aircraft should be functionable and interoperable. Additionally, power-related factors are still perceived as important factors that can lead a system to failure. Finally, for a manually controlled system Operator is a significant risk parameter. When combined with inadequate training and expertise, the Operator should be a factor that contributes to accidental incidents with injuries, fatalities, or equipment damage.
6.3. Scenarios’ Comparison—Scoring Sensitivity
To validate the effectiveness of the proposed risk assessment methodology, this study presented two different drone-based application scenarios. A drone-based delivery system is depicted in Figure 4, and a disaster site monitoring drone-based system is presented in Figure 8. Both figures illustrate the basic requirements of the examined scenarios. Comparing the AHP scoring of the risk elements in both scenarios and the cumulative risk contribution of the established risk chains, it is shown that they have differences in evaluating the key risk parameters. This is because of the different requirements and scoring criteria that have been set for each scenario. (See Section 4.2.3 and Section 6.2 for the scoring criteria and requirements of package delivery and sit monitoring scenario, respectively) Figure 9 illustrates a comparison between the local and global weights calculated for both scenarios. The last column of the table, namely ‘Ranking’, represents the ranking of the outlined risk chains for both scenarios, i.e., column under SMS for the site-monitoring scenario and PDS for the package delivery scenario.
Figure 9.
Package delivery–site monitoring scenarios: comparing local and global weights.
As shown, there is a diversity among the calculated local weights in almost all layers. For example, the asset of Environmental Conditions is assessed as of high importance in the delivery scenario, while Operator and Ground Control Station are assessed as of low importance. On the contrary, the Operator and Ground Control Station are considered of high importance in the Site monitoring scenario. Airborne Component has been assessed as of high importance to both scenarios. In a similar way, operator-related vulnerabilities (Lack of Expertise, Wrong Handling, and Faulty Operation) have been evaluated as of low importance in the first scenario, while for the site monitoring scenario having assessed as of high importance. Only power-related vulnerabilities have been assessed as of high importance to both scenarios. In a similar way, threat events have been evaluated and prioritized in a different way. Extreme Weather Conditions and Wireless Attacks have been assessed as of high importance at the delivery scenario, while Unsuccessful Navigation and Control Loss (Operator-related threats) have been assessed as of high importance at the site-monitoring scenario.
Having an insight into the entries of Table 14, it is found that the risk ranking of the outlined risk chains is comparatively different (comparing the SMS and PDS columns). Particularly, it is revealed that AHP scoring (both local and global weights) is affecting the score of the cumulative risk contribution, thus affecting the risk ranking. For instance, assume the risk chain Environmental Conditions–High Susceptibility to Weather Conditions–Power Failure–Survivability, which was evaluated with the highest cumulative risk contribution for the PDS scenario. Based on the AHP scoring of this scenario, the implemented risk parameters are of the highest importance. On the contrary, the same risk chain is ranked 67th according to the other scenarios’ scoring criteria. The reason is that both Environmental Conditions and Susceptibility to Weather Conditions have been ranked as of minor importance. In a similar way, we are examining the risk chain Airborne Component–High Power Consumption–Unsuccessful Navigation–Safety. This chain is ranked as one of the greatest risk contributors for the SMS scenario. Comparing its ranking under the PDS scenario (46th among 147 risk chains), it could be said that the high AHP scoring of Unsuccessful Navigation has pulled up its final ranking. Another representative example of a risk chain whose ranking supports the sensitivity of risk ranking to the AHP scoring is the chain no. 5, Operator–Lack of Expertise/Training/Skills–Unsuccessful Navigation–Safety. All risk parameters involved were assessed as of minor importance under the delivery scenario. For that reason, the particular risk chain was ranked 102nd. However, for the site monitoring scenario in which the specific parameters had a high AHP scoring, the risk contribution of this risk chain has been upgraded. Finally, consider the risk chains ranked 31st and 40th (Table 14, under column ‘SMS’). The contributing risk parameter of extreme weather conditions was ranked as of the highest importance based on the first scenario’s priorities. Therefore, the chain’s ranking under the first scenario was fifth and sixth, respectively. However, the sharp decrease in the AHP weight of Extreme Weather Conditions under the second scenario has pulled down their final ranking.
Summing up, in this study, the risk elements associated with the utilization of a drone-assisted system were identified by implementing a hybrid risk assessment approach. Regarding the applicability of the developed risk assessment framework, the established model can be used as an evaluation tool to assess the risk level of integrating a drone-assisted system into different workflows, such as package delivery, surveillance, and the provision of communication services. Utilizing a drone-assisted system poses several risks related to the area of operation, human administrators, environmental conditions, the type of mission, and the technical specifications of the system. These parameters were correlated in different ways. To this end, the proposed model could be suitable as a guide for understanding and mitigating risks. The risk elements, identified and verified during the application of the proposed framework, could provide personnel (practitioners, technicians, controllers, etc.) with a better understanding of the root causes of risks and how they are interconnected and interrelated. Accordingly, this can promote awareness of the technical, environmental, safety, and security risks that might arise in the utilization of aerial systems.
7. Conclusions and Future Work
This study took a step toward presenting a systematic risk assessment approach for drone-assisted services. It applied a hybrid methodology including steps covering the qualitative analysis (NIST–ISO integration) and quantitative evaluation (a multi-layer hierarchical process based on AHP’s fundamentals) of risks associated with drone services. First, fundamental information on risk assessment and risk was presented. In addition, different approaches employed for risk assessment of aerial systems are reviewed. This background knowledge was utilized to define a simple, functional, easily understandable, and applicable model, suitable for drone-oriented applications, while considering the risk elements of assets, vulnerabilities, threat sources, and impact. The applicability and feasibility of the proposed method were demonstrated by applying it to two different drone-assisted systems, explaining its effectiveness in identifying hazards, evaluating risk elements, and assessing risk events. The use of a multi-criteria hierarchy model defined the propagation of the relative importance of each element across the hierarchy and estimated its global importance. It also empowered the final ranking of the verified risk elements and enabled the identification of the factors that made the greatest contribution to the occurrence of system failure. Additionally, the framework visualized different risk chains, each assessed as a separate entity, constituting a separate risk event. From both scenarios’ analysis, it was validated and deduced that power-related elements appear to be among the most important factors to consider. Most chains involving High Power Consumption, Ineffective Power Source, and Power Failure were listed among the weightiest risk chains. Therefore, considering the manufacturers’ technical recommendations, adjusting the drone’s speed and altitude while flying, defining the acceptable margins of power consumption, and maintaining a safe energy threshold are the best practices for safeguarding the system’s performance. Moreover, the Airborne Component was another risk factor contributing to the increase in exposure to hazardous situations. Filtering the most significant risk chains revealed that the airborne component influenced 16 (package delivery scenario) and 22 (site monitoring scenario) risk chains, respectively. As for the weather-related factors were the greatest contributors to risk under the first scenario. Environmental Conditions, Susceptibility to Weather Conditions, and Extreme Weather Conditions were the leading elements of the aggregated risk. In addition, they influence the majority of the 40 most significant risk chains. Moreover, temperatures above 40 °C, rainy and windy conditions are parameters decreasing battery efficiency, thus should be considered before deploying an aerial system. Therefore, drone-assisted projects require strict pre-flight environmental assessments. Regarding the Communications Links, it seems that their involvement with the system’s risk is limited only to wireless attacks and weather conditions, since they influence a limited number of the hazardous risk chains. Nonetheless, communication channels are outlined as a critical component, especially in cases of manual control, and are vulnerable to sophisticated attacks. Therefore, effective authentication and security mechanisms must be implemented. Closing, regarding the requirements, Survivability seemed to be prominent (influencing a considerable number of risk chains) and powered by influential threats such as Power Failure and Weather Conditions. Consequently, taking power- and weather-related controls should increase the system’s resilience and decrease the impact on the system’s performance in the case of a hazardous event. In addition, Safety is another requirement that should be considered when deploying a drone-based system. Especially when the system is manually controlled, the employment of highly skilled operators should ensure the functional performance of the system.
Although the proposed risk assessment approach may have the potential to strengthen both the conceptual and functional skills of experts, future work will extend its applicability to different drone-based applications. The factors involved in the risk assessment of drone-assisted systems vary. Owing to their dynamic nature, it is suggested that practitioners involve the proposed framework by adjusting the relative weights and evaluating the resulting risk contributions, according to the planned applications and use cases. In addition, future work will implement an experimental evaluation of the framework, including simulation tests to support the findings summarized above. Therefore, to obtain more effective results, in our future work, we intend to evaluate the weightiest risk contributors under different scenarios by assessing the effect of temperature, atmospheric conditions, characteristics of the area of operation, characteristics and type of the mission, technical characteristics of the drone, battery, and energy consumption. The proposed framework, along with the simulation tests, is expected to serve as a useful, complementary tool that can be easily modified and adjusted to different applications and various types of aerial systems. Apart from that, combining AHP scoring with probabilistic modeling (BN) should potentially create a more robust risk analysis tool for quantifying dynamically changing failure scenarios. Therefore, to build on this study, future work will involve applying BN to facilitate a comparative analysis of prospective outcomes with the present results.
Supplementary Materials
The following supporting information can be downloaded at: https://www.mdpi.com/article/10.3390/drones10050370/s1. Supplementary Material S1: Qualitative analysis; Supplementary Material S2: Pairwise comparison matrices; Supplementary Material S3: Global weights; Supplementary Material S4: Risk chains—risk contribution; Supplementary Material S5: Site monitoring scenario: pairwise comparison matrices. References [2,13,21,77,90,92,127,128,129,130,132,133,135,136], are cited in Supplementary Material S1.
Author Contributions
Conceptualization, N.F.; methodology and validation, N.F.; writing, N.F.; review, editing, and supervision, K.K., S.K. and H.A. All authors have read and agreed to the published version of the manuscript.
Funding
This research received no external funding.
Data Availability Statement
The original contributions presented in this study are included in the article/Supplementary Material. Further inquiries can be directed to the corresponding author.
Conflicts of Interest
The authors declare no conflicts of interest.
References
- Allouch, A.; Koubâa, A.; Khalgui, M.; Abbes, T. Qualitative and Quantitative Risk Analysis and Safety Assessment of Unmanned Aerial Vehicles Missions Over the Internet. IEEE Access 2019, 7, 53392–53410. [Google Scholar] [CrossRef] [Scilit]
- Shakhatreh, H.; Sawalmeh, A.H.; Al-Fuqaha, A.; Dou, Z.; Almaita, E.; Khalil, I.; Othman, N.S.; Khreishah, A.; Guizani, M. Unmanned Aerial Vehicles (UAVs): A Survey on Civil Applications and Key Research Challenges. IEEE Access 2019, 7, 48572–48634. [Google Scholar] [CrossRef] [Scilit]
- Katzis, K.; Ahmadi, H.; Shakir, M.Z. A Novel Airborne Self-Organising Architecture for 5G+ Networks. In Proceedings of the 2017 IEEE 86th Vehicular Technology Conference (VTC-Fall); IEEE: Piscataway, NJ, USA, 2017. [Google Scholar] [CrossRef] [Scilit]
- Join the Airborne Revolution. Day and Night. Whatever the Weather. ALLSOPP HELIKITES LTD. Available online: https://www.helikites.com/ (accessed on 7 December 2025).
- Katzis, K.; Grondoudis, A. Disaster Monitoring and Disaster Relief Using High Altitude Platforms. In Proceedings of the 1st International Conference in Safety Crisis Management, Nicosia, Cyprus, 24–28 June 2011. [Google Scholar]
- Reynaud, L.; Rasheed, T. Deployable Aerial Communication Networks: Challenges for Futuristic Applications. In Proceedings of the 9th ACM Symposium on Performance Evaluation of Wireless Ad Hoc, Sensor, and Ubiquitous Networks, Paphos, Cyprus; Association for Computing Machinery: New York, NY, USA, 2012. [Google Scholar] [CrossRef] [Scilit]
- Saeed, A.; Younes, A.B.; Cai, C.; Cai, G. A Survey of Hybrid Unmanned Aerial Vehicles. Prog. Aerosp. Sci. 2018, 98, 91–105. [Google Scholar] [CrossRef] [Scilit]
- Katzis, K.; Grondoudis, A.; Boustras, G.; Papazoglou, P. Forest Fires: Proactive and Reactive Surveillance Employing in-Situ, Aerial, and Space Technology. In International Conference on Remote Sensing and Geoinformation of Environment, Paphos, Cyprus; SPIE: Bellingham, WA, USA, 2013. [Google Scholar] [CrossRef] [Scilit]
- Helikite Airborne Surveillance Systems. Allsopp Helikites Ltd. Available online: https://www.helikites.com/aerial-surveillance-aerostats (accessed on 21 November 2025).
- Borghetti, F.; Caballini, C.; Carboni, A.; Grossato, G.; Maja, R.; Barabino, B. The Use of Drones for Last-Mile Delivery: A Numerical Case Study in Milan, Italy. Sustainability 2022, 14, 1766. [Google Scholar] [CrossRef] [Scilit]
- Zubin, I.; Wiegmans, B.; Arem, B.; Duin, R. Using Drones in the Last-Mile Logistics Processes of Medical Product Delivery: A Feasibility Case Study in Rotterdam. In Proceedings of the 99th Annual Meeting Transportation Research Board, Washington, DC, USA, 12–16 January 2020. [Google Scholar]
- Kim, A.; Wampler, B.; Goppert, J.; Hwang, I.; Aldridge, H. Cyber Attack Vulnerabilities Analysis for Unmanned Aerial Vehicles. In Proceedings of the Infotech@Aerospace 2012, Garden Grove, CA, USA, 19–21 June 2012. [Google Scholar] [CrossRef] [Scilit]
- Anagnostis, I.; Kotzanikolaou, P.; Douligeris, C. Understanding and Securing the Risks of Uncrewed Aerial Vehicle Services. IEEE Access 2025, 13, 47955–47995. [Google Scholar] [CrossRef] [Scilit]
- Kardasz, P.; Doskocz, J.; Hejduk, M.; Wiejkut, P.; Zarzycki, H. Drones and Possibilities of Their Using. J. Civ. Environ. Eng. 2016, 6, 1000233. [Google Scholar] [CrossRef]
- Hartmann, K.; Steup, C. The Vulnerability of UAVs to Cyber Attacks—An Approach to the Risk Assessment. In 5th International Conference on Cyber Conflict (CyCon), Tallin; IEEE: Talin, Estonia, 2013; pp. 1–23. [Google Scholar]
- Barr, L.C.; Newman, R.; Ancel, E.; Belcastro, C.M.; Foster, J.V.; Evans, J.; Klyde, D.H. Preliminary Risk Assessment for Small Unmanned Aircraft Systems. In 17th AIAA Aviation Technology, Integration, and Operations Conference; AIAA: Denver, Colorado, 2017. [Google Scholar] [CrossRef] [Scilit]
- Guo, R.; Tian, J.; Wang, B.; Shang, F. Cyber-Physical Attack Threats Analysis for UAVs from CPS Perspective. In 2020 International Conference on Computer Engineering and Application (ICCEA), Guangzhou, China; IEEE: Piscataway, NJ, USA, 2020; pp. 259–263. [Google Scholar] [CrossRef] [Scilit]
- Shakeri, R.; Al-Garadi, M.A.; Badawy, A.; Mohamed, A.; Khattab, T.; Al-Ali, A.; Harras, K.A.; Guizani, M. Design Challenges of Multi-UAV Systems in Cyber-Physical Applications: A Comprehensive Survey and Future Directions. IEEE Commun. Surv. Tutor. 2019, 21, 3340–3385. [Google Scholar] [CrossRef] [Scilit]
- Gomes, R.; Straub, J.; Jones, A.; Morgan, J.; Tipparach, S.; Sletten, A.; Kim, K.W.; Loegering, D.; Feikema, N.; Dayananda, K.; et al. An Interconnected Network of UAS as a System-of-Systems. In 2017 IEEE/AIAA 36th Digital Avionics Systems Conference (DASC); IEEE: St. Petersburg, FL, USA, 2017; pp. 1–7. [Google Scholar] [CrossRef] [Scilit]
- Ross, R. Managing Information Security Risk: Organization, Mission, and Information System View (NIST Special Publication 800-39); National Institute of Standards and Technology NIST: Gaithersburg, MD, USA, 2011.
- Joint Task Force Transformation Initiative. Guide for Conducting Risk Assessments (NIST Special Publication 800-30); National Institute of Standards and Technology (NIST): Gaithersburg, MD, USA, 2012.
- ISO/IEC 27005; Information Security, Cybersecurity and Privacy Protection—Guidance on Managing Information Security Risks. ISO: Geneva, Switzerland, 2022.
- Eckmaier, R.; Fumy, W.; Mouille, S.; Quemard, J.-P.; Polemi, N.; Rumpel, R. ENISA Risk Management Standards; ENISA: Brussels, Belgium, 2022. [Google Scholar]
- EBIOS—Risk Manager; National Cybersecurity Agency of France (ANSSI): Paris, French, 2019; Available online: https://messervices.cyber.gouv.fr/guides/en-ebios-risk-manager-method#collection (accessed on 23 March 2026).
- Alberts, C.; Dorofee, A.; Stevens, J.; Woody, C. Introduction to OCTAVE Approach; Carnegie Mellon University: Pittsburgh, PA, USA, 2003. [Google Scholar]
- CRAMM. Wikipedia. Available online: https://en.wikipedia.org/wiki/CRAMM (accessed on 14 October 2025).
- Jones, J.A.; Hutton, A. Risk Taxonomy; The Open Group: Berkshire, UK, 2009. [Google Scholar]
- Talabis, M.R.M.; Martin, J.L.; Wheeler, E. Information Security Risk Assessment Toolkit: Practical Assessments through Data Collection and Data Analysis; Elsevier Inc.: Waltham, MA, USA, 2013. [Google Scholar] [CrossRef] [Scilit]
- Specific Operations Risk Assessment. Available online: https://drones.gov.cy/gr/sora-risk-assessment/ (accessed on 13 October 2025).
- Specific Operations Risk Assessment (SORA). Available online: https://www.easa.europa.eu/en/domains/drones-air-mobility/operating-drone/specific-category-civil-drones/specific-operations-risk-assessment-sora#group-easa-downloads (accessed on 14 October 2025).
- Yazar, Z. A Qualitative Risk Analysis and Management Tool—CRAMM; SANS: North Bethesda, MD, USA, 2022. [Google Scholar]
- Dittrich, J. Guidelines on Specific Operation Risk Assessment (SORA); JARUS: Birmingham, UK, 2024. [Google Scholar]
- Shang, K.; Hossen, Z. Applying Fuzzy Logic to Risk Assessment and Decision-Making; Casualty Actuarial Society: Arlington, VA, USA; Canadian Institute of Actuaries: Ottawa, ON, Canada; Society of Actuaries: Chicago, IL, USA, 2013. [Google Scholar]
- Wang, J.; Fan, K.; Mo, W.; Xu, D. A Method for Information Security Risk Assessment Based on the Dynamic Bayesian Network. In International Conference on Networking and Network Applications (NaNA), Hakodate, Japan; IEEE: Piscataway, NJ, USA, 2016; pp. 279–283. [Google Scholar] [CrossRef] [Scilit]
- Shapiro, A.F.; Marie-Claire, K. Risk Assessment Applications of Fuzzy Logic; Canadian Institute of Actuaries: Ottawa, ON, Canada; Society of Actuaries: Chicago, IL, USA; Casualty Actuarial Society: Arlington, VA, USA, 2015. [Google Scholar]
- Alali, M.; Almogren, A.; Rassan, I.; Bhuiyan, Z.A.; Hassan, M. Improving Risk Assessment Model of Cyber Security Using Fuzzy Logic Inference System. Comput. Secur. 2018, 74, 323–339. [Google Scholar] [CrossRef] [Scilit]
- Lee, M.-C. Information Security Risk Analysis Methods and Research Trends: AHP and Fuzzy Comprehensive Method. Int. J. Comput. Sci. Inf. Technol. (IJCSIT) 2014, 6, 29–45. [Google Scholar] [CrossRef] [Scilit]
- Safety Management Systems (SMS) for Airports and Airport Projects. Available online: https://www.faa.gov/airports/airport_safety (accessed on 24 October 2025).
- Gonçalves, P.; Sobral, J.; Ferreira, L. Unmanned Aerial Vehicle Safety Assessment Modelling through Petri Nets. Reliab. Eng. Syst. Saf. 2017, 167, 383–393. [Google Scholar] [CrossRef] [Scilit]
- Ferrigan, J. Safety Risk Assessment for UAV Operation; AeroTract Geospatial: Albany, OR, USA, 2022. [Google Scholar]
- DJI Agras T30,” DJI Sciences and Technologies Ltd. Available online: https://www.dji.com/global/t30 (accessed on 22 December 2025).
- Neff, P.; Garman, K. Identifying and Mitigating Human Factors Errors in Unmanned Aircraft Systems. In Proceedings of the 16th AIAA Aviation Technology, Integration, and Operations Conference; American Institute of Aeronautics and Astronautics (AIAA): Reston, VA, USA, 2016. [Google Scholar] [CrossRef] [Scilit]
- Sankararaman, S.; Krishnakumar, K. Towards A Computational Framework for Autonomous Decision-Making in Unmanned Aerial Vehicles. In AIAA Information Systems-AIAA Infotech at Aerospace, Texas; American Institute of Aeronautics and Astronautics (AIAA): Reston, VA, USA, 2017. [Google Scholar] [CrossRef] [Scilit]
- Johnsen, S.; Evjemo, T.E. State of the Art of Unmanned Aircraft Transport Systems in Industry Related to Risks, Vulnerabilities and Improvement of Safety. In Proceedings of the 29th International European Safety and Reliability Conference, Hannover, Germany; Research Publishing Services: Tamil Nadu, India, 2019. [Google Scholar] [CrossRef] [Scilit]
- Ancel, E.; Capristan, F.M.; Foster, J.V. Real-Time Risk Assessment Framework for Unmanned Aircraft System (UAS) Traffic Management (UTM). In Proceedings of the 17th AIAA Aviation Technology, Integration, and Operations Conference, Denver, Colorado; American Institute of Aeronautics and Astronautics (AIAA): Reston, VA, USA, 2017. [Google Scholar] [CrossRef] [Scilit]
- Javaid, A.Y.; Sun, W.; Devabhaktuni, V.K.; Alam, M. Cyber Security Threat Analysis and Modeling of an Unmanned Aerial Vehicle System. In Proceedings of the IEEE Conference on Technologies for Homeland Security (HST); IEEE: Waltham, MA, USA, 2012; pp. 584–590. [Google Scholar] [CrossRef] [Scilit]
- Moud, H.I.; Shojaei, A.; Flood, I.; Zhang, X. Monte Carlo Based Risk Analysis of Unmanned Aerial Vehicle Flights over Construction Job Sites. In Proceedings of the 9th International Conference on Simulation and Modeling Methodologies, Technologies and Applications, Porto, Portugal; SciTePress: Setúbal, Portugal, 2018. [Google Scholar] [CrossRef] [Scilit]
- Izadi, H.M.; Shojaei, A.; Flood, I.; Zhang, X.; Hatami, M. Qualitative and Quantitative Risk Analysis of Unmanned Aerial Vehicle Flights over Construction Job Sites. In Proceedings of the Eighth International Conference on Advanced Communications and Computation (INFOCOMP) 2018, Barcelona, Spain; ThinkMind Digital Library: Valencia, Spain, 2018. [Google Scholar]
- Aliyari, M.; Ashrafi, B.; Ayele, Y.Z. Hazards Identification and Risk Assessment for UAV–Assisted Bridge Inspections. Struct. Infrastruct. Eng. 2021, 18, 421–428. [Google Scholar] [CrossRef] [Scilit]
- Xu, Y.; Turkan, Y. The Development of a Safety Assessment Model for Using Unmanned Aerial Systems (UAS) in Construction. Saf. Sci. 2022, 155, 105893. [Google Scholar] [CrossRef] [Scilit]
- Wang, L.; Maoran, Z.; Li, N. A Bayesian Network Approach for Systemic Risk Analysis in Unmanned Aerial Vehicle (UAV) Operations. Sci. Rep. 2026, 16, 13546. [Google Scholar] [CrossRef] [Scilit]
- Kaplan, S.; Garrick, J.B. On the Quantitative Definition of Risk. Risk Anal. 1981, 1, 11–27. [Google Scholar] [CrossRef] [Scilit]
- Tweneboah-Koduah, S.; Buchanan, W.J. Security Risk Assessment of Critical Infrastructure Systems: A Comparative Study. Comput. J. 2018, 61, 1389–1406. [Google Scholar] [CrossRef] [Scilit]
- Glossary, National Institute of Standards and Technology. Available online: https://csrc.nist.gov/glossary/term/asset (accessed on 28 October 2025).
- Skondras, N.; Tsesmelis, D.; Vasilakou, C.; Karavitis, C. Resilience–Vulnerability Analysis: A Decision-Making Framework for Systems Assessment. Sustainability 2020, 12, 9306. [Google Scholar] [CrossRef] [Scilit]
- Nyerges, T.; Gallo, J.; Reynolds, K.; Prager, S.; Murphy, P.; Li, W. Framing VRRSability Relationships among Vulnerability, Risk, Resilience, and Sustainability for Improving Geo-Information Evaluations within Geodesign Decision Support. Int. J. Geo-Inf. 2024, 13, 67. [Google Scholar] [CrossRef] [Scilit]
- Saaty, T.L. The Analytic Hierarchy Process; McGraw-Hill: New York, NY, USA, 1980. [Google Scholar]
- Aminbakhsh, S.; Gunduz, M.G.; Sonmez, R. Safety Risk Assessment Using Analytic Hierarchy Process (AHP) during Planning and Budgeting of Construction Projects. J. Saf. Res. 2013, 46, 99–105. [Google Scholar] [CrossRef] [Scilit] [PubMed]
- Saaty, R.W. The Analytic Hierarchy Process—What It Is and How It Is Used. Math. Model. 1987, 9, 161–176. [Google Scholar] [CrossRef] [Scilit]
- Vaidya, O.S.; Kumar, S. Analytic Hierarchy Process: An Overview of Applications. Eur. J. Oper. Res. 2006, 169, 1–29. [Google Scholar] [CrossRef] [Scilit]
- Cheng, E.W.; Li, H. Analytic Hierarchy Process: An Approach to Determine Measures for Business Performance. Meas. Bus. Excell. 2001, 5, 30–37. [Google Scholar] [CrossRef] [Scilit]
- Shin, D.W.; Shin, Y.; Kim, G.H. Comparison of Risk Assessment for a Nuclear Power Plant Construction Project Based on Analytic Hierarchy Process and Fuzzy Analytic Hierarchy Process. J. Build. Constr. Plan. Res. 2016, 4, 157–171. [Google Scholar] [CrossRef]
- Siddayao, G.; Valdez, S.E.; Fernandez, P.L. Analytic Hierarchy Process (AHP) in Spatial Modeling for Floodplain Risk Assessment. Int. J. Mach. Learn. Comput. 2014, 4, 450–457. [Google Scholar] [CrossRef] [Scilit]
- Hsiao, L.-S.; Huang, C.-J.; Liu, H.-T.; Lin, I.-L. An AHP-Based Assessment of the Relative Importance of Risk Factors in Project Management: Designing a Bid Preparation Checklist. Systems 2025, 13, 328. [Google Scholar] [CrossRef] [Scilit]
- Mustafa, M.A.; Al-Bahar, J. Project Risk Assessment Using the Analytic Hierarchy Process. IEEE Trans. Eng. Manag. 1991, 38, 46–52. [Google Scholar] [CrossRef] [Scilit]
- Canco, I.; Kruja, D.; Iancu, T. AHP, a Reliable Method for Quality Decision Making: A Case Study in Business. Sustainability 2021, 13, 13932. [Google Scholar] [CrossRef] [Scilit]
- Yang, H.; Chen, P.; Huang, Y.; Ma, J.; Guo, F.; Yu, H.; Xu, W.; Han, L.; Cao, H. Research on Real Time Risk Monitoring System of Airline Operation Based on AHP. In Proceedings of the IEEE International Conference on Computer Science and Educational Informatization (CSEI), Kunming, China; IEEE: Piscataway, NJ, USA, 2019. [Google Scholar] [CrossRef] [Scilit]
- Peng, G.; Han, L.; Liu, Z.; Guo, Y.; Yan, J.; Jia, X. Application of Fuzzy Analytic Hierarchy Process in Risk Evaluation Model. Front. Psychol. 2021, 12, 715003. [Google Scholar] [CrossRef] [Scilit]
- Putra, A.; Soewito, B. Integrated Methodology for Information Security Risk Management Using ISO 27005:2018 and NIST SP 800-30 for Insurance Sector. Int. J. Adv. Comput. Sci. Appl. 2023, 14, 625–633. [Google Scholar] [CrossRef] [Scilit]
- Fikri, A.M.; Putra, F.A.; Suryanto, Y.; Ramli, K. Risk Assessment Using NIST SP 800-30 Revision 1 and ISO 27005 Combination Technique in Profit-Based Organization: Case Study of ZZZ Information System Application in ABC Agency. Procedia Comput. Sci. 2019, 61, 1206–1215. [Google Scholar] [CrossRef] [Scilit]
- Setiawan, H.; Putra, F.A.; Pradana, A.R. Design of Information Security Risk Management Using ISO/IEC 27005 and NIST SP 800-30 Revision 1: A Case Study at Communication Data Applications of XYZ Institute. In Proceedings of the 2017 International Conference on Information Technology Systems and Innovation (ICITSI), Bandung, Indonesia; IEEE: Piscataway, NJ, USA, 2017. [Google Scholar] [CrossRef] [Scilit]
- Calik, I.; Kerim, K.; Onur, Ş. Life Cycle Risk Management for Improving Labor Productivity in Construction Projects in Türkiye. Buildings 2025, 15, 484. [Google Scholar] [CrossRef] [Scilit]
- Bamakan, S.M.H.; Dehghanimohammadabadi, M. A Weighted Monte Carlo Simulation Approach to Risk Assessment of Information Security Management System. Int. J. Enterp. Inf. Syst. 2016, 11, 63–78. [Google Scholar] [CrossRef] [Scilit]
- Xiao, L.; Qi, Y.; Li, Q. Information Security Risk Assessment Based on Analytic Hierarchy Process and Fuzzy Comprehensive. In Proceedings of the International Conference on Risk Management & Engineering Management, Beijing, China; IEEE: Piscataway, NJ, USA, 2008; pp. 404–409. [Google Scholar] [CrossRef] [Scilit]
- Thompson, A.; Alese, B.; Folasade, A.; Ayeni, O. Information Security Risk Analysis Using Analytic Hierarchy Process and Fuzzy Comprehensive Evaluation. Int. J. Comput. Sci. Inf. Secur. (IJCSIS) 2020, 18, 36–45. [Google Scholar]
- Fu, S.; Zhou, H. The Information Security Risk Assessment Based on AHP and Fuzzy Comprehensive Evaluation. In Proceedings of the IEEE 3rd International Conference on Communication Software and Networks, Xi’an, China; IEEE: Piscataway, NJ, USA, 2011; pp. 124–128. [Google Scholar] [CrossRef] [Scilit]
- Tsai, H.-Y.; Huang, Y.-L. An Analytic Hierarchy Process-Based Risk Assessment Method for Wireless Networks. IEEE Trans. Reliab. 2011, 60, 801–816. [Google Scholar] [CrossRef] [Scilit]
- Zhao, Y.; Jiao, J.; Zhao, T. A Synthetic Risk Assessment Model Based on AHP. In Reliability and Maintainability Symposium, Colorado Springs, CO, USA; IEEE: Piscataway, NJ, USA, 2014; pp. 1–6. [Google Scholar] [CrossRef] [Scilit]
- Kobaszyńska-Twardowska, A.; Łukasiewicz, J.; Sielicki, P.W. Risk Management Model for Unmanned Aerial Vehicles during Flight Operations. Materials 2022, 15, 2448. [Google Scholar] [CrossRef] [Scilit]
- Li, X.; Sun, X.; Fang, M. Risk Assessment of Unmanned Aerial Vehicle (UAV) Operations Based on Bayesian Network. In Proceedings of the 2022 2nd International Conference on Big Data, Artificial Intelligence and Risk Management (ICBAR), Xi’an, China; IEEE: Piscataway, NJ, USA, 2022; pp. 189–193. [Google Scholar] [CrossRef] [Scilit]
- Du, S.; Zhong, G.; Wang, F.; Pang, B.; Zhang, H.; Jiao, Q. Safety Risk Modelling and Assessment of Civil Unmanned Aircraft System Operations: A Comprehensive Review. Drones 2024, 8, 354. [Google Scholar] [CrossRef] [Scilit]
- Benarbia, T.; Kyamakya, K. A Literature Review of Drone-Based Package Delivery Logistics Systems and Their Implementation Feasibility. Sustainability 2022, 14, 360. [Google Scholar] [CrossRef] [Scilit]
- Mohsan, S.A.H.; Khan, M.A.; Noor, F.; Ullah, I.; Alsharif, M.H. Towards the Unmanned Aerial Vehicles (UAVs): A Comprehensive Review. Drones 2022, 6, 147. [Google Scholar] [CrossRef] [Scilit]
- Derhab, A.; Cheikhrouhou, O.; Allouch, A.; Koubaa, A.; Qureshi, B.; Ferrag, M.A.; Maglaras, L.; Khan, F. Internet of Drones Security: Taxonomies, Open Issues, and Future Directions. Veh. Commun. 2023, 39, 100552. [Google Scholar] [CrossRef] [Scilit]
- Ordoukhanian, E.; Madni, A. Resilient Multi-UAV Operation: Key Concepts and Challenges. In Proceedings of the AIAA Science and Technology Conference and Expo; AIAA: Reston, VA, USA, 2016. [Google Scholar] [CrossRef] [Scilit]
- Fitrikananda, B.P.; Jenie, Y.I.; Sasongko, R.A.; Muhammad, H. Risk Assessment Method for UAV’s Sense and Avoid System Based on Multi-Parameter Quantification and Monte Carlo Simulation. Aerospace 2023, 10, 781. [Google Scholar] [CrossRef] [Scilit]
- Susini, A. A Technocritical Review of Drones Crash Risk Probabilistic Consequences and Its Societal Acceptance. In Risk Information Management, Risk Models and Applications (RIMMA), Berlin; RIMMA: Borehamwood, UK, 2015; Volume 7, pp. 27–38. [Google Scholar]
- Ficco, M.; Granata, D.; Palmieri, F.; Rak, M. A Systematic Approach for Threat and Vulnerability Analysis of Unmanned Aerial Vehicles. Internet Things 2024, 26, 101180. [Google Scholar] [CrossRef] [Scilit]
- Kumar, S.; Tiwari, A.; Ahirwar, Y.; Kumar, G.; Arafat, M.Y. The Rise of UAV-Based Smart Surveillance: A Systematic Review of Trends and Technologies. IEEE Access 2025, 13, 181553–181575. [Google Scholar] [CrossRef] [Scilit]
- Tsao, K.-Y.; Gilder, T.; Vassilakis, V.G. A Survey of Cyber Security Threats and Solutions for UAV Communications and Flying Ad-Hoc Networks. Ad Hoc Networks 2022, 133, 102894. [Google Scholar] [CrossRef] [Scilit]
- Chitta, S.; Jain, R. Last Mile Delivery Using Drones. In Proceedings of the Technology Convergence, Innovation & Decision Sciences; The Bank of Korea: Seoul, Republic of Korea, 2017. [Google Scholar]
- Saripalli, P.; Walters, B. QUIRC: A Quantitative Impact and Risk Assessment Framework for Cloud Security. In Proceedings of the IEEE 3rd International Conference on Cloud Computing, Miami, FL, USA; IEEE: Piscataway, NJ, USA, 2010; pp. 280–288. [Google Scholar] [CrossRef] [Scilit]
- Pant, S.; Kumar, A.; Ram, M.; Klochkov, Y.; Sharma, H.K. Consistency Indices in Analytic Hierarchy Process: A Review. Mathematics 2022, 10, 1206. [Google Scholar] [CrossRef] [Scilit]
- Koulinas, G.; Marhavilas, P.K.; Demesouka, O.; Vavatsikos, A. Risk Analysis and Assessment in the Worksites Using the Fuzzy-Analytical Hierarchy Process and a Quantitative Technique—A Case Study for the Greek Construction Sector. Saf. Sci. 2019, 112, 96–104. [Google Scholar] [CrossRef] [Scilit]
- Szabo, Z.K.; Szádoczki, Z.; Bozóki, S.; Stănciulescu, G.C.; Szabo, D. An Analytic Hierarchy Process Approach for Prioritisation of Strategic Objectives of Sustainable Development. Sustainability 2021, 13, 2254. [Google Scholar] [CrossRef] [Scilit]
- Li, N.; Liu, X.; Yu, B.; Li, L.; Xu, J.; Tan, Q. Study on the Environmental Adaptability of Lithium-Ion Battery Powered UAV under Extreme Temperature Conditions. Energy 2021, 219, 119481. [Google Scholar] [CrossRef] [Scilit]
- 4 Factors That Impact Drone Flight Times. Agri Spray Drones. Available online: https://agrispraydrones.com/blogs/news/4-factors-that-impact-drone-flight-times (accessed on 14 January 2026).
- Callahan, M.A.; Sexton, K. If Cumulative Risk Assessment Is the Answer, What Is the Question? Environ. Health Perspect. 2007, 115, 799–806. [Google Scholar] [CrossRef] [Scilit]
- Callahan, M.A. Framework for Cumulative Risk Assessment; U.S. Environmental Protection Agency (EPA): Washington, DC, USA, 2003.
- Vafaei, N.; Ribeiro, R.; Camarinha-Matos, L.M. Normalization Techniques for Multi-Criteria Decision Making: Analytical Hierarchy Process Case Study. In Proceedings of the IFIP Advances in Information and Communication Technology, Costa de Caparica, Portugal; Springer: Berlin/Heidelberg, Germany, 2016. [Google Scholar] [CrossRef] [Scilit]
- Trung, D.D. Development of Data Normalization Methods for Multi-Criteria Decision Making: Applying for MARCOS Method. Manuf. Rev. 2022, 9, 22. [Google Scholar] [CrossRef] [Scilit]
- Delivery Drones Market Report. 2026. Available online: https://www.thebusinessresearchcompany.com/report/delivery-drones-global-market-report (accessed on 22 January 2026).
- Yang, H.; Lee, Y.; Jeon, S.-Y.; Lee, D. Multi-Rotor Drone Tutorial: Systems, Mechanics, Control and State Estimation. Intell. Serv. Robot. 2017, 10, 79–93. [Google Scholar] [CrossRef] [Scilit]
- Alkouz, B.; Shahzaad, B.; Bouguettaya, A. Service-Based Drone Delivery. In Proceedings of the IEEE 7th International Conference on Collaboration and Internet Computing (CIC), Atlanta, GA, USA; IEEE: Piscataway, NJ, USA, 2021; pp. 68–76. [Google Scholar] [CrossRef] [Scilit]
- Ghamari, M.; Rangel, P.; Mehrubeoglu, M.; Tewolde, G.S.; Sherratt, R.S. Unmanned Aerial Vehicle Communications for Civil Applications: A Review. IEEE Access 2022, 10, 102492–102531. [Google Scholar] [CrossRef] [Scilit]
- Anbaroglu, B. Parcel Delivery In An Urban Environment Using Unmanned Aerial Systems: A Vision Paper. In Proceedings of the ISPRS Annals of Photogrammetry, Remote Sensing and Spatial Information Sciences; Copernicus Publications: Göttingen, Germany, 2017; pp. 73–79. [Google Scholar] [CrossRef] [Scilit]
- Hossain, N.U.I.; Lutfi, M.; Ahmed, I.; Akundi, A.; Cobb, D. Modeling and Analysis of Unmanned Aerial Vehicle System Leveraging Systems Modeling Language (SysML). Systems 2022, 10, 264. [Google Scholar] [CrossRef] [Scilit]
- Barros, J.; Henriques, J.; Reis, J.; Rosado, D.P.; Melao, N. Unmanned Aerial Systems: A Systematic Literature Review. In Information Technology and Systems; Springer: Temuco, Chile, 2024; pp. 82–93. [Google Scholar] [CrossRef] [Scilit]
- Osmani, K.; Schulz, D. Comprehensive Investigation of Unmanned Aerial Vehicles (UAVs): An In-Depth Analysis of Avionics Systems. Sensors 2024, 24, 3064. [Google Scholar] [CrossRef] [Scilit]
- El Safany, R.; Bromfield, M. A Human Factors Accident Analysis Framework for UAV Loss of Control in Flight. Aeronaut. J. 2025, 129, 1723–1749. [Google Scholar] [CrossRef] [Scilit]
- UAS Regulations: Common European Rules for UAS. Available online: https://drones.gov.cy/regulations/ (accessed on 26 January 2026).
- Xu, C.; Liao, X.; Tan, J.; Ye, H.; Lu, H. Recent Research Progress of Unmanned Aerial Vehicle Regulation Policies and Technologies in Urban Low Altitude. IEEE Access 2020, 8, 74175–74194. [Google Scholar] [CrossRef] [Scilit]
- Gao, M.; Hugenholtz, C.; Fox, T.; Kucharczyk, M.; Barchyn, T.; Nesbit, P. Weather Constraints on Global Drone Flyability. Sci. Rep. 2021, 11, 12092. [Google Scholar] [CrossRef] [Scilit] [PubMed]
- Why Your Drone Battery Life Is Getting Shorter (and How to Fix It). Available online: https://www.ctechigroup.com/why-your-drone-battery-life-is-getting-shorter-and-how-to-fix-it.html (accessed on 13 January 2025).
- Lv, S.; Wang, X.; Lu, W.; Zhang, J.Z.; Ni, H. The Influence of Temperature on the Capacity of Lithium Ion. Energies 2022, 15, 60. [Google Scholar] [CrossRef] [Scilit]
- Wawrzyn, D. Some Helpful Tips for Maximizing Your Drone’s Battery Life. Available online: https://www.propelleraero.com/blog/some-helpful-tips-for-maximizing-your-drones-battery-life/ (accessed on 13 January 2025).
- Zhang, J.; Campbell, J.F.; Sweeney, D.C.; Hupman, A.C. Energy Consumption Models for Delivery Drones: A Comparison and Assessment. Transp. Res. Part D Transp. Environ. 2021, 90, 102668. [Google Scholar] [CrossRef] [Scilit]
- Akram, N.; Khoshrangbaf, M.; Challenger, M.; Dagdeviren, O. Energy Consumption Modeling and Flight Time Analysis of Micro Drones. IEEE Access 2025, 13, 109854–109866. [Google Scholar] [CrossRef] [Scilit]
- Benson, T. Aerodynamics Index. Available online: https://www.grc.nasa.gov/www/k-12/VirtualAero/BottleRocket/airplane/drageq.html (accessed on 21 March 2026).
- Susi, J.; Unt, K.-E.; Heering, S. Determining the Efficiency of Small-Scale Propellers via Slipstream Monitoring. Drones 2022, 7, 381. [Google Scholar] [CrossRef] [Scilit]
- Aerodynamics for Students. Available online: https://aerospace101.com/aircraft-performance/rotor-momentum-analysis.html (accessed on 16 January 2026).
- Grindley, B.; Phillips, K.; Parnell, K.J.; Cherrett, T.; Scanlan, J.; Plant, K.L. Over a decade of UAV incidents: A human factors analysis of causal factors. Appl. Ergon. 2024, 121, 104355. [Google Scholar] [CrossRef] [Scilit]
- Kumar, S.M.; Kasbekar, G.S.; Maity, A. Identification of GPS Spoofing as a Drone Cyber-Vulnerability and Evaluation of Efficacy of Asynchronous GPS Spoofing. In Proceedings of the 22nd IFAC Symposium on Automatic Control in Aerospace (ACA 2022), Mumbai, India; Elsevier: Amsterdam, The Netherlands, 2022; Volume 55, pp. 394–399. [Google Scholar] [CrossRef] [Scilit]
- Drone Spoofing and Countermeasure. Available online: https://www.nqdefense.com/anti-drone-drone-spoofing-and-countermeasure/ (accessed on 10 January 2026).
- Drone Laws in Cyprus. Available online: https://uavcoach.com/drone-laws-in-cyprus/ (accessed on 8 May 2025).
- What Is Drone Jamming and How Can It be Countered? Available online: https://doodlelabs.com/what-is-drone-jamming/ (accessed on 31 January 2026).
- Zhang, X.; Liu, Y.; Zhang, Y.; Guan, X.; Delahaye, D.; Tang, L. Safety Assessment and Risk Estimation for Unmanned Aerial Vehicles Operating in National Airspace System. J. Adv. Transp. 2018, 2, 1–11. [Google Scholar] [CrossRef] [Scilit]
- Petritoli, E.; Leccese, F.; Ciani, L. Reliability Assessment of UAV Systems. In Proceedings of the IEEE International Workshop on Metrology for AeroSpace (MetroAeroSpace), Padua, Italy; IEEE: Piscataway, NJ, USA, 2017; pp. 266–270. [Google Scholar] [CrossRef] [Scilit]
- Waliullah, M.; Gan, D. Wireless LAN Security Threats and Vulnerabilities. Int. J. Adv. Comput. Sci. Appl. 2014, 5, 176–183. [Google Scholar] [CrossRef] [Scilit]
- Petritoli, E.; Leccese, F.; Ciani, L. Reliability and Maintenance Analysis of Unmanned Aerial Vehicles. Sensors 2018, 18, 3171. [Google Scholar] [CrossRef] [Scilit]
- Selvamuthu, D.; Singla, I.; Agarwal, D. Reliability and Maintainability Analysis of UAV Systems: An Analytical Approach. In Proceedings of the IEEE Space, Aerospace and Defence Conference (SPACE), Bangalore, India; IEEE: Piscataway, NJ, USA, 2025; pp. 1–6. [Google Scholar] [CrossRef] [Scilit]
- Fusaro, R.; Chiesa, S.; Cresto Aleina, S.; Fioriti, M. Contribution to R.A.M.S Estimation in Early Design Phases of Unmanned Aerial Vehicles—UAVs. Int. J. Mechan. Con. 2015, 16, 73–83. [Google Scholar]
- Maintainability. Available online: https://www.sciencedirect.com/topics/engineering/maintainability#:~:text=Maintainability%20is%20defined%20as%20the,in%20accordance%20with%20prescribed%20procedures (accessed on 4 January 2026).
- Gudmundsson, S. Chapter 1—The Aircraft Design Process. In General Aviation Aircraft Design; Elsevier: Amsterdam, The Netherlands, 2013; pp. 1–32. [Google Scholar] [CrossRef] [Scilit]
- Mohammad, A.J.; Hutchison, D.; Sterbenz, J.P.G. Towards Quantifying Metrics for Resilient and Survivable Networks. In Proceedings of the 14th IEEE International Conference on Network Protocols (ICNP 2006), Santa Barbara, CA, USA; IEEE: Piscataway, NJ, USA, 2006. [Google Scholar]
- Ellison, R.J.; Fisher, D.; Linger, R.; Lipson, H.; Longstaff, T.; Mead, N. Survivable Network Systems: An Emerging Discipline; Software Engineering Institute: Pittsburgh, PA, USA, 1999. [Google Scholar]
- Vaezi, A.; Jones, S.; Asgary, A. Integrating Resilience into Risk Matrices: A Practical Approach to Risk Assessment with Empirical Analysis. J. Risk Anal. Crisis Response 2023, 13, 252–272. [Google Scholar] [CrossRef] [Scilit]
- Jamming and Spoofing Protection for UAVs Using GNSS Signals. Available online: https://safran-navigation-timing.com/jamming-and-spoofing-protection-for-uavs-using-gnss-signals/ (accessed on 1 December 2025).
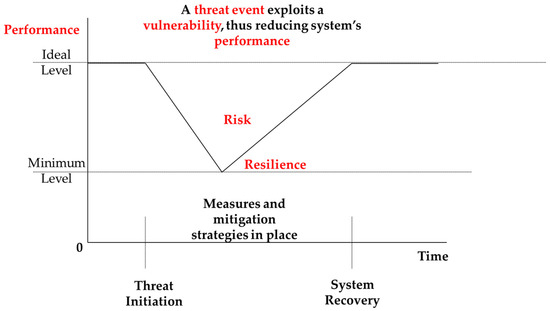
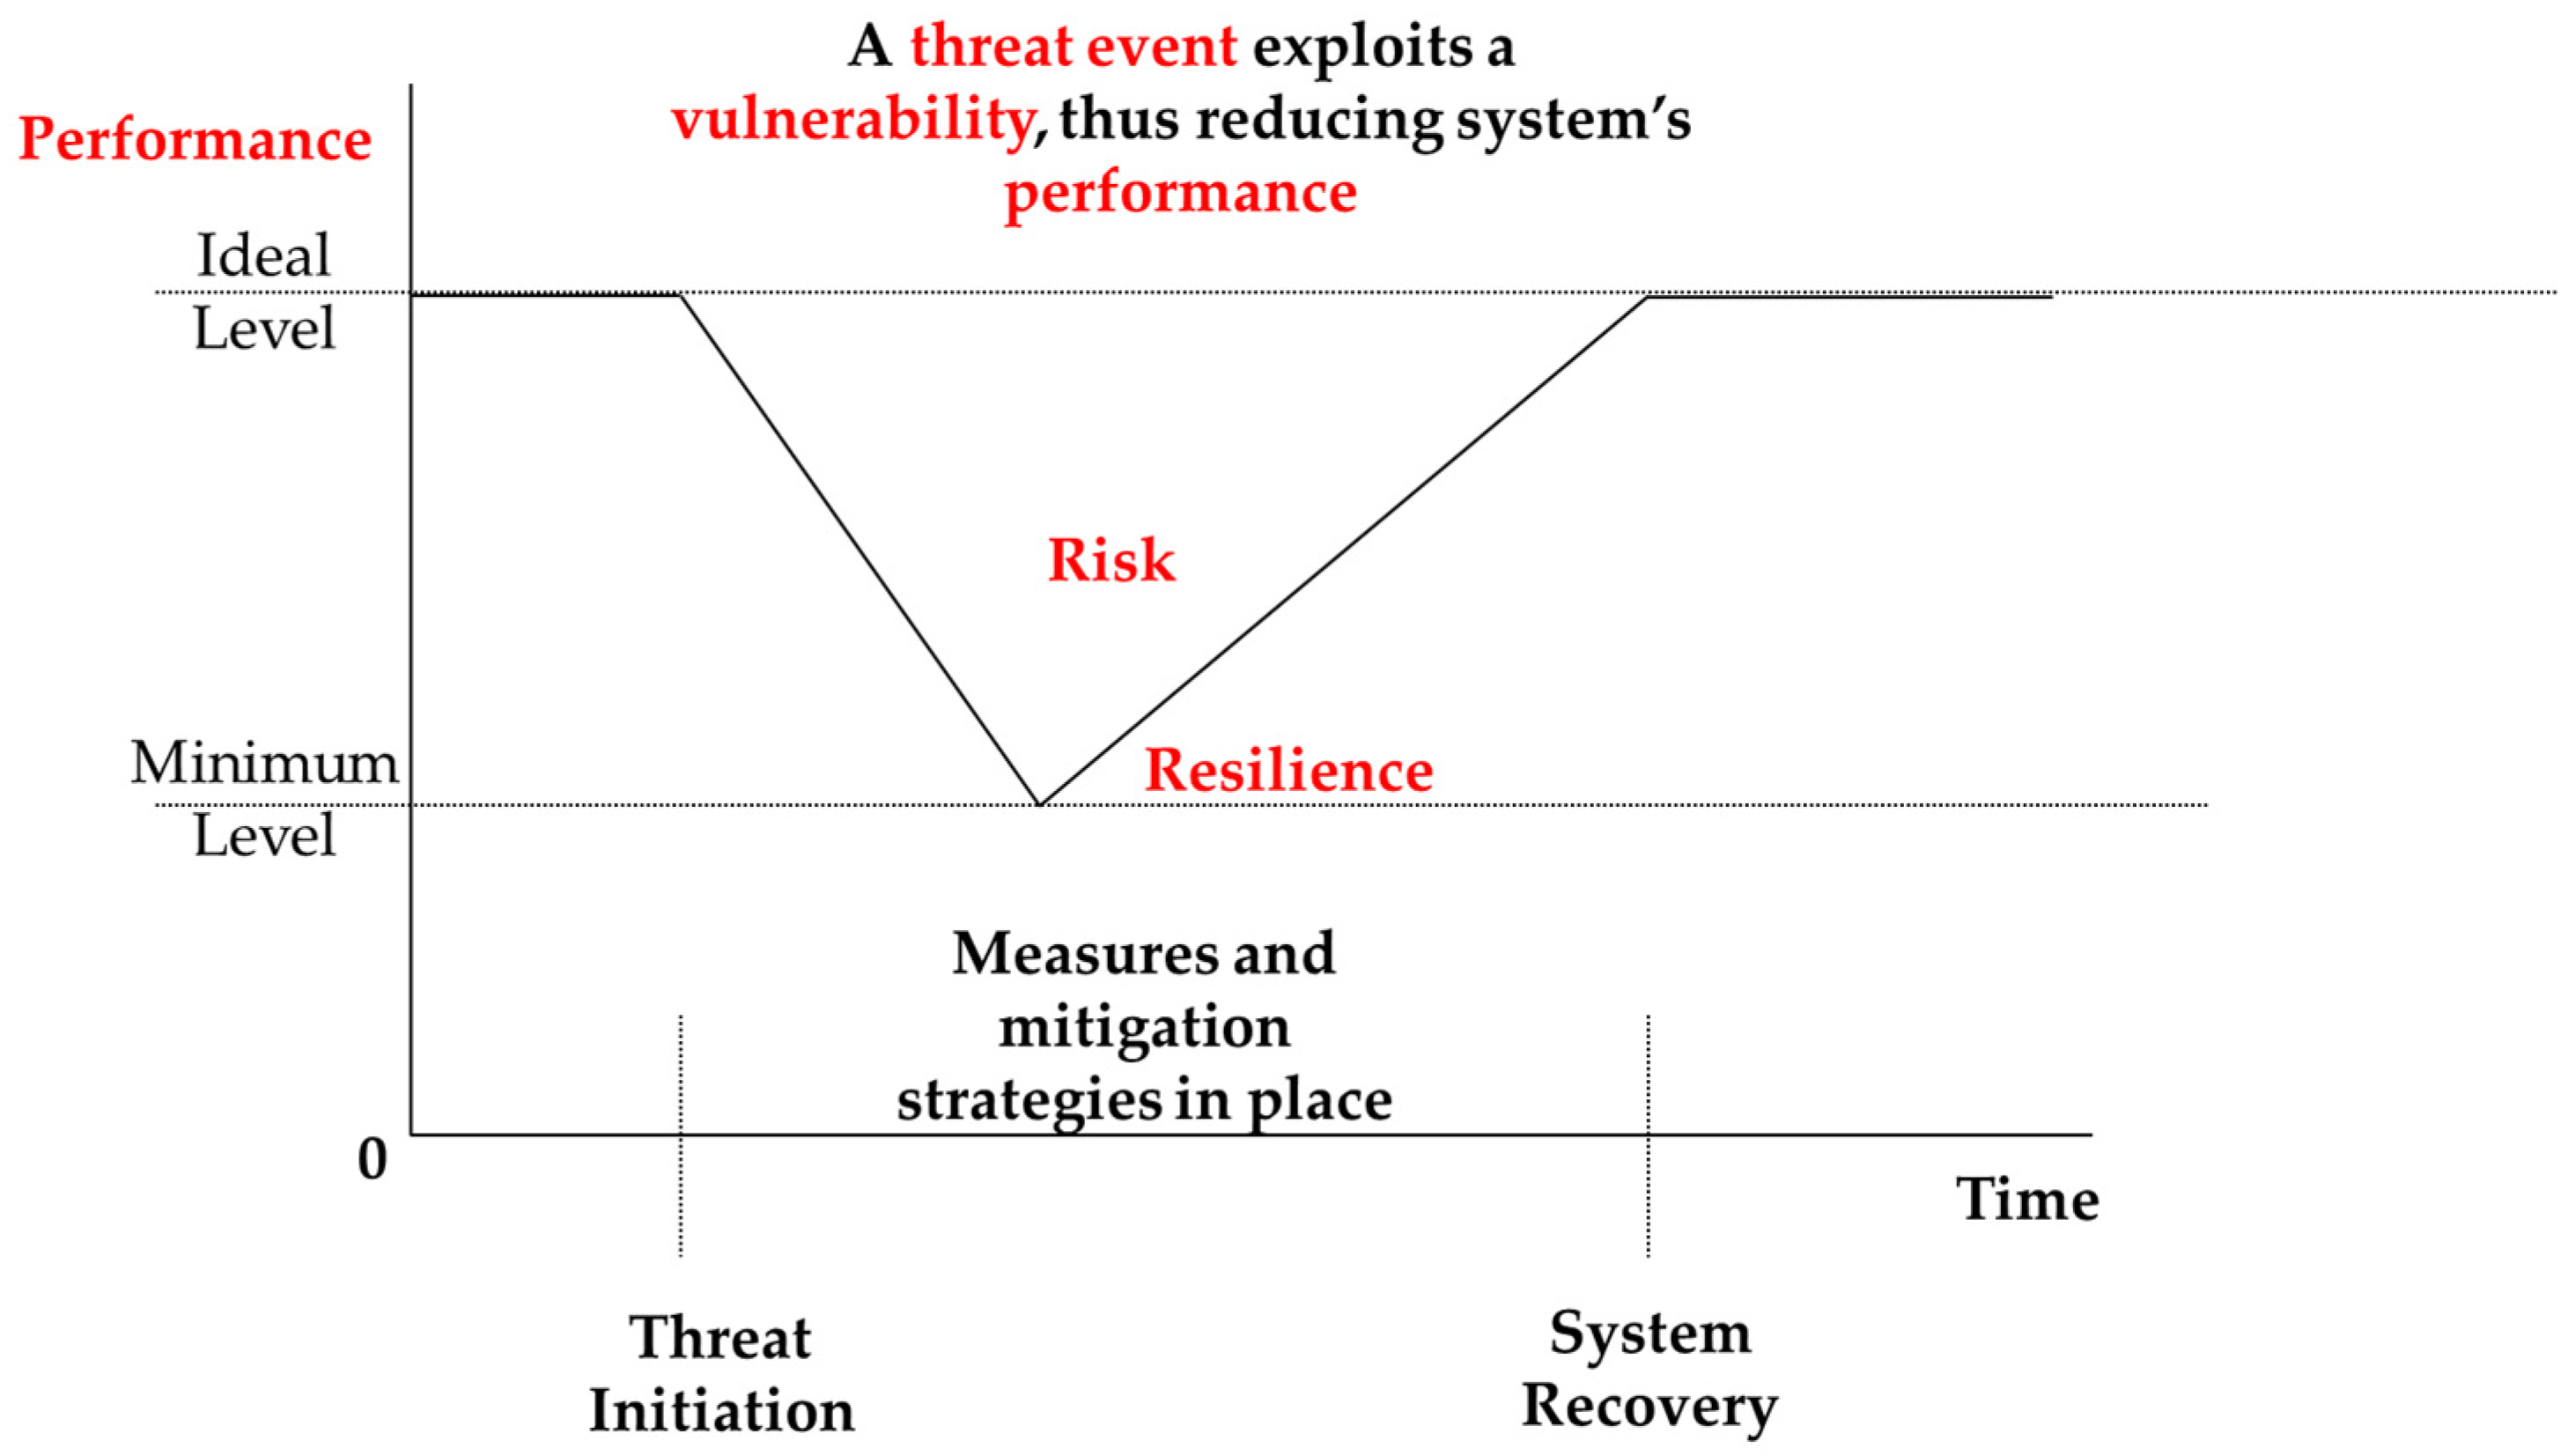
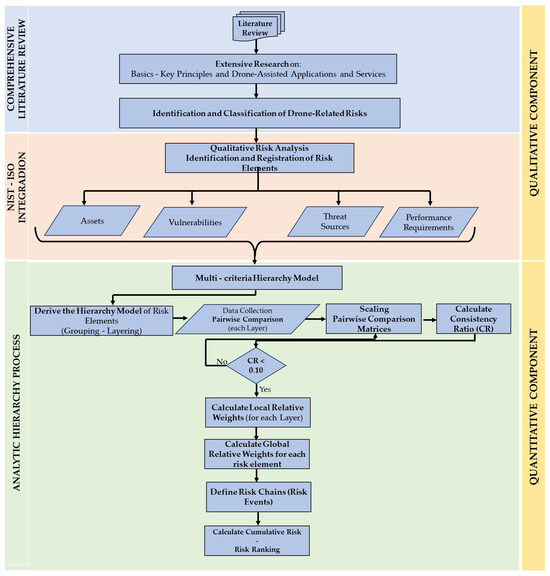
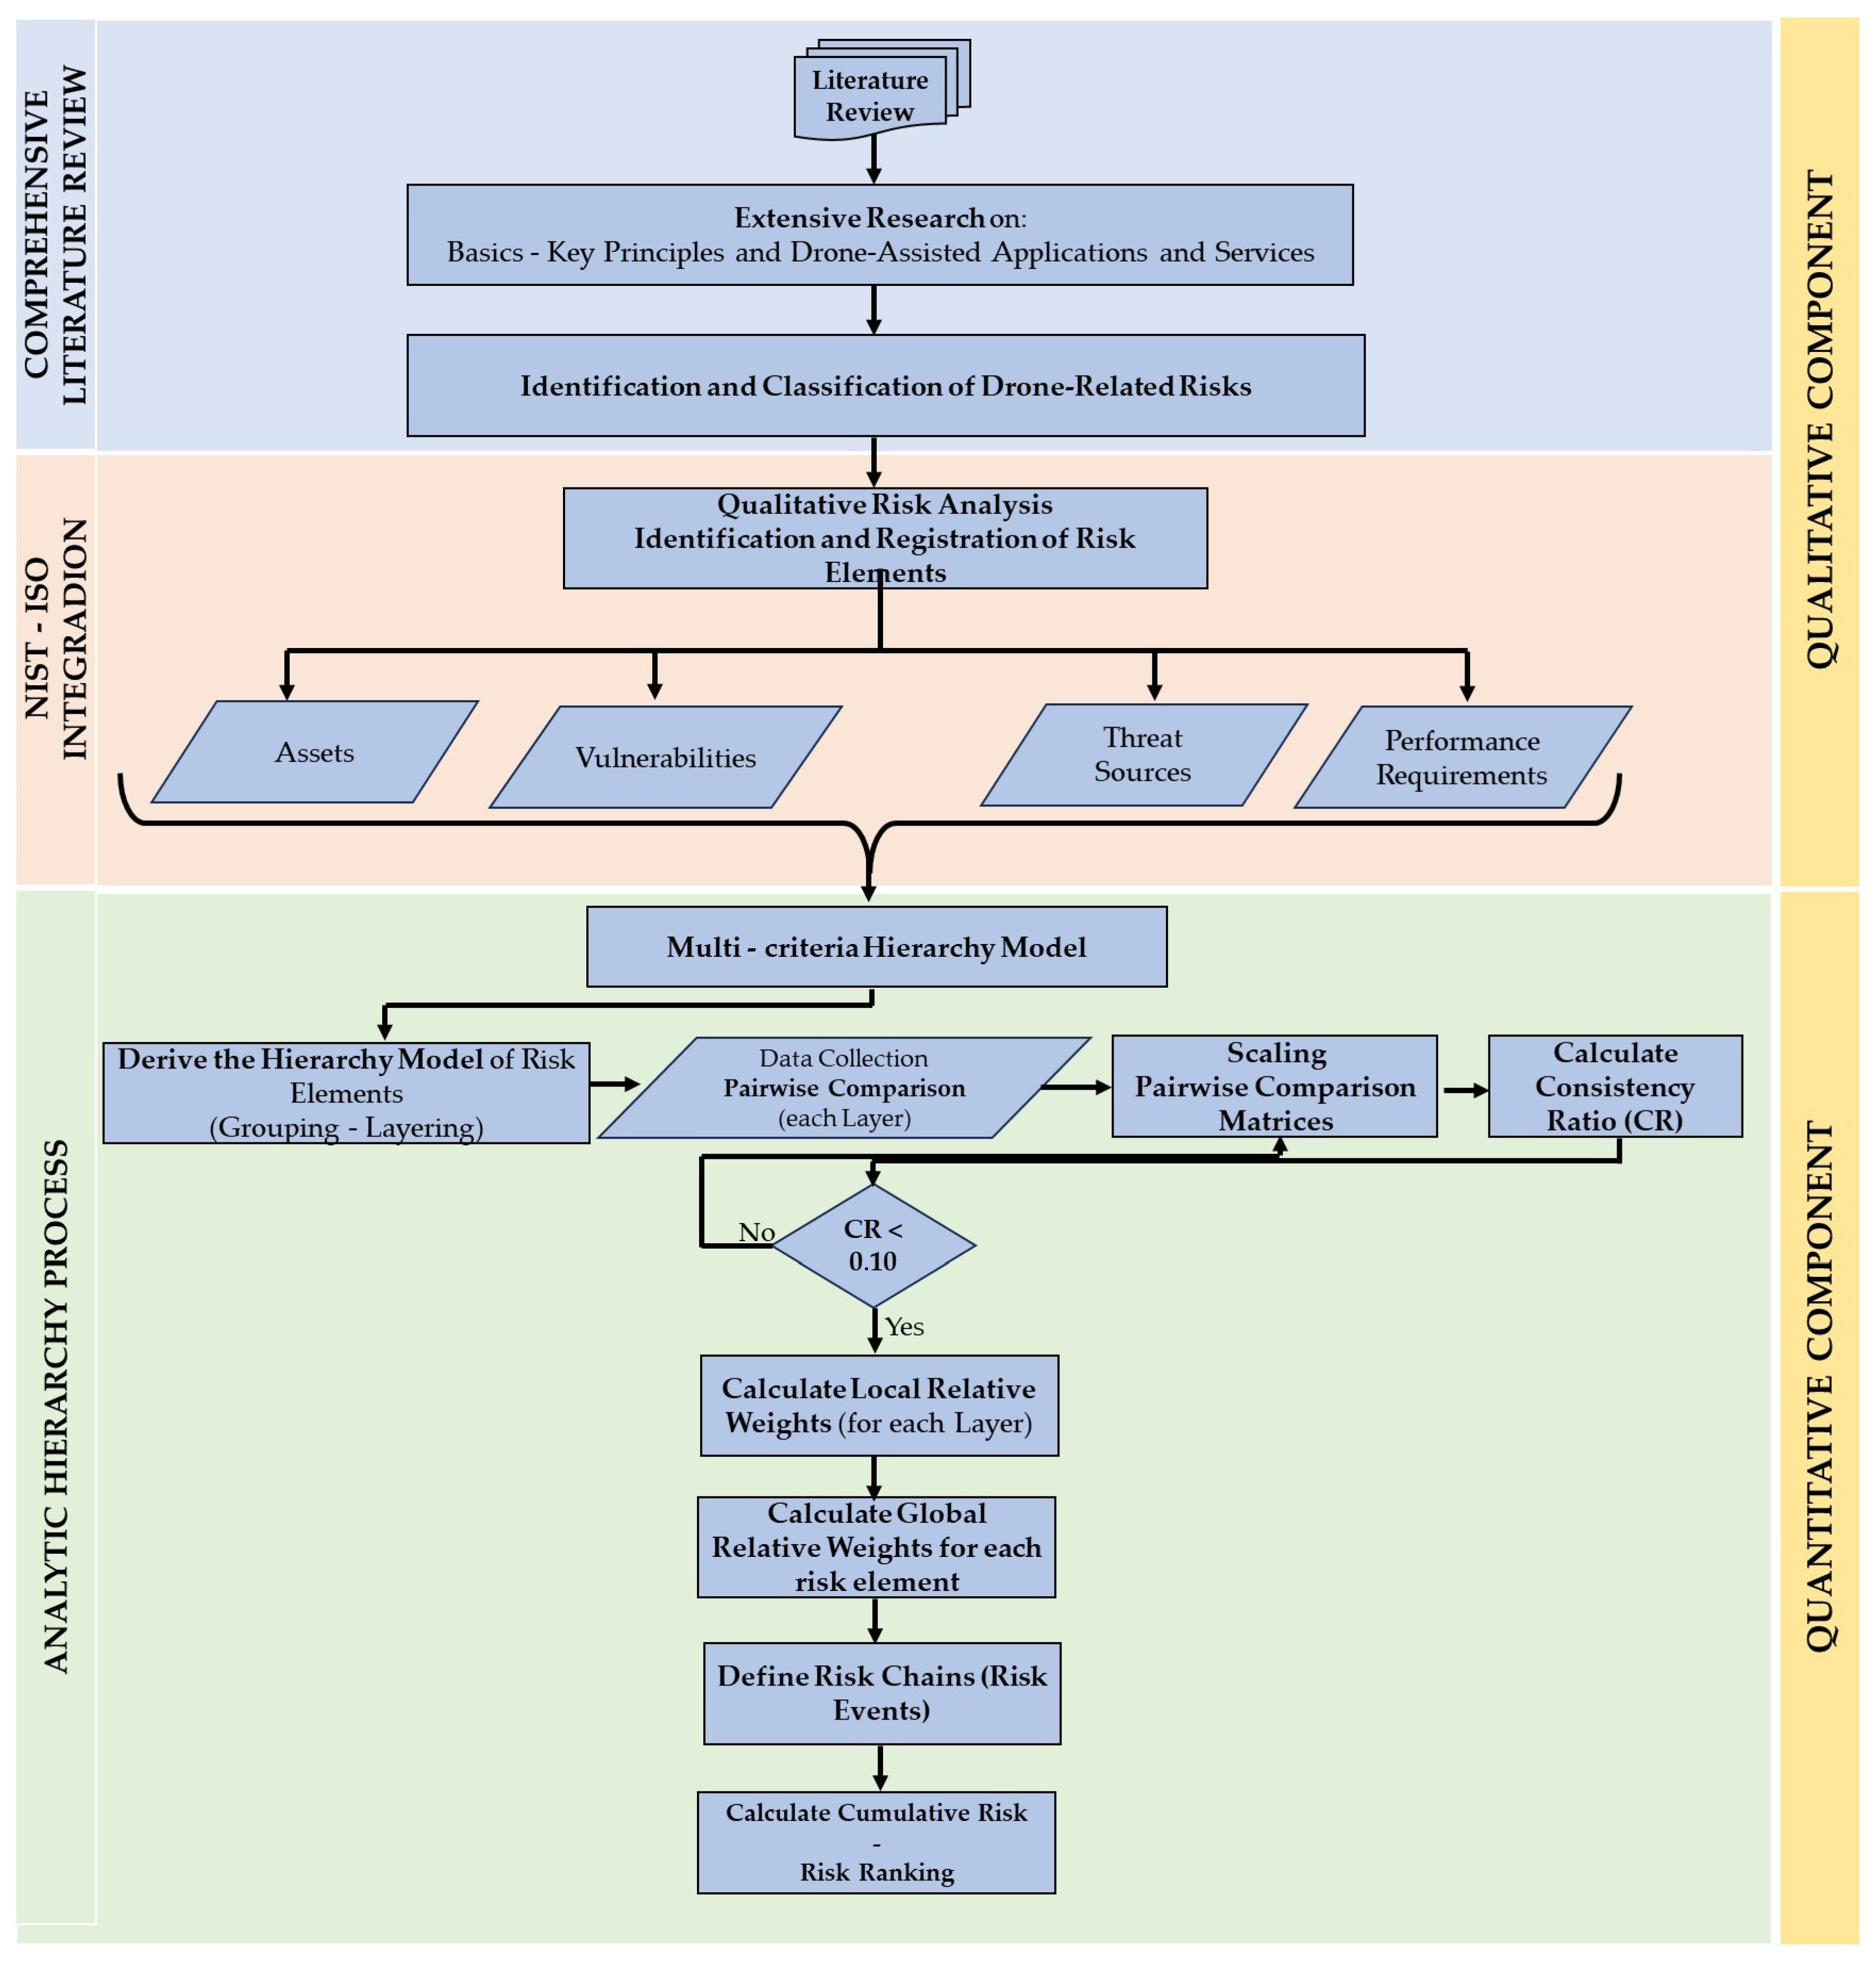
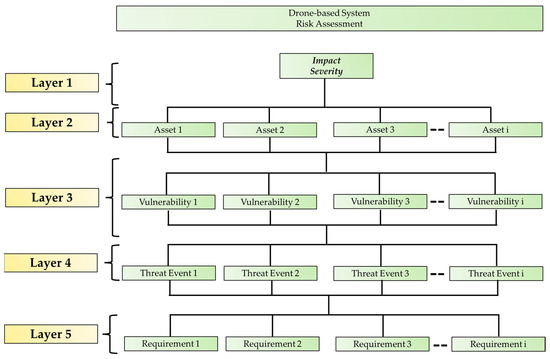
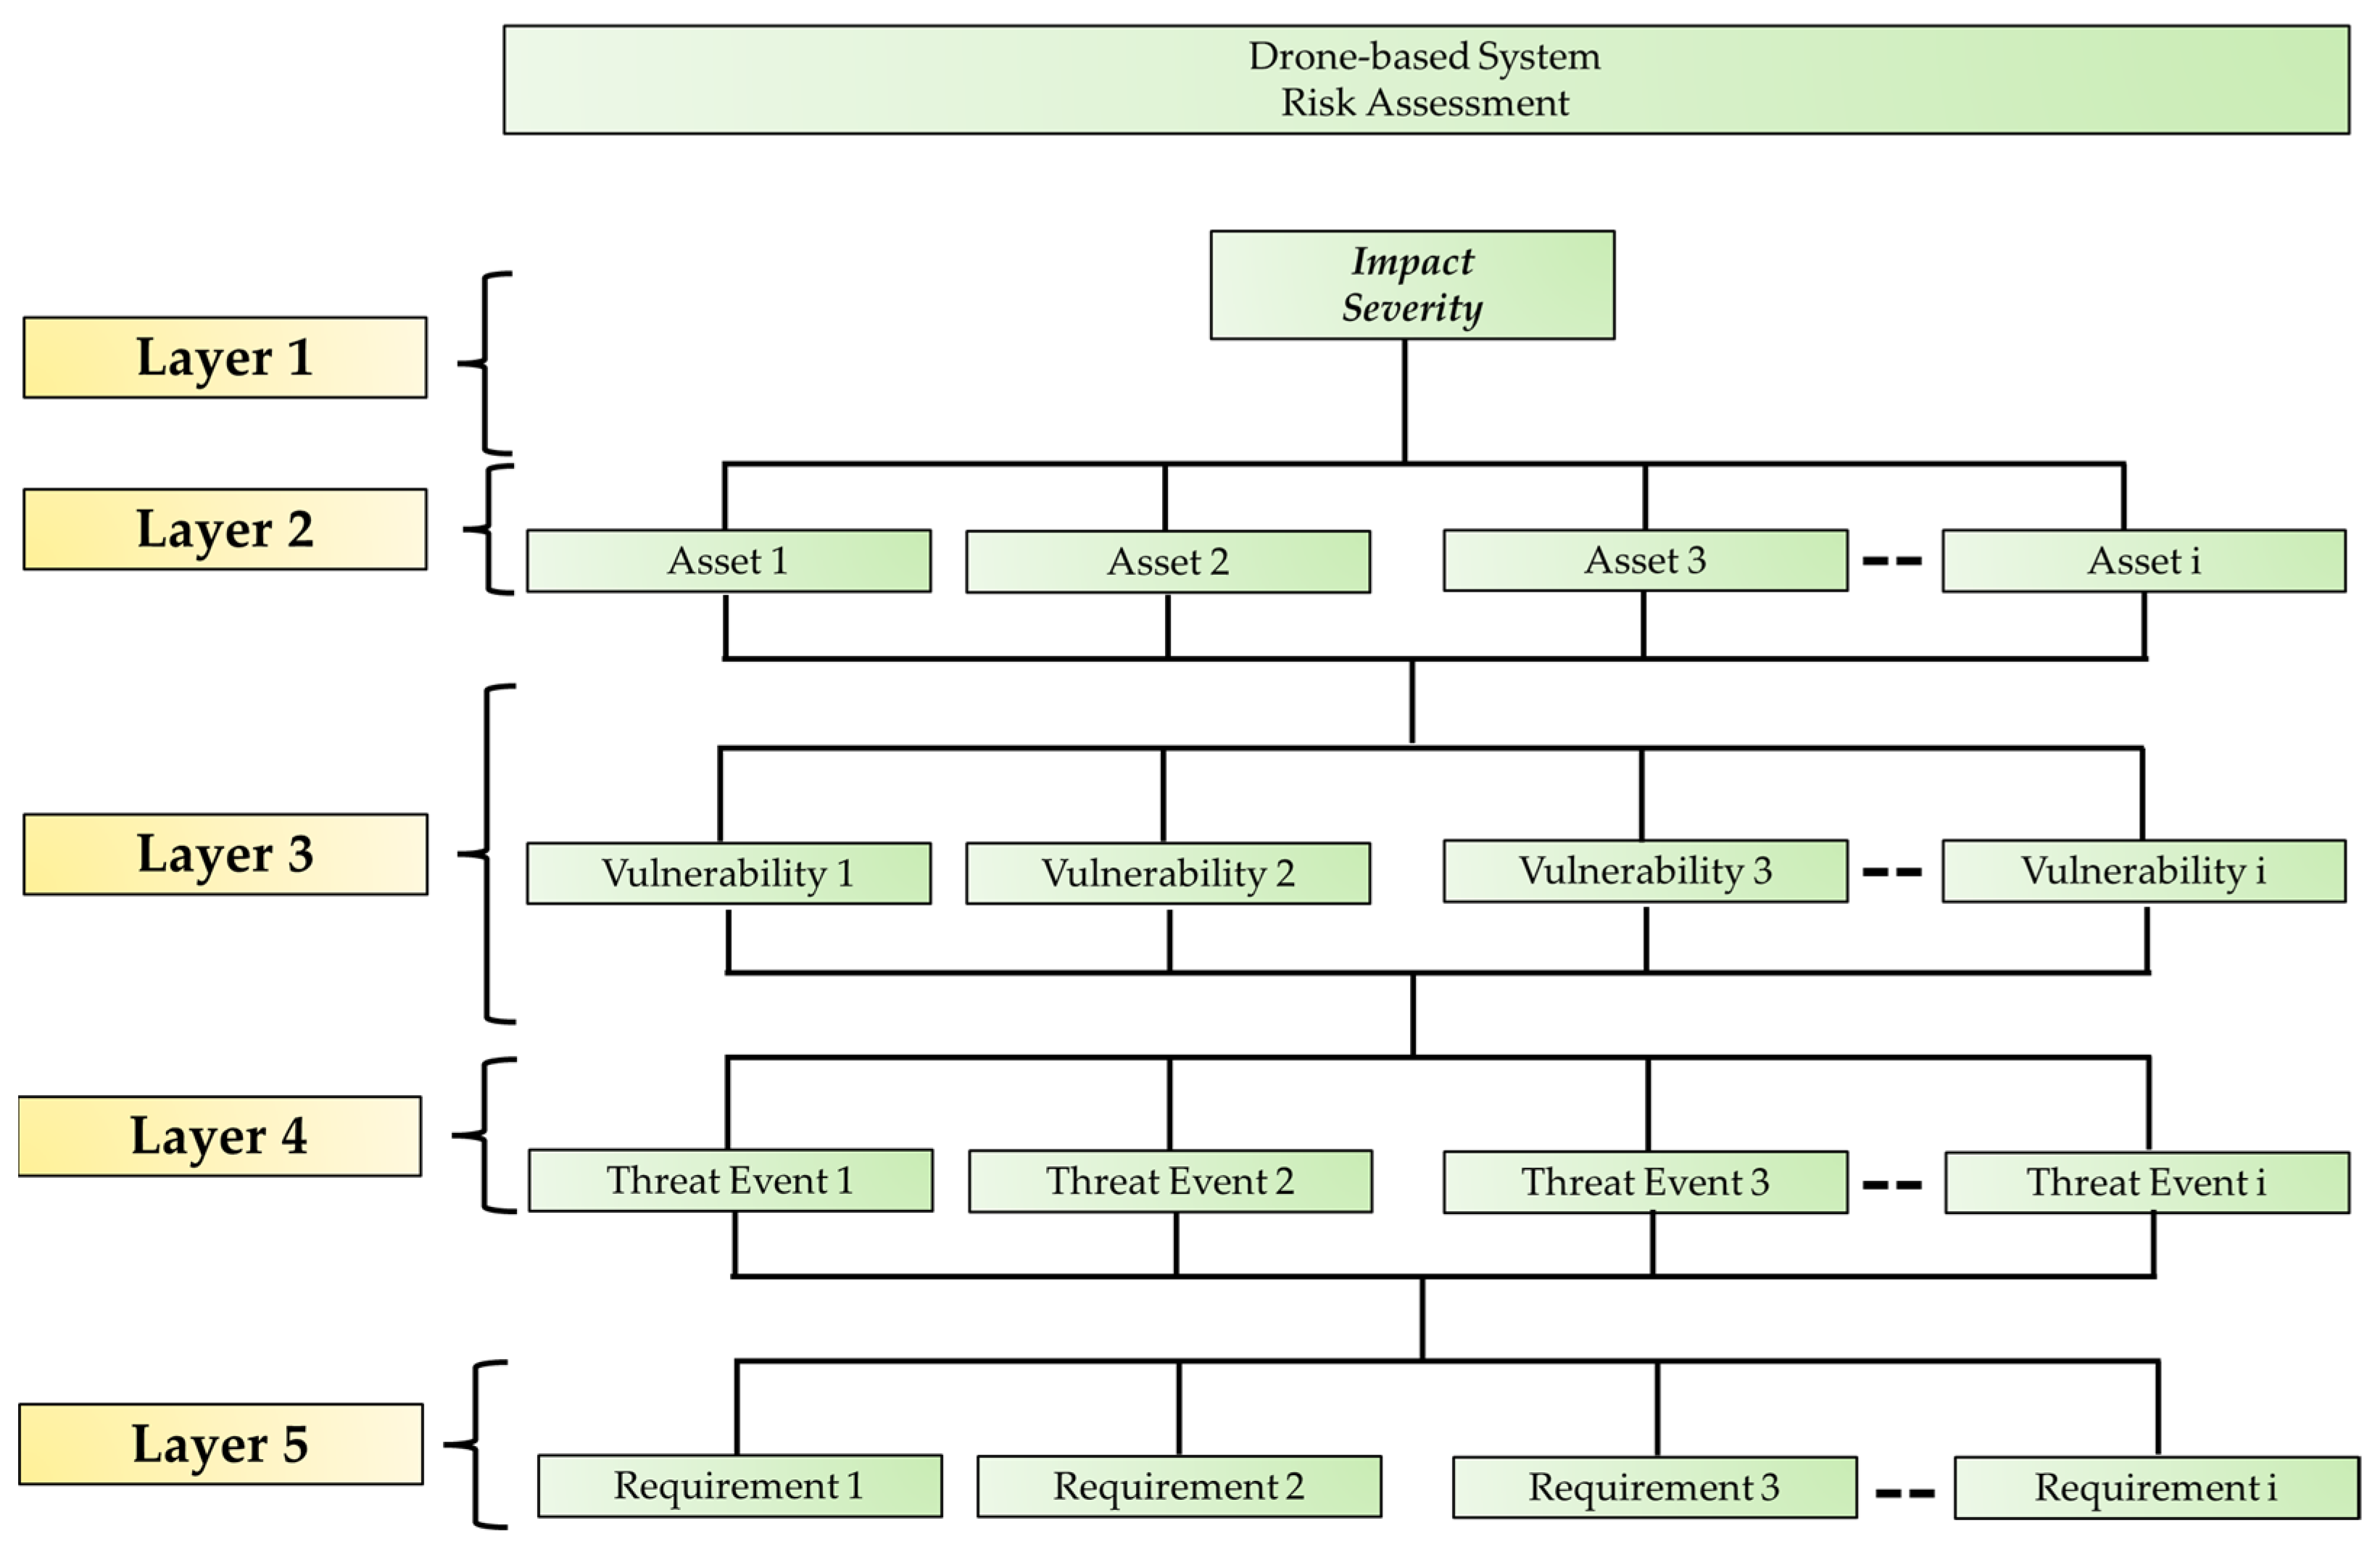
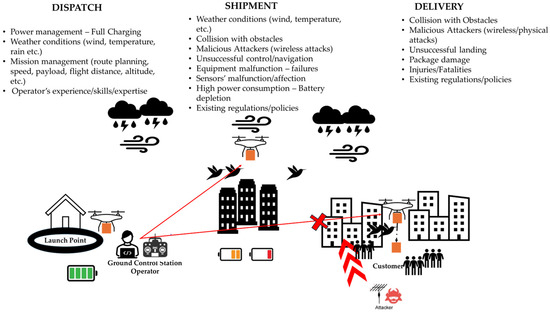
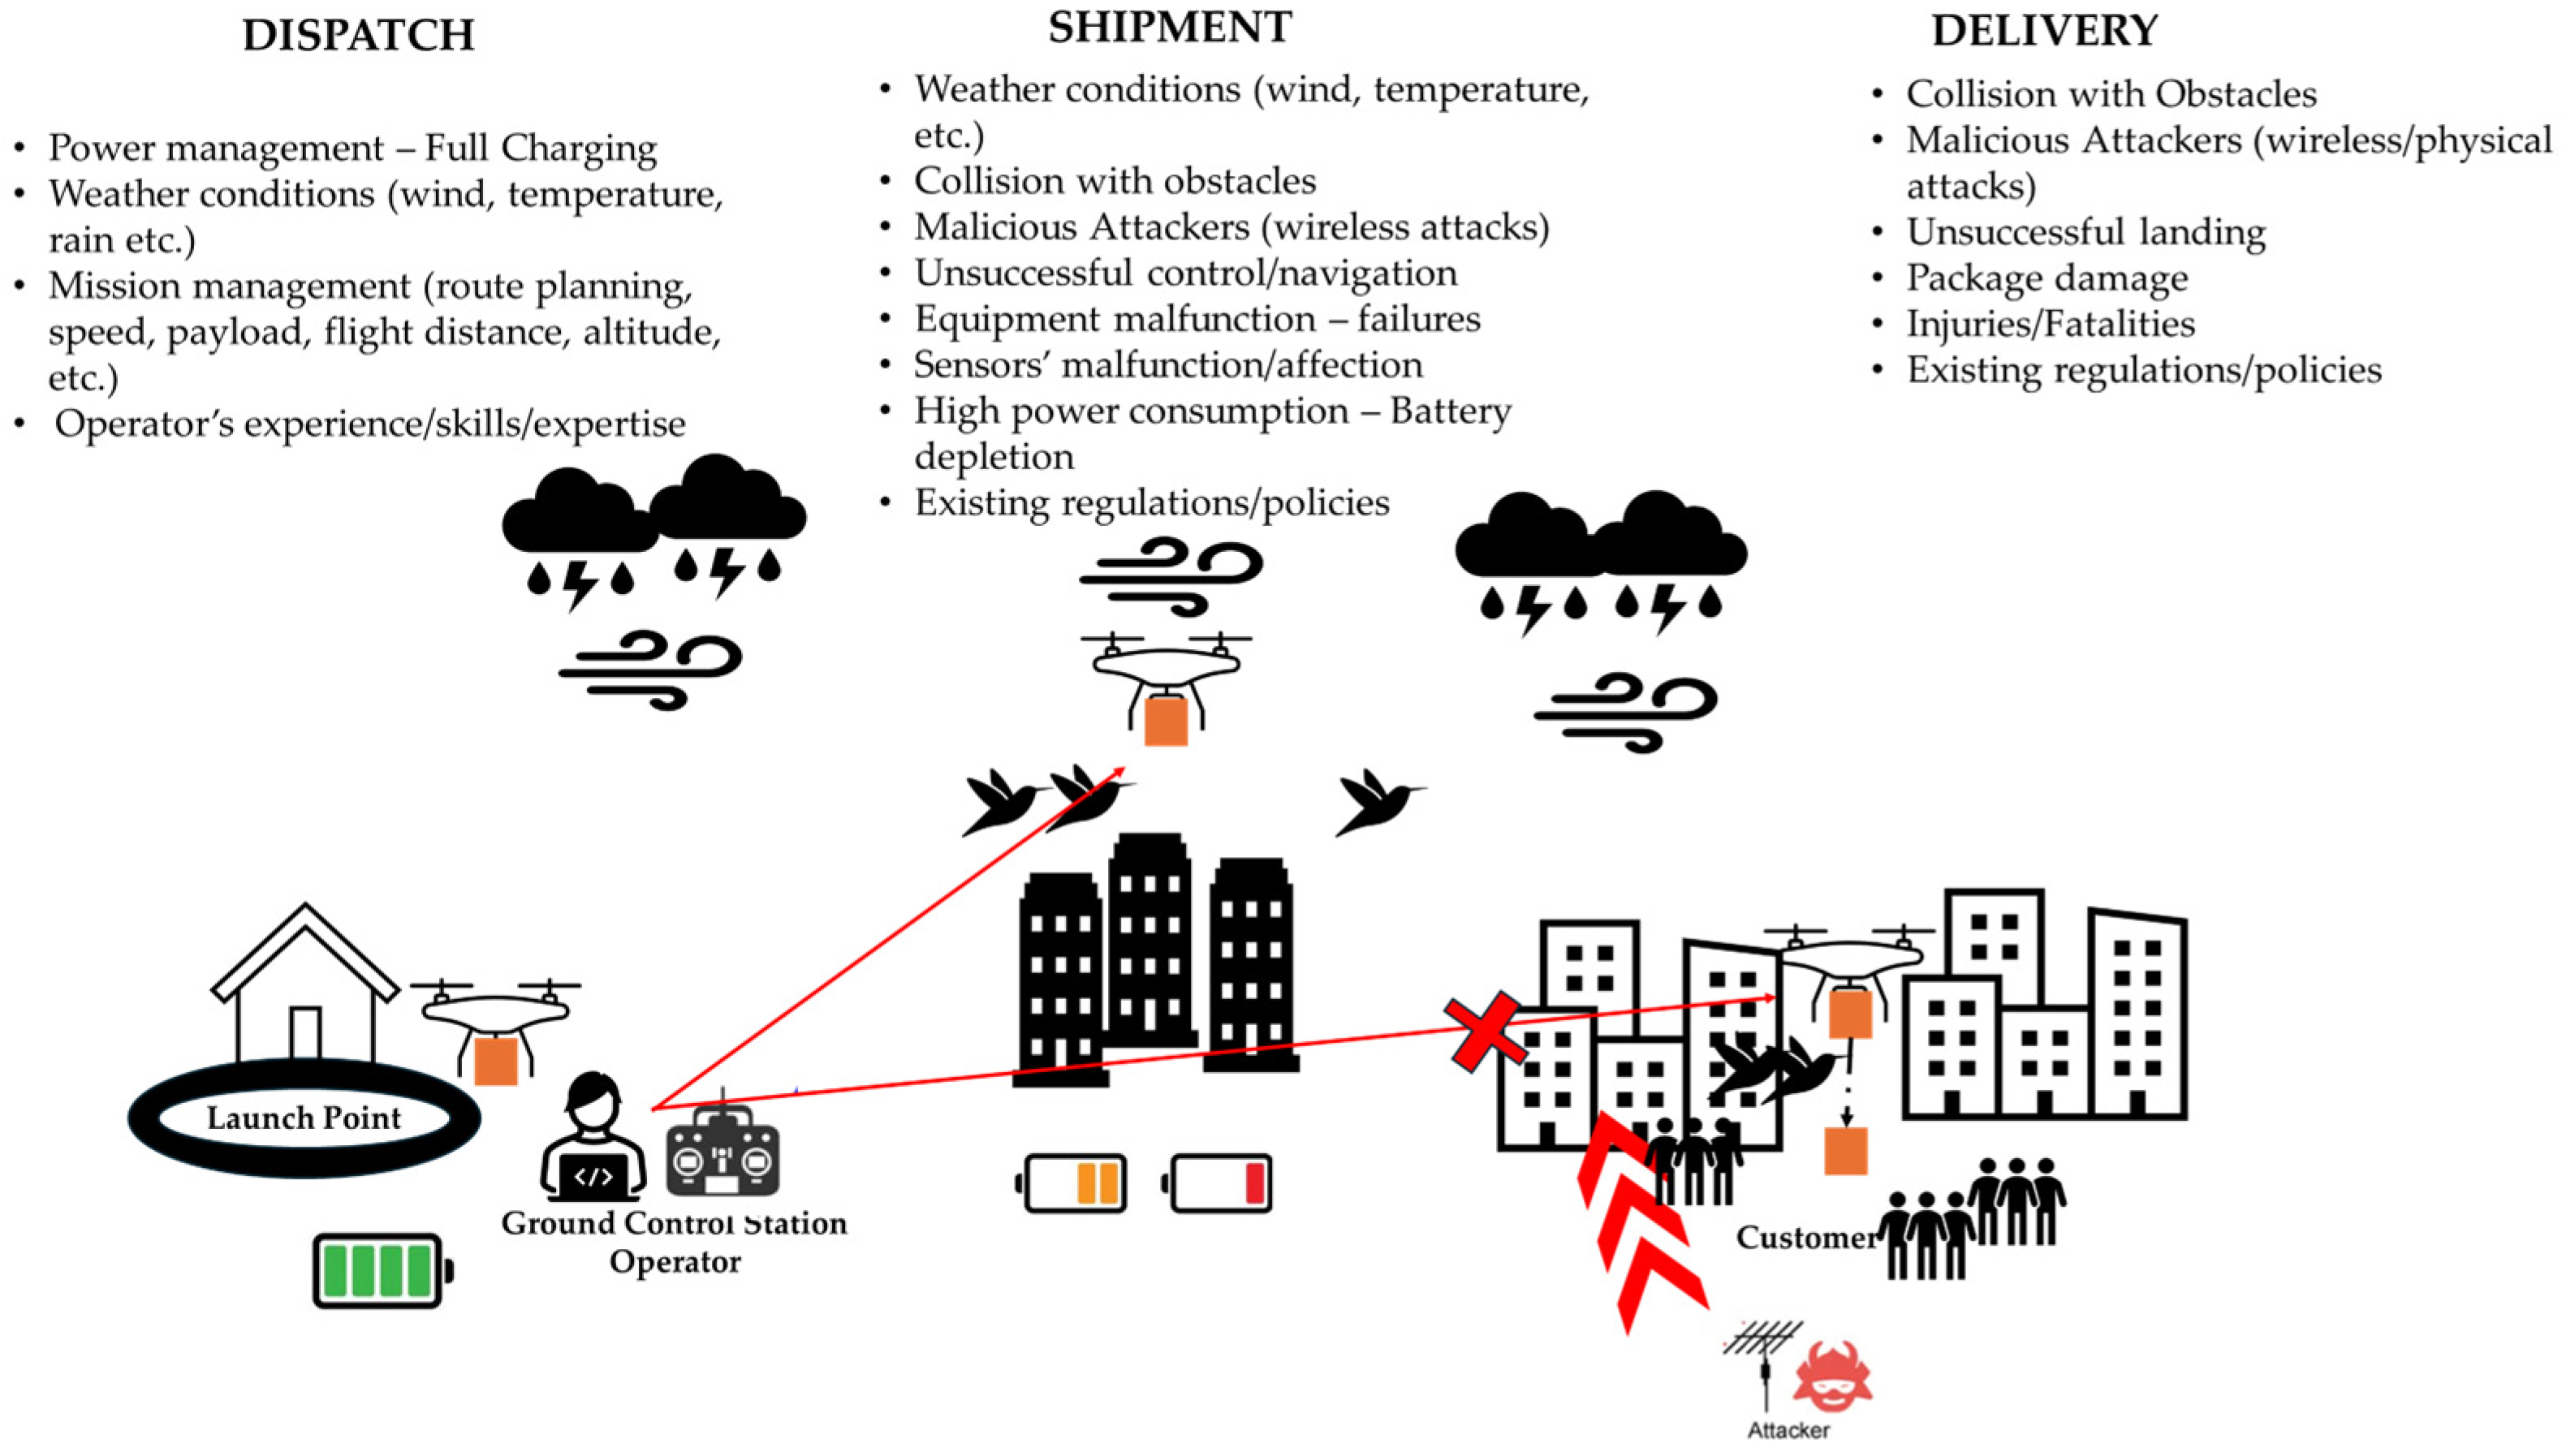
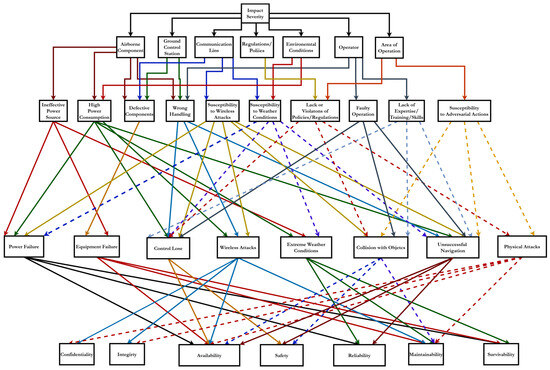
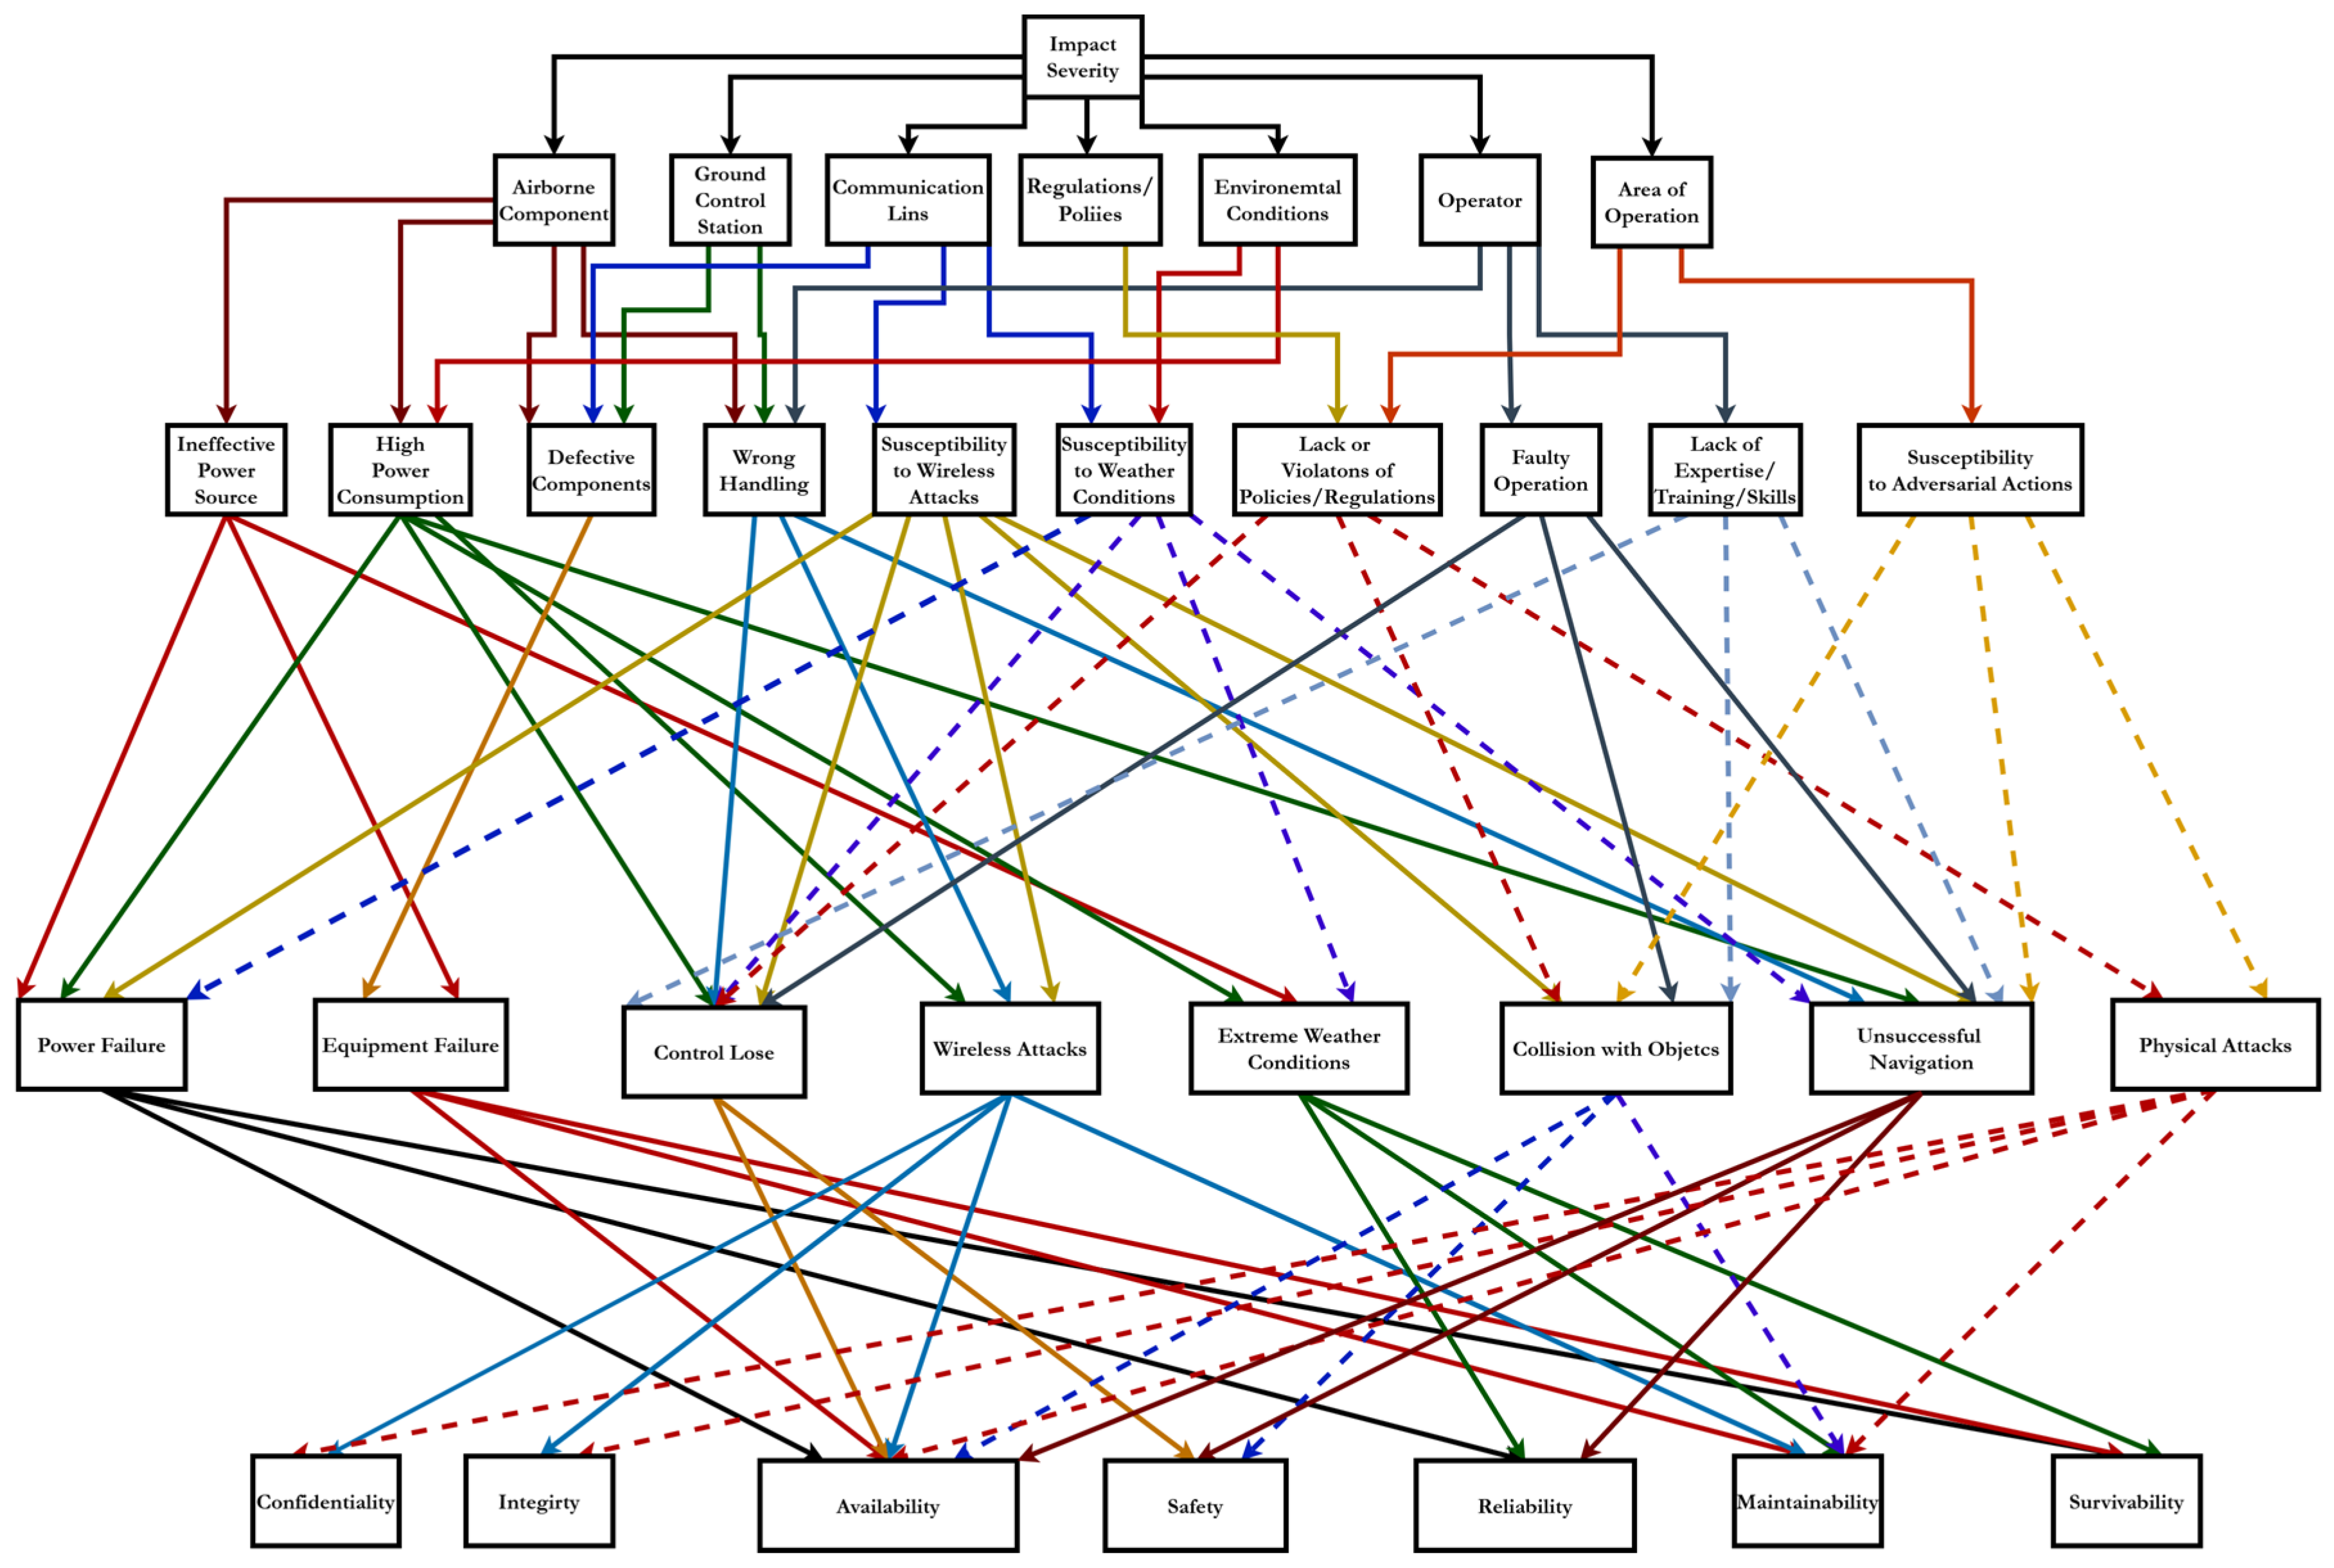
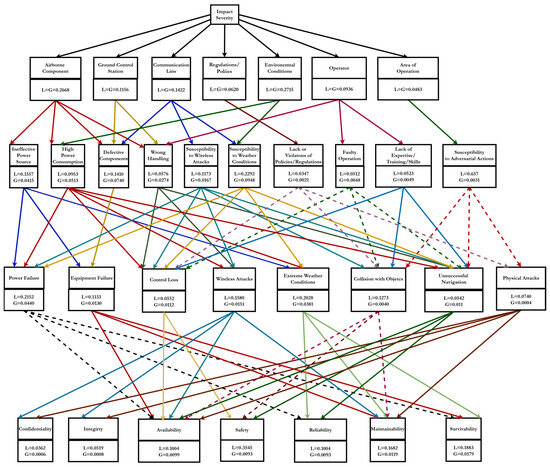
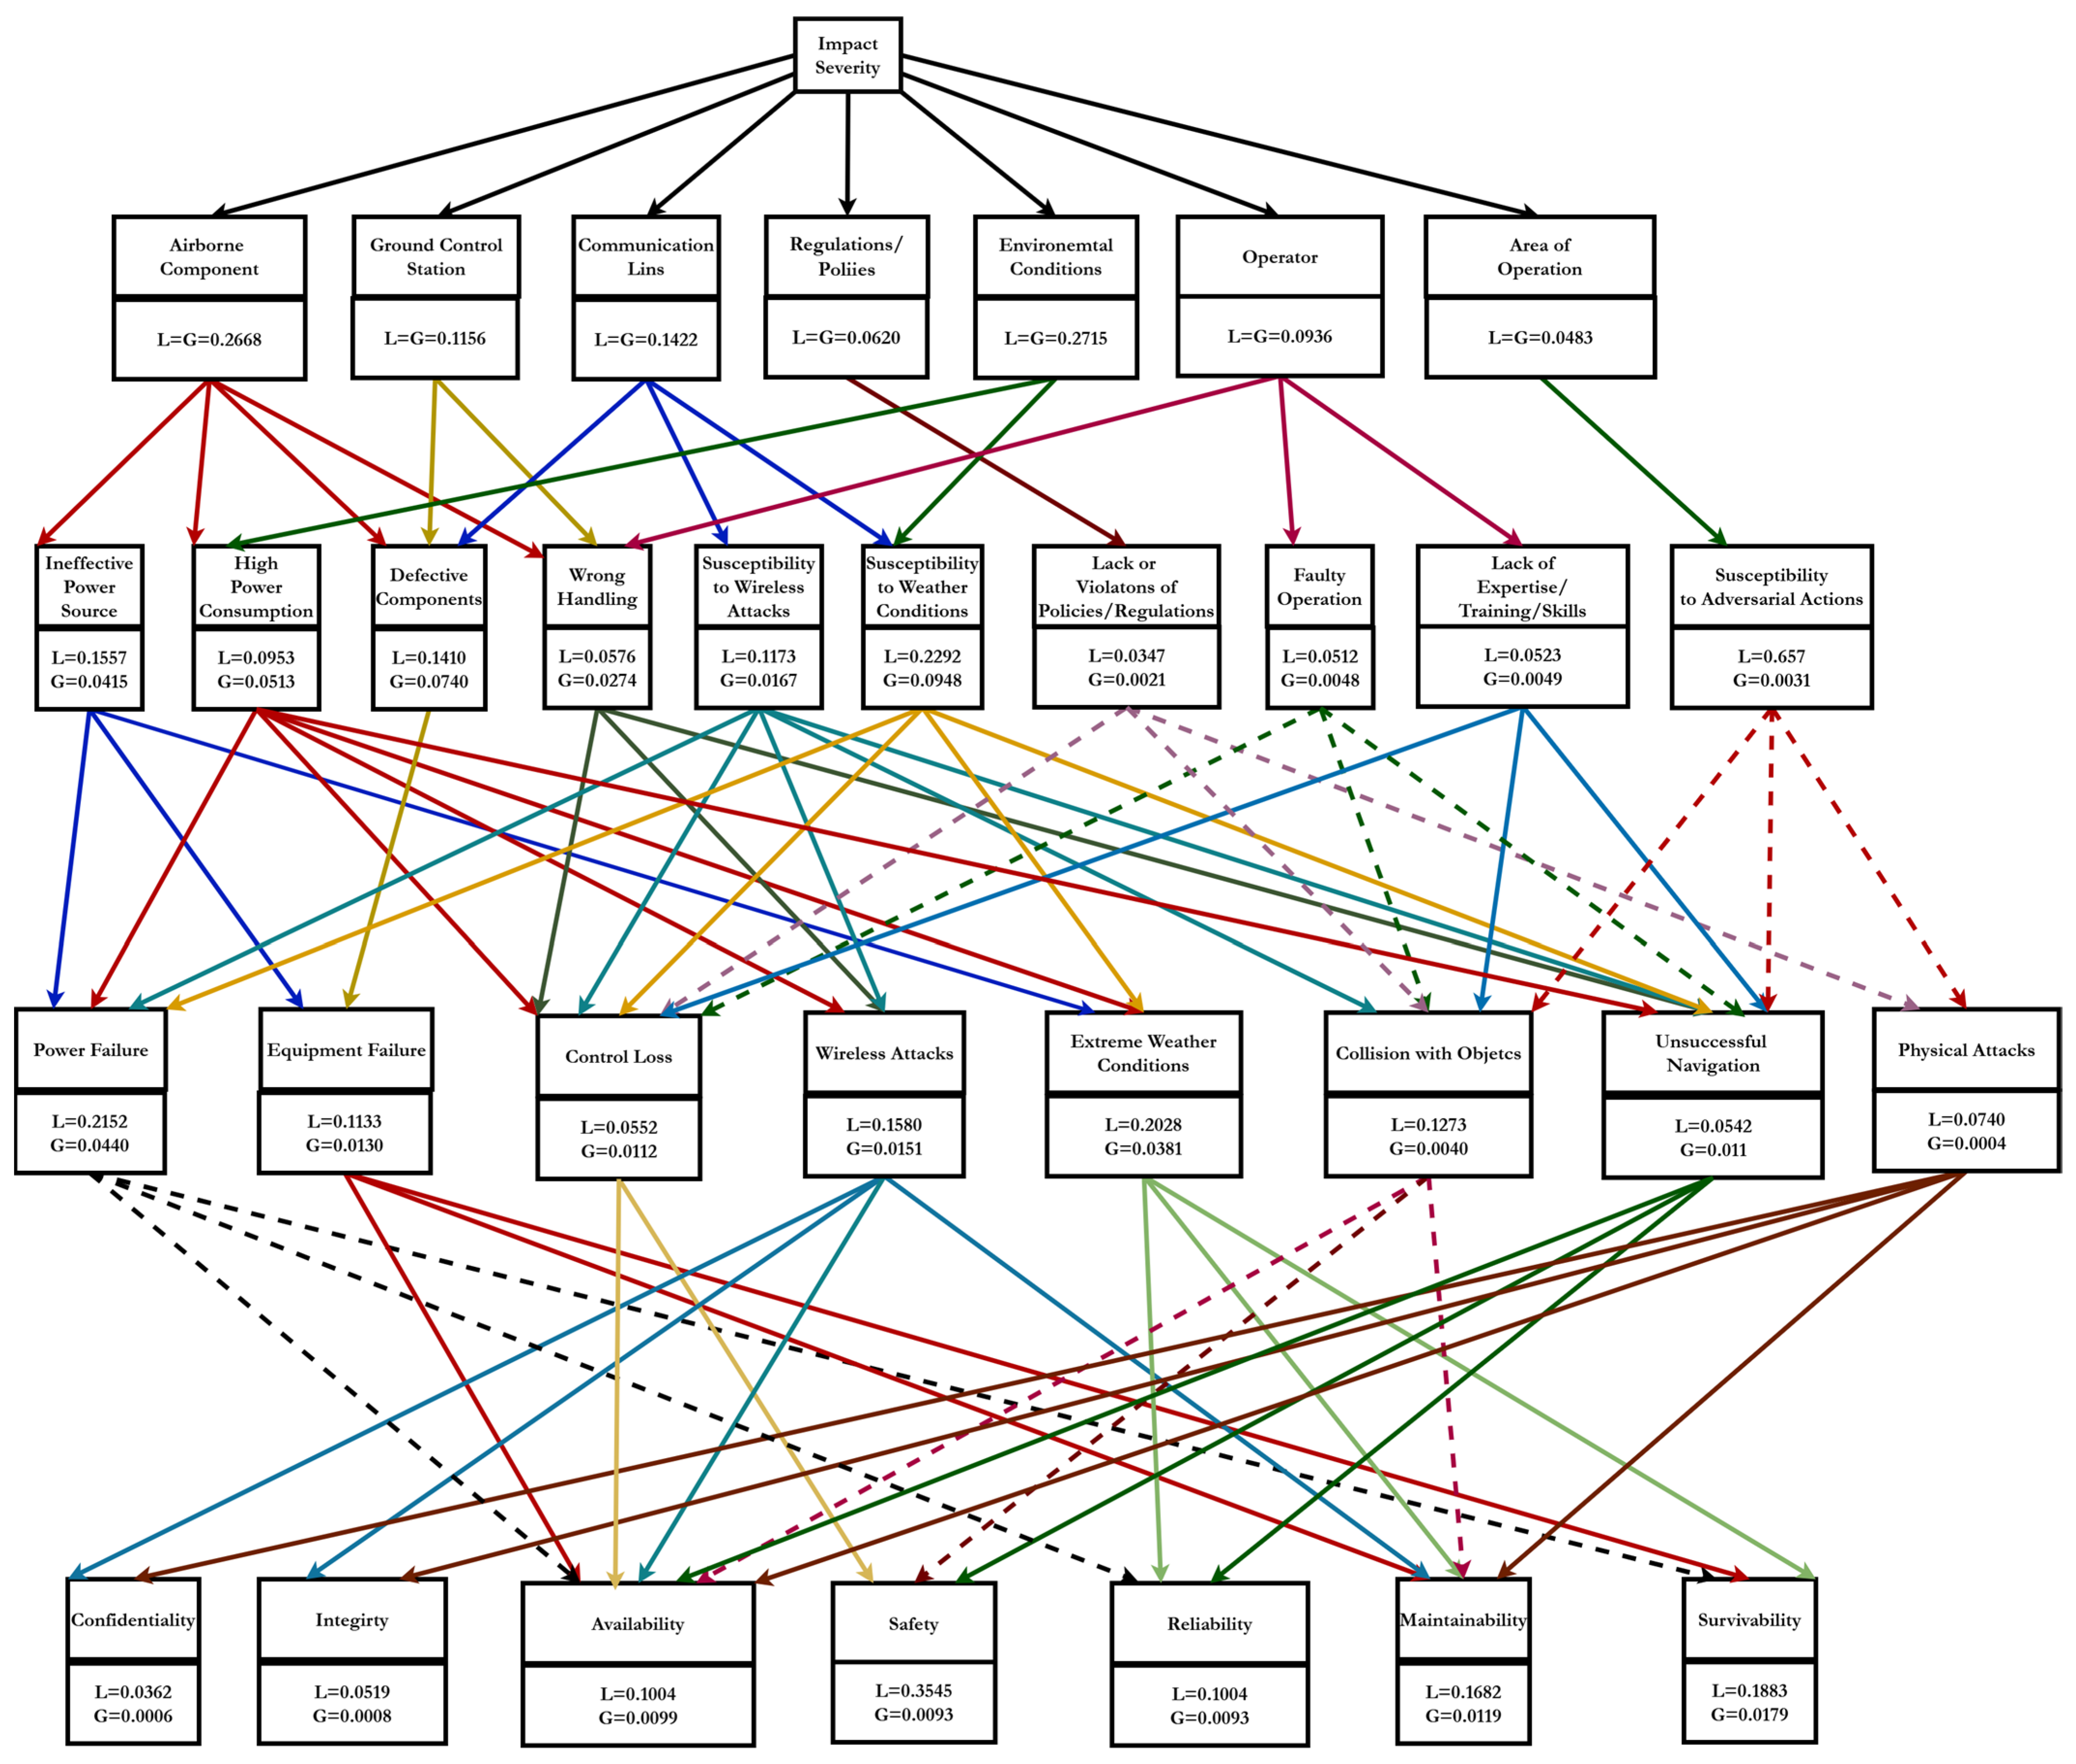
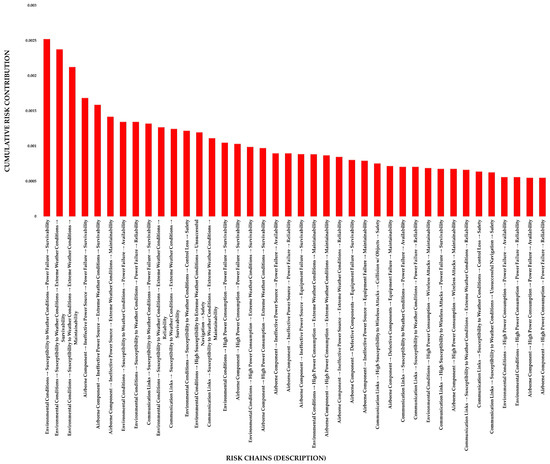
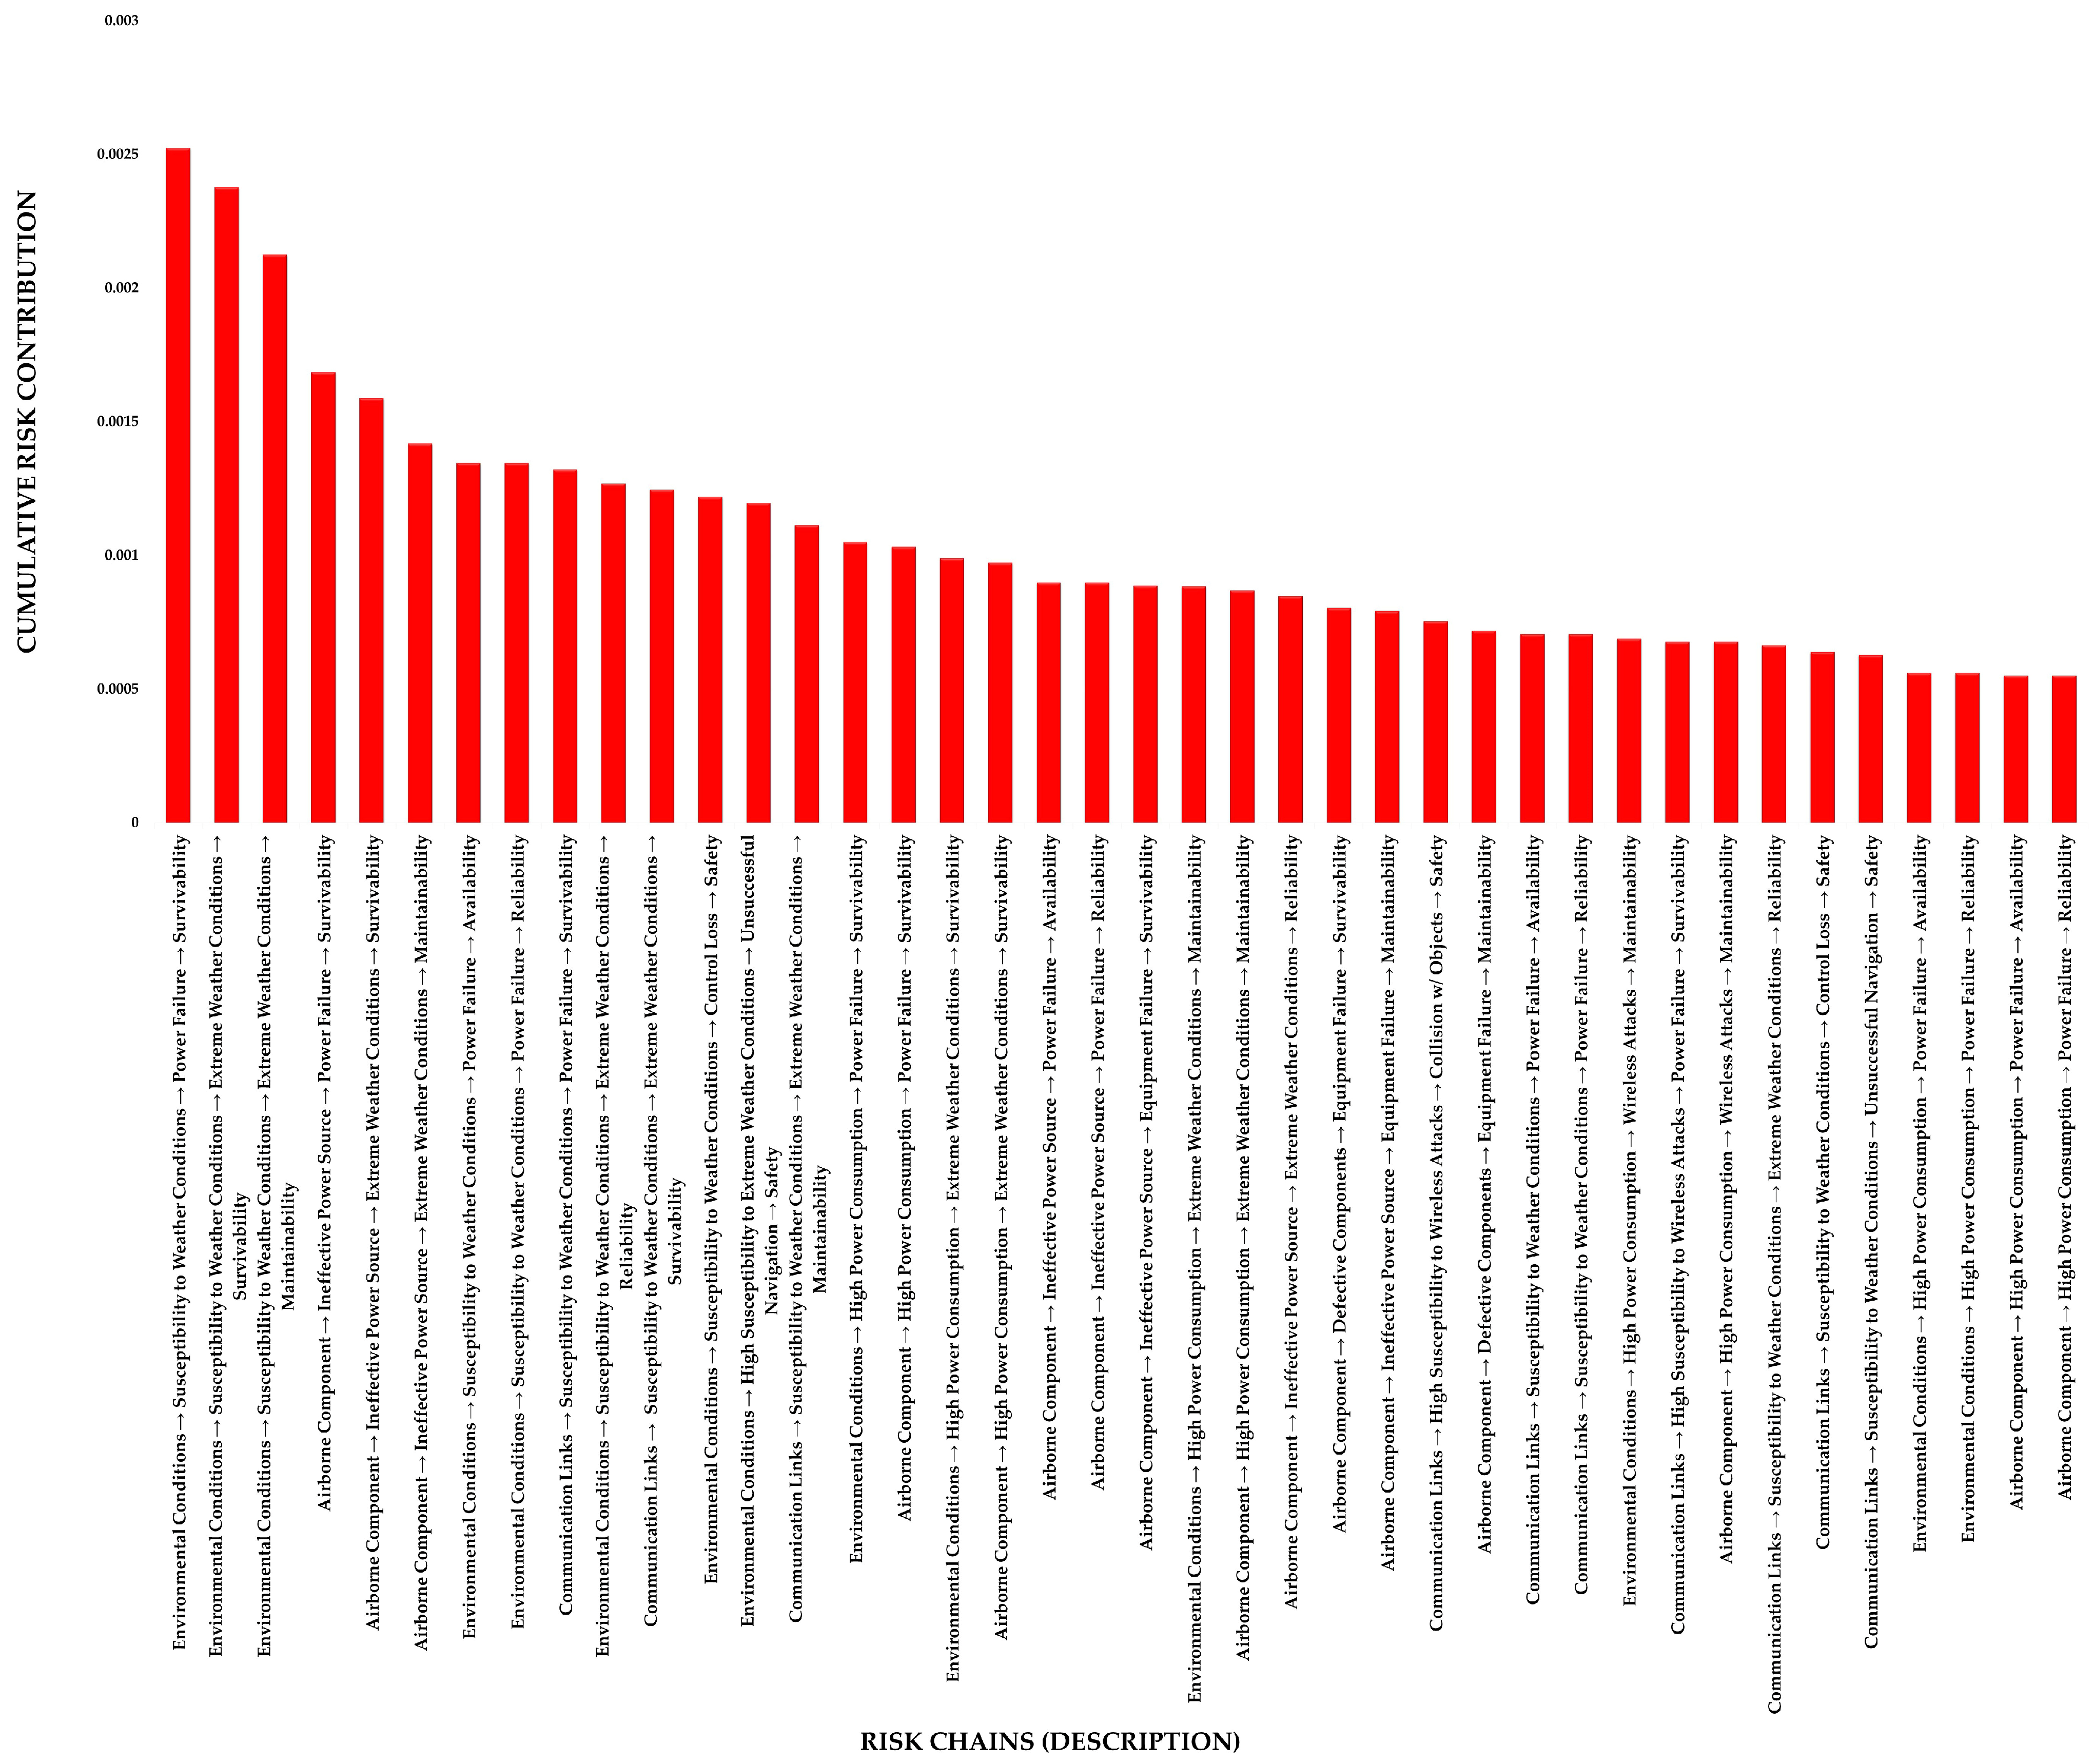
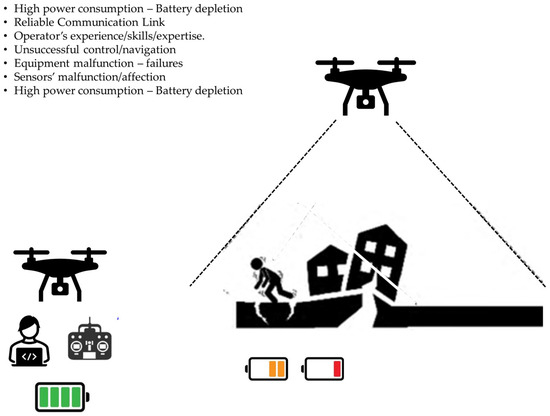
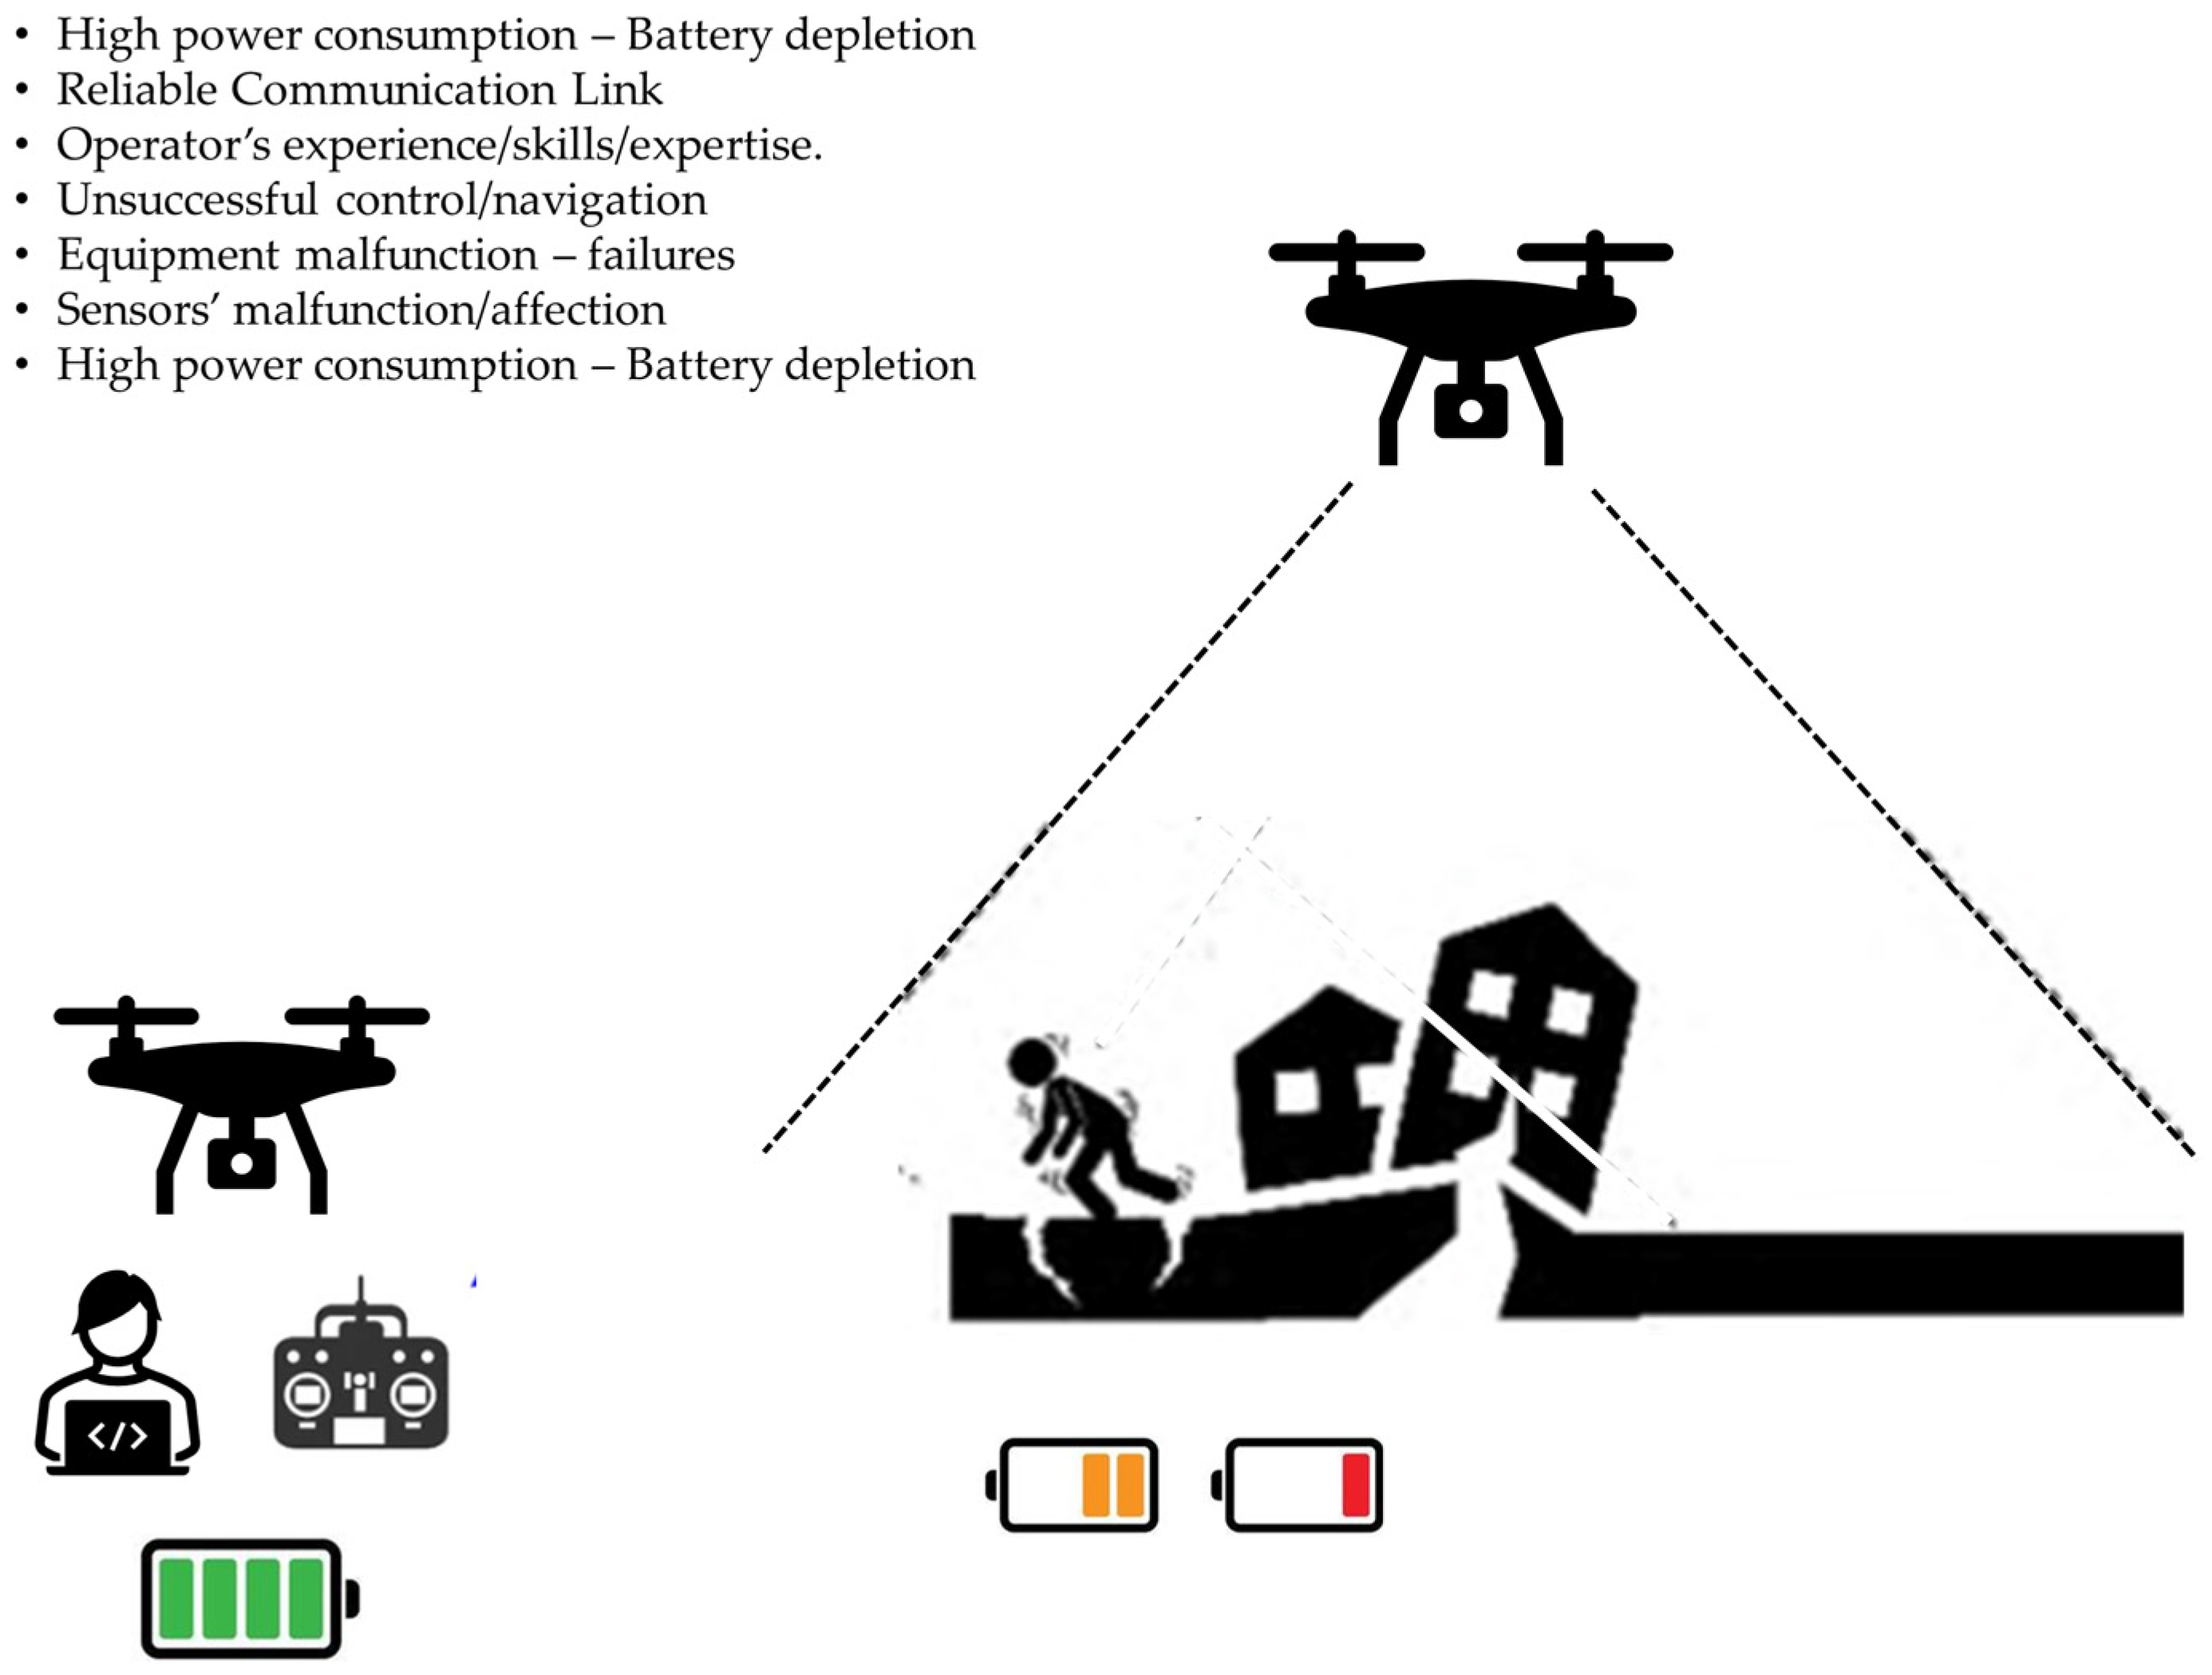
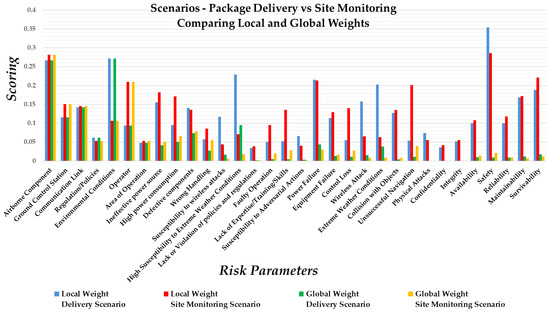
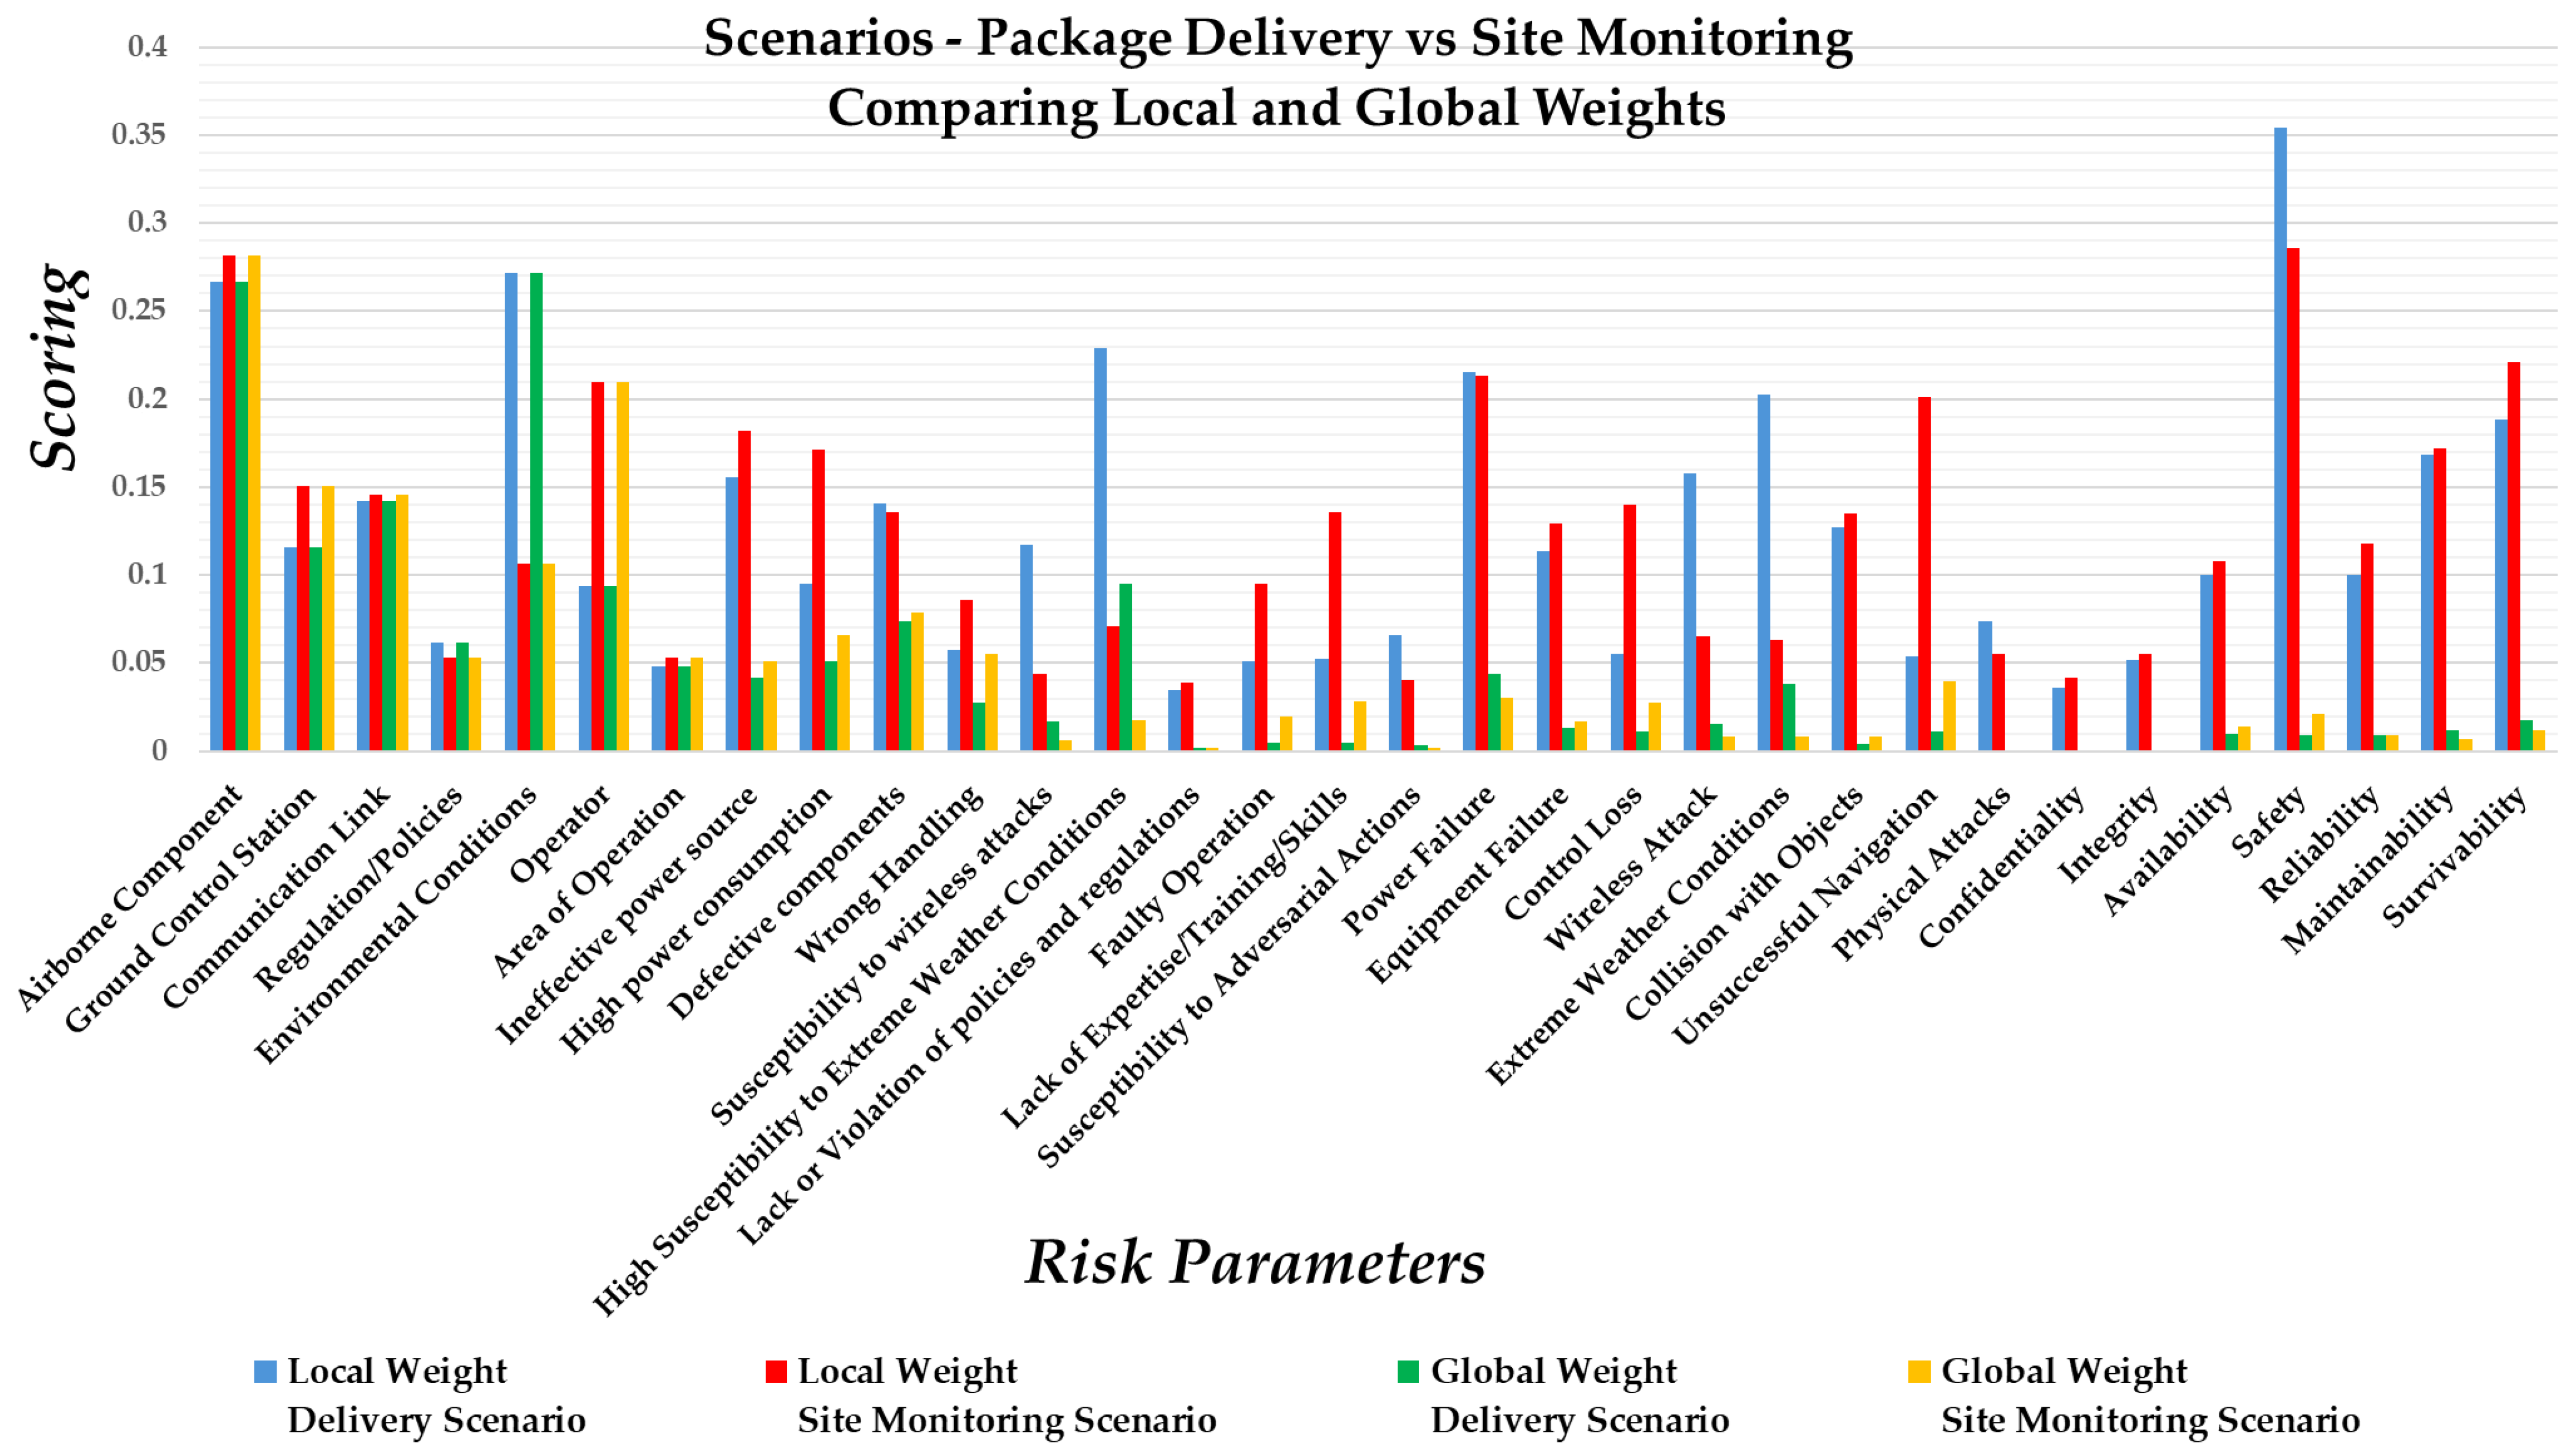

Disclaimer/Publisher’s Note: The statements, opinions and data contained in all publications are solely those of the individual author(s) and contributor(s) and not of MDPI and/or the editor(s). MDPI and/or the editor(s) disclaim responsibility for any injury to people or property resulting from any ideas, methods, instructions or products referred to in the content. |
© 2026 by the authors. Licensee MDPI, Basel, Switzerland. This article is an open access article distributed under the terms and conditions of the Creative Commons Attribution (CC BY) license.