


Highlights
What are the main findings?
- In conservation environments, ground risk is largely driven by transient populations (e.g., tourism and ranger activity), which are not reliably captured by standard population raster datasets.
- Formal safety requirements and field realities are often misaligned in wildlife operations, creating operational friction between prescribed procedures and practical execution.
What are the implications of the main findings?
- Ground-risk assessments in conservancies should prioritise bottom-up, activity-based population estimates, using raster products primarily for triangulation and sensitivity analysis.
- Reducing friction between safety requirements and field needs, through iterative crew optimisation and mission-specific procedure design, can improve both operational efficiency and procedural compliance.
Abstract
Safe Beyond Visual Line of Sight (BVLOS) operations are increasingly required for wildlife monitoring and conservation, yet existing regulatory frameworks are rarely tailored to protected areas characterised by low population density and limited infrastructure. This paper presents a field-based use case illustrating how the Specific Operations Risk Assessment (SORA) methodology can be applied to conservation-oriented BVLOS missions under Kenyan airspace conditions, including coordination within military-controlled airspace. We evaluate three population-density estimation approaches (qualitative, bottom-up, and top-down) against available ground truth, and compare tabulated and analytical SORA methods for deriving the Ground Risk Class. The work illustrates how SORA 2.5 structures ground and air risk reasoning in a conservation context, while retrospective review identifies limitations in containment, Operational Safety Objectives, and tactical mitigation performance requirements. Field trials involved five concurrent teams and 30 personnel conducting over 260 flights and more than 60 h of UAS activity across the Ol Pejeta Conservancy, providing insights into multi-team coordination under field conditions. Field implementation revealed areas of misalignment between prescribed safety requirements and operational realities, prompting iterative adaptation of workflows and procedures. Observed outcomes included reductions in team size (25–50%) and procedural steps (18%), derived from retrospective comparison of field procedures. A lightweight Uncrewed Traffic Management prototype was also trialled, revealing practical limitations in conservancy environments. Finally, we present a ten-step framework for developing field-ready safety procedures to support risk-informed decision-making in non-standard operational contexts. The findings provide empirically grounded guidance on applying SORA principles to conservation UAS missions, without proposing a new risk framework or generalised operational model.
1. Introduction
Uncrewed Aerial System (UAS) have become an important tool for wildlife conservation by enabling high-resolution data collection across large or inaccessible areas with minimal disturbance to animals [1,2,3]. Their flexibility supports increasingly demanding applications, including Beyond Visual Line of Sight (BVLOS) and multi-UAS operations [4,5]. As such operations scale in range, duration, and coordination complexity, the primary challenge shifts from platform capability to ensuring missions are conducted safely within regulatory and operational constraints. Despite a growing body of literature on conservation UAS applications, few peer-reviewed studies document how established risk assessment frameworks [6] translate into field-ready procedures in remote conservation environments. Empirical evidence remains limited on how Specific Operations Risk Assessment (SORA)-derived requirements interact with transient population exposure, limited infrastructure, and non-standard airspace governance [7,8]. As a result, friction arising from applying risk-based frameworks in conservation campaigns remains under-reported.
The SORA provides a structured framework for assessing and mitigating risks in UAS operations [9,10,11], but its application in conservation settings is challenged by remote environments, limited infrastructure, and the need to adapt flight plans to animal movement and changing local conditions. As a result, ensuring that safety requirements remain compatible with research objectives requires field testing and context-specific adaptation [12]. Within this context, this study reports on 2025 field campaigns conducted at the Ol Pejeta Conservancy in Kenya (360 km2), building on earlier operations in 2024 [13] and extending them to multi-team BVLOS deployments involving multiple UAS, pilots, and lightweight coordination tools as part of the WildDrone project [14].
1.1. Kenyan Regulatory Context
The Kenyan Civilian Aviation Authority (KCAA)’s UAS Regulations 2020 [15] classify UAS operations into Categories A–C according to operational risk and complexity. BVLOS flights fall under Category C and require integration with Air Traffic Control (ATC) and compliance with the KCAA’s Rules of the Air, summarised in Appendix A.1.
At the time of writing, the KCAA did not issue standard BVLOS authorisations pending the establishment of a national Uncrewed Traffic Management (UTM). The reported operations were therefore conducted under a specific exemption within prohibited military airspace covering Ol Pejeta, subject to prior approval and real-time coordination with Kenyan Air Force (KAF) ATC. In the absence of formal separation standards between crewed and uncrewed aircraft, airspace safety relied on procedural coordination and radio communication. The operations required both a temporary import permit for each UAS and an operational permit for the BVLOS missions [16], facilitated through the local partner Kenya Flying Labs (KFL). Further regulatory definitions, permit requirements, and document templates are provided in Appendix A.2, and the full submission set is available in an open-access repository (https://github.com/GuyMaalouf/wilddrone-hackathon-2025-bvlos-ops, accesssed on 29 January 2026).
1.2. Study Aim
This study examines how SORA 2.5 can be applied to the planning and execution of BVLOS operations in protected conservation areas characterised by low population density and limited infrastructure, within a specific Kenyan regulatory context that includes coordination with military-controlled airspace. Drawing on field campaigns conducted in Kenya, the analysis evaluates how SORA 2.5 can be adapted to conservation environments and identifies sources of friction between formal safety requirements and the practical constraints of fieldwork. The study makes two main contributions: (i) an empirical assessment of how ground risk can be characterised in conservation areas, including the treatment of transient populations and the practical use of different intrinsic Ground Risk Class (iGRC) assessment approaches, and (ii) an analysis of how risk assessment outcomes can be translated into scalable, field-ready procedures for multi-team BVLOS operations supported by lightweight coordination tools. The aim is to provide empirically grounded insights into the practical application of SORA in non-standard operational contexts, rather than to propose a new risk framework.
1.3. Research Questions
The analysis is structured around four research questions:
- RQ 1—How can SORA 2.5 guide the planning of BVLOS operations in conservation areas?
- RQ 1.1: How can SORA 2.5 ground-risk approaches be used in conservation settings, and how do they compare in that context?
- RQ 1.2: Which safety constraints affect conservation fieldwork, and how can they be addressed?
- RQ 2—How should safety procedures be designed to meet the needs of conservation fieldwork?
- RQ 2.1: How much efficiency can be gained by tailoring procedures to specific missions?
- RQ 2.2: Which procedural elements can be automated, and how does automation affect crew workload and reliability?
- RQ 3—How can BVLOS operations be scaled to multiple teams while preserving safety in the field?
- RQ 3.1: How can crew configurations be optimised to improve scalability while maintaining safety, and what trade-offs arise?
- RQ 4—What needs to happen for field-supported BVLOS operations to become fully remote?
1.4. Reading Guide
Readers seeking the main insights can begin with Section 5 (Discussion), which answers the research questions and synthesises regulatory, procedural, and operational findings. Section 2, Section 3 and Section 4 provide the supporting analysis: Section 2 outlines the SORA-guided risk assessment, including the comparison of population-density methods and tabulated versus analytical computation of intrinsic Ground Risk Class; Section 3 describes procedure design, crew coordination, and multi-team operations; Section 4 presents field results and recurring operational challenges. Appendix A summarises the Kenyan regulatory framework and permit process, Appendix B provides supplementary SORA calculations and definitions, and Appendix C contains mission-level field trial cards.
2. SORA 2.5-Based Risk Assessment in a Conservation Environment
SORA 2.5 was used as guidance to structure the risk assessment and safety planning for BVLOS operations under Kenyan airspace conditions. This section summarises how the relevant SORA steps informed the pre-operation classification of ground and air risk, and how the remaining elements of the framework were evaluated retrospectively following the January 2025 Ol Pejeta campaign, with detailed calculations, procedural artefacts, and extended analyses provided in the Appendix A, Appendix B and Appendix C to support, but not interrupt, the main narrative. Particular emphasis is placed on ground-risk assessment and the conservation-specific considerations affecting population-density estimation. Supplementary calculations and extended analyses, including post-operation evaluations of Operational Safety Objectives (OSOs), containment, and tactical-mitigation requirements, are provided in Appendix B. It is important to note that the SORA addresses only third-party ground and air risks; internal field-team safety considerations (such as wildlife encounters or heat exposure) fall outside its scope and were managed through separate operational protocols.
2.1. Step 1: Documentation of the Proposed Operation
What—Mission Objective: Conduct BVLOS flights to support wildlife conservation at Ol Pejeta, including ecological mapping, animal tracking, and environmental monitoring.
Where—Area of Operation: Flights took place within the 360 km2 fenced Ol Pejeta Conservancy in central Kenya, a sparsely populated wildlife reserve containing several lodges and camps relevant to ground-risk assessment. The area lies under KCAA jurisdiction within military-controlled airspace, requiring coordination with both civilian and military ATC.
Which—Platforms Used: A total of 14 UASs were used, combining Commercial Off-The-Shelf (COTS) and research platforms. COTS multirotors comprised DJI Mavic 3 variants (Enterprise, Thermal, Pro), DJI Mini 3, Parrot Anafi, and CoDrone systems (Aluco, Noctu). Research platforms included the “Papa Smurf” quadcopter developed by the University of Bristol. Two fixed-wing systems were deployed: the Ebee X and a solar-powered University of Bristol glider. This mix provided complementary endurance, range, and payload capabilities for the different conservation tasks undertaken.
2.2. Step 2: iGRC
Step 2 estimates the iGRC by assessing the population-density within the operational footprint. We first defined a top-down containment geometry, then applied three population-estimation methods (qualitative field knowledge, tourism-based bottom-up, and raster-based top-down) and mapped the resulting densities to iGRC using both the tabulated SORA 2.5 method and the analytical approach of SORA Annex F.
2.2.1. SORA Semantic Map and Top-Down Volume Definition
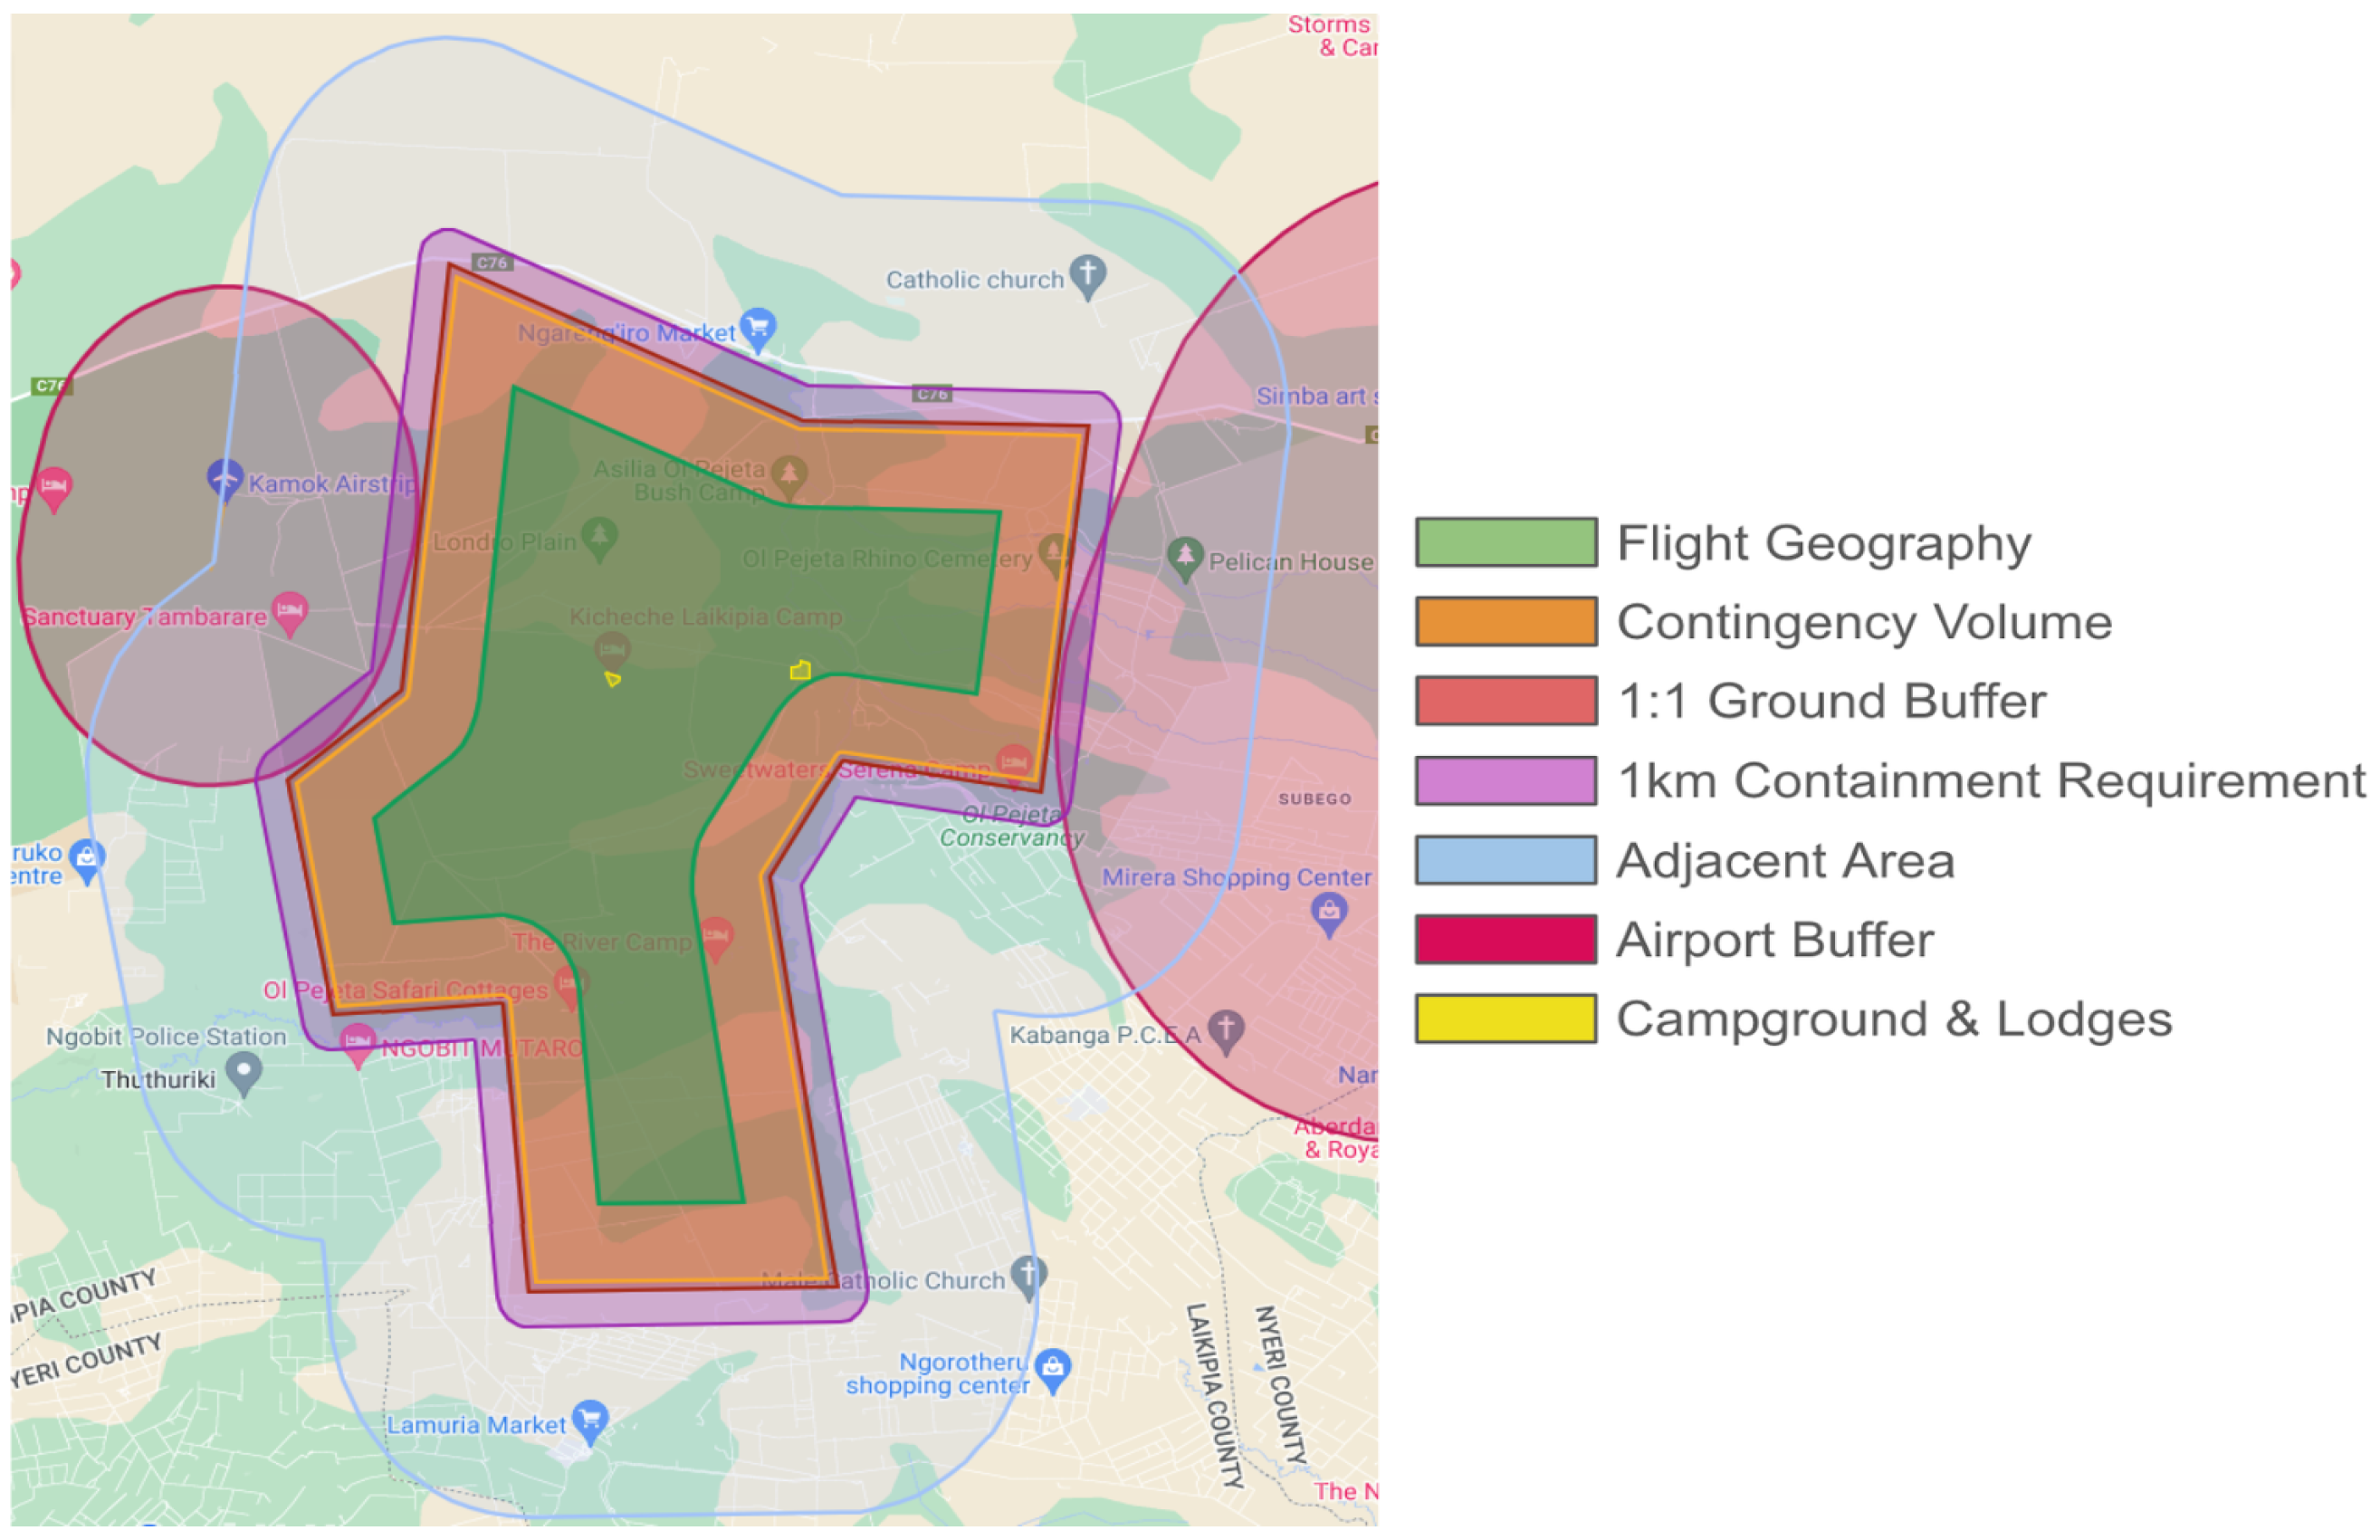
We constructed a semantic map for Ol Pejeta, seen in Figure 1, based on the SORA semantic volumes, more details available in Appendix B.1.
Figure 1.
SORA semantic map of the January 2025 field campaign. The map visualises the spatial volumes defined in SORA Step 2 to model risk containment: (1) Flight geography (green), the nominal operating area; (2) Contingency volume (orange), set by a 1.5 km horizontal buffer representing a 50 s reaction window at 30 m/s for the fastest UAS; (3) Ground-risk buffer (red), a 400 ft (120 m) band, aligned with the maximum flight altitude, reflecting the ballistic descent footprint used for iGRC determination; (4) Containment area (purple), a 1 km band beyond the ground-risk buffer used in Step 8 to verify containment and identify outdoor assemblies; (5) Adjacent area (light blue), regions outside the containment area where uninvolved people may still be exposed in failure scenarios; (6) Air-risk buffer zones (ruby red), lateral and vertical separation distances from crewed aviation activities based on the maximum UAS altitude; (7) Campgrounds (yellow), treated as sensitive zones and excluded from the operational volume during ground-risk mitigation.
A top-down approach was adopted: starting from the fenced conservancy boundary, we defined a bounded risk footprint that excludes surrounding villages and marks campgrounds as no-fly zones. This configuration aligns the ground-risk footprint with the conservancy fence, simplifies regulatory justification, and helps keep both routine and failure scenarios contained within the conservancy. Buffer-sizing considerations and a comparison with a bottom-up, path-based alternative are provided in Appendix B.2.
Note on units: This paper uses metric, imperial, and nautical units according to operational convention. Altitudes and regulatory limits are expressed in feet to match KCAA practice, horizontal distances and buffer sizes are given in metres or kilometres following UAS specifications, and airspace separation distances use nautical miles where appropriate.
2.2.2. Qualitative Estimation Using Field Knowledge
The initial iGRC assessment followed the SORA Annex F guidelines using a qualitative estimate of the average population density within the iGRC footprint (flight geography + contingency + ground-risk buffer). This estimate drew on prior BVLOS campaigns at Ol Pejeta and input from rangers and conservancy management. Human presence inside the fenced conservancy consists primarily of resident staff and their families, concentrated around staff compounds, operational centres, and a small number of lodges. Tourist activity is similarly localised around camps and attractions, with additional transient movement during game drives. Because the conservancy is fenced and not accessible to surrounding communities, there is no casual or unregulated foot traffic from outside the reserve.
Taken together, this restricted and spatially clustered pattern of human activity, combined with the absence of dense settlements or large buildings within the risk footprint, supported classifying the area as “lightly populated” (<50 people/km2). Classification criteria and supporting evidence are summarised in Appendix B.3.
2.2.3. Tourism-Based Local Estimation (Bottom-Up Approach)
A bottom-up estimate of population exposure was derived by projecting 2025 tourist visits to Ol Pejeta from official conservancy statistics (2016–2022) and regional post-COVID recovery rates from UN Tourism [17,18], yielding approximately 116,800 visitors (Figure 2).
Figure 2.
Projected annual tourist visits to Ol Pejeta Conservancy for 2016–2025. Blue markers show observed visitor numbers from official conservancy reports [19]. Shaded region highlights COVID-19 downturn from 2019–2021. Projections from 2023 onward combine United Nations World Tourism Organization (UN Tourism) regional recovery rates [17,18] with a pre-pandemic local growth trend of 7%. The central line represents the mid-range estimate, with upper and lower bounds indicating the uncertainty of recovery trajectories.
A low-season adjustment for January resulted in an average of 352 tourists per day. Assuming an even distribution across 10 active camps and adding 10 staff per camp produced an estimated 46 people/km2, corresponding to the “lightly populated” category. Intermediate values are summarised in Table 1, with derivations in Appendix B.4.
Table 1.
Summary of the calculation steps of the bottom-up population-density estimate.
2.2.4. Population Raster Analysis (Top-Down Approach)
As a complementary top-down method, residential population within the conservancy was estimated using the 2020 WorldPop gridded dataset for Kenya [20]. Rasters were analysed at 100, 200, and 500 m resolutions to assess grid-size sensitivity (Figure 3).
Figure 3.
Estimated population densities within Ol Pejeta Conservancy derived from WorldPop 2020, illustrating the effect of grid resolution on peak density estimates. At 100 m resolution, finer grids produce localised peaks with a maximum of 105 ppl/km2, while aggregation to 200 m and 500 m smooths these variations, reducing maxima to 58 and 53 ppl/km2, respectively. Annex F of the SORA recommends selecting a grid size comparable to the UAS dispersion area (≈200 m below 500 ft AGL).
A distribution derived from the 100 m grid (Figure 4) was used to characterise density variation across the operational area, yielding an average density of 12 people/km2 and a maximum of 105 people/km2. Aggregation to 200 m and 500 m reduced the maxima to 58 and 53 people/km2, respectively, illustrating how coarser grids smooth local peaks.
Figure 4.
Distribution of residential population densities across the operational area using WorldPop 2020 at 100 m resolution. Dashed lines indicate the mean, median, 99th-percentile, and maximum densities (12, 10, 37, 105 ppl/km2, respectively). This highlights the influence of isolated extremes during ground-risk assessments.
Because SORA relies on the maximum population density, the choice of raster resolution has a direct effect on iGRC classification. At 200 m and 500 m, WorldPop maxima were close to, but slightly above, the qualitative and tourism-based estimates (<50 people/km2), whereas the 100 m grid produced an isolated extreme value more than twice as high. Figure 4 shows this as a tail event, highlighting how fine-resolution rasters can introduce single-cell outliers that disproportionately influence SORA outcomes. As WorldPop represents residential, typically night-time population, it does not capture transient tourist or staff presence within the fenced conservancy. Processing steps are summarised in Appendix B.5, and the full analysis code is available on GitHub (https://github.com/GuyMaalouf/opc-worldpop-analysis, accessed on 29 January 2026).
2.2.5. Ground-Truth Validation of Population Estimates
To validate the population estimates, daily visitor records from Ol Pejeta Conservancy were used as time-bounded, post-campaign ground-truth data derived from administrative records rather than real-time tracking. The observed mean of 309 tourists/day closely matched the bottom-up estimate of 352 tourists/day, while a transient spike exceeding 550 visitors occurred on 31 January (Figure 5).
Figure 5.
Daily visitor composition in Ol Pejeta Conservancy (25 January–2 February 2025). Stacked bars show overnight and day-trip visitors recorded during the campaign period. The data reveal a stable baseline with occasional surges, including a peak on 31 January driven primarily by day visitors.
Visitor distribution across camps showed strong spatial clustering (Figure 6), with most camps hosting small groups of 5–15 guests/day and a clear outlier at Sweetwaters Tented Camp, which averaged 112 visitors/day and exceeded 200 visitors on one day.
Figure 6.
Daily visitor counts by camp (25 January–2 February 2025). Box plots summarise visitor distributions at each camp. Most sites show low, tightly clustered counts, while Sweetwaters Tented Camp emerges as a clear hotspot with substantially higher occupancy and a marked outlier (≈208 visitors), illustrating how localised peaks are not captured by raster-based or conservancy-wide averages.
Approximately 600 staff were present daily across multiple facilities. These observations confirm that the conservancy remains lightly populated on average, while revealing short-lived surges and localised hotspots that are not captured by static or coarse-resolution population models and that must be addressed through conservative planning assumptions within the SORA process.
2.2.6. Determination of iGRC Based on the SORA Table
To complete Step 2, we identified the iGRC using the tabulated method in the SORA 2.5 framework [9]. The population-density value used for the table lookup was the <50 people/km2 category, consistent with the qualitative and tourism-based methods described earlier. For the platform characteristics, we selected the University of Bristol solar-powered glider as the representative UAS because it had the largest wingspan and highest cruise speed among all platforms deployed. Its 3.8 m wingspan places it in the 3–8 m characteristic-dimension category, and its 20 m/s cruise speed falls within the <25 m/s category. Following the SORA requirement to use the higher-risk of the two, the 3–8 m column was selected.
The intersection of the <50 ppl/km2 row with the 3–8 m column results in iGRC 5. The complete table used for this classification is reproduced in Appendix B.6.
2.2.7. Refined iGRC Estimation Using Annex F
We then applied the analytical method in SORA Annex F, which replaces the stepwise table with a continuous risk metric using the critical area and population density . Using the same UAS parameters and density estimates, Annex F yielded iGRC 4, one class lower than the tabulated iGRC 5. Full calculations are provided in Appendix B.7.
This difference reflects the discrete structure of the tabulated method: the University of Bristol solar glider lies close to the boundary of the 3–8 m characteristic-dimension column, where small changes in wingspan or population estimates can produce relatively coarse shifts in the tabulated result. Annex F offers a finer-grained calculation in such edge cases, producing a slightly lower intrinsic ground-risk value.
2.3. Step 3: Final Ground Risk Class (GRC)
Starting from the refined iGRC 4 (SORA Annex F, Section 2.2.7), we applied exposure-reduction (M1) ground-risk mitigations from Annex B of SORA 2.5, implemented primarily through operational and procedural controls rather than additional onboard systems, to reduce exposure of uninvolved people (Table 2). No energy-reduction devices (M2) were available on the platforms.
Table 2.
Ground-risk exposure-reduction mitigations (M1): Measures to reduce the likelihood of uninvolved people being present within the operational footprint under SORA Annex B.
According to the Annex B reduction scheme, the combination of M1a (low), M1b (medium), and M1c (low) is valid and yields a three-step reduction, lowering the ground-risk classification from iGRC 4 to a final GRC 1. Full details are provided in Appendix B.8.
2.4. Step 4: Initial Air Risk Class (iARC)
The initial Air Risk Class (iARC) reflects the expected encounter rate with crewed aircraft in the operational volume before applying strategic mitigations. All flights took place inside the military-controlled restricted area HKR10 (Nanyuki), which overlaps a prohibited zone (HKP2) frequently used by KAF. This resulted in a classification of iARC–c.
Although the conservancy itself is rural, low-flying crewed aircraft, primarily tourist and charter traffic, were regularly observed, and one overflight during daytime operations required the UAS to descend below 30 m Above Ground Level (AGL) and temporarily pause the mission. Night flights were conservatively assigned the same iARC–c category.
2.5. Step 5: Strategic Air-Risk Mitigations
Strategic mitigations were applied before take-off to reduce the likelihood of encounters with crewed aircraft in the restricted and prohibited airspace over Ol Pejeta. These measures, combined with coordination from KAF, reduced the initial classification from iARC–c to a residual ARC–b. The applied mitigations are listed in Table 3.
Table 3.
Strategic air-risk mitigations: Measures to reduce the encounter rate with crewed aircraft.
The residual assessment relied on procedural deconfliction established by KAF ATC, including a vertical buffer between UAS operations and the lowest crewed flight levels and direct coordination before each operation. These measures ensured consistent separation within a controlled airspace and justified reducing the initial iARC–c to ARC–b.
2.6. Step 6: Tactical Mitigation Performance Requirements
For ARC–b operations, we applied the low-robustness Tactical Mitigation Performance Requirements (TMPR) defined in SORA Annex D. Tactical mitigations primarily relied on observers, ATC information, and radio-based situational awareness rather than automated detect-and-avoid systems. The measures implemented during the January 2025 campaign covered detection, decision-making, command, execution, and feedback using the available systems.
While these measures satisfy the qualitative requirements for low-robustness TMPRs, the absence of independent ground-truth air traffic data over the conservancy prevented empirical verification of detection probability, which was therefore treated as a known limitation in the retrospective assessment. A concise summary is provided in Table 4, with an adapted overview of the Annex D requirements in Appendix B.9.
Table 4.
Low-robustness TMPRs applied for ARC–b operations: The table summarises the layered detection approach, predefined contingency actions, command-and-control performance, execution times, and feedback latencies used to satisfy the Annex D low-robustness criteria.
2.7. Step 7: Specific Assurance and Integrity Level (SAIL)
The final ground risk (GRC 1) and residual air risk (ARC-b) combine to give a Specific Assurance and Integrity Level (SAIL) II operation according to the SORA Step 7 matrix. This level determines the robustness levels of containment requirements and Operational Safety Objectives (OSOs) that must be addressed in subsequent steps. The full SAIL matrix and mapping are provided in Appendix B.11.
2.8. Step 8: Containment Requirements
Containment requirements were based on adjacent-area population density and the characteristic dimension of the largest platform (3.8 m wingspan). Raster analysis of the 5 km adjacent area (Appendix B.12) indicated densities of 45–50 ppl/km2, local maxima below 500 ppl/km2, and no large assemblies within 1 km of the operational boundary.
Using the SORA 2.5 tabulated method (SORA main body Table 11 [9]; Appendix B.13), the operation corresponds to a Low containment requirement because the UAS exceeds the 3 m characteristic-dimension category. For comparison, the analytical SORA Annex F method (§5.3) was applied. The refined calculation in Appendix B.14, using people/km2, yielded . As shown in Appendix B.15, no ground-risk mitigations applied in the adjacent area, and Appendix B.16 reports the corresponding Annex F Table 27 [9] outcome of no containment requirement for a SAIL II operation.
Both methods indicate minimal population exposure outside the conservancy, with the Annex F analytical approach yielding a less conservative yet compliant result. This reflects the intended SORA 2.5 trade-off: the tabulated method provides a faster, conservative option, whereas the analytical method requires additional effort but offers a more representative assessment in non-standard environments such as wildlife conservancies.
2.9. Step 9: Operational Safety Objectives (OSOs)
Due to timeline constraints, a clause-by-clause OSO assessment was not performed before fieldwork; instead, operational safety was ensured through pre-defined procedures, training, and checklists. Following the campaign, the operation was retrospectively reviewed against SORA 2.5 Annex E requirements for a SAIL II mission to assess compliance.
The review showed that several OSOs were met, others were partially met (typically due to incomplete documentation such as maintenance records or the absence of an Emergency Response Plan), and one OSO was not met, with the identified gaps primarily reflecting limitations in organisational assurance and documentation maturity rather than deficiencies observed during in-field operations, thereby providing a structured basis for prioritising improvements in future campaigns. A summary of OSO compliance is provided in Table 5, with detailed integrity and assurance justifications in Appendix B.17.
Table 5.
Summary of compliance with the Operational Safety Objectives (OSOs) applicable to a SAIL II operation. Detailed integrity and assurance justifications are provided in Appendix B.17.
2.10. Step 10: Comprehensive Safety Portfolio (CSP)
The final stage compiles all evidence generated across the previous SORA steps into a CSP. Although a formal one was not submitted to the KCAA, the materials produced for this project (operational description, risk assessment, and permit-application documents) effectively constituted the project’s version of a CSP. Together, they demonstrated how the operation addressed the safety claims and derived requirements for a SAIL II context. Future iterations would benefit from a structured compliance matrix to explicitly map each claim to its supporting evidence and improve traceability within the CSP.
3. Procedures Setup and Development
Building on the SORA-based risk framework, this section describes how safety requirements were translated into operational practice during the January 2025 field campaign at Ol Pejeta Conservancy, including organisational setup, coordination workflows, and standard operating procedures co-designed by safety specialists and field biologists.
Methodological scope of efficiency metrics: All efficiency metrics are derived from retrospective operational comparisons rather than controlled experiments. Baselines reflect conservative early-campaign configurations, while reduced configurations result from validated adaptations introduced with increased operational experience.
3.1. Crew Configurations and Roles Refinement
Operations initially employed a conservative crew structure with one pilot, one co-pilot, and dedicated airspace and ground observers per UAS (Figure 7a), ensuring redundancy and clear task separation during procedure validation and establishing a baseline for subsequent crew-scaling decisions. As operational confidence increased, observers were shared between teams operating from the same site (Figure 7b), with overlapping monitoring sectors allowing one observer pair to provide full coverage without exceeding workload limits.
Figure 7.
Evolution of crew configurations across field campaigns. The initial setup (a) used four dedicated roles per UAS. The Multi-UAS setup (b) shared airspace and ground observers where fields of view overlapped. In the Swarm setup (c), synchronised missions allowed co-pilots to be shared. The Extended Field setup (d) merged the co-pilot and airspace-observer roles, with a 250 ft (75 m) AGL altitude limit to compensate for reduced airspace monitoring redundancy.
This Multi-UAS setup was used when two teams co-located, typically during coordinated missions. It reduced staffing from 8 to 6 people, corresponding to an observed 25% reduction, without observed safety degradation, through defined sectors and coordinated timing. Table 6 summarises crew-size progression.
Table 6.
Crew-size optimisation across operation types. Summary of how crew refinements supported safe scaling as the number of UAS increased. Values indicate total personnel for each configuration and the reduction relative to the initial setup.
For swarm operations, 3 UAS flew synchronised missions using identical checklists, allowing the co-pilot role to be shared through centralised oversight (Figure 7c). This setup required 6 operators for 3 UAS, a 50% reduction relative to the initial configuration. By contrast, independent multi-UAS missions retained dedicated co-pilots because differing objectives required continuous availability for monitoring and emergency response.
During the extended campaign (February–June 2025), biologists operated in separate areas and required independent teams. Lower personnel availability and long-duration missions made larger crews impractical, so the co-pilot and airspace-observer roles were merged resulting in a three-person crew per UAS (Figure 7d). Across four teams, staffing decreased from 16 to 12 people (25% reduction). Because this combined role increased cognitive workload and reduced airspace-awareness robustness, maximum altitude was limited to 250 ft (75 m) AGL to reduce the likelihood of encounters with crewed traffic.
Overall, crew structures were simplified progressively as operational evidence accumulated, enabling reduced staffing while maintaining equivalent safety assurance.
3.2. Operations Planning and Coordination
Daily morning and afternoon briefings structured the overall coordination of up to 5 concurrent teams. These map-based sessions used the conservancy’s predefined patrol blocks to allocate scientific tasks, assign personnel and vehicles, and confirm platform availability. Patrol blocks were selected to avoid spatial overlap. When two teams required the same area, they merged and conducted the activity as a coordinated multi-UAS operation, with pilots positioned together to maintain direct verbal communication.
3.2.1. Third-Party Coordination
Team movements were reported to the Ol Pejeta radio room upon departure and return to maintain awareness of active UAS operations and to support rapid incident response. External communication with ATC was centralised through a single safety manager via mobile phone. ATC was contacted once before and once after each operational window, and the conservancy was treated as a single UAS operation for these exchanges, removing the need for team-level notifications.
3.2.2. Digital Coordination with WildOps
To support airspace coordination, a lightweight digital UTM prototype, WildOps (https://github.com/GuyMaalouf/WildOps-public, accessed on 29 January 2026), was trialled during the campaign. Pilots submitted planned missions by specifying the operation type (VLOS/BVLOS), time window, and take-off location, which were visualised as airspace volumes for approval by the safety manager.
In practice, this workflow was poorly aligned with field operations: although patrol blocks were assigned in advance, take-off locations were typically determined only after arriving on site and locating target animals, making pre-entry of coordinates impractical. On-site use required a laptop and mobile hotspot, increasing setup time, reducing usability in bright outdoor conditions, and adding workload during time-critical mission phases, while the lack of integrated positioning on laptops further complicated location entry.
Operationally, the safety manager required only confirmation that teams remained within the authorised flight geography and sufficiently separated from one another. This was more efficiently achieved by sharing a GPS pin via WhatsApp directly from the pilot’s mobile device, enabling rapid manual verification without detailed airspace visualisation or additional hardware.
Overall, the trial illustrates that desktop-based, pre-flight UTM workflows are poorly suited to dynamic conservation environments. Effective coordination in such contexts requires mobile-first tools with minimal user input, automatic position reporting, and interfaces designed for rapid, in-field decision-making rather than pre-planned submissions.
3.3. Operational Procedures, Iterations and Refinements
Field activities followed standard procedures spanning planning, pre-flight, in-flight, and post-flight phases, supported by contingency and emergency procedures. To manage these consistently across multiple operation types, the WildProcedures (https://github.com/GuyMaalouf/WildProcedures-checklist-generator, accessed on 29 January 2026) software was introduced. It maintained a central JSON (JavaScript Object Notation) database in which procedures were tagged by operation type (day/night, VLOS/BVLOS, with/without remote observer) and number of UAS (single, multiple, or swarm). A single command generated (i) a detailed procedures document and (ii) a compact field checklist. This automated approach replaced numerous static templates used during the June 2024 campaign and enabled rapid iteration, traceability, and customisation.
3.3.1. Adaptation Across Operation Types
Procedures were adapted to reflect differences in visibility, communication requirements, observer roles, and platform coordination, while maintaining a consistent core safety structure across all missions. Table 7 summarises how steps and equipment were tailored to match each operation type.
Table 7.
Procedural adaptations across operation types during WildDrone 2025 field activities.
3.3.2. Measured Efficiency Gains from Customisation
Table 8 reports the observed reduction in checklist items achieved through customised procedures (excluding contingency and emergency protocols), showing an average decrease of about 18%. This reduction serves as a practical proxy for time savings.
Table 8.
Efficiency gain (%) across operation types, shown as the reduction in checklist items relative to the non-customised baseline. Gains were highest for simpler configurations such as VLOS, with smaller improvements for multi-UAS and extended-range BVLOS operations.
Figure 8 shows that all efficiency gains occur before take-off, where streamlining has the greatest operational impact. These stages are time-sensitive, as rapid preparation affects the ability to observe or track wildlife.
Figure 8.
Efficiency gain per checklist through customisation, expressed as the reduction in checks relative to the baseline procedure set. Customised checklists were generated automatically by WildProcedures based on operation type and number of UAS. Most gains occur in the preparation stages before take-off, while later procedures remain unchanged due to their standardised structure.
3.3.3. Evolution of Procedures over Time
Procedures were refined iteratively through co-development between safety specialists and field biologists to streamline workflows while maintaining safety. Table 9 summarises the main areas of improvement and their outcomes.
Table 9.
Progressive refinement of operational procedures between January and March 2025.
4. Field Trials & Observations
The field trials presented in this section include both the WildDrone Hackathon operations conducted at Ol Pejeta Conservancy in January 2025 and the extended field campaigns that followed between February and June 2025. Together, these missions spanned diverse operational conditions and team configurations, providing a broad empirical basis for evaluating the practical application of the SORA-based safety framework introduced in Section 2. Rather than analysing individual missions in isolation, the trials are used to identify recurring operational constraints and mitigation patterns that inform the cross-cutting discussion in Section 5. They also support the operational insights discussed in Section 5, where five recurring constraints and their management strategies are examined:
- (A)
- Large teams limit scalability but can be reduced safely through gradual optimisation;
- (B)
- Repeated missions improve efficiency but require training to sustain vigilance;
- (C)
- Range limits create time pressure but expansion depends on safe airspace integration;
- (D)
- Environmental factors elevate operational risk and require crew-safety measures;
- (E)
- Co-development ensures procedures remain practical and field-ready.
These observations illustrate how regulatory planning translated into field practice and provide the empirical grounding for the synthesis and generalisation presented in Section 5.
Summary of Field Trial Cards
Each operation was documented using a standardised Field Trial Card, ensuring consistent reporting of objectives, procedures, and observations. Table 10 summarises the missions at a high level, while Appendix C provides the full operational details. Together, they demonstrate how recurring patterns observed across heterogeneous missions underpin the higher-level discussion of safety, scalability, and operational trade-offs in Section 5.
Table 10.
Summary of field operations conducted during and after the WildDrone Hackathon 2025.
5. Discussion
This section synthesises the main findings and addresses the research questions (Section 1.3), drawing on quantitative results and qualitative observations from Section 2, Section 3 and Section 4. It interprets how SORA 2.5 can guide BVLOS operations in protected areas characterised by low population density, limited infrastructure, and dynamic field conditions, and extracts transferable insights for other non-standard operational environments with comparable ground and air risk profiles, while recognising that quantitative efficiency gains are context-dependent.
- RQ1. How Can SORA 2.5 Guide the Planning of BVLOS Operations in Conservation Areas?
The findings indicate that SORA 2.5 can guide BVLOS planning in conservation areas by clarifying dominant ground- and air-risk drivers and supporting proportionate mitigation strategies. As illustrated in Section 2, the framework helped distinguish risks requiring strategic spatial mitigations from those manageable through field procedures, informing decisions on flight exclusion areas, separation from aerodromes and roads, and conditions under which night operations remained acceptable. While specific mitigations remain context-dependent, this SORA-guided reasoning is applicable to other low-density, time-sensitive deployments where air risk is managed procedurally rather than through dense supporting infrastructure, such as remote environmental monitoring, disaster response, and search-and-rescue operations [33,34,35,36].
The assessment resulted in a sail II classification, after which operational safety was delivered primarily through structured field procedures. A retrospective review of relevant OSOs showed broad consistency with sail II expectations, indicating that well-designed field practices can achieve outcomes compatible with the framework. Future campaigns should formalise this alignment through more comprehensive OSO documentation.
A continuing limitation is the absence of reliable real-time air-traffic information, which reduces confidence in air-risk assumptions [37,38]. Progress in such environments will depend on improved airspace situational awareness, particularly through simple, affordable, and privacy-preserving Electronic Conspicuity (EC) solutions.
- RQ1.1. How Can SORA 2.5 Ground-Risk Approaches Be Used in Conservation Settings, and How Do They Compare in That Context?
- A—Population estimation relies more on local knowledge than modelling
Three population-density estimation approaches were compared against post-campaign daily administrative records used as ground truth, collected after more than 260 flights. The qualitative method provided reasonable first estimates but remained subjective where prior field knowledge was limited, while the bottom-up approach yielded similar values but required access to camp records that may not always be available. Raster-based estimates aligned only incidentally with these methods, as nearby village populations spilled into the conservancy and transient groups such as tourists and rangers, who constituted most people present during operations, were undercounted. Ground-truth observations confirmed this mismatch, revealing concentrated activity near Sweetwaters Camp that none of the models captured. Overall, reliable population inputs for SORA applications in conservancies require direct engagement with site managers and, where possible, on-site reconnaissance; raster products should therefore be treated as a secondary reference when field data cannot be obtained [39].
- B—Raster-based population estimates have limitations
The raster analysis highlighted three factors influencing intrinsic ground-risk classification. First, grid resolution affected apparent density: at Ol Pejeta, WorldPop estimates ranged from 105 ppl/km2 at 100 m to 53 ppl/km2 at 500 m, with 200 m providing the most representative scale in line with SORA Annex F guidance [40]. Second, maximum-cell values overstated exposure, as isolated 100 m cells exceeded 100 ppl/km2 while 99% of the area remained below 37 ppl/km2, suggesting percentile-based thresholds may provide a more stable representation. Third, global rasters omitted transient activity, which dominated human presence in the conservancy. Together, these factors indicate that raster-based estimates require careful interpretation and supplementation with local knowledge.
- C—Annex F analytical estimation provides a more representative assessment
Using a representative density, the intrinsic ground-risk class was computed with both the tabulated and analytical SORA Annex F methods. The lookup table placed the 3.8 m UAS just above a category threshold, resulting in iGRC 5, whereas the continuous analytical method yielded iGRC 4. This one-class difference reflects the conservative nature of tabulated approaches near boundaries; while it did not affect the resulting SAIL in this case, it could ease downstream requirements in other contexts. Analytical estimation is therefore preferable near boundary conditions, as it provides a more proportional assessment while remaining feasible with standard computational tools.
- RQ1.2. Which Safety Constraints Affect Conservation Fieldwork, and How Can They Be Addressed?
This section outlines the main safety constraints observed during field operations and how they can be addressed within a SORA-guided framework.
- A—Large teams limit scalability but can be reduced safely through gradual optimisation
Early missions relied on large teams, increasing coordination overhead and limiting scalability. Roles were progressively combined (e.g., shared observers and merged co-pilot/airspace-observer), enabling reductions without overloading individuals [41]. Crew optimisation should proceed incrementally, with clear role definitions and checks that reductions do not degrade airspace awareness, supported by mitigations where needed.
- B—Repeated missions improve efficiency but require training to sustain vigilance
Daily repetition improved coordination and reduced setup times as teams became familiar with checklists and terrain. However, routine operations and increasing automation risked reduced vigilance, particularly in multi-UAS contexts [42]. In-flight checklists therefore prompted active cross-checks of telemetry, airspace status, and observer reports. Sustaining efficiency without loss of alertness requires structured and recurrent training.
- C—Range limits create time pressure but expansion depends on safe airspace integration
Limited range created time pressure when animals moved quickly, highlighting the need for efficient coordination and repositioning. These constraints were driven primarily by airspace integration: many crewed aircraft over conservancies are non-cooperative and electronically invisible, requiring human observers to maintain separation. Extended-range missions (≤2 km by day, ≤5 km at night) therefore relied on remote airspace observers to maintain visual coverage, improving safety but increasing logistical complexity. Future BVLOS expansion depends on improved airspace-situational-awareness systems capable of detecting cooperative and non-cooperative aircraft; until then, hybrid approaches combining digital tools and observers remain the most practical solution.
- D—Environmental factors elevate operational risk and require crew-safety measures
Vegetation, wind, wildlife proximity, and night operations affected visibility, positioning, and line-of-sight continuity [43], requiring adjustments to launch sites and observer placement. Environmental limits were encoded in checklists, while crew-safety risks were managed through field protocols. Procedures should explicitly define the environmental conditions under which they remain valid, integrating operational and crew-safety considerations.
- E—Co-development ensures procedures remain practical and field-ready
Procedures developed during early missions were conservative and poorly adapted to field realities. During the January 2025 campaign, collaborative refinement by safety specialists and field teams removed redundancies, reordered steps, and strengthened contingency responses, including additional checks following an incoming crewed aircraft event. Iterative co-development maintains alignment with SORA expectations while ensuring procedures remain usable in daily conservation operations.
- RQ2. How Should Safety Procedures Be Designed to Meet the Needs of Conservation Fieldwork?
Developing safety procedures for conservation operations requires balancing regulatory requirements with field practicality. This section presents a compact methodology for designing field-ready procedures that remain clear, usable, and safe in dynamic field conditions, and that is applicable to other low-density, time-sensitive deployments.
- 1.
- Define scope and inputs: Specify operational scope (normal, contingency, emergency) and context (terrain, airspace, wildlife rules, UAS type, crew roles), consistent with SORA Annex E OSO #08(a) [9], ISO 21384-3 [44], and ICAO Doc 10019 [45].
- 2.
- Design the checklist family: Create checklists for planning, pre-/post-operation, all flight phases, emergency, and contingency. Keep emergency and contingency lists readily accessible, and maintain both detailed procedures and concise field checklists [44,45].
- 3.
- Apply clear placement rules and initiation anchors: Shift tasks that can be completed off-site to pre-operation; avoid repeated power cycles within a phase; use full checks only for the first flight and a reduced set for subsequent flights. Define initiation anchors for each checklist (e.g., pre-operation at the vehicle, first flight on arrival, subsequent flights before take-off, post-flight at landing) [46].
- 4.
- Set the right level of detail: Keep lists short and readable. Combine low-workload actions that occur together, separate safety-critical steps, use clear action verbs, avoid negations, and do not cluster demanding actions at the same moment [46,47].
- 5.
- Express environmental limits as field cues: Translate wind, visibility, terrain, and vegetation constraints into simple observable cues [9,45] so crews can apply limits without relying on instruments alone.
- 6.
- Minimise the “subsequent flight” checklist: After configuration and calibration are confirmed [9,46], retain only essential recurring steps: logging, power-up, battery and SD-card changes, error checks, GNSS and link confirmation, brief weather scan, team brief, go/no-go decision, take-off call, and immediate post-lift performance check.
- 7.
- Manage crew fatigue and workload: Apply fatigue-management principles (rest, hydration, role rotation, recovery days) rather than fixed-hour limits. Include the IMSAFE check in pre-operation and launch phases to confirm fitness to operate [9,45].
- 8.
- Separate emergency, contingency, and Emergency Response Plan (ERP): Define emergency procedures for immediate abnormal events, contingency procedures for predictable degradations, and the ERP for post-accident actions (e.g., crash, fire, injury, airspace incident), including relevant contact details [9,44,45].
- 9.
- Ensure formatting and legibility: Apply human-factors design principles: clear typography, left alignment, sufficient spacing, consistent structure, strong contrast, and visual emphasis on high-importance actions without implying optionality [46,47,48].
- 10.
- Validate and refine iteratively: Test procedures via table-top reviews and limited flights, refine them through daily debriefs, and maintain version control and change logs. Where higher assurance is required, follow SORA Annex §E.3 [9] and accepted means of compliance such as ASTM F3178-16 [49].
- RQ2.1. How Much Efficiency Can Be Gained by Tailoring Procedures to Specific Missions?
Tailoring procedures to mission type reduced the number of checks per operation by an average of about 18%, with most savings occurring before take-off, particularly during pre-flight and first-flight phases. Although this reduction is only a proxy for time saved and was not derived from a formal time–motion study, it indicates that modest adjustments to preparation steps can yield meaningful efficiency gains in daily fieldwork [47].
These gains resulted from aligning procedures with operational context. Differences in range, time of day, and number of UAS produced distinct risk profiles that warranted targeted adaptations: night missions required different equipment and omitted day-specific checks, while multi-UAS operations introduced coordination and vertical-separation checks to prevent conflicts during take-off and landing. Such tailoring removed irrelevant steps without compromising safety, and similar differentiation could extend to UAS-specific procedures as platform data become more standardised.
Using a centralised database in WildProcedures (https://github.com/GuyMaalouf/WildProcedures-checklist-generator, accessed on 29 January 2026) ensured that customisation did not erode standardisation. Automatically generating tailored checklists reduced checklist habituation [46,47] by removing items with no operational relevance, improving both efficiency and operator vigilance.
Overall, procedural tailoring offers the greatest benefit in operations with variable configuration or risk, such as changing range, complexity, or number of UAS, which is typical of field-deployed, time-sensitive missions. For repetitive single-UAS operations under uniform conditions, efficiency gains are more limited.
- RQ2.2. Which Procedural Elements Can Be Automated, and How Does Automation Affect Crew Workload and Reliability?
Automation can reduce workload by handling routine tasks, improving situational awareness, and reducing manual errors. Its greatest value lies in planning and pre-flight phases, where information gathering and verification dominate. In-flight tools can support vigilance through periodic prompts, while packing, inspection, and post-flight tasks remain largely physical and offer limited scope for automation. Similar task boundaries have been reported in other time-sensitive field operations, including emergency response and remote environmental monitoring, where preparation benefits most from automation while in-field decision-making remains human-centred.
Fully automatable elements include retrieving airspace and weather data, checking crew qualifications, and generating mission-specific checklists. Partial automation is appropriate near operational limits, where systems can flag uncertainty but require human confirmation. Safety briefings, final go/no-go decisions, and emergency coordination with ATC must remain human-led.
Automation also introduces human-factors risks, including reduced attention (automation complacency), over-trust (automation bias), and skill degradation (out-of-the-loop effects) [50,51,52,53]. Mitigation requires guardrails such as confirmation prompts, challenge–response calls, and periodic checks that maintain operator engagement.
Overall, automation can reduce workload and omissions while supporting situational awareness, but it should complement rather than replace human judgement, particularly during contingencies. Future work should examine how specific automation features affect workload, vigilance, and reliability in real operations.
- RQ3. How Can BVLOS Operations Be Scaled to Multiple Teams While Preserving Safety in the Field?
Scaling multi-team BVLOS operations requires clear spatial organisation, predictable workflows, and shared situational awareness [54]. The practices below summarise methods applied during five-team field operations (over 260 flights and 60 h) and are relevant to other low-density, time-sensitive deployments where multiple crews operate concurrently under procedural airspace separation. These insights are based on repeated operational use and qualitative safety outcomes rather than controlled comparative experiments.
1. Defined flight zones support effective deconfliction: A shared operational map defining authorised flight areas and contingency zones provides a common spatial reference and reduces overlap [55]. Dividing the area into clear zones simplifies coordination without relying on precise GPS positioning.
2. Operational windows reduce coordination load: Fixed activity windows (e.g., morning, afternoon, night) streamline logistics, improve resource sharing, and reduce the likelihood of overlapping operations [55].
3. Centralised supervision strengthens operational safety: A central safety manager maintains oversight across teams [54], confirms compliance with authorised geographies, and acts as the single point of contact with ATC and external authorities, preventing inconsistent reporting.
4. Robust coordination is essential for safe separation in shared airspace: When multiple UAS share airspace, co-located pilots can coordinate take-off and landing verbally, supported by standard vertical-separation rules. In multi-UAS missions this maintains independent trajectories, while swarm operations rely on synchronised checklists and a shared mission objective.
5. Reliable communication ensures safe coordination: Communication channels should be verified before each flight, with multiple technologies used to provide redundancy and maintain connectivity between teams.
6. Continuous feedback sustains safety at scale: Debriefs after each operational window identify coordination issues and inefficiencies. Feeding this information back into procedures and checklists helps prevent gradual erosion of safety margins as operational tempo increases.
- RQ3.1. How Can Crew Configurations Be Optimised to Improve Scalability While Maintaining Safety, and What Trade-Offs Arise?
Optimising crew configurations requires reducing team size without undermining workload balance or situational awareness. Field experience showed that once procedures stabilise and task demands become predictable, roles can be merged progressively in a structured manner [56]. Similar crew-scaling dynamics have been reported in other field-based BVLOS contexts relying on procedural airspace separation rather than infrastructure-supported detect-and-avoid, indicating applicability beyond conservation settings. The principles below summarise how teams can scale while managing safety trade-offs.
- 1.
- Begin with conservative crew configurations and iterate toward efficiency: Early missions should use larger teams to keep workload low while procedures mature. As processes stabilise, compatible roles can be merged through iterative review without loss of situational awareness [57].
- 2.
- Balance operational needs with safety trade-offs: Smaller teams may be necessary under field constraints but increase workload and reduce redundancy. When reductions are unavoidable, compensatory measures such as limiting altitude, range, or mission complexity should be applied, and reductions implemented only once their effects are understood.
- 3.
- Leverage shared roles in multi-UAS and swarm operations: In multi-UAS missions, observers can be shared if coverage areas are clearly defined. Swarm operations allow further role sharing (e.g., co-pilots) when UAS follow the same checklist and timing, provided responsibilities remain explicit.
- 4.
- Merge roles that share a single operational focus: Role consolidation is most effective when tasks contribute to a single operational focus. For example, co-pilot and airspace-observer roles may be combined due to their shared aviation-safety objective, whereas wildlife-observer roles require independence. Clear responsibility boundaries reduce cognitive switching and simplify qualification.
- 5.
- Maintain vigilance through cross-checks: Routine operations can reduce alertness; short challenge–response calls help maintain focus and prevent complacency during low-workload phases.
- RQ4. What Needs to Happen for Field-Supported BVLOS Operations to Become Fully Remote?
This discussion reflects the authors’ perspective on potential pathways toward remote BVLOS operations and is intended as an interpretative outlook rather than a statement of regulatory fact.
Transitioning from field-supported to fully remote BVLOS operations requires progressively replacing on-site roles with reliable airspace integration, communication, and autonomy. Drawing on evidence from this study, prior work on remote UAS integration [58,59], and current regulatory trends, this section outlines a plausible and transferable pathway rather than quantitative performance claims. The progression is incremental: extending range with minimal personnel, reducing local roles as assurance grows, and ultimately enabling remote or autonomous concepts such as UAS-in-a-box. Although derived from conservation deployments, these constraints and pathways apply to other low-density, time-sensitive operations, including rural disaster response, search and rescue, and remote environmental monitoring.
- A.
- Airspace integration as the primary enabler
The main barrier to remote BVLOS operations is airspace integration, particularly in regions with mixed cooperative and non-cooperative traffic and limited surveillance infrastructure. Under the SORA TMPR framework [9], operators must detect a significant proportion (50∼90%) of intruding crewed aircraft, yet poor characterisation of traffic behaviour in regions such as sub-Saharan Africa prevents meaningful verification of detection performance. As a result, operational range remains constrained by visual observer coverage.
Emerging regulatory approaches emphasise EC for cooperative airspace management. The U.S. Part 108 draft rule links right-of-way to broadcast status [60], Europe’s U-space framework similarly relies on EC [61], and ADS-L provides a lightweight transmission option [62,63]. Trials such as the UK i-Conspicuity programme demonstrate detection ranges beyond 10 km, though cost, privacy, and interoperability remain barriers [64,65,66]. Universal EC adoption offers the most scalable path, while non-cooperative sensing suits specialised contexts [67].
- B.
- Evolution of air-risk methodology
While SORA 2.5 strengthened ground-risk and containment structures, air-risk logic (ARC and TMPR) remains conservative. Field experience shows reliance on procedural mitigations and human-centred responses. As EC adoption increases, detect-and-avoid systems will require staged validation, beginning with conservative separation and relaxing criteria as evidence accumulates, mirroring earlier scaling of field-supported multi-UAS operations.
- C.
- Connectivity and command resilience
Beyond airspace integration, Command and Control (C2) resilience becomes the next constraint. Current operations rely on RF line-of-sight links over 2–5 km, whereas remote missions require redundant architectures combining RF, cellular, or satellite links. Increasing range will favour higher-level intent-based control over continuous low-level inputs. Studies such as GENIUS indicate that 5G can meet safety-critical requirements, though rural coverage remains uneven [68]. Autonomous functions must tolerate short link losses and execute predefined contingencies, consistent with OSO #06 and OSO #13.
- D.
- Incremental pathway toward remote operations
Progress toward remote BVLOS operations should follow a staged approach: start conservatively, validate performance, and expand complexity gradually. Interoperable EC and shared airspace situational awareness form the immediate foundation, enabling advances in connectivity and autonomy through evidence-based testing. Remote operations thus represent a continuation of learning cycles toward safer, more scalable UAS integration.
6. Conclusions
This study examined how SORA 2.5 can guide multi-team BVLOS operations in protected, low-density conservation areas, using field campaigns conducted in Kenya as an empirical basis. Rather than proposing a new risk framework, the work illustrates how SORA outputs can be interpreted and operationalised in environments characterised by limited infrastructure, transient populations, and procedural airspace management.
The analysis combined ground- and air-risk assessment with operational evidence from over 260 flights and more than 60 h of activity. Qualitative, bottom-up, and raster-based population estimates all indicated lightly populated conditions, but ground-truth records showed that global rasters can under-represent transient exposure associated with tourism and ranger activity. This reinforces the need for local data when assessing ground risk in conservation settings. Near threshold cases, the Annex F analytical method produced a less conservative intrinsic Ground Risk Class than the tabulated approach, while a retrospective review against Annex E clarified which Operational Safety Objectives were satisfied in practice and where further evidence is required. Although derived from a single conservancy, these risk-assessment challenges and trade-offs are representative of other low-density, time-sensitive field deployments.
Operationally, the campaigns demonstrated that structured spatial planning, shared procedures, and central oversight can support concurrent BVLOS missions with multiple teams. Progressive crew restructuring reduced team size by approximately 25–50% while maintaining observed safety margins, and mission-specific procedures generated using WildProcedures reduced checklist length by an average of 18%, with most gains occurring before take-off. These figures are indicative rather than statistically validated, but they show how procedural tailoring can improve efficiency without eroding safety. A lightweight coordination tool (WildOps) supported situational awareness but proved ill-suited to highly mobile crews and intermittent connectivity, highlighting that digital tools must be designed around field constraints rather than control-room assumptions. The resulting ten-step procedure-design framework provides a reusable, field-ready structure for translating SORA objectives and human-factors guidance into practical checklists for conservation and similar low-infrastructure operations.
Taken together, the findings show how SORA-informed risk assessment, locally grounded population estimation, compact crews, and tailored procedures can support scalable BVLOS operations while preserving safety transparency. For regulators and practitioners, the study illustrates how SORA 2.5 can be adapted to fenced reserves and procedurally managed airspace, how analytical ground-risk methods can avoid unnecessary conservatism, and how lightweight procedure-generation tools can support assurance arguments in the field.
Limitations and Future Work
This work is limited to a single conservancy, a specific regulatory context involving military-controlled airspace, and a restricted set of UAS platforms. Efficiency and safety claims are based on checklist structure, crew configuration, and observed operations rather than formal time–motion studies or incident statistics. Future work should strengthen evidence for partially satisfied Operational Safety Objectives, particularly those related to tactical mitigation performance, through systematic measurement of workload, timing, and safety events. The procedure-design approach and WildProcedures should be extended to additional platforms and environments, while coordination tools such as WildOps require mobile-first, connectivity-aware redesign to support wider EC adoption, improved detect-and-avoid performance, and resilient communications beyond short-range radio links, enabling a gradual transition to fully remote BVLOS operations.
Author Contributions
Conceptualization, G.M., K.J. and U.P.S.L.; methodology, G.M., T.S.R., D.R.G., M.W., B.R.C., U.P.S.L. and K.J.; software, G.M.; validation, T.S.R., D.R.G., M.W., B.R.C., U.P.S.L. and K.J.; formal analysis, G.M. and K.J.; investigation, E.P., B.R.C., S.A., E.G.A.R., K.M., T.v.d.S., L.L.-D., C.R.S.-J., C.A.M.C., V.S., E.I., J.K., D.N.N. and W.N.; resources, T.S.R., D.R.G., M.W., B.R.C., U.P.S.L. and K.J.; data curation, G.M., E.P., S.A., E.G.A.R., K.M., T.v.d.S., L.L.-D., C.R.S.-J., C.A.M.C., V.S., E.I., J.K. and D.N.N.; writing—original draft preparation, G.M.; writing—review and editing, G.M., T.S.R., D.R.G., M.W., U.P.S.L., B.R.C., E.P., S.A., E.G.A.R., K.M., J.H.J., T.v.d.S., L.L.-D., C.R.S.-J., C.A.M.C., V.S., E.I., J.K., D.N.N. and K.J.; visualization, G.M.; supervision, K.J., U.P.S.L., T.S.R., D.R.G., M.W. and B.R.C.; project administration, T.S.R., D.R.G., M.W., U.P.S.L., B.R.C., E.P. and K.J.; funding acquisition, T.S.R., D.R.G., M.W., U.P.S.L., B.R.C., E.P. and K.J. All authors have read and agreed to the published version of the manuscript.
Funding
This research was funded by the WildDrone MSCA Doctoral Network (EU Horizon Europe, Grant No. 101071224); the EPSRC project “Autonomous Drones for Nature Conservation Missions” (EP/X029077/1); the AI Institute ICICLE (NSF Award #2112606); and the Imageomics Institute (NSF HDR, Award #2118240). B.R.C. also acknowledges support from the University of Konstanz Investment Grant programme and the Deutsche Forschungsgemeinschaft (DFG, German Research Foundation) under Germany’s Excellence Strategy—“Centre for the Advanced Study of Collective Behaviour” EXC 2117–422037984.
Data Availability Statement
Publicly available inputs, including regulatory documents, population raster datasets, and manufacturer specifications, are cited and linked within the manuscript. Operational materials generated during the WildDrone field campaigns, such as procedures, risk assessment artefacts, and Field Trial Cards, contain sensitive regulatory and location-specific information and are therefore not fully publicly available. Redacted and representative examples are provided as Appendix A, Appendix B and Appendix C.
Acknowledgments
The authors sincerely thank the Kenya Wildlife Services, the Ol Pejeta Conservancy management and staff, Kenya Flying Labs (especially Cleopa Otieno), the Kenya Civil Aviation Authority (particularly Francis Kigen), the local Kenya Air Force Air Traffic Control, and the Wildlife Research and Training Institute for their invaluable support during this project.
Conflicts of Interest
The authors declare no conflicts of interest. Author Saadia Afridi was employed by the company Avy B.V. The remaining authors declare that the research was conducted in the absence of any commercial or financial relationships that could be construed as a potential conflict of interest.
Appendix A. Kenyan UAS Regulations and Permit Process
Introductory Note: This supplementary appendix provides the technical material supporting the main article, covering regulatory, methodological, and operational aspects omitted for brevity. Appendix A outlines the Kenyan UAS regulatory framework and the permit process for temporary import and BVLOS authorisation. Appendix B presents the full SORA 2.5 application, including volume definitions, population-density estimation methods, intrinsic and mitigated ground-risk assessments, TMPR analysis, SAIL determination, adjacent-area evaluation, and containment requirements. Appendix C compiles the Field Trial Cards, summarising mission procedures and operational lessons from the WildDrone activities. Together, these appendices form the technical basis for the regulatory analysis and operational insights discussed in the paper.
Appendix A.1. Civil Aviation UAS Regulatory Framework
The regulation of UASs in Kenya is defined by the Civil Aviation Unmanned Aircraft Systems Regulations 2020 (Legal Notice No. 42, Kenya Gazette Supplement No. 34, 30 March 2020). These regulations classify operations into three categories according to the risk posed to persons, property, and airspace:
- Category A (Low Risk): Restricted to Visual Line Of Sight (VLOS) operations at or below 400 ft AGL with a Max Take-Off Weight (MTOW) ≤ 25 kg. A lateral separation of at least 50 m must be maintained from uninvolved persons, buildings, and objects. Operations must occur in segregated airspace unless expressly authorised by the KCAA.
- Category B (Medium Risk): Also limited to VLOS (including extended VLOS), but permits operations exceeding certain Category A constraints. These may occur in non-segregated airspace, provided they remain clear of controlled or restricted zones unless authorised.
- Category C (High Risk): Covers high-complexity operations, including BVLOS flights and missions in controlled airspace, requiring integration with ATC, compliance with the Civil Aviation (Rules of the Air) Regulations, and a valid Certificate of Airworthiness.
All categories require prior KCAA approval, including a temporary import permit and an operational authorisation. Commercial activities additionally require a valid Remote Operator Certificate (ROC).
At the time of our operations, routine authorisation of BVLOS missions was not available due to the absence of a national UTM system. However, because flights occurred within military-controlled airspace, the KCAA granted an exemption contingent on approval by the KAF ATC. Consequently, BVLOS operations required coordination with both civil and military regulators.
Details of the authorisation workflow and submitted documentation are summarised in the main paper. All templates and forms are available in our open-access repository (https://github.com/GuyMaalouf/wilddrone-hackathon-2025-bvlos-ops, accessed on 29 January 2026).
Appendix A.2. Permit Application Requirements
This section summarises the documentation submitted to the KCAA and KAF to obtain temporary import and operational permits for the January 2025 campaign.
Table A1.
Documentation Required to Apply for a UAS Temporary Import Permit.
Table A2.
Documentation Required to Apply for a UAS Operational Permit.
Appendix B. Detailed Application of the Ten-Step SORA Methodology
Appendix B.1. SORA Semantic Map and Volume Definitions
Before applying SORA Step 2, it is necessary to define the spatial model used for risk containment and footprint calculations. The SORA semantic map in Figure A1 outlines five operational volumes defined by the Joint Authorities for Rulemaking on Unmanned Systems (JARUS) methodology: flight geography, contingency volume, ground risk buffer, containment area, and adjacent area.
Figure A1.
SORA semantic map for the January 2025 field campaign. The figure shows the spatial volumes used for containment and ground/air-risk assessment: (1) Flight geography (green); (2) Contingency volume (orange), defined by a 1.5 km buffer based on the fastest UAS performance; (3) Ground-risk buffer (red), a 400 ft (120 m) band aligned with the maximum flight altitude; (4) Containment area (purple), the 1 km band used in Step 8 to verify containment and detect assemblies; (5) Adjacent area (light blue), used to evaluate exposure beyond the containment area; (6) Air-risk buffer zones (ruby red), lateral and vertical separations from nearby aviation activity; (7) Campgrounds (yellow), treated as sensitive zones and excluded during ground-risk mitigation.
These volumes define the spatial boundaries used throughout the assessment. Their definitions, based on the official JARUS documentation [9], are:
- Flight geography: The volume in which the UAS is intended to operate under normal conditions, defined horizontally and vertically by planned mission paths and operational constraints.
- Contingency volume: A buffer surrounding the flight geography that accounts for off-nominal behaviour (e.g., navigation or link loss) in which the UAS remains controllable but deviates from the planned trajectory.
- Ground-risk buffer: A horizontal buffer extending from the contingency volume, defined using a 1:1 rule relative to maximum altitude. It represents the area potentially affected by a ballistic descent and forms part of the intrinsic Ground Risk Class (iGRC) footprint.
- Adjacent area: The region beyond the ground-risk buffer used to assess exposure to uninvolved people and determine the containment requirement.
- Containment area: The first 1 km band of the adjacent area, used in Step 8 of the SORA to identify outdoor assemblies and verify containment performance.
Appendix B.2. Additional Notes on Buffer Selection and Design Choices
Unlike other SORA parameters, the contingency volume size is not prescribed by the JARUS guidance. It is the responsibility of the operator to define an appropriate buffer based on aircraft performance and operational context. Choosing a smaller contingency volume allows for a larger flight geography but leaves limited reaction time for the pilot or failsafe systems. This increases the risk of exiting the contingency volume, resulting in a loss of control scenario under SORA, which may trigger immediate termination procedures. In contrast, an overly large contingency volume, especially when applying a top-down approach, significantly shrinks the flight geography, possibly restricting mission feasibility.
By subtracting the contingency volume and ground risk buffer from the conservancy’s boundary, we delineated the flight geography. This yielded a conservative and bounded intrinsic Ground Risk Class footprint, while ensuring that areas with higher population density, such as nearby villages, were excluded from the operational volume. Campgrounds, shown in yellow on the semantic map, were also flagged as high-risk zones and are explicitly excluded from flights as part of the mitigation measures applied in SORA Step 3 (Ground Risk Mitigations).
This approach ensured that the UAS operational volume remained confined to safer areas. In contrast, a bottom-up approach—in which a mission-specific flight geography is initially defined, then expanded by adding contingency and ground risk buffers—can offer finer control over the desired operational area. However, it increases the likelihood of overlapping with populated or sensitive zones, potentially elevating the Ground Risk Class and triggering more stringent SORA Operational Safety Objectives (OSOs).
Appendix B.3. Qualitative Descriptors for Population Density
Table A3 provides the official qualitative descriptors used to support ground population density classification in Step 2 of the SORA methodology. These descriptors were adapted from Table 8 of Annex F [9] in the SORA 2.5 documentation and offer guidance on identifying population classes based on local characteristics.
Table A3.
Qualitative Descriptors for Population Density (adapted from SORA 2.5, Annex F, Table 8 [9]).
In the main text, we classified the Ol Pejeta Conservancy as “lightly populated” based on these descriptors. That classification was further validated using the quantitative methods described in Section 2.2.
Appendix B.4. Tourism-Based Estimation of Population Density
To support the population-density assessment required in SORA Step 2, we estimated the number of tourists likely present in Ol Pejeta Conservancy in January 2025. The estimate combines historical visitor data, post-COVID recovery trends, and seasonal patterns to derive a context-specific approximation from publicly available sources.
- 1.
- Local Growth and COVID Impact.
We analysed annual visitor statistics for Ol Pejeta from 2016–2022 [19]. The sharp downturn in 2020–2021 reflects the COVID-19 impact, with partial recovery in 2022. To characterise baseline growth independently of the pandemic, we computed the pre-COVID Average Annual Growth Rate (AAGR) using 2016–2019 data:
where is the observed number of tourists in year y.
- 2.
- Adjustment Using Global Post-COVID Recovery Benchmarks.
To account for ongoing global recovery, we applied UN Tourism recovery factors for 2023–2025 [17,18]:
- 2023: 84–92% of 2019 levels
- 2024: 97–99% of 2019 levels
- 2025: projected at 104–106%, obtained by applying the 7% AAGR to 2024 values
Projected values were computed using:
where is the projected tourist count for year y, is the observed 2019 value, and is the relevant recovery factor.
- 3.
- Projected Annual Totals.
Table A4 summarises observed and projected tourist numbers for 2016–2025, with lower and upper bounds for 2023–2025 based on UN Tourism scenarios. Figure A2 presents the same data with a confidence band and visual shading over COVID-affected years.
Figure A2.
Projected annual tourist visits to Ol Pejeta Conservancy (2016–2025). Blue markers indicate observed values based on official Ol Pejeta annual reports. The grey band from 2019–2021 highlights the tourism downturn caused by the COVID-19 pandemic. From 2023 onward, projections are based on regional recovery rates published by the UN Tourism (expressed as a percentage of 2019 levels), combined with a local pre-COVID growth rate of 7%. A midline shows the central estimate, with a confidence band representing lower and upper recovery bounds. A dotted vertical line marks the transition from observed to estimated values.
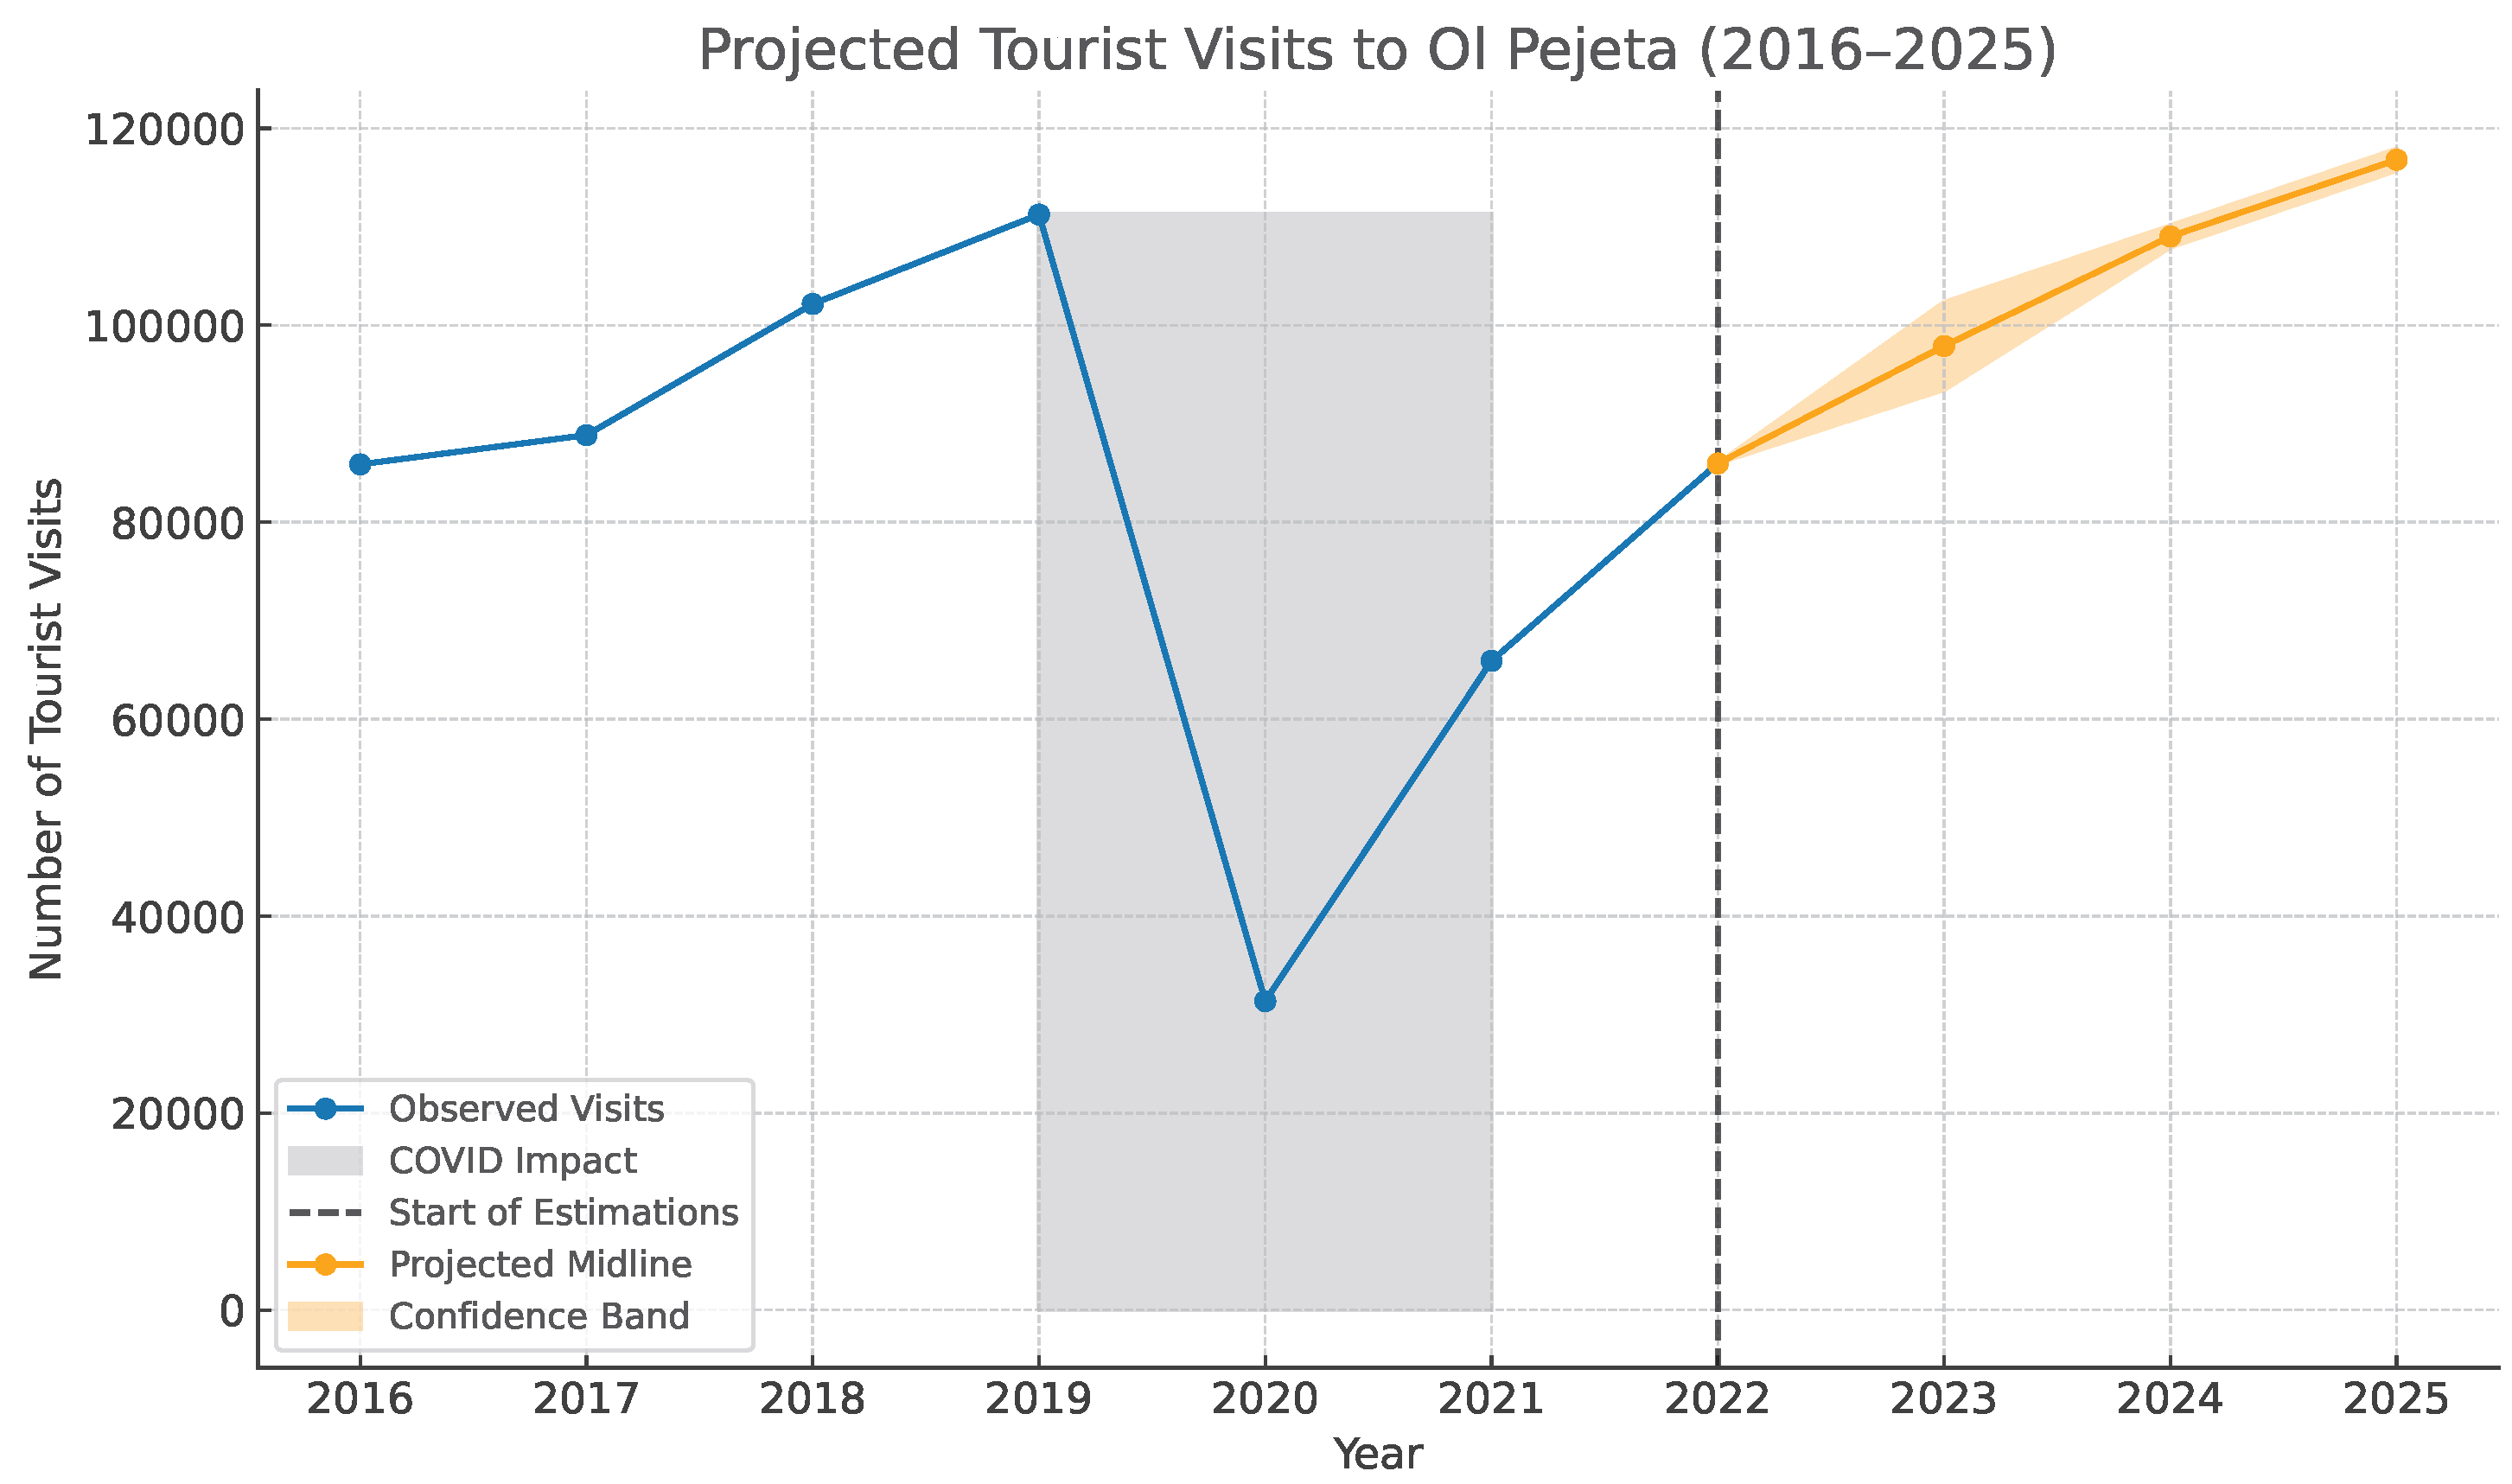
Table A4.
Annual tourist visit data and post-COVID projections for Ol Pejeta Conservancy.
- 4.
- Seasonal Adjustment for January.
Because our operations took place in January, we applied a month-specific adjustment. January in central Kenya marks the start of the short dry season. Safari guidance for Ol Pejeta and Kenya describes December–March as a dry, favourable period with lower crowding and prices than the July–October peak [69,70,71].
We therefore used a seasonality factor with a conservative margin and computed average daily visitors as:
where is the estimated January daily presence. Applying the conservative +10% upper bound yields 352 tourists per day for January 2025.
- 5.
- Estimating Localised Tourist Density at Camps.
For SORA Step 2, we then estimated the maximum localised density by assuming all tourists are concentrated at camps at night, when visitor clustering is highest.
- a.
- Number of camps:Based on Ol Pejeta’s official accommodation listings, we identified ten active tourism facilities: Sweetwaters Serena Camp, Porini Rhino Camp, Ol Pejeta Bush Camp, Ol Pejeta Safari Cottages, Kicheche Laikipia Camp, Mutara Camp, Pelican House, Sanctuary Tambarare, River Camp, and The Stables [72].
- b.
- Tourist distribution:Even distribution of 352 tourists across ten camps gives:
- c.
- Camp staff:Drawing on operational experience at The Stables, we conservatively assume 10 staff per camp, giving:
- d.
- Area of influence:We bound each camp to a 1 km2 inhabited area, yielding a population density of:This value remains below the SORA threshold of 50 people/km2 for a lightly populated area and supports our intrinsic ground-risk classification.
Appendix B.5. Raster-Based Estimation of Population Density
To complement qualitative and local estimates of ground population density, we evaluated publicly available gridded data from the WorldPop project. This appendix summarises the dataset, processing steps, and interpretation.
- a.
- Source Dataset:We used the 2020 WorldPop raster for Kenya [20], which provides resident-population estimates at a ∼100 m (3 arc-second) resolution. Values are produced using a random forest-based dasymetric disaggregation method [39] that redistributes census counts using high-resolution covariates (night-time lights, building footprints, roads, land cover). The resulting raster gives the estimated number of residents per cell.
- b.
- Raster Processing:A lightweight Python script extracted and analysed a local subset of the raster using:
- ken_ppp_2020.tif: Unconstrained 2020 WorldPop raster for Kenya (https://hub.worldpop.org/geodata/summary?id=6530 accessed on 8 January 2026)
- olpejeta_boundary.kml: Boundary polygon for Ol Pejeta Conservancy
Processing steps:- Clip raster to the conservancy boundary.
- Convert native units (people per 0.01 km2) to people/km2.
- Compute summary statistics at 100 m resolution.
- Aggregate to 200 m and 500 m to assess grid-size effects, following Annex F of the SORA.
- Visualise raster layers for inspection.
At 100 m resolution, the average density was 12.19 people/km2 and the maximum 104.84. Aggregation to 200 m and 500 m reduced maxima to 58.07 and 53.35 people/km2, respectively. This is consistent with Annex F: finer grids inflate local peaks, whereas coarser grids smooth them. The 200 m grid was therefore selected as the representative scale for intrinsic ground-risk assessment for flights below 500 ft AGL.The full code, setup instructions, and example outputs are publicly available (https://github.com/GuyMaalouf/opc-worldpop-analysis accessed on 8 January 2026). - c.
- Notes on Interpretation:WorldPop is effective for broad-scale assessments but omits non-resident and transient populations (tourists, mobile staff, temporary workers). In Ol Pejeta, this omission is important near camps or ranger posts that are not reflected in census data. Furthermore, raster values represent averages over grid cells, which can mask strong local clustering.These limitations, together with grid-size sensitivity, underline the need to combine raster-based estimates with local knowledge and ground observations when deriving exposure values for iGRC analysis.
Appendix B.6. Tabulated Determination of Intrinsic Ground Risk Class (iGRC)
The table below is adapted from Table 8 of the SORA 2.5 main body [9] and is used to determine the intrinsic Ground Risk Class (iGRC) based on estimated population density and aircraft characteristics.
Table A5.
Intrinsic Ground Risk Class (iGRC) as a function of population density, UAS characteristic dimension, and maximum speed. Adapted from Table 8 of SORA 2.5 [9]. Highlighted cell shows the classification for our case.
Appendix B.7. Fine-Grained Estimation of iGRC Using SORA Annex F
This appendix outlines the full calculation process of the intrinsic Ground Risk Class (iGRC) using the refined method described in Annex F of the SORA. This approach uses physical parameters of the aircraft and the estimated ground population density to compute a continuous risk score.
Annex F defines the iGRC as:
where:
- : population density in people/m2.

- : critical area in m2, representing the ground footprint where an individual might be lethally impacted.
The critical area for aircraft with wingspans between 1 m and 8 m (Case 2 in Annex F Section 1.8.2) is calculated as:
Each component is now explained and computed using default values from Annex F as seen in Table A6:
Table A6.
Default Parameters from Annex F used in Critical Area Estimation.
- : Effective impact radius combines the radius of a person and half the aircraft’s wingspan. This accounts for a lethal area that extends both from the person struck and the size of the aircraft:
- : Glide distance estimates how far the aircraft can travel horizontally during descent, using the person height as a proxy for impact height:
- : Horizontal impact velocity, the component of aircraft speed along the ground:
- : Non-lethal velocity, the speed below which impact energy is less than (290 J):
- : Deceleration time, to decelerate from impact to non-lethal speed:Since the result is negative, the aircraft is already below the non-lethal threshold upon impact. Thus:
- : Reduced slide distance, representing the distance over which the aircraft continues to slide after initial impact, until it decelerates to a non-lethal velocity:Because , there is no additional contribution from sliding.
We now compute the final critical area using the full expression:
Using a population density of 50 people/km2 (converted to people/m2), we find:
Final calculation of iGRC:
This example illustrates how the fine-grained Annex F method can yield a lower iGRC compared to Table A5, which places our use case in iGRC 4 instead of iGRC 5. While the tabulated method enables fast and conservative assessments, it may over- or under-estimate the actual risk for borderline cases like ours. The analytical approach of Annex F offers a more accurate evaluation aligned with aircraft specifics.
Appendix B.8. Ground Risk Mitigation Measures (SORA Step 3)
This appendix provides definitions and rules for the ground risk mitigation measures used in Step 3 of the SORA, based on Annex B of the official SORA 2.5 documentation.
Table A7.
Summary of Ground Risk Mitigation Measures (Step 3 of the SORA).
Appendix B.9. Tactical Mitigation Performance Requirements (Step 6)
Table A8 below reproduces the TMPR criteria defined in Table 1 of Annex D of the SORA 2.5 [9], which establish the minimum performance standards for the detect–decide–command–execute–feedback loop under low robustness conditions (ARC-b). These requirements describe how an operator must detect and respond to unexpected air encounters during flight, ensuring adequate situational awareness, command responsiveness, and descent capability even in the absence of high-integrity systems.
Table A8.
Tactical Mitigation Performance Requirements (TMPR) for low robustness (ARC-b) operations, adapted from Table 1 of Annex D in the SORA 2.5 [9].
Appendix B.10. Platform-Specific Command and Execute Performance (TMPR Analysis)
This section summarises the Command and Execute performance of each platform used during the operation, in relation to the tactical mitigation performance requirements (TMPR) for ARC-b operations. It complements the general overview presented in Table 4 (Step 6) by providing detailed link types, estimated control latency, and descent performance for each platform.
Table A9.
Platform-level comparison of Command and Execute performance vs. TMPR (ARC-b).
Appendix B.11. Determination of the SAIL
The SAIL defines the degree of assurance and integrity required for an operation. It results from the intersection of the final GRC and the residual ARC, as shown in Table A10.
Table A10.
Determination of the SAIL, reproduced from the official SORA 2.5 Main Body, Step 7 [9].
Appendix B.12. Population-Raster Analysis of the Adjacent Area
To determine the containment requirement in SORA Step 8, we evaluated the adjacent area surrounding the conservancy using a top-down population-raster analysis. The adjacent area corresponds to a 5 km ring around the contingency volume (Case A in SORA 2.5 §5.1.3). Our fastest UAS is software-limited to 20 m/s, yielding a maximum displacement of 3.6 km in 3 min. Because this remains below 5 km, the operation falls under Case A, and a conservative 5 km radius was therefore applied (Figure A1).
Population values were extracted from the 2020 WorldPop raster (100 m resolution) and processed using Python scripts for raster clipping, aggregation to 1 km cells, and statistical summarisation of densities within the 5 km ring. All scripts and datasets are available in our public repository (https://github.com/GuyMaalouf/opc-worldpop-analysis accessed on 8 January 2026). Figure A3 illustrates the resulting spatial distribution.
Figure A3.
Population density within the 5 km adjacent area surrounding the Ol Pejeta operational volume, derived from WorldPop (2020), at 100 m (left) and 1 km (right) resolutions.
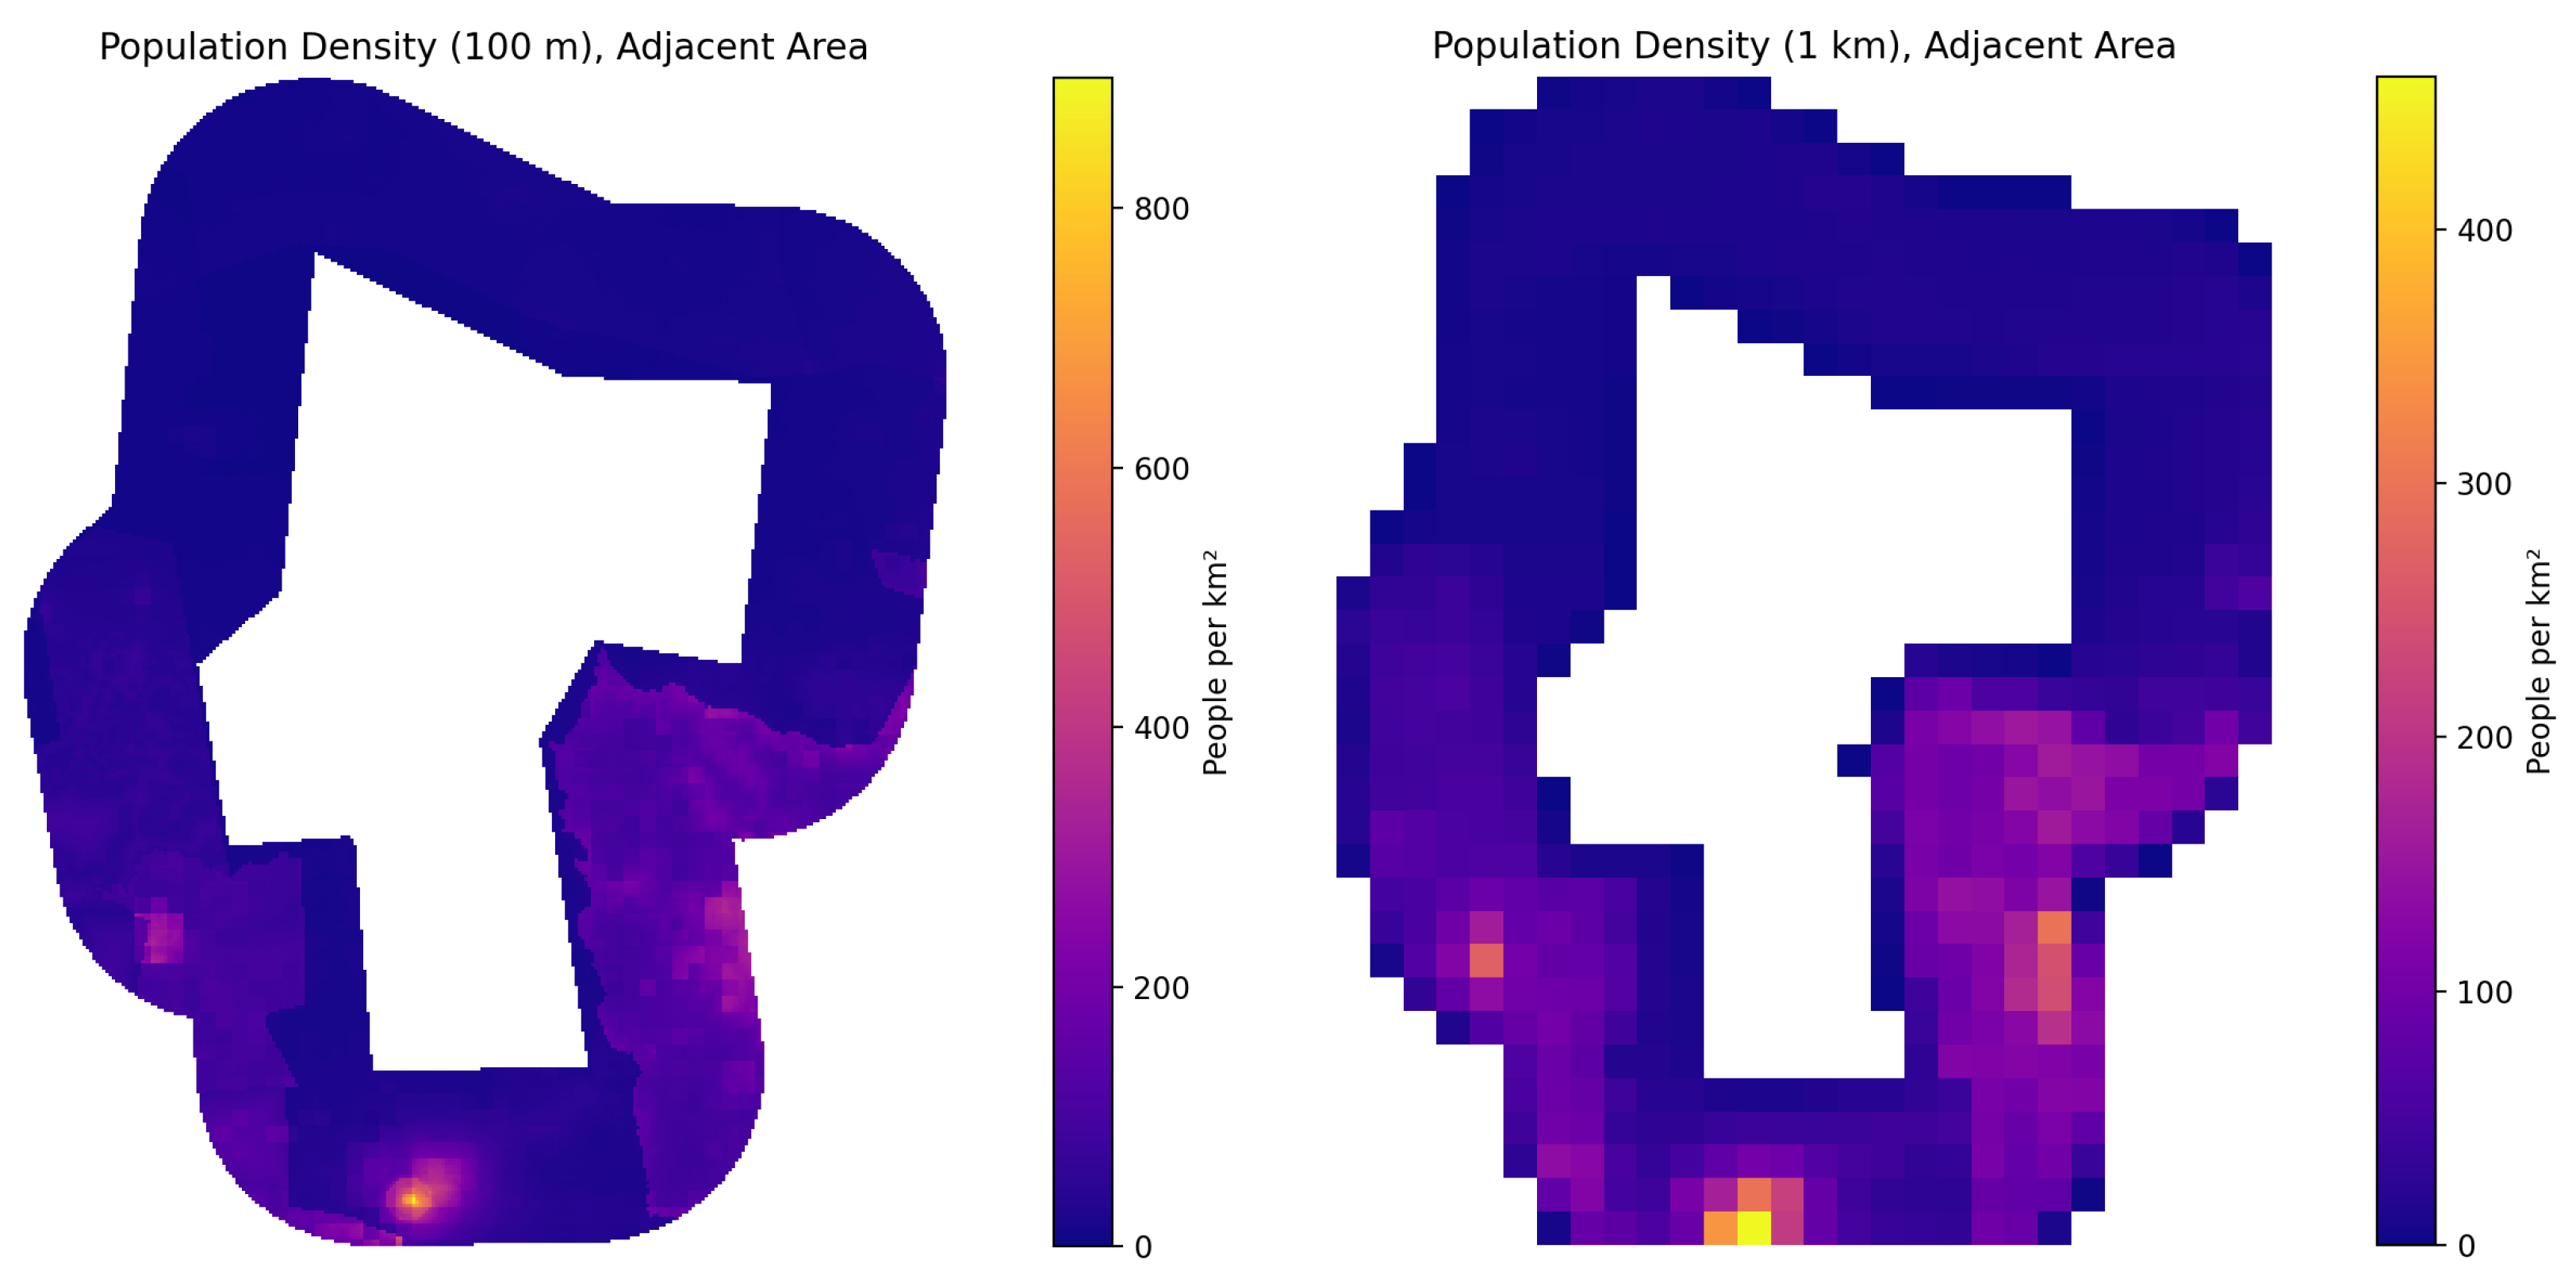
Clipping the WorldPop raster to the adjacent area produced an average population density of and a maximum of at the native 100 m resolution. Aggregating to 1 km cells reduced these values to and . This behaviour reflects the grid-size effect described in SORA Annex F and discussed in Section 2.2.4 of the main paper: finer grids highlight isolated single-cell peaks, whereas coarser grids smooth local extremes and better reflect the spatial scale relevant to UAS dispersion.
To remain conservative while avoiding sensitivity to isolated high-density cells, we adopted representative values of and for the adjacent-area assessment. These values align with the refined estimates used in the main paper and support the containment analysis in Step 8.
Appendix B.13. Containment Requirements for 8 m UA (Excerpt from SORA 2.5 Main Body)
The following table reproduces Table 11 from the SORA 2.5 main body [9]. It provides the tabulated containment requirements for unmanned aircraft systems (UAS) with a characteristic dimension of up to 8 m and a cruise speed below 75 m/s. Sheltering is assumed to be not applicable for UAS operating in the adjacent area, and containment levels are expressed as Low, Medium, or High depending on the SAIL and the population exposure characteristics.
Table A11.
Containment requirements for 8 m UAS (adapted from SORA 2.5 Main Body, Table 11 [9]).
Appendix B.14. Fine-Grained Calculation of the Adjacent-Area iGRC
Annex F of SORA 2.5 introduces an analytical, fine-grained method for determining the iGRC of the adjacent area. Unlike the operational area, where the iGRC is derived from the maximum local population density, Annex F explicitly specifies that the adjacent area should use a weighted average population density, since a loss-of-containment event is assumed to have a uniformly distributed probability of occurring anywhere within the 5 km ring.
Following the same formulation presented in Equation (A7) of Appendix B.7, which originates from Annex F of the SORA 2.5 documentation [9], the intrinsic ground-risk class is computed as:
where is expressed in people/m2 and is the critical area (m2) representing the potential lethal-impact footprint.
The critical area is given by Annex F Equation (8):
with parameters identical to those used in Appendix B.7. Using , , and , we obtain . Converting to yields:
Therefore, the intrinsic ground-risk class for the adjacent area is iGRC 4, derived from the weighted average population density within the 5 km ring.
Appendix B.15. Applicability of Ground-Risk Mitigations in the Adjacent Area
Annex F §5.3 provides additional guidance on which ground-risk mitigations remain valid for excursion scenarios (i.e., when an unmanned aircraft leaves its contingency volume). Only mitigations that continue to function or remain logically applicable during a fly-away may be claimed. Specifically, the following may be considered:
- M1(a)—Sheltering of people, if it can be generalised across the adjacent area;
- M1(b)—Time-of-day restrictions (e.g., night operations) that reduce outdoor population exposure; and
- M2—Passive or frangible design features that limit kinetic energy upon impact.
All other mitigations are not applicable to the adjacent-area assessment:
- M1(b)—Route- or exposure-based arguments, which apply only to controlled flight paths inside the operational volume;
- M1(c)—Tactical ground observation, as observers cannot provide coverage for an uncontrolled fly-away; and
- M2—Active mitigation systems (e.g., parachutes or specific descent manoeuvres), which are assumed to fail in a containment breach.
In the present case, none of the permitted mitigations are applicable:
- Sheltering cannot be assumed, as the surrounding farmlands are primarily worked outdoors during the day;
- Time-of-day restrictions are inapplicable, since operations occur both by day and by night; and
- The employed UAS platforms do not feature sufficient frangible or passive design elements to claim M2 credit.
Consequently, the final ground-risk class remains GRC 4. For a SAIL II operation, Annex F §5.3 and Table 27 [9] specify that a final GRC 4 corresponds to no containment requirement.
Appendix B.16. SORA Containment Requirements (Copy of SORA 2.5 Annex F, Table 27 [9])
Table A12 reproduces Table 27 from SORA 2.5 Annex F [9], showing the containment requirement level as a function of the SAIL in the operational volume and the Adjacent Area Final GRC, where:
- N: No containment requirement
- L: Low containment requirement
- M: Medium containment requirement
- H: High containment requirement
- Oos: Out of scope
Table A12.
SORA Containment Requirements—adapted from SORA 2.5 Annex F, Table 27 [9].
Appendix B.17. Operational Safety Objectives (SAIL II Summary)
Table A13 and Table A14 reproduce the set of Operational Safety Objectives (OSOs) applicable to SAIL II operations, as defined in SORA 2.5 Annex E. Each OSO identifies a safety objective that must be demonstrated by the operator with an appropriate level of integrity (safety gain) and assurance (method of proof).
- Integrity: The strength of the safety gain achieved through compliance with the OSO.
- Assurance: The confidence level in the operator’s evidence or demonstration of that compliance.
Compliance status is shown using the following colour scheme: Green (Met), Orange (Partially met), and Red (Not met). Inline markers (met, partially met, not met) are used to highlight the corresponding status within the text.
Table A13 and Table A14 summarise all OSOs applicable at SAIL II, indicating the required robustness level and how each objective was addressed in the WildDrone BVLOS framework. OSOs #02, #04, #05, #18, #19, and #24 are excluded here, as they are not applicable at SAIL II and only apply at higher SAIL levels.
Table A13.
Operational Safety Objectives (SAIL II) with Compliance Assessment (Adapted from SORA 2.5 Annex E)—Part 1.
Table A14.
Operational Safety Objectives (SAIL II) with Compliance Assessment (Adapted from SORA 2.5 Annex E)—Part 2.
Appendix C. Field Trial Cards—Operational Insights from Real-World Operations
This appendix compiles a series of Field Trial Cards summarising key missions conducted during the WildDrone operations in Kenya. Each card presents a concise account of a specific field activity, outlining its objective and mission context, operational summary and procedures, and the main challenges and lessons learned. Together, these records capture the diversity of experimental objectives and illustrate how practical field experience informed the continuous refinement of our operational framework. The cards provide both a technical and procedural overview of how research missions were planned and executed under real-world conditions, serving as a reference for future large-scale conservation operations and regulatory studies.
Table A15.
Field Trial Card #1—Night Tracking of Lions to Study Predator Behaviour.
Table A16.
Field Trial Card #2—Evaluating a UAS Swarm System for Multi-Perspective Data Collection.
Table A17.
Field Trial Card #3—Assessing Wildlife Behavioural Response to Drone Approaches.
Table A18.
Field Trial Card #4—Drone-Based Data Collection for Individual Rhino Identification.
Table A19.
Field Trial Card #5—3D Reconstruction and Semantic Segmentation of Natural Habitats.
Table A20.
Field Trial Card #6—Testing Collaborative Multi-Agent Aerial Mapping for Wildlife Surveys.
Table A21.
Field Trial Card #7—Testing Edge-AI Drone Systems for Autonomous Wildlife Monitoring.
Table A22.
Field Trial Card #8—Assessing Multi-Object Tracking for Wildlife Monitoring.
Table A23.
Field Trial Card #9—Assessing Behavioural Responses of Wildlife to Drone Noise.
Table A24.
Field Trial Card #10—Geolocation Accuracy of Animal Positioning using COTS Drones.
Table A25.
Field Trial Card #11—Stereo vision payload for measurement of animal body condition.
References
- Anderson, K.; Gaston, K.J. Lightweight unmanned aerial vehicles will revolutionize spatial ecology. Front. Ecol. Environ. 2013, 11, 138–146. [Google Scholar] [CrossRef] [Scilit]
- Anderson, K.; Gonzalez, F.; Gaston, K.J. Drones in ecology: Ten years back and forth. BioScience 2025, 75, 664–680. [Google Scholar] [CrossRef] [Scilit] [PubMed]
- Linchant, J.; Lisein, J.; Semeki, J.; Lejeune, P.; Lejeune, P.; Vermeulen, C. Are unmanned aircraft systems the future of wildlife monitoring? A review. Mammal Rev. 2015, 45, 239–252. [Google Scholar] [CrossRef] [Scilit]
- Aliane, N. Drones and AI-Driven Solutions for Wildlife Monitoring. Drones 2025, 9, 455. [Google Scholar] [CrossRef] [Scilit]
- Hodgson, J.C.; Mott, R.; Baylis, S.M.; Pham, T.T.; Wotherspoon, S.; Kilpatrick, A.D.; Raja Segaran, R.; Reid, I.; Terauds, A.; Koh, L.P. Drones count wildlife more accurately and precisely than humans. Methods Ecol. Evol. 2018, 9, 1160–1167. [Google Scholar] [CrossRef] [Scilit]
- Cabral, T.; Duarte, M.D.; Place, S.; Mccarthy, P.; Caetano, J.V. Unmanned aircraft systems risk assessment: Review of existing tools and new results. In Proceedings of the STO Specialists’ Meeting IST-166, Lisbon, Portugal, 16–17 October 2018; NATO Science and Technology Organization (STO): Neuilly-sur-Seine, France, 2018. STO-MP-IST-166. Available online: https://publications.sto.nato.int/publications/STO%20Meeting%20Proceedings/STO-MP-IST-166/MP-IST-166-05.pdf (accessed on 1 December 2025).
- Capitán, C.; Capitán, J.; Castano, A.R.; Ollero, A. Risk assessment based on SORA methodology for a UAS media production application. In Proceedings of the ICUAS, Atlanta, GA, USA, 11–14 June 2019; IEEE: New York, NY, USA, 2019. [Google Scholar] [CrossRef] [Scilit]
- Janik, P.; Zawistowski, M.; Fellner, R.; Zawistowski, G. Unmanned aircraft systems risk assessment based on SORA for first responders and disaster management. Appl. Sci. 2021, 11, 5364. [Google Scholar] [CrossRef] [Scilit]
- JARUS. Guidelines on Specific Operations Risk Assessment (SORA) v2.5 Package. Joint Authorities for Rulemaking on Unmanned Systems. 2024. Available online: http://jarus-rpas.org/wp-content/uploads/2024/06/SORA-v2.5-Main-Body-Release-JAR_doc_25.pdf (accessed on 1 December 2025).
- EASA. Specific Operations Risk Assessment (SORA). European Union Aviation Safety Agency. 2024. Available online: https://www.easa.europa.eu/en/domains/drones-air-mobility/operating-drone/specific-category-civil-drones/specific-operations-risk-assessment-sora (accessed on 7 January 2026).
- Zheng, B.; Zhou, W.; Ma, X. Quantitative Study on UAV Operational Risk Based on Specific Operation Risk Assessment Model. Qual. Reliab. Eng. Int. 2025, 41, 1689–1713. [Google Scholar] [CrossRef] [Scilit]
- Habibi, H.; Rao, D.M.K.K.V.; Sanchez-Lopez, J.L.; Voos, H. On SORA for High-Risk UAV Operations under New EU Regulations: Perspectives for Automated Approach. arXiv 2023, arXiv:2303.02053. [Google Scholar] [CrossRef] [Scilit]
- Maalouf, G.; Meier, K.; Richardson, T.; Guerin, D.; Watson, M.; Lundquist, U.P.S.; Afridi, S.; Rolland, E.G.; Jepsen, J.H.; Njoroge, W. Insights Into Safe and Scalable BVLOS UAS Operations from Kenya’s Ol Pejeta Conservancy. In Proceedings of the ICUAS, Charlotte, NC, USA, 14–17 May 2025; IEEE: New York, NY, USA, 2025. [Google Scholar] [CrossRef] [Scilit]
- Lundquist, U.P.S.; Afridi, S.; Berthelot, C.; Dat, N.N.; Hlebowicz, K.; Iannino, E.; Laporte-Devylder, L.; Maalouf, G.; May, G.; Meier, K.; et al. WildDrone: Autonomous Drone Technology for Monitoring Wildlife Populations. Front. Robot. AI 2025, 12, 1695319. [Google Scholar] [CrossRef] [Scilit]
- Kenya Civil Aviation Authority. Civil Aviation (Unmanned Aircraft Systems) Regulations, 2020; Kenya Civil Aviation Authority: Nairobi, Kenya, 2020; Available online: https://www.kcaa.or.ke/sites/default/files/regulation/Civil%20Aviation%20%28Unmanned%20Aircraft%20Systems%29%20Regulations%202020.pdf (accessed on 7 January 2026).
- Kenya Civil Aviation Authority. Unmanned Aircraft Systems: Manual of Implementing Standards; Number CAA-M-UAS001; Kenya Civil Aviation Authority: Nairobi, Kenya, 2020; Available online: https://www.kcaa.or.ke/sites/default/files/docs/uas/Manual%20of%20Implementing%20Standards%20%28MIS%29.pdf (accessed on 8 January 2026).
- UN Tourism. International Tourism Recovers Pre-Pandemic Levels in 2024; UN Tourism: Madrid, Spain, 2025; Available online: https://www.untourism.int/news/international-tourism-recovers-pre-pandemic-levels-in-2024 (accessed on 25 October 2025).
- UN Tourism. World Tourism Barometer; UN Tourism: Madrid, Spain, 2025; Available online: https://webunwto.s3.eu-west-1.amazonaws.com/s3fs-public/2024-01/UNWTO_Barom24_01_January_Excerpt.pdf?VersionId=IWu1BaPwtlJt66kRIw9WxM9L.y7h5.d1 (accessed on 8 January 2026).
- Ol Pejeta Conservancy. Annual Reports. 2024. Available online: https://www.olpejetaconservancy.org/annualreports/ (accessed on 25 October 2025).
- WorldPop. Global 100m Population. 2018. Available online: https://hub.worldpop.org/geodata/summary?id=6530 (accessed on 24 October 2025).
- Petchenik, I. Supercharging Flightradar24’s Data Display. 2025. Available online: https://www.flightradar24.com/blog/inside-flightradar24/supercharging-flightradar24s-data-display/ (accessed on 8 October 2025).
- Rolland, E.; Meier, K.; Grøntved, K.A.R.; Laporte-Devylder, L.; Maalouf, G.; Lundquist, U.P.S.; Christensen, A. Drone Swarms for Multi-Perspective Monitoring of Large Mammals in their Natural Habitats: Deployment and Field Trials. In The PAAMS Collection; Springer: Berlin/Heidelberg, Germany, 2025; Available online: https://link.springer.com/chapter/10.1007/978-3-032-07638-0_22 (accessed on 1 December 2025).
- Rolland, E.; Grøntved, K.; Laporte-Devylder, L.; Kline, J.; Lundquist, U.; Christensen, A. Drone Swarms for Animal Monitoring: A Method for Collecting High-Quality Multi-Perspective Data. In Proceedings of the 15th Annual IMAV Conference, Bristol, UK, 16–20 September 2024; Richardson, T., Ed.; 2024. Available online: http://www.imavs.org/papers/2024/38.pdf (accessed on 1 December 2025).
- Rolland, E.G.A.; Meier, K.; Bronz, M.; Shrikhande, A.M.; Richardson, T.; Lundquist, U.P.S.; Christensen, A.L. WildBridge: Ground Station Interface for Lightweight Multi-Drone Control and Telemetry on DJI Platforms. In Proceedings of the 13th International Conference on Robot Intelligence Technology and Applications (RITA 2025), London, UK, 17–19 December 2025; Available online: https://portal.findresearcher.sdu.dk/en/publications/wildbridge-ground-station-interface-for-lightweight-multi-drone-c/ (accessed on 1 December 2025).
- Shukla, V.; Morelli, L.; Trybala, P.; Remondino, F.; Gan, W.; Yu, Y.; Wang, X. Exploring the potential of UAV collaborative 3D mapping in Kenyan savanna for wildlife research. In Proceedings of the 15th Annual IMAV Conference, Bristol, UK, 16–20 September 2024; pp. 301–308. Available online: https://www.imavs.org/papers/2024/36.pdf (accessed on 1 December 2025).
- Kline, J.; Zhong, A.; Irizarry, K.; Stewart, C.V.; Stewart, C.; Rubenstein, D.I.; Berger-Wolf, T. WildWing: An open-source, autonomous and affordable UAS for animal behaviour video monitoring. Methods Ecol. Evol. 2025. [Google Scholar] [CrossRef] [Scilit]
- Ngoc Dat, N.; Richardson, T.; Watson, M.; Meier, K.; Kline, J.; Reid, S.; Maalouf, G.; Hine, D.; Mirmehdi, M.; Burghardt, T. WildLive: Near Real-time Visual Wildlife Tracking onboard UAVs. arXiv 2025, arXiv:2504.10165. [Google Scholar]
- Kline, J.; Stevens, S.; Maalouf, G.; Saint-Jean, C.R.; Ngoc, D.N.; Mirmehdi, M.; Guerin, D.; Burghardt, T.; Pastucha, E.; Costelloe, B.; et al. MMLA: Multi-Environment, Multi-Species, Low-Altitude Aerial Footage Dataset. arXiv 2025, arXiv:2504.07744. [Google Scholar]
- Afridi, S.; Laporte-Devylder, L.; Maalouf, G.; Kline, J.M.; Penny, S.G.; Hlebowicz, K.; Cawthorne, D.; Lundquist, U.P.S. Impact of Drone Disturbances on Wildlife: A Review. Drones 2025, 9, 311. [Google Scholar] [CrossRef] [Scilit]
- Afridi, S.; Hlebowicz, K.; Cawthorne, D.; Lundquist, U.P.S. Unveiling the Impact of Drone Noise on Wildlife: A Crucial Research Imperative. In Proceedings of the 2024 International Conference on Unmanned Aircraft Systems (ICUAS), Chania, Greece, 4–7 June 2024; pp. 1409–1416. [Google Scholar] [CrossRef] [Scilit]
- Meier, K.; Richards, A.; Watson, M.; Maalouf, G.; Johnson, C.; Hine, D.; Richardson, T. WildBridge: Conservation Software for Animal Localisation using Commercial Drones. In Proceedings of the 15th Annual IMAV Conference, Bristol, UK, 16–20 September 2024; Available online: https://www.imavs.org/papers/2024/39.pdf (accessed on 1 December 2025).
- Meier, K.; Rolland, E.G.A.; Iannino, E.; Simpson, M.; Maalouf, G.; Njoroge, W.; Mutisya, S.; Watson, M.; Costelloe, B.R.; Richards, A.; et al. Simulated and Field-Based Error Characterisation of Animal Geolocalisation and Relative Positioning via Commercial Drones. Available online: https://figshare.com/articles/poster/Simulated_and_Field-Based_Error_Characterisation_of_Animal_Geolocalisation_and_Relative_Positioning_via_Commercial_Drones/30206908/1?file=58246171 (accessed on 1 December 2025).
- Khan, S.; Gupta, S.; Gupta, S.K. Emerging UAV technology for disaster detection, mitigation, response, and recovery. J. Field Robot. 2022, 39, 552–570. [Google Scholar] [CrossRef] [Scilit]
- Beard, R.W.; McLain, T.W.; Goodrich, M.A.; Anderson, C.; Rasmussen, S.J. Informing New Concepts for UAS and Autonomous System Safety Management Using Disaster Management and First Responder Scenarios. NASA Technical Memorandum. 2021. Available online: https://ntrs.nasa.gov/citations/20210011534 (accessed on 1 December 2025).
- Manfreda, S.; McCabe, M.F.; Miller, P.E.; Lucas, R.; Madrigal, V.P.; Mallinis, G.; Ben Dor, E.; Helman, D.; Estes, E.; Ciraolo, G.; et al. On the use of unmanned aerial systems for environmental monitoring. Remote Sens. 2018, 10, 641. [Google Scholar] [CrossRef] [Scilit]
- Duffy, J.P.; Cunliffe, A.M.; DeBell, L.; Sandbrook, C.; Wich, S.A.; Shutler, J.D.; Myers-Smith, I.H.; Varela, M.R.; Anderson, K. Location, location, location: Considerations when using lightweight drones in challenging environments. Remote Sens. Ecol. Conserv. 2017, 3, 146–157. [Google Scholar] [CrossRef] [Scilit]
- Williams, K.W.; Gildea, K.M. A Review of Research Related to Unmanned Aircraft System Visual Observers; Technical Report DOT/FAA/AM-14/9; Federal Aviation Administration, Office of Aviation, Civil Aerospace Medical Institute: Washington, DC, USA, 2014. Available online: https://rosap.ntl.bts.gov/view/dot/57171/dot_57171_DS1.pdf (accessed on 1 December 2025).
- Shah, H.; Haritos, T.; Silas, K.; Cathey, H.M.; Gomez, L.M. Estimating Visual Observers’ Performance for Detecting Intruder Aircraft During Small UAS Flight Operations. In Proceedings of the AIAA AVIATION Forum and ASCEND 2024, Las Vegas, NV, USA, 29 July–2 August 2024. [Google Scholar] [CrossRef] [Scilit]
- Stevens, F.R.; Gaughan, A.E.; Linard, C.; Tatem, A.J. Disaggregating Census Data for Population Mapping Using Random Forests with Remotely-Sensed and Ancillary Data. PLoS ONE 2015, 10, e0107042. [Google Scholar] [CrossRef] [Scilit]
- Openshaw, S. The Modifiable Areal Unit Problem; Geo Books: Norwich, UK, 1984. [Google Scholar]
- Clothier, R.A.; Greer, D.A.; Greer, D.G.; Mehta, A.M. Risk Perception and the Public Acceptance of Drones. Risk Anal. 2015, 35, 1167–1183. [Google Scholar] [CrossRef] [Scilit] [PubMed]
- Caldwell, J.A.; Mallis, M.M.; Caldwell, J.L.; Paul, M.A.; Miller, J.C.; Neri, D.F. Fatigue Countermeasures in Aviation. Aviat. Space Environ. Med. 2009, 80, 29–59. [Google Scholar] [CrossRef] [Scilit]
- Hodgson, J.C.; Baylis, S.M.; Mott, R.; Herrod, A.; Clarke, R.H. Precision wildlife monitoring using unmanned aerial vehicles. Sci. Rep. 2016, 6, 22574. [Google Scholar] [CrossRef] [Scilit] [PubMed]
- ISO 21384-3:2023; Unmanned Aircraft Systems—Part 3: Operational Procedures. Technical Report; International Organization for Standardization: Geneva, Switzerland, 2023. Available online: https://www.iso.org/standard/80124.html (accessed on 1 December 2025).
- ICAO Doc 10019; Manual on Remotely Piloted Aircraft Systems (RPAS). Technical Report; International Civil Aviation Organization: Montreal, QC, Canada, 2015. Available online: https://store.icao.int/en/manual-on-remotely-piloted-aircraft-systems-rpas-doc-10019 (accessed on 1 December 2025).
- FAA Advisory Circular 120-71B; Standard Operating Procedures and Pilot Monitoring Duties for Flightdeck Crewmembers; Technical Report; Federal Aviation Administration: Washington, DC, USA, 2017. Available online: https://www.faa.gov/documentLibrary/media/Advisory_Circular/AC_120-71B.pdf (accessed on 1 December 2025).
- Degani, A.; Wiener, E.L. Human Factors of Flight-Deck Checklists: The Normal Checklist; Technical Report; NASA Ames Research Center: Moffett Field, CA, USA, 1991. Available online: https://ntrs.nasa.gov/citations/19910017830 (accessed on 1 December 2025).
- MIL-STD-1472G; Department of Defense Design Criteria Standard: Human Engineering. Technical Report; U.S. Department of Defense: Washington, DC, USA, 2012. Available online: https://quicksearch.dla.mil/qsDocDetails.aspx?ident_number=36903 (accessed on 1 December 2025).
- ASTM F3178-24; Standard Practice for Operational Risk Assessment of Unmanned Aircraft Systems (UAS). Technical Report; ASTM International: West Conshohocken, PA, USA, 2024. [CrossRef] [Scilit]
- Bainbridge, L. Ironies of Automation. Automatica 1983, 19, 775–779. [Google Scholar] [CrossRef] [Scilit]
- Parasuraman, R.; Riley, V. Humans and Automation: Use, Misuse, Disuse, Abuse. Hum. Factors 1997, 39, 230–253. [Google Scholar] [CrossRef] [Scilit]
- Skitka, L.J.; Mosier, K.L.; Burdick, M. Does Automation Bias Decision-Making? Int. J. Hum. Comput. Stud. 1999, 51, 991–1006. [Google Scholar] [CrossRef] [Scilit]
- Endsley, M.R.; Kiris, E.O. The Out-of-the-Loop Performance Problem and Level of Control in Automation. Hum. Factors 1995, 37, 381–394. [Google Scholar] [CrossRef] [Scilit]
- Xue, M.; Kuo, V.H.; De Alvear Cardenas, J.I.D.; Pradeep, P. Safety Benefit Analysis of Conformance Monitoring for Situation Awareness in UTM. In Proceedings of the AIAA SCITECH 2025 Forum, Orlando, FL, USA, 6–10 January 2025. [Google Scholar] [CrossRef] [Scilit]
- Barrado, C.; Boyero, M.; Brucculeri, L.; Ferrara, G.; Hately, A.; Hullah, P.; Martin-Marrero, D.; Pastor, E.; Rushton, A.P.; Volkert, A. U-Space Concept of Operations: A Key Enabler for Opening Airspace to Emerging Low-Altitude Operations. Aerospace 2020, 7, 24. [Google Scholar] [CrossRef] [Scilit]
- Hobbs, A.; Lyall, B. Human factors guidelines for unmanned aircraft systems. Ergonomics in Design 2016, 24, 23–28. [Google Scholar] [CrossRef] [Scilit]
- Hu, P.T.; Nelson, B.; Nesmith, B.L.; Williams, K.W. Annotated Bibliography (1997–2021): Crew and Staffing Requirements of Unmanned Aircraft Systems in Air Carrier Operations; Technical Report DOT/FAA/AM-22/06; Federal Aviation Administration, Office of Aerospace Medicine: Washington, DC, USA, 2022. Available online: https://www.faa.gov/sites/faa.gov/files/2022-07/Annotated%20Bibliography%20%281997-2021%29-%20Crew%20and%20Staffing%20Requirements%20of%20Unmanned%20Aircrafts%20Systems%20in%20Air%20Carrier%20Operations.pdf (accessed on 1 December 2025).
- Kopardekar, P. Enabling Large-scale Beyond Visual Line of Sight Small Drone Operations. In Helander’s Compendium of Human Factors and Ergonomics; NASA Technical Reports Server (NTRS): Washington, DC, USA, 2025. Available online: https://ntrs.nasa.gov/citations/20250002682 (accessed on 1 December 2025).
- Mohsan, S.A.H.; Othman, N.Q.H.; Li, Y.; Alsharif, M.H.; Khan, M.A. Unmanned aerial vehicles (UAVs): Practical aspects, applications, open challenges, security issues, and future trends. Intell. Serv. Robot. 2023, 16, 109–137. [Google Scholar] [CrossRef] [Scilit] [PubMed]
- Federal Aviation Administration. Normalising Unmanned Aircraft Systems Beyond Visual Line of Sight (BVLOS) Operations; Notice of Proposed Rulemaking (NPRM) website version; Federal Aviation Administration: Washington, DC, USA, 2025. Available online: https://www.faa.gov/newsroom/BVLOS_NPRM_website_version.pdf (accessed on 1 December 2025).
- Jepsen, J.H.; Laursen, K.H.; Jensen, K. A Survey of State-of-the-Art U-space Research. In Proceedings of the 2024 10th International Conference on Automation, Robotics and Applications (ICARA), Athens, Greece, 22–24 February 2024; IEEE: New York, NY, USA, 2024. [Google Scholar] [CrossRef] [Scilit]
- European Union Aviation Safety Agency (EASA). Technical Specification for ADS-L Transmissions Using SRD-860 Frequency Band (ADS-L 4 SRD-860); ED Decision 2022/024/R, Issue 1; EASA: Cologne, Germany, 2022; Available online: https://www.easa.europa.eu/sites/default/files/dfu/ads-l_4_srd860_issue_1.pdf (accessed on 1 December 2025).
- EASA. Automatic Dependent Surveillance–Light (ADS-L) Frequently Asked Questions. 2025. Available online: https://www.easa.europa.eu/en/the-agency/faqs/automatic-dependent-surveillance-light-ads-l (accessed on 30 October 2025).
- EASA. Preventing Mid-Air Collisions—Conspicuity and ADS-L. 2025. Available online: https://www.easa.europa.eu/en/domains/general-aviation/%21conspicuity (accessed on 30 October 2025).
- Foltin, V. EASA—CASIA Meeting: iConspicuity & ADS-L; EASA: Cologne, Germany, 2023. Available online: https://www.easa.europa.eu/sites/default/files/dfu/4._iconspicuity_ads-l.pdf (accessed on 1 January 2026).
- UK Civil Aviation Authority. CAP3139: Electronic Conspicuity (EC) Consolidated Study Report; UK Civil Aviation Authority: Crawley, UK, 2025; Available online: https://www.caa.co.uk/our-work/publications/documents/content/cap3139/ (accessed on 1 December 2025).
- Maalouf, G.; Jensen, K.; Jepsen, J.H. Airspace Situational Awareness: Proposed Airspace Safety Concepts & State-of-the-art Review of UAS Aircraft Detection Technologies. In Proceedings of the ICUAS, Chania, Greece, 4–7 June 2024. [Google Scholar] [CrossRef] [Scilit]
- Singh, R.; Jepsen, J.H.; Ballal, K.D.; Nwabuona, S.; Berger, M.; Dittmann, L. An Investigation of 5G, LTE, LTE-M and NB-IoT Coverage for Drone Communication Above 450 Feet. In Proceedings of the 2023 IEEE 24th International Symposium on a World of Wireless, Mobile and Multimedia Networks (WoWMoM), Boston, MA, USA, 12–15 June 2023; IEEE: New York, NY, USA, 2023; pp. 370–375. [Google Scholar] [CrossRef] [Scilit]
- TrueAfrica. When to Visit: The Best Time for an East African Safari? Available online: https://trueafrica.com/when-to-visit-the-best-time-for-an-east-african-safari/ (accessed on 1 December 2025).
- Holidify. Best Time to Visit Ol Pejeta Conservancy: Weather and Festivals. Available online: https://www.holidify.com/places/ol-pejeta-conservancy/best-time-to-visit.html (accessed on 1 December 2025).
- SafariBookings. Best Time to Visit Ol Pejeta Conservancy (Month by Month). Available online: https://www.safaribookings.com/ol-pejeta/best-time (accessed on 1 December 2025).
- Ol Pejeta Conservancy. Hotels and Lodges (Tourism Partners). Available online: https://www.olpejetaconservancy.org/hotels-lodges-tourism-partners/ (accessed on 1 December 2025).
- DJI. Specs: DJI Mavic 3 Enterprise. Available online: https://enterprise.dji.com/mavic-3-enterprise (accessed on 7 October 2025).
- DJI. DJI Mavic 3 Pro: Specifications. Available online: https://www.dji.com/dk/mavic-3-pro/specs (accessed on 7 October 2025).
- DJI. Mavic 2: Product Information. Available online: https://www.dji.com/dk/mavic-2/info (accessed on 7 October 2025).
- DJI. Support for DJI Mini 3 Pro. Available online: https://www.dji.com/global/support/product/mini-3-pro (accessed on 7 October 2025).
- Parrot. ANAFI Professional Drones: Technical Specifications. Available online: https://www.parrot.com/en/drones/anafi/technical-specifications (accessed on 7 October 2025).
- Sui, K.; Zhou, M.; Liu, D.; Ma, M.; Pei, D.; Zhao, Y.; Li, Z.; Moscibroda, T. Characterizing and Improving WiFi Latency in Large-Scale Operational Networks. In Proceedings of the 14th Annual International Conference on Mobile Systems, Applications, and Services, Singapore, 20 June 2016; ACM: New York, NY, USA, 2016; pp. 347–360. [Google Scholar] [CrossRef] [Scilit]
- CODRONE. CODRONE. Available online: https://codrone.dk/ (accessed on 7 October 2025).
- CubePilot. Herelink Overview. Available online: https://docs.cubepilot.org/user-guides/herelink/herelink-overview (accessed on 7 October 2025).
- FrSky. FrSky R-XSR Receiver. Available online: https://www.frsky-rc.com/r-xsr/ (accessed on 7 October 2025).
- Volkert, A.; Hackbarth, H.; Lieb, T.J.; Kern, S. Flight Tests of Ranges and Latencies of a Threefold Redundant C2 Multi-Link Solution for Small Drones in VLL Airspace. In Proceedings of the 2019 Integrated Communications, Navigation and Surveillance Conference (ICNS), Herndon, VA, USA, 9–11 April 2019. [Google Scholar] [CrossRef] [Scilit]
- NAN Models. XPLORER 3. Available online: https://nanmodels.com/models/xplorer-3/ (accessed on 7 October 2025).
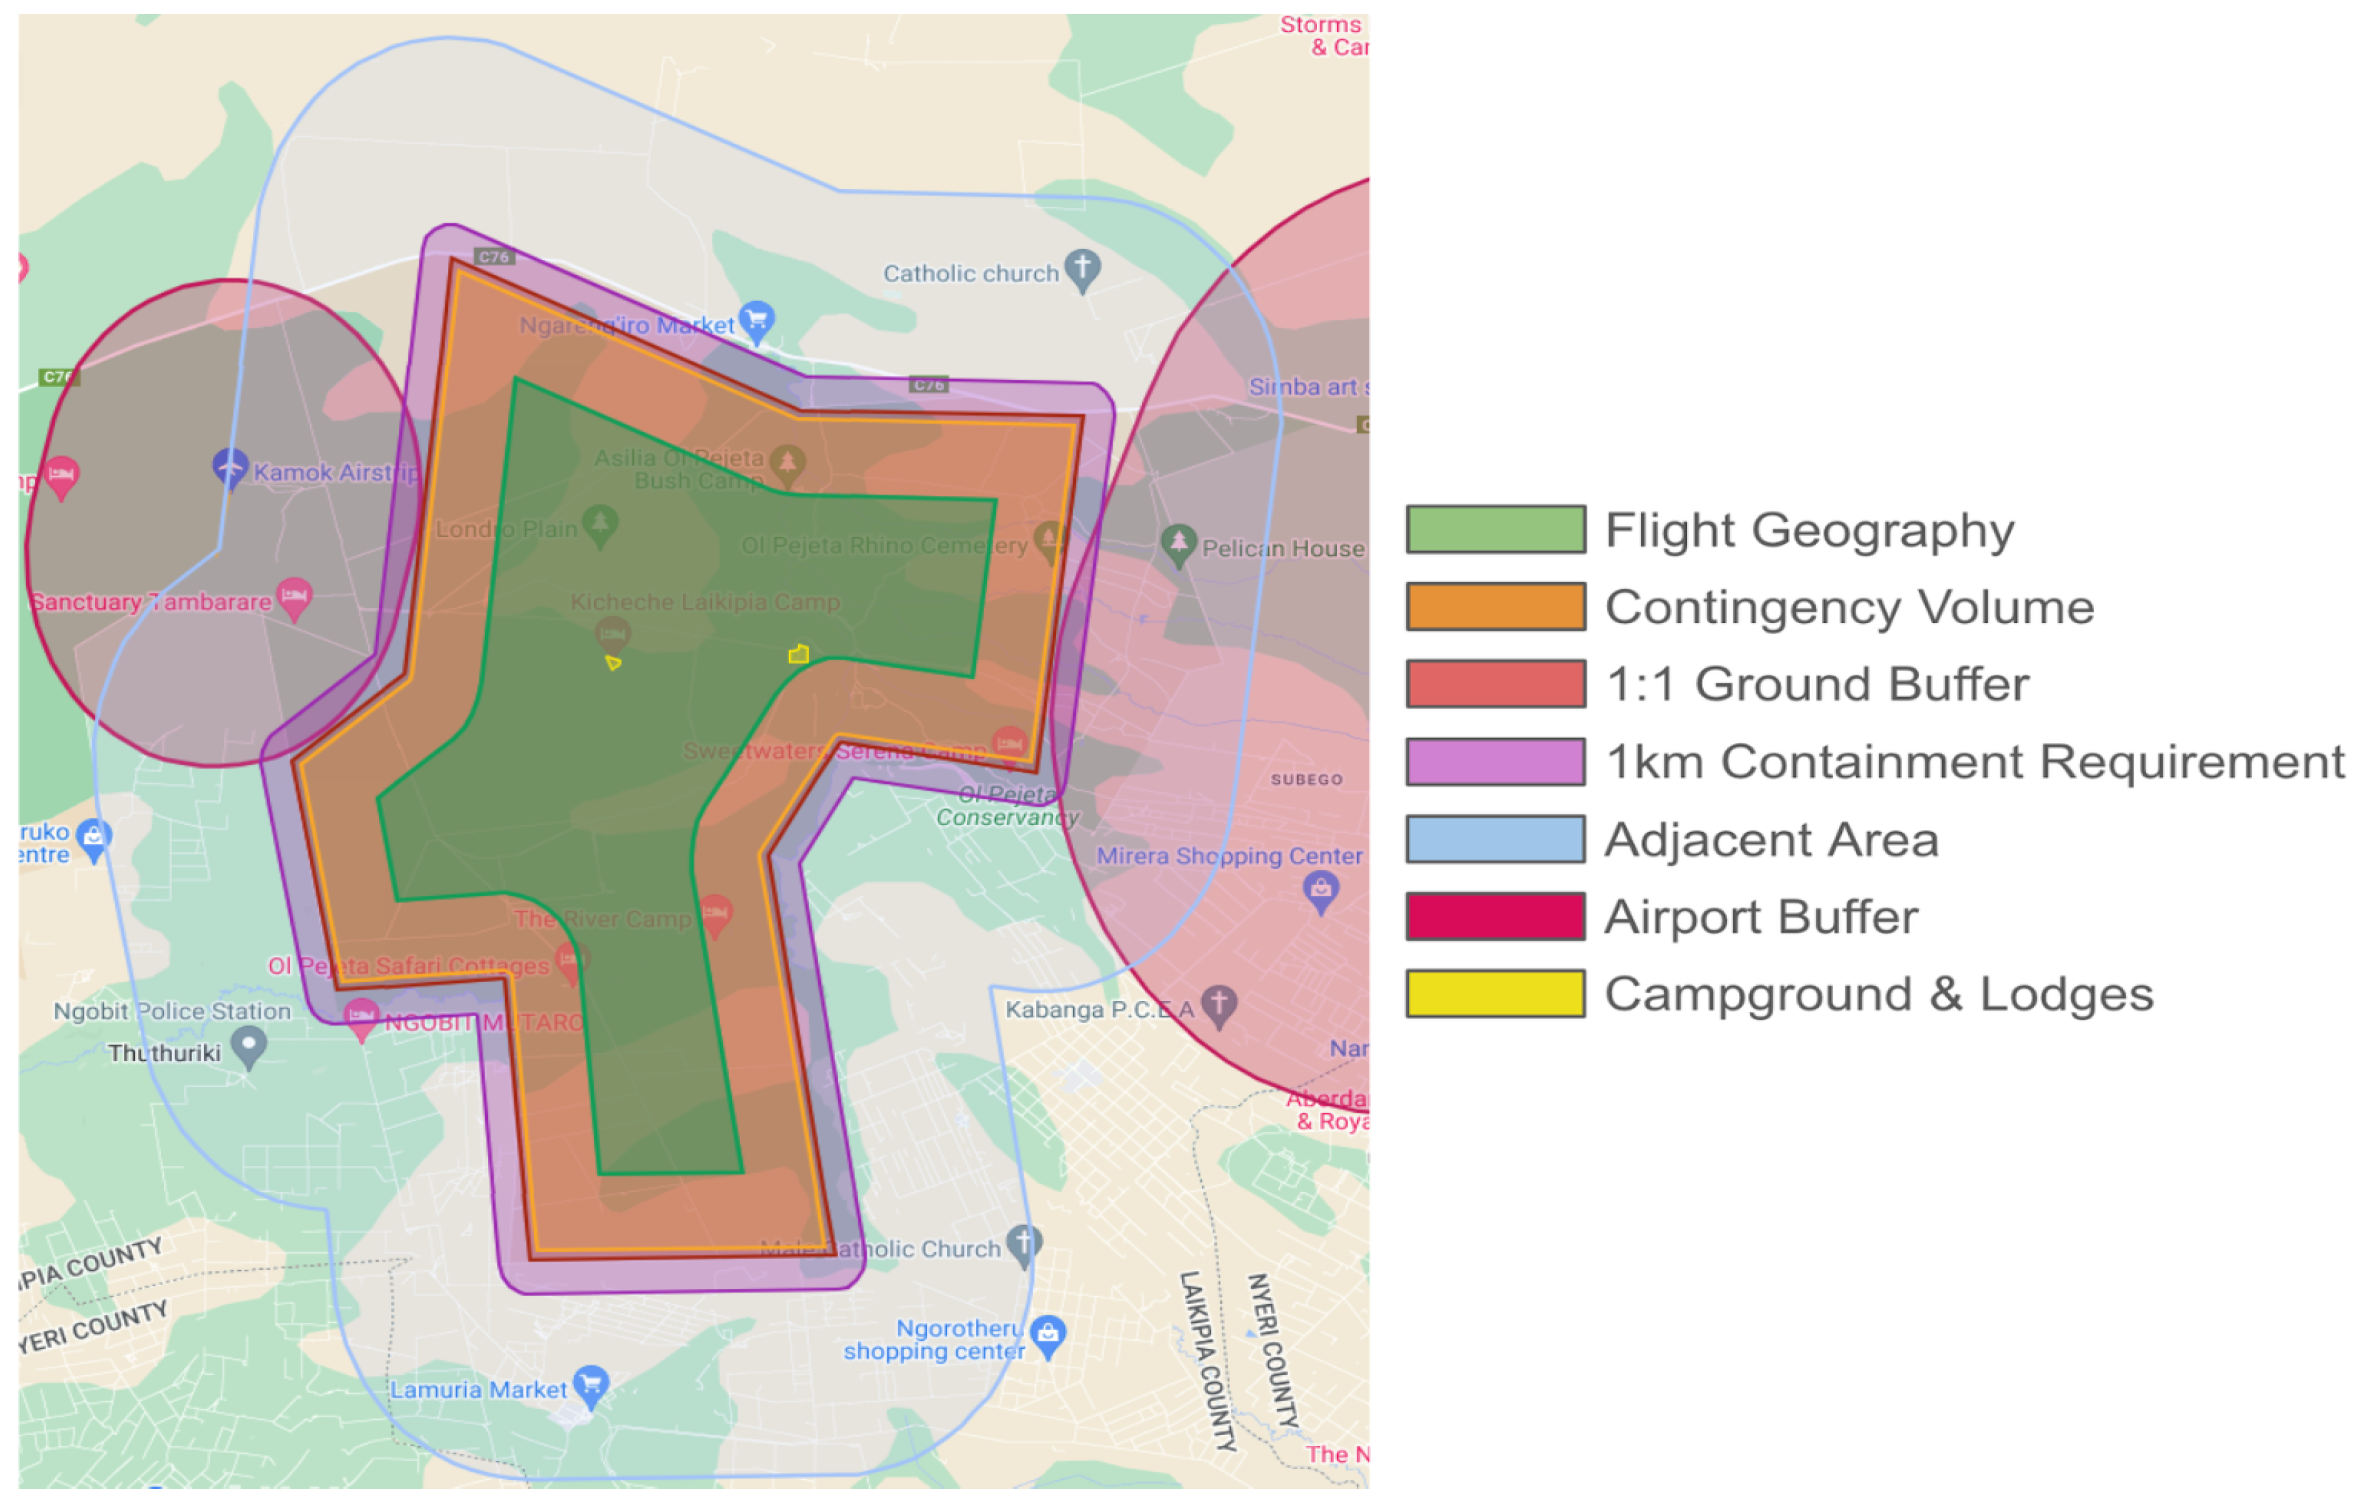
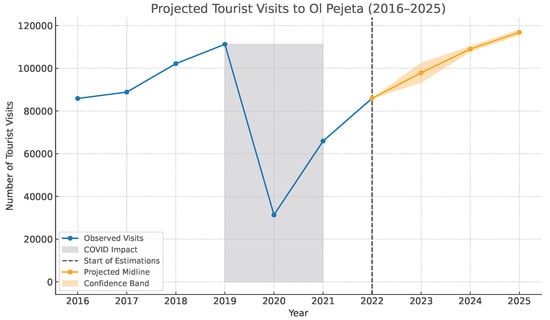
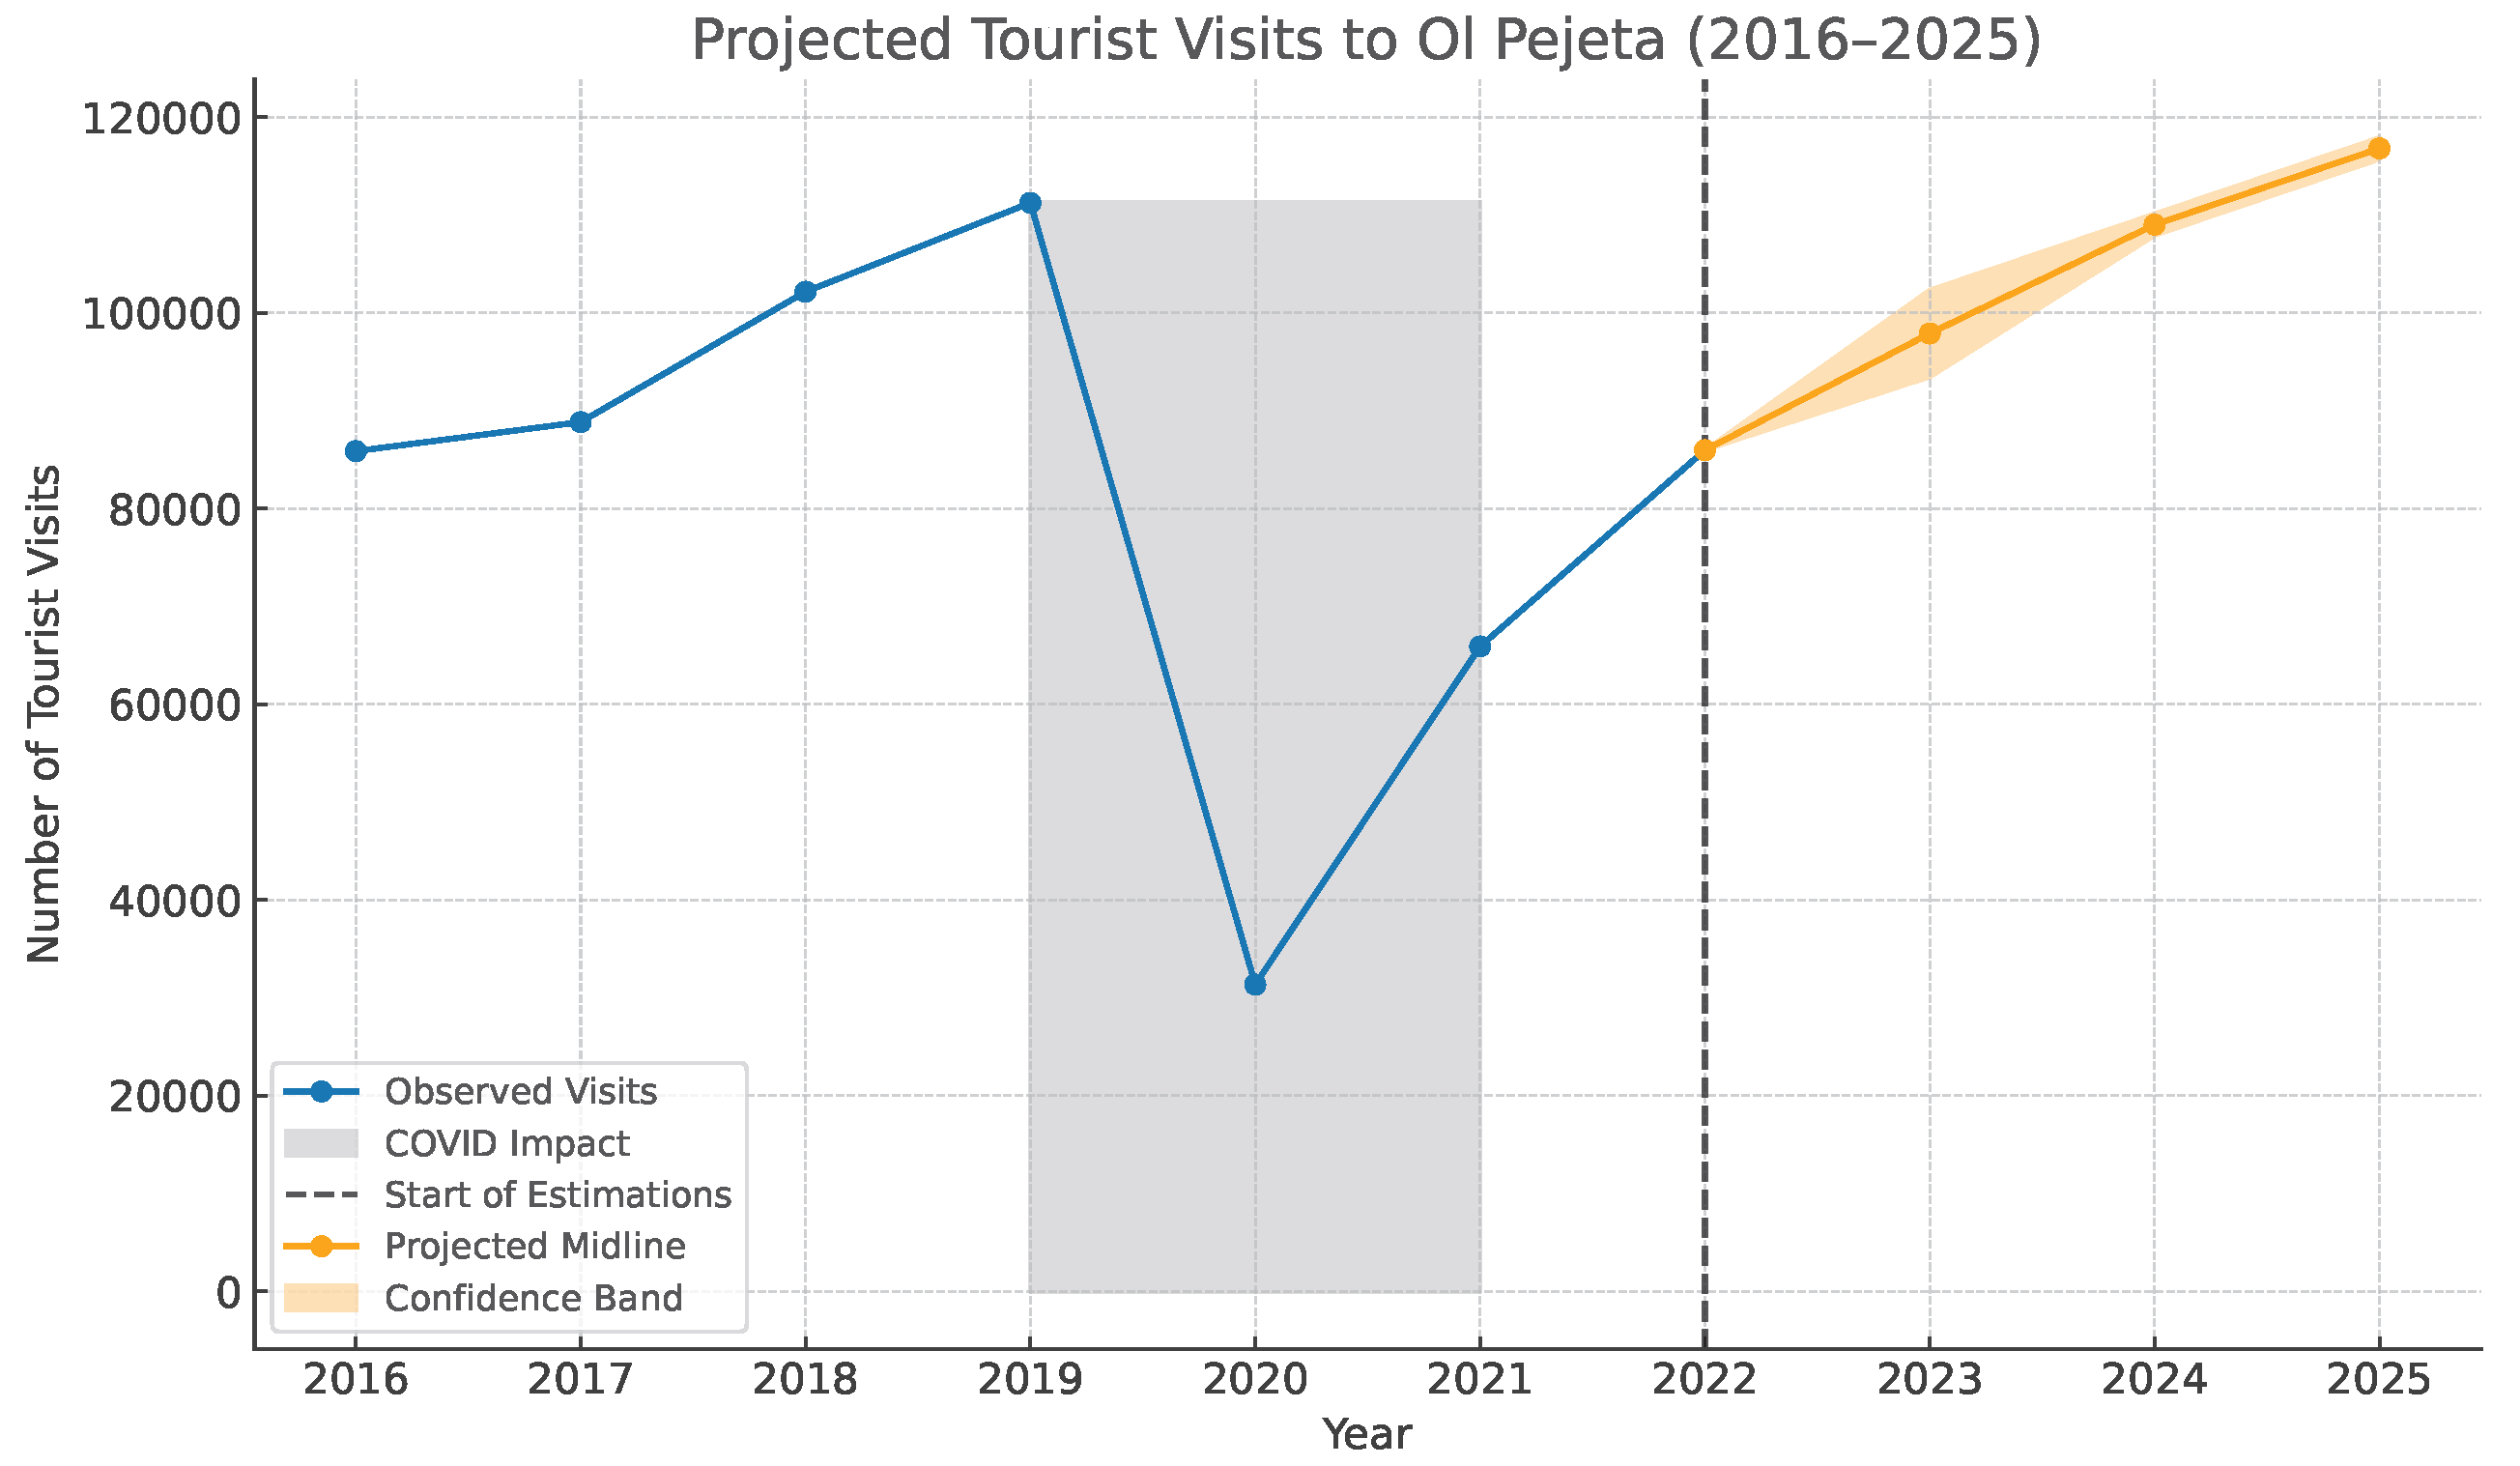
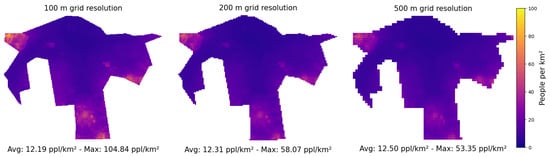
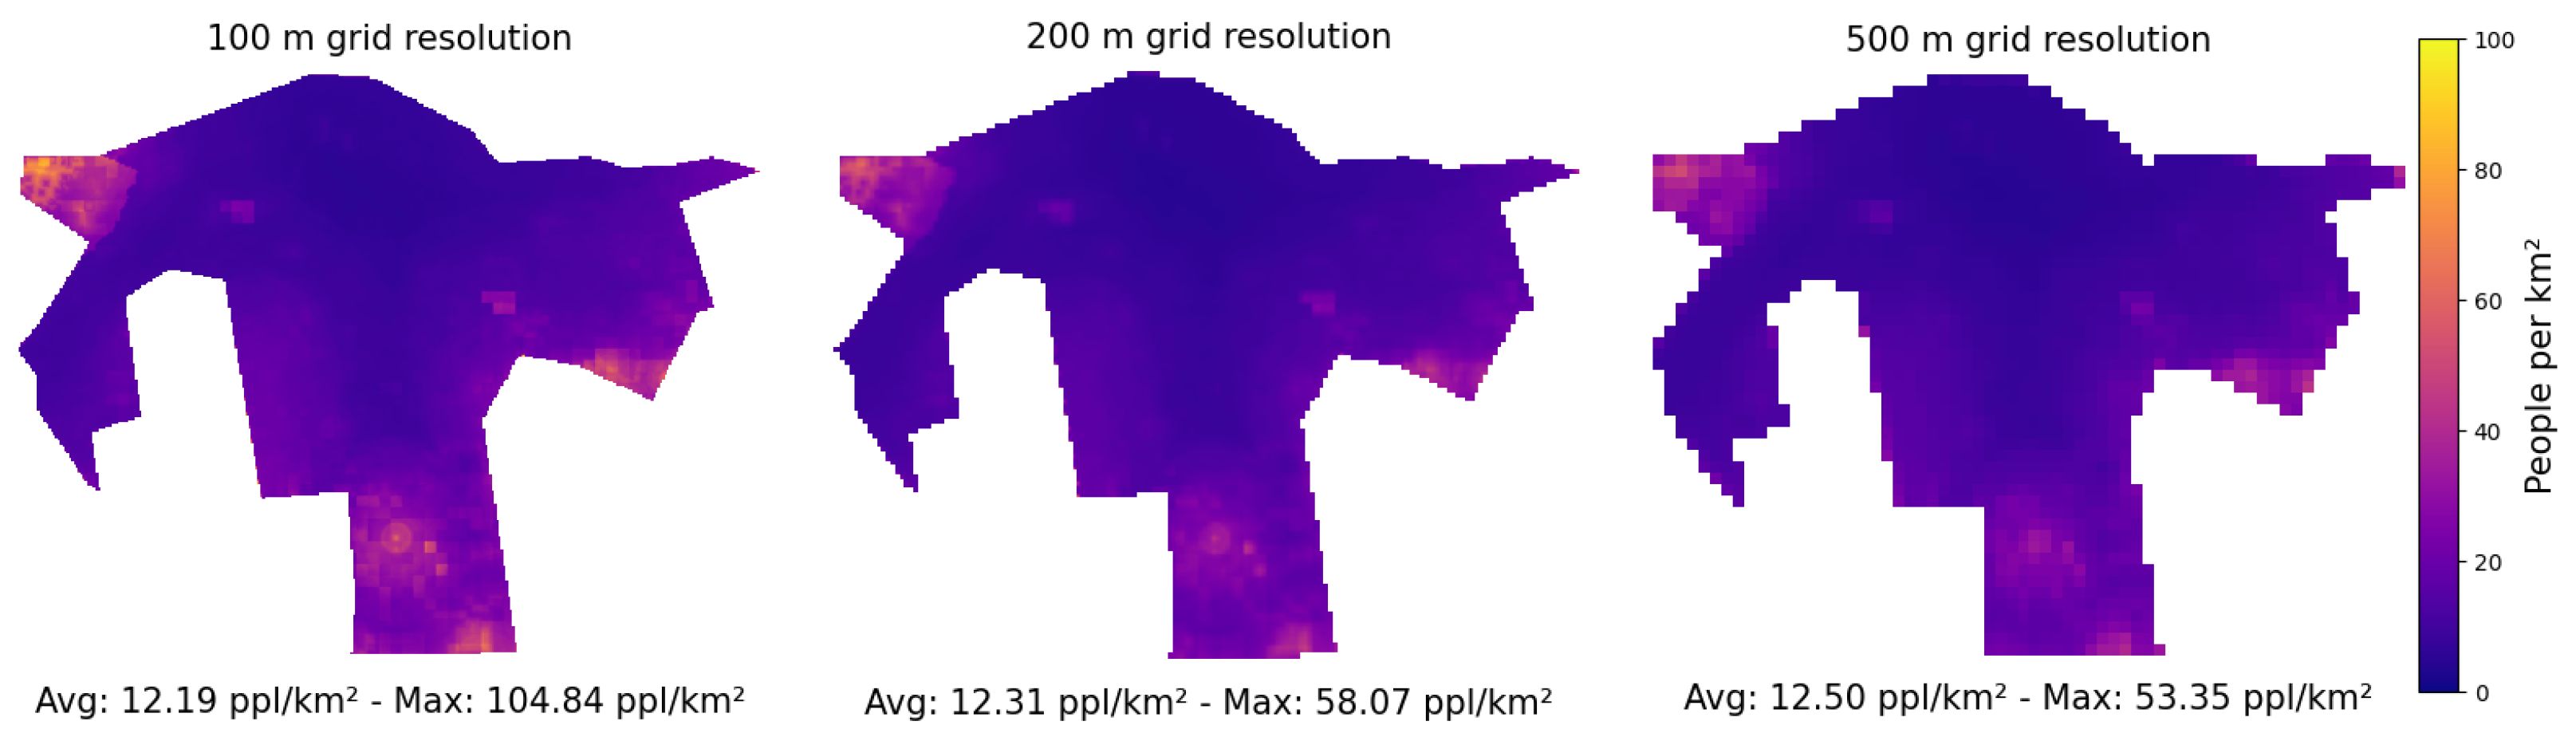
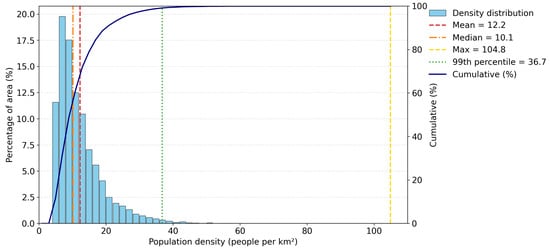
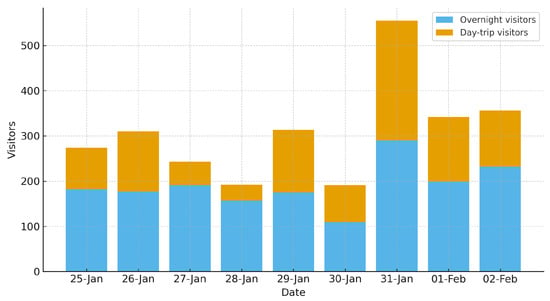
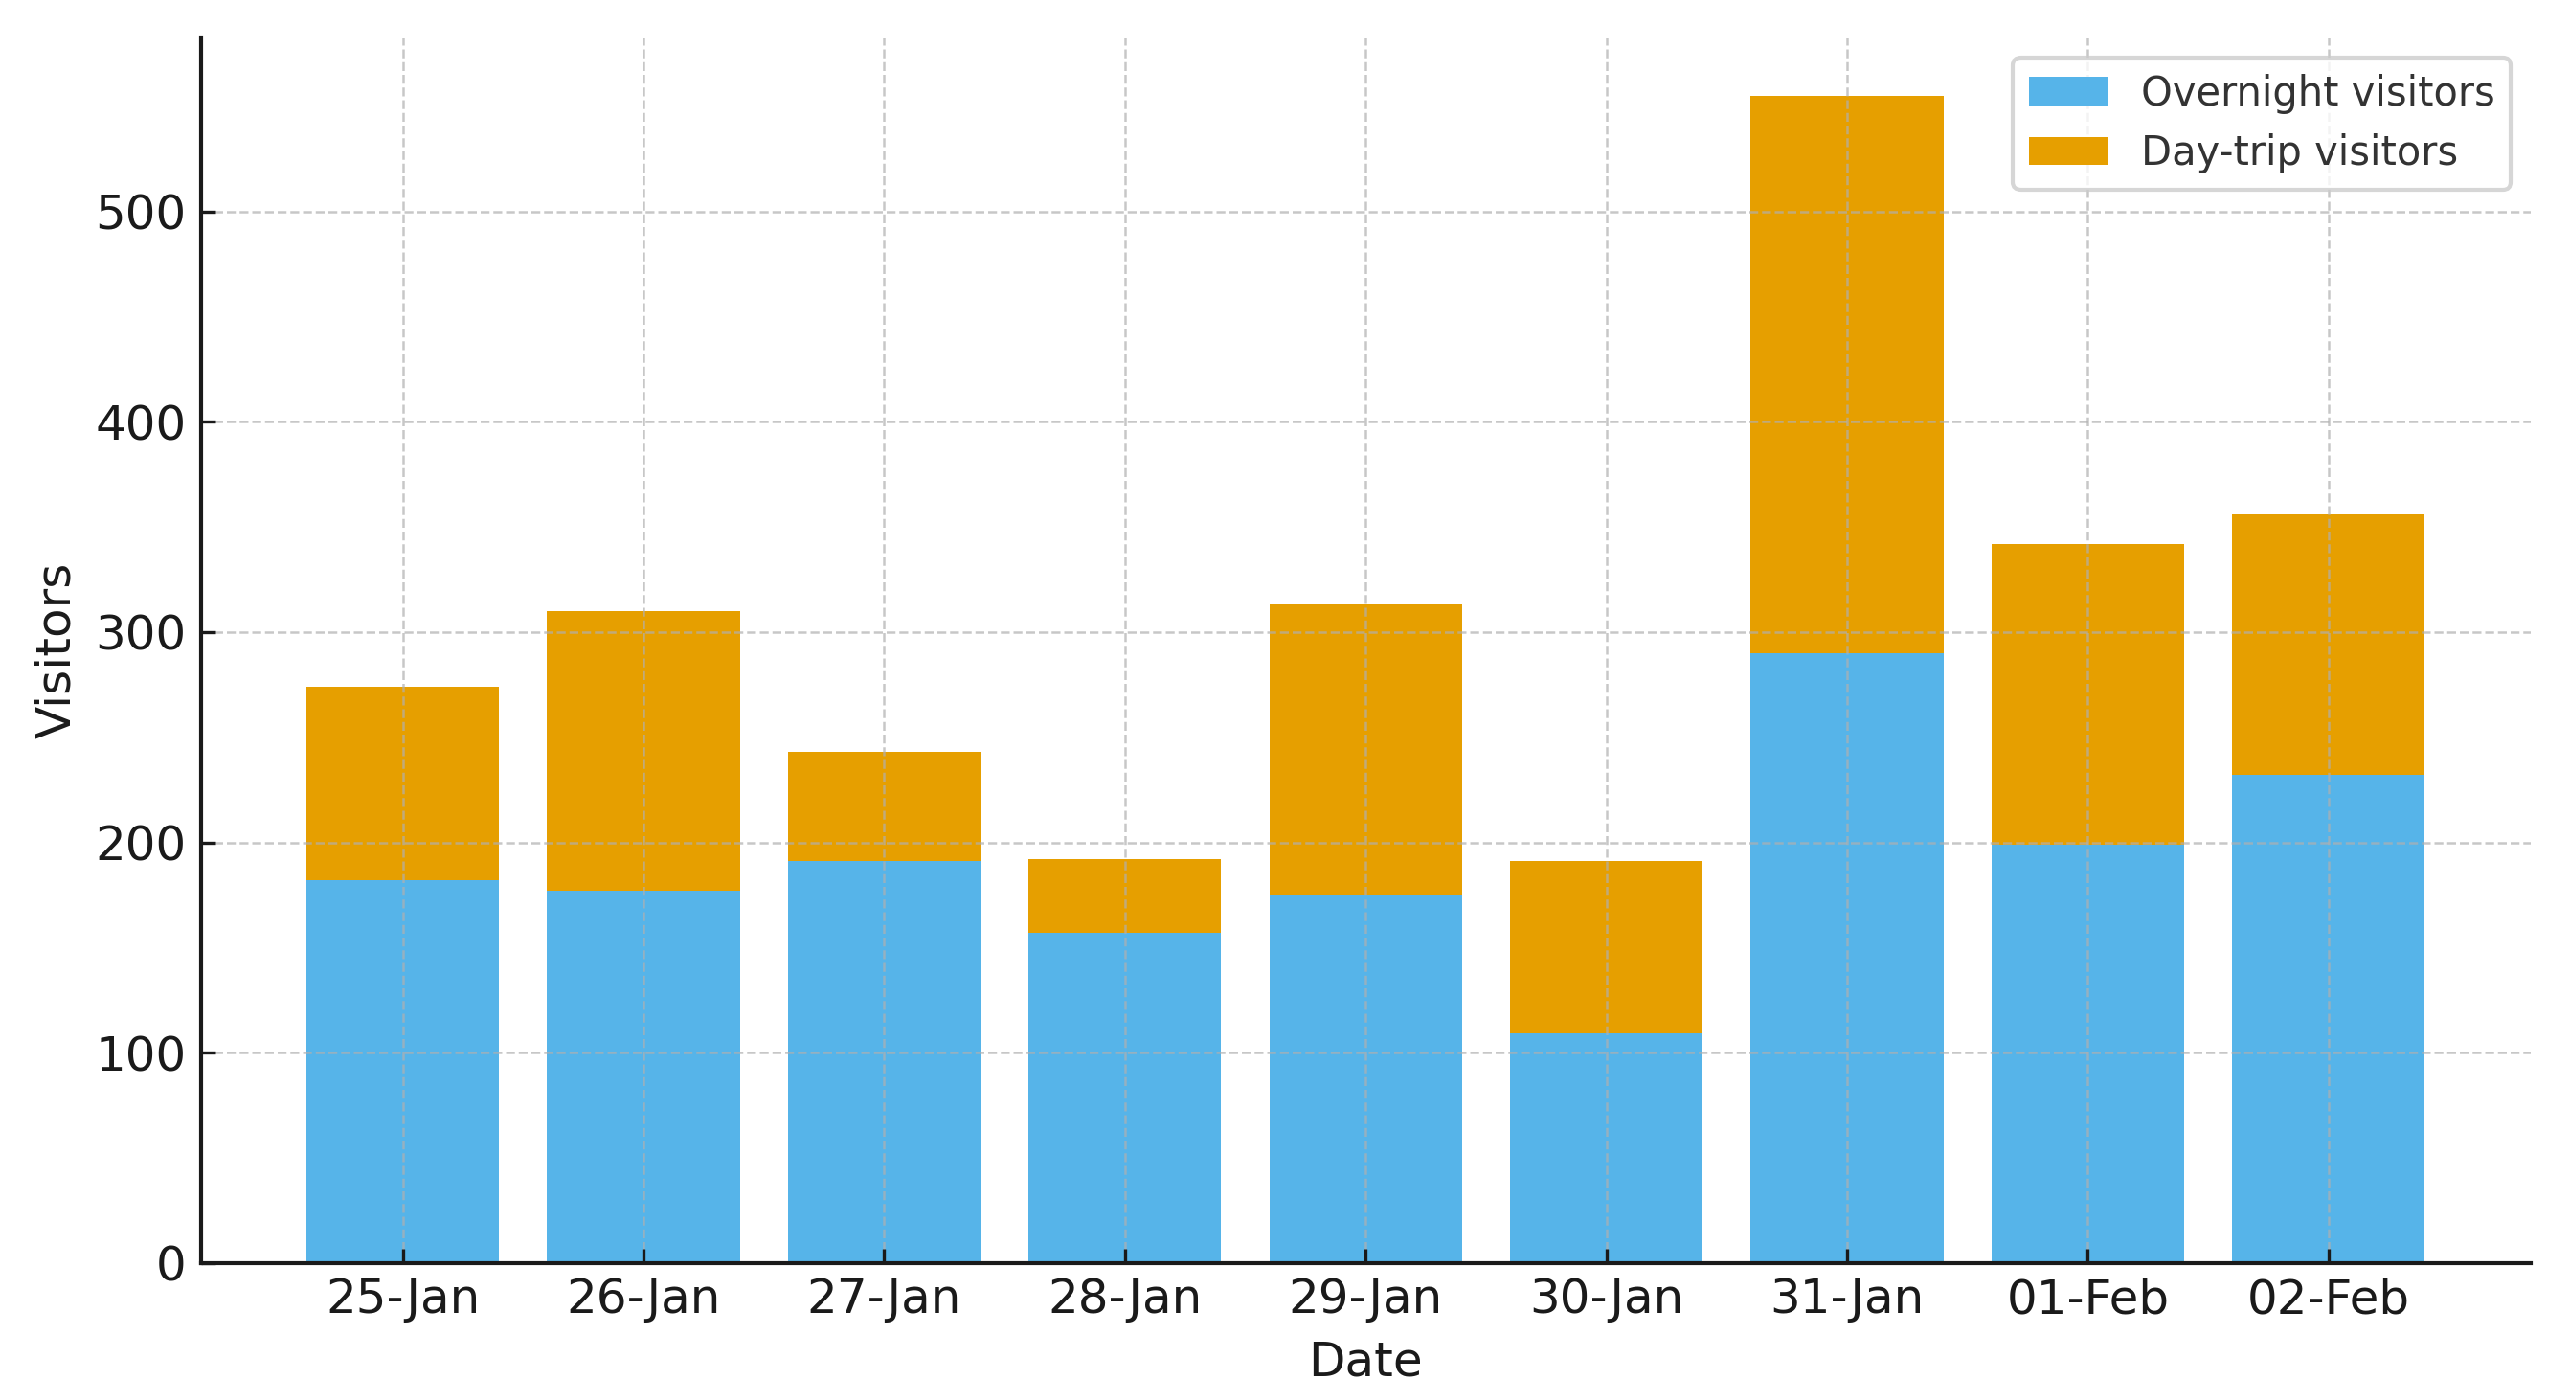
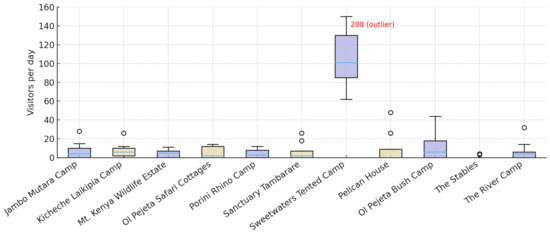
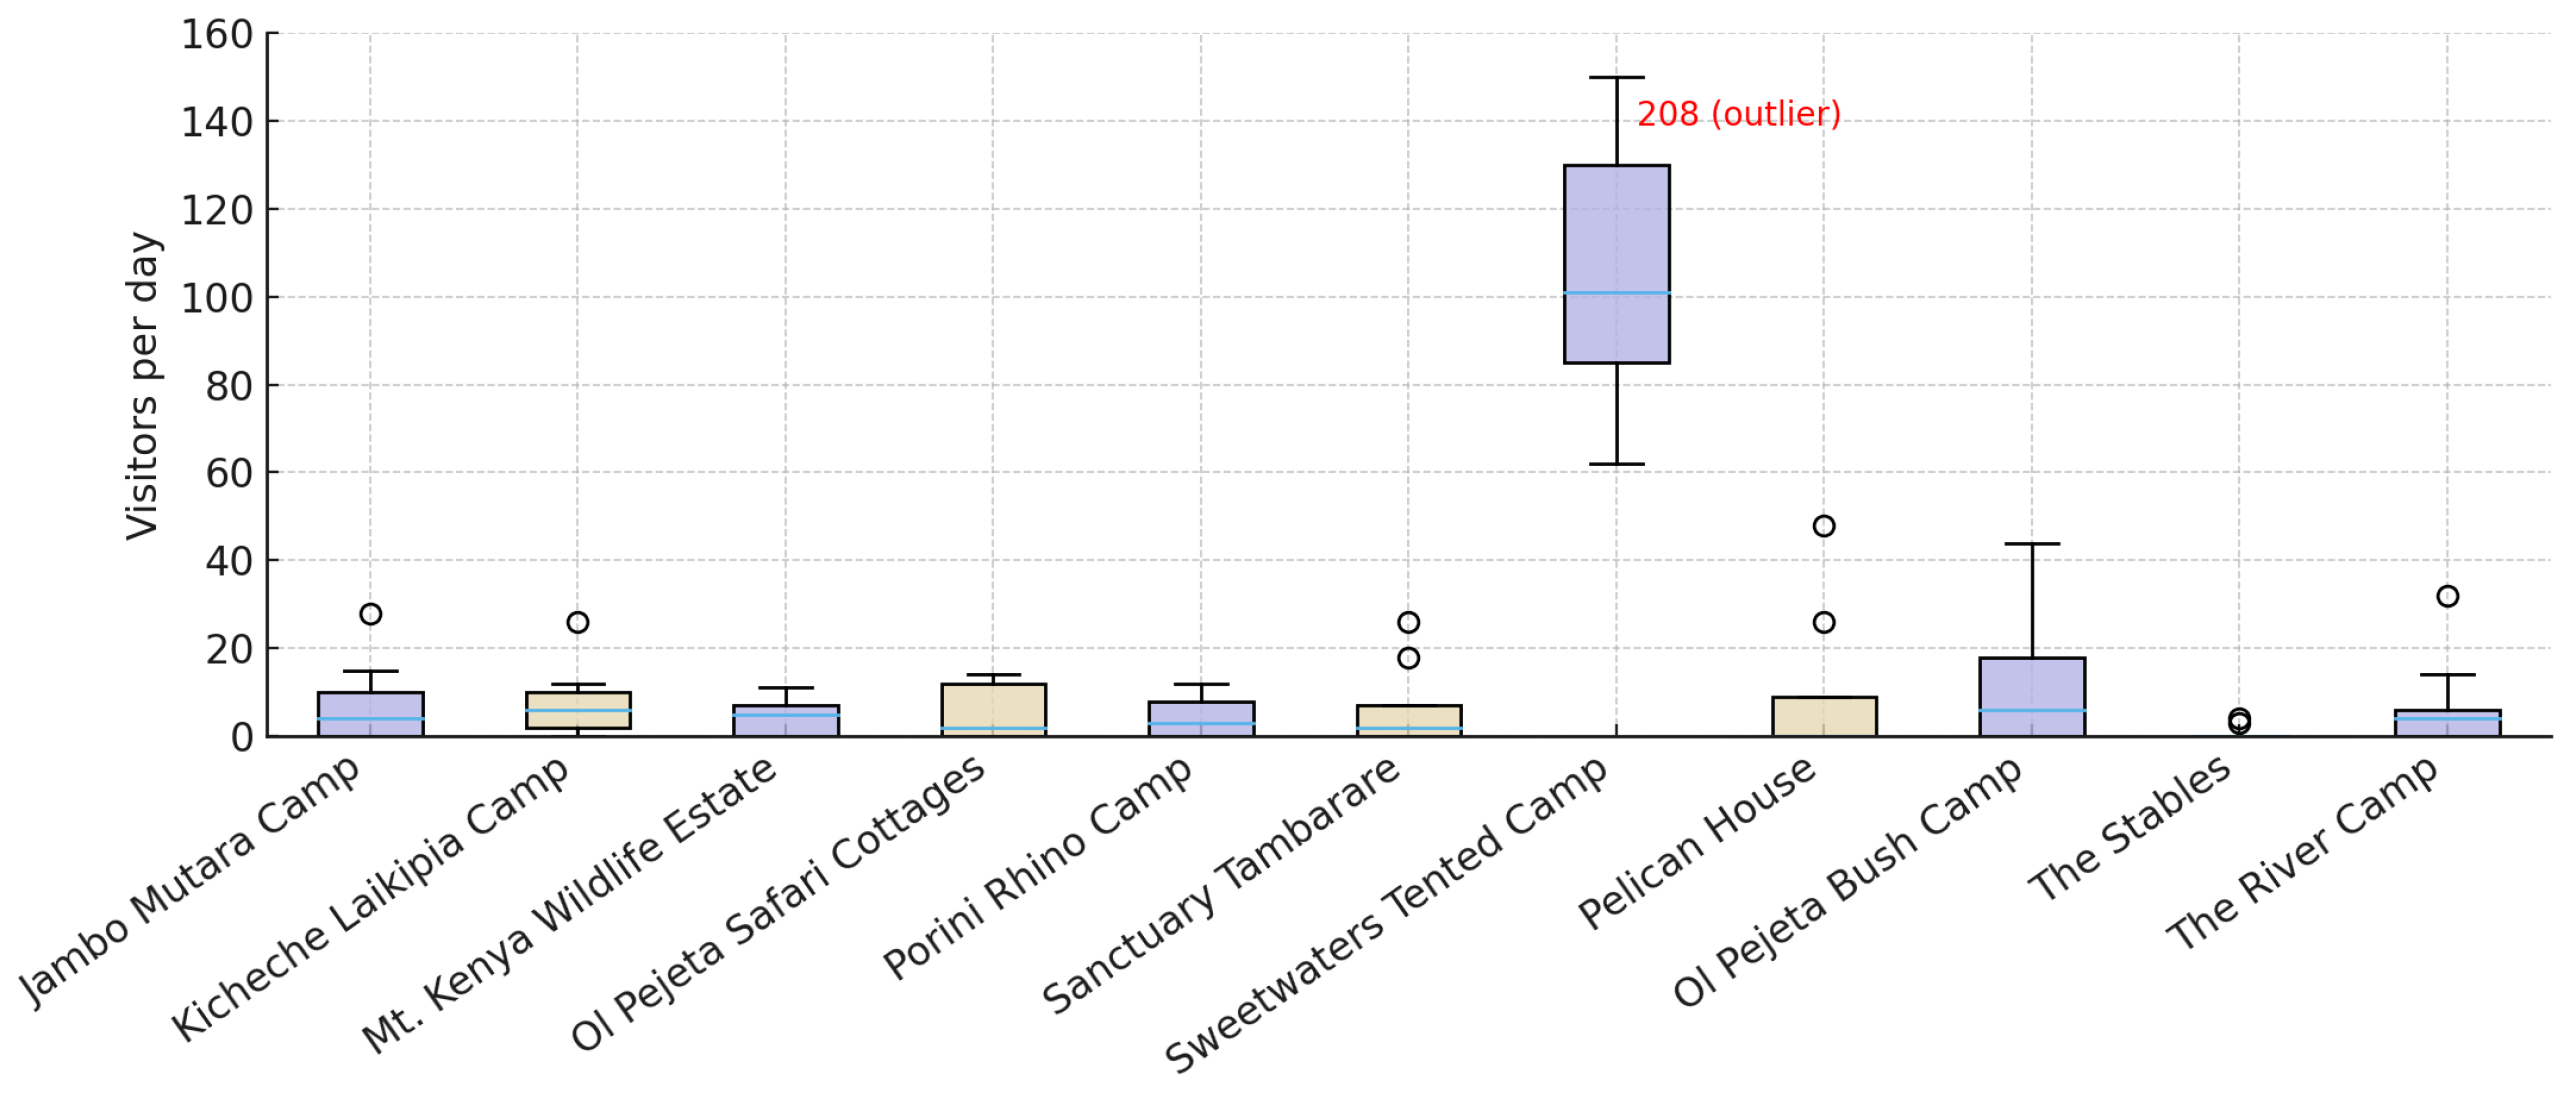
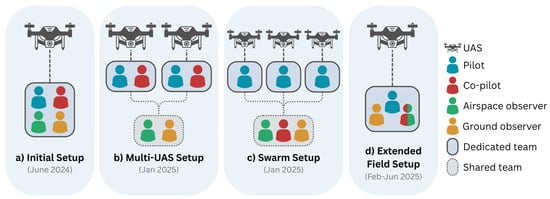
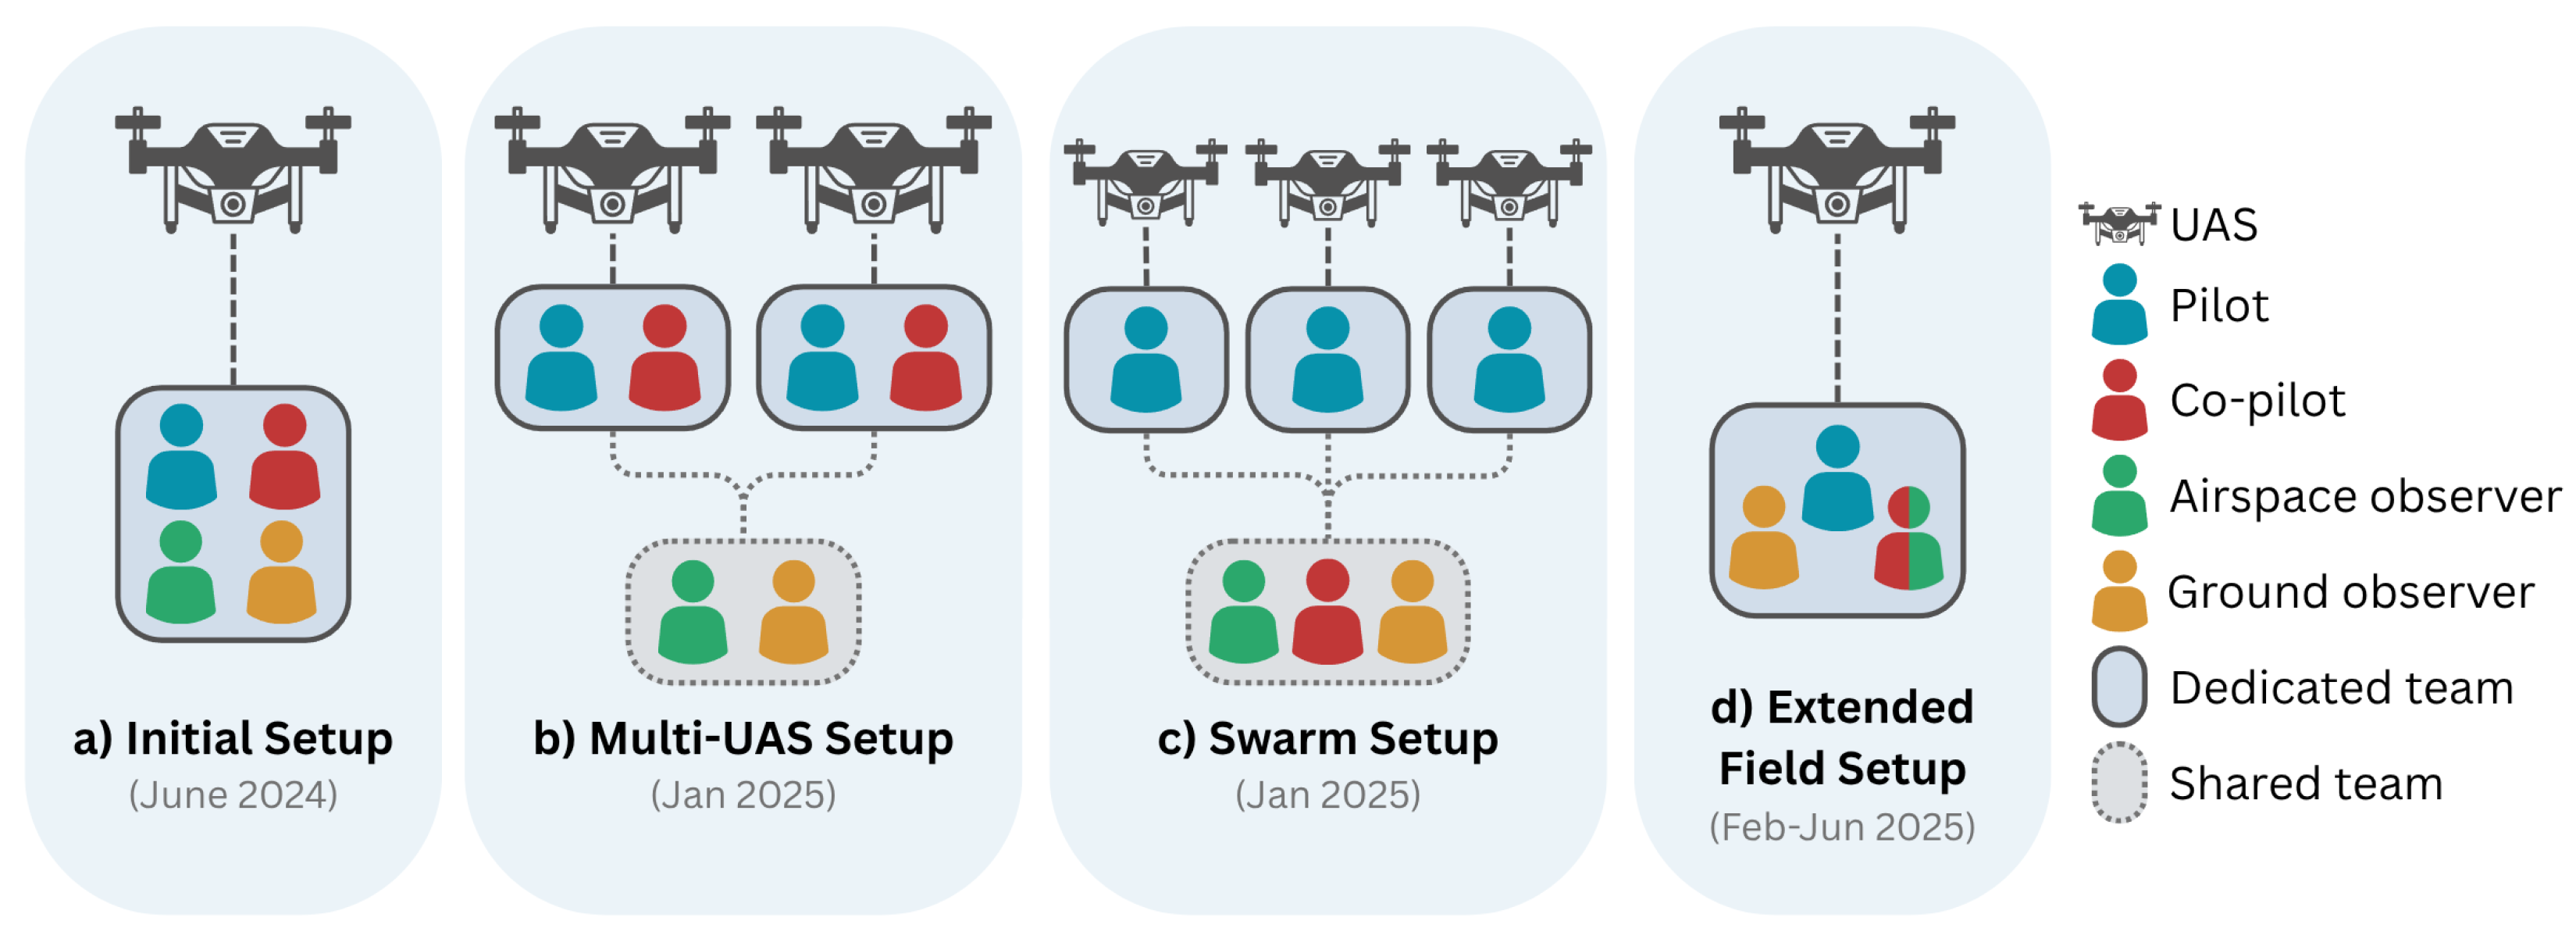
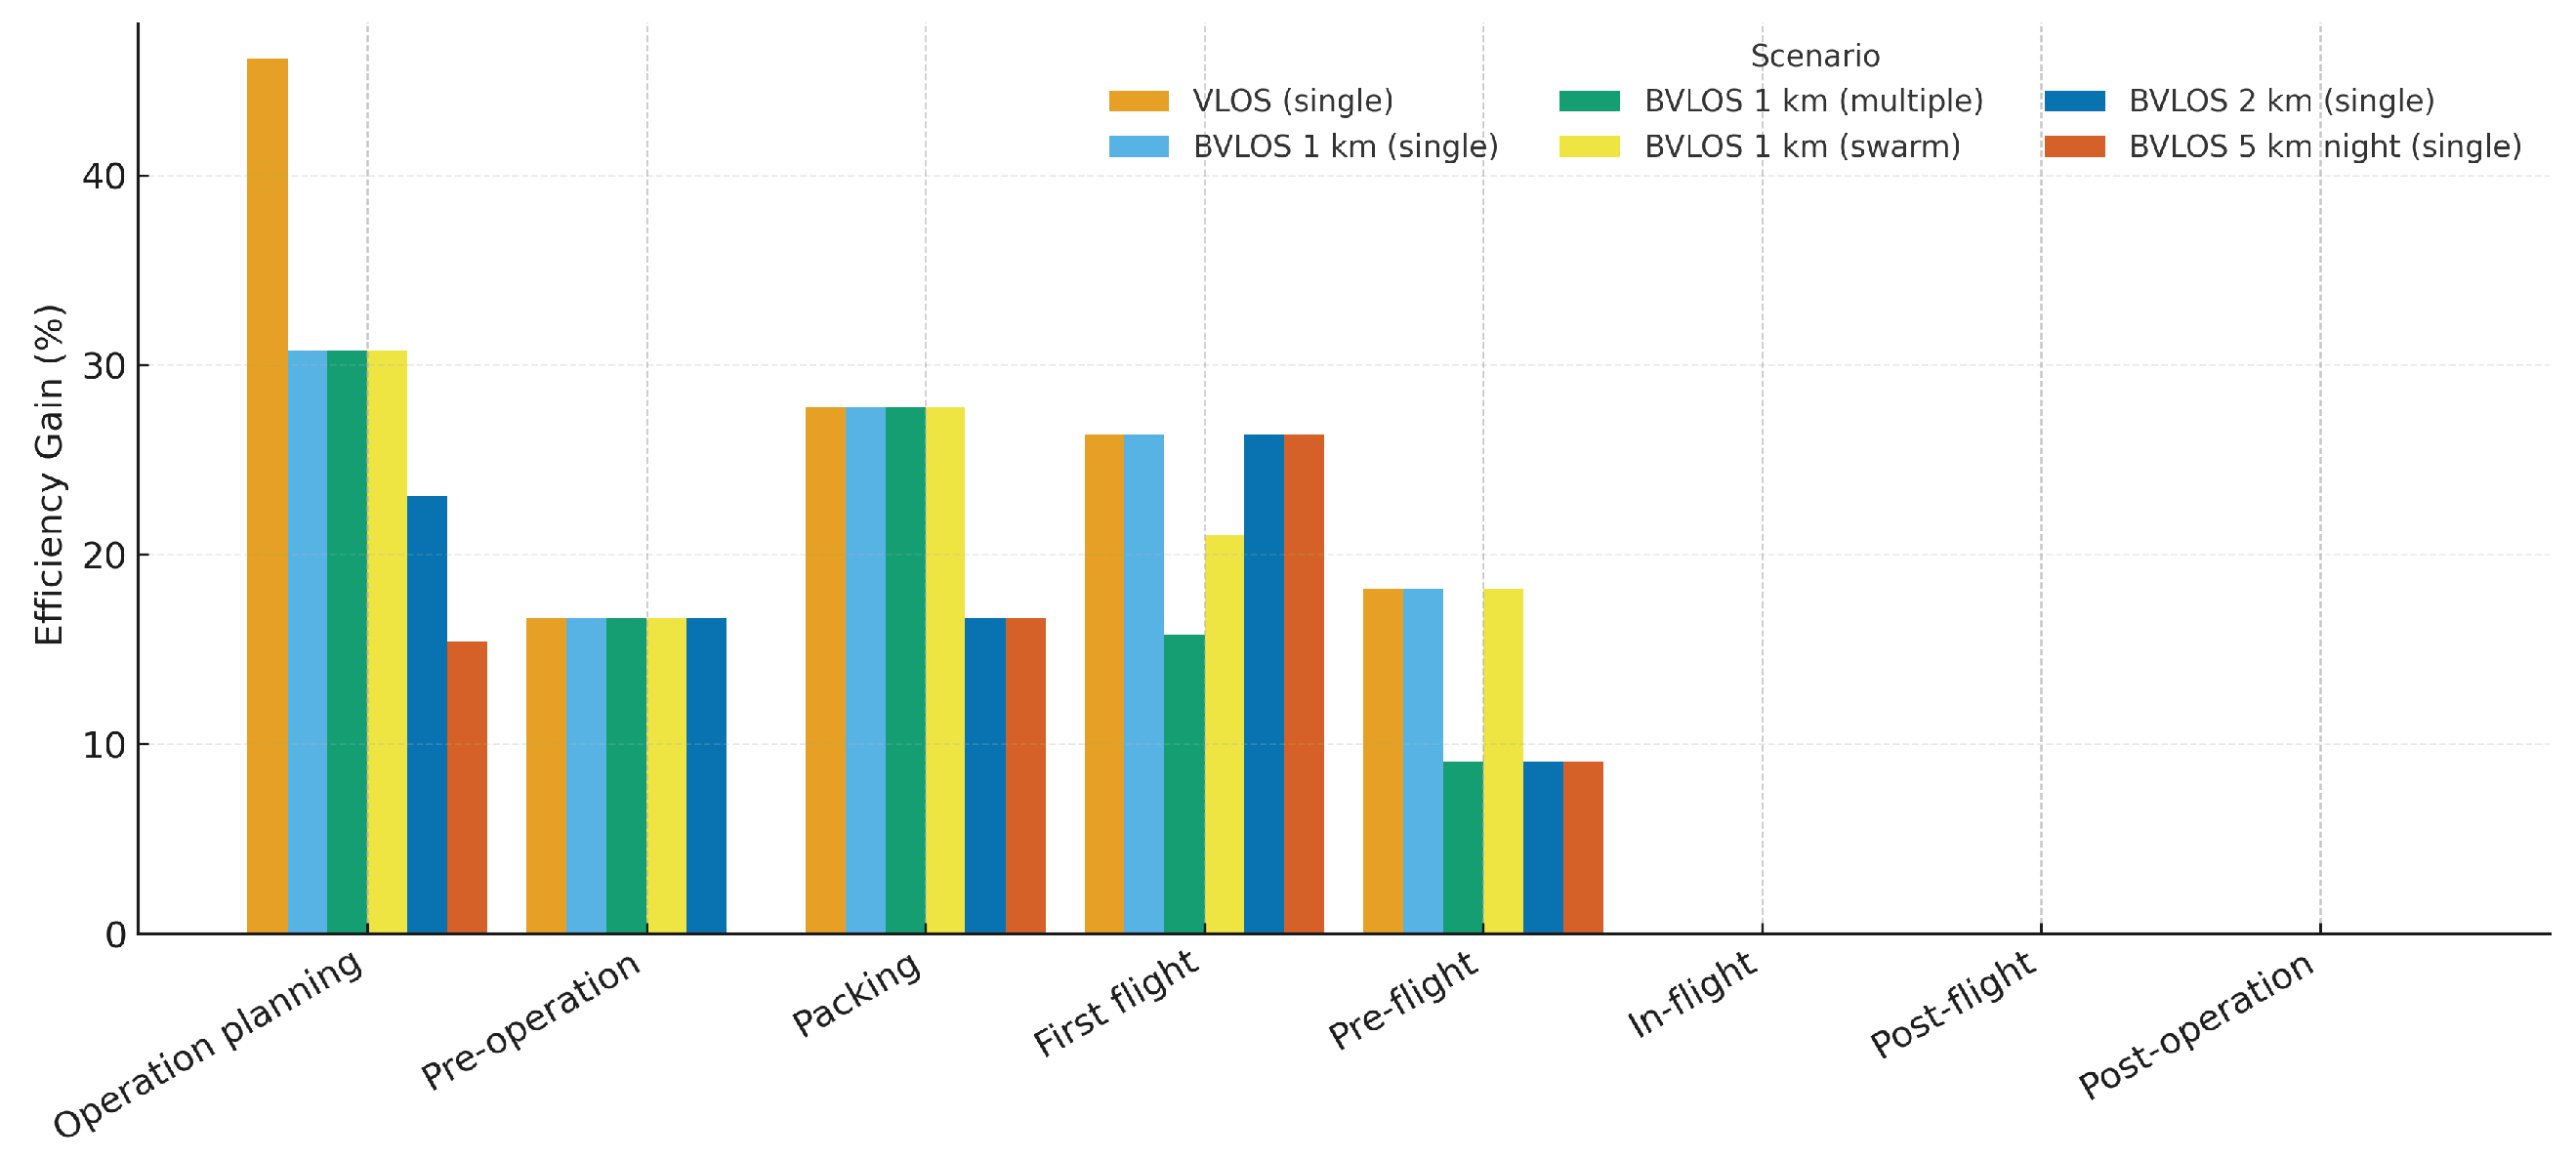

Disclaimer/Publisher’s Note: The statements, opinions and data contained in all publications are solely those of the individual author(s) and contributor(s) and not of MDPI and/or the editor(s). MDPI and/or the editor(s) disclaim responsibility for any injury to people or property resulting from any ideas, methods, instructions or products referred to in the content. |
© 2026 by the authors. Licensee MDPI, Basel, Switzerland. This article is an open access article distributed under the terms and conditions of the Creative Commons Attribution (CC BY) license.