


Abstract
Relative Entropy (RE) is defined as the measure of the degree of randomness of any geographical variable (i.e., urban growth). It is an effective indicator to evaluate the patterns of urban growth, whether compact or dispersed. In the present study, RE has been used to evaluate the urban growth of Dehradun city. Dehradun, the capital of Uttarakhand, is situated in the foothills of the Himalayas and has undergone rapid urbanization. Landsat satellite data for the years 2000, 2010 and 2019 have been used in the study. Built-up cover outside municipal limits and within municipal limits was classified for the given time period. The road network and city center of the study area were also delineated using satellite data. RE was calculated for the periods 2000–2010 and 2010–2019 with respect to the road network and city center. High values of RE indicate higher levels of urban sprawl, whereas lower values indicate compactness. The urban growth pattern over a period of 19 years was examined with the help of RE.
1. Introduction
Rapid urbanization and changes of the landscape have been witnessed in some developing countries as a result of fast economic development. Therefore, the measurement and monitoring of land use changes in these areas is a crucial task for planning and management purposes [1]. Relative Entropy is an effective indicator to evaluate the patterns of urban growth, whether compact or dispersed, with regard to a factor. It measures the degree of randomness of any geographical variable (i.e., urban growth) among n zones [2,3]. Through this, the entropy structure and behavior of different systems (i.e., urban sprawl) can be described [4]. Entropy-based approaches have been widely used for measuring urban growth patterns by using remote sensing and Geographical Information System (GIS) [5,6,7,8,9]. In the present study, an attempt has been made to evaluate urban growth using the Relative Entropy of Dehradun.
1.1. Study Area
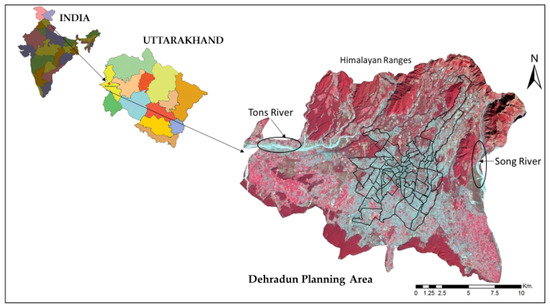
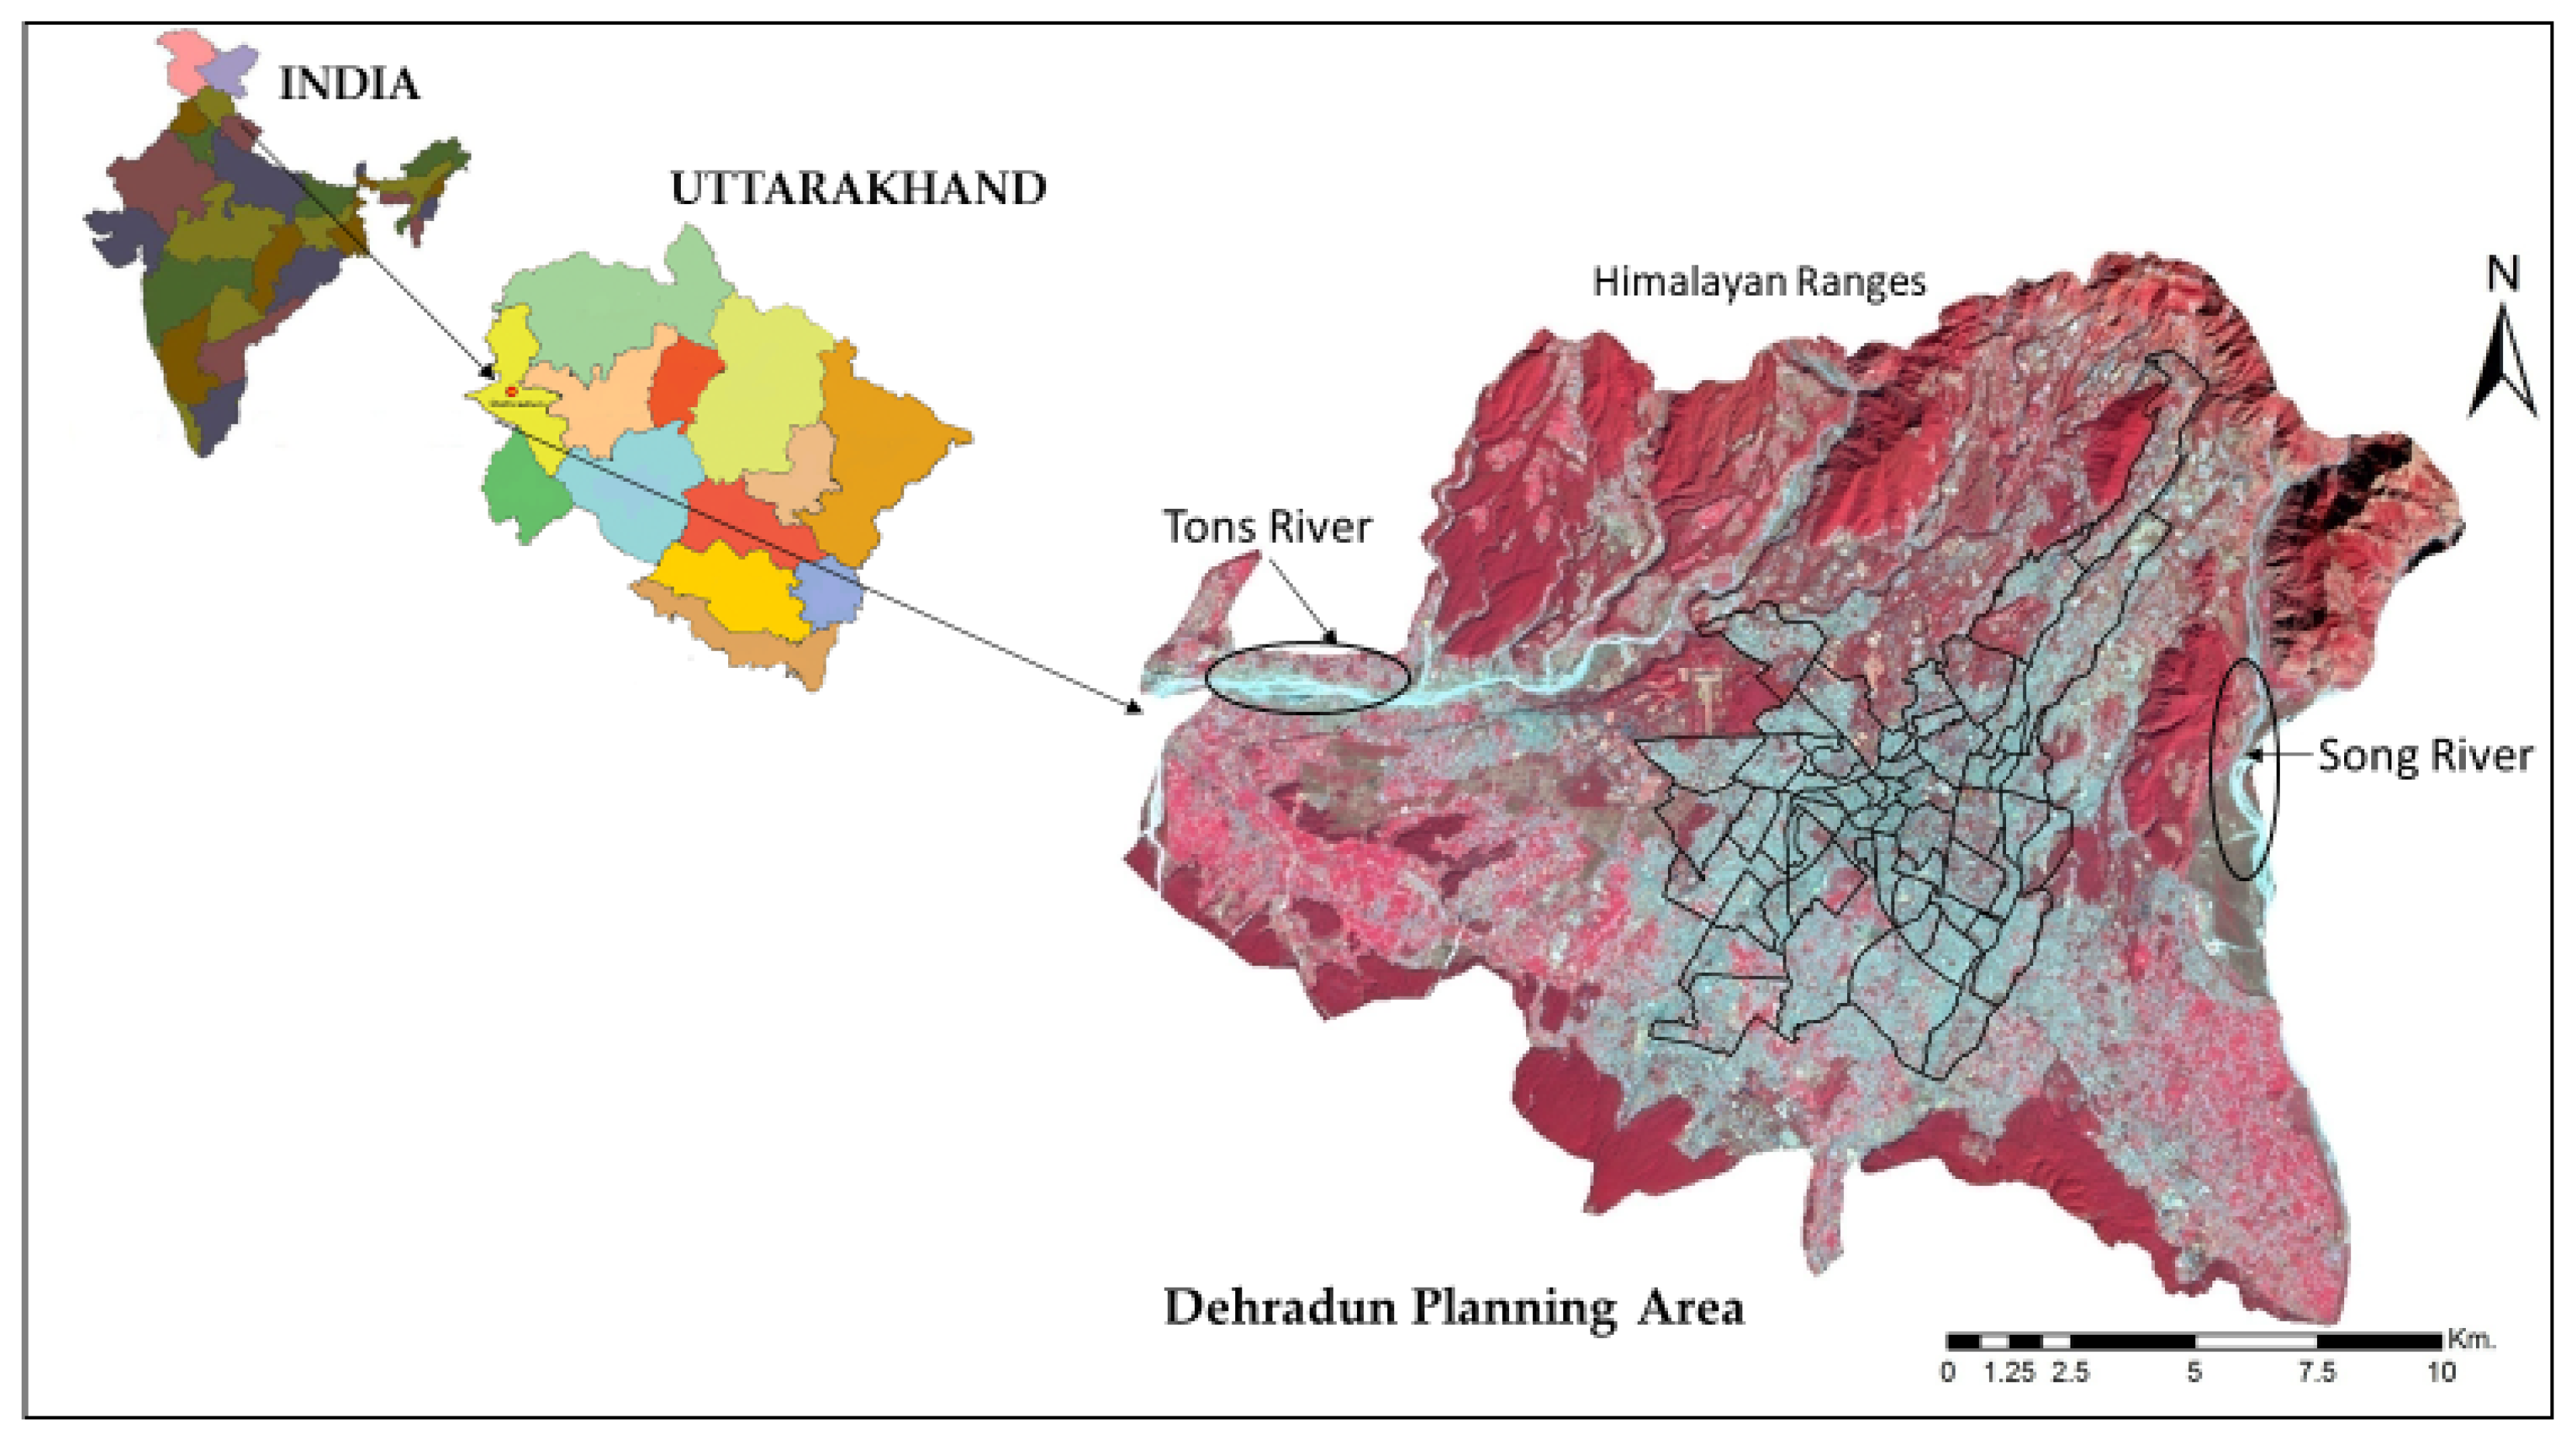
Dehradun Planning Area, which consists of Dehradun city and the surrounding area, is selected as the study area. It is the capital of Uttarakhand state in India. The geographical extents are 30°15′ N to 30°25′ N latitude and 77°55′ E to 78°10′ E longitude with a total area of 360 km2. The study area includes the lower Himalayas on the northern side and Shivalik mountains on the southern side. The River Song and River Tons are situated in the eastern and western parts, respectively. There are a number of civil and defense institutions of national importance situated in the city. It is also a vital service center for trade, health, education, transportation and recreation (Figure 1).
Figure 1.
Location map of the study area.
1.2. Dataset
For the study, Landsat (TM) satellite images for the years 2000, 2010 and 2019 at a spatial resolution of 30 m were used as primary data for the generation of land cover maps and a road network map. The topographical maps (sheet numbers: 53 J/3 and 53 F/15) and guide maps of the study area from the Survey of India (SOI) were used as reference data.
1.3. Methodology
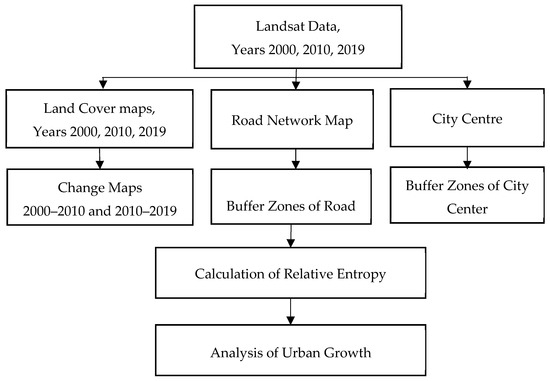
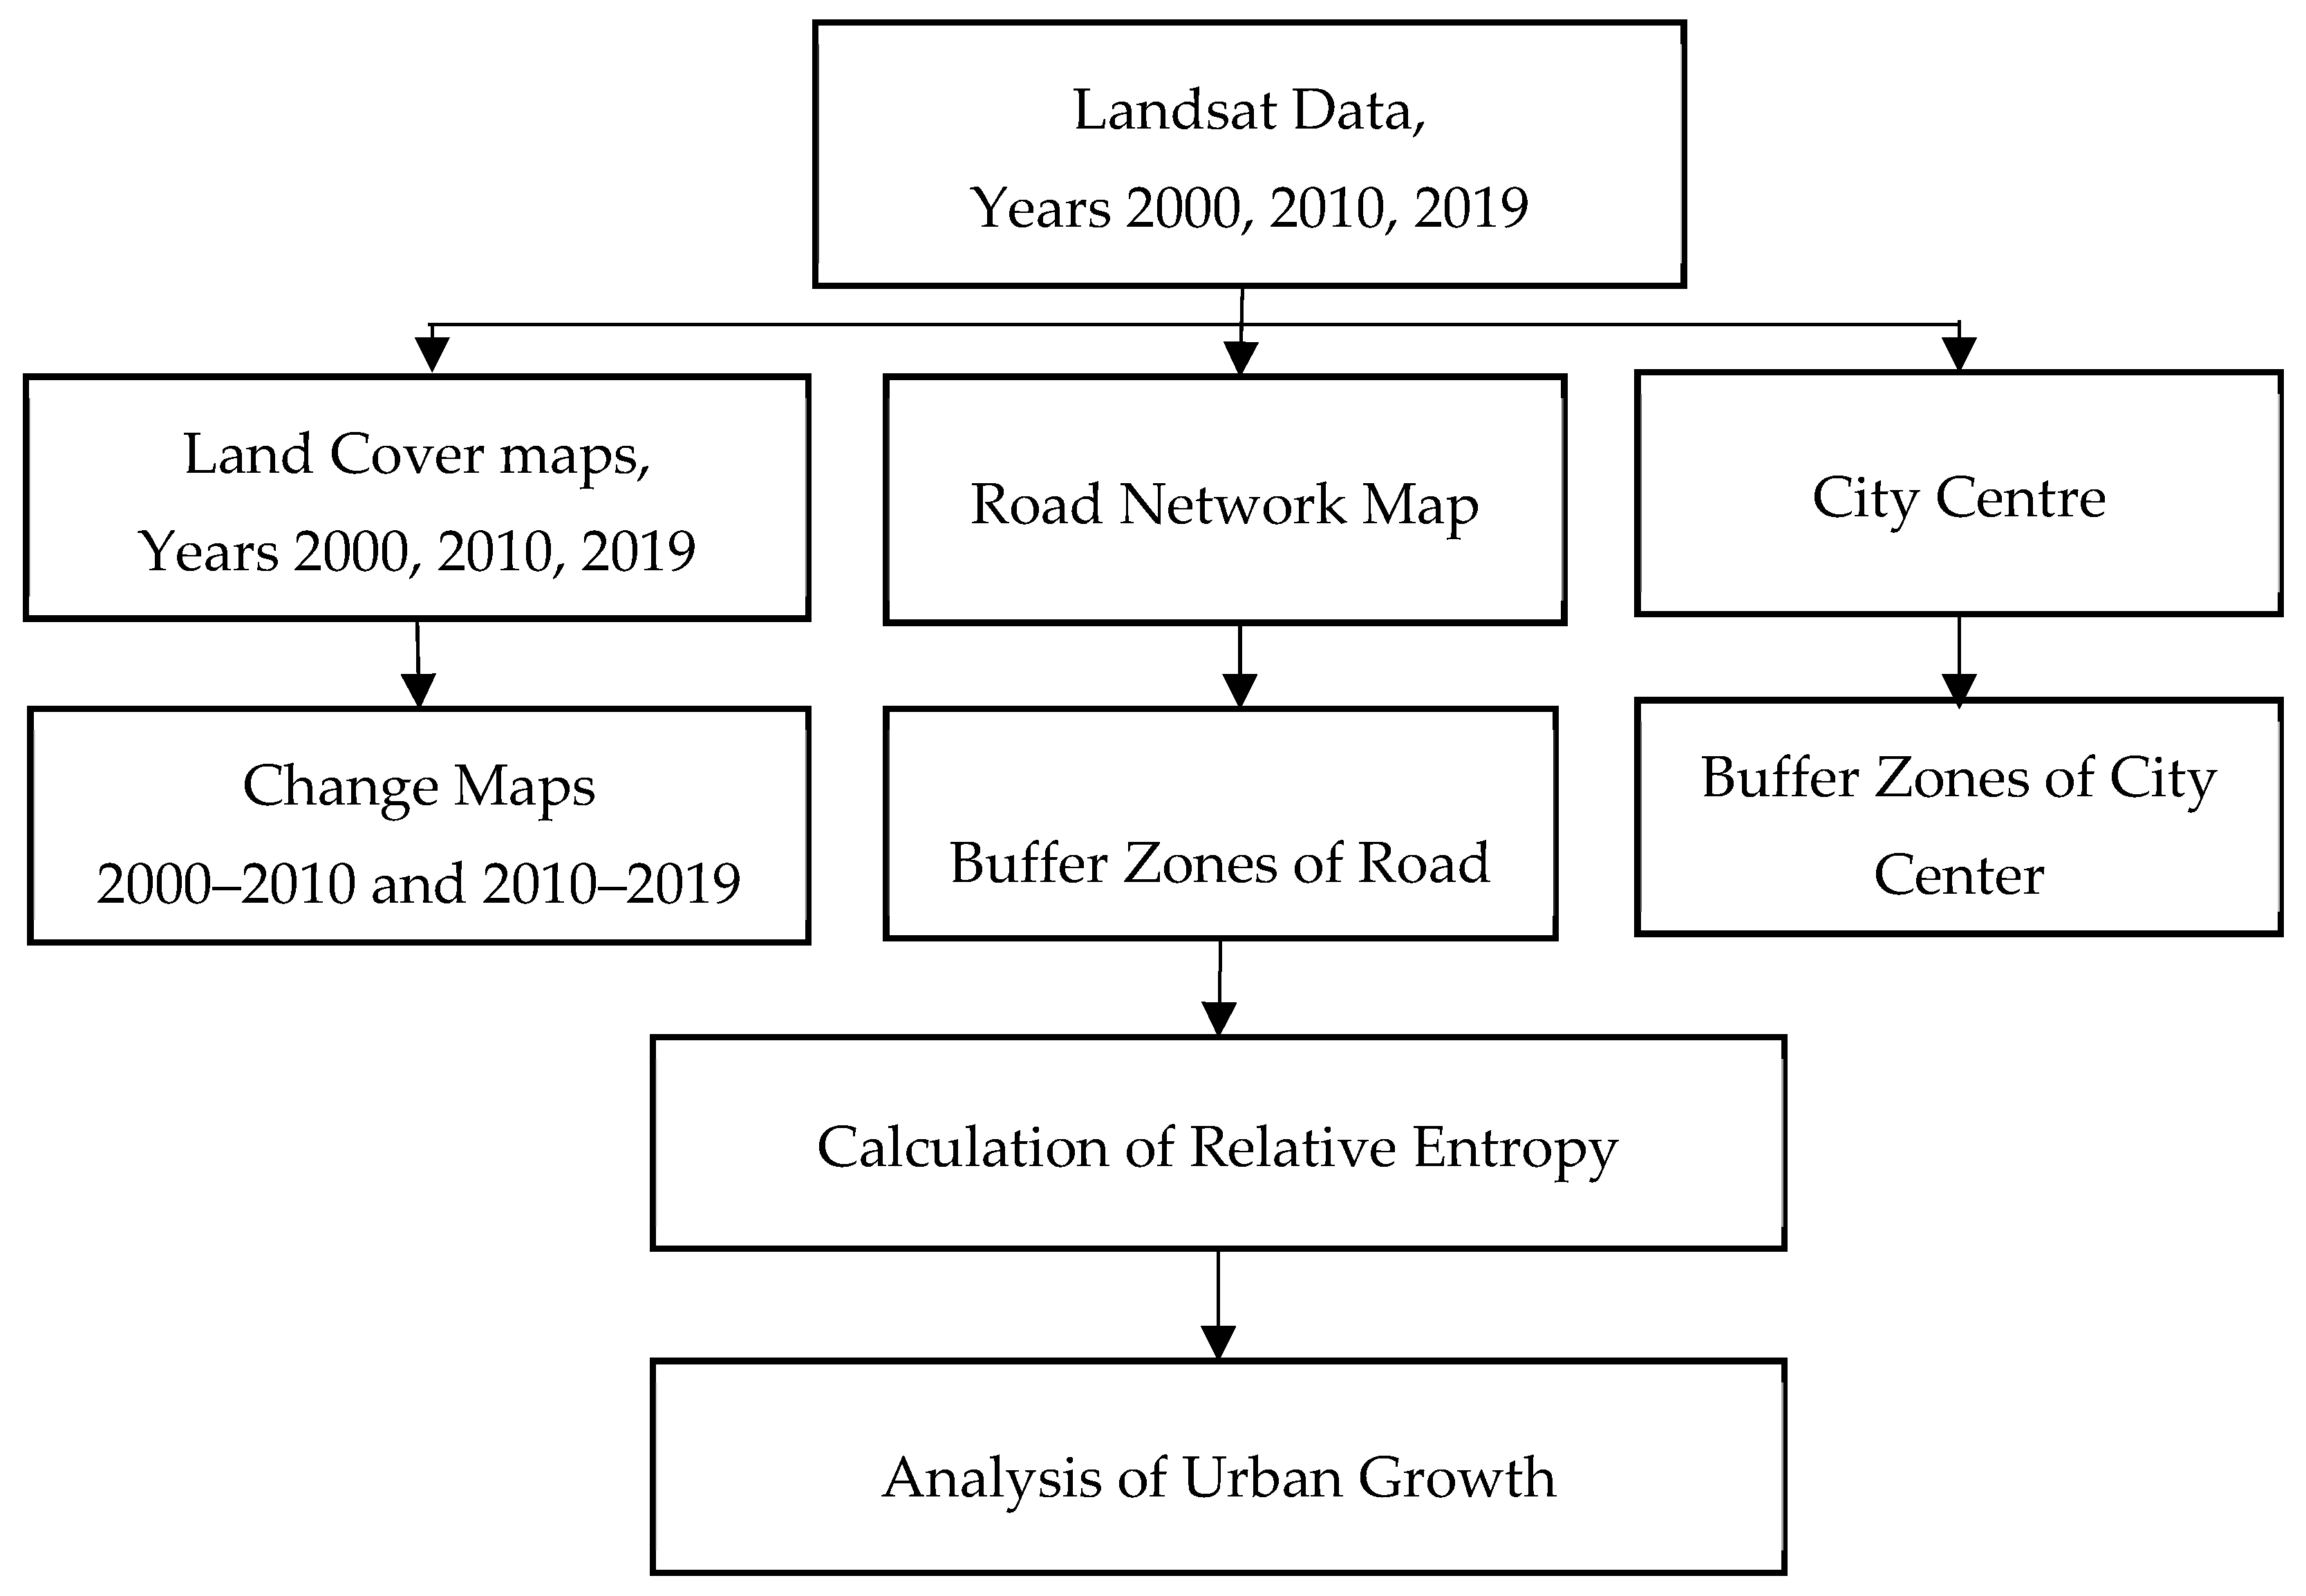
The methodology of the study is given in Figure 2, depicting the preparations of maps (land cover, city center and road network) and the analysis of urban growth.
Figure 2.
Methodological flowchart of the study.
1.4. Preparations of Land Cover Maps
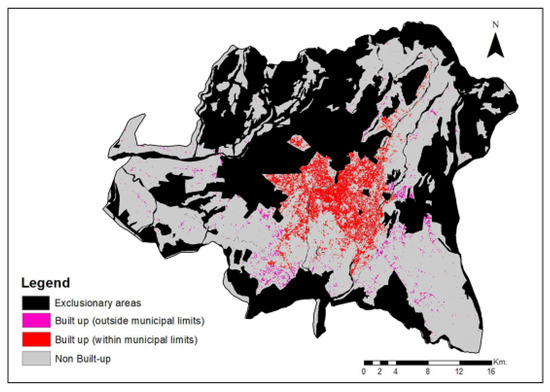
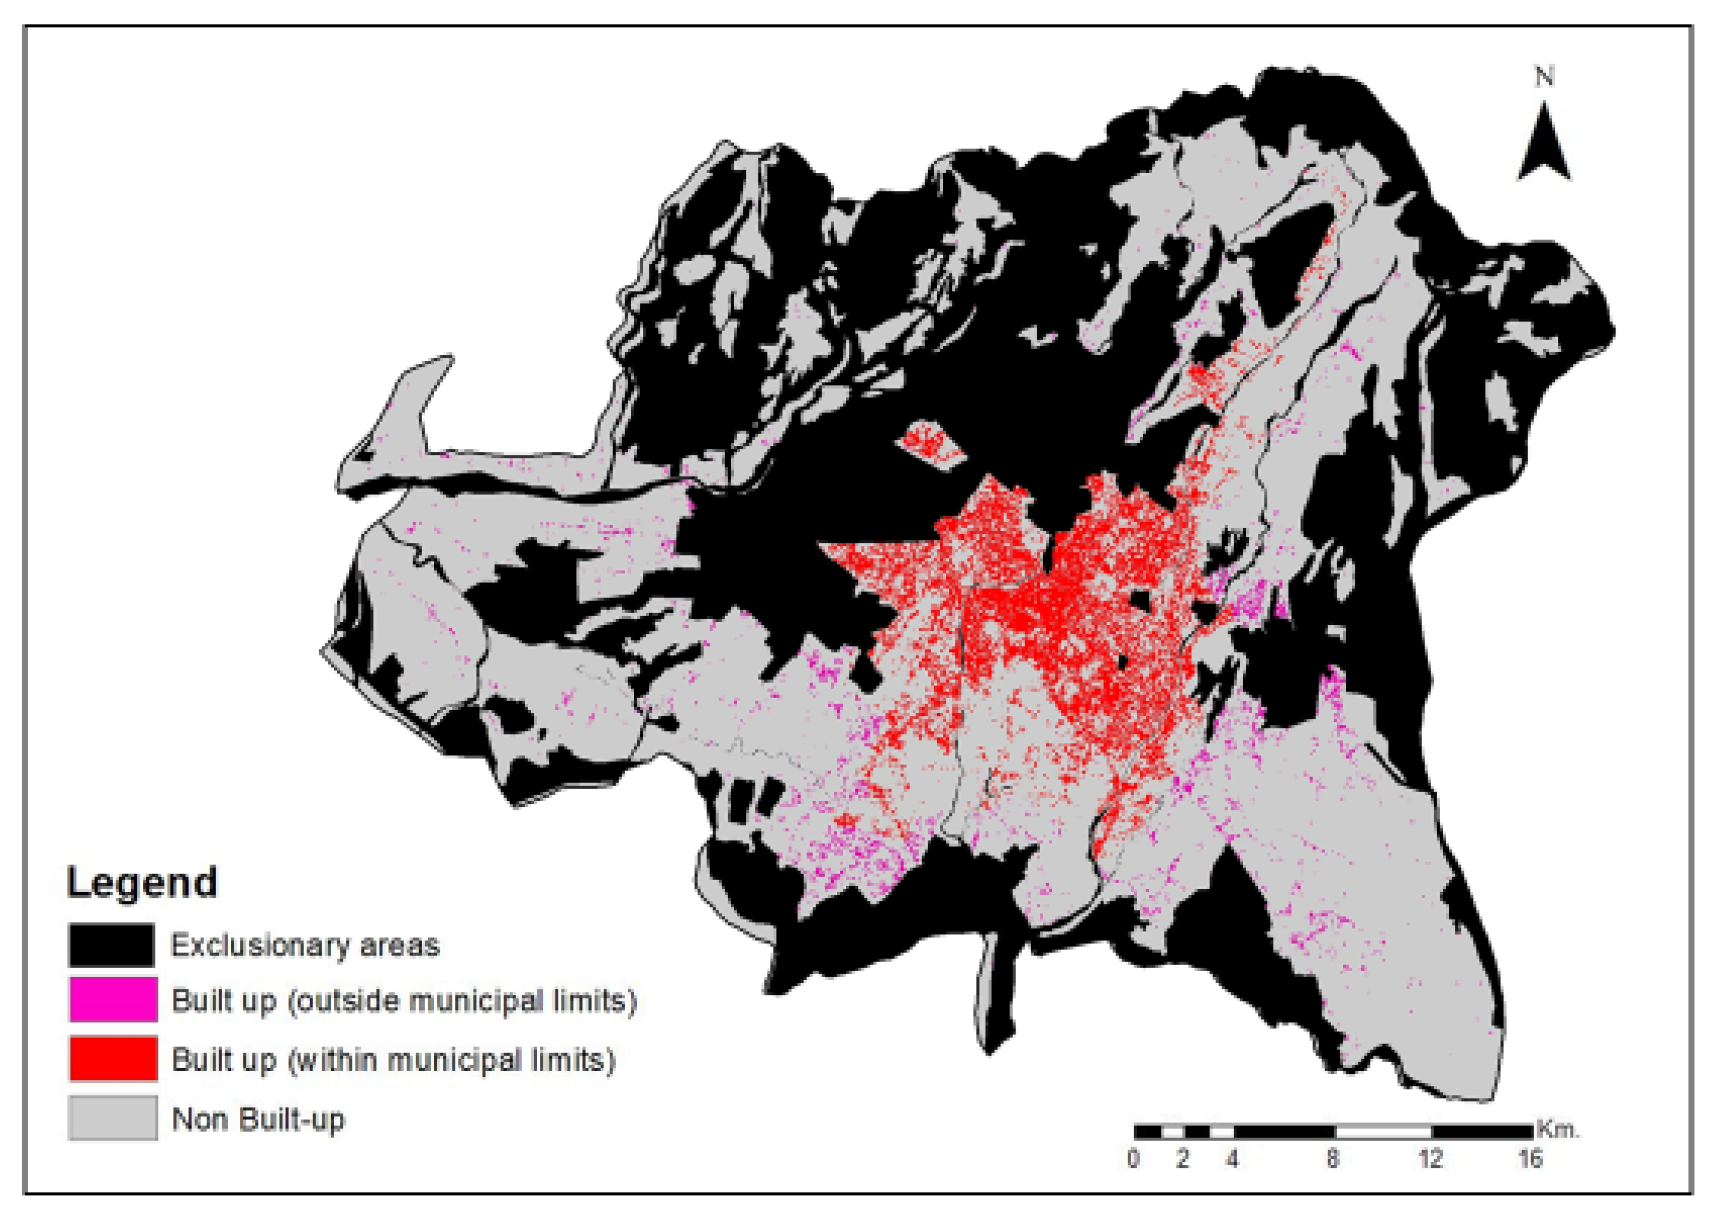
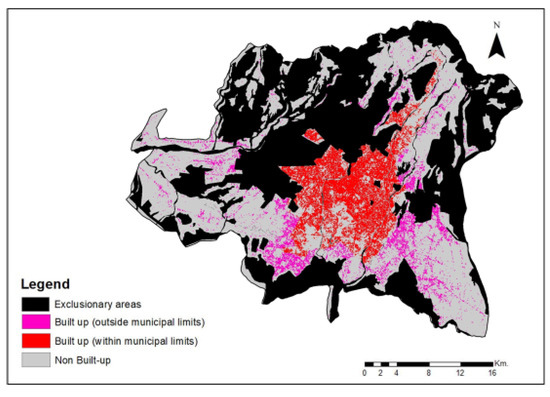
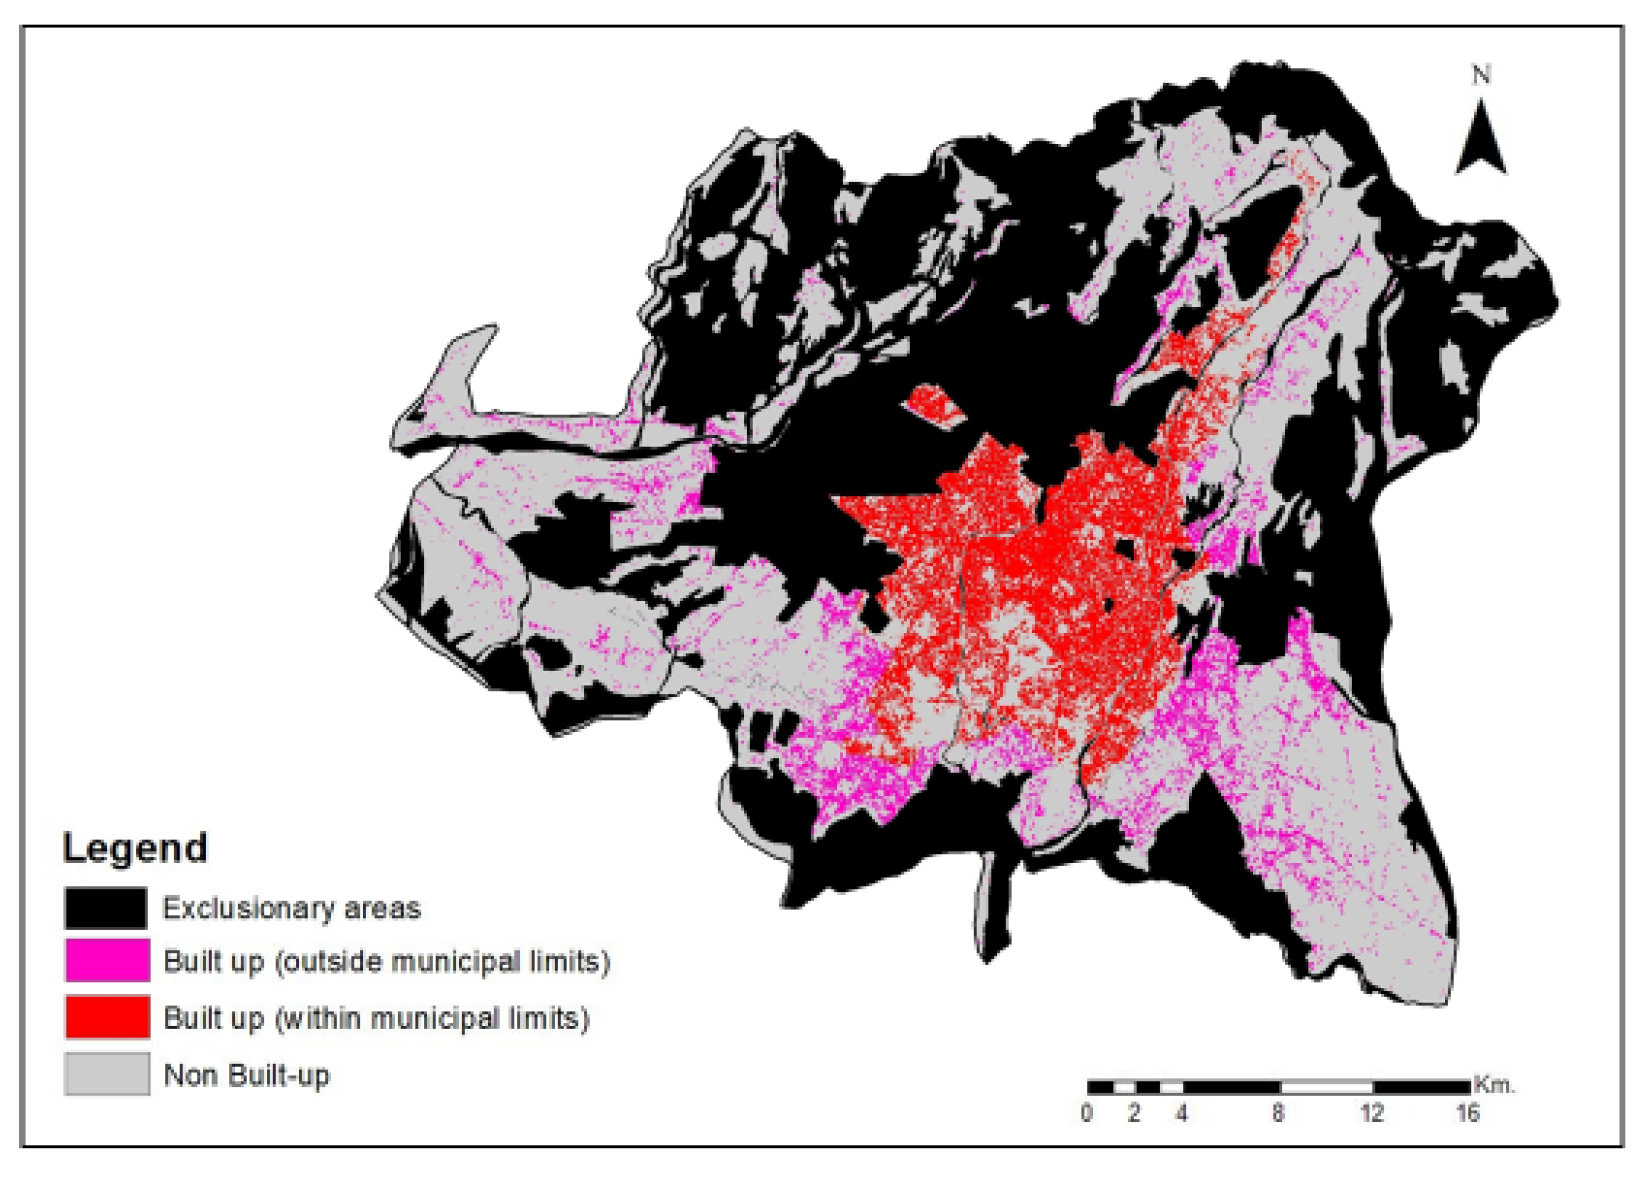
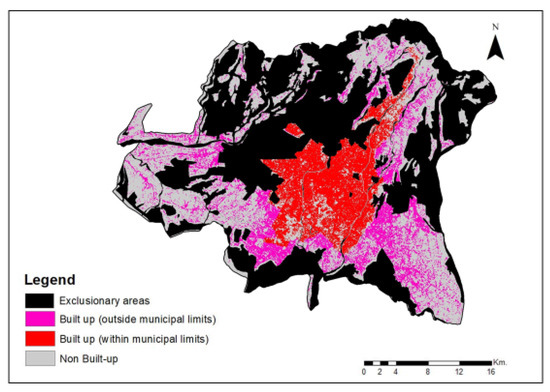
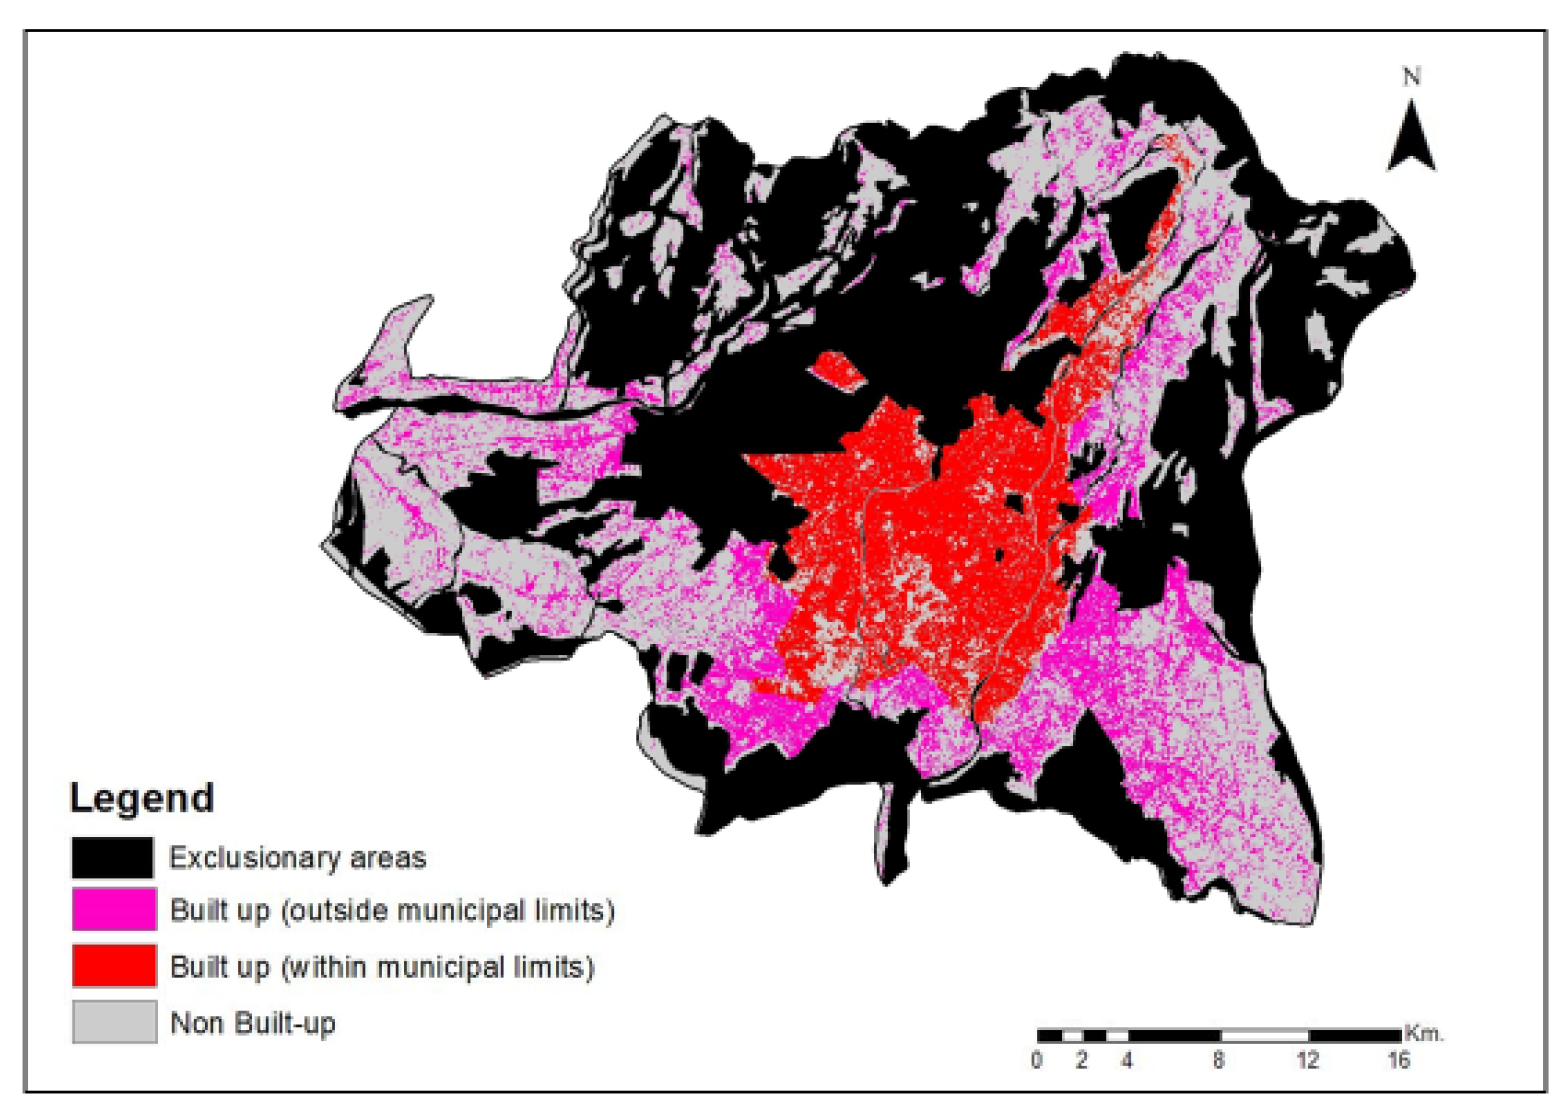
A false color composite (FCC) of the study area was generated from red, green and near-infrared bands of the image. Different tones of red denote natural and semi-natural vegetation. The cyan color with rough texture signifies a built-up area. The dark blue to cyan tone with a smooth texture represents dry river beds. The fallow land has a greenish-grey tone with a smooth texture. The bright white tone with no vegetation denotes bare soil. The land cover maps have been produced from the classification of Landsat images of the years 2000, 2010 and 2019 using the maximum likelihood classifier (MLC), which is a parametric supervised classification algorithm. The land cover is classified into six classes: i.e., built-up outside municipal limits, built-up within municipal limits, cultivated and managed areas, natural and semi natural vegetation and river course (Figure 3, Figure 4 and Figure 5).
Figure 3.
Land cover (2000) of the study area.
Figure 4.
Land cover (2010) of the study area.
Figure 5.
Land cover (2019) of the study area.
1.5. Analysis of Urban Growth
In this study, the main focus is on the built-up classes (both built-up within municipal limits and built-up outside municipal limits). Urban growth has been quantified in terms of the increase in the built-up area over a period of time. Therefore, land cover maps representing the different classes for the years 2000, 2010 and 2019 have been prepared for monitoring urban growth. The growth analysis for the two time periods 2000–2010 and 2010–2019 has been carried out in the GIS environment using overlay operation.
1.6. Generation of Road Network Map
The road network has been derived from a Landsat image from the year 2019, Google Earth and the guide map. The road network map shows that the network is radial in nature, with the roads radiating outwards from the city center. The radiating roads are interconnected to each other by a network of roads.
1.7. Delineation of City Center
The city center has been defined as the part of the city where most business activities are located. In the study area, the city core has been identified after consultation with the local planning authorities. The city center consists mainly of the area near clock tower and General Post Office (GPO), which have formed the nucleus around which the city has grown.
1.8. Calculation of Relative Entropy:
Shannon’s entropy (SE) is defined as a measure of the degree of randomness or spatial concentration or dispersion of a geographical variable (urban growth) (xi) among n zones [1]. It is calculated using Equation (1):
where pi is the probability of a phenomenon (variable) occurring in the ith zone. The range of entropy values is from zero to a maximum of log(n). However, to compare the entropy values, the SE is normalized between 0 and 1 and is called the Relative Entropy (Equation (2)).
RE = SE/log(n)
1.9. Relative Entropy with Respect to Roads
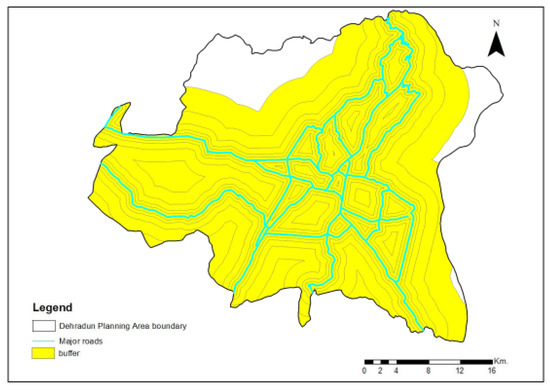
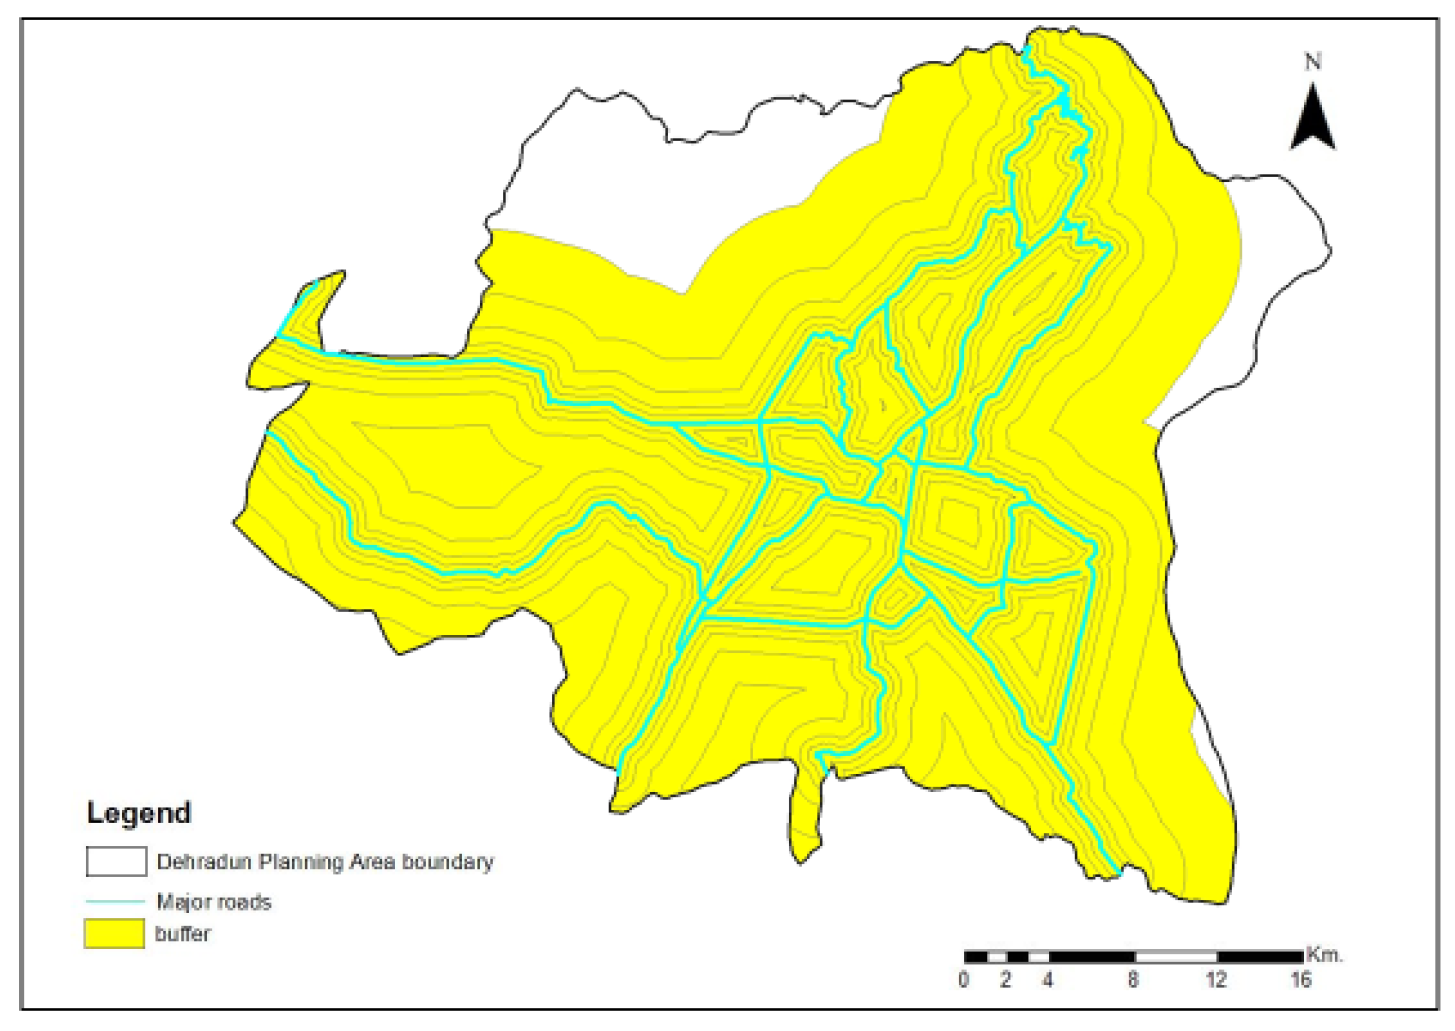
Firstly, buffer zones of 200 m, 400 m, 800 m, 1600 m and 3200 m with respect to the major roads were taken in the Dehradun Planning Area. The Relative Entropy with respect to roads was calculated for the built-up area growth for 2000–2010 and 2010–2019 for the Dehradun municipal area and outside the municipal area (Figure 6).
Figure 6.
Buffer zones along roads.
1.10. Relative Entropy with Respect to the City Center
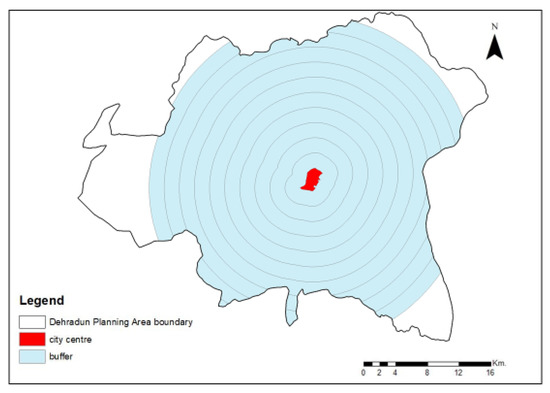
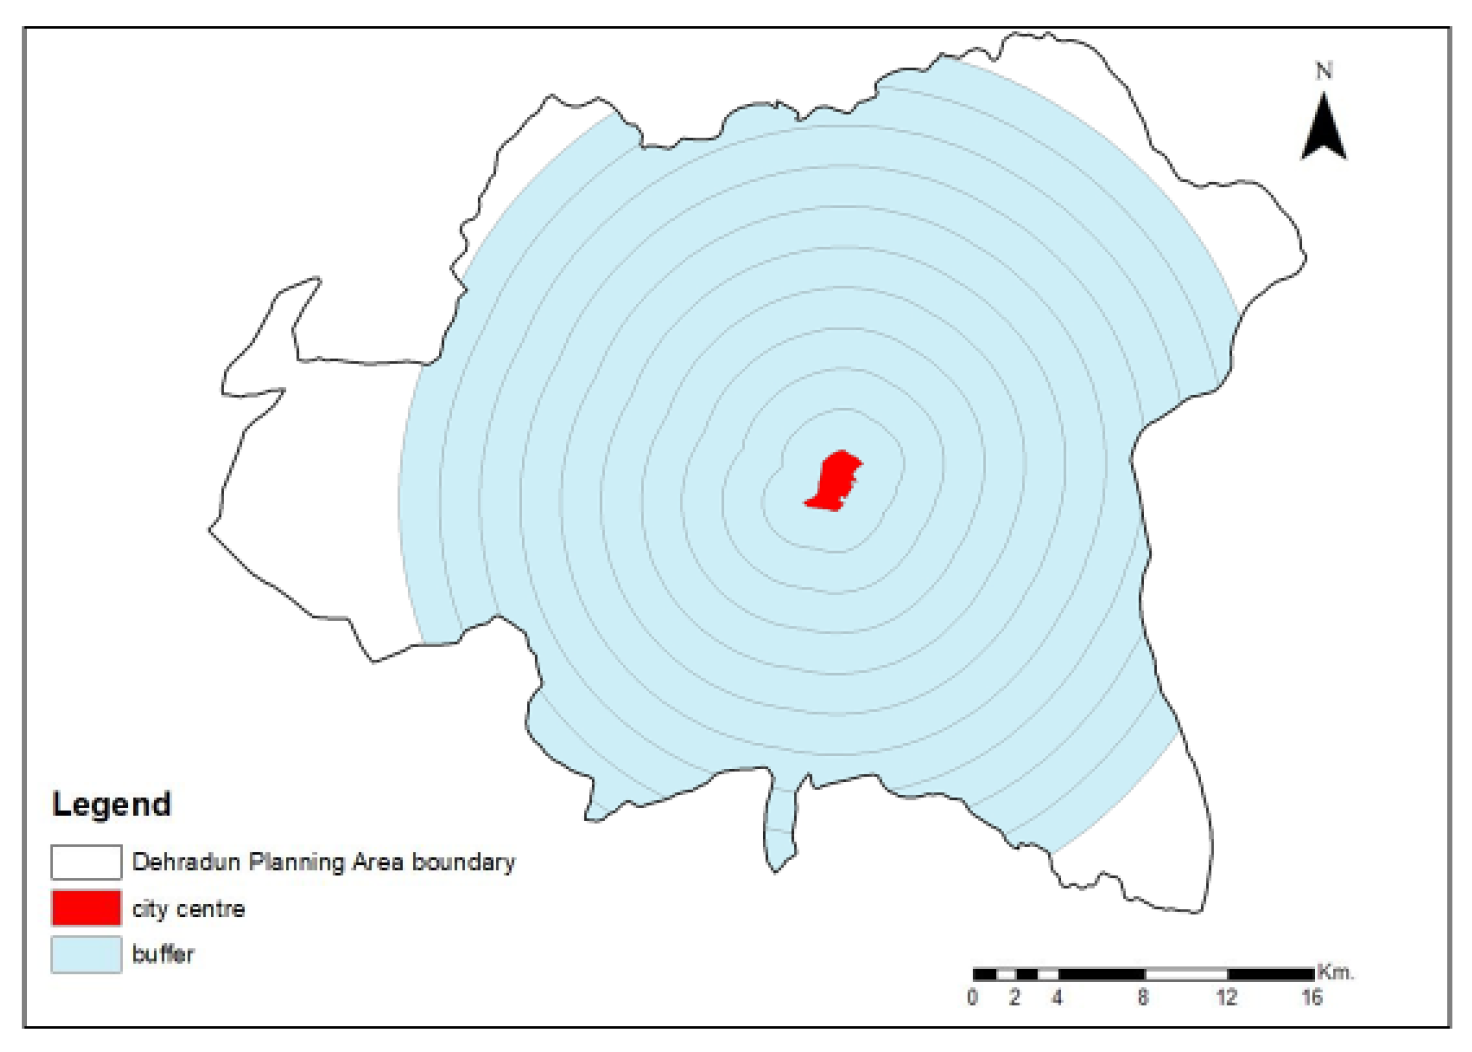
Buffer zones of 1000 m, 2000 m, 3000 m, 4000 m, 5000 m, 6000 m, 7000 m, 8000 m, 9000 m and 10,000 m with respect to the city center were taken in the Dehradun Planning Area. Relative Entropy was calculated for the built-up area growth for 2000–2010 and 2010–2019 for the Dehradun municipal area and outside the municipal area (Figure 7).
Figure 7.
Buffer zones in the city center.
2. Results and Discussion
Maps depicting the land cover for year 2000 (Figure 3), 2010 (Figure 4), and 2019 (Figure 5) were generated. Buffer zones were also developed for analysis around the roads (Figure 6) and city center (Figure 7). The Relative Entropy (RE) calculated with respect to the road network and city center is shown in Table 1 and Table 2. A set of calculations for SE and RE is shown in Equations (3) and (4).
Table 1.
Calculation of Relative Entropy (RE) with regard to the road network within municipal limits during 2000–2010.
Table 2.
Relative entropy (RE) value for different time periods with regard to the road and city core.
Similarly, SE and RE were calculated for the datasets (Table 2).
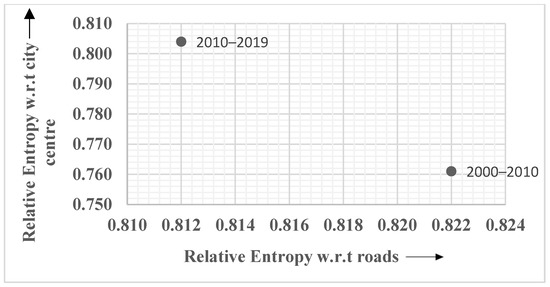
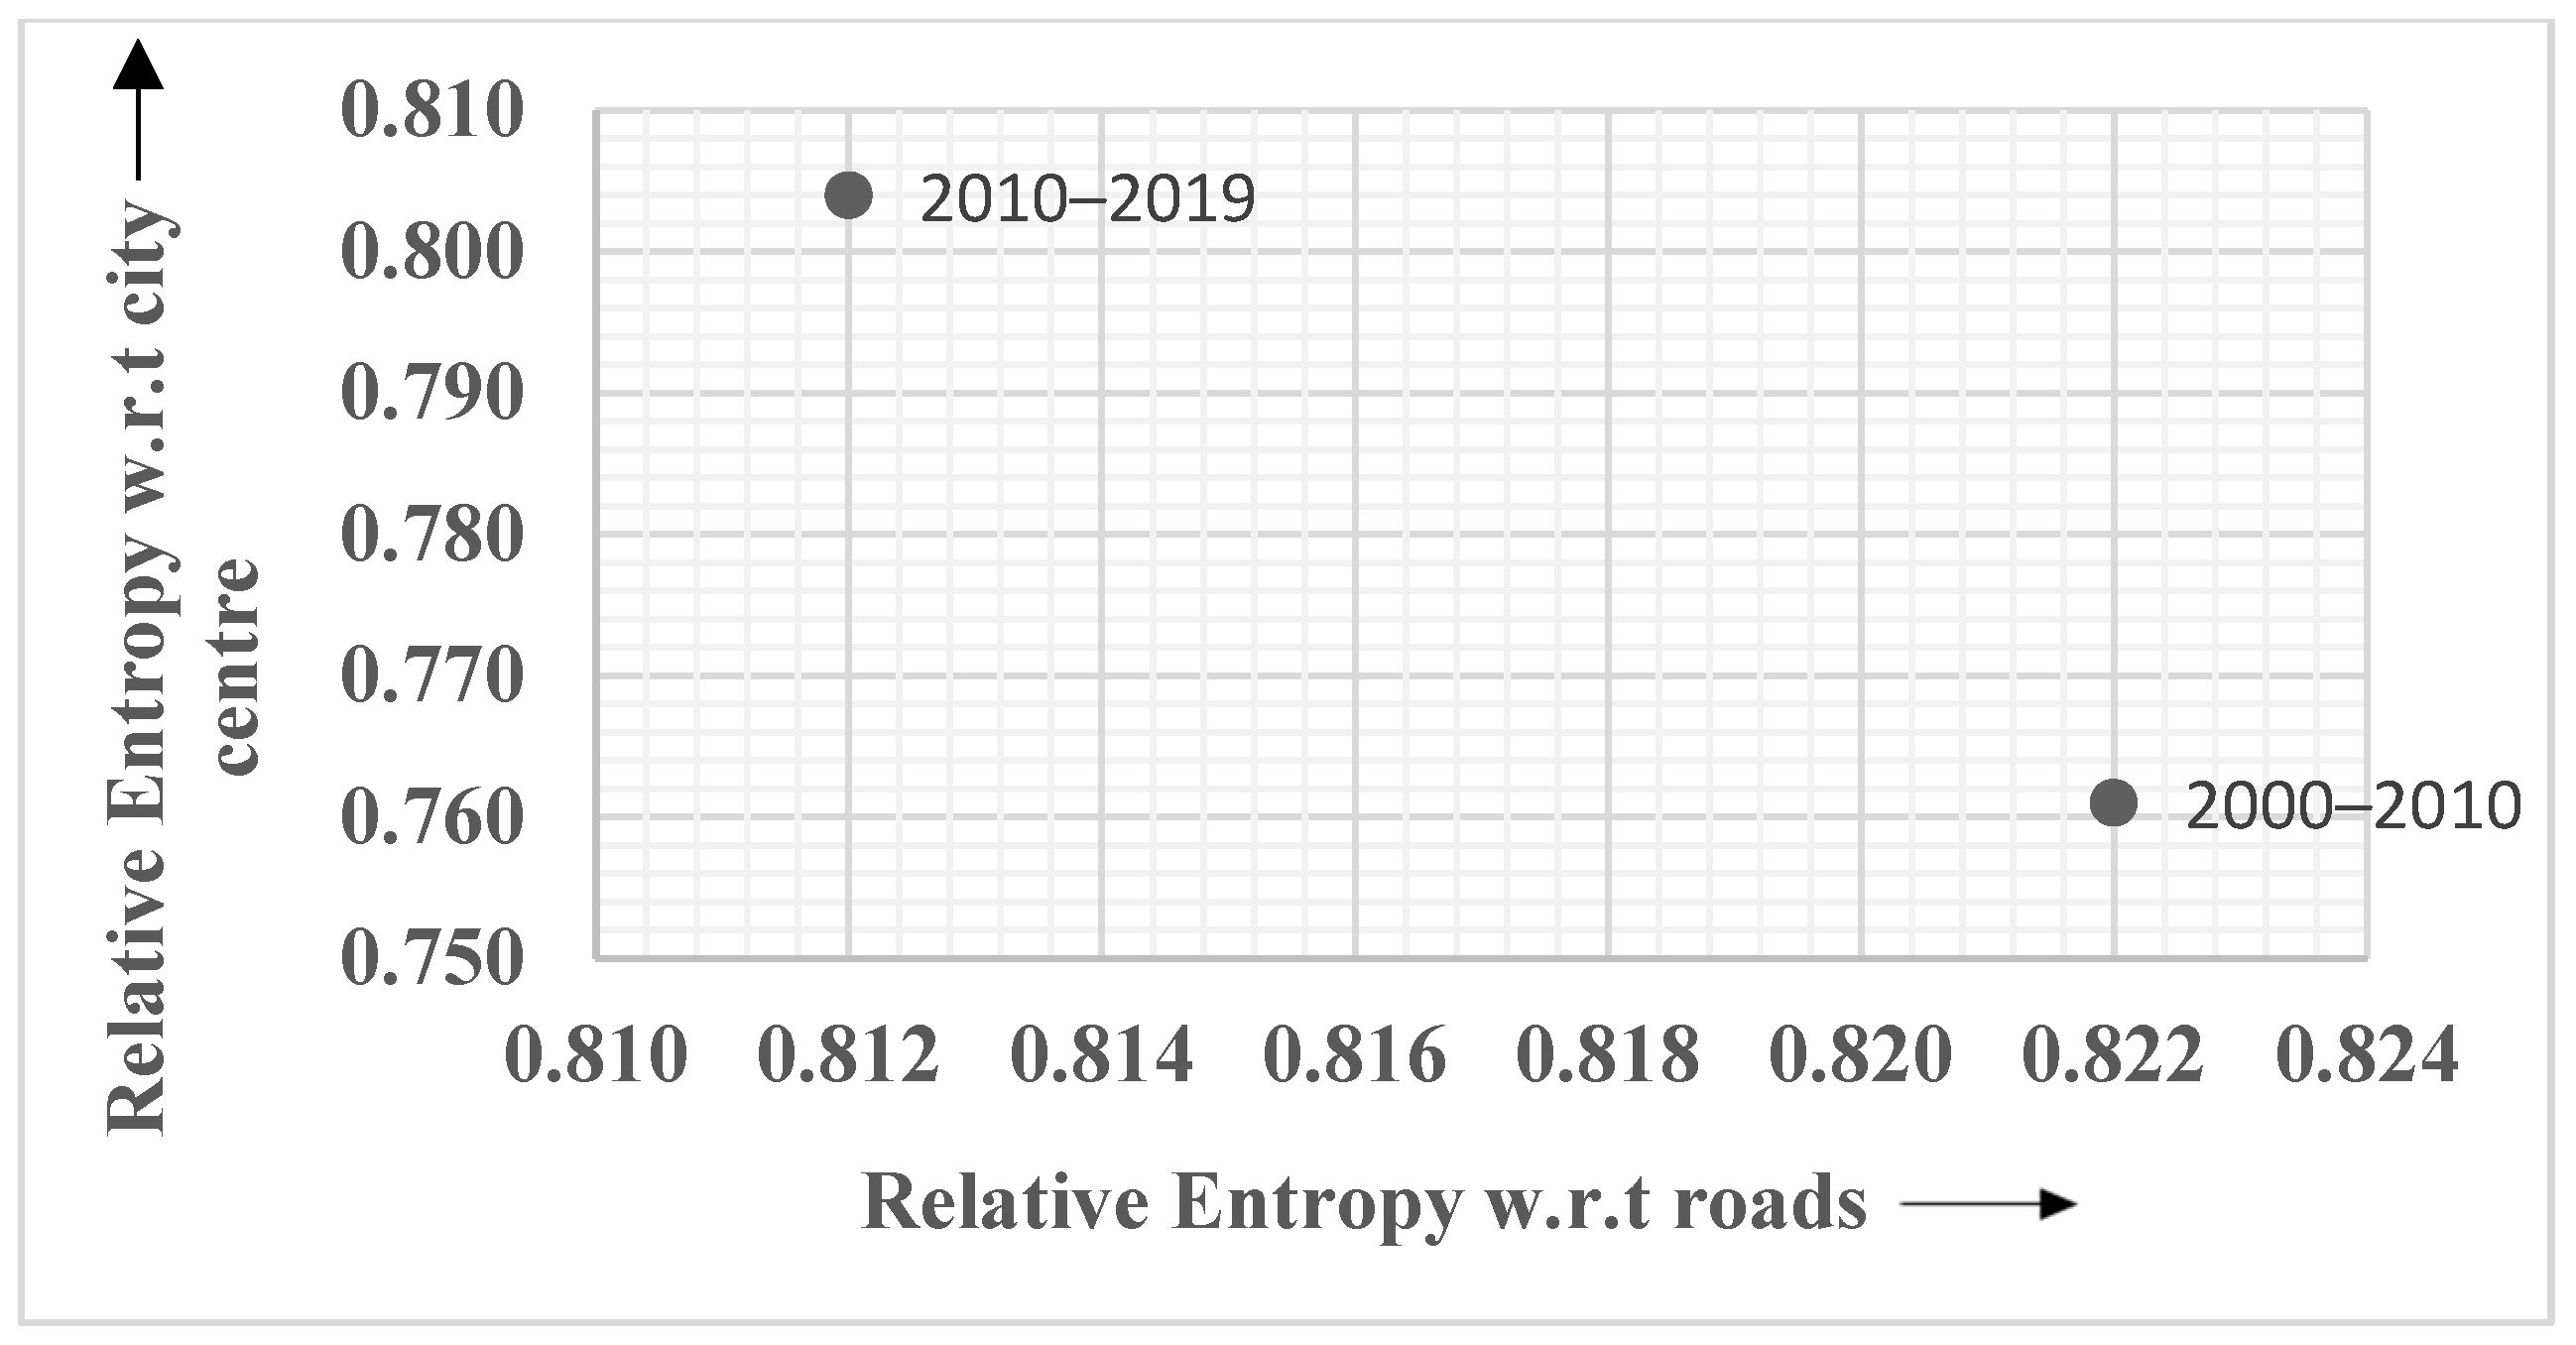
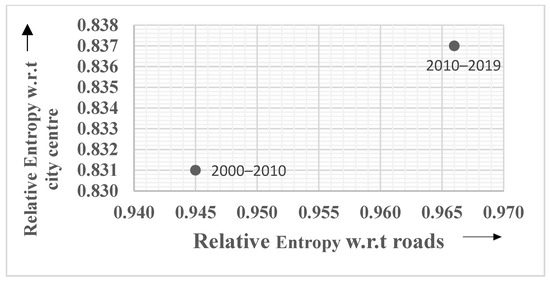
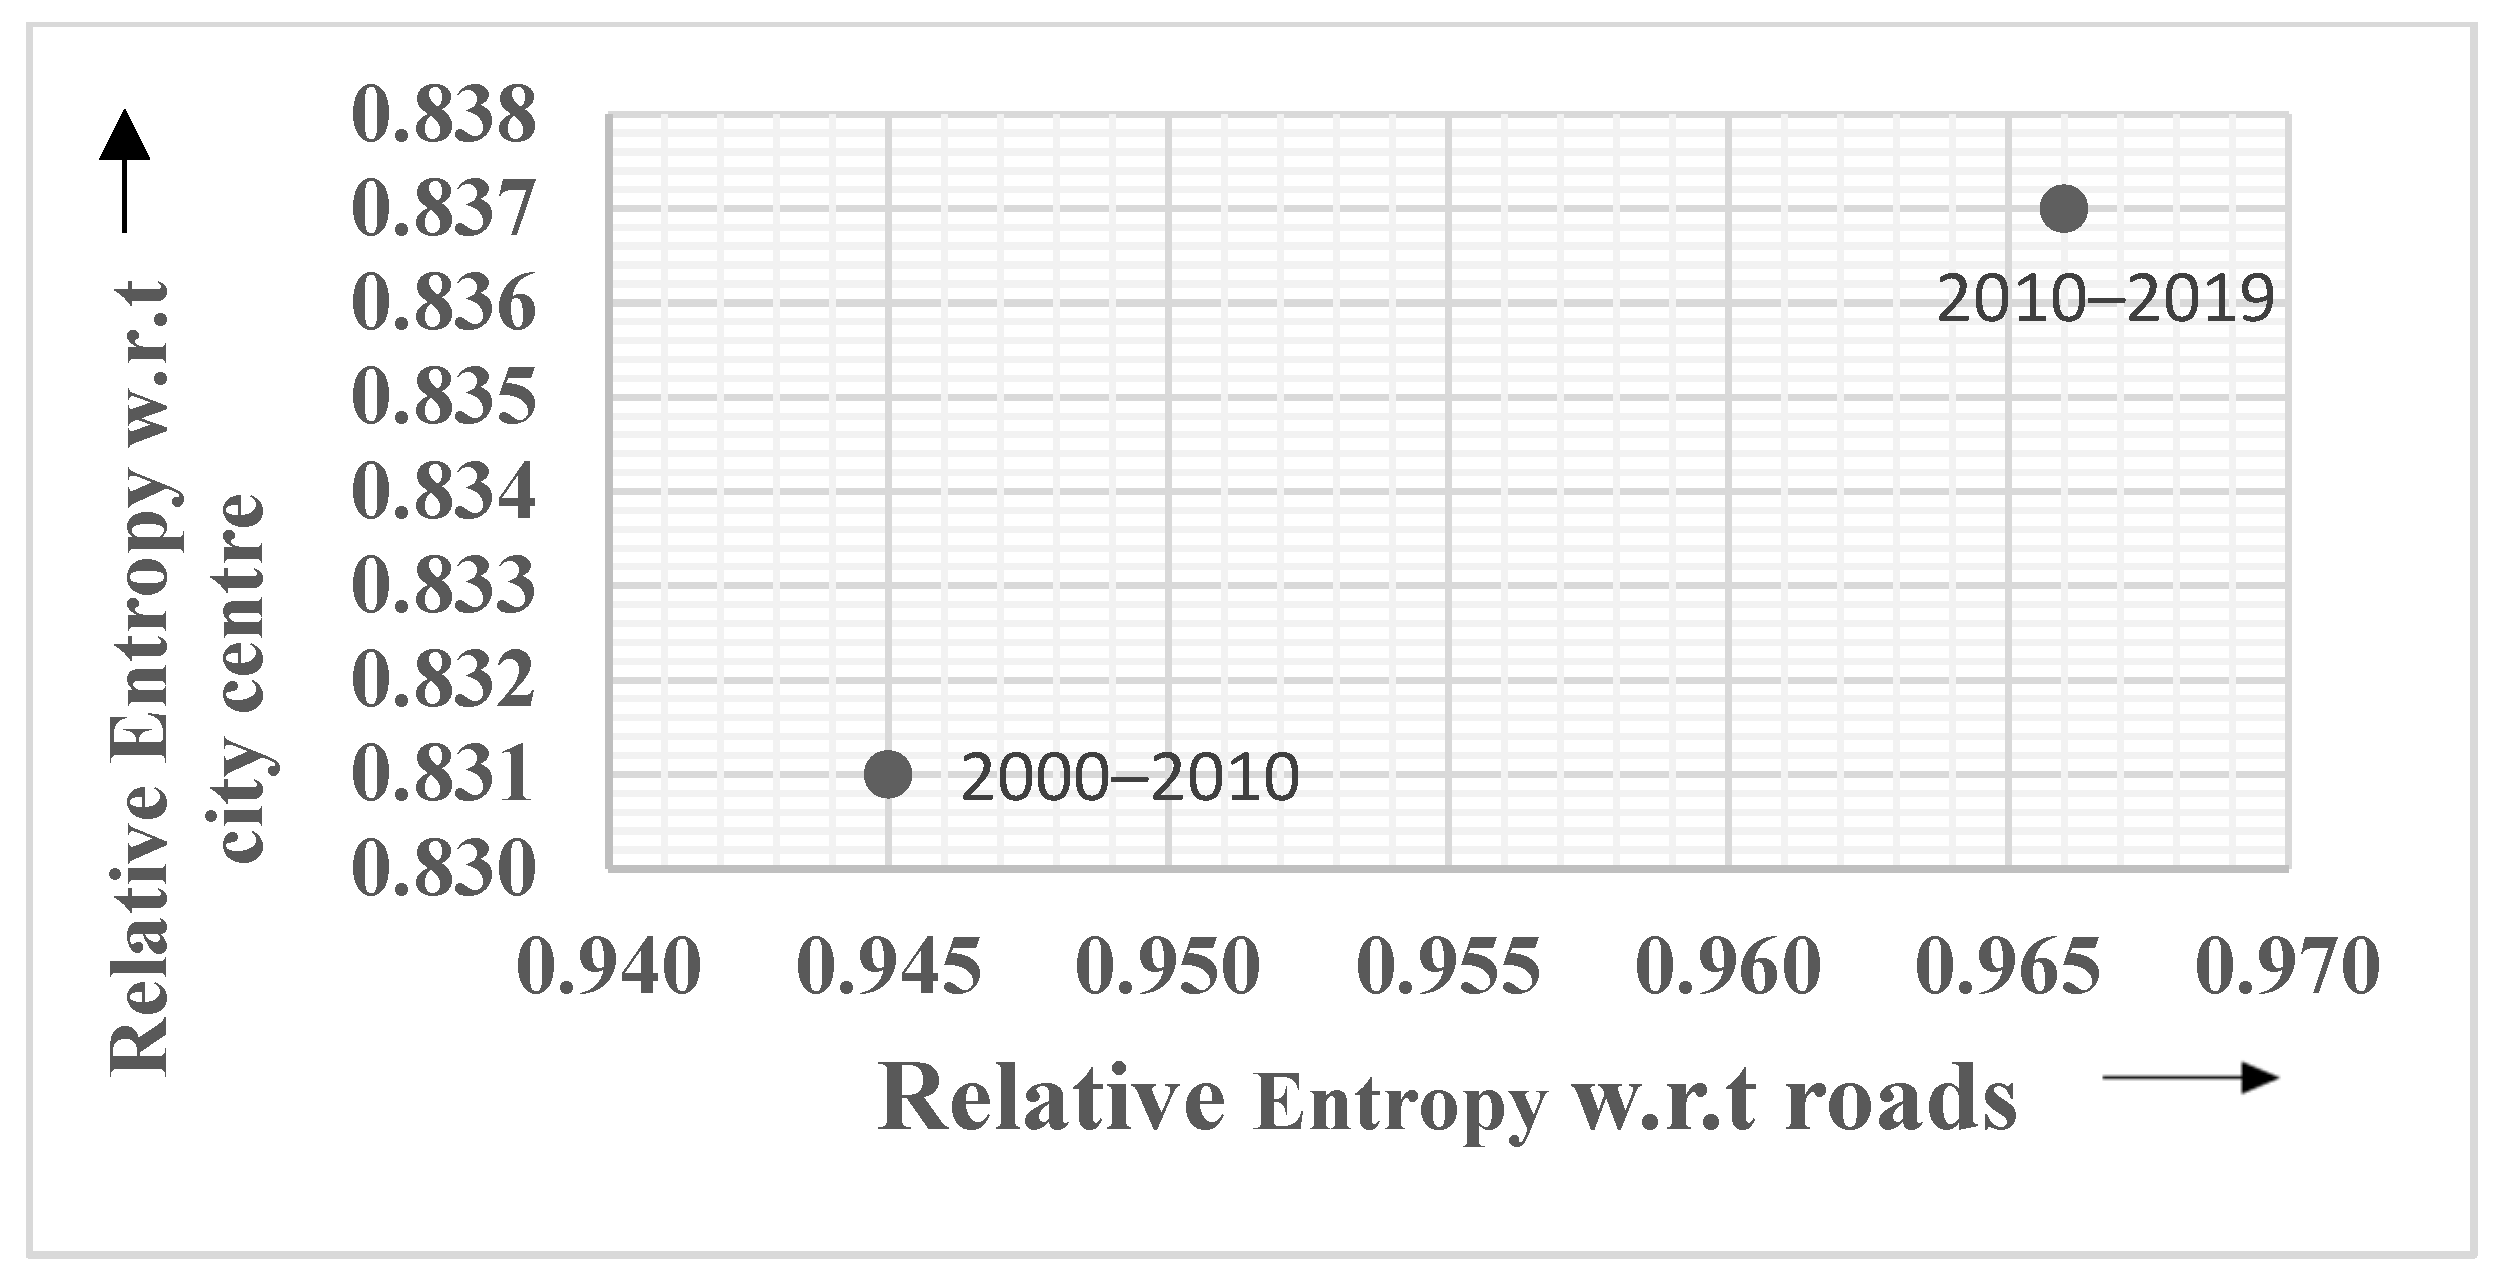
In the municipal area of Dehradun during the 2000–2010 and 2010–2019 periods, the RE with regard to the roads was 0.822 and 0.812 respectively. Outside the municipal area of Dehradun during 2000–2010 and 2010–2019, the RE with regard to the roads was 0.945 and 0.966, respectively. The inverse relationship between developments inside the municipal rea and outside the municipal area is clearly depicted from Figure 8 and Figure 9 (the entropy values are represented by blue dots). It can be observed that the RE with regard to the roads over a period of time in the municipal area remained constant, but outside the municipal area, it increased. It can also be inferred that along the roads and outside municipal area, there was a more uniform distribution of built-up areas. In the municipal area of Dehradun during 2000–2010 and 2010–2019 periods, the RE with regard to the city center was 0.761 and 0.804, respectively (Figure 8). Outside the municipal area of Dehradun during 2000–2010 and 2010–2019 periods, the RE with regard to the city center were 0.831 and 0.837, respectively (Figure 9). It can be observed that the RE with regard to the city center in the municipal area over a period of time increased, which led to a more dispersed distribution of the built-up areas with regard to the city center. The distribution of built-up areas is more compact with regard to the city center as compared to the distribution with regard to the road network.
Figure 8.
RE with regard to the roads and city core during 2000–2010 and 2010–2019 within municipal limits.
Figure 9.
RE with regard to the roads and city core during 2000–2010 and 2010–2019 outside municipal limits.
3. Conclusions
The study reveals that RE can help in quantifying and analyzing the urban growth patterns with regard to the road network, city center and other factors which influence the urban growth process. Higher values of RE indicate higher levels of urban sprawl, whereas lower values indicate compactness. The RE can also help in validating the urban growth simulation results by comparing the simulated growth with the actual growth patterns.
Author Contributions
Conceptualization, S.M., A.S., A.B. and G.N.; Methodology, S.M., A.S., A.B. and G.N.; Software and Analysis, S.M., A.S. and G.N.; Validation, S.M., A.S., A.B. and G.N.; Writing—Original Draft Preparation, G.N.; Writing—Review & Editing, S.M., A.S. and A.B.; Supervision, S.M. A.S. and A.B. All authors have read and agreed to the published version of the manuscript.
Funding
This research received no external funding.
Acknowledgments
The authors would like to send words of appreciation to NASA for their insights and support through data sharing platforms, which was highly valuable in the presented study. The first author acknowledges the Department of Science and Technology for the INSPIRE Fellowship.
Conflicts of Interest
The authors declare no conflict of interest.
References
- Yeh, A.G.O.; Li, X. Measurement and monitoring of urban sprawl in a rapidly growing region using entropy. Photogramm. Eng. Remote Sens. 2001, 67, 83–90. [Google Scholar]
- Li, X.; Yeh, A.G.O. Modelling sustainable urban development by the integration of constrained cellular automata and GIS. Int. J. Geogr. Inf. Sci. 2000, 14, 131–152. [Google Scholar] [CrossRef] [Scilit]
- Li, X.; Yeh, A.G.O. Analyzing spatial restructuring of land use patterns in a fast growing region using remote sensing and GIS. Landsc. Urban Plan. 2004, 69, 335–354. [Google Scholar] [CrossRef] [Scilit]
- Cabral, P.; Augusto, G.; Tewolde, M.; Araya, Y. Entropy in Urban Systems. Entropy 2013, 15, 5223–5236. [Google Scholar] [CrossRef] [Scilit]
- Sudhira, H.S.; Ramachandra, T.V.; Jagadish, K.S. Urban sprawl: Metrics, dynamics and modelling using GIS. Int. J. Appl. Earth Obs. Geoinform. 2004, 5, 29–39. [Google Scholar] [CrossRef] [Scilit]
- Punia, M.; Singh, L. Entropy Approach for Assessment of Urban Growth: A Case Study of Jaipur, India. J. Indian Soc. Remote Sens. 2012, 40, 231–244. [Google Scholar] [CrossRef] [Scilit]
- Joshi, P.K.; Lele, N.; Agarwal, S.P. Entropy as an indicator of fragmented landscape. Curr. Sci. 2006, 91, 276–278. [Google Scholar]
- Maithani, S. Cellular Automata Based Model of Urban Spatial Growth. J. Indian Soc. Remote Sens. 2010, 38, 604–610. [Google Scholar] [CrossRef] [Scilit]
- Sarvestani, M.S.; Ibrahim, A.L.; Kanaroglou, P. Three decades of urban growth in the city of Shiraz, Iran: A remote sensing and geographic information systems application. Cities 2011, 28, 320–329. [Google Scholar] [CrossRef] [Scilit]

Publisher’s Note: MDPI stays neutral with regard to jurisdictional claims in published maps and institutional affiliations. |
© 2019 by the authors. Licensee MDPI, Basel, Switzerland. This article is an open access article distributed under the terms and conditions of the Creative Commons Attribution (CC BY) license (https://creativecommons.org/licenses/by/4.0/).