


Abstract
Nickel (Ni) and copper (Cu) are essential soil micronutrients that are beneficial for plant growth and development when applied at the right levels to deficient soils. However, they can also be of concern if excessive application leads to accumulation in soil, causing soil fertility problems that can compromise food production as well as result in human exposure to these metals if they enter the food chain. The application of Ni and Cu salts can strongly influence the nitrogen (N) cycle as they can stimulate soil microbiological activity that leads to N losses to the atmosphere. A laboratory incubation was conducted to study the effect of these metal salts on gaseous N emissions. Copper sulphate (CuSO4) and nickel sulphate (NiSO4) were applied at rates below soil toxicity (3.0 kg Ni/ha and 7.5 kg Cu/ha), together with 15N-labelled-urea (rate 100 kg N/ha) and under two soil water-filled pore space (WFPS) conditions: continuous anaerobic (75% WFPS) versus aerobic (50% WFPS) followed by an anaerobic (75% WFPS) cycle. Results showed no significant effect of the Ni application on nitric oxide (NO) emissions at the low rates applied. However, there was an indication of a meaningful (p = 0.051) production of this gas under aerobic soil conditions. No N2 emissions were observed from any treatment (only expected to occur under anaerobic conditions) during the 43 days of the incubation, which could suggest that, as for Ni, the selected Cu application rate may not clearly stimulate the complete denitrification process to produce N2. It is possible that the expected increase in N2 emissions or larger NO emissions were counteracted by the low amount of soil-extractable Cu and Ni available after application because of binding processes with the clay fraction (48% clay) and the acid nature of the Cambisol used in the incubation. Further research into the effect of metal applications to contrasting soil types, with varied application rates and repeated application events, and under differing soil moisture conditions on N emissions is required. Furthermore, experiments should also be conducted at finer scales to elucidate the specific effect of these metal application rates on the biochemical processes responsible for the N gases produced.
1. Introduction
Nitrogen (N) losses from agricultural soils in the form of leaching and in the form of gaseous emissions are an environmental concern. Losses to the atmosphere mainly occur via gaseous emissions of ammonia (NH3), nitric oxide (NO), nitrous oxide (N2O) and nitrogen (N2). Plants need N in its inorganic form for uptake as do the microorganisms in the soil involved in the processes that release these N gases. One important process in the N cycle that contributes to the pool of inorganic N is mineralisation, where organic biomass is transformed into soluble forms (inorganic) by microbes and soil organisms as their source of carbon (C) and N. Mineral forms of N are released into the soil once these organisms meet their needs, and these excess inorganic forms are available for further use by plant or can be lost to the environment. However, if microbial demand for N is high and/or N sources are not enough, microbes retain or immobilise N in their biomass [1]. Applications of organic and mineral fertilisers to agricultural soils are often conducted by farmers to provide plants with the required amount of N for development and growth. However, these activities can also lead to great losses of N to the environment, causing not just serious environmental problems but also an economic loss for farmers. Losses via NH3 mainly occur through volatilisation of urea contained in animal faeces and fertilisers like straight urea, while NO, as well as N2O, are mainly produced during nitrification and denitrification processes of the soil N cycle [2]. When using chemical fertilisers containing urea CO(NH2)2 salts, the added urea is hydrolysed into ammonia (NH3) with the help of urease. In an acidic environment, NH3 is dissolved and converted into NH4+, which is available to plants and subjected to further nitrification in aerobic conditions by soil nitrifiers, including nitrifying bacteria, fungi and archaea [1]. NH3 is oxidised into hydroxylamine (NH2OH), and this further oxidised to nitrite (NO2−), forming NO as an intermediary compound. This gas can also be produced (under low O2 levels), together with N2O, during the dissimilatory reduction of NO2−, nitrate (NO3−) or both [3]. This gas has a negative impact on the environment, as it is a highly reactive gas reacting with volatile organic compounds and sunlight, increasing ground level ozone, while acting as a catalyst in the stratosphere and breaking down the ozone layer [4]. It also contributes to acid rain when it oxidises in the air to form NO2, which then reacts with water vapour to form nitric acid [5]. It has been estimated that soils contribute annually 3.3 to 21 Tg N ha−1 to NO emissions [6,7], which highlights the importance of mitigating these emissions to achieve better soil N management and reduce environmental emissions.
Nitrous oxide is one of the most important greenhouse gases, with a global warming potential 265 times that of carbon dioxide (CO2) [8] and is known to be responsible for approximately 60% of the total global anthropogenic N (~6 Tg N2O-N) [9]. With the increasing use of N fertilisers to support increases in food production [10], it is estimated that the emissions of N2O from agricultural lands will also increase [11,12]. Nitrous oxide is a subproduct of nitrification but it is also produced by denitrification when NO3− is used by denitrifiers as a terminal electron acceptor instead of O2 for respiration when O2 is unavailable [1]. This process produces N2, as well as N2O and NO, which is the ultimate end of the denitrification process and, despite not being of environmental concern, it represents an economic loss of the N applied to increase yields.
When looking at the biogeochemical processes that cause NO, N2O and N2 emissions, there are many factors that influence and lead to these atmospheric losses of N and soil water content is one of them [13]. The amount of soil water determines the degree of aerobicity and anaerobicity of the soil environment by changing oxygen (O2) availability for plant roots and microorganisms. These changes have a direct impact on soil microbiology, making soil N biochemical processes highly dynamic and changeable within the soil environment [14,15]. When soil moisture conditions are high, the proportion of soil pores filled with air decrease as they get replaced with water, reducing O2 diffusivity within the soil [16]. It can also make C and N more available after cycles of soil rewetting after periods of drought. By filling the soil pores and preventing O2 supply, high moisture content provides suitable conditions for denitrification. Many studies have shown a significant relationship between the water-filled pore space (WFPS) and microbial pathways that produce N gases. It is generally considered [17,18,19] that nitrification is more important than denitrification when WFPS < 60% (more NO than N2O is produced), denitrification dominates when WFPS > 60% (more N2O production over NO) and N2 is mainly produced under total anaerobic soil conditions [18,19]. However, these ranges may vary depending on the type of soil.
Many microbial enzymes involved in the reactions that produce these gases are also dependent on metal cofactors. For example, urease uses a redox-active nickel (Ni) cofactor for the hydrolysis of urea into NH3 [20,21,22] or nitrous oxide reductase uses copper (Cu) as a redox-active cofactor for the catalysis of the final step of bacterial denitrification to convert N2O into N2 and water [3,23]. Thus, the abundance and availability of these metals in the soil is also a key factor as they can influence the soil N cycle and exert control on the resulting N emissions [24]. Metal applications in excess have been reported to have a positive influence on microbial populations and therefore affect processes in the N cycle; for example, they can affect the population of denitrifiers, leading to decreases in N2O emissions [25]. This could be seen as a positive result, but the application of these metals to soils does not only play an essential part in the microbial N cycle. It is also essential to plants, and if metal applications exceed plant requirements, they can accumulate in the soil or even cause toxicity and the inhibition of ecosystem processes. Approximately 20% of Cu in soil is in a soluble form and, therefore, available for plant use, which can cause Cu deficiency in many agricultural soils worldwide [26]. Animal manures, sewage sludge and biosolids usually contain high concentrations of Cu, which can supply crop Cu requirements (2–20 ppm) for cellular metabolic processes. However, at elevated levels, Cu becomes toxic to plants (>20 ppm, leaf analysis), which is of concern when applying those wastes to soil, with excess Cu inhibiting plant photosynthesis, reducing plant productivity and potentially posing a risk to humans due to accumulation in the food chain [26]. Copper sulphate (CuSO4) is the most common inorganic source of fertiliser, with Cu rates of 1–22 kg/ha needed to correct a soil deficiency [27]. In contrast to Cu, a deficit of Ni in soils is uncommon as plant requirements of this metal are very low (0.1–1.0 ppm), but soil toxicity is common when biosolids, usually with very high concentrations of Ni, are applied as an amendment.
The UK Government’s recommended rates are intended to reduce heavy metal inputs to minimise their accumulation in agricultural soils and reduce the risk of these metals entering the food chain and affecting human health. However, the specific effect of those metal rates on the N cycle, particularly on N gaseous emissions, has not yet been assessed by the UK Government. In this study, we investigated the impact on N emissions of those two heavy metals (Ni and Cu), when applied to soil cores together with urea under two soil water conditions (continuous anaerobic versus aerobic–anaerobic cycle). Application rates were kept below soil and plant toxicity levels, following the UK Government’s permissible application rates for these metals [28]. Using isotope tracing, this study also analyses the transformation of the applied urea-N into soil 15NH4 and soil 15NO3 and evaluates the ratio of N2O derived from 15N-urea. Anaerobic conditions were maintained by keeping the soil moisture content at 75% WFPS, which was the highest moisture that the soil could hold without collapsing and leaching and at which N2O reduction to N2 is mainly produced from denitrification and heterotrophic nitrification [29]. Aerobic conditions were achieved by maintaining soil moisture at 50% WFPS.
2. Materials and Methods
2.1. Experimental Design
The current study was carried out at Rothamsted Research (North Wyke, UK). The experiment included four treatments and three replicates for each treatment. The four treatments are shown in Table 1. In the treatment of T1 and T3, Ni was added as nickel sulphate (NiSO4) at a rate of 3.0 kg Ni ha−1. In the T2 treatment, Cu was applied as copper sulphate (CuSO4) at a rate of 7.5 kg Cu ha−1. The quantity of the amendment was based on the highest annual permissible application rates permitted by the UK government [28,30]. Urea was added to all the treatments with 15N-labelled at an enrichment level of 28.706 atom% and an application rate of 100 kg N ha−1.
Table 1.
Soil moisture conditions and amendments used for the experimental treatments.
The experimental duration was 43 days. During this time, two separate incubations were run simultaneously with the following aims:
- (i)
- One incubation was setup in the automated Denitrification Incubation System (DENIS) [31], which has 12 soil incubation chambers able to contain soil cores of 14.2 cm diameter. These were filled with 3 replicates of each of the 4 treatments. The DENIS is an incubation system where a gas mixture continuously flows in and out of the chambers. Each chamber is selected sequentially every 8 min and the gas stream coming from each chamber is diverted to two gas analysers: a gas chromatograph with a helium ionisation detector (HID) for N2 determination and a chemiluminescence analyser for nitric oxide (NO). The detection limit for N2 was 0.5 ppm and the linearity of the detector was observed between 1 and 1000 ppm N2. The NO analyser shows a linear response between 0.5 ppb and 500 ppm [32]. Gas measurements were conducted every 96 min from each chamber throughout the experimental period. Between samplings, the gas from each chamber flows through an extra sample vial before being vented to the atmosphere. The extra sample vials were exchanged twice a day for later 15N2O analyses. The incubation was carried out inside a temperature-controlled cabinet containing the chambers at 20 °C.
- (ii)
- The second incubation consisted of a parallel set of cores (small cores), where 60 soil cores (diameter = 4.5 cm) were prepared and received the same amendment under the same soil moisture conditions for the 4 treatments. In total, there were five replicate small core sets for destructive sampling to trace the soil N transformation via soil N extractions. All the parallel small soil cores were maintained in a light-shielding controlled-environment cabinet (Versatile Environmental Test Chamber MLR-532H, Panasonic©), where the temperature was maintained at 20 °C and the air moisture at 90%.
2.2. Critical Timings During the Experiment
Prior to the start of the experiment soil cores were placed in the system (labelled as Day −2) and flushed through with a gas He:O2 mixture (80:20) at a flow rate of 30 mL min−1 per vessel to remove N2 from the soil cores. The gas mixture aims to replace the N2 in natural air with He to background N2 levels and allow measurements of N2, an indicator of denitrification. On Day 0, the flow rate was changed to 12 mL min−1 per vessel and re-directed to flow over the surface of the soil core to start measuring baseline emissions. Afterwards, the treatment solutions (urea with or without Cu or Ni) were added to the soil cores. The total volumes of the treatment solutions were 50 mL for the large and 5 mL for the small cores, allowing the soil moisture content to reach 50% WFPS after the addition. To raise the soil moisture content from 50% to 75% WFPS, additions of 260 mL and of 26 mL deionised water (DIW) for the large and small cores, respectively, were carried out on Day 14. The experiment ended on Day 43.
2.3. Soil Preparation, Packing and Soil Moisture Maintenance
The soil used in this study was obtained from a permanent pasture site at Rothamsted Research, North Wyke (50:46:10 N, 3:54:05 W). The soil order in the World Reference Base system was Cambisol. The soil was taken from the top 20 cm from the surface. After sampling, roots and plant residues were removed by sieving the soil through stainless-steel meshes (mesh pore sizes = 8–10 mm). The sieved soil was left at room temperature for 1–2 days and then passed through another stainless-steel mesh (pore size = 2 mm). The soil was packed into cores straight after the final sieving. The basic properties of the soil are shown in Table 2.
Table 2.
Initial soil properties of the soil used for the experiment.
The sieved soil was packed to a bulk density of 0.88 g cm−3, which equates to the bulk density measured in the field’s surface soil. About 140 g and 1393 g (dry weight basis) of the sieved soil were packed to 10 cm height in each of the parallel small cores and DENIS cores, respectively. The soil moisture content was 27.88% (dry basis) at packing. More water was added to the cores to raise the soil moisture contents (in WFPS%) to those stated in Table 1. The pore space (porosity, Vp) of the current soil was calculated following Equation (1).
where Vc is the total volume of each core (cm3) and the DB and Dp the bulk density (g cm−3) and particle density (g cm−3) of the soil, respectively. The particle density of the soil was 2.545 g cm−3. The amount of deionised water to add (mL or g) was calculated following Equation (2).
where the X% stands for the targeted ultimate WFPS%, Vp is the pore space (mL) and the Vsoil is the volume of the moisture that was initially in the soil (mL). The total weights of the parallel cores were checked every three to four days. Additional deionised water was added to the small cores to maintain the targeted soil moisture contents if needed.
2.4. Soil Analyses
Soil samples were taken from the parallel cores for the analysis of extractable N (NH4+ and NO3−), the 15N enrichment in soil extract and soil pH on Days −2, 7, 14, 29 and 43. Mineral N was determined by extracting 100 g of fresh soil with 200 mL of 2M KCl solution. Soil NH4+ and NO3− contents were determined in soil KCl extracts (1:2 soil:2M KCl ratio). Soil moisture was gravimetrically determined after oven-drying subsamples at 105 °C for 24 h. The soil pH measurement followed the method of 1:1 extraction with deionised water. Soil 15NH4+ and 15NO3− were determined using the reaction of alkaline sodium hypobromite (NaOBr) with NH4−-N (for 15NH4+ quantification) and the reaction of NO2− and hydroxylamine (NH2OH) (for 15NO3− quantification), in both cases to form N2O [33]. The N2O produced was transferred to Exetainers (Labco Ltd., Lampeter, Wales) and the enriched N2O (15N2O) was determined with Isotope Ratio Mass Spectrometry (IRMS).
Initial soil total Cu and Ni contents were determined by acid digestion in aqua regia, giving the total amounts of Cu and Ni present in the soil. On experimental Days 7 and 14, the immediately bioavailable and mobile fractions of Cu and Ni were determined by extraction with 1M ammonium nitrate (NH4NO3). Total elements and exchangeable cations were analysed using an Agilent 5900 SVDV Inductively Coupled Plasma—Optical Emission Spectrometer, ICP-OES (Agilent Technologies LDA, Didcot, UK).
2.5. Data Analysis and Statistics
The percentage of the N2O derived from the 15N-labelled urea was calculated based on Equation (3).
where 15N2OS is the atomic ratio of 15N in the N2O gas of the sample (atom%); 15NN: the natural abundance atomic ratio of 15N (=0.3663%); and 15NEn is the enrichment level of 15N in the amended urea (=28.7064%).
The contribution of the 15N-Urea application to the total soil mineral N pool was calculated as follows:
where soil 15N-NH4 and soil 15N-TON are the amounts of soil 15NH4 and 15TON, respectively, both expressed as mg N/kg soil, and total N-NH4 and total N-TON are the concentrations of NH4 and TON in the KCl extracts expressed as mg N/kg soil.
The amount of 15N-NH4 and soil 15N-TON in the soil KCl extracts were calculated as follows:
where 15N-NH4 and 15N-TON are the 15N abundances of 15NH4 and 15TON in the KCl extracts used for the transformation to N2O (atom%); 15NN: the natural abundance atomic ratio of 15N of a KCl extract with no soil (=0.3652%); 15NEn: the enrichment level of 15N-urea amendment applied (=28.7064%) and total N-NH4 and total N-TON are the concentrations of NH4 and TON in the KCl extract, expressed as mg N/kg soil.
For the variables TON (mg kg−1), NH4 (mg kg−1) (NH4+), soil-extractable Cu (ppm) and Ni concentrations (ppm), a two-way analysis of variance (ANOVA) was performed with the structure: Variable ~ Treatment * Day of Measurement. The residuals of the Ni soil concentration ANOVA were not normal as per the histogram, scatter plot and Shapiro–Wilk test (p < 0.05). As this violated one of the ANOVA assumptions, a Box-Cox test was performed on the model giving the value −1. The reciprocal of the dataset was then used for the statistical analyses. (Note that the transformation did not affect which treatments were significantly different from each other). The transformed residuals Shapiro–Wilk test had a p value of greater than 0.05, indicating normality. Cumulative NO Emissions (kg ha−1) were also analysed using ANOVA with a one-way structure (Variable ~ Treatment). A linear mixed-effect model was performed on the repeated measure variables (15NH4+, 15N2O and 15NO3−) data using the package lme4 in R. The model was structured as: lmer (Variable ~ Treatment * Days of Measurement + (1 | Experimental Unit)). Tukey’s Honestly Significant Difference test was used to test difference between means for all analyses.
3. Results
3.1. Soil-Extractable Cu, Ni Levels After Application of Metal Salts in Combination with 15Urea
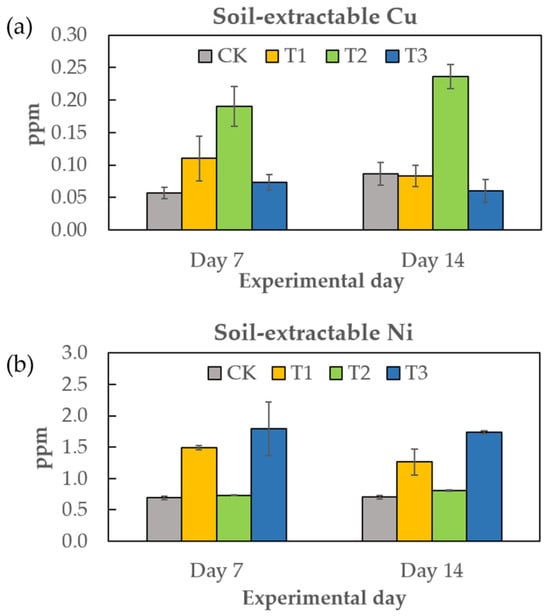
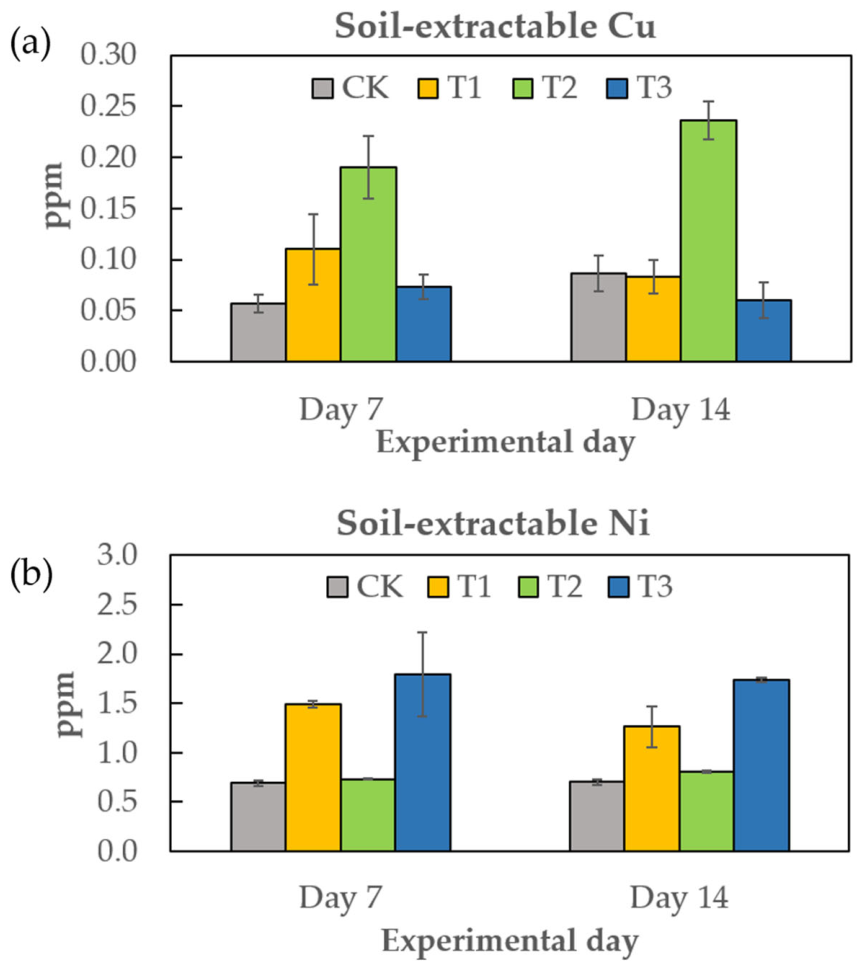
Overall, the application of CuSO4 to T2 significantly increased soil levels of available Cu in this treatment (p < 0.001) (Figure 1a) and those levels remained similar in this treatment on the two experimental days analysed (p > 0.05). Maximum levels of 0.24 ± 0.02 ppm were observed in T2 while an average concentration (± standard error, se) of 0.06 ± 0.02 ppm was observed in the rest of treatments on both days analysed.
Figure 1.
Concentration of soil-extractable Cu (a) and soil-extractable Ni (b) in soil samples. Bars represent mean values (n = 3) and error bars the standard error of the mean. CK: 15N-Urea (50% WFPS–75% WFPS); T1: 15N-Urea + Ni (50% WFPS–75% WFPS); T2: 15N-Urea + Cu (50% WFPS–75% WFPS); T3: 15N-Urea + Ni (continuous 75% WFPS).
Soil-extractable Ni (Figure 1b) was significantly higher in the treatments amended with NiSO4 (T1 and T3) on the days analysed (p < 0.001). No significant differences were observed between the treatments with Ni amendment (T1 vs. T3) (p > 0.005) or between treatments without added Ni (CK, T2) (p > 0.005). Levels of added Ni remained similar on the two dates analysed (p > 0.05). Average values (± se) in T1 and T3 were 1.38 ± 0.11 and 1.77 ± 0.19, while values of 0.70 ± 0.02 and 0.77 ± 0.02 were found in CK and T2, respectively.
3.2. Soil Mineral N Levels and Contribution of the 15N Urea to Those Levels
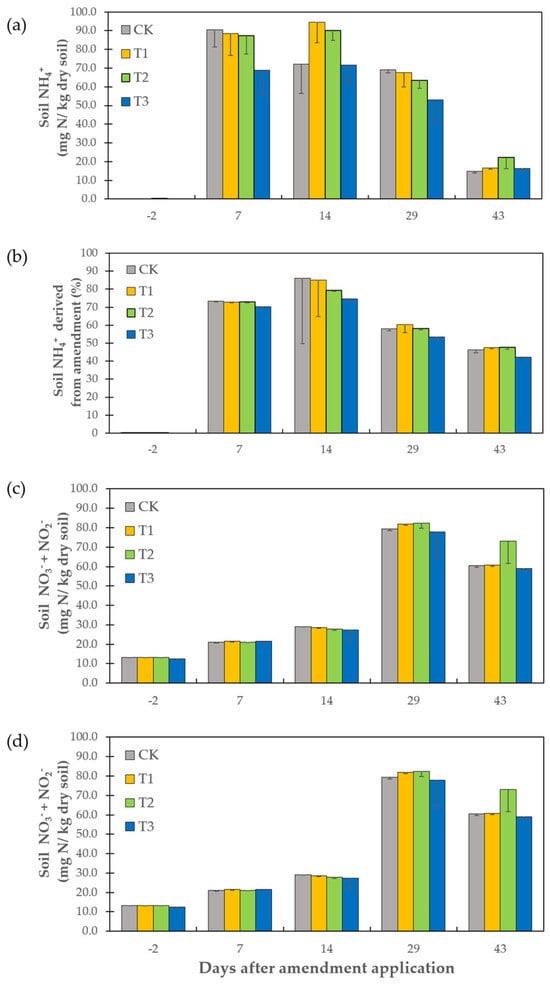
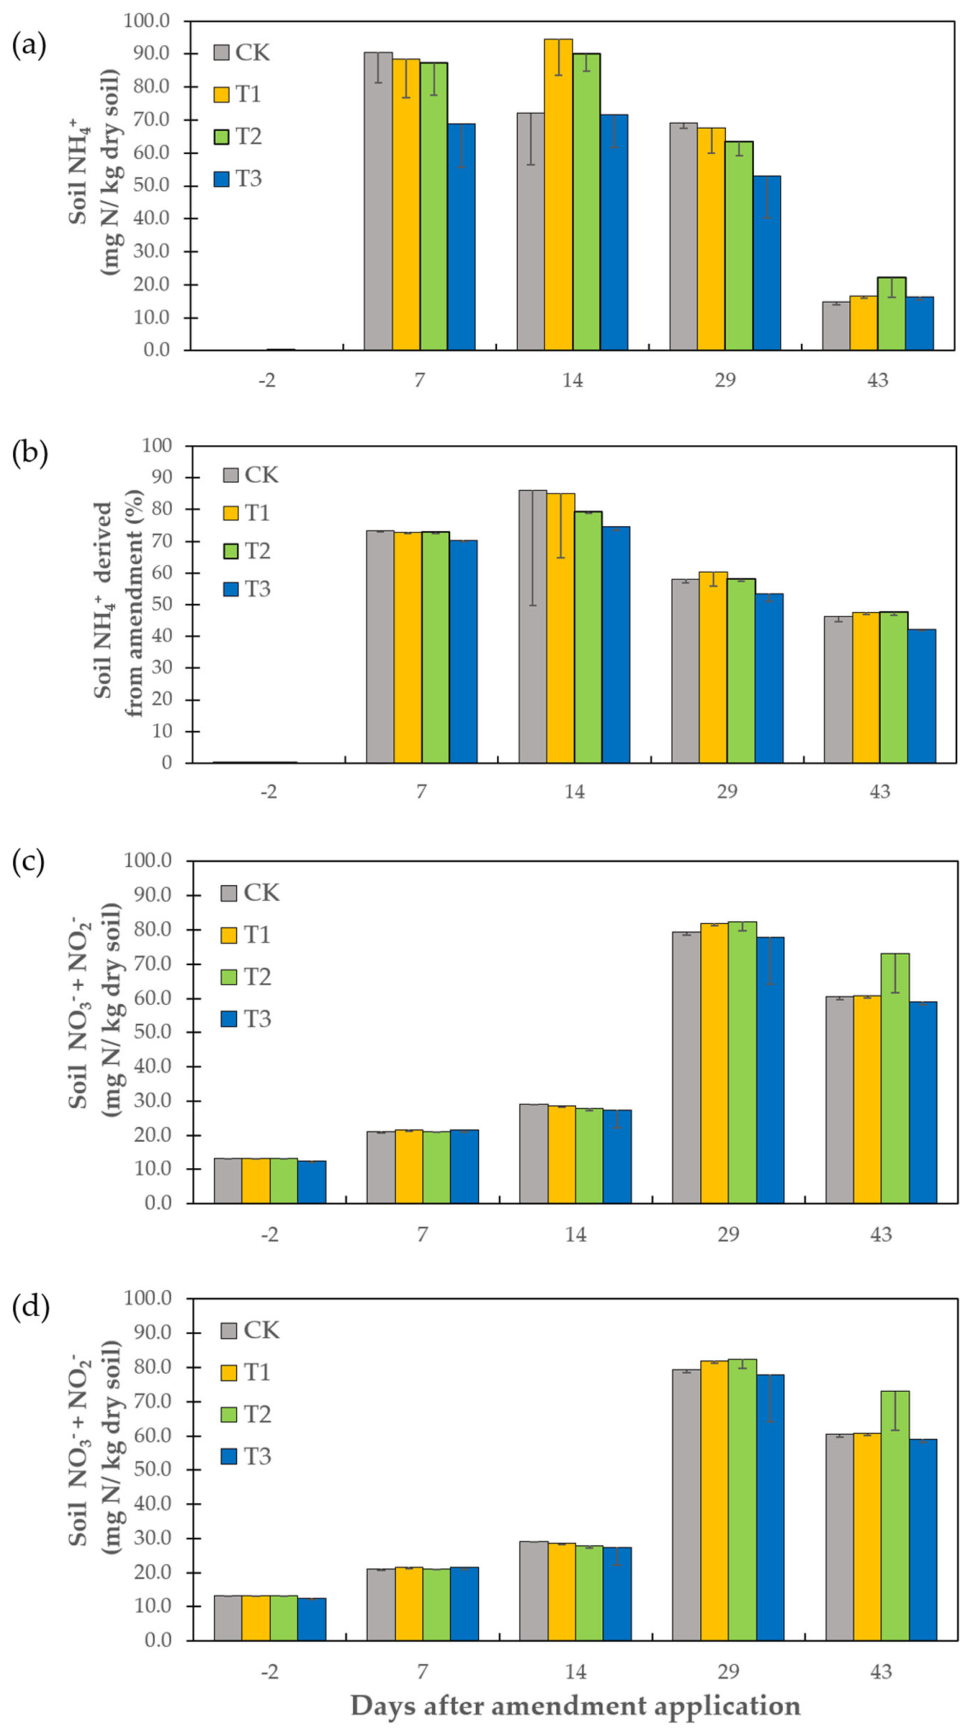
The application of NiSO4 (T1 and T3) or CuSO4 (T2) in combination with urea did not significantly change soil NH4 levels when compared to CK (p > 0.05), but differences were observed between the sampling days (p < 0.05). Urea application rapidly increased NH4 levels in all treatments, maintaining high values up to 14 days after amendment, and following the same decreasing pattern afterwards (Figure 2a). The maximum soil NH4 levels, observed from CK, T1, T2 and T3 in the first 14 days of the experiment, were 90.5 ± 9.1, 94.6 ± 11.1, 90.1 ± 5.28 and 71.6 ± 9.9 mg N/kg dry soil, respectively.
Figure 2.
Soil NH4+ (a), NH4+ derived from 15N-urea (b), soil TON (NO3− + NO2−) (c) and 15TON (NO3− + NO2−) derived from 15N-urea (d) during the experimental period. Data points represent mean values (n = 3) and error bars represent standard error of the mean. Treatments: CK: 15N-Urea (50% WFPS–75% WFPS); T1: 15N-Urea + Ni (50% WFPS–75% WFPS); T2: 15N-Urea + Cu (50% WFPS–75% WFPS); T3: 15N-Urea + Ni (continuous 75% WFPS).
The soil 15NH4 levels analysed showed lower 15N enrichment of NH4 in T3 in comparison with the other three treatments on Day 7 and lower than T1 and T2 on Day 14, but the differences were not significant (p > 0.05). With regard to the source of the soil N pool during the experiment, it was observed that a large proportion of the soil N was coming from the amendment on Days 7 and 14 (averages of 72 ± 0.7% and 81 ± 2.7%, respectively), decreasing after these days to average levels as low as 46 ± 1.3% on Day 43 (Figure 2b).
No significant differences were observed in TON levels between treatments (p > 0.05) while differences were observed between sampling dates (p < 0.001). Soil TON concentration gradually increased in all treatments, reaching the maximum levels 29 days after the urea application (Figure 2c). Mean TON levels ranged from 13.1 ± 0.2 (on Day −2) to 80.4 ± 1.1 (on Day 29). The 15N-TON data showed no differences between treatments (p > 0.05) but there were differences between sampling dates (p < 0.001). The contribution of the 15N-labelled urea to the soil TON pool gradually increased WITH respect to initial TON levels in all treatments, increasing from average values of 22 ± 0.8% on Day 7 to average values of 57 ± 1.0% on Day 43 (Figure 2d).
3.3. Fluxes of NO and N2 and Cumulative Emissions
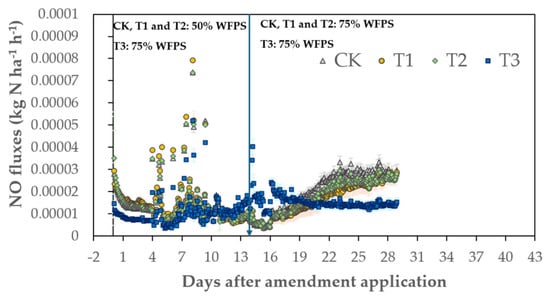
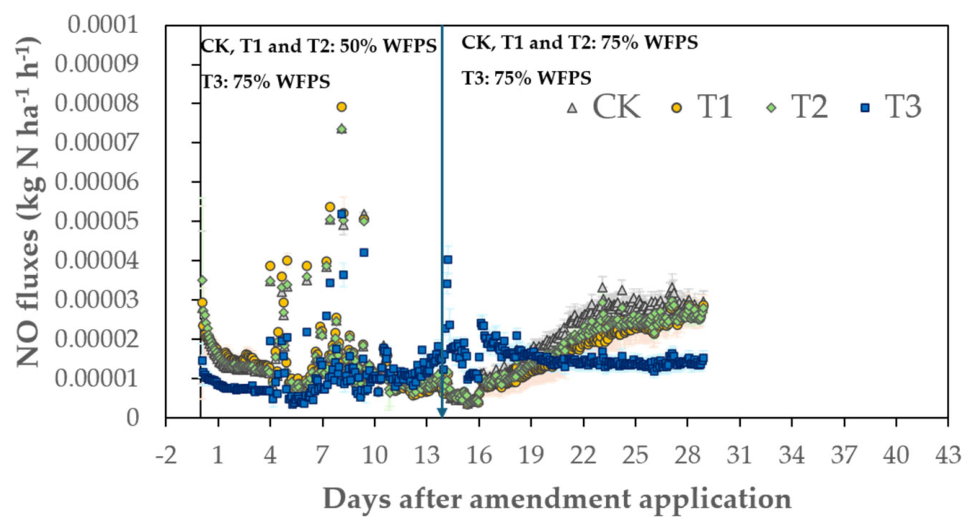
Fluxes of NO (Figure 3) were recorded only during 29 days after the application of the amendments as a problem with the instrument occurred from this day onward, halting the ability to continue monitoring the fluxes for the rest of the experimental period. The magnitude of the measured fluxes from CK, T1, T2 and T3 during the 29 day period were in the ranges 3.6 × 10⁻⁶–7.4 × 10⁻⁵, 3.5 × 10⁻⁶–7.9 × 10⁻⁵, 3.6 × 10⁻⁶–9.8 × 10⁻⁵ and 3.3 × 10⁻⁶–5.2 × 10⁻⁵ kg N ha−1 h−1, respectively. NO emissions showed an initial peak from Day 4 of the incubation in all treatments, reaching maximum fluxes on Day 8 from treatments CK, T1 and T3. Fluxes from T3 were smaller in magnitude when compared to the other three treatments in this initial phase. While NO emissions decreased for treatments CK, T1 and T2, a second peak of NO occurred in T3 from Day 12, reaching its peak at Day 14 followed by a decrease and levelling out by Day 22. In treatments CK, T1 and T2, NO emissions started to increase steadily only a few hours after the addition of water to increase soil moisture levels to 75% WFPS in those treatments. Fluxes of N2 were not detected during the incubation from any treatment.
Figure 3.
Measured NO fluxes after amendment application. Data points represent mean values (n = 3) and error bars represent standard error of the mean. Treatments: CK: 15N-Urea (50% WFPS-75% WFPS); T1: 15N-Urea + Ni (50% WFPS-75% WFPS); T2: 15N-Urea + Cu (50% WFPS-75% WFPS); T3: 15N-Urea + Ni (continuous 75% WFPS).
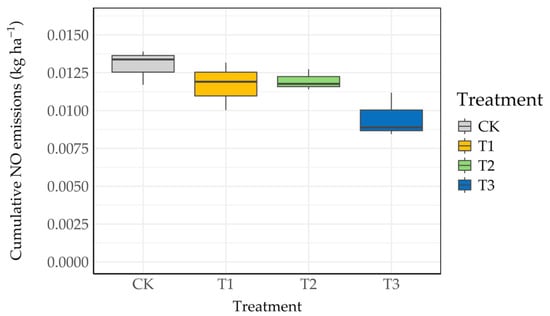
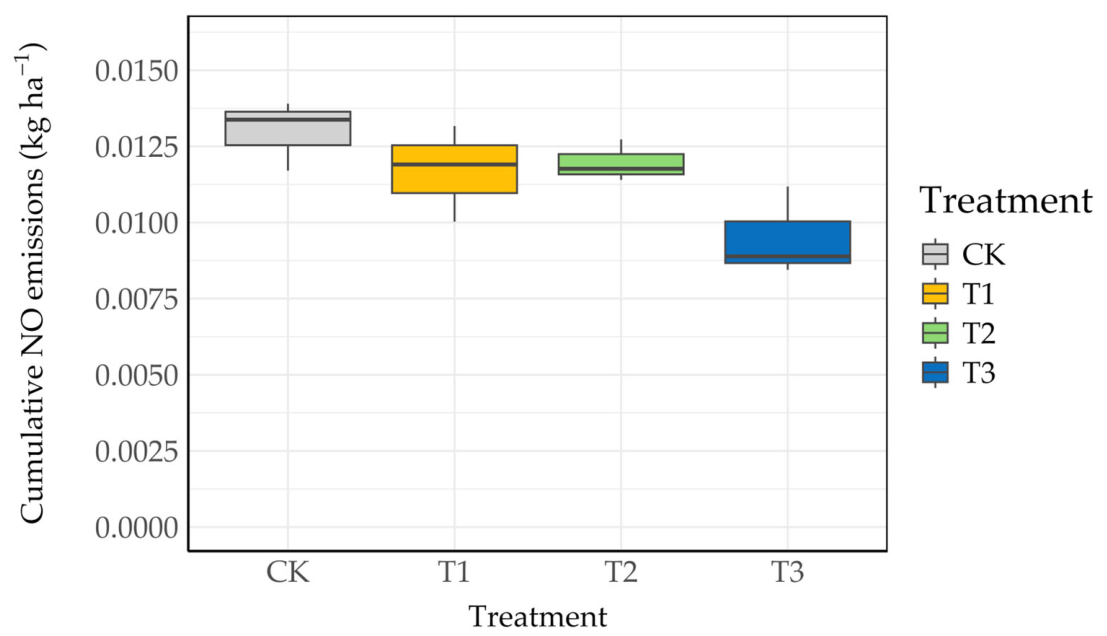
The post-hoc statistical analysis showed CK only to be significantly greater than T3 when looking at cumulative NO emissions (p < 0.05) (Figure 4). The ANOVA analysis for cumulative NO emissions produced a p value (p = 0.051) that did not indicate a significant difference between the treatment within the 95% confidence interval. However, this analysis still indicates a high likelihood that the T1 and T2 treatments had a different impact on cumulative NO emissions than T3.
Figure 4.
Cumulative NO emissions (kg N ha−1) of the different treatment groups. Boxes represent the datapoints distribution (n = 3), the horizontal line the median value and the whiskers the lower and upper 25% data within each treatment. Treatments: CK: 15N-Urea (50% WFPS-75% WFPS); T1: 15N-Urea + Ni (50% WFPS-75% WFPS); T2: 15N-Urea + Cu (50% WFPS-75% WFPS); T3: 15N-Urea + Ni (continuous 75% WFPS).
3.4. Ratio of N2O Derived from the Added 15N-Urea and N2 Emissions
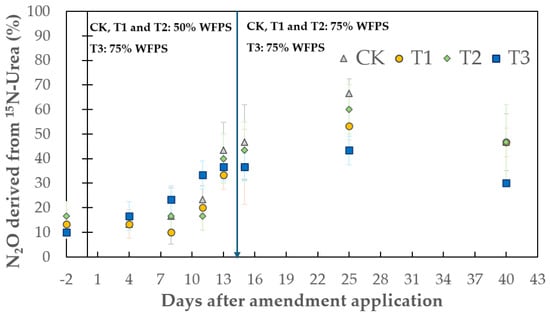
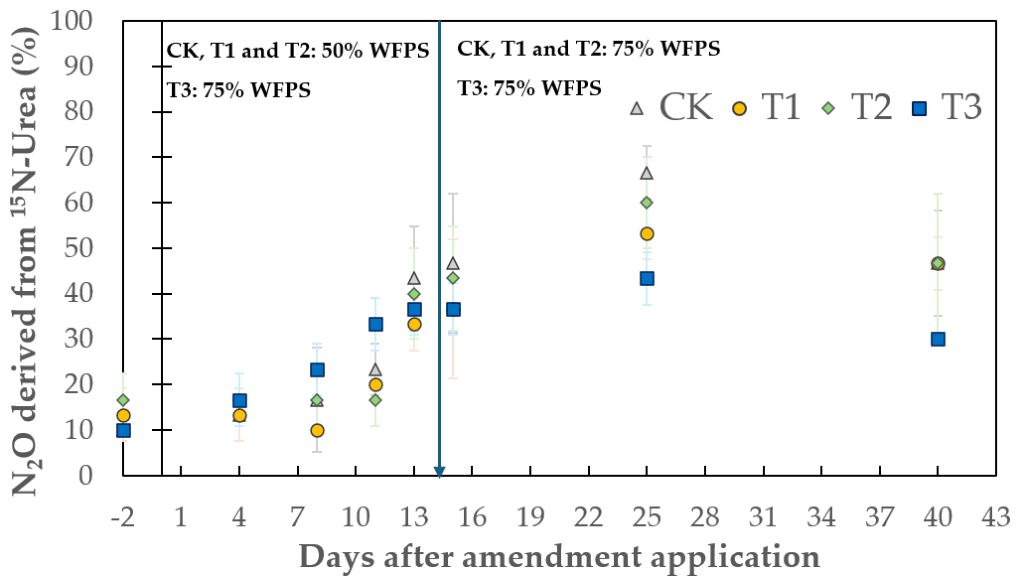
The 15N2O spot samples collected during the experiment showed significant differences in experimental days and the interaction between experimental day and the treatments (Figure 5). The ratio of N2O derived from the 15N-labelled urea of all the treatment groups followed a similar increasing pattern after amendment application. Average values ranged from 4.0 ± 0.4% (on Day 0) to 16.5 ± 1.5% (on Day 27). Though not significantly different, the ratios of N2O derived from the amendment were initially higher in the treatment with the higher level of WFPS (T3—75%). After the soil moisture was increased in CK, T1 and T2, this relationship reversed. While all treatments showed an increase in the ratio of N2O derived from the amendment, this increase slowed down for treatment T3, which had a lower ratio of N2O derived from its amendment compared to the other treatments by Day 27.
Figure 5.
15N atomic ratio in the collected N2O samples on different experimental days. Data points represent mean values (n = 3) and error bars represent standard error of the mean. Treatments: CK: 15N-Urea (50% WFPS-75% WFPS); T1: 15N-Urea + Ni (50% WFPS-75% WFPS); T2: 15N-Urea + Cu (50% WFPS-75% WFPS); T3: 15N-Urea + Ni (continuous 75% WFPS).
4. Discussion
4.1. Effect of Application of CuSO4 on Complete Denitrification
The study aimed to evaluate whether adding CuSO4 together with urea could affect N cycling. By enhancing soil conditions for Cu-dependent N2O reductase activity, the aim was to promote total denitrification and, consequently, promote N2 production. Some studies have reported significant N2O reductions after CuSO4 applications. For example, Shen et al. [34] observed 94–95% reductions in N2O emissions from Andosols and Fluvisols after the application of 130 mM of CuSO4.
In this incubation study, no N2 emissions were detected despite the fact that the DENIS system can detect very low levels of N2 if produced (as low as 0.0004 kg N/ha/h). This absence of N2 peaks gave us an indication that perhaps no complete denitrification was produced. The treatment that received Cu salt (T2) behaved in the same way as the control treatment (CK), showing no evidence of stimulation of complete denitrification through N2 production. The daily data provided the %N2O derived from the 15N-urea applied from each chamber (Figure 5) as a result of microbial processes that released N2O, which occurred in all treatments either from soil or from the applied amendment, just not complete denitrification.
In some studies where soil metal applications were at different rates, the focus was on promoting/exacerbating soil conditions to see the effect on N2O and N2 production without considering whether those effective rates cause soil and plant toxicity and ultimately an environmental risk. Black et al. [35] reported that enhancing the reduction of N2O to N2 requires Cu application rates between 150 and 200 mg/kg, which are above the 20 mg/kg reported to cause plant toxicity. This could explain the similar absence of N2 production between the treatments despite the application of Cu in T2. In this experiment, the application of CuSO4 was 8 mg/kg, below the concentration for plant toxicity and much lower than the application by Black et al. [35]. Devaney et al. [36] observed a reduction in N2O emissions in a sandy loam soil, under similar soil WFPS laboratory conditions (75–80% WFPS) and at low Cu application rates (13.3 mg Cu/kg soil), where daily N2O flux could reach maximum values of 0.12 kg N/ha from untreated soils while small Cu salt applications produced lower maximum daily values of 0.08 kg N/ha. Sharma et al. [37], during the incubation of riparian, marsh and stream soils with different Cu additions, also observed significant accumulation of N2O in those soils when no Cu was added in comparison with the N2O emitted under low (8.3–31.8 mg Cu/kg soil) and high Cu loading (82.6–317.3 mg/kg).
Although N2O emissions were not measured directly, N2O was detected from the tracing method. It was also observed that the potential production of this gas could be more related to the optimal soil moisture levels to produce this gas rather than the application of Cu. This can be seen in the increasing trend in enrichment from T3, where no Cu was applied but soil conditions were continuously anaerobic (75% WFPS), and the increase in the 15N atomic ratio of the N2O in the rest of treatments, once soil moisture was raised to anaerobic conditions.
In addition to the low Cu application rate, it is possible that a large proportion of the Cu applied with CuSO4 was retained by the large fraction of clay present in the soil used for the experiment (Cambisol). The capacity of adsorption of Cu increases with the higher levels of clay minerals [26,38]. Besnard et al. [39] found larger concentrations of Cu in clay-sized fractions of soils, particularly clay size fractions <2 µm. Thus, it is possible that, by bonding with clays, Cu became less mobile and less available as a nutrient, as reflected in the low extractable Cu levels observed in the soil (Figure 1a). Under conditions of environmentally safe CuSO4 application rates and low Cu availability in the Cambisol studied, it is possible that the expected effect of the added Cu to increase N2 emissions through increased activity of N2O reductase was counteracted by the reduced availability of Cu after its application through binding processes. Further incubations need to be conducted to clarify this.
4.2. Effect of Application of NiSO4 on Nitrification
Urease is a Ni-dependent enzyme that catalyses urea hydrolysis into NH3, which is transformed to NH4+ when in equilibrium with water, which can then be nitrified. Some studies have reported that Ni additions to soils can stimulate nitrification. deCatanzaro et al. [40] observed this effect on forest soils after applications of 100 mg/kg soil. In our study, no clear increase in NO production due to NiSO4 was observed, at least during the period of 29 days monitored by the NO analyser. NO emissions from T1 (NiSO4) and CK (no NiSO4) were similar at soil moisture levels (50% WFPS) where nitrification occurred (first 14 days). This was reflected by the similar increase in soil NH4 levels and the gradual transformation to soil NO3 in both treatments (Figure 2). The absence of differences between T1 and CK can also be attributed, as for CuSO4, to the low NiSO4 application rates applied based on the Government’s recommendations and to the clay content of the soil used for the incubation [41,42]. While several studies have investigated the effects of heavy metals on the soil N-cycle, specific studies investigating the resulting NO emissions from metal applications to soils were not found in the literature, reflecting the need for more studies to investigate the effect of this metal in different type of soils and experimental set-ups.
4.3. Effect of Moisture Conditions and Metal Application on NO and Potential N2O Emissions
The Ni treatment at a constant high WFPS level (T3) showed the lowest cumulative NO emissions. A comparison of the treatments with added NiSO4 (T3 and T1) indicates that the differences in NO production between treatments (despite being not significant at exactly 95% confidence) are highly likely to be driven by the moisture conditions [18,19] rather than metal application, at least during the period monitored. It is important to remember that NO, produced by nitrification and denitrification processes, is not always emitted as it can be rapidly consumed in the soil, mainly during the denitrification process where relative consumption is higher [43]. Since this occurs under anaerobic conditions, it is plausible to believe that the more anaerobic conditions in T3 led to greater consumption of NO than T1. Higher NO emissions could suggest higher potential for N2O emissions, which could have started to be produced from Day 13, as NO emissions decreased [44]. The significantly higher contribution of the applied urea to the 15N ratio of the N2O samples collected in CK, T1 and T2 in comparison to T3 from Day 14 also coincided with the increase in soil moisture in those treatments (Figure 3). This seemed to have a more significant impact on the transformation of the applied amendment to N2O than the application of heavy metals to soils. At this stage, soil mineral N data also indicate increasing soil NO3 levels, which, under the more anaerobic soil conditions, support the theory of higher N2O emissions due to denitrification at this stage. Equally, if the dry soil is rewetted, any N2O produced and stored in the soil could then be released. Thus, the change in soil moisture could affect the timing of the N2O peaks but may not have significantly reduced the overall N2O emission, when the soil was highly moist for a certain period. However, this inference still requires evidence from further studies looking at N2O emission data. It is very important to note that the NO analyser did not acquire data after Day 29, where soil moisture levels were still anaerobic, so any potential effect of Ni application on NO produced from this soil after this day was missed, and therefore, it was not possible to detect or evaluate.
The addition of Ni and Cu (represented by T1 and T2, respectively) did not significantly affect the source of the 15N atomic ratio of the N2O spot samples compared to the CK treatment, at any of the sampling times, suggesting only a minor impact on the potential N2O emissions. Chiaravalloti et al. [45] also observed that the application of metals such as Cu can significantly decrease N2O emissions, but this effect depends not only on the rate of Cu applied but alos on the soil pH, being significant under a high soil pH but not in acidic soils with low pH. Only microorganisms that have nosZ genes encoding N2O reductase can conduct a complete reduction of N2O to N2. At low soil pH, the synthesis, activity and functionality of N2O reductase are inhibited, favouring N2O emissions [46]. Shaaban et al. [47] observed that reductions in N2O emissions from acid soils are possible under adequate Cu levels, increased pH and abundant nosZ genes in those soils. In this sense, the acidic nature of the soils used for the incubation in combination with the use of the UK government’s Cu recommended rates (low) could have been factors explaining the lack of an effect on N2 emissions. deCatanzaro et al. [40] observed that high Ni applications (500 mg/kg) stimulated N mineralisation, and these rates were much higher than those used in our study. However, mineralisation processes are likely to have occurred during the experiment in all treatments. Initial soil mineral N contents on Day −2 were significantly lower than those of the samples after the addition of the 15N-urea. When comparing the levels of NH4+ with the % soil 15NH4+ from amendment (and 15NO3−) (Figure 2a–d), differences between 20 and 30 g N/kg of soil were observed, denoting a possible contribution from mineralisation to increased available soil N. Mineralisation processes were likely to happen in this soil since the experiment was conducted in sieved (2 mm) and air-dried soil to reach a WFPS level of 30%. Under these conditions, the organic matter (initially protected in the soil aggregates before sieving) was more physically exposed and unprotected. Thus, the rapid soil rewetting to establish experimental moisture conditions could have triggered mineralisation [48] by the microbial community in all treatments and increased the soil-available N pool.
4.4. Recommendations for Future Research
The availability of metals in the soil can regulate or inhibit microbial processes by causing changes in the microbial population, ultimately altering N-cycling. These changes can be observed after short-term manipulation of the metal availability [24]. In this incubation, the soil type use, in combination with the selected UK Government’s recommendation rates (realistic rates for agronomic use), may have limited the ability to produce an enzymatic effect that translated to evident differences between treatments due to the low metal availability for microbes. In addition to the low metal application rates applied to this soil, the high clay content may have further reduced the amount of metal availability for microbial activity by adsorption to this fraction. In this sense, future experimental designs that include different application rates and different soil types should be conducted to untangle the potential dual effect of these two factors (rate, soil type) seen in this incubation. Black et al. [49] reported that some denitrifying bacteria are sensitive to historical concentrations of Cu in soils. This incubation only covered a period of 43 days after a single application event. Hence, the potential effects of the long-term exposure to these metal rates in this soil on microbial activity and N-cycling should also be addressed in future incubations. In relation to moisture conditions, the current incubation included treatments coupled with soil moisture conditions and metal applications. For Cu, it was not possible to fit a treatment with continuous anaerobic conditions (%75 WFPS) so future designs should aim to decouple moisture conditions and metal effects from both Cu and Ni, with full factorial structure and control.
We acknowledge the lack of continuous N2O fluxes during this incubation and the importance of these being monitored in future incubations to observe the clear effect of the metals on the N dynamics that lead to its production or reduction to N2. In relation to this, and as mentioned before, the influence of Cu availability on N2O consumption/reduction (even if N2O data were available) in this soil would have been better evaluated with experiments conducted at microbiological and enzymatic levels. For Ni, urease activity, urea hydrolysis rates and changes in NH4+ specific to Ni applications were not measured in this study so future studies should include these to obtain a better understanding of processes that lead to NO emissions.
Shen et al. [34] observed that only 54% of the strains of denitrifiers investigated from an Andosol and a Fluvisol were able to reduce the N2O to N2 after application of Cu to pure culture, showing the complexity of the soil processes involved. Therefore, similar experiments should be conducted with this Cambisol to elucidate the potential of Cu or Ni applications to reduce N losses at the agronomic levels recommended by the UK Government.
5. Conclusions
Following the UK Government’s recommended soil application rates of Cu and Ni salts is crucial for providing nutrients for biological plant processes without causing soil toxicity from a excess application. However, the effect of soil N emissions needed to be examined. The data acquired with this soil incubation experiment showed that the application of these metals at the recommended rates do not seem to stimulate N processes that could affect NO emissions or promote losses of N through N2 emissions in Cambisols. The effect of these processes could have been counteracted by the reduced availability of the metals after their application through binding processes with the clay fraction as well as the acidic nature of the soil. However, results showed that there was a high likelihood that the resulting NO emissions were related to the different soil moisture conditions between treatments. Further research into the effect of metal applications on gaseous N emissions from contrasting soil types, application rates, repeated application events and soil moisture conditions is required. Future studies in this type of soil should be conducted in parallel with microbial and enzymatic experiments to elucidate the specific effect of these metal application rates on the specific microbial population and the resulting N gases.
Author Contributions
Conceptualisation: A.L.L., N.L. and L.M.C.; methodology: A.L.L., N.L., S.S.A., C.-H.L., M.R.A. and L.M.C.; validation: A.L.L., N.L. and L.M.C.; formal analysis: S.S.A.; investigation: A.L.L., N.L., S.S.A., C.-H.L., M.R.A. and L.M.C.; resources: A.L.L., N.L. and L.M.C.; data curation: A.L.L. and N.L. writing—original draft preparation: A.L.L., N.L., S.S.A., C.-H.L., M.R.A. and L.M.C.; writing—review and editing; A.L.L., N.L., S.S.A., C.-H.L., M.R.A. and L.M.C.; supervision: A.L.L., N.L. and L.M.C.; project administration: L.M.C.; funding acquisition: L.M.C. All authors have read and agreed to the published version of the manuscript.
Funding
The experiment was founded by the Royal Society (project IEC_R3_233111) and led by Rothamsted Research (UK) and National Chung-Hsing University (Taiwan). Rothamsted Research receives strategic funding from the Biotechnology and Biological Sciences Research Council of the United Kingdom (BBSRC). We acknowledge the support from the Resilient Farming Futures (BB/X010961/1) and Growing Health (BB/X010953/1) Institute Strategic Programmes.
Data Availability Statement
All data are included within the article.
Acknowledgments
The authors would like to acknowledge the contribution of our colleague, Pei-Tzu Kao from National Chung-Hsing University, for contributing to the funding for this study as well as for her input on conducting the experiment. Special wishes are extended as Kao has just embarked on a new chapter in her life. We would like to thank the anonymous reviewers for their insightful comments and constructive feedback, which have significantly improved the quality of the manuscript. We would also like to thank William Mark Roberts and Sofia Nightingale, from Rothamsted Research, for his valuable help proofreading the English in this manuscript. Gemini Flash (API version 2.5/3.6) was used to assist in creating the visual concept and layout of the graphical abstract, in particular the visualisation of the “Key Findings and Mechanisms”. To ensure scientific accuracy, the resulting graphical representation was verified against the experimental data of this study.
Conflicts of Interest
The authors declare no conflicts of interest.
References
- Robertson, G.P.; Groffman, P.M. Nitrogen transformations. In Soil Microbiology, Ecology and Biochemistry; Paul, E.A., Frey, S.D., Eds.; Elsevier: Amsterdam, The Netherlands, 2024; pp. 407–438. [Google Scholar]
- Butterbach-Bahl, K.; Baggs, E.M.; Dannenmann, M.; Kiese, R.; Zechmeister-Boltenstern, S. Nitrous oxide emissions from soils: How well do we understand the processes and their controls? Philos. Trans. R. Soc. B Biol. Sci. 2013, 368, 1621. [Google Scholar] [CrossRef] [Scilit] [PubMed]
- Richardson, D.; Felgate, H.; Watmough, N.; Thomson, A.; Baggs, E. Mitigating release of the potent greenhouse gas N2O from the nitrogen cycle—Could enzymic regulation hold the key? Trends Biotechnol. 2009, 27, 388–397. [Google Scholar] [CrossRef] [Scilit] [PubMed]
- Nguyen, D.-H.; Lin, C.; Vu, C.-T.; Cheruiyot, N.K.; Nguyen, M.K.; Le, T.H.; Lukkhasorn, W.; Vo, T.; Bui, X. Tropospheric ozone and NOx: A review of worldwide variation and meteorological influences. Environ. Technol. Innov. 2022, 28, 102809. [Google Scholar] [CrossRef] [Scilit]
- Perring, M.P.; Jones, L.; Sharps, K.; Hayes, F. Nitric oxide (NO) and nitrogen dioxide (NO2): A state-of-knowledge review of their roles in, and consequences for, vegetation and ecosystems. Atmos. Environ. 2026, 367, 121744. [Google Scholar] [CrossRef] [Scilit]
- Davidson, E.A.; Kingerlee, W. A global inventory of nitric oxide emissions from soils. Nutr. Cycl. Agroecosyst. 1997, 48, 37–50. [Google Scholar] [CrossRef] [Scilit]
- Vinken, G.C.M.; Boersma, K.F.; Maasakkers, J.D.; Adon, M.; Martin, R.V. Worldwide biogenic soil NOx emissions inferred from OMI NO2 observations. Atmos. Chem. Phys. 2014, 14, 10363–10381. [Google Scholar] [CrossRef] [Scilit]
- IPCC. Climate Change 2014: Synthesis Report; Pachauri, R.K., Meyer, L.A., Eds.; IPCC: Geneva, Switzerland, 2014. [Google Scholar]
- Reay, D.S.; Davidson, E.A.; Smith, K.A.; Smith, P.; Melillo, J.M.; Dentener, F.; Crutzen, P.J. Global agriculture and nitrous oxide emissions. Nat. Clim. Change 2012, 2, 410–416. [Google Scholar] [CrossRef] [Scilit]
- Adalibieke, W.; Cui, X.; Cai, H.; You, L.; Zhou, F. Global crop-specific nitrogen fertilization dataset in 1961–2020. Sci. Data 2023, 10, 617. [Google Scholar] [CrossRef] [Scilit] [PubMed]
- Kanter, D.R.; Zhang, X.; Mauzerall, D.L.; Malyshev, S.; Shevliakova, E. The importance of climate change and nitrogen use efficiency for future nitrous oxide emissions from agriculture. Environ. Res. Lett. 2016, 11, 094003. [Google Scholar] [CrossRef] [Scilit]
- Stocker, B.D.; Roth, R.; Joos, F.; Spahni, R.; Steinacher, M.; Zaehle, S.; Bouwman, L.; Ri, X.; Prentice, I.C. Multiple greenhouse-gas feedbacks from the land biosphere under future climate change scenarios. Nat. Clim. Change 2013, 3, 666–672. [Google Scholar] [CrossRef] [Scilit]
- López-Aizpún, M.; Castellano-Hinojosa, A.; González-López, J.; Bedmar, E.J.; Loick, N.; Barrat, H.A.; Ma, Y.; Chadwick, D.; Cardenas, L. (Eds.) Nitrogen Cycle in Agriculture: Biotic and Abiotic Factors Regulating Nitrogen Losses. In Nitrogen Cycle; CRC Press: Boca Raton, FL, USA, 2021. [Google Scholar]
- Berlin, M.; Suresh Kumar, G.; Nambi, I.M. Numerical modelling on transport of nitrogen from wastewater and fertilizer applied on paddy fields. Ecol. Model. 2014, 278, 85–99. [Google Scholar] [CrossRef] [Scilit]
- Rubol, S.; Manzoni, S.; Bellin, A.; Porporato, A. Modeling soil moisture and oxygen effects on soil biogeochemical cycles including dissimilatory nitrate reduction to ammonium (DNRA). Adv. Water Resour. 2013, 62, 106–124. [Google Scholar] [CrossRef] [Scilit]
- Du, Y.; Guo, S.; Wang, R.; Song, X.; Ju, X. Soil pore structure mediates the effects of soil oxygen on the dynamics of greenhouse gases during wetting–drying phases. Sci. Total Environ. 2023, 895, 165192. [Google Scholar] [CrossRef] [Scilit] [PubMed]
- Mekala, C.; Nambi, I.M. Understanding the hydrologic control of N cycle: Effect of water filled pore space on heterotrophic nitrification, denitrification and dissimilatory nitrate reduction to ammonium mechanisms in unsaturated soils. J. Contam. Hydrol. 2017, 202, 11–22. [Google Scholar] [CrossRef] [Scilit] [PubMed]
- Davidson, E.; Schimel, J. Microbial processes of production and consumption of nitric oxide. In Biogenic Trace Gases: Measuring Emissions from Soil and Water; Wiley: Hoboken, NJ, USA, 1995; Volume 327. [Google Scholar]
- Meixner, F.X.; Yang, W.X. Biogenic emissions of nitric oxide and nitrous oxide from arid and semi-arid land. In Dryland Ecohydrology; D’Odorico, P., Porporato, A., Eds.; Springer: Dordrecht, The Netherlands, 2006; pp. 233–255. [Google Scholar]
- Jabri, E.; Carr, M.B.; Hausinger, R.P.; Karplus, P.A. The crystal structure of urease from Klebsiella aerogenes. Science 1995, 268, 998–1004. [Google Scholar] [CrossRef] [Scilit]
- Kappaun, K.; Piovesan, A.R.; Carlini, C.R.; Ligabue-Braun, R. Ureases: Historical aspects, catalytic, and non-catalytic properties—A review. J. Adv. Res. 2018, 13, 3–17. [Google Scholar] [CrossRef] [Scilit] [PubMed]
- Mazzei, L.; Cianci, M.; Benini, S.; Ciurli, S. The Structure of the Elusive Urease–Urea Complex Unveils the Mechanism of a Paradigmatic Nickel-Dependent Enzyme. Angew. Chem. Int. Ed. 2019, 58, 7415–7419. [Google Scholar] [CrossRef] [Scilit] [PubMed]
- Rosenzweig, A.C. Nitrous oxide reductase from CuA to CuZ. Nat. Struct. Biol. 2000, 7, 169–171. [Google Scholar] [CrossRef] [Scilit] [PubMed]
- Giannopoulos, G.; Hartop, K.R.; Brown, B.L.; Song, B.; Elsgaard, L.; Franklin, R.B. Trace Metal Availability Affects Greenhouse Gas Emissions and Microbial Functional Group Abundance in Freshwater Wetland Sediments. Front. Microbiol. 2020, 11, 560861. [Google Scholar] [CrossRef] [Scilit] [PubMed]
- Liu, Y.; Liu, Y.; Zhou, H.; Li, L.; Zheng, J.; Zhang, X.; Zheng, J.; Pan, G. Abundance, composition and activity of denitrifier communities in metal polluted paddy soils. Sci. Rep. 2016, 6, 19086. [Google Scholar] [CrossRef] [Scilit] [PubMed]
- Xu, E.; Liu, Y.; Gu, D.; Zhan, X.; Li, J.; Zhou, K.; Zhang, P.; Zou, Y. Molecular Mechanisms of Plant Responses to Copper: From Deficiency to Excess. Int. J. Mol. Sci. 2024, 25, 6993. [Google Scholar] [CrossRef] [Scilit] [PubMed]
- PubChem. PubChem Compound Summary for CID 24463, Copper Sulfate Pentahydrate. 2026. Available online: https://pubchem.ncbi.nlm.nih.gov/compound/Copper-sulfate-pentahydrate (accessed on 8 June 2026).
- Stuart, J.; Nicholson, F.; Rollett, A.; Chambers, B.; Gleadthorpe, A.; Vale, M. The Defra “Agricultural Soil Heavy Metal Inventory” for 2008 Report 3 for Defra Project SP0569; Department for Environment, Food and Rural Affairs: London, UK, 2010.
- Bateman, E.J.; Baggs, E.M. Contributions of nitrification and denitrification to N2O emissions from soils at different water-filled pore space. Biol. Fertil. Soils 2005, 41, 379–388. [Google Scholar] [CrossRef] [Scilit]
- Nicholson, F.A.; Smith, S.R.; Alloway, B.J.; Carlton-Smith, C.; Chambers, B.J. An inventory of heavy metals inputs to agricultural soils in England and Wales. Sci. Total Environ. 2003, 311, 205–219. [Google Scholar] [CrossRef] [Scilit] [PubMed]
- Cardenas, L.; Hawkins, J.; Chadwick, D.; Scholefield, D. Biogenic gas emissions from soils measured using a new automated laboratory incubation system. Soil Biol. Biochem. 2003, 35, 867–870. [Google Scholar] [CrossRef] [Scilit]
- GE Instruments. Sievers Nitric Oxide Analyzer NOA 280.Operation and Maintenance Manual. Firmware Version 3.00 and Later USA2006. Available online: https://www.manualslib.com/manual/1247918/Ge-Moa-280i.html (accessed on 10 August 2026).
- Stevens, R.J.; Laughlin, R.J. Nitrite Transformations during Soil Extraction with Potassium Chloride. Soil Sci. Soc. Am. J. 1995, 59, 933–938. [Google Scholar] [CrossRef] [Scilit]
- Shen, W.; Xue, H.; Gao, N.; Shiratori, Y.; Kamiya, T.; Fujiwara, T.; Isobe, K.; Senoo, K. Effects of copper on nitrous oxide (N2O) reduction in denitrifiers and N2O emissions from agricultural soils. Biol. Fertil. Soils 2020, 56, 39–51. [Google Scholar] [CrossRef] [Scilit]
- Black, A.; Hsu, P.-C.L.; Hamonts, K.E.; Clough, T.J.; Condron, L.M. Influence of copper on expression of nirS, norB and nosZ and the transcription and activity of NIR, NOR and N2OR in the denitrifying soil bacteria Pseudomonas stutzeri. Microb. Biotechnol. 2016, 9, 381–388. [Google Scholar] [CrossRef] [Scilit] [PubMed]
- Devaney, D.; Hodson, M.E.; Godley, A.R.; Purdy, K.; Yamulki, S. Impact of sewage sludge applications on the biogeochemistry of soils. Water Sci. Technol. 2008, 57, 513–518. [Google Scholar] [CrossRef] [Scilit] [PubMed][Green Version]
- Sharma, N.; Flynn, E.D.; Catalano, J.G.; Giammar, D.E. Copper availability governs nitrous oxide accumulation in wetland soils and stream sediments. Geochim. Cosmochim. Acta 2022, 327, 96–115. [Google Scholar] [CrossRef] [Scilit]
- Fernández, M.A.; Soulages, O.E.; Acebal, S.G.; Rueda, E.H.; Sánchez, R.M.T. Sorption of Zn(II) and Cu(II) by four Argentinean soils as affected by pH, oxides, organic matter and clay content. Environ. Earth Sci. 2015, 74, 4201–4214. [Google Scholar] [CrossRef] [Scilit]
- Besnard, E.; Chenu, C.; Robert, M. Influence of organic amendments on copper distribution among particle-size and density fractions in Champagne vineyard soils. Environ. Pollut. 2001, 112, 329–337. [Google Scholar] [CrossRef] [Scilit] [PubMed]
- deCatanzaro, J.B.; Hutchinson, T.C. Effects of nickel addition on nitrogen mineralization, nitrification, and nitrogen leaching in some boreal forest soils. Water Air Soil Pollut. 1985, 24, 153–164. [Google Scholar] [CrossRef] [Scilit]
- Covelo, E.F.; Vega, F.A.; Andrade, M.L. Simultaneous sorption and desorption of Cd, Cr, Cu, Ni, Pb, and Zn in acid soils: I. Selectivity sequences. J. Hazard. Mater. 2007, 147, 852–861. [Google Scholar] [CrossRef] [Scilit] [PubMed]
- Covelo, E.F.; Vega, F.A.; Andrade, M.L. Competitive sorption and desorption of heavy metals by individual soil components. J. Hazard. Mater. 2007, 140, 308–315. [Google Scholar] [CrossRef] [Scilit] [PubMed]
- Skiba, U.; Smith, K.A.; Fowler, D. Nitrification and denitrification as sources of nitric oxide and nitrous oxide in a sandy loam soil. Soil Biol. Biochem. 1993, 25, 1527–1536. [Google Scholar] [CrossRef] [Scilit]
- Loick, N.; Dixon, E.; Abalos, D.; Vallejo, A.; Matthews, P.; McGeough, K.; Watson, C.; Baggs, E.M.; Cardenas, L.M. “Hot spots” of N and C impact nitric oxide, nitrous oxide and nitrogen gas emissions from a UK grassland soil. Geoderma 2017, 305, 336–345. [Google Scholar] [CrossRef] [Scilit] [PubMed]
- Chiaravalloti, I.; Epihov, D.; Milliken, E.; Zhang, S.; Woollen, B.; Theunissen, N.; Cota, M.; Beerling, D.; Planavsky, N. (Eds.) Influence of Enhanced Weathering and Copper on Nitrous Oxide Emissions. In Proceedings of the Goldschmidt 2025 Conference; Prague, Czech Republic, 6–11 July 2025. [Google Scholar]
- Bakken, L.R.; Frostegård, Å. Emerging options for mitigating N2O emissions from food production by manipulating the soil microbiota. Curr. Opin. Environ. Sustain. 2020, 47, 89–94. [Google Scholar] [CrossRef] [Scilit]
- Shaaban, M.; Wang, X.-L.; Song, P.; Hou, X.; Wu, Y.; Hu, R. Ascription of nosZ gene, pH and copper for mitigating N2O emissions in acidic soils. Environ. Res. 2023, 237, 117059. [Google Scholar] [CrossRef] [Scilit] [PubMed]
- Lundquist, E.J.; Jackson, L.E.; Scow, K.M. Wet–dry cycles affect dissolved organic carbon in two California agricultural soils. Soil Biol. Biochem. 1999, 31, 1031–1038. [Google Scholar] [CrossRef] [Scilit]
- Black, A.; Wakelin, S.; Hamonts, K.; Gerard, E.; Condron, L. Impacts of long term copper exposure on abundance of nitrogen cycling genes and denitrification activity in pasture soils. Appl. Soil Ecol. 2019, 138, 253–261. [Google Scholar] [CrossRef] [Scilit]

Disclaimer/Publisher’s Note: The statements, opinions and data contained in all publications are solely those of the individual author(s) and contributor(s) and not of MDPI and/or the editor(s). MDPI and/or the editor(s) disclaim responsibility for any injury to people or property resulting from any ideas, methods, instructions or products referred to in the content. |
© 2026 by the authors. Licensee MDPI, Basel, Switzerland. This article is an open access article distributed under the terms and conditions of the Creative Commons Attribution (CC BY) license.