


Abstract
This study aimed to evaluate the comprehensive effects of foliar fertilization on maize-related traits and to identify nutrient-related factors associated with yield variation. A single-site field experiment was conducted during the 2024 growing season using maize cultivar ‘Zhengdan 958’. Two fertilization treatments, conventional fertilization (CF) and conventional fertilization combined with foliar fertilization (OF), were applied, with each treatment consisting of three replicate plots. Thirty variables related to yield, yield components, plant nutrient status, and grain nutrient accumulation were measured and included in subsequent exploratory analyses. Analysis of variance (ANOVA) combined with exploratory multivariate statistical analyses was employed to evaluate treatment effects, examine statistical associations among measured variables, and develop the exploratory yield regression models. Compared with CF, OF significantly increased several yield component traits, including kernels per row, ear length, and grain weight per ear, with increases ranging from 9.8% to 20.5%. OF increased grain nitrogen and carbon accumulation by 17.8% and 26.8%, respectively, and increased maize yield, gross revenue and net profit by 20.3–20.5%. Exploratory multivariate statistical analyses indicated that foliar fertilization under conventional fertilization conditions significantly improved several maize yield-related traits. Grain nutrient accumulation, yield components, and yield and economic performance were all important variables that distinguished fertilization treatments and exhibited progressively increasing relative contributions. Further analyses indicated a hierarchical pattern of statistical associations among yield components, grain nutrient accumulation, and maize yield. Grain nitrogen, phosphorus, and carbon accumulation were nutrient-related variables showing statistical associations with maize yield, and their associations with yield were mainly mediated through key yield components. Among the evaluated nutrient variables, GNA showed a strong mathematically coupled statistical association with GY within the evaluated dataset. These findings provide new insights into the statistical relationships between nutrient accumulation and maize yield under foliar fertilization and may contribute to the optimization of nutrient management strategies in maize production.
1. Introduction
Maize (Zea mays L.) is a major cereal crop in China, and its stable production depends on efficient nutrient management and appropriate agronomic practices [1]. In major maize-producing regions such as Shandong Province, maintaining high and stable maize yields requires improved management strategies that can optimize crop nutrient acquisition and utilization [2]. Therefore, understanding how nutrient management practices affect nutrient accumulation and yield formation is important for improving the efficiency and stability of maize production. However, excessive or inappropriate fertilization practices have contributed to soil fertility decline [3], nutrient imbalance, and reduced nutrient use efficiency [4], thereby limiting maize yield potential and economic returns [5]. Therefore, developing sustainable and efficient fertilization strategies that enhance nutrient utilization and crop productivity has become a major goal of modern maize production systems. Among the various nutrients involved in crop growth, nitrogen is widely recognized as a key nutrient associated with biomass production, nutrient accumulation, and yield formation in maize [2].
Conventional fertilization practices are often associated with high labor requirements, elevated costs, and limited application uniformity, which may negatively affect nutrient utilization efficiency [6]. In contrast, foliar fertilization, owing to its rapid nutrient absorption characteristics and potential for efficient nutrient utilization, has been recognized as an effective strategy for enhancing crop productivity and improving nutrient use efficiency [7]. The increasing adoption of emerging agricultural technologies, particularly unmanned aerial vehicles (UAVs), has further expanded the practical applications and operational efficiency of foliar fertilization [8].
As an effective supplement to soil fertilization, foliar fertilization has been widely adopted to promote crop growth, improve nutrient acquisition, enhance yield formation, and increase product quality. In both horticultural crops (e.g., apple [9] and tomato [10]) and cereal crops (e.g., rice [11] and wheat [12]), foliar application of functional fertilizers has been reported to improve crop productivity through changes in photosynthetic performance, nutrient uptake, and yield-related traits. However, the effectiveness of foliar fertilization is strongly influenced by environmental conditions, nutrient composition, and application timing, resulting in substantial variability in crop responses and yield outcomes [13]. Compared with studies on horticultural crops, research on foliar fertilization in maize has largely focused on individual agronomic responses, whereas the integrated relationships among yield-related traits, yield components, and nutrient accumulation, particularly the relative associations of different nutrient accumulation variables with maize yield, remain insufficiently understood.
Multivariate statistical analysis is an important tool for interpreting complex agricultural data, and has been widely applied in genetic improvement, heavy metal contamination assessment [14], fertilizer evaluation, trait association analysis, and agricultural system assessment [15]. Multivariate statistical approaches, including principal component analysis [3], correlation analysis [16], similarity analysis [17], partial least squares regression analysis [18], grey relational analysis [19], path analysis [20], and regression analysis [21], provide powerful tools for integrating multidimensional trait information and exploring statistical associations among variables associated with crop responses to fertilization. Previous studies have demonstrated that foliar nutrient application can significantly improve maize grain quality [22], while yield and its component traits remain important indicators of overall crop performance [23]. Correlation analyses have shown that 100-kernel weight, ear length, and kernels per ear are strongly associated with maize yield [24], whereas enhanced nitrogen uptake and accumulation, together with increased carbon and potassium accumulation, have been reported to show statistical associations with yield-related traits [25,26]. Grey relational and path analyses further revealed that yield components such as kernel number and grain weight show strong statistical associations with yield, whereas grain nutrient accumulation variables are mainly associated with yield through indirect relationships within the analytical framework, with these relationships requiring cautious interpretation because grain nutrient accumulation is mathematically coupled with grain yield [27,28].
Previous studies have applied correlation analysis, principal component analysis (PCA), regression analysis, and other multivariate approaches to investigate the relationships among maize yield, yield components, and nutrient-related traits. For example, Mazloom et al. used PCA to characterize the relationships among maize yield, yield-related traits, and nutrient concentrations, with the first principal component being mainly associated with yield and nutrient concentration [23]. Long et al. applied multivariate analysis to different maize hybrids and identified grain weight per ear, kernels per hectare, and ear length as important traits associated with grain yield [27]. Similarly, Behpouri et al. reported that kernel weight and kernel number were among the traits most strongly associated with maize yield, whereas nutrient-related variables were primarily associated with yield through grain formation traits [29]. Other studies have also reported positive associations between nitrogen and potassium accumulation and maize yield [28,30,31,32], while carbon accumulation has been positively associated with yield in maize [26,33]. In addition, PCA-based studies have demonstrated that yield-related traits and nutrient concentrations can contribute substantially to the multivariate differentiation of maize performance [22,34]. However, existing studies have generally focused on specific trait groups or individual analytical approaches, and few have integrated grain nutrient accumulation, yield components, and maize yield within a unified multidimensional framework. Therefore, the statistical associations of different grain nutrient accumulation variables with maize yield and key yield components remain insufficiently characterized. To address this gap, the present study integrates multiple complementary multivariate approaches to evaluate foliar fertilization effects and identify variables statistically associated with maize yield.
Using the summer maize cultivar ‘Zhengdan 958’ grown in the Yantai region, this study systematically evaluated the effects of foliar fertilization on maize yield, yield components, and grain nutrient accumulation. Multivariate statistical approaches were employed to integrate multidimensional trait information, evaluate the statistical associations of nutrient accumulation and yield component traits with maize yield, conduct exploratory yield regression analyses, and characterize the statistical relationships among nutrient accumulation, yield components, and maize yield, with particular attention to mathematically coupled statistical associations involving grain nutrient accumulation and yield.
2. Materials and Methods
2.1. Description of the Study Area
The field experiment was conducted at the Yantai Academy of Agricultural Sciences, Fushan District, Yantai, Shandong Province, China (37.49° N, 121.28° E; Figure 1). The region has a temperate monsoon climate. Meteorological data during the maize growing season (23 June–10 October 2024) were obtained from the meteorological station of the Yantai Academy of Agricultural Sciences. During this period, the mean air temperature was 24.61 °C, cumulative precipitation was 585.8 mm, and the mean relative humidity was 83.3% (Figure 2 and Table A1) [35]. One flood irrigation was applied five days after sowing (28 June 2024). These meteorological data provide the environmental context for evaluating the response of maize to foliar fertilization. The soil was classified as brown loamy soil. No fertilizer-related experiments had previously been conducted at the experimental site, and the preceding crop was winter wheat. Before the experiment began, soil samples were taken to determine key physicochemical properties, with the findings summarized in Table 1.
Figure 1.
Location of the field experimental site at the Yantai Academy of Agricultural Sciences, Fushan District, Yantai, Shandong Province, China. (a) Location of Shandong Province in China; (b) location of Yantai City in Shandong Province; (c) detailed location of the experimental site. The gray, black, red, and green areas indicate China, Shandong Province, Yantai City, and Fushan District, respectively. The star indicates the field experimental site (37.49° N, 121.28° E), and the letter “N” on the triangular symbol indicates north.
Figure 2.
Daily variations in air temperature, relative humidity, and precipitation during the 2024 maize growing season. (a) Daily variation in mean, maximum, and minimum air temperatures during the 2024 maize growing season. (b) Daily relative humidity and precipitation during the 2024 maize growing season.
Table 1.
Basic Physicochemical Characteristics of the Soil.
2.2. Design of the Experiment
Two fertilization treatments were established, each with three replicate plots, resulting in a total of six experimental plots arranged in a completely randomized design (CRD). The size of each plot was 40 m2 (5 m × 8 m). In the CF plots, compound fertilizer served as the basal application, with an equivalent volume of water sprayed as the control. In the OF plots, compound fertilizer was used as the basal treatment combined with foliar fertilizer application. The target maize yield was set at 9.5 t ha−1. Based on the nutrient abundance and deficiency index method [36] and fertilizer efficiency optimization principles, the application rates of N, P2O5, and K2O under conventional fertilization were each determined to be 112.5 kg ha−1 based on local conventional fertilization practices. The basal fertilizer inputs were identical between CF and OF, and foliar fertilization represented the only treatment difference. The foliar fertilizer supplied only small additional amounts of nutrients relative to the basal fertilization program, allowing the effects of foliar nutrient supplementation on nutrient accumulation and yield formation to be evaluated. The fertilization scheme is presented in Table 2.
Table 2.
Experimental Treatments and Nutrient Inputs under Different Fertilization Regimes.
2.3. Experimental Materials
The experimental fertilizers included compound fertilizer (N–P2O5–K2O ≥ 15–15–15%, Jiangxi Kaimenzi Fertilizer Co., Ltd., Jingdezhen China) [37] and organic water-soluble foliar fertilizer (organic matter > 100 g L−1, N–P2O5–K2O ≥ 20–2–100 g L−1, density 1.25 kg L−1, Shandong Rongcheng Hongde Marine Biotechnology Co., Ltd., Rongcheng, China) [38]. The foliar fertilizer supplied additional nutrients and was used to evaluate their contribution to maize nutrient accumulation and yield formation.
2.4. Experimental Procedures and Analytical Methods
2.4.1. Fertilization Regimes and Field Management
Following wheat harvest on 23 June 2024, maize was sown under no-tillage conditions with a seeding rate of 25 kg ha−1, a plant density of 54,000 plants ha−1, 49 cm row spacing, and a sowing depth of 4 cm. Compound fertilizer was applied as the basal fertilizer for both treatments using the seed-fertilizer co-application method. According to the maize phenological growth-stage classification, foliar applications were conducted at four key maize growth stages, including jointing stage (V5 stage–V6 stage), small trumpet stage (V8 stage–V9 stage), large trumpet stage (V11 stage–V12 stage), and tasseling–silking stage (VT stage–R1 stage), with a spray volume of 300 L ha−1, and foliar fertilizer was applied at rates of 1.05, 0.6, 0.6, and 0.9 L ha−1 at the respective growth stages to ensure continuous nutrient supplementation during yield formation. In the OF treatment, an organic water-soluble foliar fertilizer was applied, whereas an equivalent volume of water was sprayed in the CF treatment as the control. Maize was mechanically harvested on 10 October 2024. During the experimental period, irrigation, weed control, and pest and disease management practices were applied uniformly across all treatments.
2.4.2. Measurement Indicators and Analytical Procedures
Soil Collection and Physicochemical Property Measurements
Before the start of the experiment, soil samples were collected from the top 20 cm of the plow layer using an “S”-shaped grid sampling method. Ten grid points were established along the “S”-shaped path within the experimental area, and soil samples were collected and mixed to obtain representative composite samples. After air-drying and passing through a 2 mm sieve, 5.00 g of soil was used for pH determination using a pH meter (pH 610, Wigen Technology Co., Beijing, China). A 2.00 g subsample was used to determine AN using the alkali diffusion method. AP was measured by NH4F–HCl extraction, followed by colorimetric analysis using the molybdenum-antimony method on a UV-1100B spectrophotometer (Shanghai Ziqi Experimental Equipment Co., Shanghai, China). AK was measured by CH3COONH4 extraction and quantified using a TAS-990 atomic absorption spectrophotometer (Beijing Puxi General Instrument Co., Beijing, China) [39]. An additional air-dried soil sample was sieved through a 0.149 mm mesh, and 0.200 g subsamples were analyzed for SOM using an elemental analyzer (vario MAX cube, Elementar Trading Co., Ltd., Shanghai, China) [2,3].
Measurement of Maize Grain Yield and Yield Components
At physiological maturity (black-layer stage; 9 October 2024), border rows and 1 m from both ends of each plot were excluded, and the central area (7 m × 4 m) was harvested for grain yield determination, with values standardized to 14% moisture content [2,3,4,40,41]. For each replicate plot, 10 ears were randomly selected as subsamples to determine ear length, kernel rows per ear, and kernels per row. After threshing, cob weight, grain weight per ear, kernels per ear, and 100-kernel weight were determined. The values obtained from the 10 ears within each plot were averaged and used as the experimental observations for statistical analysis [2,4].
Determination of Nitrogen, Phosphorus, Potassium, and Carbon Concentrations in Maize Tissues
Plants were separated into grains, stalks, and leaves, washed with distilled water, blanched at 80–90 °C for 15–30 min in a hot-air oven (DHG-9245A, Changzhou Haibo Instrument Co., Ltd., Changzhou, China), and oven-dried at 65 °C until constant weight was reached. The dried samples were pulverized with a tissue grinder (QE-300, Zhejiang Yili Industrial & Trade Co., Ltd., Jiaxing, China). Following sulfuric acid–hydrogen peroxide digestion in a digestion furnace (KSL-1010, Beijing Tongrunyuan Electromechanical Technology Co., Beijing, China) and subsequent volume adjustment, nitrogen (N) concentration was quantified using an automatic Kjeldahl analyzer (KDY-9830, Beijing Tongrunyuan Electromechanical Technology Co., Beijing, China). Phosphorus (P) concentration was measured by molybdenum–antimony colorimetry using a UV-1100B spectrophotometer (Shanghai Ziqi Experimental Equipment Co., Shanghai, China), while potassium (K) concentration was analyzed by atomic absorption spectrophotometry (TAS-990, Beijing Puxi General Instrument Co., Beijing, China) [2,4,39]. Carbon (C) concentration was determined with an elemental analyzer (Vario MAX Cube, Elementar Trading Co., Shanghai, China) [2,3].
2.4.3. Calculation and Evaluation Methods
GY (t ha−1) = Grain weight (kg)/1000/28 × 10,000
1000, 28 m2, and 10,000 represent the weight conversion factor, effective harvest area, and area conversion factor, respectively. Grain weight was calculated on a 14% standard-moisture basis [2,3,4,40,41]. Abbreviations: GY, grain yield. The same definitions apply hereinafter.
Nutrient accumulation (kg ha−1) = Nutrient concentration (%)/100 × GY (t ha−1) × 1000
100 and 1000 represent the percentage-to-decimal conversion factor and weight conversion factor, respectively. Because grain nutrient accumulation is calculated using grain yield, the resulting nutrient accumulation variables are mathematically coupled with GY and are therefore interpreted as mathematically coupled statistical associations rather than independent biological predictors in subsequent analyses.
GTA (kg ha−1) = GNA + GPA + GKA + GCA
GTC (%) = GTA (kg ha−1)/GY (t ha−1)/1000 × 100%
G denote grain. N, P, K, C, and T denote nitrogen, phosphorus, potassium, carbon, and the total, respectively. C and A denote nutrient concentration and nutrient accumulation, respectively. TC and TA denote total nutrient concentration and total nutrient accumulation, respectively. The same abbreviations apply hereinafter.
GR (CNY ha−1) = GY (t ha−1) × 1000 × 3
The maize price was 3 CNY kg−1. Abbreviations: GR, gross revenue. The same definitions apply hereinafter.
TC (CNY ha−1) = Fertilizer cost + Basal fertilizer application cost + Foliar fertilizer application cost × Number of applications
The prices of compound fertilizer and foliar fertilizer were 5 and 200 CNY kg−1, respectively. The basal fertilizer application cost and foliar fertilizer application cost were 200 and 60 CNY ha−1 per application, respectively. Abbreviations: TC, total cost. The same definitions apply hereinafter. Economic returns were evaluated using a single-season partial budget analysis based on fertilizer costs, fertilizer application costs, and the assumed local maize grain price. Only treatment-specific costs that differed between treatments were included in the economic comparison.
NP (CNY ha−1) = GR − TC
Abbreviations: NP, net profit. The same definitions apply hereinafter.
X i j = (x i j − mean (xi))/stddev (xi)
This equation was used for data standardization in principal component analysis and hierarchical cluster analysis, where X i j denotes the standardized value of the i-th indicator for the j-th sample, while x i j is the corresponding raw value, and stddev represents the standard deviation of the i-th indicator across the dataset.
X TC j = max (xi) − x TC j
For weighted composite index analysis, TC is a reverse-scored indicator, where max represents the maximum value of this variable.
F = f1 i j × M1 + f2 i j × M2 + f3 i j × M3
Only the first three principal components were included in the weighted composite index analysis. F represents the composite score. f1 i j, f2 i j, and f3 i j represent the scores of the j-th replicate of the i-th treatment on PC1, PC2, and PC3, respectively; and M1, M2, and M3 represent the contribution weights of the corresponding eigenvalues.
Y i j = (y i j − min (yi))/(max (yi) − min (yi))
This equation was used for data normalization in grey relational analysis, where Y i j represents the normalized value of the i-th indicator for the j-th sample, y i j represents the original value, and min represent the minimum values of this variable.
Y TC j = (max (y TC) − y TC j)/(max (y TC) − min (y TC))
For grey relational analysis, TC was treated as a cost-type reverse-scored indicator requiring inverse normalization.
2.5. Statistical Analysis and Multivariate Data Processing
Under a Windows operating system, data were processed in Microsoft Office Professional 2013 (v15.0.4420.1017). One-way analysis of variance (ANOVA) was performed to evaluate the effects of fertilization treatments, with fertilization treatment considered as the fixed factor. Shapiro–Wilk normality tests, exploratory multivariate statistical analyses, and graphical visualization were performed using OriginPro 2024 (v10.1.0.178) and GraphPad Prism 2019 (v8.0.2(263)).
3. Results
3.1. Effects of Different Fertilization Treatments on Maize Yield, Economic Benefits, and Yield Components
Different fertilization treatments significantly affected maize yield and economic performance (Table 3). Relative to CF, OF significantly enhanced grain yield (GY) and gross revenue (GR), with both increasing by 20.5% (p < 0.05). Despite a 22.0% increase in total cost (TC) under OF, the gain in net profit (NP) surpassed the added cost by 3749 CNY ha−1, leading to a significant 20.3% increase in net profit. The corresponding raw plot-level data are provided in Table A2.
Table 3.
Maize Yield and Economic Performance under Different Fertilization Treatments.
In terms of yield component traits, OF significantly increased several key yield components, including grain weight per ear (GWE), kernels per row (KPR), and ear length (EL), by 20.5%, 9.8%, and 11.0%, respectively (Table 4). The OF treatment increased kernels per ear (KPE), kernels per hectare (KPH), 100-kernel weight (100-KW), and cob weight (CW) by 9.9%, 10.2%, 10.2%, and 14.2%, respectively, while no significant difference was observed in kernel rows per ear (KRE).
Table 4.
Maize Yield Components under Different Fertilization Treatments.
3.2. Effects of Different Fertilization Treatments on Nutrient Concentrations and Grain Nutrient Accumulation in Maize
Different fertilization regimes resulted in relatively stable nutrient concentrations across maize tissues (Figure 3b–d), whereas grain nutrient accumulation showed pronounced treatment-dependent variation (Figure 3a). Under the OF treatment, grain nitrogen accumulation (GNA), grain carbon accumulation (GCA) and total grain nutrient accumulation (GTA) increased significantly by 17.8%, 26.7% and 18.3%, respectively (p < 0.05), grain phosphorus accumulation (GPA), and grain potassium accumulation (GKA) also increased by 15.1% and 14.0%, respectively. Under the OF treatment, straw N, P, and K concentrations (SNC, SPC, and SKC), together with grain P, grain K, total nutrient concentrations (GPC, GKC, GTC), and leaf C concentration (LCC), were slightly higher than those under CF, whereas the remaining nutrient concentrations were slightly lower. Overall, foliar fertilization was associated with higher grain nutrient accumulation, whereas nutrient concentrations in different maize tissues remained relatively stable across treatments. The raw plot-level data underlying these nutrient concentration and accumulation results are provided in Table A2.
Figure 3.
Nutrient Concentrations and Nutrient Accumulation in Maize Grain, Straw, and Leaves under Different Fertilization Regimes. (a) Grain nutrient accumulation. (b) Straw nutrient concentration. (c) Grain nutrient concentration. (d) Leaf nutrient concentration. L and S denote leaf and straw respectively. The definitions of the abbreviations are provided in Equation (4) of Section 2.4.3. Values are expressed as mean ± standard deviation (SD, n = 3). Different lowercase letters indicate significant differences between treatments at p < 0.05. The same abbreviations apply hereinafter.
3.3. Exploratory Principal Component Analysis of Maize Traits Under Different Fertilization Treatments
Principal component analysis (PCA) was employed to identify the major sources of variation among maize traits and to evaluate the relationships between nutrient-related variables and yield-related traits [42]. The data standardization procedure used for PCA is presented in Table A3. Three principal components, each having an eigenvalue above 1, were identified, together explaining 83.4% of the total variance. The first principal component (PC1) explained the largest proportion of variance (56.2%, eigenvalue = 14.3), with high-loading variables primarily including yield and economic benefit traits, yield components (except KRE), and grain nutrient accumulation indicators. The mean loadings of the top four indicators within these three categories decreased progressively (5.28, 4.75, and 4.60, respectively), suggesting that these categories contributed substantially to PC1. The second principal component (PC2) (28.8%, eigenvalue = 6.8) was primarily characterized by yield component indicators and grain and leaf nutrient concentrations. The third principal component (PC3) (14.9%, eigenvalue = 3.7) was mainly associated with nutrient concentrations in leaves and straw (Table 5). Variables with high loadings were the major contributors to the corresponding sources of trait variation.
Table 5.
Principal Component Eigenvalues, Variance Contributions, Factor Loadings, and Indicator Weights of Maize Traits under Different Fertilization Treatments.
A weighted principal component-based comprehensive evaluation method was employed to integrate multidimensional indicator information and calculate composite scores, thereby quantitatively assessing the overall performance of maize across different fertilization treatments (Table 6). The OF treatment exhibited higher PC1, PC3, and composite scores than the CF treatment, with significantly higher PC1 and composite scores (p < 0.05). The ranking order of PC1 scores was (OF-3 > OF-1 > OF-2) > (CF-3 > CF-2 > CF-1), whereas the ranking order of composite scores was (OF-2 > OF-3 > OF-1) > (CF-1 > CF-3 > CF-2). In contrast, PC2 and PC3 scores did not exhibit stable treatment separation patterns. Overall, the OF treatment showed higher grain nutrient accumulation, better performance in several yield component traits, and higher overall comprehensive evaluation scores than the CF treatment.
Table 6.
Principal Component Scores, Comprehensive Evaluation Scores, and Rankings of Maize-Related Traits under Different Fertilization Treatments.
3.4. Principal Component Score Analysis for Visualizing Trait Patterns Under Different Fertilization Treatments
Principal component score plots simultaneously display sample scores and variable loadings, thereby revealing potential distribution patterns and treatment separation among samples from different fertilization treatments [42]. The two-dimensional biplots included confidence ellipses, whereas the three-dimensional score plots incorporated projection lines to facilitate visualization of sample distribution patterns (Figure 4). In the three-dimensional score plot of all indicators, projection line intersections occurred within the PC1–PC2 plane and PC2–PC3 plane (Figure 4a), which was consistent with the distribution pattern of PC1 and composite scores observed in the comprehensive evaluation (Table 6). In the biplot of yield and economic benefit traits, the confidence ellipses of the two treatments showed clear visual separation, while all indicators exhibited high positive loadings along PC1 and close associations among yield and economic benefit traits (Figure 4b). For the biplots of yield component and grain nutrient accumulation indicators, the confidence ellipses partially overlapped, whereas most variables exhibited high and consistent loadings along PC1, suggesting coordinated variation between grain nutrient accumulation and yield component traits. In contrast, KRE exhibited relatively low loadings and weak correlations with other yield component indicators (Figure 4c,d). For plant nutrient concentration indicators, the confidence ellipses largely overlapped in the three-dimensional plots (Figure 4e,f) and all projection lines intersected in the three-dimensional plots (Figure 4e–g), suggesting relatively limited separation between treatments. Moreover, the loading directions of grain and straw carbon concentration along PC1 differed from those of most other indicators. Overall, yield-related traits exhibited the clearest separation between treatments, whereas plant nutrient concentrations showed comparatively limited variation. Within the present dataset, grain nutrient accumulation variables displayed stronger associations with treatment differences than nutrient concentration variables.
Figure 4.
PCA score plots (2D biplots and 3D score plots) of maize-related indicators under different treatments. (a) Three-dimensional score plot of all indicators; (b–f) two-dimensional biplots of yield and economic benefit traits, yield component traits, and grain nutrient accumulation indicators, and grain and straw nutrient concentration indicators, respectively; (g) three-dimensional score plot of leaf nutrient concentration indicators. The confidence ellipses are presented solely as descriptive visualizations to facilitate visual comparison of treatment distributions and should not be interpreted as inferential statistical confidence regions.
3.5. Similarity and Correlation Analyses of Yield-Related Traits
Indicator-based Hierarchical Cluster Analysis (HCA) and correlation analysis (CA) were conducted to evaluate the statistical associations between maize yield and related variables, and to compare the relationships among yield components and nutrient-related traits within the dataset [16]. The data standardization procedure used for HCA is presented in Table A3. The grain nutrient accumulation–GY relationships interpreted as mathematically coupled statistical associations. The HCA results showed that grain nutrient accumulation indicators were among the variables showing relatively short clustering distances with GY, although these relationships should be interpreted as mathematically coupled statistical associations rather than independent relationships with GY. Within this group, GNA exhibited the shortest clustering distance to GY, followed by GPA, GKA, and GCA. In contrast, plant nutrient concentration indicators exhibited relatively low similarity to GY. KRE exhibited the largest clustering distance from GY, suggesting a relatively weak clustering relationship between KRE and GY (Figure 5a). CA revealed strong positive correlations between yield and economic benefit traits (r = 0.95–1.00, with the corresponding p values below 0.01). Except for KRE, GY showed positive correlations with most yield component indicators. Among these indicators, GWE was strongly correlated with GY (r = 1.00, with p < 0.01 in the present dataset), while KPR and EL were positively correlated to GY (r = 0.83 and 0.87, respectively; with p < 0.05 in the present dataset). Among the grain nutrient accumulation indicators, GNA exhibited one of the strongest positive associations with GY (r = 0.84, with p < 0.05 in the present dataset), together with GCA and GKA, whereas GTA showed a similarly strong association with GY (r = 0.84, with p < 0.05 in the present dataset). These correlations represent mathematically coupled statistical associations because grain nutrient accumulation is calculated using GY. GPA also exhibited a relatively high correlation with GY (r = 0.80). In contrast, plant nutrient concentration indicators showed relatively weak correlations with GY (Figure 5b). Overall, the results of HCA and correlation analysis were generally consistent and suggested that grain nutrient accumulation indicators showed stronger mathematically coupled statistical associations with GY than nutrient concentration indicators within the present dataset. Among the evaluated nutrient accumulation variables, GNA showed the highest correlation coefficient with GY, indicating a strong mathematically coupled statistical association within the evaluated dataset.
Figure 5.
Similarity and Correlation Analyses between GY and Related Indicators Based on Indicator-level HCA and Pearson CA. (a) Circular dendrogram of all indicators (indicator-based clustering), in which all 30 indicators were treated as clustering variables. The dendrogram illustrates the similarity relationships and hierarchical clustering structure among indicators, with branch lengths representing the relative differences between variables. (b) Heatmap of Pearson correlations between GY and related indicators, displaying Pearson correlation coefficients (R) and significance levels (P). Correlation coefficients are represented by colored blocks, with exact R values shown above the diagonal. Asterisks indicate significance levels, where * and ** denote p < 0.05 and p < 0.01, with the same notation used throughout the manuscript.
3.6. Identification of Key Variables Associated with Maize Grain Yield
Grey Relational Analysis (GRA) was employed to quantify the associations between individual indicators and GY [19]. The data normalization process used for GRA is presented in Table A4. Partial Least Squares Regression (PLSR) was used to evaluate the relative statistical associations of yield-related and nutrient-related variables in explaining variations in GY [18], with grain nutrient accumulation variables interpreted as mathematically coupled variables. Using GY as the reference sequence, the GRA results showed that grain nutrient accumulation indicators exhibited substantially stronger mathematically coupled statistical associations with GY than nutrient concentration indicators. Among the nutrient accumulation traits, GNA showed one of the highest association degrees (0.76), exceeding those of GPA (0.73) and GKA (0.74), and was comparable to GCA (0.77), indicating a strong mathematically coupled statistical association within the evaluated dataset. Based on the VIP criterion (>1.0) [14], grain nutrient accumulation indicators were identified as variables showing relatively strong statistical associations with GY variation. Among them, GNA exhibited the highest VIP value (1.25), followed by GCA (1.21), GKA (1.19), and GPA (1.18), indicating relatively strong statistical associations with yield variation among the evaluated nutrient factors. The VIP values and WCD obtained from PLSR and GRA are presented in Figure 6. Notably, discrepancies were observed between the weighted correlation degrees (WCD) and VIP ranking of TC, whereas SNC exhibited a relatively high VIP value but a comparatively low WCD. The remaining plant nutrient concentration indicators generally exhibited low WCD and VIP values. KRE showed a relatively low WCD (0.60) and the lowest VIP value (0.02). Overall, the combined results of GRA and PLSR demonstrated that grain nutrient accumulation indicators showed stronger mathematically coupled statistical associations yield variation than nutrient concentration indicators. Among the evaluated nutrient variables, GNA consistently ranked highest, indicating that GNA showed a strong mathematically coupled statistical association with GY within the evaluated dataset.
Figure 6.
VIP values and WCD of GY-related indicators based on PLSR and GRA. VIP represents the Variable Importance for Projection, whereas WCD denotes the weighted correlation degree. The same applies hereinafter.
Path analysis (PA) was conducted using GY as the dependent variable and yield component traits and grain nutrient accumulation indices as independent variables to quantify their direct and indirect statistical associations with GY [20], with grain nutrient accumulation indices interpreted as mathematically coupled variables. The Shapiro–Wilk test confirmed that the data were normally distributed (p > 0.05), satisfying the assumptions required for path analysis. Among the yield component traits, KPR and EL exhibited relatively high and statistically significant correlations with GY, whereas CW showed a comparatively weak correlation with GY. Overall, the direct effects of these traits were relatively low within the evaluated path model. KPH and 100-KW not only exhibited strong correlations with GY but also showed the highest proportions of direct effects relative to total effects (86.7% and 87.2%, respectively), indicating that they are the primary variables directly associated with GY variation in the evaluated path model. The remaining yield component traits were primarily associated with GY indirectly through their relationships with KPH and 100-KW, with indirect effects ranging from 0.227 to 0.613 (Table 7), suggesting that these two traits served as important intermediate variables within the evaluated statistical relationship network. All grain nutrient accumulation indices exhibited relatively high correlations with GY, representing mathematically coupled statistical associations because these accumulation variables are calculated using GY. Among them, GNA and GCA showed significant correlations, with GNA exhibiting the highest correlation coefficient. For direct effects, GNA, GPA, and GCA accounted for 26.2%, 51.2%, and 70.7% of their total effects, respectively, indicating that these variables represented secondary association factors contributing to maize yield variation. In contrast, GKA showed the lowest direct effect and primarily associated with GY indirectly through its relationships with GNA, GPA, and GCA, with indirect contributions of 17.2%, 34%, and 48.7%, respectively (Table 8). These findings indicate that KPH and 100-KW represented primary association factors, whereas GNA, GPA, and GCA represented secondary nutrient-related variables showing mathematically coupled statistical associations with GY variation.
Table 7.
Path Coefficients of Yield Component Traits Affecting GY.
Table 8.
Path Coefficients of Grain N, P, K, and C Accumulation Traits Affecting GY.
3.7. Exploratory Stepwise Multiple Linear Regression Modeling of Maize Grain Yield
Linear regression analysis (LRA) based on the least squares method was conducted to quantify the linear statistical relationships among variables [21]. Model performance was evaluated using the coefficient of determination (R2), adjusted R2 (R2a), root mean square error (RMSE) [29,43,44], Akaike Information Criterion (AIC), and corrected AIC (AICc) [16]. The results indicated that models simultaneously incorporating KPH and 100-KW consistently achieved the highest apparent statistical fit, whereas models based solely on individual yield components or grain nutrient accumulation variables exhibited substantially lower explanatory power (Table 9). Among all candidate models, the ternary regression model incorporating KPH, 100-KW, and GNA exhibited the highest apparent statistical fit (R2 = 0.99996, RMSE = 0.0000570), followed closely by the binary model including KPH and 100-KW (R2 = 0.99994, RMSE = 0.0000715). However, these exceptionally high R2 values should be interpreted cautiously because the predictors are mathematically related to GY and the analysis was conducted using only six independent experimental plots, and therefore the resulting relationships should be regarded as mathematically coupled statistical associations. Such mathematical coupling and the extremely small sample size may contribute to overfitting and unstable model estimates. Although leave-one-out cross-validation (LOOCV) was used to assess model performance, LOOCV cannot compensate for the extremely small sample size or the limited degrees of freedom associated with only six independent experimental plots. Therefore, the LOOCV results should not be interpreted as evidence of model reliability or stability. Therefore, these results are presented only as exploratory, mathematically coupled statistical relationships within the present dataset rather than evidence of predictive accuracy, model stability, or independent predictive capability. Among the grain nutrient-related indicators evaluated, GNA was retained in the exploratory regression model that showed the highest apparent statistical fit, suggesting a stronger mathematically coupled statistical association yield variation than GPA or GCA within the evaluated models. Three-dimensional response-surface visualization further illustrated that observed data points were closely distributed around the fitted planes of these models, indicating a close fit of the observed data to the fitted planes within the present dataset (Figure 7a–f). Among the univariate nutrient-based models, the GNA model (GY = 0.0654 × GNA + 1.27) showed better apparent statistical fit than the corresponding GCA model, indicating a stronger mathematically coupled statistical relationship between nitrogen accumulation and yield variation. Based on the regression coefficients and their signs, KPH and 100-KW were associated with positive regression coefficients in the ternary model, whereas GNA and GCA were assigned negative coefficients after adjustment for shared variance among predictors. In contrast, both GNA and GCA exhibited positive regression coefficients in the corresponding binary and univariate models. This inconsistency suggests substantial interactions and collinearity among yield components and grain nutrient accumulation variables. Therefore, the statistical association of nutrient accumulation to grain yield variation should be interpreted primarily through its statistical associations with yield-component variables rather than solely through the sign of individual regression coefficients, and it should not be interpreted as evidence of independent predictive importance.
Table 9.
Stepwise Multiple Linear Regression Equations for GY.
Figure 7.
3D Plane Fitting and 2D Linear Regression Analyses of GY under Different Regression Models. (a–f) The 3D plane plots illustrate the fitting performance of the binary regression models; (g,h) the univariate plots present the linear relationships between GY and GNA or GCA.
Further path analysis (PA) of variables retained in the exploratory regression models indicated that 100-KW exhibited the largest direct effect on GY (0.66–0.68), followed by KPH (0.64). Both variables also exhibited moderate indirect effects (0.105–0.111), indicating that they showed both direct and indirect statistical associations with GY through their relationships with other yield-related variables (Table 10, Table 11, Table 12 and Table 13). In contrast, grain nutrient accumulation variables exhibited negligible direct effects (−0.01 to 0.02), despite showing relatively strong mathematically coupled statistical associations with GY and substantial indirect effects. Among the grain nutrient accumulation variables, the magnitude of indirect effects followed the order GNA (0.85) > GCA (0.82) > GPA (0.79), indicating that nutrient accumulation variables were statistically associated with GY mainly through their indirect relationships with KPH and 100-KW within the evaluated path model, while these associations remain mathematically coupled with GY. Notably, GNA was the only nutrient-related variable retained in the exploratory regression model with the highest apparent statistical fit and also exhibited the largest indirect effect among nutrient accumulation variables; however, this pattern should be interpreted as a mathematically coupled statistical association rather than evidence of independent predictive importance. Collectively, these results suggest that maize yield variation was associated with yield component traits and grain nutrient accumulation variables, with the relative statistical associations of the evaluated variables based on their combined direct and indirect effects ranked as 100-KW > KPH > GNA > GCA > GPA. Based on their direct and indirect path effects, 100-KW and KPH were identified as primary variables directly statistically associated with maize yield variation. In contrast, GNA, GCA, and GPA were identified as secondary nutrient-related variables showing mathematically coupled statistical associations with GY through their associations with 100-KW and KPH. KPR, CW, EL, and GKA showed comparatively weaker statistical associations with GY and were therefore described as tertiary auxiliary variables within the hierarchical association framework. Overall, these results revealed a hierarchical association pattern of maize yield variation, highlighting grain nitrogen accumulation showed a strong mathematically coupled statistical association with GY and yield component traits under foliar fertilization within the evaluated dataset.
Table 10.
Path Coefficients of KPH and 100-KW Affecting GY.
Table 11.
Path Coefficients of KPH, 100-KW, and GNA Affecting GY.
Table 12.
Path Coefficients of KPH, 100-KW, and GPA Affecting GY.
Table 13.
Path Coefficients of KPH, 100-KW, and GCA Affecting GY.
4. Discussion
4.1. Yield Enhancement and Grain Nutrient Accumulation Under Foliar Fertilization: Associations Between Nitrogen Accumulation and Yield Formation
Foliar fertilization is widely recognized as an effective supplement to soil fertilization because it can rapidly provide nutrients during critical growth stages, thereby enhancing both crop productivity and nutrient use efficiency [7]. In the present study, foliar fertilization increased maize grain yield by 20.5%, which falls within the 9–30% range reported in previous studies [45,46,47,48,49,50,51,52]. This result confirms the effectiveness of organic water-soluble foliar fertilizers in improving maize productivity and supports their potential role in optimizing nutrient management. The yield-promoting effect observed in the present study may be associated with the presence of organic bioactive compounds. Previous studies have suggested that these compounds may enhance photosynthetic activity, delay leaf senescence, prolong the grain-filling period, and facilitate assimilate production and translocation to developing kernels. However, these physiological processes were not directly measured in the present study and are therefore discussed only as plausible mechanisms supported by previous research. Despite the additional input cost associated with foliar fertilization, the increase in grain yield generated substantial economic returns, resulting in a net profit gain that exceeded the corresponding increase in production cost [50,51,53]. These results suggest that integrating foliar fertilization with rational fertilization strategies not only improves economic returns but also enhances overall system efficiency in maize production, supporting its application in sustainable nutrient management practices.
Maize grain yield is determined by the coordinated regulation of multiple yield components, among which kernel number and kernel weight are generally considered the most important contributors to final yield formation [54]. Kernel rows per ear (KRE) are largely determined during the early stages of ear differentiation and are strongly constrained by genetic potential; consequently, nutrient supplementation during later growth stages is often insufficient to substantially alter this trait, which explains the non-significant treatment effect observed in the present study [55]. In contrast, KPR and 100-KW are closely associated with pollination success, assimilate accumulation, and grain filling, making them more responsive to nutrient availability [56]. Foliar fertilization significantly improved several yield-related traits, including GWE, KPR, EL, KPH, and 100-KW, with increases ranging from 9.8% to 20.5%. The observed increases in kernels per hectare and 100-kernel weight may be consistent with improved source–sink coordination during the reproductive stage. Likewise, previous studies have suggested that improved nutrient supply may sustain leaf photosynthetic activity and assimilate production, thereby contributing to kernel development and grain filling [45,46,57]. However, because source–sink coordination, photosynthetic activity, assimilate production, and grain-filling processes were not directly evaluated in the present study, these explanations should be regarded as plausible mechanisms supported by previous research rather than direct evidence from this experiment.
Regarding plant nutrient traits, foliar fertilization had no significant effect on tissue nutrient concentrations but was associated with increased grain nutrient accumulation, which was mainly related to increases in grain yield and biomass accumulation. Foliar fertilization increased GNA, GPA, GKA, GCA, and GTA by 14.0–26.7%, with significant increases observed in GNA, GCA, and GTA, consistent with previous studies [49,51,53]. From a conceptual perspective, crop nutrient accumulation is generally considered to be related to both tissue nutrient concentration and biomass accumulation. When nutrient concentrations vary only slightly, increases in biomass may still contribute to higher total grain nutrient accumulation, suggesting a pattern in which nutrient accumulation is closely associated with biomass production rather than a specific nutrient concentration response. Foliar fertilization significantly increased nutrient accumulation but had limited effects on tissue nutrient concentrations, consistent with previous reports [2,4,49]. This pattern suggests that grain nutrient accumulation may represent a more informative indicator of maize nutritional status and yield-related responses than tissue nutrient concentrations alone. Integrating foliar fertilization with conventional fertilization can synergistically improve maize yield and grain nutrient accumulation, providing important insights into optimizing fertilization strategies and enhancing agricultural productivity. Among grain nutrient elements, nitrogen showed the most pronounced response, and grain nitrogen accumulation exhibited the strongest statistical association with maize yield among the evaluated nutrient variables.
4.2. Exploratory Multivariate Analysis of Maize Performance Under Foliar Fertilization
Crop responses to fertilization involve variations among multiple physiological and agronomic traits, which can be evaluated using integrated multivariate approaches. In maize fertilization studies, single-indicator evaluation methods are insufficient to fully characterize the variation patterns and relative contributions of multiple traits [2,4]. Therefore, PCA were employed to integrate multiple traits and comprehensively evaluate the overall effects of foliar fertilization on maize growth performance. PC1 accounted for 46.9% of the total variance and represented the principal component explaining the largest proportion of variation among the retained components. The variables with high loadings on PC1 mainly included grain nutrient accumulation, yield components, and yield and economic benefit traits, and the contribution of these variable categories to PC1 showed an increasing trend. Foliar fertilization resulted in higher PC1, PC3 and composite scores in OF treatments compared with CF treatments. The differences in composite scores were primarily associated with variations in yield and economic traits, yield components, and grain nutrient accumulation traits. This suggests that the yield-promoting effect of foliar fertilization arises from coordinated improvements across multiple processes rather than a single trait, thereby systematically enhancing overall maize production performance. These results show partial agreement with previous studies. Mazloom et al. observed that PC1 was mainly associated with yield and nutrient concentration [23], whereas Li, Behpouri, and Kumar found that PC1 was primarily determined by yield component traits such as KPE, EL, and 100-KW [27,29,58]. Building on previous PCA studies incorporating nutrient concentrations [34], this study further included grain nutrient accumulation in the comprehensive evaluation framework and found that it jointly contributed to PC1 together with yield components and yield and economic benefit traits. These results indicate that grain nutrient accumulation showed stronger discriminatory capacity than tissue nutrient concentration indicators for evaluating fertilization treatment differences, providing a new perspective for comprehensive assessment.
The principal component score plots further illustrated the overall separation patterns among fertilization treatments based on multidimensional maize performance indicators. The confidence regions of yield and economic benefit traits were completely separated, whereas those of yield components and grain nutrient accumulation partially overlapped among treatments. These results indicate that differences among fertilization treatments were mainly reflected in yield, economic benefit, yield component, and grain nutrient accumulation traits, with the strongest separation observed in yield and economic benefit traits. These findings are consistent with the non-significant changes in tissue nutrient concentrations and the significant increases in grain nutrient accumulation, yield and economic benefit traits, and yield components. They also correspond to the loading patterns of PC1. Previous studies have shown that foliar fertilization can clearly separate samples in principal component space and improve maize yield and quality performance [22,51]. These findings indicate that grain yield-related traits exhibit strong discriminatory power in multivariate space. However, studies incorporating grain nutrient accumulation into PCA and other multivariate analyses for fertilization evaluation remain limited. Therefore, this study provides an additional analytical framework for the comprehensive evaluation of fertilization treatment differences.
PCA indicated that variation in maize traits was mainly associated with differences in yield-related traits and grain nutrient accumulation characteristics. The foliar fertilization treatment showed higher overall maize performance scores based on the integrated evaluation framework. Yield and economic benefit traits, yield components, and grain nutrient accumulation were the primary indicators associated with treatment discrimination, whereas plant tissue nutrient concentrations showed relatively limited discriminatory capacity. From a trait perspective, yield components and grain nutrient accumulation are quantitative traits that are highly responsive to environmental and agronomic conditions, thereby showing strong explanatory power in integrated evaluations. Therefore, a multivariate framework integrating PCA and composite evaluation with indicators of yield efficiency, yield components, and grain nutrient accumulation provides a robust approach for evaluating fertilization effects and supporting maize management optimization.
4.3. Identification of Hierarchical Yield-Associated Variables and Exploratory Yield Prediction Models
Yield and economic benefit traits increased and showed the highest PCA loadings, together with the clearest treatment discrimination in PCA score plots. Yield components and grain nutrient accumulation variables also increased significantly and showed relatively high PCA loadings, contributing to treatment discrimination in multivariate analyses, although their contributions were lower than those of yield and economic benefit traits. Economic traits showed the strongest correlation coefficients with GY (with p < 0.01 in the present dataset), whereas TC exhibited negative loading on PC1 as a management-controlled variable. Since GR is directly calculated from GY and NP is largely determined by GR [4], these relationships are mathematically expected and should not be interpreted as independent biological evidence. High yield remains the central objective in fertilization evaluation and a dominant focus in maize research [2]. Therefore, GY was selected as the response variable for subsequent association analyses and exploratory yield prediction model development.
Identifying key yield-associated factors is important for evaluating statistical associations between fertilization treatments and maize yield and for improving fertilization and nutrient management strategies. Similarity and correlation analyses demonstrated that GWE, EL, KPR, GNA, GKA, GCA, and GTA were significantly and positively associated with GY (r = 0.81–1.00), whereas KPH, KPE, 100-KW, and GPA also exhibited strong positive correlations with GY (r = 0.75–0.80). These results are generally consistent with Yang et al. [24], who reported positive relationships between 100-KW, EL, KPE, and GY. Previous studies [28,30,31,32] also reported positive associations between nitrogen and potassium accumulation and GY. Carbon accumulation was also positively associated with GY [26,33]. GRA and PLSR consistently identified economic traits, yield components (except KRE), and grain nutrient accumulation as variables showing relatively strong statistical associations with GY, whereas tissue nutrient concentrations showed relatively weaker statistical associations. These findings agree with Long et al. [27], highlighting strong associations of GWE, KPH, and EL with GY. Integrating GRA and PLSR with nutrient accumulation provided a more comprehensive statistical framework for identifying variables associated with maize yield. Overall, economic traits, yield components, and grain nutrient accumulation represented the three major groups of variables associated with GY, showing a decreasing trend in their relative statistical associations. These patterns were consistent with PC1 loadings, and PCA score patterns, supporting the observed statistical associations of yield components and grain nutrient accumulation with GY within the evaluated dataset. These results suggest close statistical associations among yield traits, yield components, and grain nutrient accumulation. These findings suggest a complex pattern of statistical relationships among the evaluated variables associated with maize yield. This provides additional statistical evidence for identifying yield-associated variables using multivariate approaches [2].
Path analysis quantified the direct and indirect effects of individual indicators on GY, allowing comparison of their relative statistical contributions and association patterns with yield. SNC showed low similarity with GY. The correlation between SNC and GY was not significant (r = 0.78, p > 0.05). Discrepancies between VIP and WCD rankings were observed for SNC. GWE and total GTA showed very strong correlations with GY (r = 0.96–1.00), with high WCD and VIP values. Strong collinearity among nutrient accumulation traits [2,4] may inflate direct effects and complicate the interpretation of their statistical associations with GY. KPE showed a low direct effect (−0.37) but a high indirect effect (1.13), mainly mediated by KPH (1.02). KPR, KPH, 100-KW, CW, EL, and individual grain nutrient accumulation traits (GNA, GPA, GKA, and GCA) were included in the path analysis to evaluate their statistical associations with GY, whereas GTA was excluded because it represents the sum of individual grain nutrient accumulation components and may introduce redundancy among explanatory variables. PA showed that 100-KW and KPH exhibited the largest direct associations with GY (86.7–87.2% direct effect), while grain nutrient traits (GNA, GPA, GKA, and GCA) showed comparatively smaller direct associations (26.2–70.7%) within the evaluated path model. Previous studies [59,60] also reported kernel weight and kernel number as variables most strongly associated with grain yield. KPR, CW, EL, and GKA showed weak direct effects but strong indirect effects (0.73–0.89), with most indirect associations occurring through KPH and 100-KW [61]. These results suggest strong statistical interrelationships and multicollinearity among yield components and nutrient accumulation traits, indicating that these variables are closely interconnected within the analytical framework [16].
Multivariate analyses consistently identified variables showing strong statistical associations with GY, reducing redundancy in stepwise regression and improving model interpretability. Significant yield regression models were developed across variable sets and validated using 2D and 3D fitting, illustrating the statistical relationships between predictor variables and GY. Including grain nutrient accumulation variables in stepwise regression expanded the statistical evaluation framework and improved model dimensionality. KPH and 100-KW showed stable positive effects and were consistently retained as the primary explanatory variables in the optimal regression models, consistent with previous studies [28,59,60,61]. Grain nutrient accumulation variables showed weak direct effects, while GNA and GCA displayed unstable coefficients, reflecting multicollinearity among predictor variables. However, the exceptionally high R2 values observed in the exploratory regression models should be interpreted with considerable caution. The apparent goodness of fit may be partly attributable to mathematical relationships between GY and several predictor variables, rather than reflecting independent predictive information. In particular, KPH and 100-KW are fundamental components of grain yield formation, while grain nutrient accumulation variables such as GNA are calculated using grain yield and therefore are mathematically coupled with GY. In addition, the present analysis was based on only six independent experimental plots, which substantially limits the degrees of freedom available for multivariable model estimation. The combination of mathematically coupled predictors, a very small sample size, and multiple candidate variables increases the potential for overfitting and unstable parameter estimates. Therefore, the exceptionally high R2 values, including R2 = 0.99996, should not be interpreted as evidence of excellent predictive accuracy, model stability, or independent predictive discovery. Instead, these models should be regarded strictly as descriptive exploratory results of mathematically coupled statistical associations within the present dataset. Path analysis indicated that KPH and 100-KW exhibited the strongest direct effects (0.64–0.68). GNA, GPA, and GCA were primarily associated with GY through indirect pathways represented by KPH and 100-KW, with comparatively limited direct effects. Results suggest a hierarchical pattern of statistical associations, with yield components (100-KW > KPH) showing the strongest associations with GY, followed by grain nutrient accumulation (N > C > P), and then other traits (KPR, CW, EL, GKA), within the evaluated analytical framework. Behpouri et al. [29] also reported that kernel weight and kernel number were the variables most strongly associated with grain yield, whereas nutrient-related variables were primarily associated with GY through grain formation traits. Wang et al. [57] reported that nitrogen accumulation was primarily associated with GY through indirect pathways involving KPR and KRE (0.48 and 0.89). Ren et al. [62] reported relatively large direct effects of kernel set rate and 100-KW (0.53, 0.26), whereas ear length showed mainly indirect associations with GY. Yang et al. [63] also reported positive direct effects of KPR and 100-KW, while EL showed variable negative effects. Results support a hierarchical pattern of statistical associations, with ear-related traits showing the strongest associations with GY, whereas grain nutrient accumulation was primarily associated with GY through indirect pathways represented by ear-related traits, within the evaluated statistical framework.
The statistical analyses in the present study revealed a strong statistical association between grain nitrogen accumulation (GNA) and grain yield (GY), representing a mathematically coupled statistical association within the evaluated dataset. This association may be consistent with nitrogen remobilization, source–sink coordination, and the supply of nitrogen and assimilates during grain filling. Previous studies have demonstrated that nitrogen remobilization efficiency, nutrient allocation from vegetative organs to grains, and assimilate availability during grain filling are important physiological processes influencing grain formation and yield potential [2]. However, it should be emphasized that the present study did not directly measure nitrogen remobilization efficiency, source–sink dynamics, photosynthetic carbon assimilation, or physiological processes during grain filling. These findings should be interpreted as mathematically coupled statistical associations identified within the analytical framework rather than direct evidence of biological regulation.
4.4. Future Perspectives on Nutrient-Mediated Associations and Applications Under Foliar Fertilization
This study evaluated the effects of foliar fertilization on maize traits and yield-related characteristics, but underlying mechanisms and application frameworks require further clarification.
(1) Further exploration of nitrogen-associated yield formation and nutrient utilization patterns. Future studies should incorporate N-only, P-only, K-only, nutrient-omission, or factorial treatments to better separate and quantify the specific contribution of nitrogen itself. To further clarify the physiological basis underlying nitrogen-associated yield variation, future experiments should also investigate nitrogen remobilization from vegetative organs to developing grains, source–sink relationships, and grain-filling dynamics at critical reproductive stages. In addition, ^15N and ^13C isotope tracing could be used to quantify nutrient utilization and internal allocation processes, including the remobilization and translocation of nitrogen and assimilates from source tissues to developing grains, combined with physiological measurements such as photosynthetic rate and enzyme activity for comprehensive evaluation. Measurements of photosynthetic capacity, nitrogen assimilation and remobilization-related enzyme activities, leaf senescence, and grain-filling rate could help determine whether the observed statistical associations are accompanied by coordinated changes in source activity, sink strength, and nutrient transport. Integrating molecular approaches may further elucidate potential biological processes associated with assimilate accumulation and transport at the genetic level, including the expression of genes involved in nitrogen transport, nitrogen assimilation, carbon metabolism, and assimilate partitioning during grain filling. Such integrated physiological, isotopic, and molecular evidence would provide a stronger basis for distinguishing mathematically coupled statistical associations from biologically plausible mechanisms underlying yield formation.
(2) Improving robustness and generalizability of yield prediction models. Some effects of foliar fertilization on key traits were not statistically significant, suggesting potential context dependence and limited applicability of the current model under broader environmental conditions. Multi-location, multi-year, and multi-variety trials are needed to further validate, refine, and improve the generalizability of yield prediction models.
(3) Experimental design limitations and statistical considerations. The limited number of treatments and replicates may increase the risk of overfitting and reduce model generalizability. Thus, regression equations and path coefficients should be interpreted as exploratory rather than fully predictive. Methods such as VIF and SEM can further improve variable selection and provide additional insights into direct and indirect relationships among indicators.
Precision agriculture technologies (e.g., UAVs) can enhance the efficiency and precision of foliar fertilization. Integrated use of organic and inorganic foliar fertilizers may improve nutrient supply efficiency in maize production. Additionally, aligning peak nutrient utilization periods with key growth stages may help identify optimal fertilization windows and management thresholds, thereby improving the performance of key yield-associated traits, including KPH and 100-KW, and enhancing nutrient accumulation-related characteristics, while concurrently improving auxiliary traits such as KPR, EL, CW, and KRE. Ultimately, this may contribute to improving maize yield potential through more precise nutrient–demand matching. On this basis, a multi-objective optimization framework incorporating “yield–quality–ecology” can be developed to transform fertilization management from empirical practices into data-driven precision management, thereby supporting high-yield, efficient, and environmentally sustainable maize production.
4.5. Methodological Framework and Scientific Contributions of This Study
This study developed a multidimensional integrated evaluation framework for fertilizer effect assessment. In contrast to traditional single-indicator variance-based methods, a multivariate statistical framework integrating PCA, weighted principal component analysis was developed for the integrated evaluation of multiple maize traits. Within this framework, grain nutrient accumulation indicators were integrated with yield components and economic traits, forming a multidimensional structure characterized by “yield–economic benefits–yield components–grain nutrient accumulation”. This framework provides a comprehensive evaluation approach for assessing foliar fertilization effects on maize traits and expands the dimensionality of indicators and analytical approaches for fertilizer evaluation.
This study proposes an integrated framework for identifying key variables associated with maize yield variation. A GY-associated factor framework integrating correlation analysis, similarity analysis, GRA, PLSR-based variable selection, path analysis, and stepwise regression was further developed. To our knowledge, few studies have systematically incorporated grain nutrient accumulation into GY-associated statistical models, extending their application in fertilizer evaluation and nutrient–yield relationship analysis. Hierarchical relationships among maize yield-related variables were evaluated, identifying 100-KW and KPH as primary yield-associated variables, GNA, GPA, and GCA as secondary nutrient-associated variables, and KPR, CW, EL, and GKA as additional associated traits. This hierarchical structure describes the relative contributions of ear structural traits and grain nutrient accumulation to yield variation within the evaluated dataset, providing a statistical basis for interpreting relationships between foliar fertilization, nutrient accumulation, and yield performance. Notably, among all grain nutrient accumulation variables, GNA consistently exhibited stronger statistical associations with GY than GPA and GCA across the multivariate analyses, indicating that nitrogen accumulation showed the strongest statistical association with yield variation among the evaluated nutrient variables. However, because these nutrient accumulation variables are mathematically related to GY, these patterns should be interpreted as dataset-specific mathematically coupled statistical associations rather than independent evidence of biological contribution or predictive importance.
5. Conclusions
Based on a single-site field experiment and exploratory multivariate statistical analyses, this study evaluated the comprehensive effects of foliar fertilization on maize performance, explored nutrient-related associations during maize yield formation, and evaluated the relative statistical associations of different grain nutrient accumulation variables to yield variation through an integrated analytical framework.
Foliar fertilization during critical maize growth stages significantly enhanced yield components and grain nutrient accumulation, particularly GNA, with increases ranging from 9.8% to 26.7%, resulting in a 20.5% increase in maize yield. Multivariate statistical analyses indicated that foliar fertilization substantially improved maize performance. Grain nutrient accumulation and yield components represented the principal variables distinguishing the fertilization treatments. Compared with nutrient concentrations, nutrient accumulation variables exhibited stronger statistical associations with treatment differentiation and were more closely associated with maize yield within the evaluated dataset.
100-KW and KPH were identified as the primary variables directly associated with maize grain yield in the developed statistical models. Grain nutrient accumulation showed predominantly indirect associations with GY through 100-KW and KPH in the path analysis, suggesting secondary statistical associations within the analytical framework rather than independent predictive effects. The statistical framework indicated stronger statistical associations of yield components together with secondary associations of grain nutrient accumulation variables. Within this framework, grain nitrogen accumulation showed the strongest statistical association with maize grain yield among the evaluated nutrient variables (N > C > P > K), representing a mathematically coupled statistical association within the present dataset. The developed exploratory yield regression model provides a quantitative framework for exploring nutrient-related statistical associations with maize grain yield and may provide useful information for future studies on nitrogen management and yield-related responses in maize.
Author Contributions
Conceptualization, Z.Z. and Z.F.; methodology, B.L.; software, Z.Z.; validation, H.C., Z.F. and Z.Z.; formal analysis, H.C.; investigation, W.Z., W.L. and J.Y.; resources, W.Z. and W.L.; data curation, Z.Z.; writing—original draft preparation, Z.Z. and H.C.; writing—review and editing, B.L. and Z.F.; visualization, J.Y. and T.Y.; supervision, H.C.; project administration, B.L.; funding acquisition, Z.Z., B.L. and Z.F. All authors have read and agreed to the published version of the manuscript.
Funding
This research was funded by the Yantai Municipal Bureau of Science and Technology through the Science and Technology Planning Project of Yantai [2023YD079]. The APC was funded by the same project (2023YD079).
Data Availability Statement
The dataset is available upon request from the authors.
Conflicts of Interest
Wei Zhou is employed by Rong Cheng Hong Demanning Biotechnology Co., Ltd. This company provided experimental materials (fertilizers) for this research, but did not financially sponsor our study.
Appendix A
Table A1.
Daily Meteorological Data for the Experimental Site During the 2024 Maize Growing Season (June–October).
Table A2.
The Raw Plot-Level Dataset.
Table A3.
Data Standardization in Principal Component Analysis and Hierarchical Cluster Analysis.
Table A4.
Data Normalization in Grey Relational Analysis.
References
- Tang, H.; Xu, C.S.; Qi, X.; Wang, Z.M.; Wang, J.F.; Zhou, W.Q.; Wang, Q.; Wang, J.W. Study on Periodic Pulsation Characteristics of Corn Grain in a Grain Cylinder during the Unloading Stage. Foods 2021, 10, 2314. [Google Scholar] [CrossRef] [Scilit] [PubMed]
- Zhang, Z.T.; Zhao, J.H.; Jiang, S.; Chen, H.N.; Fan, Z.B.; Leng, W.F.; Yao, J.; Xu, D.S.; Liu, B.Y. Effects of Urea-Formaldehyde Slow-Release Compound Fertilizer on Soil, Crop Yield, Nutrient Uptake and Utilization in Wheat-Maize Rotation System. Jiangsu Agric. Sci. 2025, 53, 108–118. (In Chinese) [Google Scholar] [CrossRef]
- Zhang, Z.T.; Fan, Z.B.; Leng, W.F.; Yao, J.; Yang, T.J.; Zhang, Z.H.; Chen, H.N.; Liu, B.Y. Effects of Silicon-Calcium-Potassium-Magnesium Fertilizer on Wheat Soil, Yield and Nutrient Utilization. Soil Fert. Sci. China 2025, 5, 141–153. (In Chinese) [Google Scholar]
- Zhang, Z.T.; Xu, W.H.; Jiang, X.L.; Sun, X.; Zhang, G.H.; Jiang, Z.W.; Chen, H.N.; Tan, D.S.; Liu, Z.Y.; Yang, J.C. Effects of Organic Fertilizer Instead of Chemical Fertilizer on Maize Growth, Nutrient Absorption and Soil Fertility. Mol. Plant Breed. 2025, 23, 1531–1540. (In Chinese) [Google Scholar] [CrossRef]
- Aliyu, K.T.; Huising, J.; Kamara, A.Y.; Jibrin, J.M.; Mohammed, I.B.; Nziguheba, G.; Adam, A.M.; Vanlauwe, B. Understanding Nutrient Imbalances in Maize (Zea mays L.) Using the Diagnosis and Recommendation Integrated System (DRIS) Approach in the Maize Belt of Nigeria. Sci. Rep. 2021, 11, 16018. [Google Scholar] [CrossRef] [Scilit] [PubMed]
- Wang, J.F.; Wang, Z.T.; Weng, W.X.; Liu, Y.F.; Fu, Z.D.; Wang, J.W. Development Status and Trends in Side-Deep Fertilization of Rice. Renew. Agric. Food Syst. 2022, 37, 550–575. [Google Scholar] [CrossRef] [Scilit]
- Niu, J.H.; Liu, C.; Huang, M.L.; Liu, K.Z.; Yan, D.Y. Effects of Foliar Fertilization: A Review of Current Status and Future Perspectives. J. Soil Sci. Plant Nutr. 2021, 21, 104–118. [Google Scholar] [CrossRef] [Scilit]
- Kannan, S. Foliar Fertilization for Sustainable Crop Production. Sustain. Agric. Rev. 2010, 4, 371–402. [Google Scholar] [CrossRef] [Scilit]
- Xu, H.F.; Li, S.M.; Ma, W.F.; Lu, S.X.; Bian, Z.Y.; Liang, G.P.; Mao, J. Spraying Foliar Fertilizer Affects the Physiological Function of Leaf and Improves the Quality of ‘Snick’ Apple. Plants 2025, 14, 2926. [Google Scholar] [CrossRef] [Scilit] [PubMed]
- Shi, X.D.; Zhang, L.F.; Li, Z.H.; Xiao, X.Y.; Zhan, N.B.; Cui, X.M. Improvement of Tomato Fruit Quality and Soil Nutrients through Foliar Spraying Fulvic Acid under Stress of Copper and Cadmium. Agronomy 2023, 13, 275. [Google Scholar] [CrossRef] [Scilit]
- Song, Y.S.; Dong, M.H.; Gu, J.R.; Jin, X.L.; Hu, Y.J.; Chen, F.; Qiao, Z.Y.; Zhang, T.Z. Synergistic Effects of Combined Foliar Fertilizers on Growth, Stress Tolerance, and Yield of High-Quality Japonica Rice. Int. J. Plant Prod. 2025, 19, 255–268. [Google Scholar] [CrossRef] [Scilit]
- Zain, M.; Khan, I.; Qadri, R.W.K.; Ashraf, U.; Hussain, S.; Minhas, S.; Siddiquei, A.; Jahangir, M.M.; Bashir, M. Foliar Application of Micronutrients Enhances Wheat Growth, Yield and Related Attributes. Am. J. Plant Sci. 2015, 6, 1087–1095. [Google Scholar] [CrossRef]
- Stewart, Z.P.; Paparozzi, E.T.; Wortmann, C.S.; Jha, P.K.; Shapiro, C.A. Effect of Foliar Micronutrients (B, Mn, Fe, Zn) on Maize Grain Yield, Micronutrient Recovery, Uptake, and Partitioning. Plants 2021, 10, 528. [Google Scholar] [CrossRef] [Scilit] [PubMed]
- Shtangeeva, I.; Alber, D.; Bukalis, G.; Stanik, B.; Zepezauer, F. Multivariate Statistical Analysis of Nutrients and Trace Elements in Plants and Soil from Northwestern Russia. Plant Soil 2009, 322, 219–228. [Google Scholar] [CrossRef] [Scilit]
- Honfo, S.H.; Houetohossou, A.; Assogbadjo, A.; Kakaï, R.G. Effective Use of Statistical Tools in Agricultural Sciences: A Critical Review of Multivariate Modelling Methods. J. Appl. Biosci. 2019, 142, 14564–14574. [Google Scholar]
- Zhang, Z.T.; Zhang, Z.H.; Fan, Z.B.; Leng, W.F.; Yang, T.J.; Yao, J.; Chen, H.N.; Liu, B.Y. Comprehensive Analysis of Soil Physicochemical Properties and Optimization Strategies for “Yantai Fuji 3” Apple Orchards. Agriculture 2025, 15, 1520. [Google Scholar] [CrossRef] [Scilit]
- Omar, M.; Rabie, H.A.; Mowafi, S.A.; Othman, H.T.; El-Moneim, D.A.; Alharbi, K.; Mansour, E.; Ali, M.M.A. Multivariate Analysis of Agronomic Traits in Newly Developed Maize Hybrids Grown under Different Agro-Environments. Plants 2022, 11, 1187. [Google Scholar] [CrossRef] [Scilit] [PubMed]
- Shi, F.; Niu, L.Y.; Suh, J.H.; Hung, W.L.; Wang, Y. Comprehensive Metabolomics Analysis of Mandarins (Citrus reticulata) as a Tool for Variety, Rootstock, and Grove Discrimination. J. Agric. Food Chem. 2018, 66, 10317–10326. [Google Scholar] [CrossRef] [Scilit] [PubMed]
- Wang, N.; Xing, Y.Y.; Wang, X.K. Exploring Options for Improving Potato Productivity through Reducing Crop Yield Gap in Loess Plateau of China Based on Grey Correlation Analysis. Sustainability 2019, 11, 5621. [Google Scholar] [CrossRef] [Scilit]
- Kozak, M.; Kang, M.S. Note on Modern Path Analysis in Application to Crop Science. Commun. Biometry Crop Sci. 2006, 1, 32–34. [Google Scholar]
- Li, Y.S.; Xiao, J.N.; Yan, Y.F.; Liu, W.Q.; Cui, P.; Xu, C.D.; Nan, L.J.; Liu, X. Multivariate Analysis and Optimization of the Relationship between Soil Nutrients and Berry Quality of Vitis vinifera cv. Cabernet Franc Vineyards in the Eastern Foothills of the Helan Mountains, China. Horticulturae 2024, 10, 61. [Google Scholar] [CrossRef] [Scilit]
- Crista, L.; Radulov, I.; Crista, F.; Imbrea, F.; Manea, D.N.; Boldea, M.; Gergen, I.; Ienciu, A.A.; Lațo, A. Utilizing Principal Component Analysis to Assess the Effects of Complex Foliar Fertilizers Regarding Maize (Zea mays L.) Productivity. Agriculture 2024, 14, 1428. [Google Scholar] [CrossRef] [Scilit]
- Mazloom, P.; Shojaie, S.H.; Mousavi, S.M.N. Physiological and Biochemical Pathway: Understanding Their Influence on Maize Grain Yield through Genotype–Trait Interactions. Sci. Rep. 2025, 15, 18329. [Google Scholar] [CrossRef] [Scilit] [PubMed]
- Yang, Y.L.; Wen, T.; Wang, H.F.; Ma, J.F.; Shi, X.L.; Yan, S.F.; Mu, X.Y.; Li, C.M.; Zheng, H.Y.; Liu, D.; et al. Response of Maize Varieties with Different Nitrogen Efficiencies to Nitrogen Fertilizer. Agronomy 2026, 16, 109. [Google Scholar] [CrossRef] [Scilit]
- Fan, Y.F.; Wang, Z.L.; Liao, D.P.; Raza, M.A.; Wang, B.B.; Zhang, J.W.; Chen, J.X.; Feng, L.Y.; Wu, X.L.; Liu, C.Y.; et al. Uptake and Utilization of Nitrogen, Phosphorus and Potassium as Related to Yield Advantage in Maize-Soybean Intercropping under Different Row Configurations. Sci. Rep. 2020, 10, 9504. [Google Scholar] [CrossRef] [Scilit] [PubMed]
- Sciarresi, C.; Thies, A.; Topp, C.; Eudy, D.; Kovar, J.L.; Trifunovic, S.; Dixon, P.M.; Archontoulis, S.V. Breeding for High Maize Yields Indirectly Boosting Root Carbon in the US Corn Belt since the 1980s. Field Crops Res. 2025, 323, 109774. [Google Scholar] [CrossRef] [Scilit]
- Long, Y.; Zeng, Y.L.; Liu, X.H.; Yang, Y. Multivariate Analysis of Grain Yield and Main Agronomic Traits in Different Maize Hybrids Grown in Mountainous Areas. Agriculture 2024, 14, 1703. [Google Scholar] [CrossRef] [Scilit]
- Li, R.; Yan, X.; Xia, C.; Tian, A.L.; Sun, G.Q.; Liao, L.Z.; He, R.; Huang, Q.; Yin, X.W.; Li, Q.; et al. Contribution Characteristics of Nitrogen Accumulation and Distribution to Grain Yield of Maize. BMC Plant Biol. 2025, 25, 1377. [Google Scholar] [CrossRef] [Scilit] [PubMed]
- Behpouri, A.; Farokhzadeh, S.; Zinati, Z.; Khosravi, Z. Use of multivariate analysis and machine learning methods to characterize traits contributing to wheat yield diversity. Span. J. Agric. Res. 2023, 21, 901. [Google Scholar] [CrossRef] [Scilit]
- Cui, S.; Liu, S.R.; Zhang, Y.; Zhang, X.Y.; Feng, G.Z.; Wang, S.J.; Gao, Q. Photosynthesis-driven yield improvement in maize under sulfur application: Role of young ear development and grain filling. BMC Plant Biol. 2026, 26, 371. [Google Scholar] [CrossRef] [Scilit] [PubMed]
- Sunaga, Y.; Harada, H.; Kawachi, T. Potassium fertilization and soil diagnostic criteria for forage corn (Zea mays L.) production contributing to lower potassium input in regional fertilizer recommendation. Soil Sci. Plant Nutr. 2015, 61, 957–971. [Google Scholar] [CrossRef] [Scilit]
- Gnanasundari, R.; Sellamuthu, K.M.; Malathi, P. Effect of potassium on growth, yield and NPK uptake of hybrid maize in black calcareous soil. Madras Agric. J. 2019, 106, 32–37. [Google Scholar] [CrossRef] [Scilit]
- Li, Q.; Ren, Y.; Fu, H.; Li, Z.X.; Kong, F.L.; Yuan, J.C. Cultivar differences in carbon and nitrogen accumulation, balance, and grain yield in maize. Front. Plant Sci. 2022, 13, 992041. [Google Scholar] [CrossRef] [Scilit] [PubMed]
- Costa, M.G.; Prado, R.M.; Sarah, M.M.S.; Souza, A.E.S.; Souza Júnior, J.P. Silicon mitigates K deficiency in maize by modifying C, N, and P stoichiometry and nutritional efficiency. Sci. Rep. 2023, 13, 16929. [Google Scholar] [CrossRef] [Scilit] [PubMed]
- China Meteorological Administration. Climate Characteristics of Yantai City, Shandong Province, China. China Weather Network. 2026. Available online: https://www.weather.com.cn/shandong/sdqh/gsqhtd/11/86237.shtml (accessed on 11 August 2026). (In Chinese)
- NY/T 1118-2006; Technical Specification of Balanced Fertilization by Soil Testing. Hubei Provincial Soil and Fertilizer Workstation: Xiaogan, China, 2006. (In Chinese)
- GB/T 15063-2020; Compound Fertilizer. State Administration for Market Regulation. Standardization Administration of the People’s Republic of China: Beijing, China, 2020. (In Chinese)
- Q/1082HDF 003-2021; Organic Water-Soluble Fertilizers. Rong Cheng Hong DE Manine Bio-Technology Co., Ltd.: Weihai, China, 2021. (In Chinese)
- Lu, R.K. Soil Agrochemical Analysis Method, 1st ed.; Zhu, H.Z., He, P.A., Eds.; China Agricultural Science and Technology Press: Beijing, China, 2000; pp. 13–14, 87–89, 150–152, 181–182, 193–195. ISBN 7-80119-925-1. (In Chinese) [Google Scholar]
- Guo, C.; Wang, Y.; Bao, X. No-tillage combined with deficit irrigation improves canopy photosynthesis and water use efficiency to stabilize yield in intercropped maize. Front. Plant Sci. 2025, 16, 1712975. [Google Scholar] [CrossRef] [Scilit] [PubMed]
- Liu, W.; Hou, P.; Liu, G.; Yang, Y.; Guo, X.; Ming, B.; Xie, R.; Wang, K.; Liu, Y.; Li, S. Contribution of total dry matter and harvest index to maize grain yield—A multisource data analysis. Food Energy Secur. 2020, 9, e256. [Google Scholar] [CrossRef] [Scilit]
- Behbahani, B.A.; Yazdi, F.T.; Shahidi, F.; Mortazavi, S.A.; Mohebbi, M. Principal component analysis (PCA) for investigation of relationship between population dynamics of microbial pathogenesis, chemical and sensory characteristics in beef slices containing tarragon essential oil. Microb. Pathog. 2017, 105, 37–50. [Google Scholar] [CrossRef] [Scilit] [PubMed]
- Shu, M.Y.; Zhou, L.; Chen, H.C.; Wang, X.Q.; Meng, L.; Ma, Y.T. Estimation of amino acid contents in maize leaves based on hyperspectral imaging. Front. Plant Sci. 2022, 13, 885794. [Google Scholar] [CrossRef] [Scilit] [PubMed]
- Han, L.; Yang, G.J.; Yang, H.; Xu, B.; Li, Z.H.; Yang, X.D. Clustering field-based maize phenotyping of plant-height growth and canopy spectral dynamics using a UAV remote-sensing approach. Front. Plant Sci. 2018, 9, 1638. [Google Scholar] [CrossRef] [Scilit] [PubMed]
- Zhang, L.Y. Effect of Different Planting Densities and Foliar Fertilisers on Maize Yield Under Pre-Sowing Treatments. Master’s Thesis, Hebei North University, Zhangjiakou, China, 2024. (In Chinese) [Google Scholar]
- Yan, W.; Li, X.J.; Jiang, Y.W.; Huang, M.; Liu, B.; Zhang, C.Y.; Cui, Z.L.; Xue, Y.F. Effects of sowing dates and foliar-applied fertilizers on grain yield and mineral concentrations of different maize varieties. J. Agric. 2024, 14, 1–9. (In Chinese) [Google Scholar]
- Stewart, Z.P.; Paparozzi, E.T.; Wortmann, C.S.; Jha, P.K.; Shapiro, C.A. Foliar micronutrient application for high-yield maize. Agronomy 2020, 10, 1946. [Google Scholar] [CrossRef] [Scilit]
- Tejada, M.; Rodríguez-Morgado, B.; Paneque, P.; Parrado, J. Effects of foliar fertilization of a biostimulant obtained from chicken feathers on maize yield. Eur. J. Agron. 2018, 96, 54–59. [Google Scholar] [CrossRef] [Scilit]
- Ye, D.L.; Yu, Z.X.; Chen, J.J.; Wei, S.F.; Zhang, Z.F.; Huang, S.Y.; Su, D.; Liu, T.D.; Muneer, M.A. Foliar magnesium application improves sweet corn yield: Boosting nutrient uptake and grain carbohydrate under dense planting condition. Front. Plant Sci. 2025, 16, 1499391. [Google Scholar] [CrossRef] [Scilit] [PubMed]
- Jakab, P.; Zoltán, G.; Festő, D.; Komarek, L. Investigation of Foliar Fertilization in Maize Production. Adv. Res. Life Sci. 2017, 1, 1–6. [Google Scholar] [CrossRef] [Scilit][Green Version]
- Jarecki, W.; Borza, I.M.; Rosan, C.A.; Domuța, C.G.; Vicas, S.I. The effect of foliar micronutrient fertilization on yield and nutritional quality of maize grain. Agronomy 2025, 15, 1859. [Google Scholar] [CrossRef] [Scilit]
- Zhang, L.; Zhao, N.; Shang, J.; Wang, S.X.; Zhang, Y.; An, L.Y.; Dang, R.H. Effects of several foliar fertilizers on growth and yield of grain maize. Tillage Cultiv. 2025, 45, 28–30. (In Chinese) [Google Scholar] [CrossRef]
- Ssemugenze, B.; Ocwa, A.; Kuunya, R.; Gumisiriya, C.; Bojtor, C.; Nagy, J.; Széles, A.; Illés, Á. Enhancing maize production through timely nutrient supply: The role of foliar fertiliser application. Agronomy 2025, 15, 176. [Google Scholar] [CrossRef] [Scilit]
- Ruiz, A.; Archontoulis, S.V.; Borrás, L. Kernel weight relevance in maize grain yield response to nitrogen fertilization. Field Crops Res. 2022, 286, 108631. [Google Scholar] [CrossRef] [Scilit]
- An, Y.X.; Chen, L.; Li, Y.X.; Li, C.H.; Shi, Y.S.; Song, Y.C.; Zhang, D.F.; Li, Y.; Wang, T.Y. Candidate loci for the kernel row number in maize revealed by a combination of transcriptome analysis and regional association mapping. BMC Plant Biol. 2019, 19, 201. [Google Scholar] [CrossRef] [Scilit]
- Tang, Y.L.; Guo, J.M.; Jagadish, S.V.K.; Yang, S.J.; Qiao, J.F.; Wang, Y.C.; Xie, K.; Wang, H.; Yang, Q.H.; Deng, L.; et al. Ovary abortion in field-grown maize under water-deficit conditions is determined by photo-assimilation supply. Field Crops Res. 2023, 293, 108830. [Google Scholar] [CrossRef] [Scilit]
- Wang, L.; Lu, N.N.; Song, M.L.; Zhang, Q.J.; Chen, S.L.; Wang, J.F.; Wang, F.W.; Ke, D.D. Effects of fertilizer combined with fulvic acid foliar fertilizer on yield and quality of summer maize. Soil Fert. Sci. China 2026, 1, 175–184. (In Chinese) [Google Scholar]
- Kumar, R.; Chikkappa, G.K.; Singh, S.B.; Mukri, G.; Kaul, J.; Das, A.K.; Sravani, D.; Olakh, D.S.; Bhatia, D. Multivariate analysis for yield and its component traits in experimental maize hybrids. J. Agric. Sci. 2017, 9, 219–225. [Google Scholar] [CrossRef] [Scilit][Green Version]
- Kumar, G.P.; Sunil, N.; Sekhar, J.C.; Chary, D.S. Character association and path coefficient analysis to determine interrelationships among grain yield and its components in maize genotypes (Zea mays L.). J. Sci. Res. Rep. 2024, 30, 1878. [Google Scholar] [CrossRef] [Scilit]
- Reddy, S.G.M.; Lal, G.M.; Krishna, T.V.; Reddy, Y.V.S.; Nalla, S. Correlation and path coefficient analysis for grain yield components in maize (Zea mays L.). Int. J. Plant Soil Sci. 2022, 34, 24–36. [Google Scholar] [CrossRef] [Scilit]
- Pandey, Y.; Vyas, R.P.; Kumar, J.; Singh, L.; Singh, H.C.; Yadav, P.C. Heritability, Correlation and Path Coefficient Analysis for Determining Interrelationships among Grain Yield and Related Characters in Maize (Zea mays L.). Int. J. Pure Appl. Biosci. 2017, 5, 595–603. [Google Scholar] [CrossRef] [Scilit]
- Ren, H.L.; Li, C.X.; Gong, S.C.; Li, G.L.; Hu, G.H.; Wang, M.Q.; Yang, J.F. Genetic Correlation and Path Analysis of Yield and Agronomic Characteristics of Maize Hybrids in SPSS Software. Crops 2019, 3, 86–90. (In Chinese) [Google Scholar] [CrossRef]
- Yang, T.W.; Li, H.; Duan, M.Y.; Shu, Z.B.; Chen, L. Correlation and Path Analysis between Yield and Various Traits of Different Maize Varieties. Tillage Cultiv. 2024, 44, 35–38. (In Chinese) [Google Scholar] [CrossRef]
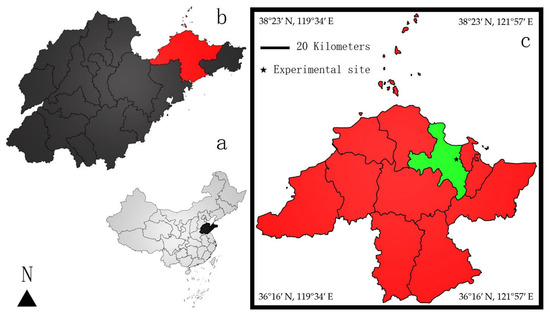
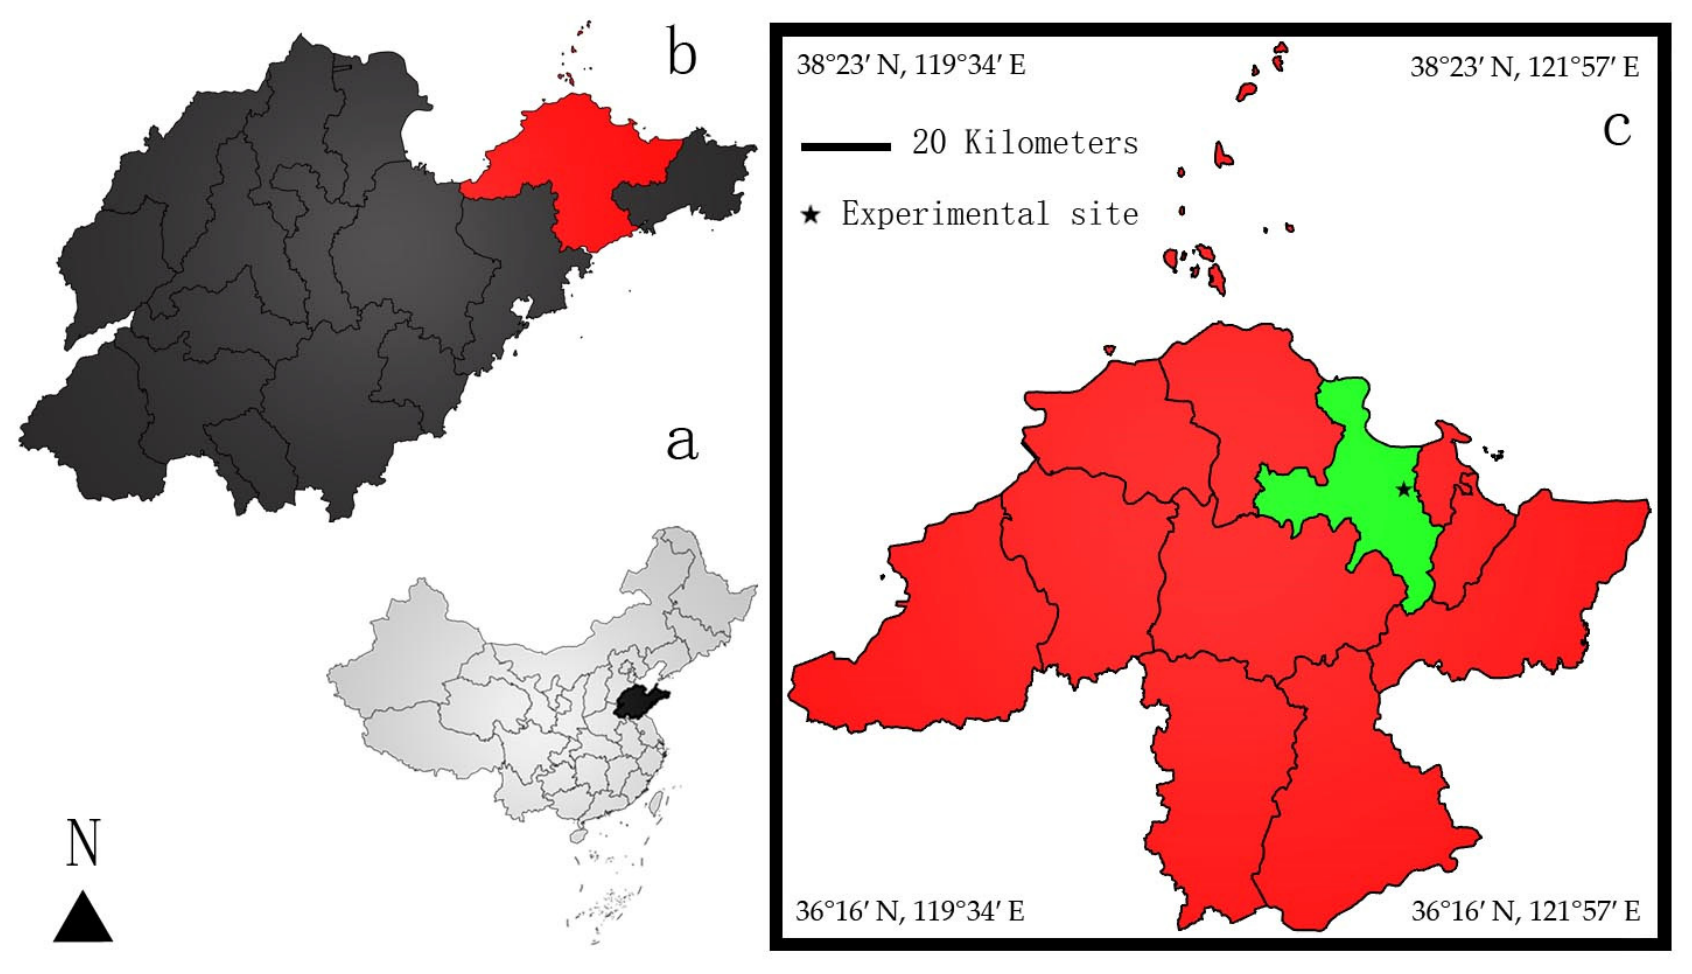
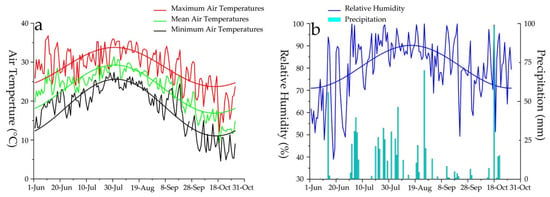
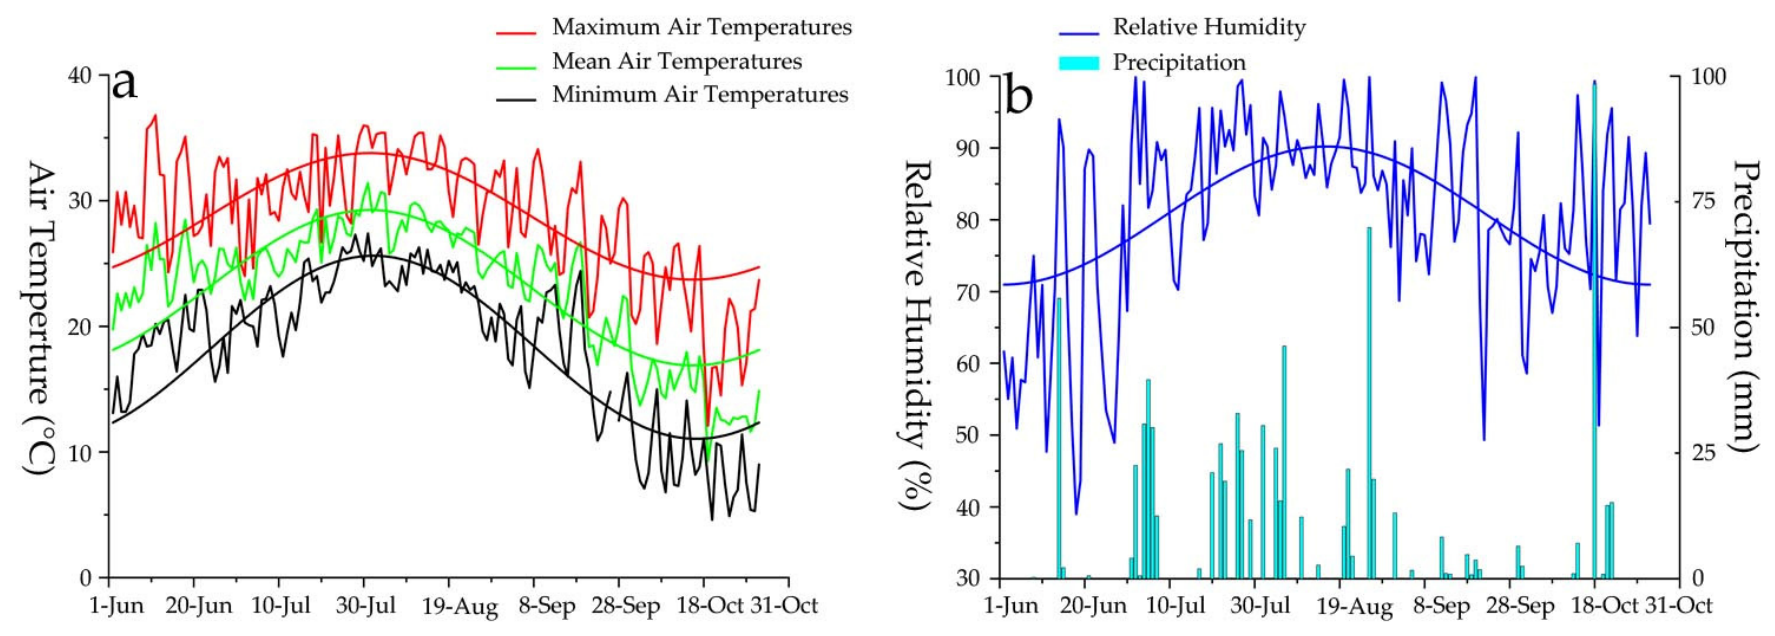
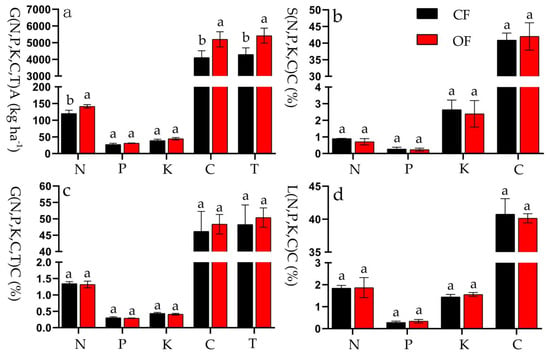
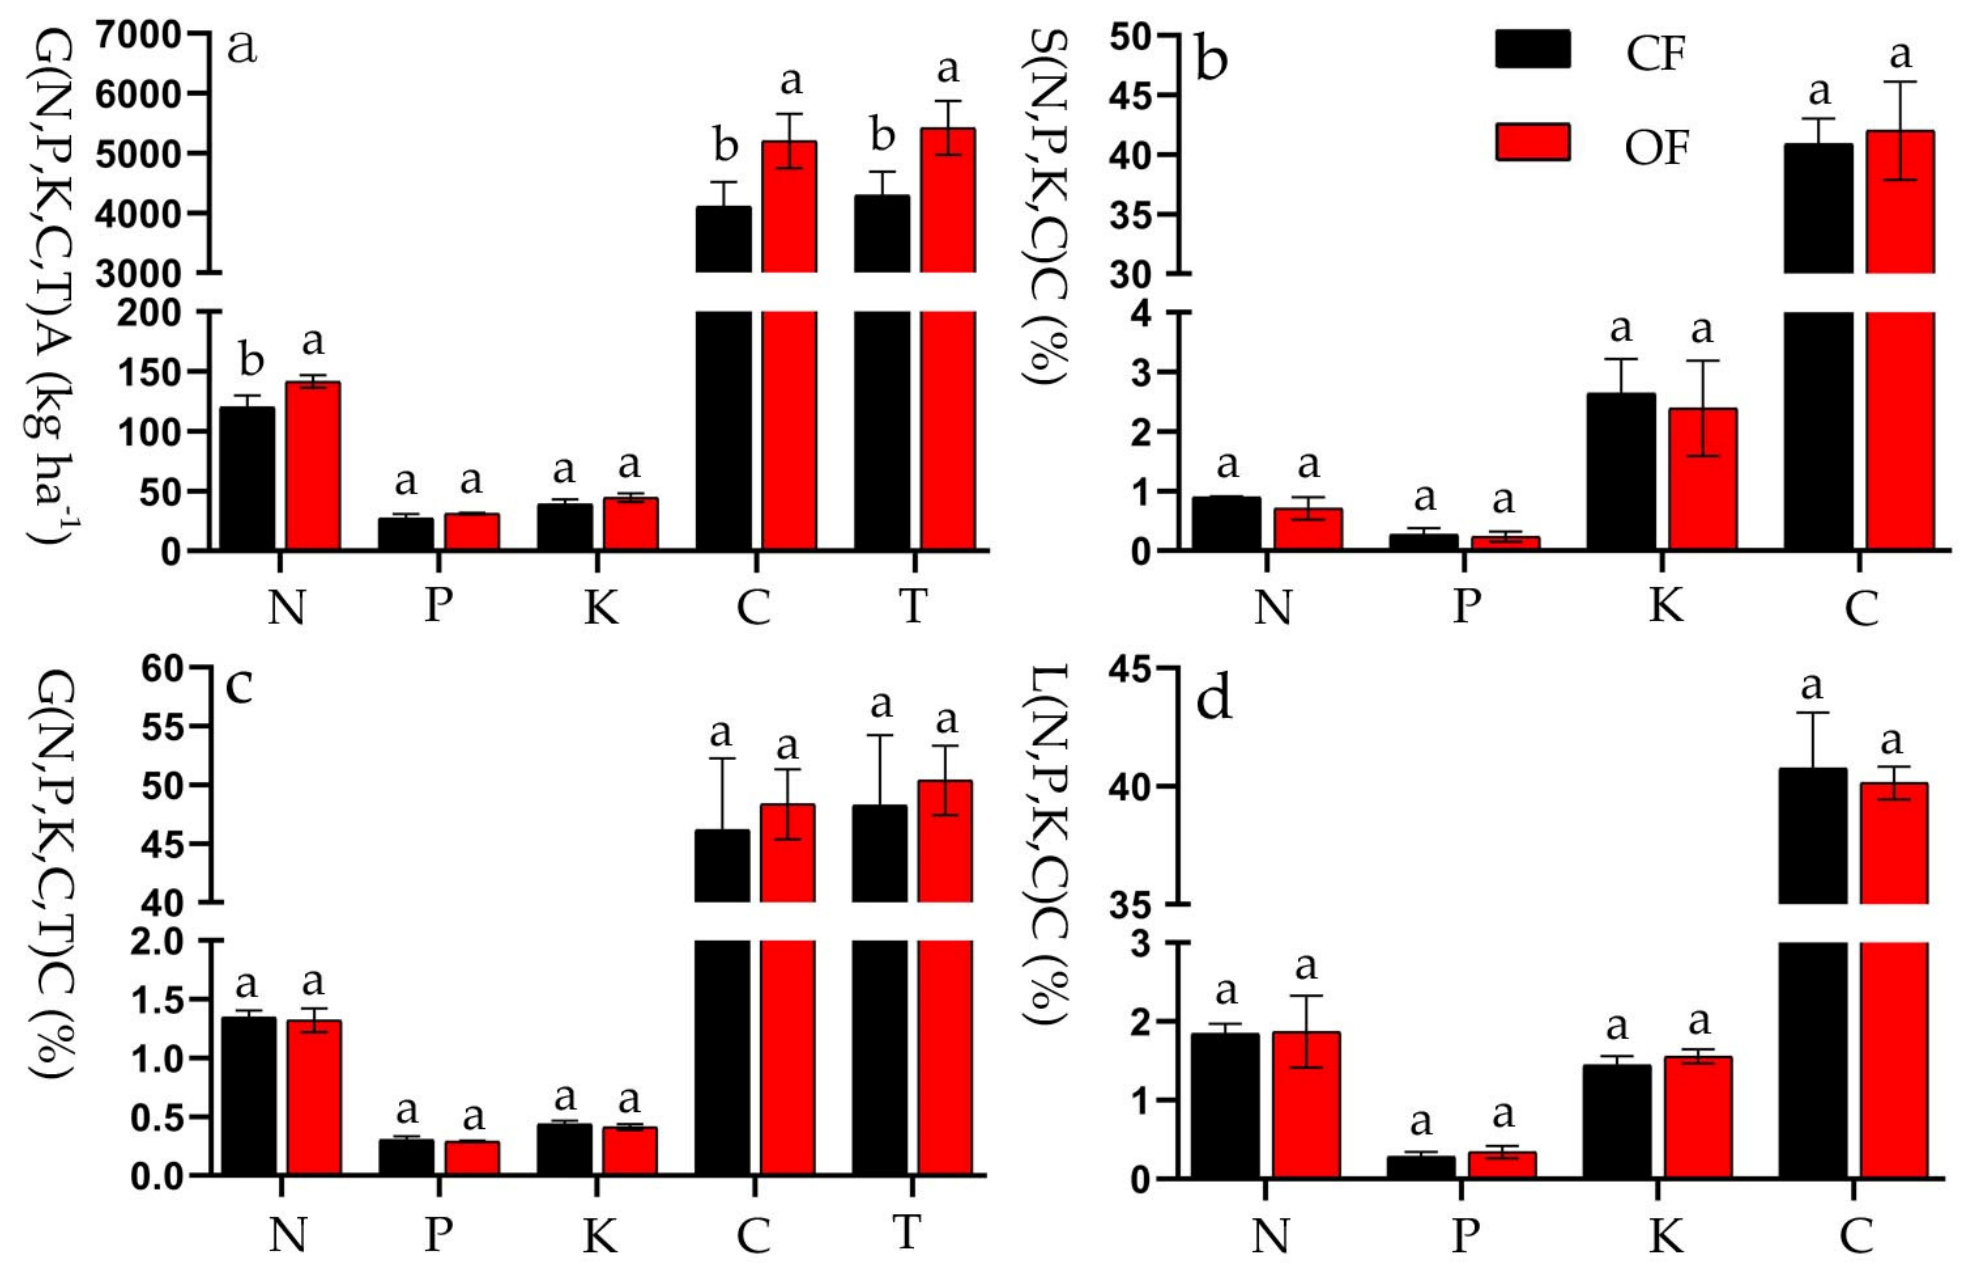
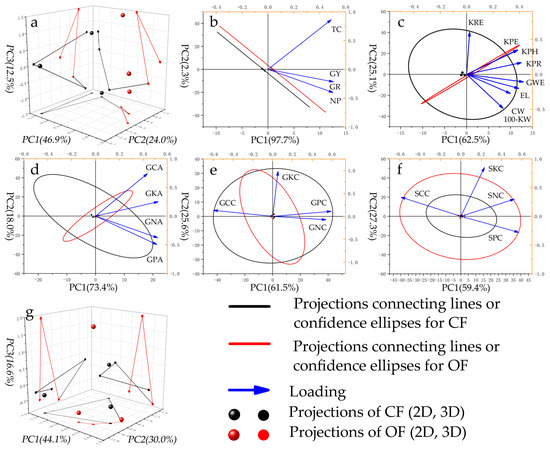
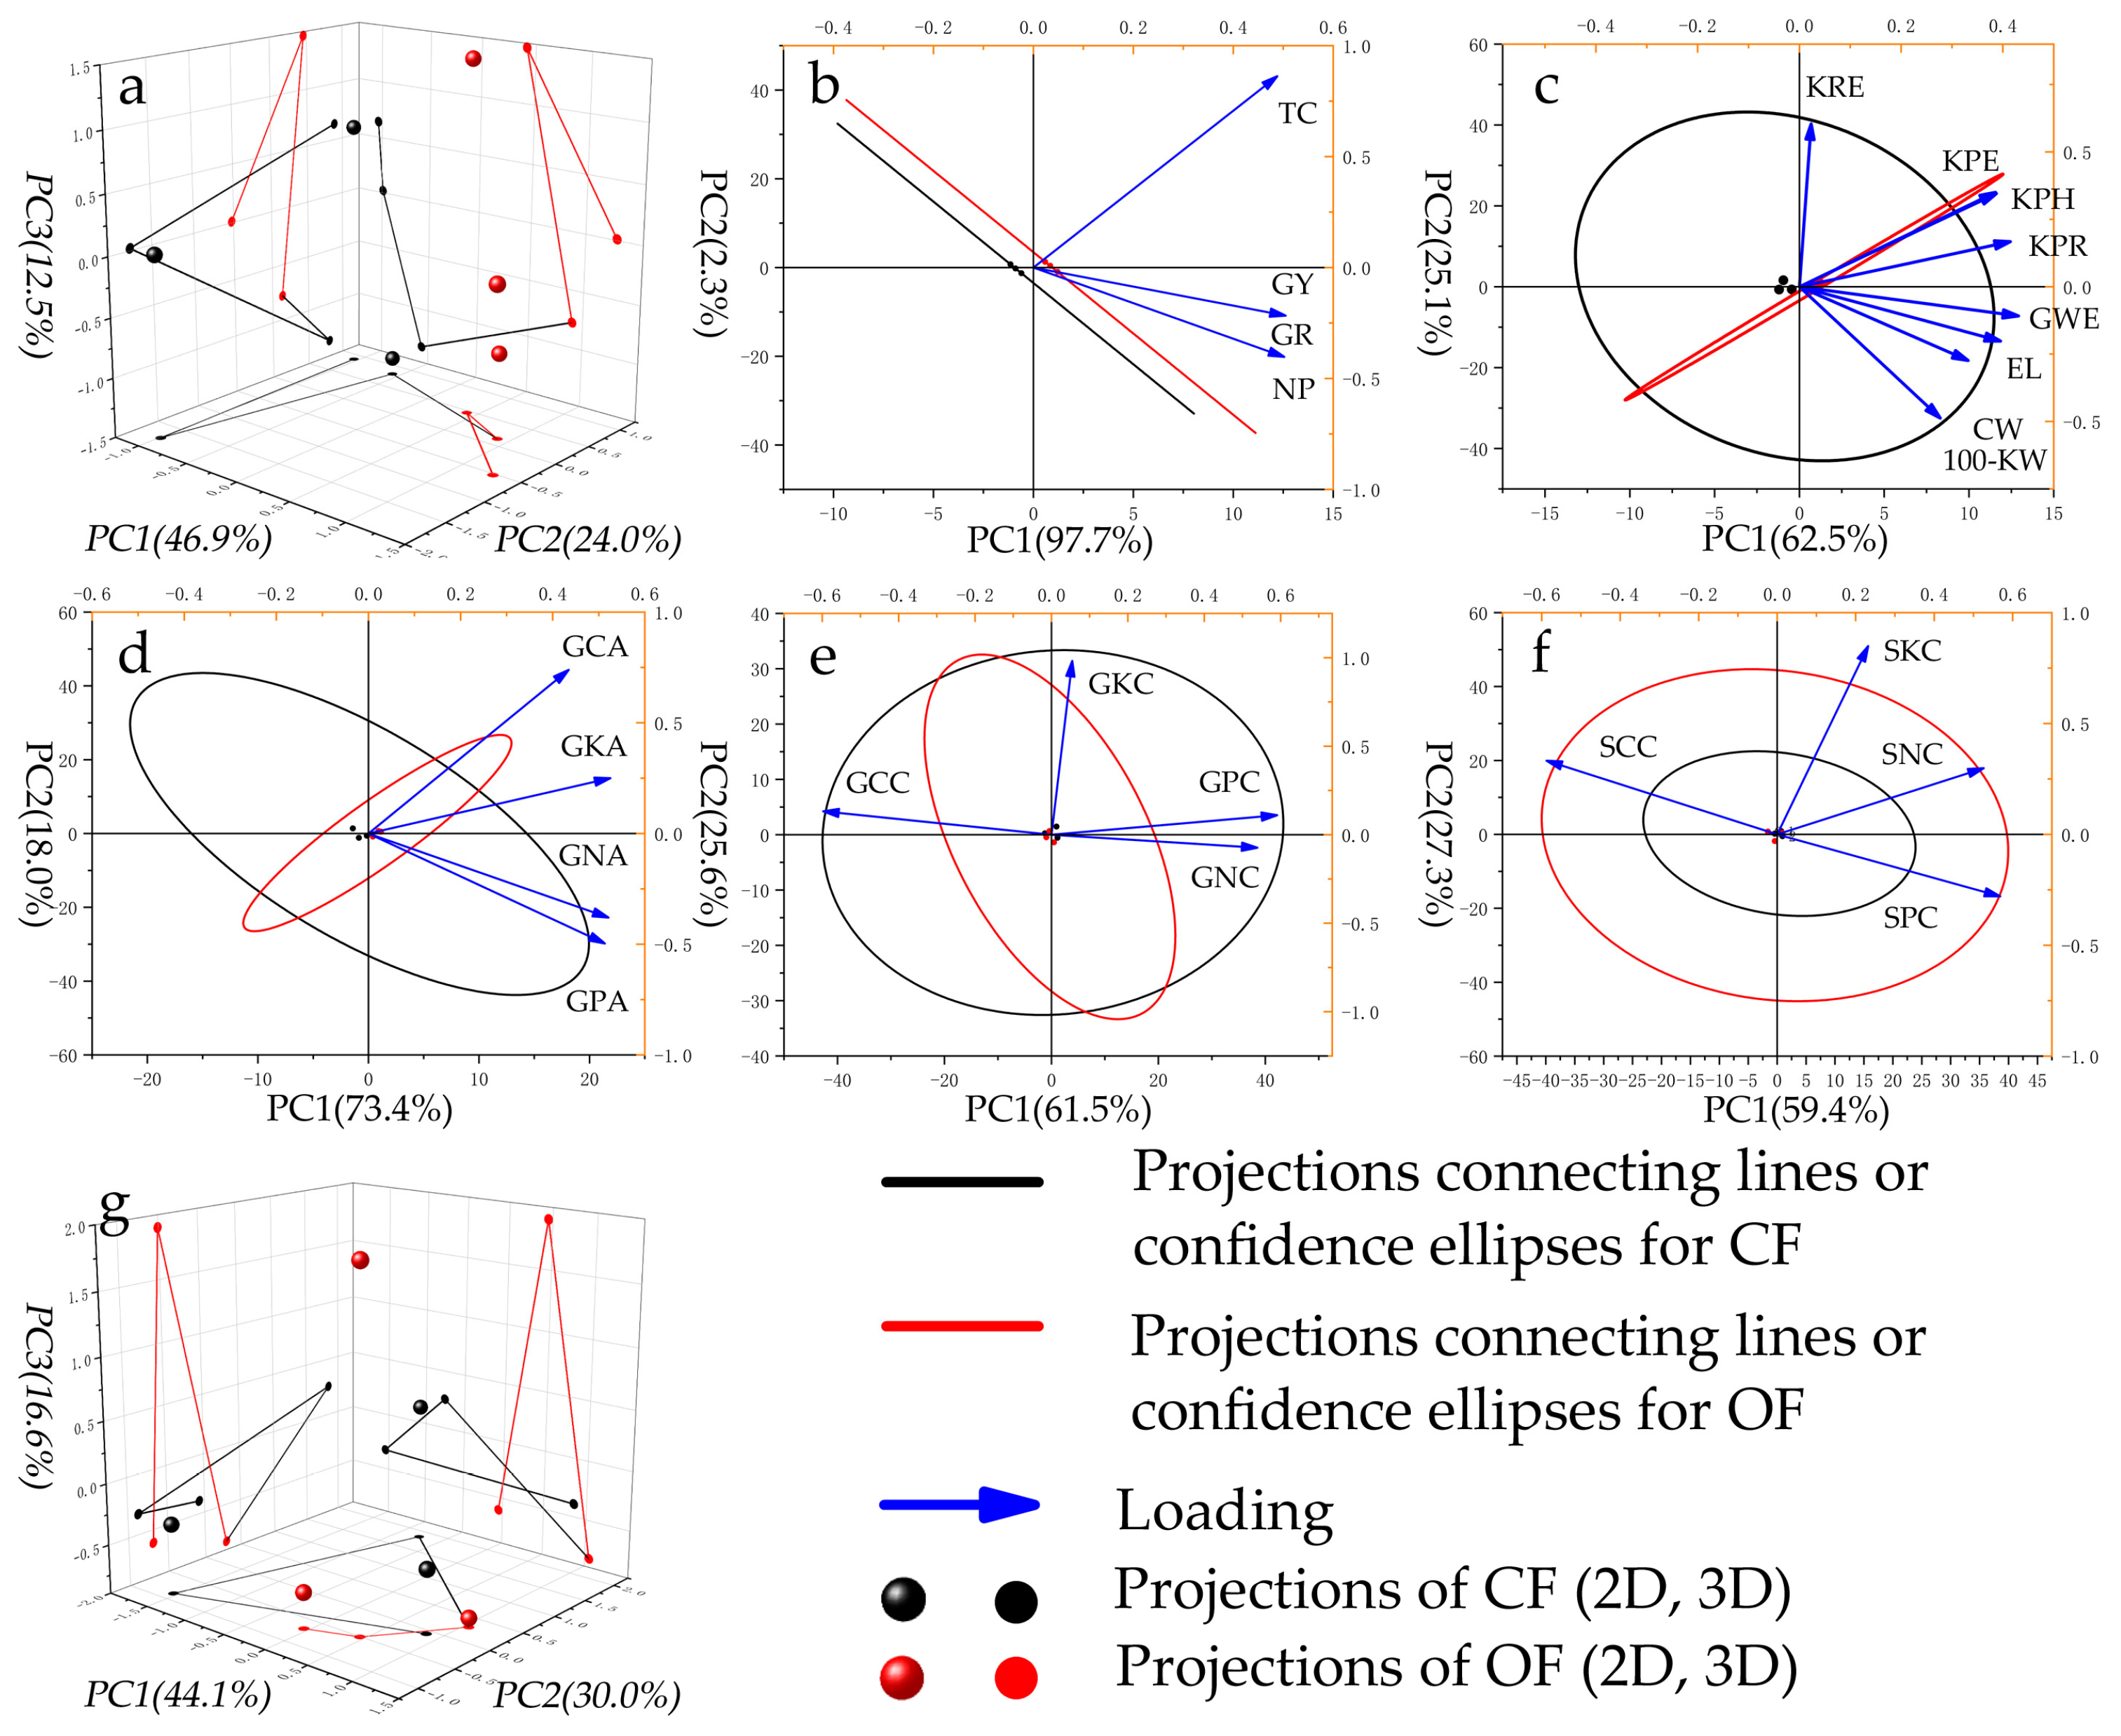
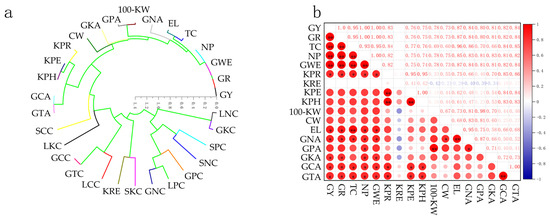
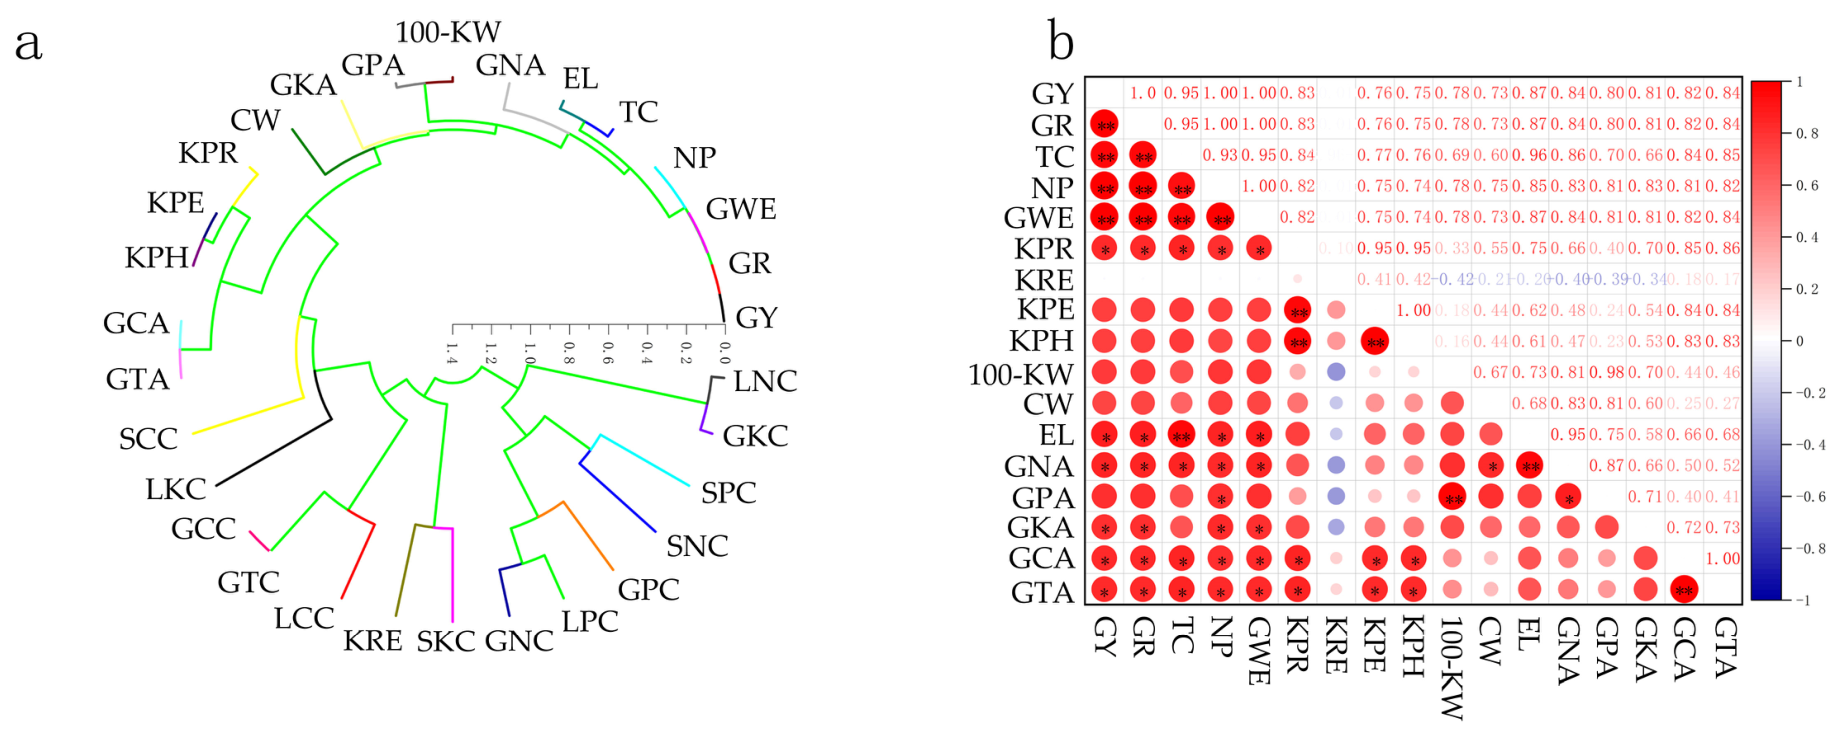
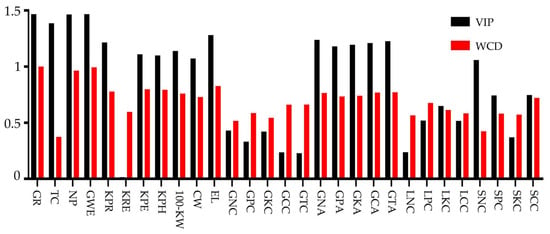
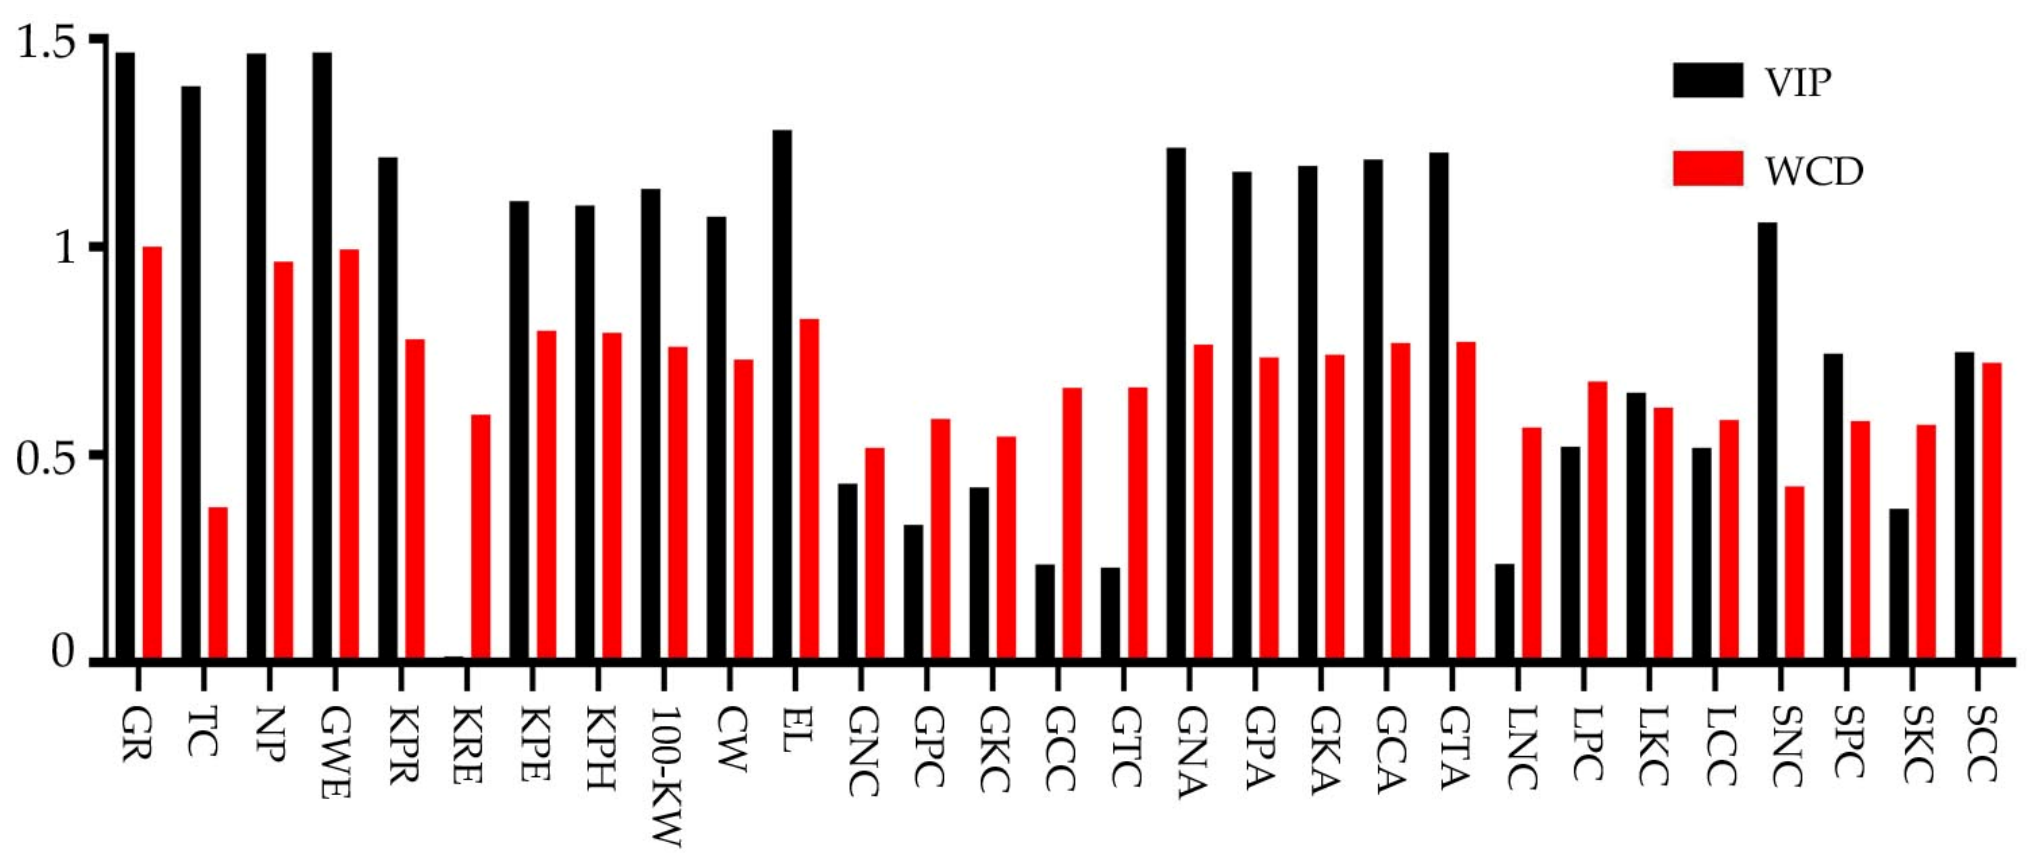
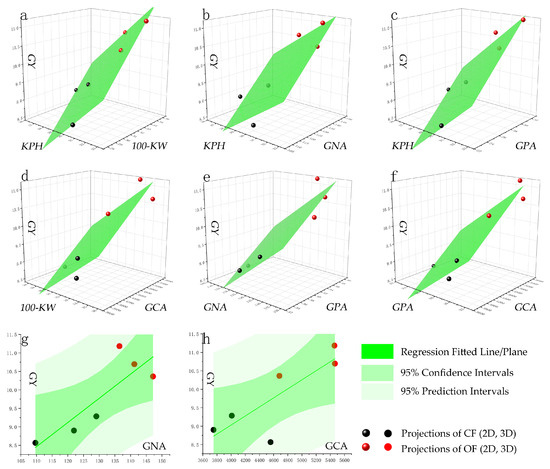
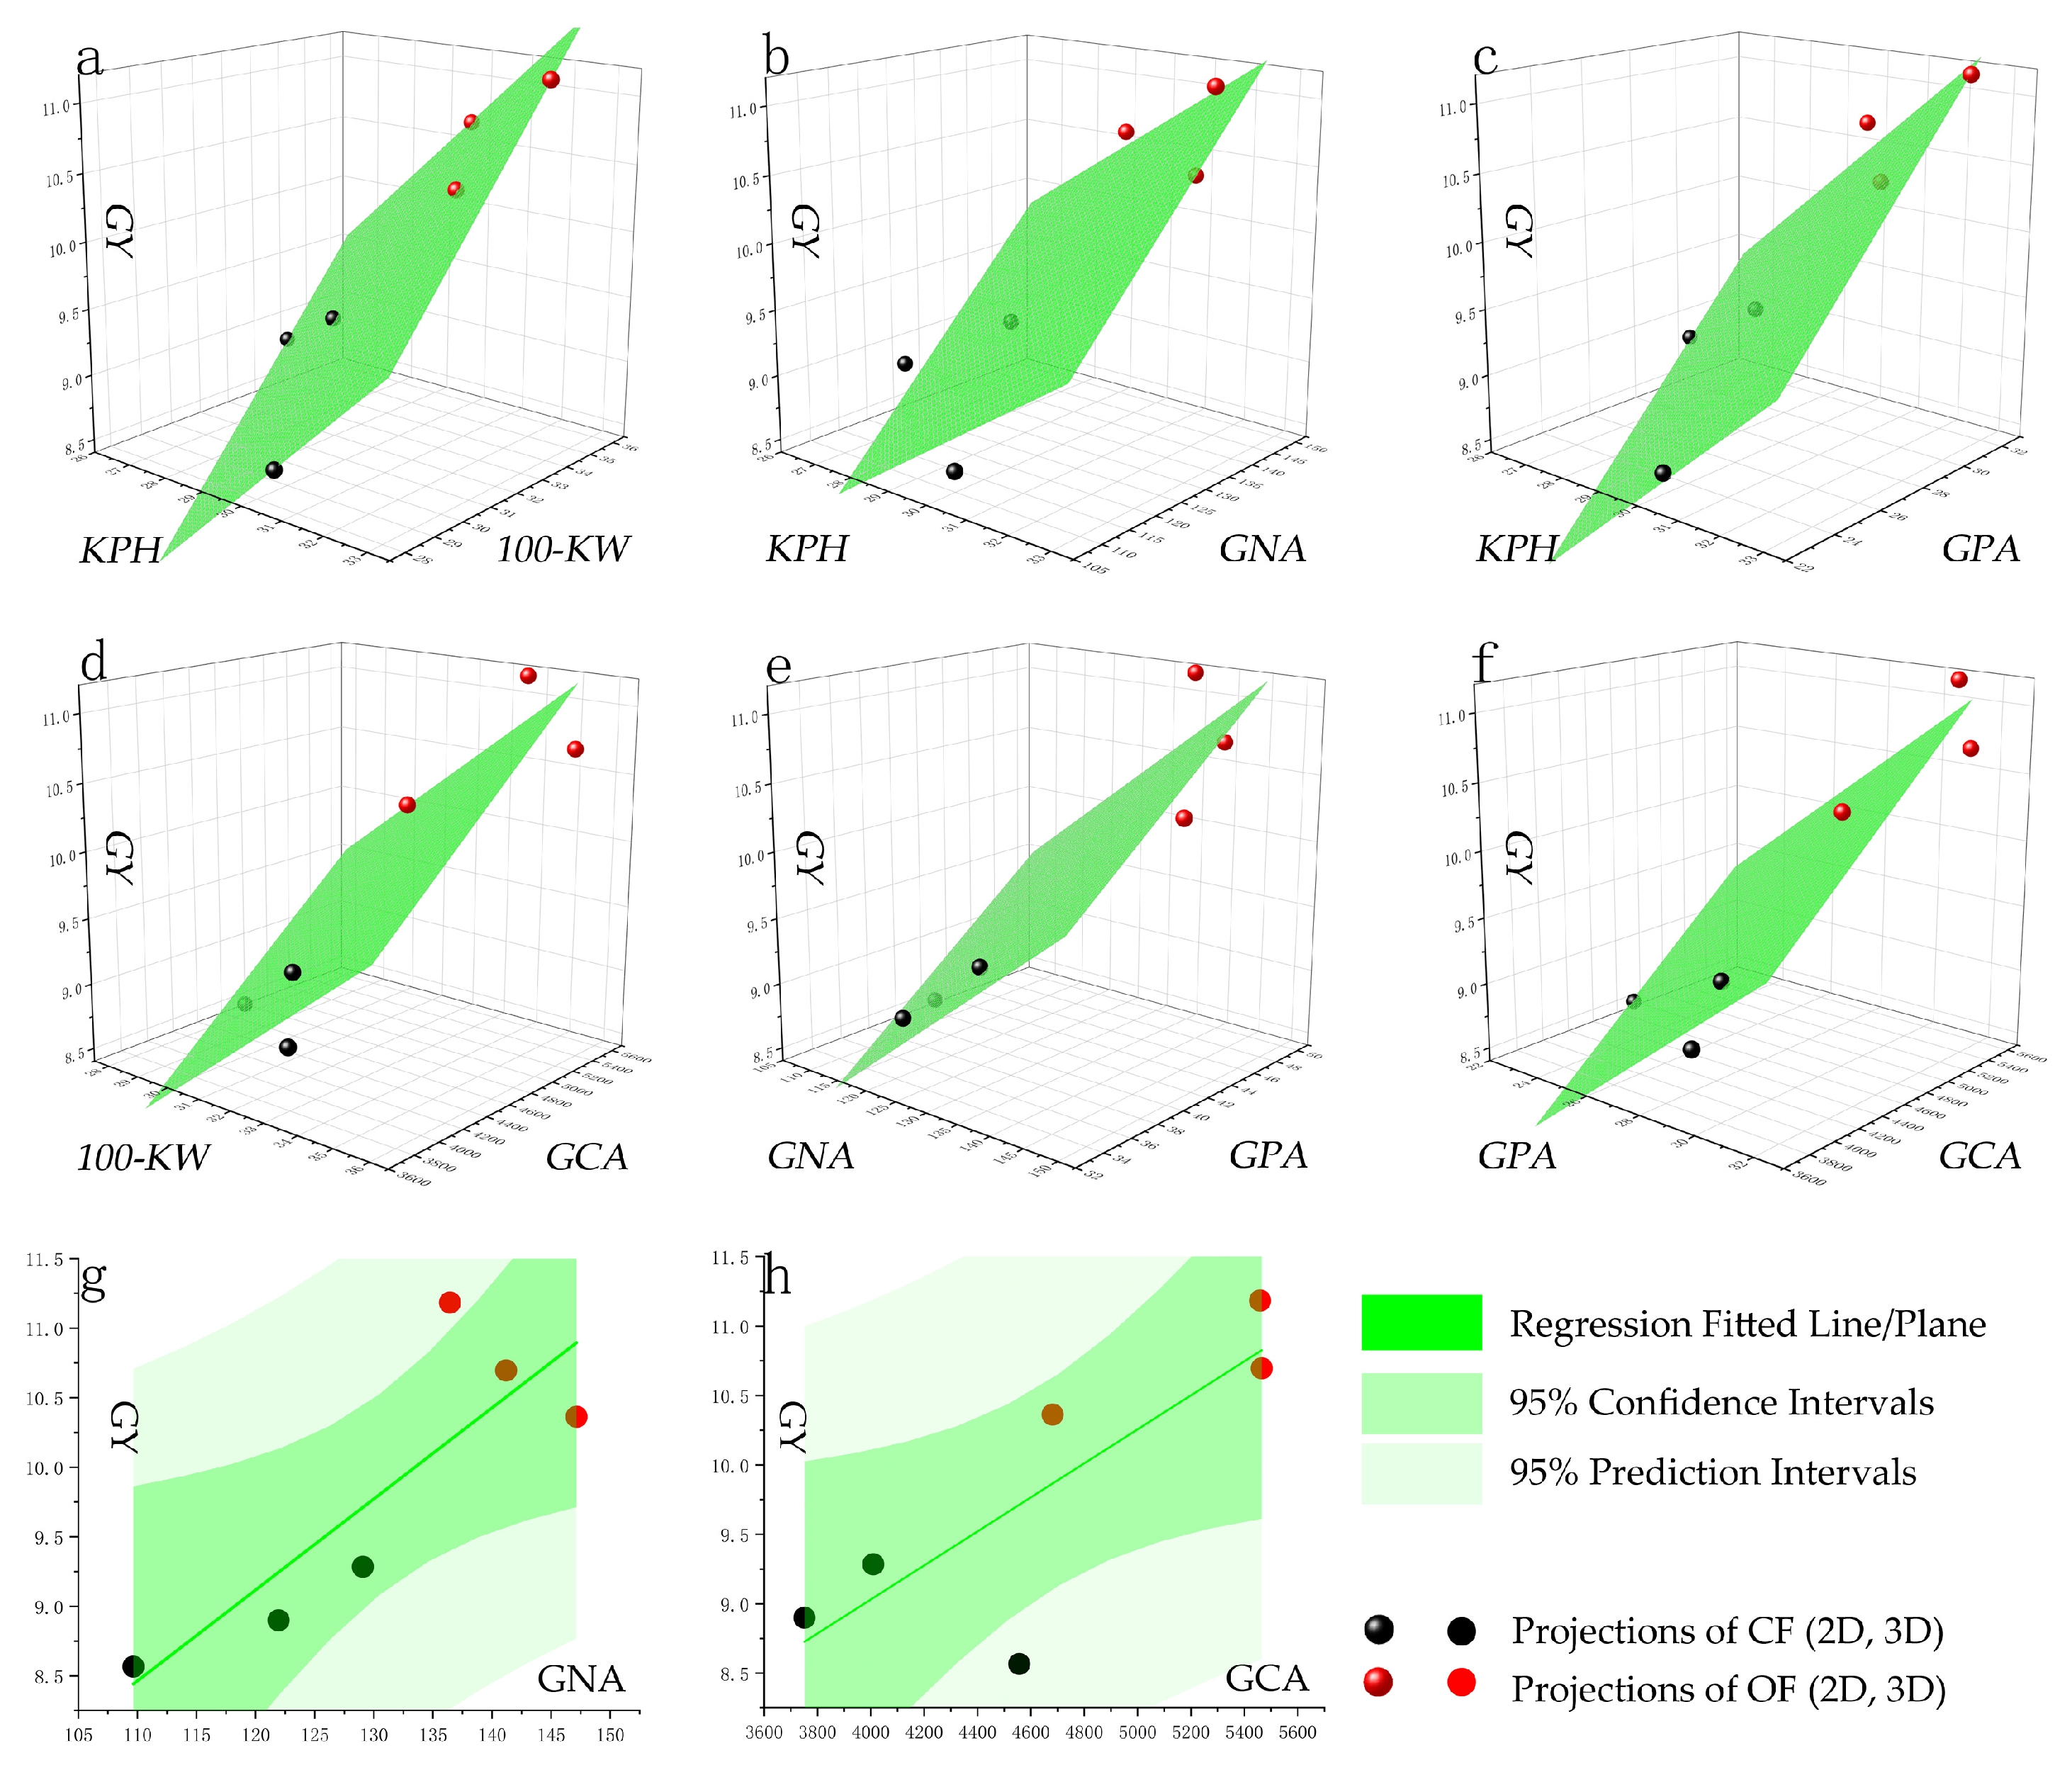

Disclaimer/Publisher’s Note: The statements, opinions and data contained in all publications are solely those of the individual author(s) and contributor(s) and not of MDPI and/or the editor(s). MDPI and/or the editor(s) disclaim responsibility for any injury to people or property resulting from any ideas, methods, instructions or products referred to in the content. |
© 2026 by the authors. Licensee MDPI, Basel, Switzerland. This article is an open access article distributed under the terms and conditions of the Creative Commons Attribution (CC BY) license.