


Abstract
The deep marine shale of the Wufeng–Longmaxi (WF–LMX) Formation in the Sichuan Basin is characterized by laterally continuous thickness, high porosity, and significant gas content, making it a representative shale reservoir with considerable resource potential. This study investigates the heterogeneity of pore structures and their controlling factors using shale samples from three representative wells, based on low-temperature nitrogen adsorption and mercury intrusion data. The reservoir can be classified into three main lithofacies: mixed siliceous shale (MSS), clay-rich siliceous shale (CSS), and siliceous clay mixed shale (SMS). The results show that siliceous shales (MSS and CSS) exhibit higher total organic carbon and quartz contents, with more developed pore systems. Among them, the CSS exhibits the highest specific surface area and the largest mesopore and macropore volumes, indicating a greater development of larger pores and superior reservoir quality. All three shale facies exhibit clear single and multifractal characteristics. The average D1 and D2 values (fractal dimensions from nitrogen adsorption at P/P0 < 0.45 and >0.45, respectively) are higher than DHg, (fractal dimension from mercury intrusion), indicating greater pore-surface roughness than internal pore structure complexity and stronger heterogeneity in larger pores. The D(q)–q spectrum shows a left-wide/right-narrow pattern, whereas the α–f(α) spectrum exhibits the opposite trend. The branch-width ratios Skd and Ska (indices of pore-size distribution complexity and heterogeneity) are both <0.1, suggesting that heterogeneity is more pronounced in low-probability regions. Fractal and multifractal analyses reveal significant pore structure heterogeneity across different lithofacies, with CSS showing relatively more homogeneous pore structures, whereas MSS exhibits stronger heterogeneity and poorer connectivity. The heterogeneity of shale reservoirs is primarily controlled by pore development, especially micropores and mesopores, and is strongly influenced by total organic carbon and quartz content.
1. Introduction
Over 95% of China’s shale gas production comes from the Upper Ordovician Wufeng (WF) Formation and the Lower Silurian Longmaxi (LMX) Formation located in and around the Sichuan Basin [1,2]. By the end of 2023, the Lower Silurian LMX shale had reported proven reserves of nearly 300 billion cubic meters. In 2023, the production from this formation was approximately 25 billion cubic meters, accounting for 10.9% of the country’s total natural gas output [3]. Currently, the main production zones in the Upper Ordovician WF Formation and the Lower Silurian Longmaxi Formation are the medium- to shallow-depth shale gas fields, such as Changning–Weiyuan, Fuling, and Zhaotong, which have achieved commercial development and large-scale production [2,4]. In recent years, significant new discoveries have been made in the deep and ultra-deep regions of the Sichuan Basin, particularly in Luzhou and Nanchuan. The typical example is Well Lu-203, which represents a breakthrough in deep shale gas exploration in China and has expanded the favorable production depth for shale gas in the Sichuan Basin [4,5]. In deep shale formations, temperature, pressure, and stress levels are characterized by unusually high values. Additionally, the reservoir exhibits a complex development of organic matter pores, inorganic mineral pores, and fractures [6,7,8]. The accumulation of shale gas is influenced by the quality of the source rocks and fluid overpressure. In deep reservoirs, the content of free gas is increasing, and with advancements in engineering and transformation technologies, there is significant potential for exploration [9]. There is a consensus that deep shale gas has promising exploration potential. Predictions indicate that the deep and ultra-deep shales of the WF and LMX formations in the Sichuan Basin, buried at depths of 3500 to 5000 m, cover an area of approximately 25,000 square kilometers. The remaining shale gas resources in this region are estimated to be around 1.3 trillion cubic meters, accounting for 51% of the total remaining resources in the WF–LMX formations, making it a significant area for future development [4].
Deep shale reservoirs are affected by conditions of high temperature and pressure at great depths, which complicates the development and connectivity of the nanoscale to microscale pore systems. The strong heterogeneity of the pores and the complex arrangement of pores and fractures make it challenging to preserve shale gas [10,11,12]. Many reports suggest that biogenic silica is fundamental to the distribution and pore development of organic-rich shales. Additionally, fluid overpressure is crucial for maintaining reservoir porosity. The combined effects of these two factors facilitate the development and preservation of high-quality, porous reservoirs in deep and ultra-deep shales [8,13,14,15]. A thorough investigation of the pore structure in shale reservoirs is essential for evaluating the heterogeneity of shale gas wells and guiding exploration in deep shale gas formations. Currently, common methods for quantitatively characterizing the storage space of unconventional reservoirs include image analysis techniques (such as scanning electron microscopy) [15,16], fluid injection methods (like mercury intrusion, low-temperature nitrogen, and carbon dioxide adsorption) [17,18,19], and non-fluid injection methods (including low-field nuclear magnetic resonance, computed tomography, and neutron/small-angle scattering) [20,21]. While these qualitative and quantitative methods can provide a comprehensive characterization of the full pore-size distribution (PSD) in shale, the irregular nature of shale pore systems often deviates from traditional Euclidean geometry, making it challenging to effectively quantify their internal heterogeneity.
Fractal geometry provides an effective tool for quantitatively characterizing the heterogeneity and self-similar features of porous media, and it has been widely applied in the study of pore structures in unconventional reservoirs such as shale [22,23]. The fractal dimension reveals the overall complexity of pore structures and establishes relationships between the physical properties, pore structure parameters, and gas content of different rock types, allowing for a quantitative characterization of reservoir heterogeneity [23,24]. Single fractal models, developed using techniques such as mercury intrusion, image analysis, and gas adsorption, have become important tools for assessing reservoir heterogeneity [23,24,25]. However, the single fractal dimension primarily reflects the overall scale characteristics of the pore system, making it difficult to capture the unevenness of PSD and local variations [26]. To address this limitation, multifractal theory has gradually been introduced into the study of reservoir pore structures [27,28]. Multifractal analysis breaks down the overall fractal structure into multiple subsets with different scale characteristics, allowing for a quantitative representation of local complexity and heterogeneity in PSD, thereby providing a more detailed understanding of spatial differences in pore structure [28,29]. Compared to single fractal analysis, multifractal analysis offers significant advantages in identifying subtle differences in pore structure and characterizing the nature of heterogeneity, providing new avenues for the detailed characterization of pore structures in unconventional reservoirs [29,30,31].
Exploration practices indicate that the WF–LMX shale is a highly enriched system for shale gas resources, characterized by widespread gas presence, extensive distribution of sweet spots, and stable high production from individual wells [3,4]. This study focuses on the WF–LMX deep marine shale in the Sichuan Basin, utilizing a range of analytical techniques including total organic carbon (TOC) testing, X-ray diffraction (XRD), field emission scanning electron microscopy (FE-SEM), low-temperature nitrogen adsorption (LTNA), and high-pressure mercury intrusion (MIP) to systematically characterize the differences in TOC content, mineral composition, and pore structure among various rock types. Based on LTNA and MIP data, a single fractal model is applied to perform fractal fitting of the pore structure, allowing for a quantitative assessment of the heterogeneity characteristics of different shale reservoir types. This research employs the box-counting method for multifractal analysis of the LTNA data, comparing the applicability of single fractal and multifractal methods in characterizing the heterogeneity of shale pore structures. Furthermore, by integrating correlation analysis and principal component analysis, the study explores the intrinsic relationship between pore structure parameters and fractal dimensions in organic-rich shales, identifying the primary controlling factors of heterogeneity in deep marine shale reservoirs. The findings contribute to a deeper understanding of the heterogeneity characteristics of deep shale reservoirs and provide a scientific basis for shale gas exploration and evaluation.
2. Geological Setting
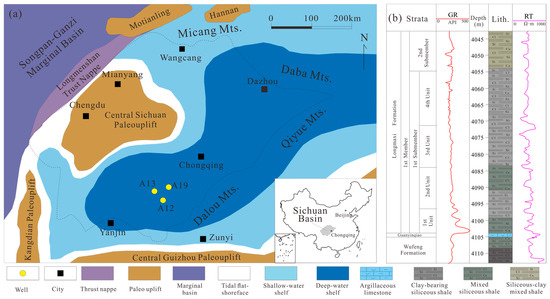
The Sichuan Basin, located in southwestern China, is structurally part of the western Yangtze Plate and is a typical superimposed oil and gas basin. During the Late Ordovician to Early Silurian period, the structural compression from the southeast caused alternating uplift of the ancient uplifts in central Sichuan and the Qianzhong-Xuefeng area, resulting in a semi-closed, stagnant marine basin characterized by a “three uplifts and one depression” configuration (Figure 1a). Two major depression centers emerged in the Weiyuan-Changning area of southern Sichuan and the Fuling-Jiaoshiba region in eastern Sichuan [32,33]. Influenced by two global transgression events, the sedimentation period of the WF–LMX formation transitioned from a deep-water shelf to a gradually evolving semi-deep and shallow-water shelf [34]. As the sedimentary water depth decreased, the abundance of organic matter and silica content steadily declined, leading to the development of clay-rich and silt-rich shales. This is reflected in a sedimentary sequence characterized by a gradual increase in grain size and a transition from darker to lighter colors (Figure 1b). Within the depression centers, high-quality black to gray-black shales are widespread, typically ranging from 20 to 40 m in thickness, predominantly consisting of siliceous and calcareous siliceous shales [34]. The shales exhibit well-developed horizontal layering, abundant with conodont fossils, and show stable planar distribution, making them a key target for shale gas exploration and research in the Sichuan Basin and its surrounding areas [1].
Figure 1.
(a) The sedimentary environment of the study area in the Sichuan Basin. (b) Generalized stratigraphy of the Wufeng–Longmaxi (WF–LMX) Formation in the Sichuan Basin, modified from Well A12.
3. Materials, Experiments and Theories
3.1. Sample and Experiments
The 15 shale samples used in the experiment were collected from three exploratory wells in southern Sichuan (Figure 1a). From each well, one gray-black shale sample was selected from each of the four sections in the WF–LMX Formation. Due to differences in sedimentary environments, the shale samples exhibited significant variations in mineral composition and TOC content. This variability provides a solid foundation for subsequent analyses of reservoir pore structure and heterogeneity.
To systematically characterize the mineral composition, organic matter abundance, and pore structure of the shale samples, a series of experimental tests was conducted, including XRD, TOC analysis, LTNA, MIP, and FE-SEM. Mineral composition was analyzed using an X-ray diffractometer (D8 Advance, Bruker, Karlsruhe, Germany), with all samples ground to less than 200 mesh. The TOC content was measured using a carbon–sulfur analyzer (CS744-MHPC, LECO, St. Joseph, MI, USA), with an analytical accuracy of ±0.3%. These analyses were conducted at the Unconventional Experiment Center of China National Offshore Oil Corporation. Pore structure parameters were obtained through low-temperature nitrogen adsorption experiments using an automatic surface area and pore size distribution analyzer (Autosorb-iQ3, Quantachrome Instruments, Boynton Beach, FL, USA). Prior to the experiments, samples were degassed under vacuum at 110 °C for 12 h to remove surface-adsorbed water and impurities. Nitrogen adsorption–desorption isotherms were then measured.
To quantitatively compare micropore and mesopore structures, the density functional theory (DFT) model implemented in the instrument analysis software (ASiQwin, Version 5.2, Quantachrome Instruments, Boynton Beach, FL, USA) was applied to calculate specific surface area (SSA), pore volume (PV), and PSD. Macropore characteristics were analyzed using a mercury intrusion porosimeter (AutoPore IV 9520, Micromeritics, Norcross, GA, USA). These experiments were conducted at China University of Geosciences to characterize macropore structures. Microscopic pore morphology was observed using FE-SEM. Samples were cut into cubes (1 cm × 1 cm × 1 cm) and polished using an argon ion polishing system to obtain smooth surfaces. High-resolution imaging was performed using a field emission scanning electron microscope (Gemini SEM 500, ZEISS, Oberkochen, Germany), with a maximum resolution of 0.8 nm.
3.2. Fractal Dimension Calculation
3.2.1. Calculation of Fractal Dimension Based on Nitrogen Adsorption Data
The Frenkel Halsey Hill (FHH) theoretical model modified by Pfeifer et al. (1989) [35] can effectively characterize the fractal characteristics of shale pore systems at different scales. The fractal dimension calculation method based on the capillary aggregation mechanism can better reflect the heterogeneity of pore structure in porous media. Therefore, this study adopts this method to calculate the fractal dimension of shale pores, and its expression is as follows.
In the equation above, V represents the volume of gas adsorbed at an absolute pressure of P (units: ml/g). P0 denotes the saturation vapor pressure (units: MPa). D is the fractal dimension. C is a constant. For the calculations, a scatter plot was created with ln(lnP0/P) on the x-axis and lnV on the y-axis, where the fitted slope corresponds to the value of D. According to the FHH model, the fractal dimension of shale reservoirs ranges from 2 to 3. A higher value indicates greater complexity and irregularity in the pore system [27,36,37].
3.2.2. Calculation of Fractal Dimension Based on High-Pressure Mercury Intrusion Data
The fractal dimension represented by the capillary bundle model typically shows a strong correlation with reservoir physical properties and pore structure characteristics, making it widely used in single fractal studies based on high-pressure mercury intrusion PSD data [29,36]. This study employs a capillary bundle fractal model based on mercury saturation to characterize the meso- and macropore structures in shale, with the fundamental expression provided below.
In the equation, SHg represents the volume fraction of mercury that occupies the pores (units: %), which is equivalent to the PV fraction. Pc denotes the capillary pressure (units: MPa), which corresponds to pore size. Based on the equivalent relationship between capillary pressure and pore size, the equation can typically be further transformed [35].
In the equation above, r represents the pore radius (units: nm). rmax denotes the maximum pore radius (units: nm). s indicates the cumulative PV percentage corresponding to the pore radius r. D is the fractal dimension of the porous material. Therefore, the fractal dimension D can be calculated from the slope of the linear relationship between lg(dV/dp) and lgp. To distinguish it from the fractal dimension calculated using low-temperature nitrogen adsorption data, this study designates the fractal dimension derived from high-pressure mercury intrusion data as DHg. Furthermore, acknowledging the limited measurement accuracy of the high-pressure mercury intrusion method at small pore scales [36], and considering the primary PSD characteristics of the studied object, this study focuses solely on fitting and analyzing the fractal dimensions of pores within the range of 50 to 3000 nm.
3.3. Multifractal Theory
Multifractals are characterized by two equivalent mathematical descriptions: the generalized fractal spectrum D(q)–q and the multifractal spectrum α–f(α). In the context of gas adsorption, the multifractal dimension is typically calculated using the box-counting method [30,36,38]. Relative pressure is divided into several equal-length boxes, with the box size denoted by ε. A mass probability function is defined for each box of size ε, which is used to quantitatively analyze the distribution characteristics of gas adsorption within each box.
Ni(ε) represents the amount of gas adsorbed in the i-th box. Nt denotes the total amount of gas adsorbed. For the i-th interval of size ε, can also be defined using an exponential function, as shown in the following equation.
In the equation, represents the singularity strength, which reflects the local singularity of the mass probability function [39]. The value of is related to the actual position of the observed box within the fractal image. If we denote the number of subintervals with the same probability marked by α as , then as the size ε of the partition’s decreases, increases, meaning that grows as ε becomes smaller [40]. Therefore, can be expressed by the following equation.
f(α) represents the dimension of fractal subsets marked by different singularity indices α. The curve formed by α and f(α) is known as the multifractal singularity spectrum, which is used to examine the uneven distribution characteristics of gas adsorption within fractal structures. The singularity index α(q) and f(α) can be determined using the Chhabra and Jensen method [41], with the following expressions provided.
represents the order of the statistical moment, which can range from −∞ to +∞. In this study, is selected as integers within the range of −10 to 10, with an interval of 1. For multifractals, can be defined as the partition function, with the following expression provided.
τ(q) denotes the q-th order mass moment, where different values of q correspond to distinct generalized fractal dimensions. The function τ(q) can be utilized to compute another set of generalized fractal dimensions, D(q). There exists a relationship between q and D(q), as shown below [34,37].
When q ≠ 1 and q < 0, it reflects the PSD characteristics in low porosity regions. Conversely, q > 0 highlights the PSD characteristics in high porosity regions [42]. When q = 1, L’Hôpital’s rule is applied to ensure the continuity of the singularity spectrum and the generalized dimension spectrum in order to determine the generalized fractal dimension. This results in a set of points (q, D(q)), which can then be used to construct the generalized fractal dimension spectrum D(q)–q. Specifically, when q is 0, 1, and 2, they correspond to the capacity dimension D0, the information dimension D1, and the correlation dimension D2 [30].
To develop a multifractal model based on nitrogen adsorption, this study uses the relative pressure (P/P0) as the total interval L, which is defined as J = [0.005, 0.99]. The interval is first interpolated into 64 subintervals to ensure sufficient data density, with each subinterval containing at least two measurement points. Following the box-counting method, the interval J is further divided into N(ε) = 2k boxes of size ε, where ε = L/2k, enabling a multi-scale analysis of the pore size distribution. In this study, k values of 0–3 are selected to balance scale resolution and statistical reliability. At larger k values (i.e., smaller ε), some subintervals may contain insufficient data points due to the discrete nature of the adsorption data, leading to unstable probability estimates and reduced reliability of multifractal parameters. Therefore, limiting k to 0–3 ensures that each box contains adequate data while still capturing the essential scale-dependent heterogeneity of the pore system.
4. Results
4.1. Mineralogy and Geochemical Characteristics of Shale
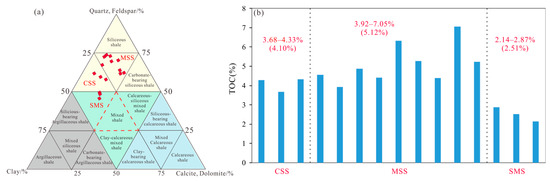
The geochemical analysis results (Table 1) indicate that the total organic carbon (TOC) content of WF–LMX shale ranges from 2.14% to 7.05%, with an average of 4.39%. Notably, Well A12 exhibits a higher TOC content, ranging from 2.52% to 6.32%, with an average of 4.68%. According to the criteria for evaluating organic matter abundance in mudstones, the WF–LMX shale is classified as a high-quality hydrocarbon source rock. The analysis of the mineral composition reveals that the WF–LMX shale is primarily composed of quartz, followed by clay minerals. The content of siliceous minerals ranges from 38.7% to 68.5%, with an average of 56.69%. The clay mineral content varies from 13.6% to 35.4%, averaging 23.18%. Correlation analysis indicates a significant positive relationship between the content of siliceous minerals and TOC, whereas clay mineral content shows a significant negative correlation with TOC. This suggests that the siliceous minerals in the study area primarily originate from biogenic silica, and that increased input of terrigenous clastic material hinders the enrichment and preservation of organic matter.
Table 1.
Differences in mineral composition and TOC among different shale lithofacies. (SMS = Siliceous-clay mixed shale; MSS = Mixed siliceous shale; CSS = Clay-bearing siliceous shale. WF. Fm. = Wufeng Formation).
Based on the lithological classification scheme proposed by Wu et al. (2024) [43], which uses clay minerals, carbonate minerals, and (quartz + feldspar) as three end members, with boundaries set at 50% and 25%, a facies classification of the WF–LMX shale reservoir was conducted (Figure 2a). The results indicate three dominant facies: mixed siliceous shale (MSS), clay-rich siliceous shale (CSS), and siliceous clay mixed shale (SMS) (Table 1). These facies show systematic variations in both mineral composition and TOC content. The MSS is characterized by relatively higher quartz content (average 63.84%) and higher TOC (average 5.12%), whereas the SMS exhibits higher proportions of carbonate (15.1%) and clay minerals (34.2%) with the lowest TOC (average 2.51%). The CSS shows intermediate compositional characteristics between the two end members. These compositional differences support the validity of the facies classification scheme.
Figure 2.
Lithofacies division diagram of Wufeng-Lomgmaxi Formation shale. (a) Lithofacies classification ternary diagram; (b) Comparison of TOC contents among different shale lithofacies.
4.2. Physical Properties and Pore Structure
4.2.1. Organic Matter Pore (OMP)
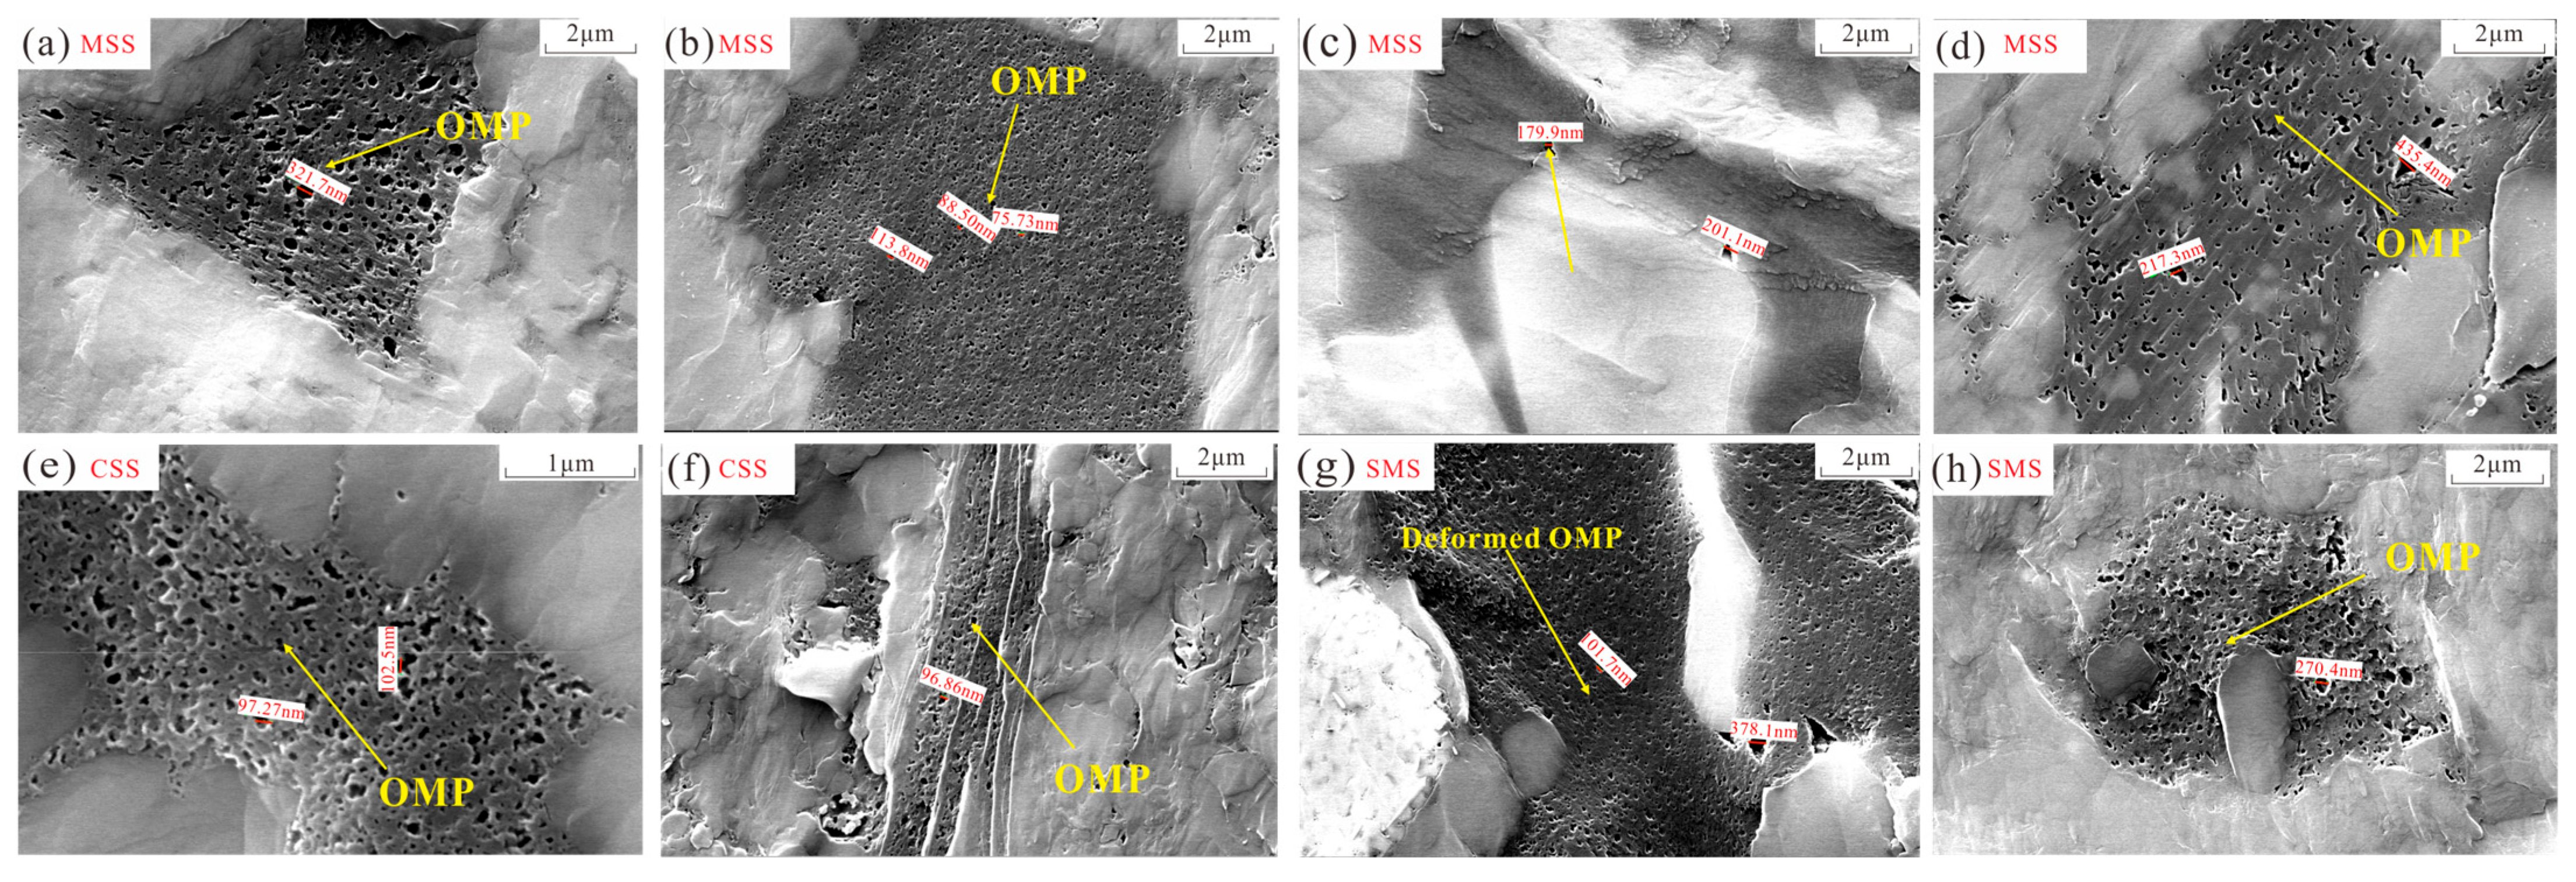
Scanning electron microscopy results reveal that the organic matter pores (OMP) in the WF–LMX shale can be classified into two types: pores supported by biological structures and those associated with bituminous organic matter (Figure 3). During hydrocarbon generation, OMP initially develops within the original biological organisms into a honeycomb or oval shape with dense distribution (Figure 3). Most organic matter with biological structures shows well-developed OMP during hydrocarbon generation; however, due to significant component loss, their shape is controlled by the inorganic mineral framework, making it difficult to fully preserve the original structure (Figure 3a,b,f). Only a small amount of organic matter has its biological cavities filled by authigenic minerals, which help preserve the in situ organic matter and develop small-diameter OMP (Figure 3d,h). A small portion of the OMP is underdeveloped, showing weak hydrocarbon potential but strong morphological preservation (Figure 3c). Liquid hydrocarbons migrate at micro- to nanoscale within the inorganic mineral framework, occupying the spaces between mineral pores, and further evolve into bitumen, while developing a large number of OMP internally (Figure 3e). Bitumen supported by inorganic minerals is characterized by a large volume and good sealing properties, containing a high number of internal OMP (Figure 3e,g). As the inorganic mineral framework deforms, the migrating organic matter also undergoes shape changes, with the OMP being most developed at the leading edge of the migration direction (Figure 3g).
Figure 3.
SEM microscopic characteristics of organic matter pores (OMP) of shales with different lithofacies. (a) A19-5; (b) A12-3; (c) A13-5; (d) A13-2; (e) A12-1; (f) A12-4; (g) A19-4; (h) A13-4.
The degree of development of organic matter pores (OMP) varies significantly among different shale facies due to the combined effects of organic matter content, the proportion of siliceous minerals, and the structural differences in the inorganic mineral framework. Generally, the siliceous shale facies exhibit the most developed OMP, characterized by diverse pore shapes and a relatively uniform PSD (Figure 3a–f). The siliceous supporting framework retains a significant amount of organic matter and develops a large number of OMP with pore sizes exceeding 100 nm. In the MSS facies, the OMP is the most developed, with pore sizes primarily ranging from 100 to 400 nm, often exhibiting a typical honeycomb structure (Figure 3a–d). The OMP in the CSS facies shows a moderate level of development, while in the SMS, the OMP has smaller pore sizes and a lower quantity (Figure 3).
4.2.2. Inorganic Mineral Pore
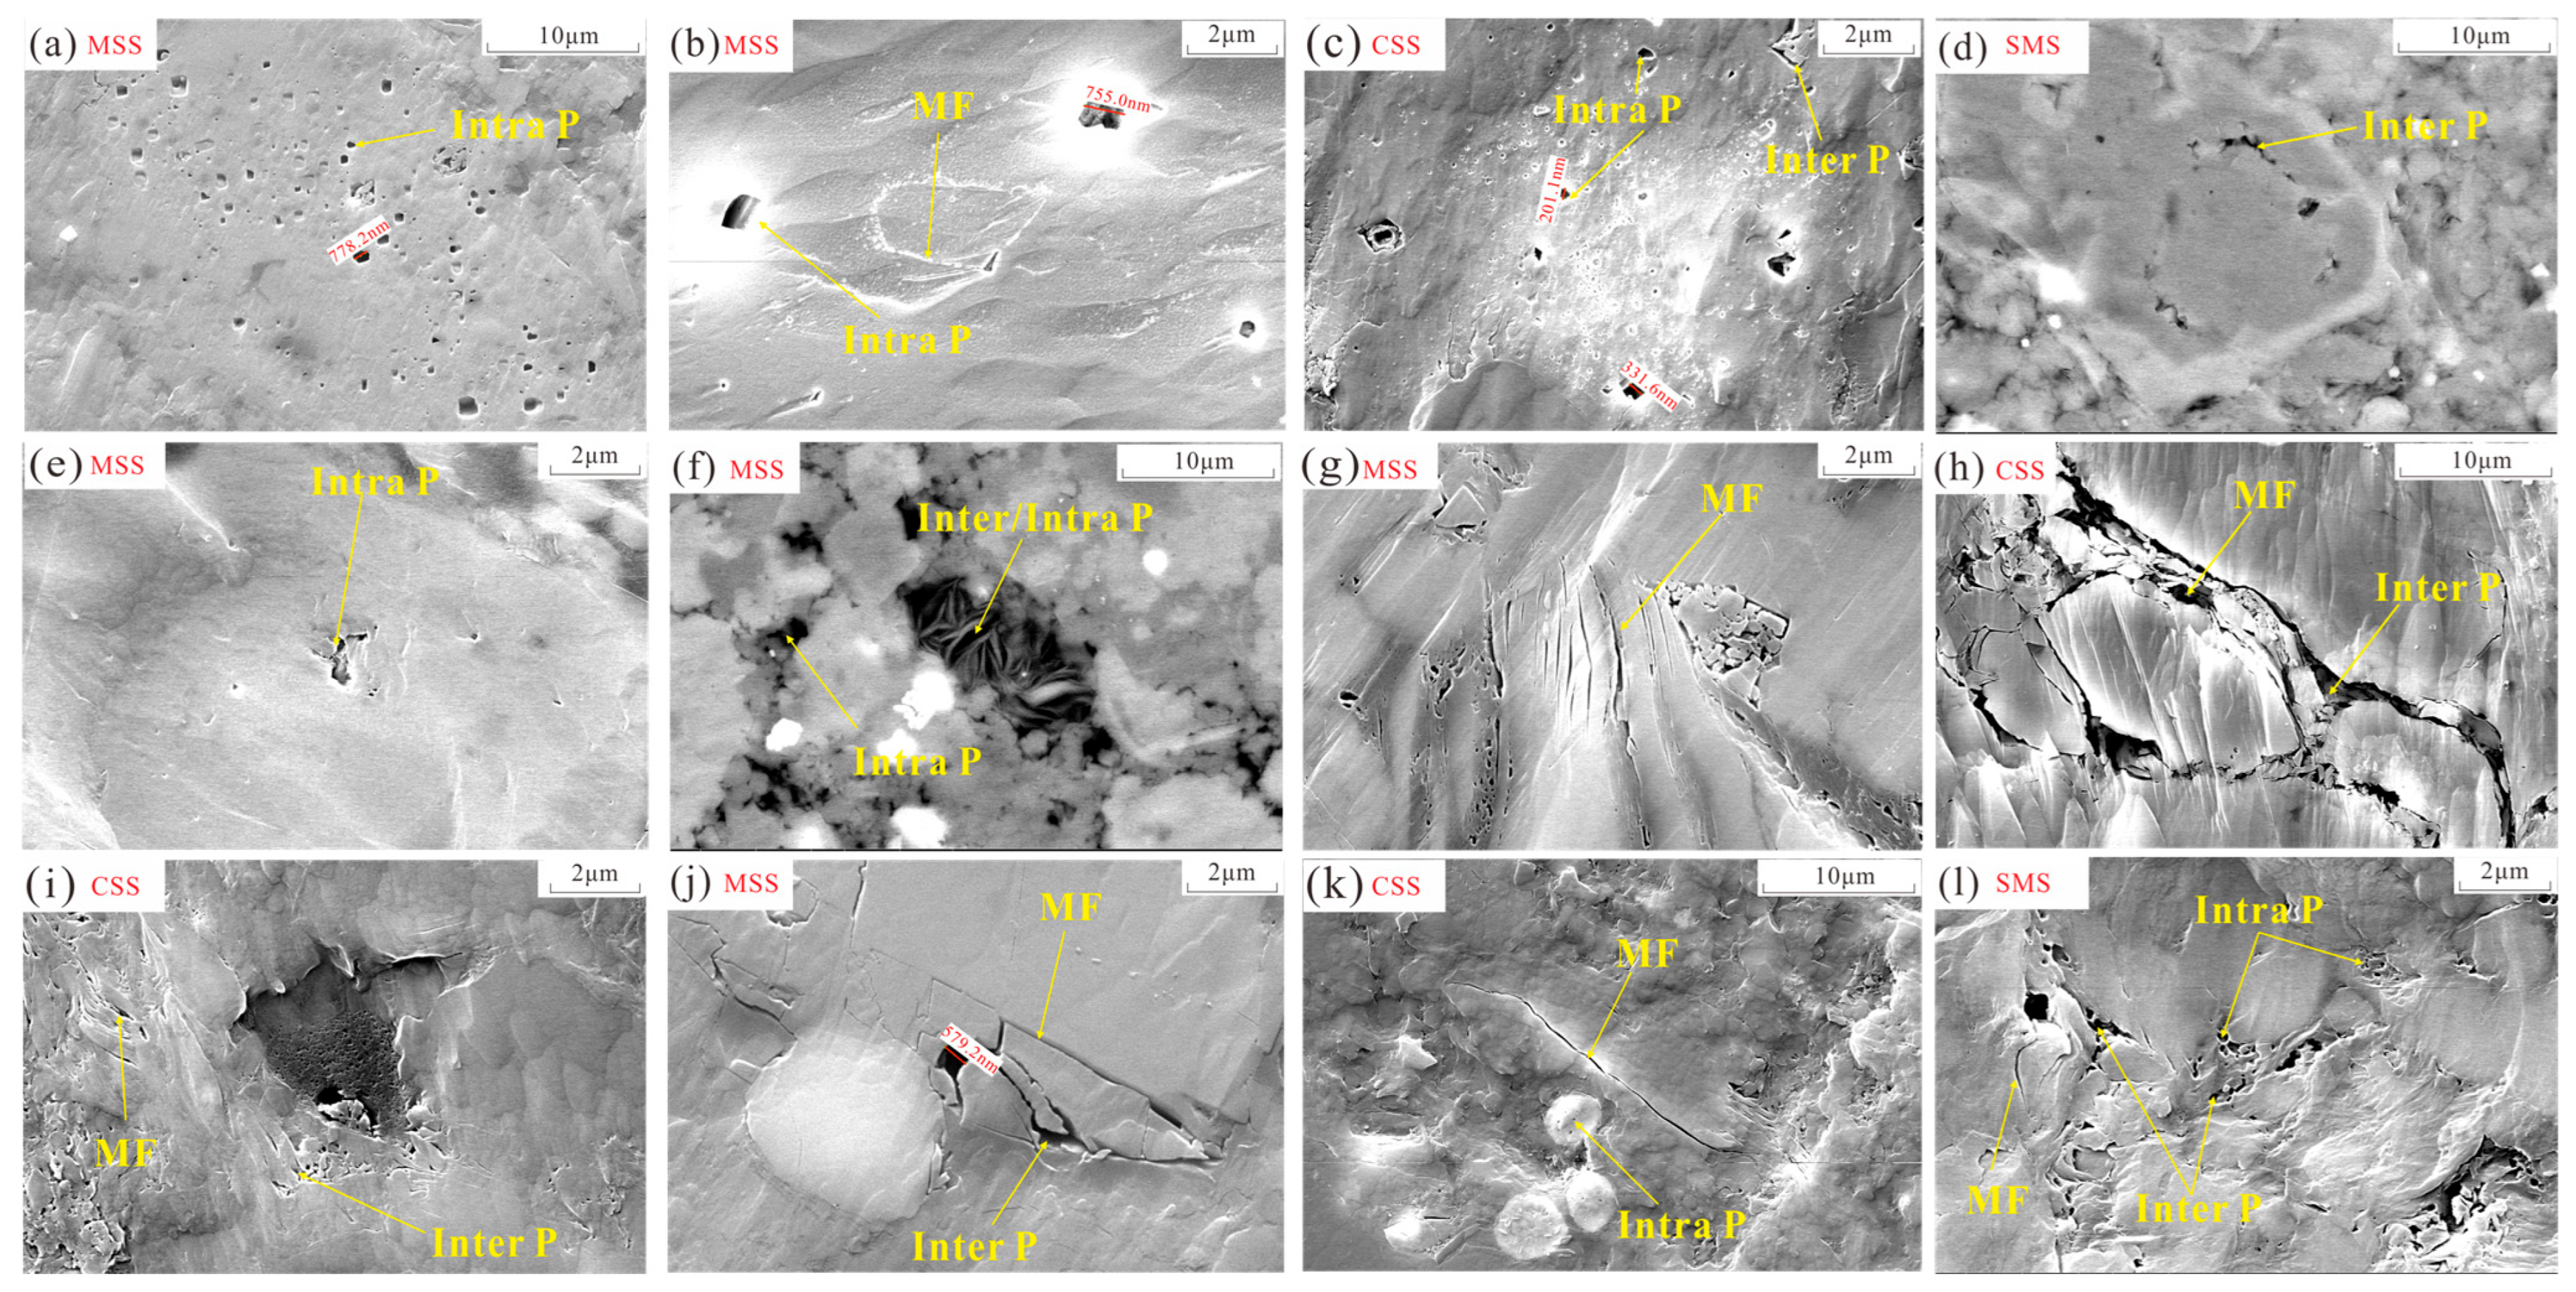
Inorganic pores are well-developed across the three rock facies, categorically divided into inter-particle pores (Inter P), intra-particle pores (Intra P), and microfractures (MF) [44] (Figure 4). Inter P primarily consists of residual spaces between mineral particles formed during sedimentation or preserved after diagenetic processes. This includes pores between brittle minerals such as quartz, feldspar, and carbonates (Figure 4d,c,j), as well as pores formed between brittle and clay minerals due to differential compaction and shrinkage (Figure 4e,h,l). These pores typically exhibit narrow, triangular, and irregular shapes, predominantly located between clay minerals, brittle minerals, and organic matter. Intra P primarily develops within mineral particles and includes dissolution pores on the surfaces of minerals such as feldspar and calcite (Figure 4a–c,f), as well as interlayer pores formed within clay minerals (Figure 4e,f). Due to later compaction and transformations of clay minerals, interlayer microfractures (MF) frequently develop between clay minerals (Figure 4g–i). Additionally, microfractures can also develop within inorganic mineral particles or along their edges (Figure 4j–l), with a small presence at the interfaces between organic matter and inorganic minerals. The formation of microfractures is closely related to factors such as differential compaction, particle fragmentation, inorganic diagenetic evolution, and the contraction of organic matter.
Figure 4.
SEM microscopic characteristics of interparticle pores (Inter P), intraparticle pores (Intra P), and micro-fissure (MF) of shales with different lithofacies. (a) A19-1; (b) A13-1; (c) A12-5; (d) A12-4; (e) A13-5; (f) A13-1; (g) A13-2; (h) A19-3; (i) A19-4; (j) A19-1; (k) A12-5; (l) A12-4.
4.2.3. Pore Structure
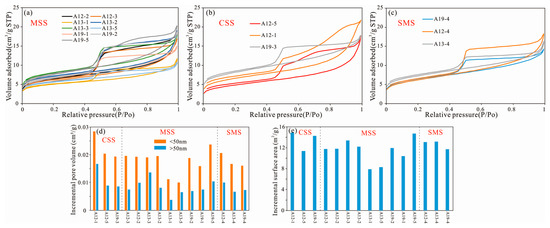
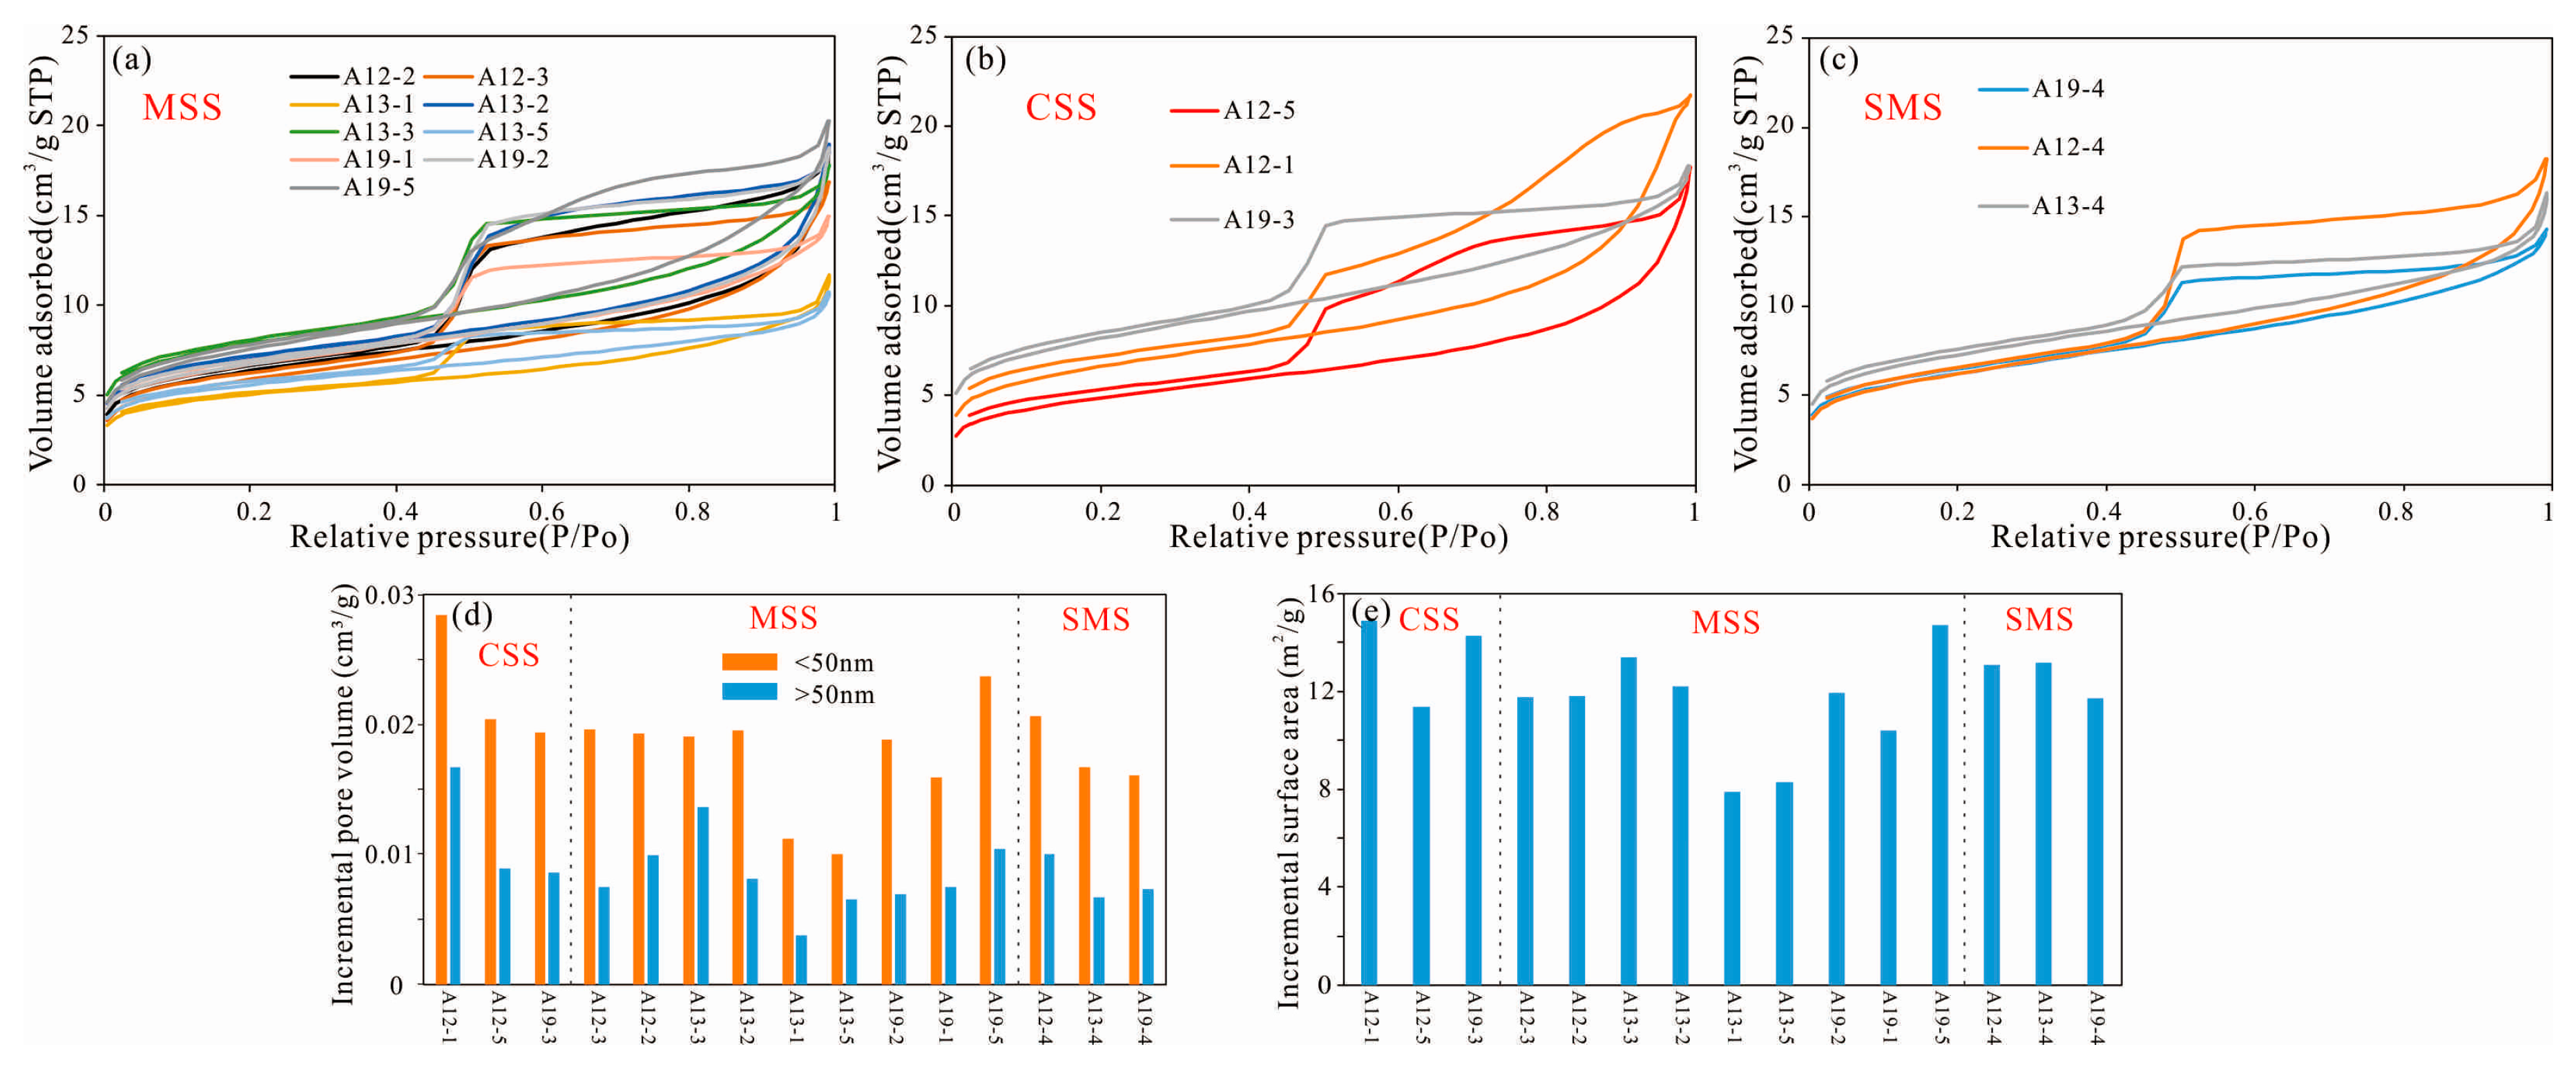
Nitrogen adsorption–desorption isotherms show pronounced hysteresis during desorption at higher relative pressures, and a forced closure below about 0.45, indicating a pore system dominated by micro- and mesopores. Under the IUPAC classification scheme [45], the hysteresis loops are mainly H3 and H2 types (Figure 5a–c). This pattern implies pore structures dominated by slit-like pores and ink-bottle geometries, accompanied by other minor pore types. SEM observations indicate that slit-like pores are chiefly associated with the platy fabric of clay minerals and microfractures, whereas ink-bottle pores are commonly linked to dissolution features and pores within organic matter. Across shale facies, both the shape of the hysteresis loop and the maximum adsorption capacity differ markedly (Figure 5a–c). Organic-rich facies (e.g., MSS and CSS) exhibit higher adsorption and overall capacity (maximum 21.71 cm3/g; mean 17.16 cm3/g), with hysteresis dominated by ink-bottle behavior. By contrast, organic-poor mixed-facies shales have weaker adsorption capacity (maximum 18.28 cm3/g; mean 16.31 cm3/g) and show predominantly slit-type hysteresis.
Figure 5.
Adsorption and desorption isotherm (a–c), pore volume (d) and specific surface area (e) distribution of shales with different lithofacies.
Combining high-pressure mercury intrusion (for pores >50 nm) with low-temperature nitrogen adsorption (for pores <50 nm) provides full PSD coverage for the WF–LMX shales. Following Loucks’ pore classification, shale pores are grouped by diameter into micropores (<2 nm), mesopores (2–50 nm), and macropores (>50 nm). Across the studied shales, the combined SSA of micro- and mesopores ranges from 7.87 to 14.9 m2/g, with a mean of 12.07 m2/g (Figure 5d). The total mesopore volume ranges from 0.0099 to 0.028 cm3/g, averaging 0.0186 cm3/g. Macropore volume ranges from 0.0038 to 0.0167 cm3/g, with a mean of 0.0088 cm3/g (Figure 5e). Thus, mesopore volume generally exceeds macropore volume. By lithofacies, the CSS shows the highest SSA and the largest mesopore and macropore volumes—13.52 m2/g, 0.0227 cm3/g, and 0.0114 cm3/g, respectively. In contrast, the SMS has the lowest values: 11.38 m2/g, 0.0178 cm3/g, and 0.0080 cm3/g.
4.3. Multi-Fractal Characteristics
4.3.1. Fractal Dimension Calculation Based on N2 Adsorption Data
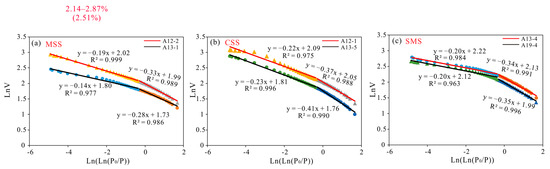
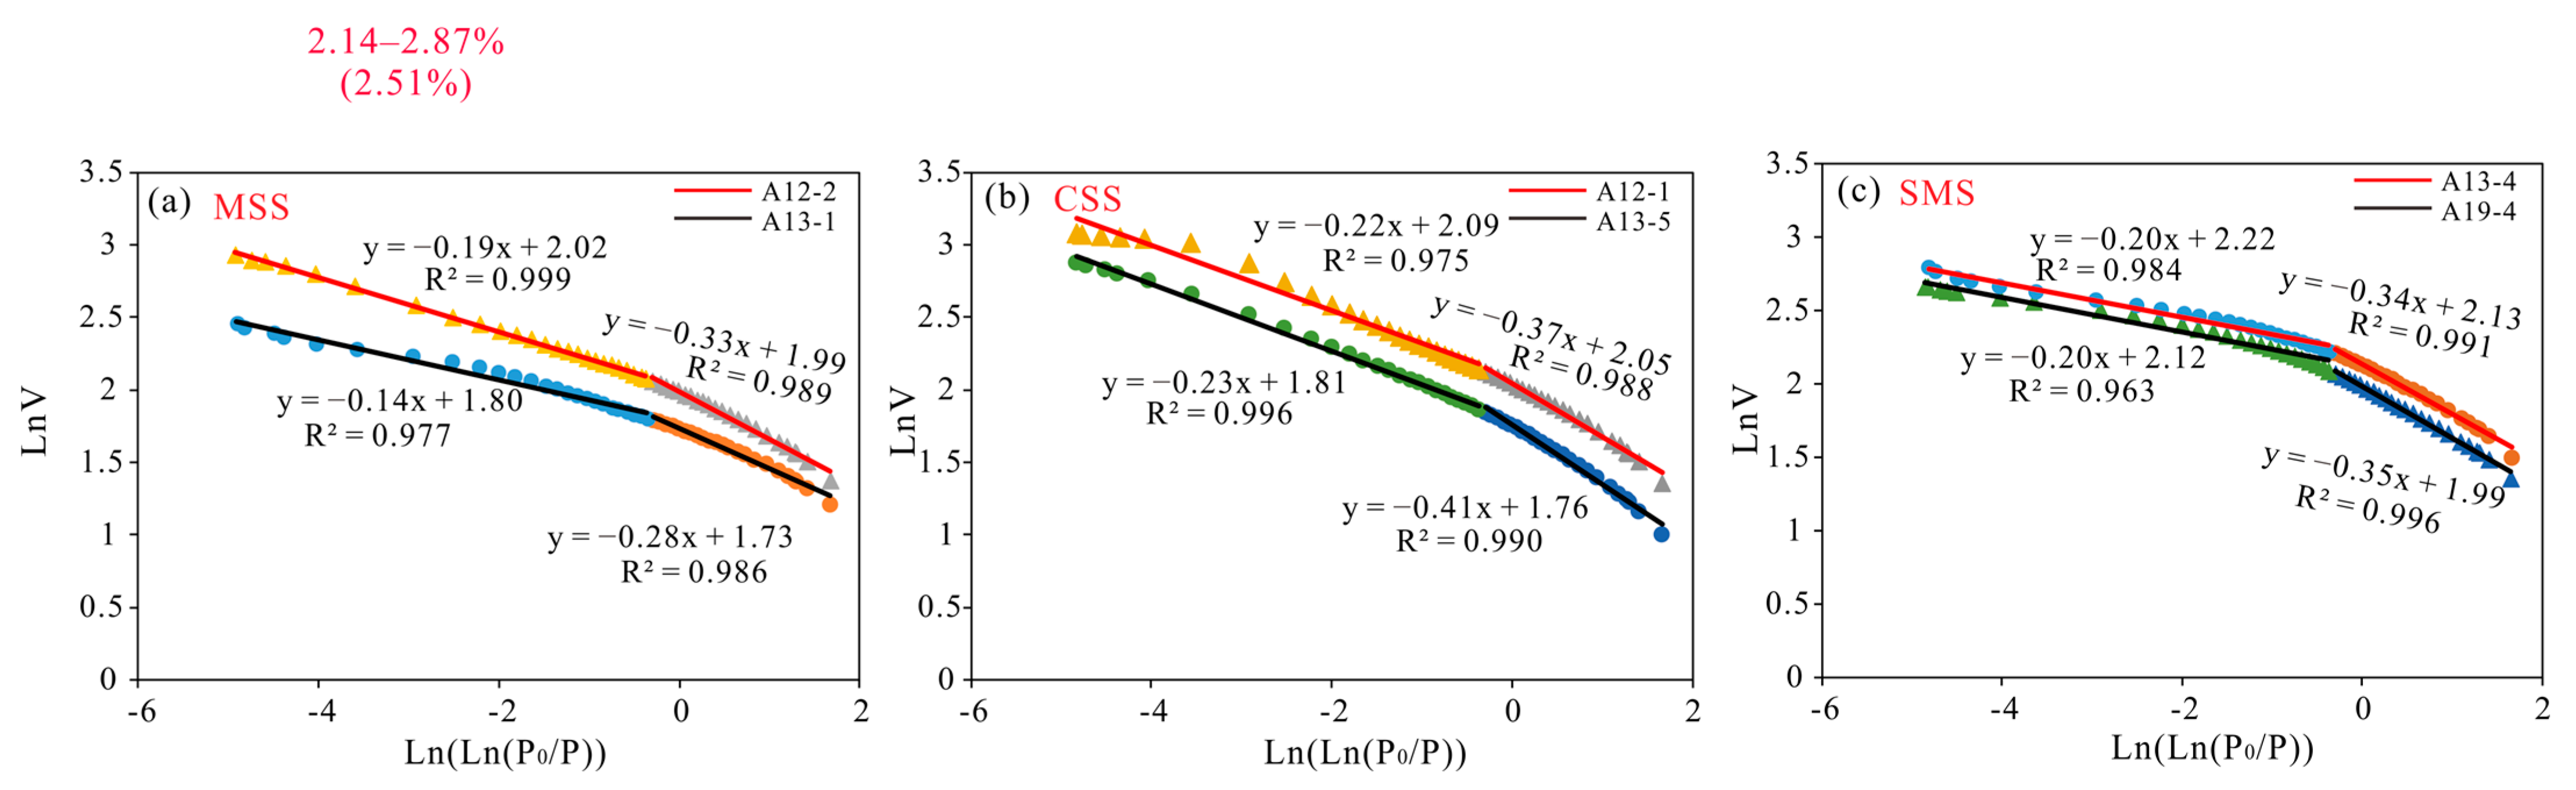
Our calculations show that the FHH double-logarithmic plot commonly displays a clear inflection, indicating shifts in pore structure behavior across adsorption stages (Figure 6). Guided by this inflection at P/P0 = 0.45, we partition the fractal dimension into two regimes—D1 (P/P0 < 0.45) and D2 (P/P0 > 0.45)—to describe the complexity and heterogeneity of smaller versus larger pores. At low relative pressures (P/P0 = 0–0.45), D1 captures adsorption and pore filling within small, adsorption-dominated pores; higher D1 values indicate rougher pore surfaces. At higher relative pressures (P/P0 = 0.45–1.0), D2 characterizes pore filling within larger, flow-relevant pores in the reservoir; higher D2 values indicate a more complex and irregular internal pore geometry.
Figure 6.
Fractal characteristics of pore structure of shale samples based on nitrogen adsorption. (a) A12-2; A13-1; (b) A12-1; A12-5; (c) A13-4; A19-4.
The experimental data and fractal-dimension estimates show that the fitted equations for the WF–LMX shale samples have coefficients of determination (R2) mostly above 0.90, indicating that the calculated fractal dimensions are reliable (Table 2). Across samples, D1 ranges from 2.60 to 2.72, with a mean of 2.671. D2 ranges from 2.77 to 2.87, with a mean of 2.82. According to the Frenkel–Halsey–Hill (FHH) model, the average D1 is higher than D2, suggesting that pore-surface roughness exceeds the complexity of the internal pore network across facies. Comparisons among facies indicate that both D1 and D2 are markedly higher in siliceous shale than in mixed shale. Among the facies, SMS shows the highest D1 and D2, with mean values of 2.69 and 2.84, respectively. CSS shows the lowest D1 and D2, with mean values of 2.63 and 2.79, respectively.
Table 2.
Fractal parameters of shales with different lithofacies.
4.3.2. Fractal Dimension Calculation Based on High-Pressure Mercury Injection Data
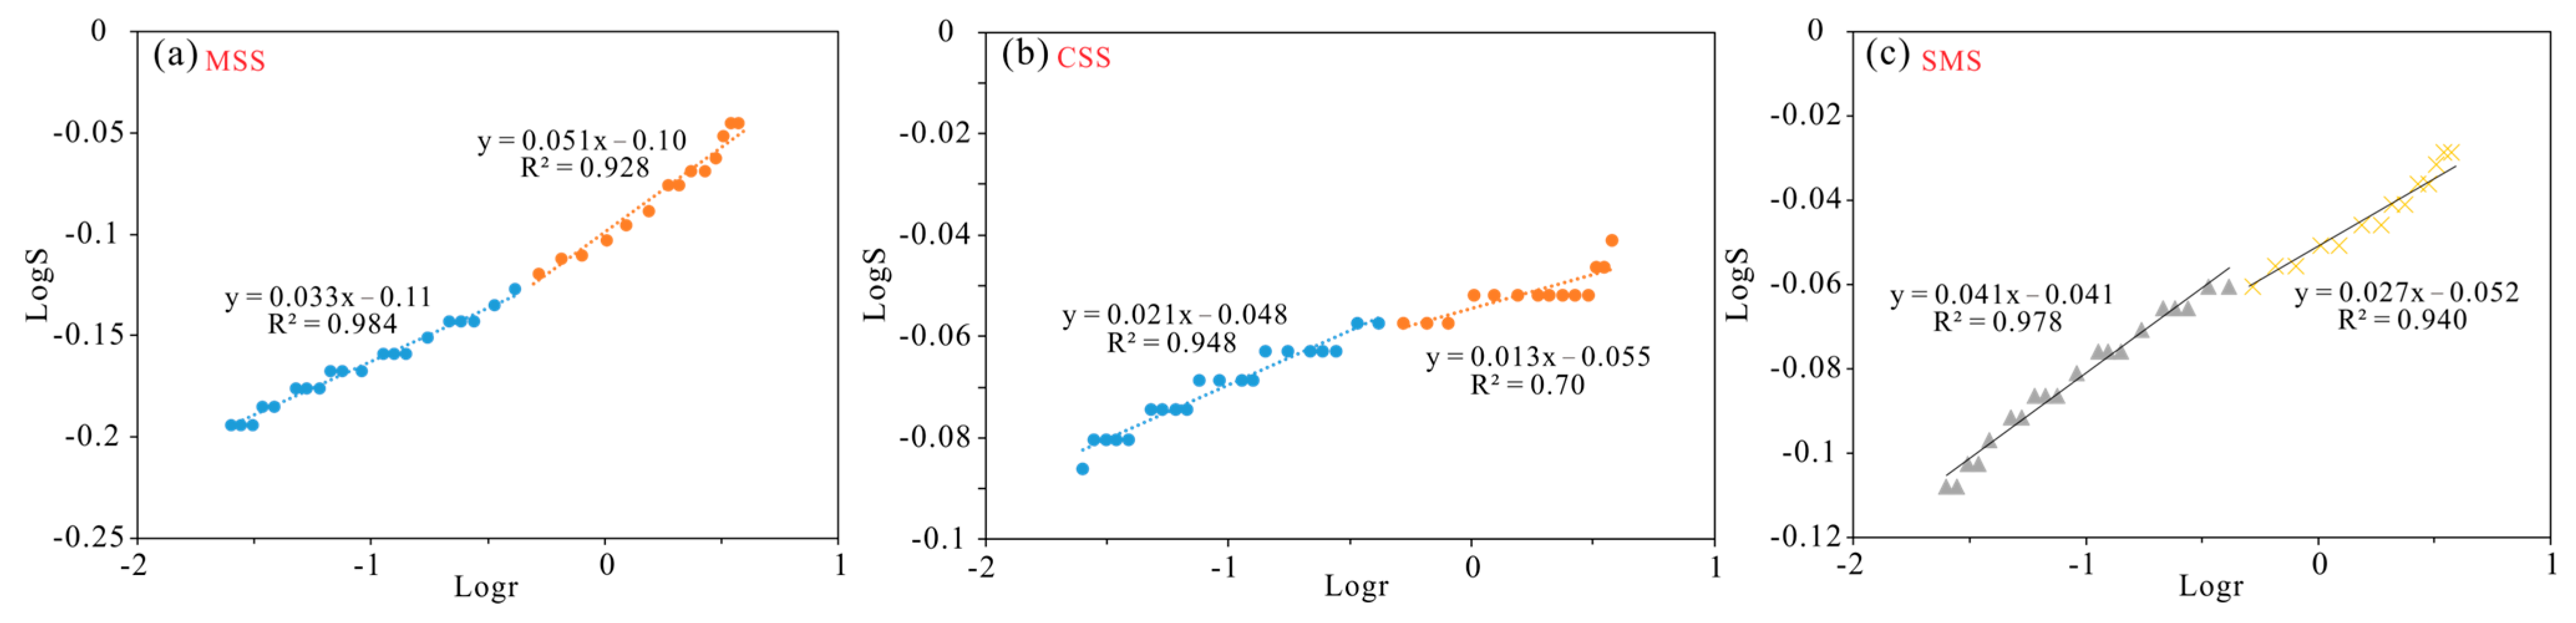
Analysis of high-pressure mercury intrusion (HPMI) data shows two distinct scaling regimes in the log–log relation between pore radius and cumulative PV—50–1000 nm and >1000 nm—confirming a dual-fractal pore system (Figure 7). DHg1 denotes the fractal dimension for the smaller-pore interval (50 < r < 1000 nm), and DHg2 for the larger-pore interval (r > 1000 nm). The mean values of DHg1 and DHg2 are similar—2.964 and 2.969, respectively. The overall pore fractal dimension (DHg) was calculated following Li et al. [46], weighting each pore-size interval by its share of the total PV. Macropore DHg ranges from 2.95 to 2.98, with a mean of 2.97, indicating limited variability in macropore structure across the shale reservoir (Table 2). Overall, DHg is higher than D1 and D2, implying that the larger pores have a more complex structure (Table 2). Across shale types, siliceous shale shows a higher macropore DHg than mixed shale, indicating a more complex macropore system in the siliceous type. The CSS type has the highest mean (2.976), whereas the SMS has the lowest (2.962).
Figure 7.
Fractal characteristics of shale samples based on high-pressure mercury injection data. (a) A19-1; (b) A12-5; (c) A12-4.
4.3.3. Calculation of Multifractal Dimension Based on N2 Adsorption Data
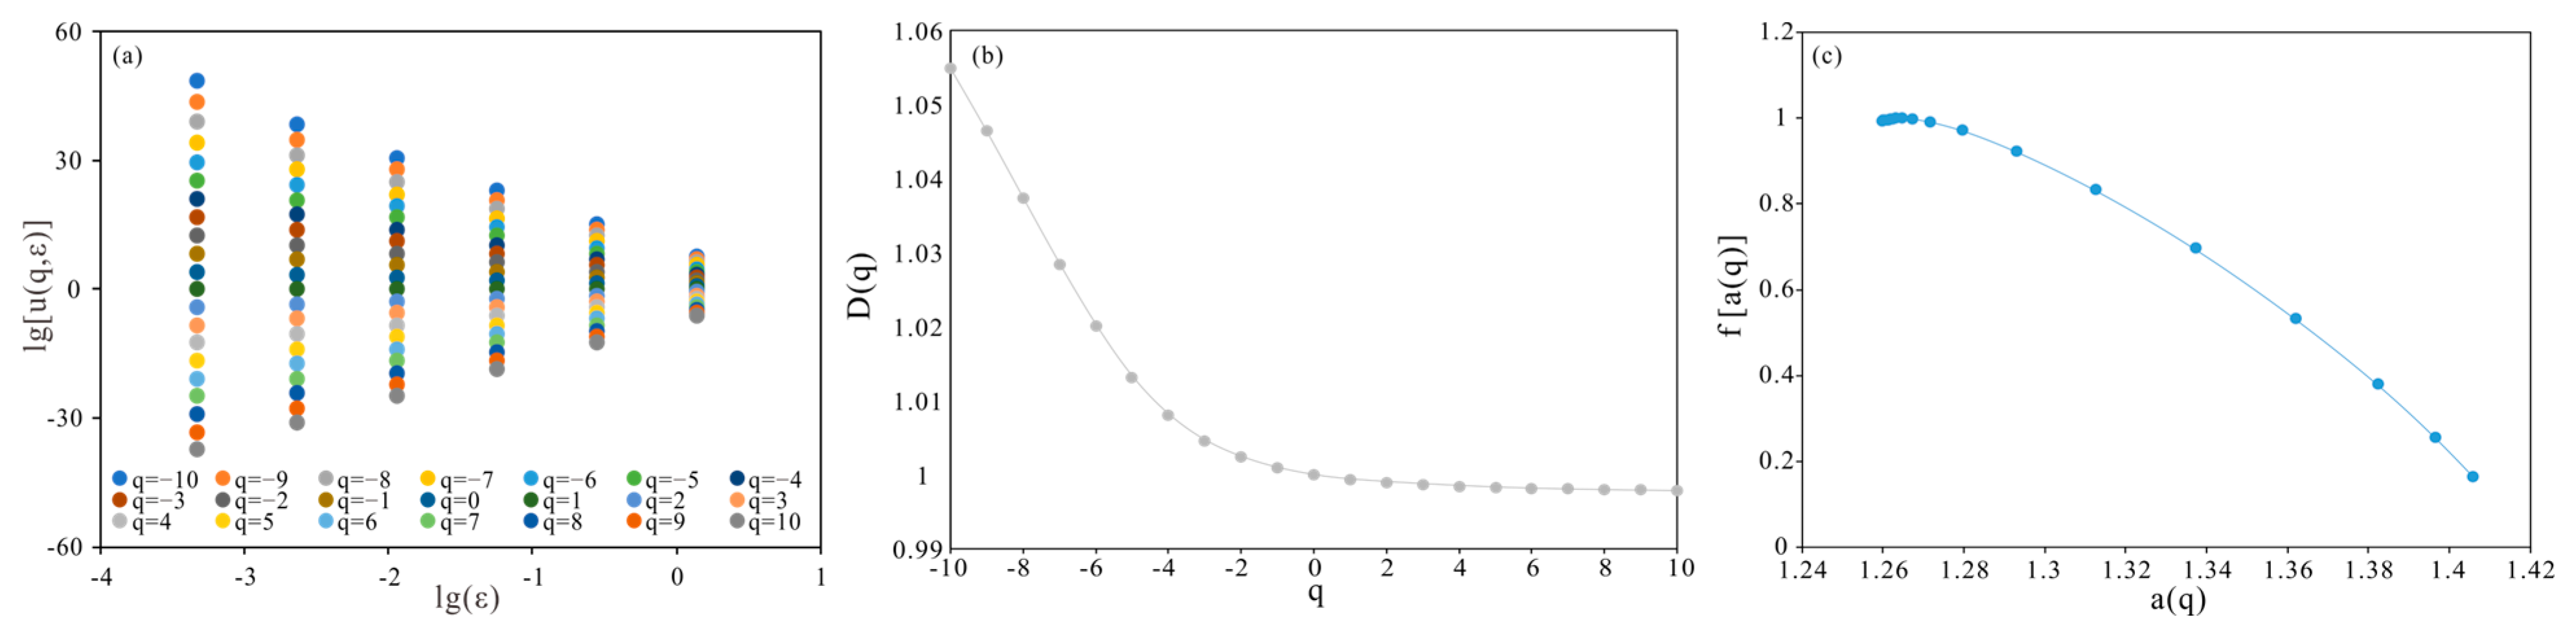
The log–log plot of the partition function against the scale ε is linear, indicating that the PSD derived from N2 adsorption is multifractal (Figure 8a). The generalized dimension spectrum D(q) decreases monotonically with q, with a steeper decline for q < 0 (Figure 8b). The left-branch width, Dmin − D0, and Dmin (at q = −10) capture heterogeneity in low-probability (sparsely populated) regions, whereas the right-branch width, D0 − Dmax, and Dmax (at q = 10) capture heterogeneity in high-probability (densely populated) regions. A wider left branch than right branch indicates that pore sizes in the low-probability range are more heterogeneous, while those in the high-probability range are relatively uniform. This study uses the ratio of branch widths, Skd = (D0 − Dmax)/(Dmin − D0), together with the spectrum width ΔD, to quantify the overall complexity and heterogeneity of the PSD.
Figure 8.
(a) Double logarithmic plot of u(q, ε) vs. ε, (b) multifractal spectrum, and (c) generalized fractal dimension corresponding to N2 distribution of sample A19-5.
The α–f(α) multifractal spectrum is continuous and forms an asymmetric, convex parabolic curve, confirming the multifractal nature of the PSD (Figure 8c). On the f(α) curve, the left-branch width (α0 − αmin) reflects heterogeneity in the high-probability portion of the distribution, while the right-branch width (αmax − α0) reflects heterogeneity in the low-probability portion. We define the spectrum width, Δα = αmax − αmin, and the branch-width ratio, Ska = (α0 − αmin)/(αmax − α0), as indices of overall pore-scale heterogeneity. These metrics quantify the nonuniformity of pore sizes and their distribution.
The asymmetric characteristics of the D(q)–q and α–f(α) spectra further provide quantitative constraints on pore structure organization and reservoir quality. A left-wide and right-narrow D(q)–q spectrum indicates stronger heterogeneity in low-probability regions, corresponding to relatively large pores that dominate storage space and fluid transport pathways. In contrast, a left-narrow and right-wide α–f(α) distribution reflects greater variability in high-probability regions, representing micropore-dominated domains that control surface complexity and adsorption behavior. From a reservoir perspective, larger spectral widths (ΔD and Δα) and stronger asymmetry indicate higher pore-system complexity, more heterogeneous PSD, and poorer pore connectivity. Conversely, narrower and more symmetric spectra suggest more uniform pore development and relatively better connectivity. Therefore, multifractal parameters can be used to quantitatively evaluate pore structure heterogeneity and infer variations in reservoir quality among different shale facies.
Table 3 summarizes the multifractal parameters derived from gas-adsorption measurements. The D(q)–q spectrum is broader at low q and narrower at high q, whereas the α–f(α) spectrum shows the reverse pattern. Consistent with these patterns, the indices Skd and Ska are both well below 0.1, indicating that the pore network is far more heterogeneous in the low-probability (sparsely populated) parts of the PSD than in the high-probability parts.
Table 3.
Multifractal parameters of shale samples from N2 adsorption.
5. Discussion
5.1. Quantitative Evaluation of Heterogeneity Characteristics
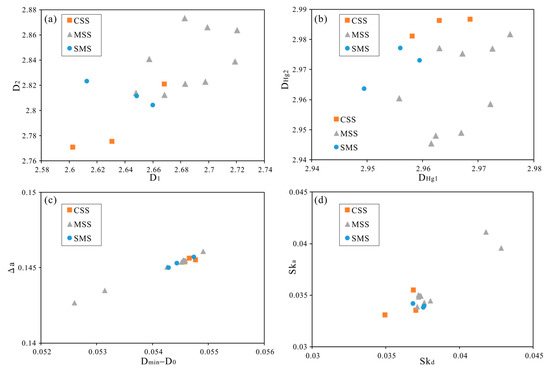
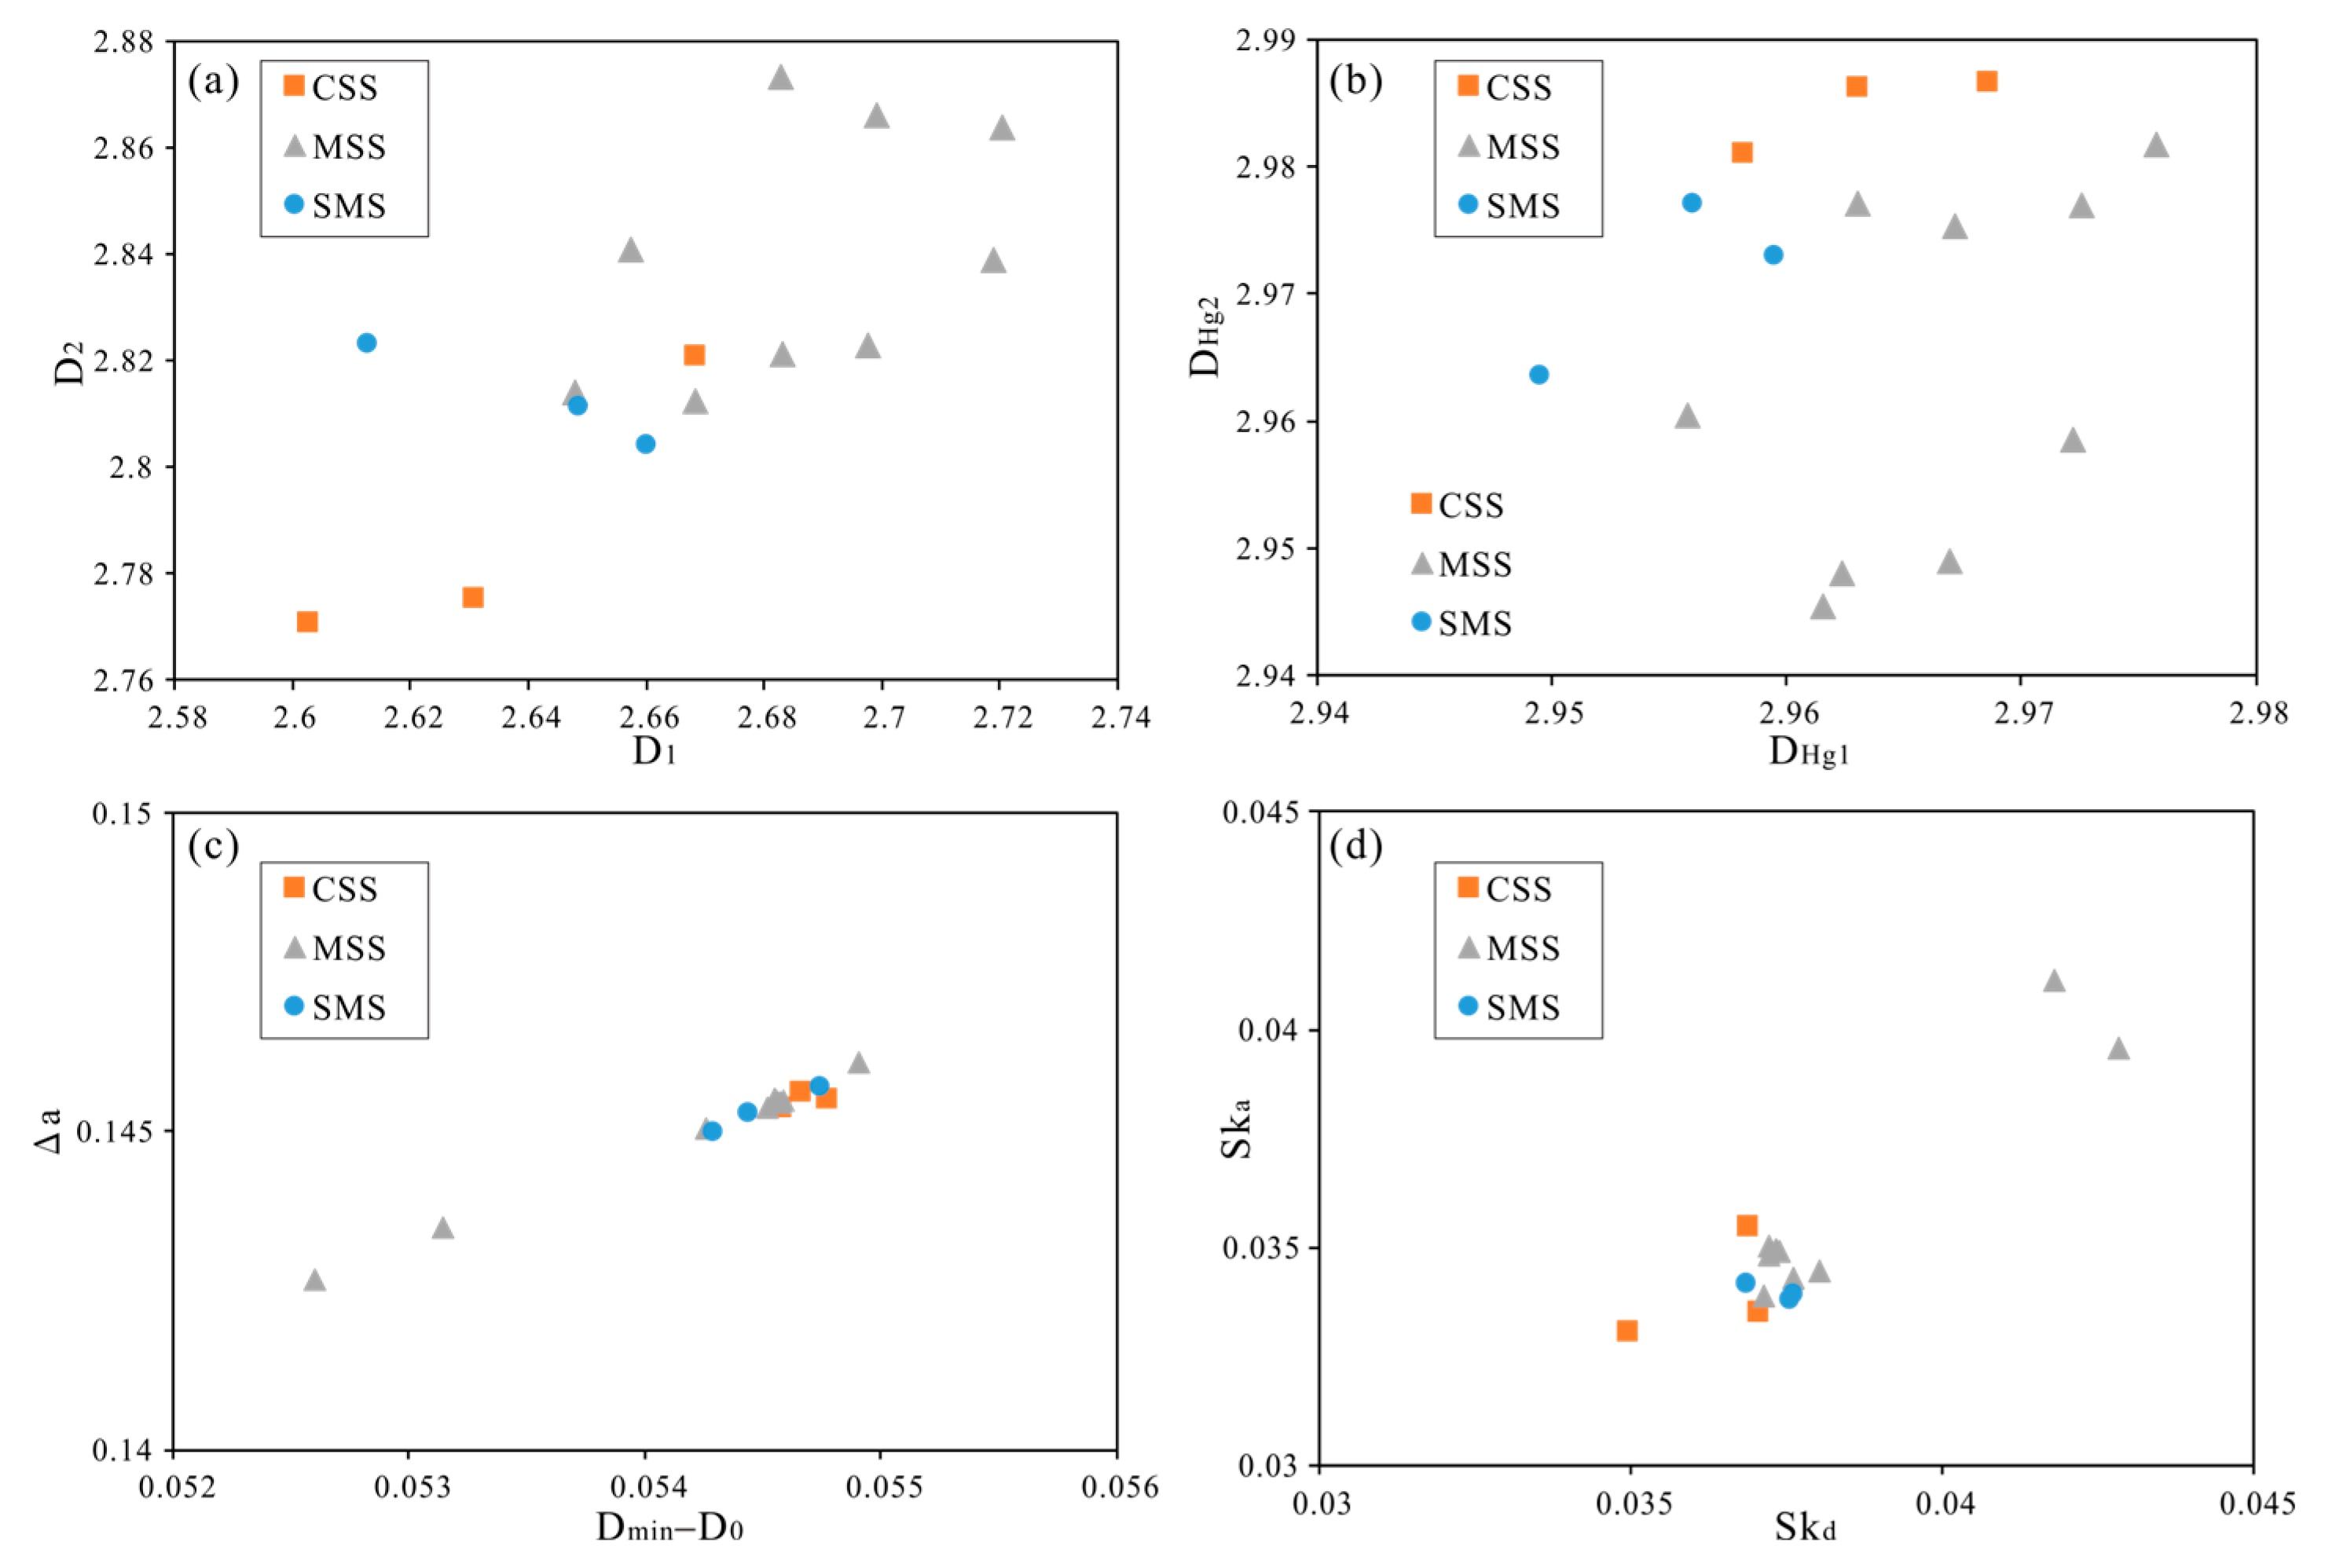
Figure 9 compares the multifractal parameters across shale facies. Calculations from N2 adsorption show that the low-pressure fractal dimension (D1) exceeds the high-pressure value (D2), indicating that pore-surface heterogeneity is greater than the complexity of the internal pore space (Figure 9a). D1 is positively correlated with D2, suggesting that greater surface heterogeneity is accompanied by higher overall spatial heterogeneity of the pore system. Among the facies, MSS is the most heterogeneous, followed by SMS, whereas CSS is the least (Figure 9a). Fractal dimensions derived from high-pressure mercury intrusion (DHg) vary little among facies but are, overall, significantly higher than D1 and D2, implying greater heterogeneity in pores >50 nm (Figure 9b). For 50–1000 nm pores (DHg1), MSS and CSS have the highest mean values, whereas SMS is distinctly lower. For macropores >1000 nm (DHg2), CSS is the highest and MSS is the lowest. Thus, CSS is most heterogeneous at >1000 nm, while MSS shows the strongest heterogeneity in the 50–1000 nm range. Notably, only MSS has DHg2 < DHg1, indicating that its 50–1000 nm pores are markedly more heterogeneous than its >1000 nm pores.
Figure 9.
Comparison of normalized multifractal parameters: (a) D1 and D2; (b) DHg1 and DHg2; (c) Dmin–D0 and Δα; (d) Ska and Skd.
Multifractal analysis of N2 adsorption shows that the CSS has a higher mean Dmin–D0 than the other lithofacies. This implies a wider left branch in the generalized multifractal spectrum and, therefore, the strongest heterogeneity in the low-probability portion of the PSD (Figure 9c). CSS also exhibits the largest mean ΔD and Δα, indicating pronounced overall heterogeneity and weak self-similarity in its pore system (Table 3). Dmin–D0 correlates positively with Δα, suggesting that reservoir-scale heterogeneity is driven primarily by the low-probability part of the PSD (Figure 9c). Within MSS, Dmin–D0 and Δα vary markedly: samples A13-1 and A13-5 are distinctly lower, whereas A19-5 is higher (Table 3). In contrast, MSS has the highest Skd and Ska, while CSS is the lowest, implying greater left–right asymmetry in MSS and a more balanced spectrum in CSS (Figure 9d). Regarding PSD dispersion, D0–D1 captures the degree of spread; higher values indicate a more dispersed PSD and poorer uniformity, with MSS highest and CSS lowest. D0–D2 reflects self-similarity; higher values denote lower self-similarity and a more complex pore architecture, again with MSS highest and CSS lowest. The Hurst index, H = (D2 + 1)/2, gauges pore-network connectivity across PSD ranges; larger H indicates better uniformity and connectivity. CSS yields the highest H, whereas MSS is the lowest.
Integrated analysis of multifractal measures shows that pore structure heterogeneity differs markedly among shale facies. In MSS, D1, D2, and the Hurst exponent are lowest, while D0–D1 and D0–D2 are highest, indicating a highly dispersed PSD and poor pore connectivity. Skd and Ska also reach maximum values, pointing to the strongest heterogeneity, largely driven by pores within less common pore-size ranges. By contrast, CSS has higher D1, D2, and Hurst values and lower D0–D1 and D0–D2, implying a more uniform PSD and better connectivity. However, some indicators (ΔD, Δα, and Dmin–D0) are large, whereas D0–Dmax, Skd, and Ska are small, revealing inconsistencies among metrics that describe heterogeneity. CSS also shows high amax, Dmin, αmin, and Dmax, underscoring that common multifractal indices such as ΔD and Δα alone cannot fully or accurately capture the heterogeneity of this facies. Considering the overall multifractal response together with field-emission scanning electron microscopy (FE-SEM) observations of pore types, connectivity, and the extent of pore development, CSS is confirmed to have the most uniform pore structure and the weakest heterogeneity among the studied facies. In SMS, values of Skd, Ska, D0–D1, and D0–D2 fall between those of CSS and MSS, indicating moderate heterogeneity in the more common PSD ranges. Overall, based on single-fractal parameters, MSS exhibits the strongest heterogeneity in its PSD.
5.2. Relationship Between Heterogeneity and Pore Structure of Shale Reservoirs
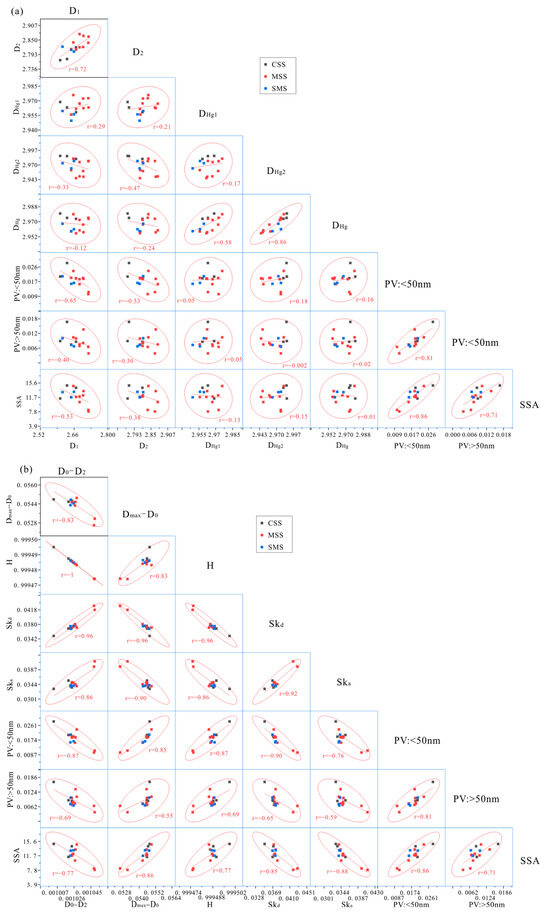
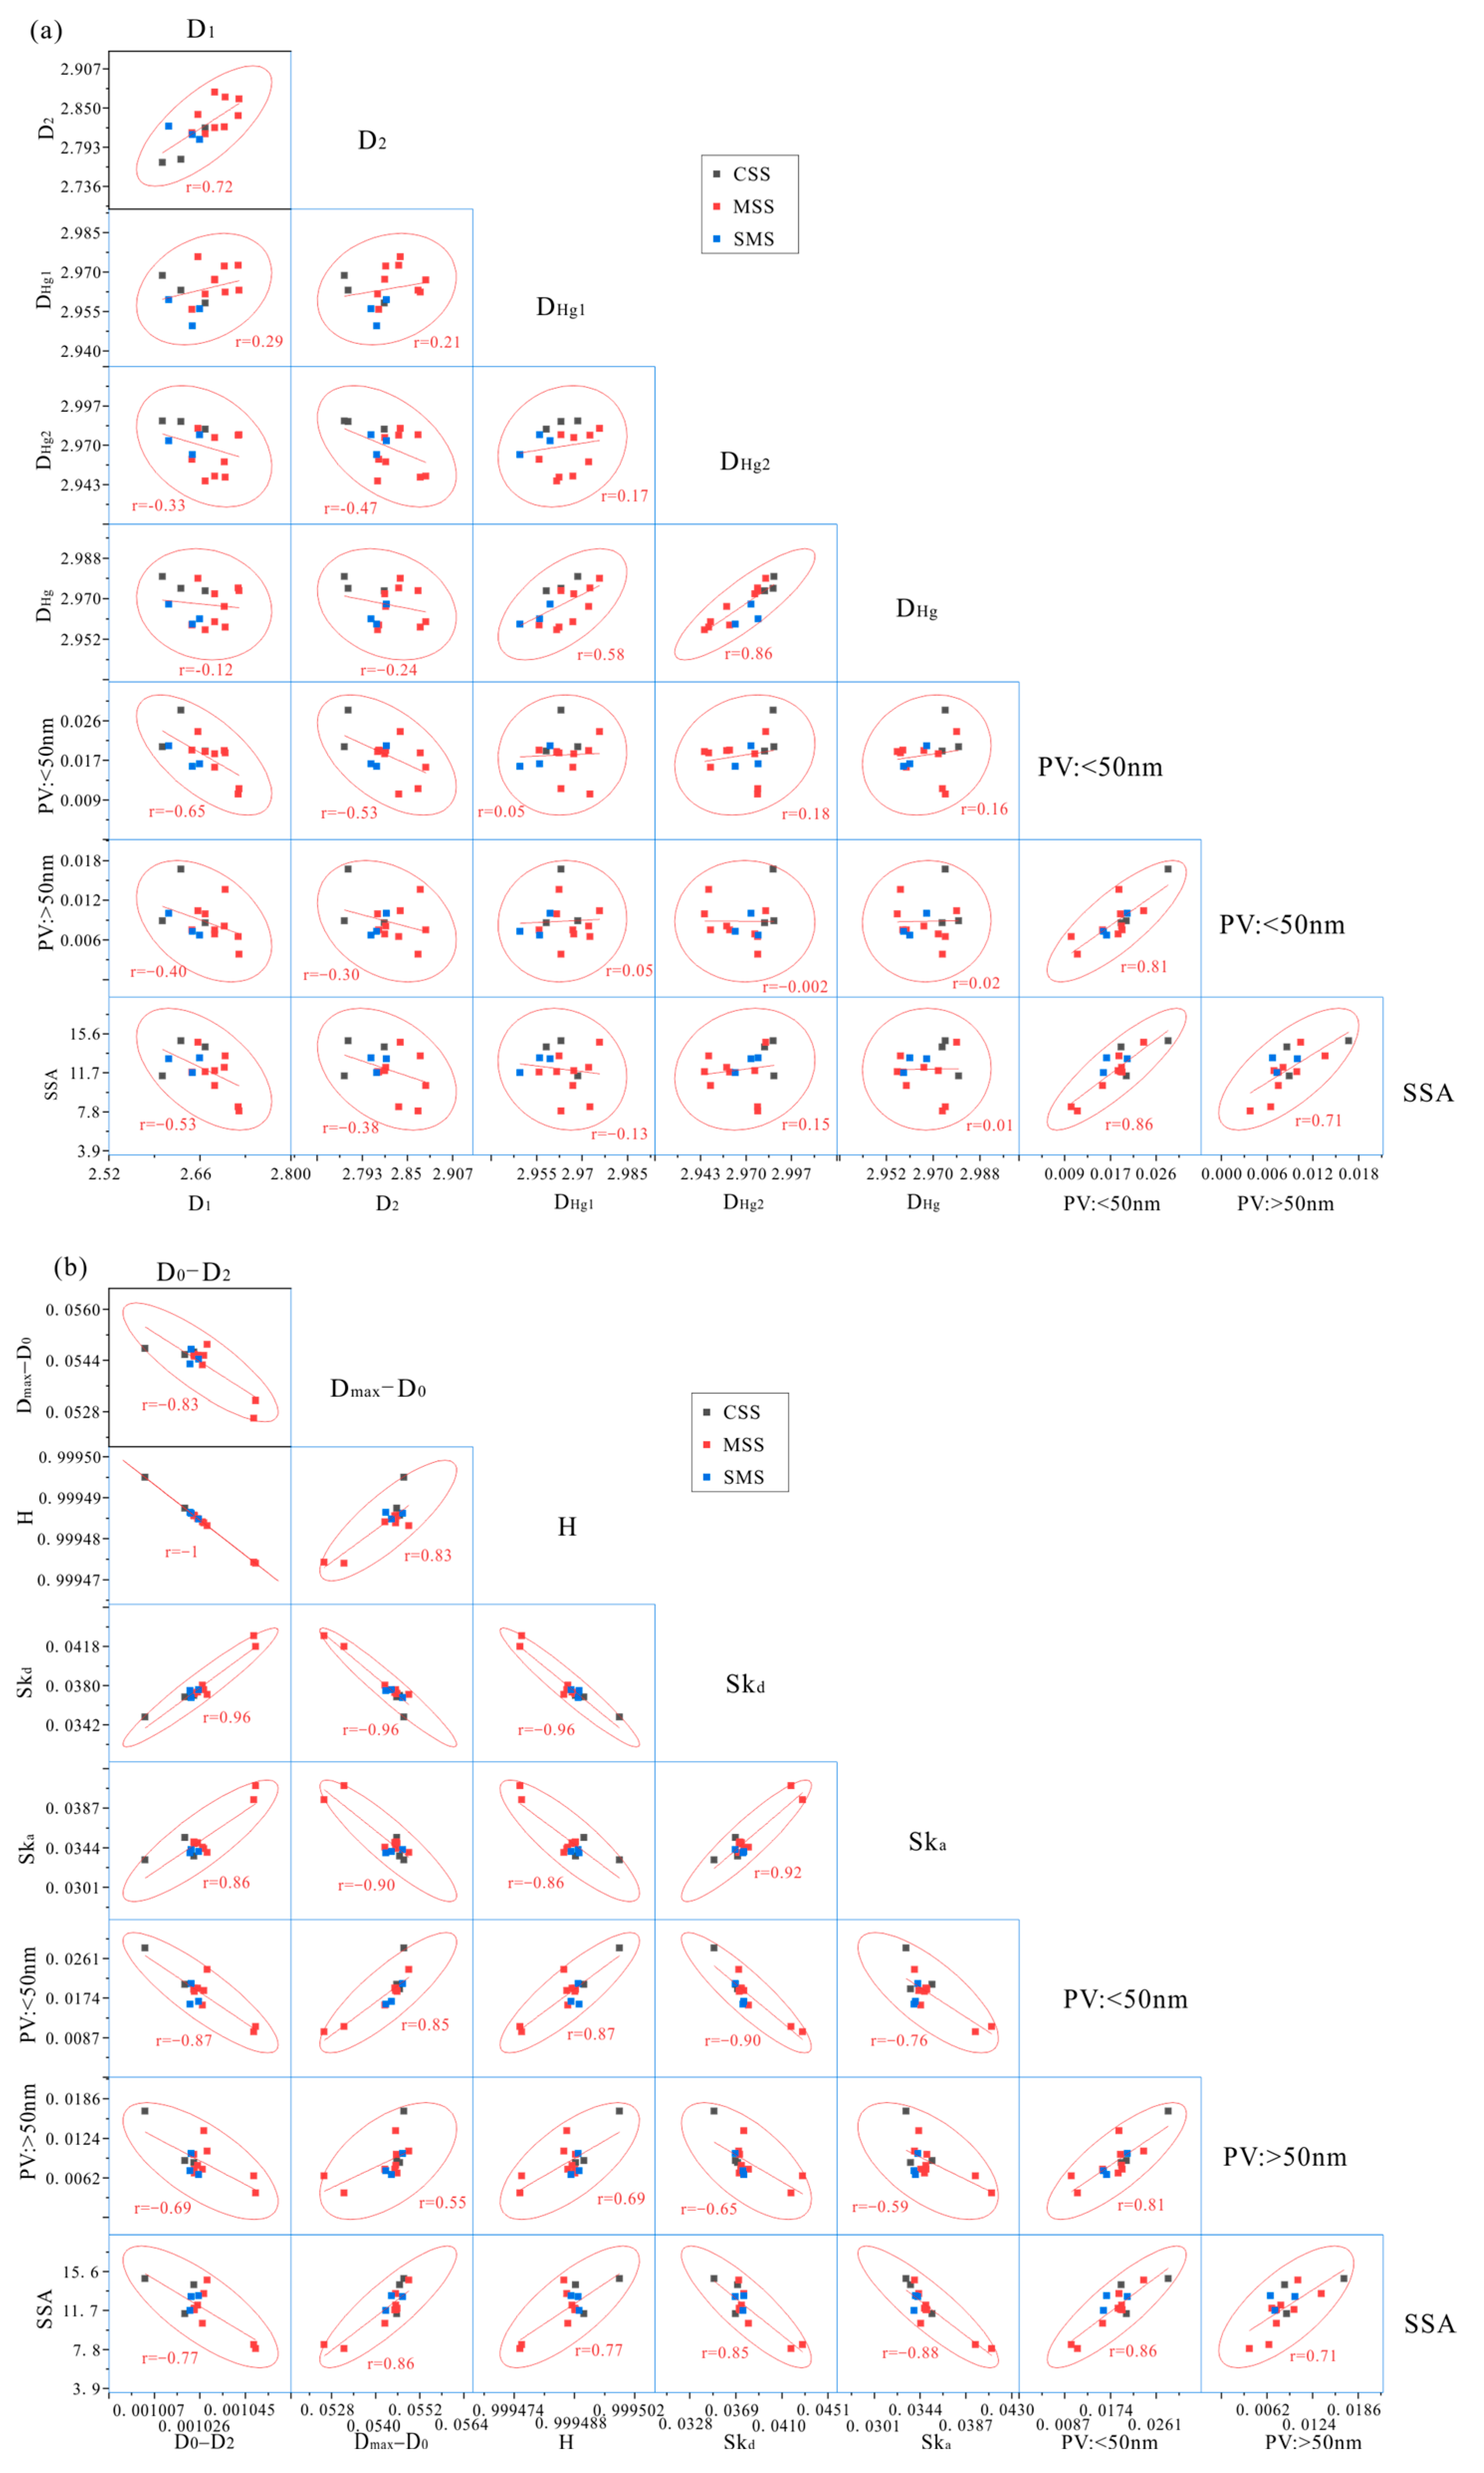
Variations in pore structure govern the storage and flow capacity of shale reservoirs. Linking reservoir properties to fractal dimensions enables an integrated assessment of different shale facies [47,48,49]. Using gas adsorption and high-pressure mercury intrusion data, we examined how PV relates to fractal dimensions across facies (Figure 10). A single-parameter comparison (Figure 10a) shows that D1 and D2 are positively correlated (R2 = 0.67), indicating that pore-surface roughness (D1) covaries with the complexity of the pore network (D2). PV and SSA are both negatively correlated with D1 and D2, implying that as pores become more developed, surface roughness and internal complexity decrease and overall heterogeneity weakens. The stronger correlations with D1 suggest that pore development affects surface heterogeneity more than internal complexity. For pores smaller than 50 nm, the correlations between PV and both D1 and D2 are stronger than for pores larger than 50 nm, indicating that mesopores are more sensitive indicators of reservoir heterogeneity.
Figure 10.
The correlation coefficient matrix among single-fractal, multifractal, and pore structure parameters: (a) single-fractal vs. pore structure parameters; (b) multifractal vs. pore structure parameters. The trendlines indicate the correlation trends between variables, and the shaded regions represent the 95% confidence intervals.
The negative correlation between SSA and the N2-adsorption fractal dimension D1 indicates that pore-surface heterogeneity is closely linked to the development of SSA. As fractal dimension increases, pore surfaces become more irregular and pore morphology more heterogeneous, creating additional sites for shale-gas adsorption. By contrast, neither PV nor SSA shows a clear relationship with fractal dimensions derived from high-pressure mercury intrusion (Figure 10a), suggesting that mercury intrusion does not capture reservoir heterogeneity effectively and that differences among lithofacies are minor. These findings imply that pore-scale heterogeneity in WF–LMX shales is governed mainly by micropores and mesopores, while macropores and microfractures contribute little to the overall heterogeneity. Accordingly, the single fractal dimensions D1 and D2 obtained from N2 adsorption reliably characterize both surface and internal pore heterogeneity. Higher fractal dimensions are associated with greater adsorption capacity and storage potential in shale reservoirs.
Figure 10b shows strong correlations among the multifractal parameters (D0–D2, Dmax–D0, H, Skd, and Ska), indicating that they consistently characterize reservoir heterogeneity. PV and SSA exhibit similar relationships with these parameters. As pore development increases, the PSD becomes more self-similar, the pore network becomes more regular and uniform, pore connectivity improves, and overall heterogeneity decreases. Among the metrics examined, the PV of micropores (<50 nm) has the highest correlation with the multifractal parameters, followed by SSA, suggesting that variations in shale pore heterogeneity are controlled primarily by the development of micro- and mesopores.
5.3. Factors Affecting Heterogeneity of Shale Reservoirs
Variations in shale composition are a primary cause of differences in pore structure and reservoir heterogeneity. In marine shales, the proportions of TOC and silica-rich minerals are the key controls on pore architecture [7,10]. To examine the complexity of pore structures among different shale types and to identify the dominant roles of organic matter and mineral constituents, this study uses fractal analysis to quantify their contributions to pore structure heterogeneity.
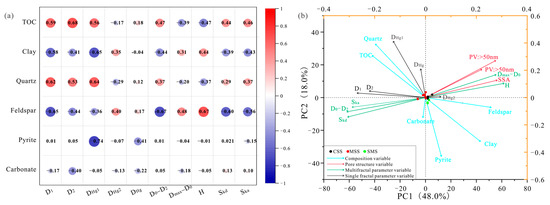
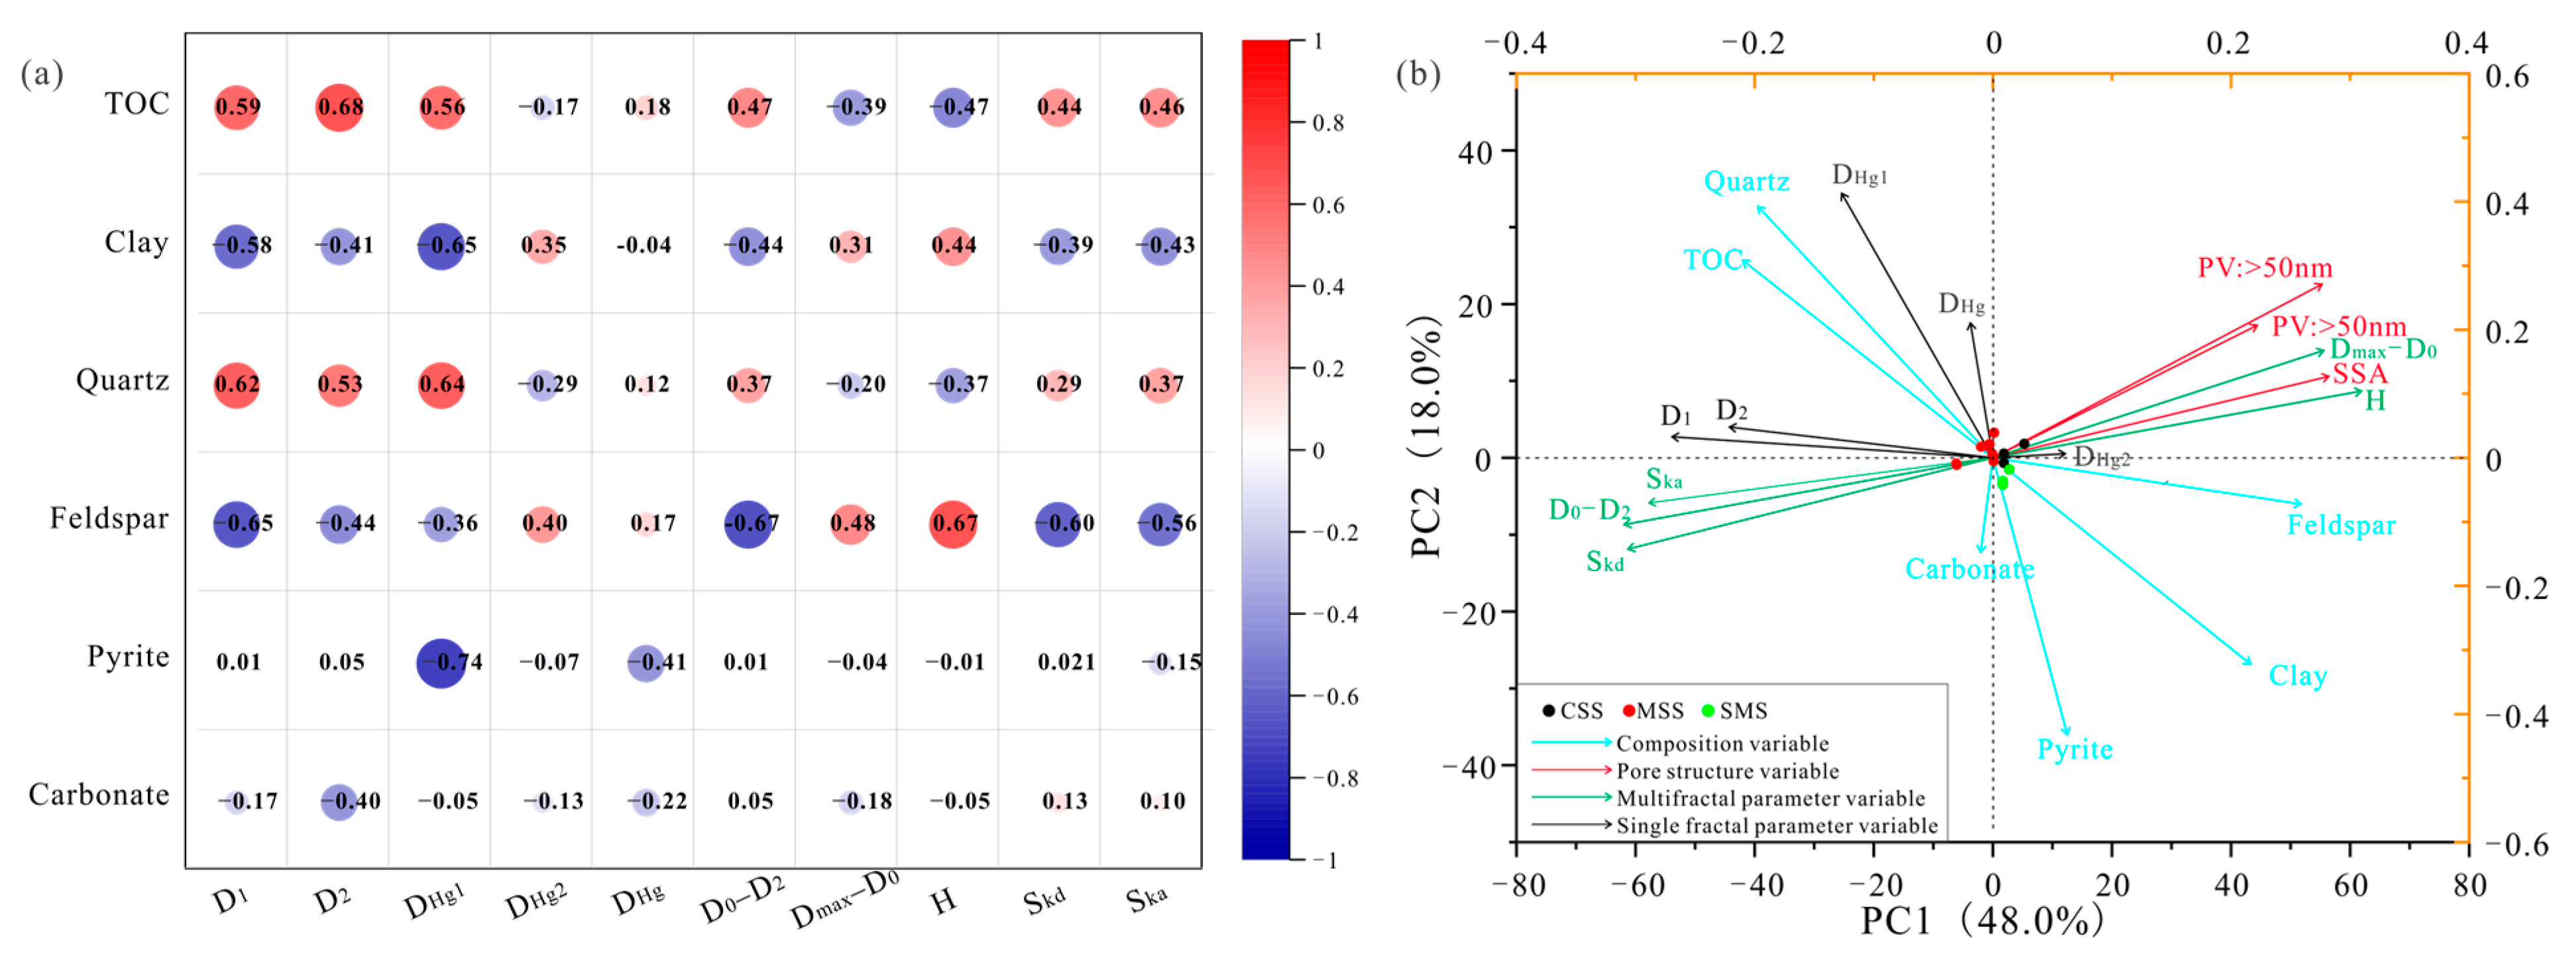
The results show that D1 and D2 increase linearly with TOC (Figure 11a), indicating that higher TOC is associated with greater pore structure heterogeneity in shale reservoirs. This relationship can be explained by the high thermal maturity of the WF–LMX Formation, which is in an overmature stage. During thermal evolution, organic matter undergoes intensive hydrocarbon generation and expulsion, leading to the progressive development of abundant organic matter-hosted nanopores [50,51]. As TOC increases, more organic matter is available for thermal decomposition, resulting in a higher density and complexity of organic pores, which in turn enhances pore structure heterogeneity and increases fractal dimensions. These pores are irregular in shape and have rough surfaces, which adds to pore-network heterogeneity (Figure 3). In parallel, maturation of organic matter together with inorganic diagenesis promotes the development of pores within mineral grains and between grains, broadening the range of pore types and further enhancing reservoir heterogeneity (Figure 4).
Figure 11.
(a) Correlation coefficient matrix; (b) principal component analysis of three shale facies samples.
Notably, TOC shows a stronger correlation with D2, indicating that TOC more strongly influences internal pore complexity. This is consistent with the honeycomb-like network of pores within organic matter observed in Figure 3. In contrast, DHg1 does not correlate significantly with TOC, implying that organic matter mainly affects the heterogeneity of 50–1000 nm pores and has a limited impact on pores larger than 1000 nm, in agreement with quantitative characterizations of pores in organic matter. Together, these findings show that the heterogeneity of micro- and mesopore structures is strongly controlled by TOC. Higher organic matter content supplies more micro- and mesopores in shale reservoirs.
D1 and D2 are both positively correlated with quartz content, indicating that higher quartz content increases the complexity of pore surfaces and internal pore space (Figure 11a). Quartz is abundant in these shales. By providing a rigid framework, quartz helps preserve early residual primary pores and increases rock brittleness, which in turn promotes the growth and extension of mineral-hosted pores and microfractures. Previous studies also show that the WF–LMX shale retains a substantial pore network even under deep burial and strong compaction. However, DHg1 shows a positive correlation with quartz, whereas DHg2 shows a weak negative correlation. These contrasting trends suggest that the protective influence of quartz is most pronounced for pores smaller than 1000 nm. In larger pores (>1000 nm), deformation may reduce pore complexity and heterogeneity.
Clay content is negatively correlated with two measures of surface and pore complexity, D1 and D2 (Figure 11a), indicating that clays diminish the complexity of reservoir surfaces and internal pore networks, with a pronounced effect on pore-surface roughness. Compared with silica-rich shale, the higher plasticity of clays makes them prone to compaction during diagenesis, which limits pore development. At high clay fractions, mineral alteration and shrinkage generate abundant interlayer pores and contraction cracks, strongly affecting adsorption pores and the heterogeneity of pore surfaces. Consistent with this, clay content is positively correlated with the mercury-intrusion index DHg2 and negatively with DHg1, implying that pores smaller than 1000 nm deform readily, thereby reducing pore-type diversity and overall reservoir heterogeneity. In addition, microfractures within and along the edges of clay minerals (Figure 4) provide effective pathways for fluid flow while further simplifying the pore structure.
Feldspar content shows negative correlations with D1 and D2, whereas carbonate content is negatively correlated only with D2 (Figure 11a). These patterns indicate that higher proportions of feldspar and carbonates tend to reduce shale reservoir heterogeneity. Readily soluble minerals such as feldspar promote pore development through dissolution. The resulting dissolution pores are relatively regular in shape with smooth surfaces, which likely reduces heterogeneity linked to surface roughness and geometry. In addition, because feldspar is a minor phase and far less abundant than quartz, its contribution to porosity is limited and partly controlled by the quartz fraction. Where carbonates are abundant, extensive dissolution can affect the entire pore-size spectrum, markedly decreasing both overall reservoir heterogeneity and the dispersion of pore sizes. Pyrite primarily hosts intercrystalline pores that withstand compaction. Its abundance correlates well with DHg1 and DHg, indicating a strong influence on heterogeneity in the macropore domain.
The multifractal metrics are consistent with the nitrogen adsorption results. TOC correlates positively with Skd and Ska (Figure 11a), indicating that higher TOC increases pore structure heterogeneity. This likely reflects the irregular shapes, isolation, and variable sizes of OMP, which amplify heterogeneity at the reservoir scale. Quartz content also shows a strong positive correlation with Skd and Ska, suggesting that higher silica content is a primary control on heterogeneity. In marine shales, silica is predominantly biogenic; its substantial input promotes TOC concentration and the development and preservation of pores, thereby accentuating pore-scale heterogeneity. By contrast, clay content is strongly negatively correlated with Skd and Ska. Increasing clay tends to equalize the PSD and improve connectivity, reducing reservoir heterogeneity, with particularly strong effects in the low-probability tails of the PSD. The opposing trends of clay and quartz indicate that greater biogenic silica input coupled with lower clay content increases heterogeneity while decreasing the uniformity of the PSD and overall connectivity.
To examine the links among shale facies, multifractal parameters, mineral composition, and pore structure, this study applied principal component analysis (PCA) to assess their relationships [25,52,53]. In the PCA plot, each variable is shown as an arrow; its projection onto a principal component indicates how strongly it contributes to that component, and the angle and length of the arrows indicate how the variables relate to one another. Figure 11b presents the nitrogen adsorption dataset, which includes 15 observations and 19 variables. The PC1 explains 48% of the total variance, indicating that it captures the dominant pattern in the data.
The multifractal parameters, the fractal metrics from N2 adsorption, and the pore structure variables all have large loadings on the principal components and are strongly associated with them, either positively or negatively. H and Dmax−D0 are tightly linked to PV and SSA, whereas D1 and D2 are closely associated with D0−D2 as well as the Ska and Skd indices. The former group plots on the positive side of PC1 and tracks the degree of pore development; the latter plots on the negative side of PC1 and reflects heterogeneity within micro- and mesopores. Together, these patterns indicate an inverse relationship between pore development and reservoir heterogeneity: as pore development increases, connectivity improves while heterogeneity diminishes. Accordingly, negative PC1 scores denote strong heterogeneity, poor connectivity, and a dispersed PSD, whereas positive PC1 scores denote weak heterogeneity, good connectivity, and well-developed pores. In comparisons between fractal parameters and mineralogical variables, heterogeneity shows a small angle and a long projection relative to TOC and quartz in the PCA loadings plot, indicating a positive correlation and a strong influence of TOC and quartz on heterogeneity. By contrast, clays and feldspars promote pore development but reduce heterogeneity. Carbonates and pyrite have only minor effects. When using mercury-intrusion fractal parameters to project the other variables, DHg and DHg2 exhibit very short projections and are poor indicators of heterogeneity. In contrast, DHg1 correlates closely with TOC and quartz, suggesting that the heterogeneity of submicron (<1000 nm) pores is strongly controlled by TOC and quartz.
6. Conclusions
Using mercury intrusion and low-temperature nitrogen adsorption measurements for WF–LMX shale, this study applied both single- and multi-scale analyses to characterize variability in pore sizes across rock types and to identify the factors that control this variability. The key findings are summarized below.
(1) The WF–LMX shale is classified into three facies (MSS, CSS, and SMS) based on differences in mineral composition and TOC content. The siliceous facies (MSS and CSS) generally exhibit higher TOC and quartz contents compared to the clay-rich facies, indicating compositional control on facies differentiation. Among these types, CSS has the greatest specific surface area and the largest mesopore and macropore volumes, indicating superior reservoir quality.
(2) All three shale facies exhibit clear single- and multifractal behavior. In the single-fractal model, the mean D1 exceeds D2, and both are lower than the fractal dimension derived from mercury intrusion (DHg). These results imply that, in shale, the internal complexity of micro- and mesopores is lower than the roughness of pore surfaces, and that macropores are more strongly heterogeneous. The D(q)–q spectrum is broad on the left and narrow on the right, whereas the α–f(α) spectrum shows the opposite pattern. Moreover, Skd and Ska are both well below 0.1, indicating markedly greater heterogeneity in low-probability pore domains than in high-probability domains.
(3) MSS shows the lowest D1, D2, and Hurst index, but the highest D0–D1 and D0–D2. These patterns indicate a highly dispersed pore-size distribution and limited reservoir connectivity. Consistent with this, MSS has the highest Skd and Ska, pointing to pronounced heterogeneity. By comparison, CSS exhibits the most uniform pore structure and the weakest heterogeneity across the shale facies.
(4) As the degree of pore development increases, the self-similarity of shale PSD increases and reservoir heterogeneity decreases. The variation in reservoir pore heterogeneity is mainly controlled by the development degree of micropores and mesopores. The heterogeneity of shale reservoirs is significantly influenced by TOC and quartz, while clay and feldspar minerals facilitate pore development but reduce reservoir heterogeneity.
Author Contributions
Conceptualization, M.W. and S.L.; methodology, Y.W.; validation, X.Y.; formal analysis, J.L.; investigation, Y.C. and X.D.; data curation, J.G.; writing—original draft preparation, M.W. and S.L.; writing—review and editing, Y.W. and X.Y.; visualization, J.L.; supervision, Y.C. and X.D.; project administration, J.G. and X.Y. All authors have read and agreed to the published version of the manuscript.
Funding
This study was financially supported by the General Project of the Chongqing Natural Science Foundation (Grant No. CSTB2022NSCQ-MXS1642), the Joint Fund for Innovation and Development of the Chongqing Natural Science Foundation (Grant No. CSTB2023NSCQ-LZX0078), the Science and Technology Research Program of the Chongqing Municipal Education Commission (Grant No. KJQN202401535), the National Natural Science Foundation of China (Grant No. 52174036), the Sichuan Science and Technology Program (Grant No. 2024NSFSC2008) and the Youth Science Research Project of Basic Research Program of Shanxi Province (Grant No. 202303021222252).
Data Availability Statement
Data is contained within the article.
Conflicts of Interest
Author Yulin Cheng was employed by the company Petroleum Industry Press Co., Ltd. The remaining authors declare that the research was conducted in the absence of any commercial or financial relationships that could be construed as a potential conflict of interest.
References
- Nie, H.; Dang, W.; Zhang, K.; Wang, J.; Li, P.; Chen, Q.; Lu, Z. Two Decades of Shale Gas Research and Development in China: Review and Prospects. Nat. Gas Ind. 2024, 44, 20–52. [Google Scholar]
- Zou, C.; Dong, D.; Zhang, Q.; Kong, W.; Liu, W.; Zhao, Z.; Yang, Z.; Zhao, Q.; Ding, R.; Cai, G.; et al. Formation, Potential, and Challenges of Marine–Continental Transitional Shale Gas in China. Earth Sci. 2025, 50, 4261–4283. [Google Scholar]
- Guo, X.; Wang, R.; Shen, B.; Wang, G.; Wan, C.; Wang, Q. Geological Characteristics, Resource Potential, and Development Direction of Shale Gas in China. Pet. Explor. Dev. 2025, 52, 17–32. [Google Scholar] [CrossRef] [Scilit]
- Zou, C.; Dong, D.; Xiong, W.; Fu, G.; Zhao, Q.; Liu, W.; Kong, W.; Zhang, Q.; Cai, G.; Wang, Y.; et al. Advances, Challenges, and Countermeasures in Shale Gas Exploration of Underexplored Plays, Sequences and New Types in China. Oil Gas Geol. 2024, 45, 309–326. [Google Scholar]
- Guo, T. Review and Reflection on Shale Gas Development in China: From Silurian to Cambrian. Pet. Reserv. Eval. Dev. 2025, 15, 339–348. [Google Scholar]
- Guo, X.; Borjigin, T.; Wei, X.; Yu, L.; Lu, X.; Sun, L.; Wei, F. Occurrence Mechanism and Exploration Potential of Deep Marine Shale Gas in the Sichuan Basin. Acta Pet. Sin. 2022, 43, 453–468. [Google Scholar]
- Nie, H.; Zhang, J.; Jin, Z.; Liu, Q.; Li, S.; Dang, W.; Li, P.; Bian, R.; Sun, C.; Zhang, K.; et al. Enrichment Mechanism of Marine Shale Gas: A Case Study of the Wufeng–Longmaxi Formations in the Sichuan Basin, SW China. Acta Geol. Sin. 2024, 98, 975–991. [Google Scholar]
- Wei, F.; Liu, Z.; Chen, F.; Yuan, T.; Li, F. Characteristics of Deep and Ultra-Deep Shale Reservoirs of the Wufeng–Longmaxi Formations in Southeastern Sichuan Basin and Implications for Shale Gas Exploration. Pet. Geol. Exp. 2023, 45, 751–760. [Google Scholar]
- Zhang, J.; Tao, J.; Li, Z.; Wang, X. Prospect of Deep Shale Gas Resources in China. Nat. Gas Ind. 2021, 41, 15–28. [Google Scholar]
- Wang, H.; Zhou, S.; Zhao, Q.; Shi, Z.; Liu, D.; Jiao, P. Enrichment Characteristics, Exploration Progress, and Prospects of Deep Shale Gas in the Southern Sichuan Basin, China. Oil Gas Geol. 2023, 44, 1430–1441. [Google Scholar]
- Fu, Y.; Jiang, Y.; Dong, D.; Hu, Q.; Lei, Z.; Peng, H.; Gu, Y.; Ma, S.; Wang, Z.; Yin, X.; et al. Microscopic Pore–Fracture Configuration and Gas-Filled Mechanisms of Shale Reservoirs in Western Chongqing, Sichuan Basin, China. Pet. Explor. Dev. 2021, 48, 916–927. [Google Scholar] [CrossRef] [Scilit]
- Xiong, L.; Yang, Z.; Shen, B.; Lu, L.; Wei, L.; Wang, R.; Pang, H. Micro-Reservoir Space Characteristics and Significance of Deep Shale Gas in the Wufeng–Longmaxi Formations, Weirong Area, Southern Sichuan. Nat. Gas Geosci. 2022, 33, 860–872. [Google Scholar]
- Guo, X.; Hu, D.; Yu, L.; Lu, L.; He, C.; Liu, W.; Lu, X. Micro-Mechanisms of Shale Self-Sealing and Shale Gas Preservation. Pet. Geol. Exp. 2023, 45, 821–831. [Google Scholar]
- Yang, X.; Zhao, S.; Liu, Y.; Liu, S.; Xia, Z.; Xu, F.; Fan, C.; Li, Y. Main Controlling Factors of Shale Gas Enrichment in the Wufeng–Longmaxi Formations, Ningxi Area, Sichuan Basin. Lithol. Reserv. 2024, 35, 99–110. [Google Scholar]
- Wang, H.; Liu, D.; Yu, Y.; Zhao, Q.; Qiu, Z.; Dong, D.; Shi, Z.; Sun, S.; Jiang, Z.; Liu, H.; et al. Enrichment Theory of Large-Area, High-Abundance Marine Shale Gas and Its Geological Evaluation Technology. Coal Geol. Explor. 2022, 50, 69–81. [Google Scholar]
- Wang, Y.; Wang, L.; Wang, J.; Jiang, Z.; Jin, C.; Wang, Y. Characterization of Organic Matter Pores in Typical Marine and Terrestrial Shales, China. J. Nat. Gas Sci. Eng. 2018, 49, 56–65. [Google Scholar] [CrossRef] [Scilit]
- Zhang, S.; Yan, J.; Hu, Q.; Wang, J.; Tian, T.; Chao, J.; Wang, M. Integrated NMR and FE-SEM Methods for Pore Structure Characterization of Shahejie Shale, Dongying Depression. Mar. Pet. Geol. 2019, 100, 85–94. [Google Scholar] [CrossRef] [Scilit]
- Wang, Y.; Liu, L.; Zheng, S.; Luo, Z.; Sheng, Y.; Wang, X. Full-Scale Pore Structure and Controlling Factors of the Wufeng–Longmaxi Shale, Southern Sichuan Basin. J. Nat. Gas Sci. Eng. 2019, 67, 134–146. [Google Scholar] [CrossRef] [Scilit]
- Hui, S.; Pang, X.; Chen, Z.; Hu, T.; Shi, K.; Di, G.; Li, M.; Mei, S.; Li, M. Quantifying the Contribution and Evolution of Pore Types in Over-Mature Marine Shale, Sichuan Basin. J. Asian Earth Sci. 2023, 249, 105625. [Google Scholar] [CrossRef] [Scilit]
- Wang, Y.; Wang, L.; Wang, J.; Jiang, Z.; Wang, C.-C.; Fu, Y.; Song, Y.-F.; Wang, Y.; Liu, D.; Jin, C. Multiscale Characterization of Three-Dimensional Pore Structures in a Shale Gas Reservoir: A Case Study of the Longmaxi Shale in Sichuan Basin, China. J. Nat. Gas Sci. Eng. 2019, 66, 207–216. [Google Scholar] [CrossRef] [Scilit]
- Almenningen, S.; Roy, S.; Hussain, A.; Seland, J.G.; Ersland, G. Effect of Mineral Composition on Transverse Relaxation Time Distributions and MR Imaging of Tight Rocks from Offshore Ireland. Minerals 2020, 10, 232. [Google Scholar] [CrossRef] [Scilit]
- Li, J.; Zheng, B. A New Method for Microscopic Pore Fractal Characterization and Its Application in Shale Reservoirs. Nat. Gas Ind. 2015, 35, 8. [Google Scholar]
- Ning, S.; Xia, P.; Hao, F.; Tian, J.; Fu, Y.; Wang, K. Pore Fractal Characteristics of Marine and Transitional Black Shales. Fractal Fract. 2024, 8, 288. [Google Scholar] [CrossRef] [Scilit]
- Sun, W.; Zuo, Y.; Wu, Z.; Liu, H.; Xi, S.; Shui, Y.; Wang, J.; Liu, R.; Lin, J. Fractal Analysis of pores and the pore structure of the Lower Cambrian Niutitang shale in northern Guizhou province: Investigations using NMR, SEM and image analyses. Mar. Pet. Geol. 2019, 99, 416–428. [Google Scholar] [CrossRef] [Scilit]
- Zhuang, H.; Jiang, Y.; Guan, Q.; Yin, X.; Gu, Y. Pore Evolution and Fractal Characteristics of Marine Shale: Longmaxi Formation. Fractal Fract. 2025, 9, 492. [Google Scholar] [CrossRef] [Scilit]
- Lopes, R.; Betrouni, N. Fractal and Multifractal Analysis: A Review. Med. Image Anal. 2009, 13, 634–649. [Google Scholar] [CrossRef] [Scilit]
- Wang, F.; Yang, K.; Zai, Y. Multifractal Characteristics of Shale and Tight Sandstone Pores. Pet. Sci. 2020, 17, 1209–1220. [Google Scholar] [CrossRef] [Scilit]
- Zheng, S.; Yao, Y.; Liu, D.; Cai, Y.; Liu, Y.; Li, X. Nuclear Magnetic Resonance T2 Cutoffs of Coals: A Novel Method by Multifractal Analysis Theory. Fuel 2019, 241, 715–724. [Google Scholar] [CrossRef] [Scilit]
- Wang, Y.; Zhong, B.; Yang, L.; Zhu, Y.; Xiang, J.; Zhang, T.; Zhang, H. Multiscale Fractal Evolution Mechanism of Pore Heterogeneity in Hydrocarbon Source Rocks: A Thermal Simulation Experiment in the Xiamaling Formation. Fractal Fract. 2025, 9, 351. [Google Scholar] [CrossRef] [Scilit]
- Wang, Z.; Jiang, Y.; Fu, Y.; Lei, Z.; Xu, C.; Yuan, J.; Wen, R.; Wang, Z.; Gu, Y.; Yin, X. Reservoir Pore Structure and Heterogeneity of Wufeng–Member 1 Shale in Western Chongqing Based on Nuclear Magnetic Resonance Characterization. Earth Sci. 2022, 47, 490–504. [Google Scholar]
- Xie, G.; Jiao, K.; Liu, R.; Deng, B.; Ye, Y.; Liu, S. Comparison of Pore Structures between Qiongzhusi Formation and Wufeng–Longmaxi Formation in the Sichuan Basin. J. Chengdu Univ. Technol. 2024, 51, 813–832. [Google Scholar]
- Fang, C.; Huang, Z.; Teng, L.; Xu, F.; Zhou, D.; Yin, Q.; Shao, W.; Shi, G. Lithofacies Palaeogeography of the Late Ordovician Kaitian Stage–Early Silurian Rhuddanian Stage in the Lower Yangtze Region and Its Petroleum Geological Significance. Geol. China 2020, 47, 144–160. [Google Scholar]
- Wang, Z.; Zhao, R.; Yang, L.; Yin, H.; Tang, W.; Liu, D.; Gu, Y.; Jiang, Y. Paleo-environmental and Geological Characteristics of Wufeng–Longmaxi Marine Shale in Different Paleo-geomorphological Units, Eastern Sichuan Basin, China. Nat. Gas Ind. B 2025, 12, 572–584. [Google Scholar] [CrossRef] [Scilit]
- Wang, H.; Shi, Z.; Sun, S.; Zhao, Q.; Zhou, T.; Cheng, F.; Bai, W. Microfacies Types and Distribution of Epicontinental Shale: A Case Study of the Wufeng–Longmaxi Shale in the Southern Sichuan Basin, China. Pet. Explor. Dev. 2023, 50, 51–64. [Google Scholar] [CrossRef] [Scilit]
- Pfeifer, P.; Wu, Y.; Cole, M.W.; Krim, J. Multilayer Adsorption on Fractally Rough Surfaces. Phys. Rev. Lett. 1989, 62, 1997–2000. [Google Scholar] [CrossRef] [Scilit]
- Zhang, C.; Guan, P.; Zhang, J.; Liang, X.; Ding, X.; You, Y. Progress in Fractal Theory for Pore Structure Characterization. Acta Sci. Nat. Univ. Pekin. 2023, 59, 897–908. [Google Scholar]
- Guan, Q.; Dong, D.; Sun, S.S.; Hu, L.; Qi, L.; Li, C.; Chen, C.; Chen, X. Fractal Characteristics and Geological Significance of Pore Structure in Deep Organic-Rich Shales: A Case Study of the Lower Silurian Longmaxi Formation in the Weiyuan Area, Sichuan Basin. Nat. Gas Ind. 2024, 44, 108–118. [Google Scholar]
- Crownover, R.M. Introduction to Fractals and Chaos; Jones and Bartlett: Boston, MA, USA; London, UK, 1995. [Google Scholar]
- Vázquez, E.V.; Ferreiro, J.P.; Miranda, J.G.V.; Paz González, A. Multifractal Analysis of Pore Size Distributions. Vadose Zone J. 2008, 7, 500–511. [Google Scholar] [CrossRef] [Scilit]
- Xiao, L.; Li, J.; Mao, Z.; Lu, J.; Yu, H.; Guo, H.; Li, G. A Method to Determine Nuclear Magnetic Resonance (NMR) T2 Cutoff Based on Normal Distribution Simulation in Tight Sandstone Reservoirs. Fuel 2018, 225, 472–482. [Google Scholar] [CrossRef] [Scilit]
- Chhabra, A.; Jensen, R.V. Direct Determination of f(α) Singularity Spectrum. Phys. Rev. Lett. 1989, 62, 1327–1330. [Google Scholar] [CrossRef] [Scilit]
- Halsey, T.C.; Jensen, M.H.; Kadanoff, L.P.; Procaccia, I.; Shraiman, B.I. Fractal Measures and Their Singularities: The Characterization of Strange Sets. Nucl. Phys. B Proc. Suppl. 1987, 2, 501–511. [Google Scholar] [CrossRef] [Scilit]
- Wu, J.; Guo, W.; Zhao, S.; Gou, Q.; Zeng, F.; Liu, Y.; Zou, X.; Wang, Y.; Liu, Z. Sweet Spot Lithofacies and Its Genesis Mechanism for Stereoscopic Development of Deep Marine Shale: A Case Study of the First Submember of Member 1 of Longmaxi Formation in Luzhou Area, Southern Sichuan Basin. Acta Pet. Sin. 2024, 45, 1219–1233. [Google Scholar]
- Loucks, R.G.; Reed, R.M.; Ruppel, S.C.; Jarvie, D.M. Morphology, Genesis, and Distribution of Nanometer-Scale Pores in Siliceous Mudstones of the Mississippian Barnett Shale. J. Sediment. Res. 2009, 79, 848–861. [Google Scholar] [CrossRef] [Scilit]
- International Union of Pure and Applied Chemistry. Recommendations for the Characterization of Porous Solids. Pure Appl. Chem. 1994, 66, 1739–1758. [Google Scholar] [CrossRef] [Scilit]
- Li, P.; Zheng, M.; Bi, H.; Wu, S.; Wang, X. Pore throat structure and fractal characteristics of tight oil sandstone. J. Pet. Sci. Eng. 2017, 149, 665–674. [Google Scholar] [CrossRef] [Scilit]
- Zhang, J.; Han, D.; Lin, W.; Wang, C.; Wang, J.; Xiao, X.; Li, Y.; Zhang, X. Pore Structure and Fractal Characteristics of Coal-Bearing Cretaceous Nenjiang Shales from Songliao Basin, Northeast China. J. Nat. Gas Geosci. 2024, 9, 197–208. [Google Scholar] [CrossRef] [Scilit]
- Zhu, F.; Hu, W.; Cao, J.; Sun, F.; Liu, Y.; Sun, Z. Micro/nanoscale pore structure and fractal characteristics of tight gas sandstone: A case study from the Yuanba area, northeast Sichuan Basin, China. Mar. Petrol. Geol. 2018, 98, 116–132. [Google Scholar] [CrossRef] [Scilit]
- Li, Y.; Liu, D.; Feng, X.; Zhao, F.; Chen, Y.; Wang, Y.; Lin, R.; Du, W.; Fan, Q.; Song, Y.; et al. Heterogeneity characteristics and its controlling factors of marine shale reservoirs from the Wufeng–Longmaxi Formation in the Northern Guizhou Area. Geol. China 2024, 51, 780–798. [Google Scholar]
- Teng, J.; Liu, B.; Mastalerz, M.; Schieber, J. Origin of Organic Matter and Organic Pores in the Overmature Ordovician–Silurian Wufeng–Longmaxi Shale of the Sichuan Basin, China. Int. J. Coal Geol. 2022, 253, 103970. [Google Scholar] [CrossRef] [Scilit]
- Chang, J.; Fan, X.; Jiang, Z.; Wang, X.; Chen, L.; Li, J.; Zhu, L.; Wan, C.; Chen, Z. Differential impact of clay minerals and organic matter on pore structure and its fractal characteristics of marine and continental shales in China. Appl. Clay Sci. 2022, 216, 106334. [Google Scholar] [CrossRef] [Scilit]
- Li, H.; He, S.; Radwand, A.E.; Xie, J.T.; Qin, Q.R. Quantitative analysis of pore complexity in lacustrine organic-rich shale and comparison to marine shale: Insights from experimental tests and fractal theory. Energy Fuels 2024, 38, 16171–16188. [Google Scholar] [CrossRef] [Scilit]
- Xue, J.; Lee, C.; Wakeham, S.G.; Armstrong, R. PCA and cluster analysis of organic geochemistry. Org. Geochem. 2011, 42, 356–367. [Google Scholar] [CrossRef] [Scilit]

Disclaimer/Publisher’s Note: The statements, opinions and data contained in all publications are solely those of the individual author(s) and contributor(s) and not of MDPI and/or the editor(s). MDPI and/or the editor(s) disclaim responsibility for any injury to people or property resulting from any ideas, methods, instructions or products referred to in the content. |
© 2026 by the authors. Licensee MDPI, Basel, Switzerland. This article is an open access article distributed under the terms and conditions of the Creative Commons Attribution (CC BY) license.