


Abstract
Wetting–air-drying cycling significantly alters the internal damage evolution and failure behavior of sandstone, and identifying reliable acoustic-emission (AE) precursors during loading is important for understanding the rupture mechanism of water-affected rock. In this study, uniaxial compression tests with AE monitoring were conducted on green sandstone subjected to different numbers of wetting–air-drying cycles. Ringing counts, RA–AF parameters, b-value evolution, AE spatial localization, and the correlation dimension D2 were jointly used to characterize mechanical deterioration, failure-mode transition, and fractal dynamic evolution. The results show that increasing cycling causes a progressive decrease in peak stress and elastic modulus, while AE activity evolves from a relatively dispersed state to stronger pre-peak concentration. The RA–AF distributions indicate that the dominant AE population gradually shifts from tensile-feature dominance toward mixed/shear-involved behavior, suggesting increasing shear participation during failure. The b-value captures stage-dependent damage evolution but exhibits relatively strong fluctuations under increasingly nonstationary event distributions. In contrast, D2 shows a clearer pre-peak turning feature, and the corresponding stress level remains relatively consistent among different cycling groups. These results indicate that wetting–air-drying cycling not only accelerates the mechanical degradation of green sandstone, but also substantially modifies its rupture dynamics. The D2 feature may therefore serve as a potential precursor parameter for characterizing pre-peak complexity transition in water-affected sandstone.
1. Introduction
Wetting–drying (W–D) processes are ubiquitous in rock engineering settings affected by water-level fluctuations, rainfall infiltration, groundwater cycling, and reservoir impoundment–drawdown, including slopes, tunnel portals, and reservoir banks [1,2,3]. In sedimentary rocks such as sandstone, repeated wetting followed by air drying progressively degrades the microstructure through differential mineral swelling–shrinkage, weakening of cementation, and accelerated subcritical crack growth driven by capillary effects and hydration–dehydration [4,5,6]. Such hydraulic cycling not only reduces strength and stiffness but can also shift the failure route from relatively localized brittle rupture to more distributed progressive damage, accompanied by earlier nonlinearity and a more unstable post-peak response [7,8,9]. Clarifying how W–D degradation reorganizes microcrack activity, crack-mode participation, and the spatiotemporal pathway to macroscopic failure is therefore essential for durability assessment and early warning of water-affected rock masses [10,11].
Acoustic emission (AE) monitoring offers a nondestructive, high-temporal-resolution means of interrogating microcracking, because transient elastic waves are released during crack initiation, propagation, and coalescence [12,13,14]. In brittle geomaterials, AE activity commonly evolves through stages—closure/compaction of pre-existing defects, quasi-elastic deformation, stable crack growth, accelerated coalescence toward peak stress, and post-peak frictional reactivation—making AE attractive for identifying damage thresholds and precursor signatures [13,14,15,16]. Conventional descriptors (e.g., ringing counts, energy, amplitude, and cumulative measures) have therefore been widely used to track damage accumulation and link microcrack activity to stress–strain behavior [14,15,16,17]. Under W–D degradation, however, the defect population becomes denser and more heterogeneous, and microcrack interactions become more intermittent and spatially distributed; consequently, precursor identification based solely on cumulative curves may be obscured by nonstationarity and competing damage zones [18,19,20].
To infer crack modes, feature-based AE classification has been widely adopted. The RA–AF framework (and related rise-time/amplitude and frequency metrics) is frequently used to distinguish tensile-dominated events from shear-dominated or mixed-mode events and to interpret failure-mode transitions [21,22,23,24]. In parallel, the b-value concept, adapted from the Gutenberg–Richter relation, quantifies the slope of the log frequency–amplitude distribution and reflects the evolving hierarchy between small and large events, providing insight into crack-scale redistribution and impending coalescence [25,26,27,28]. Despite their utility, RA–AF and b-value analyses are sensitive to windowing choices, sparse-event intervals, and decision boundaries (e.g., separating lines in RA–AF space), which can introduce scatter when heterogeneity is amplified by hydraulic cycling [28,29,30]. Moreover, these metrics are primarily statistical; without explicit spatial information, it remains difficult to identify where damage concentrates, how multiple damage corridors compete, and how spatial evolution relates to the eventual macroscopic fracture morphology [31,32].
AE source localization bridges event statistics and spatial damage by reconstructing hypocenters from multi-sensor arrival times [33]. When combined with spatial density mapping—such as kernel density estimation (KDE)—localization results can be converted into a continuous damage-intensity field, enabling robust identification of damage concentration zones and their migration during loading [34]. This spatiotemporal mapping is particularly valuable for W–D-degraded rocks, in which distributed microcracking and multiple weak interfaces can produce complex localization patterns [35].
Beyond statistical and spatial descriptors, fractal and nonlinear-dynamical approaches have increasingly been used to quantify the complexity of fracture evolution [36,37,38]. Rock failure is a multiscale, intermittent process with emergent organization, suggesting that complexity metrics may capture regime transitions that precede macroscopic instability [39]. In this context, phase-space reconstruction provides a principled means to recover latent dynamics from AE time series, and the correlation dimension offers a compact measure of effective degrees of freedom and self-similar complexity in the evolving damage system [40,41,42]. Relative to single-parameter descriptors, a sliding-window correlation-dimension series may reveal turning behaviors and local extrema that serve as potential precursors while remaining sensitive to intermittent coupling among microcracks [43]. Nevertheless, for sandstone subjected to systematic wetting–air-drying cycles, integrated studies that jointly consider (i) staged AE activity, (ii) failure-mode transitions, (iii) crack-scale redistribution, (iv) spatial localization/density mapping, and (v) nonlinear complexity evolution within a unified framework remain limited [44]. Most previous studies have addressed only one or two aspects of fracture evaluation, making it difficult to integrate AE activity evolution, crack-mode transition, spatial damage localization, and nonlinear dynamic complexity into a unified hydraulic-cycling-induced failure framework.
As summarized in Table 1, sandstone fracture evaluation has gradually evolved from conventional stress–strain-based identification toward integrated approaches involving crack initiation and propagation analysis, AE parameter characterization, spatial localization, and nonlinear dynamic indicators [45,46]. Although previous studies have clarified key stress thresholds, crack propagation paths, and failure-mode evolution, a unified framework linking mechanical degradation, crack-mode transition, spatial damage concentration, and AE dynamic complexity under wetting–air-drying deterioration is still limited. Therefore, the present study combines ringing counts, RA–AF analysis, b-value evolution, AE spatial localization, and correlation dimension D2 to characterize staged damage accumulation, crack-mode transition, crack-scale redistribution, spatial localization, and nonlinear complexity evolution within the same fracture process [47,48,49].
Table 1.
Summary of recent methodologies for sandstone fracture evaluation.
Here, we perform uniaxial compression tests with synchronous AE monitoring on green sandstone specimens subjected to different numbers of wetting–air-drying cycles. We develop an integrated AE analysis framework in which ringing-count evolution quantifies staged damage accumulation; RA–AF feature distributions track failure-mode transitions; moving-window b-value analysis characterizes crack-scale redistribution; and AE source localization combined with KDE mapping identifies damage concentration zones and their migration during loading [35]. In addition, the AE ringing-count time series is analyzed via phase-space reconstruction, and the correlation dimension (computed using the correlation-integral method) is evaluated in a sliding-window manner to quantify time-varying nonlinear complexity [40,41,42]. On this basis, we propose a turning-stress criterion that defines the first local maximum of the correlation dimension as an instability precursor, and we examine its robustness by comparison with b-value-based turning-point identification and with independent AE mode/spatial evidence [45]. Specifically, we aim to (i) elucidate how W–D degradation advances microcrack activation and reshapes the spatiotemporal damage pathway, (ii) clarify systematic trends in tensile–shear participation and crack-scale hierarchy under hydraulic cycling, (iii) determine whether AE localization and KDE-based spatial mapping can reveal damage concentration evolution consistent with final failure morphology, and (iv) evaluate whether the correlation-dimension-based turning stress provides a relatively robust precursor compared with conventional AE indicators such as the b-value.
2. Experimental Program and AE Data Processing
2.1. Specimen Preparation and Wetting–Drying Protocol
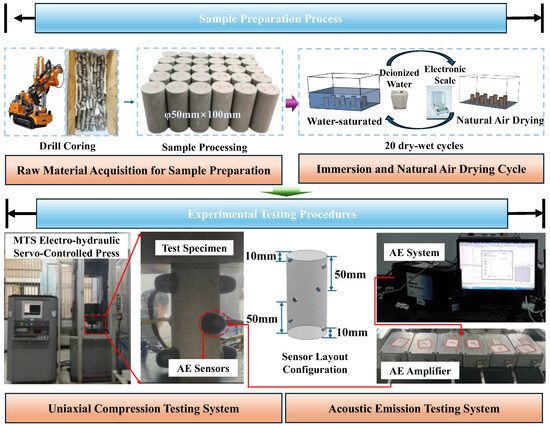
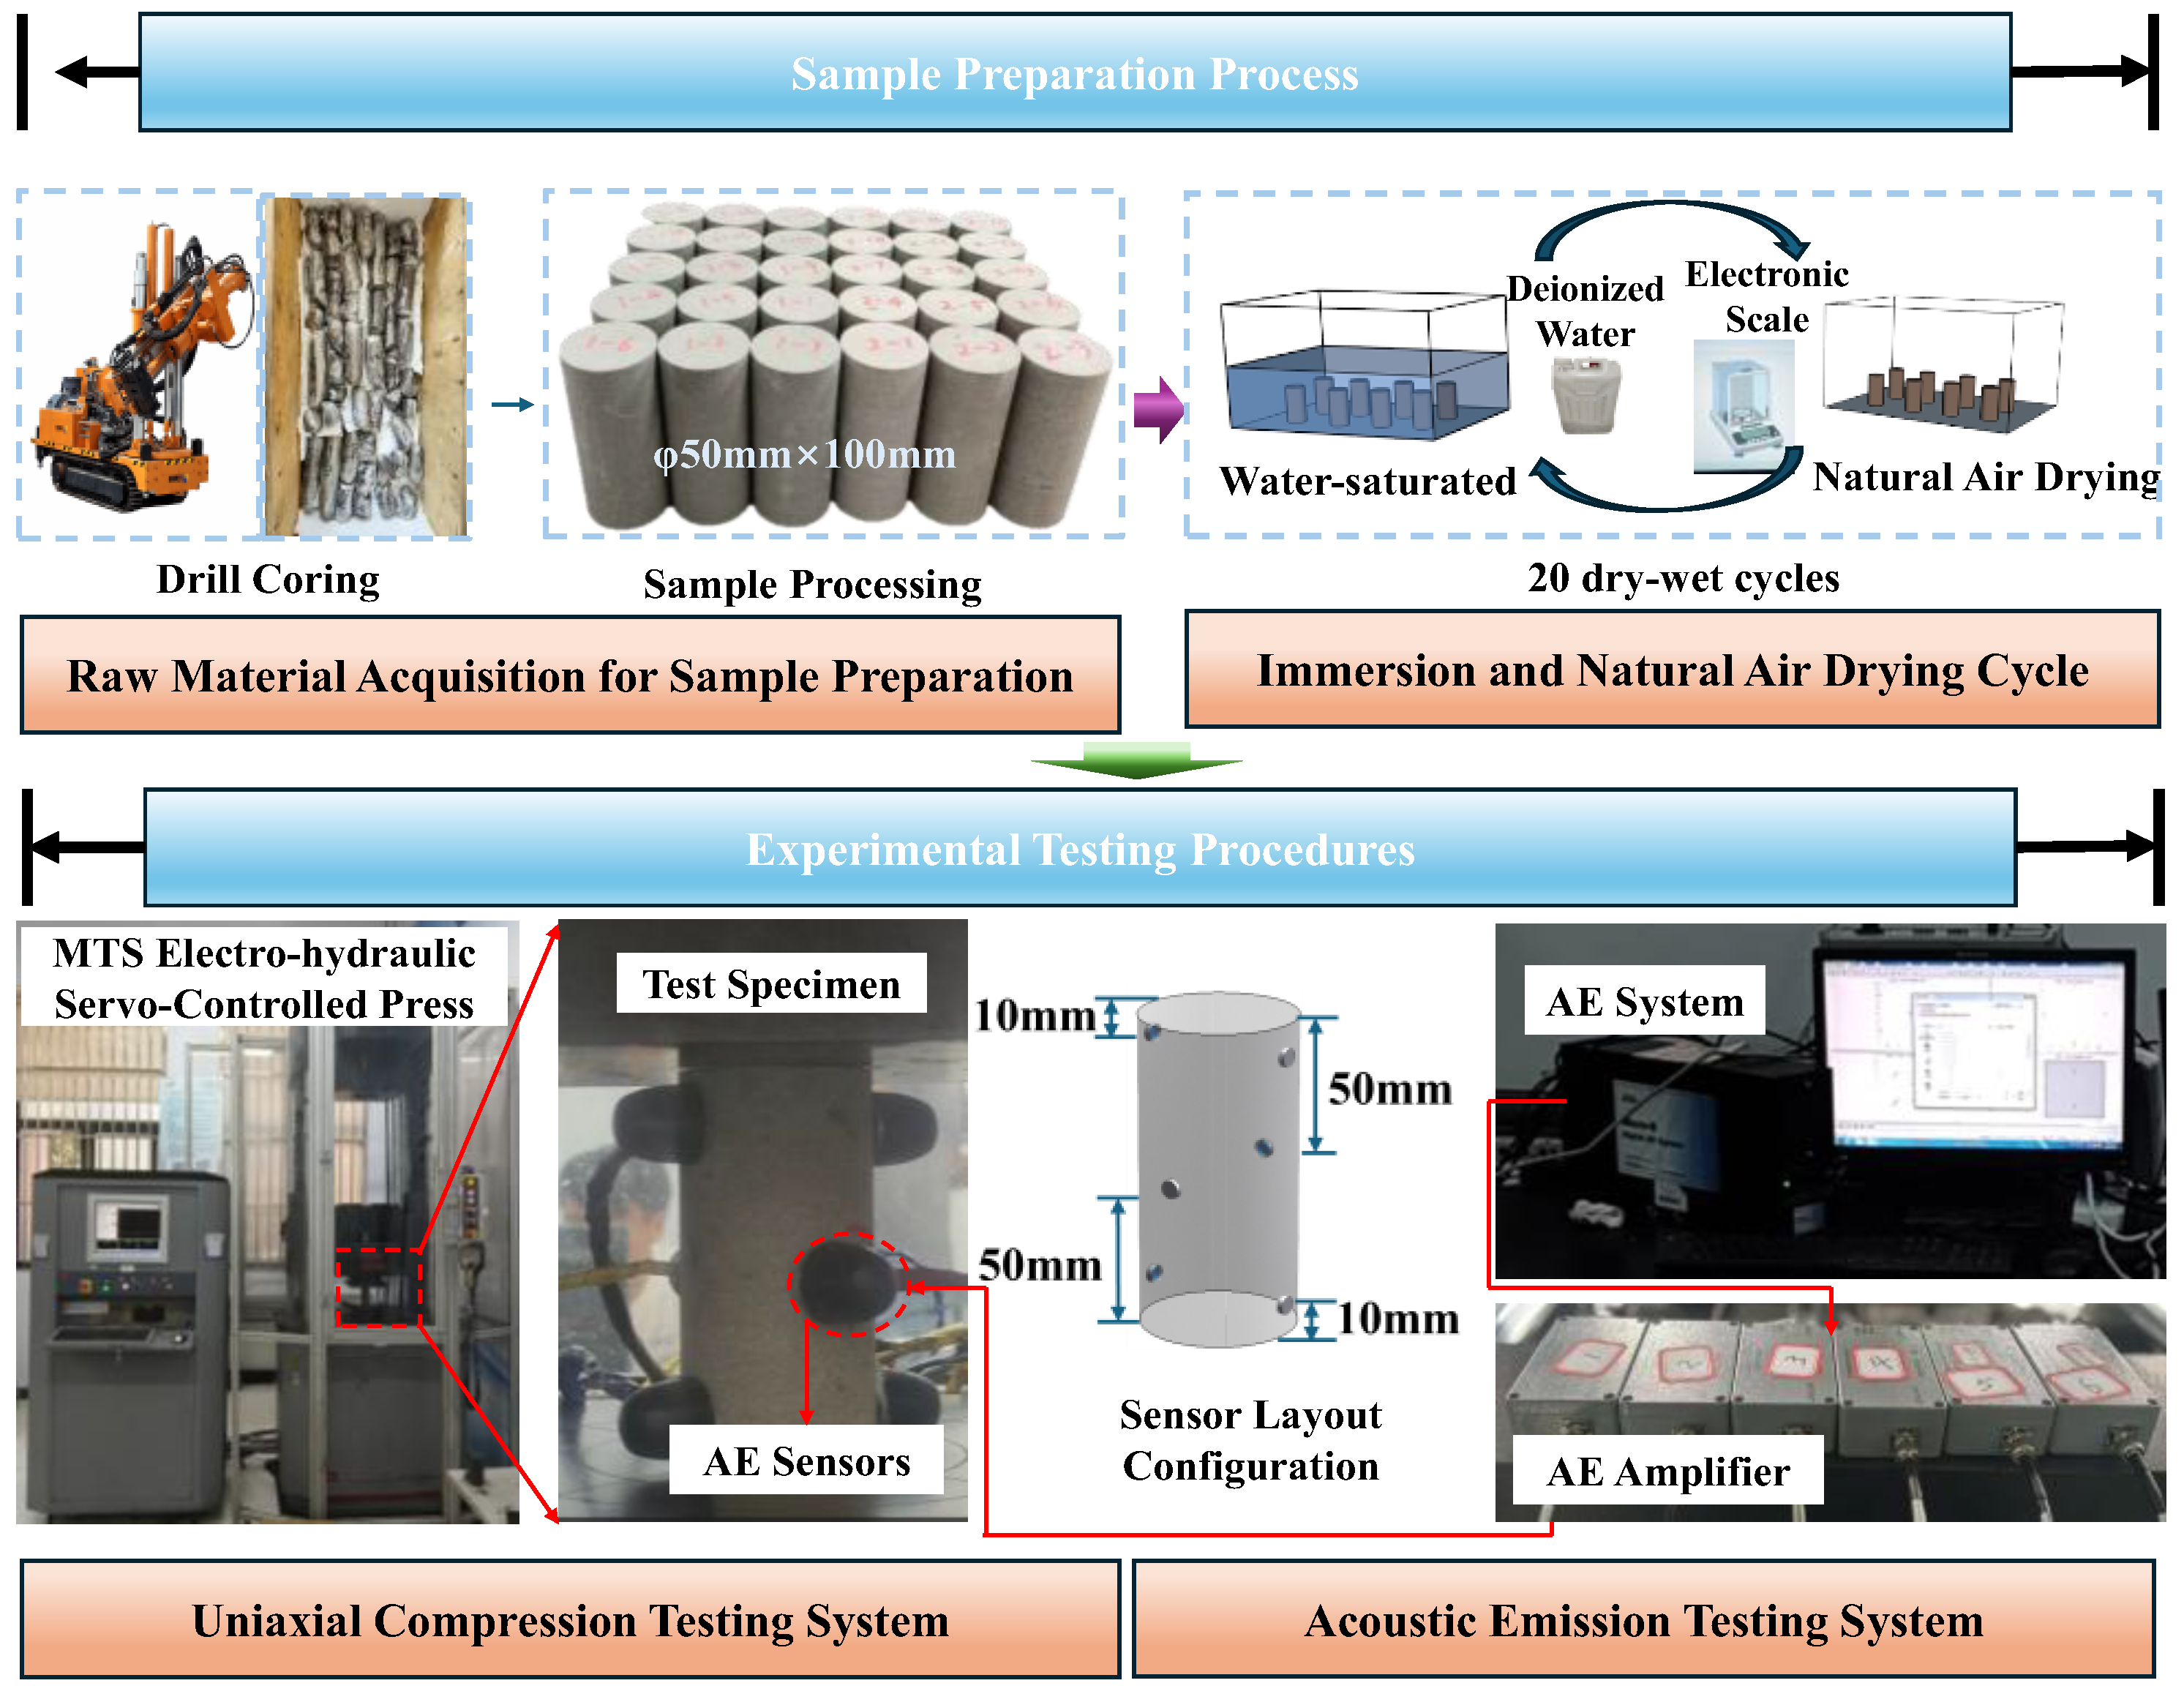
Green sandstone blocks were collected from a mining area in western China. All specimens were cored from the same stratum to minimize lithologic variability and were cut and ground into cylinders 50 mm in diameter and 100 mm in height. Unless otherwise specified, specimens were tested under their natural moisture condition, following the procedure shown in Figure 1.
Figure 1.
Schematic of specimen preparation and testing procedure.
Five groups were prepared after 0, 5, 10, 15, and 20 wetting–air-drying cycles, with three replicate specimens per group (15 specimens in total). One cycle comprised two steps: (i) immersion in deionized water at room temperature for 8 h, and (ii) indoor air drying under ambient conditions for approximately 24 h. Specimens were weighed during cycling, and the drying step was deemed complete when the mass change between two consecutive measurements was <0.1%, after which the next cycle (or the mechanical test) was initiated. All cycle groups were subjected to the same immersion duration, air-drying conditions, and mass-stabilization criterion; therefore, the terminal state of specimens prior to mechanical testing was judged using a unified standard, ensuring inter-group comparability.
2.2. Uniaxial Compression and AE Monitoring
Uniaxial compression tests were performed using an MTS electro-hydraulic servo-controlled testing machine (Figure 1). Displacement control was applied at a loading rate of 0.03 mm/s. After reaching peak stress, loading was continued to capture post-peak behavior, and the test was terminated once the post-peak stress had dropped by 30% relative to the peak value. The nominal axial strain was estimated as actuator displacement divided by the initial specimen height. All tests were conducted under laboratory ambient conditions.
AE monitoring was carried out using a PCI-2 system equipped with Mini300 sensors. Six sensors were mounted on the lateral surface at three axial levels with circumferential staggering, as shown in the “Sensor Layout Configuration” in Figure 1. Silicone grease was used as the coupling agent, and the sensors were fixed with magnetic holders to ensure stable coupling and reduce frictional noise. The preamplifier gain was 40 dB, and the sampling rate was 3 MHz; a band-pass filter of 100–800 kHz was applied. The acquisition threshold was set to 40 dB, and the timing parameters were PDT/HDT/HLT = 200/300/50 μs. Prior to testing, wave velocity and system delay were calibrated using an acoustic calibration procedure; the mean calibrated P-wave velocity was 1531 m/s. Event locations were determined by least-squares inversion, yielding an average localization error of ~3 mm. Mechanical and AE data were recorded synchronously for subsequent coupled analyses.
2.3. AE Parameters and Data Processing
To characterize microcracking during loading, AE ringing counts were used as the primary activity descriptor, and cumulative–count curves were constructed to highlight staged AE evolution. For each AE event, the following parameters were defined [30]:
RA value: RA = RT/A, where RT is the rise time and A is the amplitude.
AF value: AF = C/D, where C is the count and D is the duration.
For RA–AF-based crack-mode discrimination, to reduce subjectivity in choosing a separating line, the maximum-slope criterion in AF–RA space was adopted as the boundary to partition the event cloud into regions dominated by tensile-type and shear-type cracking, respectively. This classification was then used to compare failure-mode transitions among specimens subjected to different numbers of wetting–drying cycles. To reduce subjectivity in defining the AF–RA boundary, no empirical manual line was adopted. Instead, the boundary slope was determined using a maximum-slope rule according to the dominant distribution trend of AE events in the RA–AF feature space. This method was used to characterize the relative evolution of failure mode under different wetting–air-drying conditions rather than to define the absolute crack type of each individual AE event.
In addition, a moving-window b-value analysis was used to quantify damage evolution and changes in the crack-size distribution. Event amplitude (or an equivalent measure) was assumed to follow a Gutenberg–Richter-type relation:
where N is the number of events with amplitude ≥ A, and a and b are regression parameters. In this study, the b-value was calculated using a moving-window of 500 AE events and a step size of 25 events. This combination was selected as a compromise between statistical stability and evolutionary resolution, since smaller windows are more susceptible to random fluctuations, whereas larger windows may obscure pre-peak turning features. The step size of 25 events provides sufficient overlap between adjacent windows, enabling smoother tracking of b-value evolution during loading. The selected parameters are therefore appropriate for the AE-event density and data scale of the present dataset, but should not be regarded as universally optimal for all rock AE analyses.
To characterize the spatial evolution of damage, AE source localization and kernel density mapping were also performed. First-arrival times were picked from multichannel waveforms and, together with calibrated sensor coordinates, wave velocity, and system delay, were used to build a travel-time model. The resulting hypocenter catalog was visualized as 3D point clouds. A Gaussian KDE was then applied to the hypocenter coordinates to obtain a continuous spatial density field on a grid, thereby identifying AE-active (damage-concentrated) zones and their migration during loading. In addition, the crack initiation point can be identified by combining the deviation in the stress–strain response from the near-linear elastic stage with the onset of intensified AE activity.
3. Fractal Characterization of AE Time Series
3.1. Phase-Space Reconstruction and Phase-Trajectory Analysis
To recover latent damage dynamics from AE time series, we employ delay-coordinate embedding for phase-space reconstruction. Let the AE ringing-count sequence be x = {x1, x2, …, xn}, where xi is the ringing count at the i-th sampling instant. Because AE hits are not strictly evenly spaced in time, the event stream was converted to a uniformly sampled ringing-count series by resampling onto an equal-interval time grid. Specifically, ringing counts within each fixed time bin (Δt = 1 s) were summed to obtain xi. This equal-interval resampling ensures the validity of delay-coordinate embedding and subsequent correlation-dimension estimation. With time delay τ and embedding dimension m, the reconstructed vectors in an m-dimensional phase space are defined as [44]:
where N = n − (m − 1)τ. With appropriate (m, τ), the reconstructed phase space is topologically equivalent to the original system, enabling characterization of nonlinear evolution and complexity variations during fracturing.
To reduce subjectivity in parameter selection, the embedding dimension m was determined using the false nearest neighbors (FNN) method, and the delay τ was selected using the autocorrelation function to balance redundancy and information loss. Preliminary analyses on representative specimens across cycle groups showed that the FNN ratio stabilized at m ≈ 5, and the autocorrelation function suggested τ ≈ 6; therefore, to ensure strict comparability among all specimens, we adopted m = 5 and τ = 6 throughout.
Because the reconstructed space is typically high-dimensional, direct visualization is inconvenient. We therefore applied principal component analysis (PCA) to the reconstructed matrix X = [X1T,…,XNT]T. An eigen-decomposition (equivalently, SVD) of Y = XTX was performed, and the eigenvectors v1, v2, and v3 associated with the three largest eigenvalues were selected as principal directions. The 3D projection is then given by:
Denoting the projected axes as U, V, and W, we obtain a comparable 3D phase trajectory. Trajectory contraction/expansion, clustering, and geometric morphology provide an intuitive view of damage evolution and support subsequent correlation-dimension estimation and precursor extraction.
3.2. Correlation Dimension D2 via the Correlation Integral
To quantify the complexity and self-similarity of the fracturing process, we compute the correlation dimension D2 using the Grassberger–Procaccia (GP) algorithm. In the embedding space, the Euclidean distance between two reconstructed vectors Xi and Xj is dij = ‖Xi − Xj‖. For a scale r > 0, the correlation integral is defined as:
where H(·) is the Heaviside step function:
Within an appropriate scaling region, is approximately linear with , and the slope corresponds to the correlation dimension D2. To improve numerical stability and reduce subjectivity in interval selection, we adopt a discrete-slope form. For two scales r1 and r2,
In practice, logarithmically spaced scales rk are selected within the scaling region [ra, rb], is computed, and slope estimates are obtained via central differences. The mean or median of the slope series is used as the representative D2. For additional robustness, least-squares linear fitting over [ra, rb] can also be used, with the fitted slope taken as D2; the two approaches should agree when the scaling region is properly chosen.
3.3. Sliding-Window Fractal Evolution and Turning-Stress Criterion
To capture time-varying complexity over the full loading process, we introduce a sliding-window strategy. The AE count series is partitioned into consecutive windows, and the correlation dimension and phase trajectory are computed independently for each window. Let the window length be L (data points, or equivalently time) and the step size be s. The k-th window is:
This procedure yields a loading-path-evolving D2 series and the corresponding phase-trajectory series, enabling stage-wise comparison from both geometric and statistical perspectives. To link fractal indicators with mechanical response, each window is mapped to the synchronized stress curve. The stress at the window center, σ(tk+L/2), is used as the representative stress of that window, thus constructing the D2–σ evolution. A turning stress σtp is defined for precursor identification: when D2(σ) exhibits a typical pre-peak “increase-then-decrease” pattern, σtp is taken as the stress corresponding to the first local maximum of D2. This additional condition is introduced to exclude short-lived false peaks caused by local noise fluctuations, so that the identified turning point reflects a genuine stage transition in the evolution of damage complexity rather than a random fluctuation.
4. Results and Discussion
4.1. Macroscopic Mechanical Response and Physical Deterioration
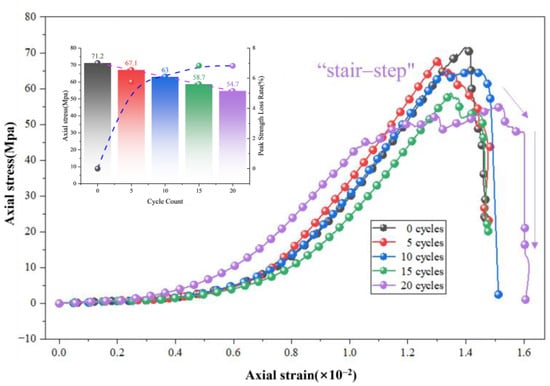
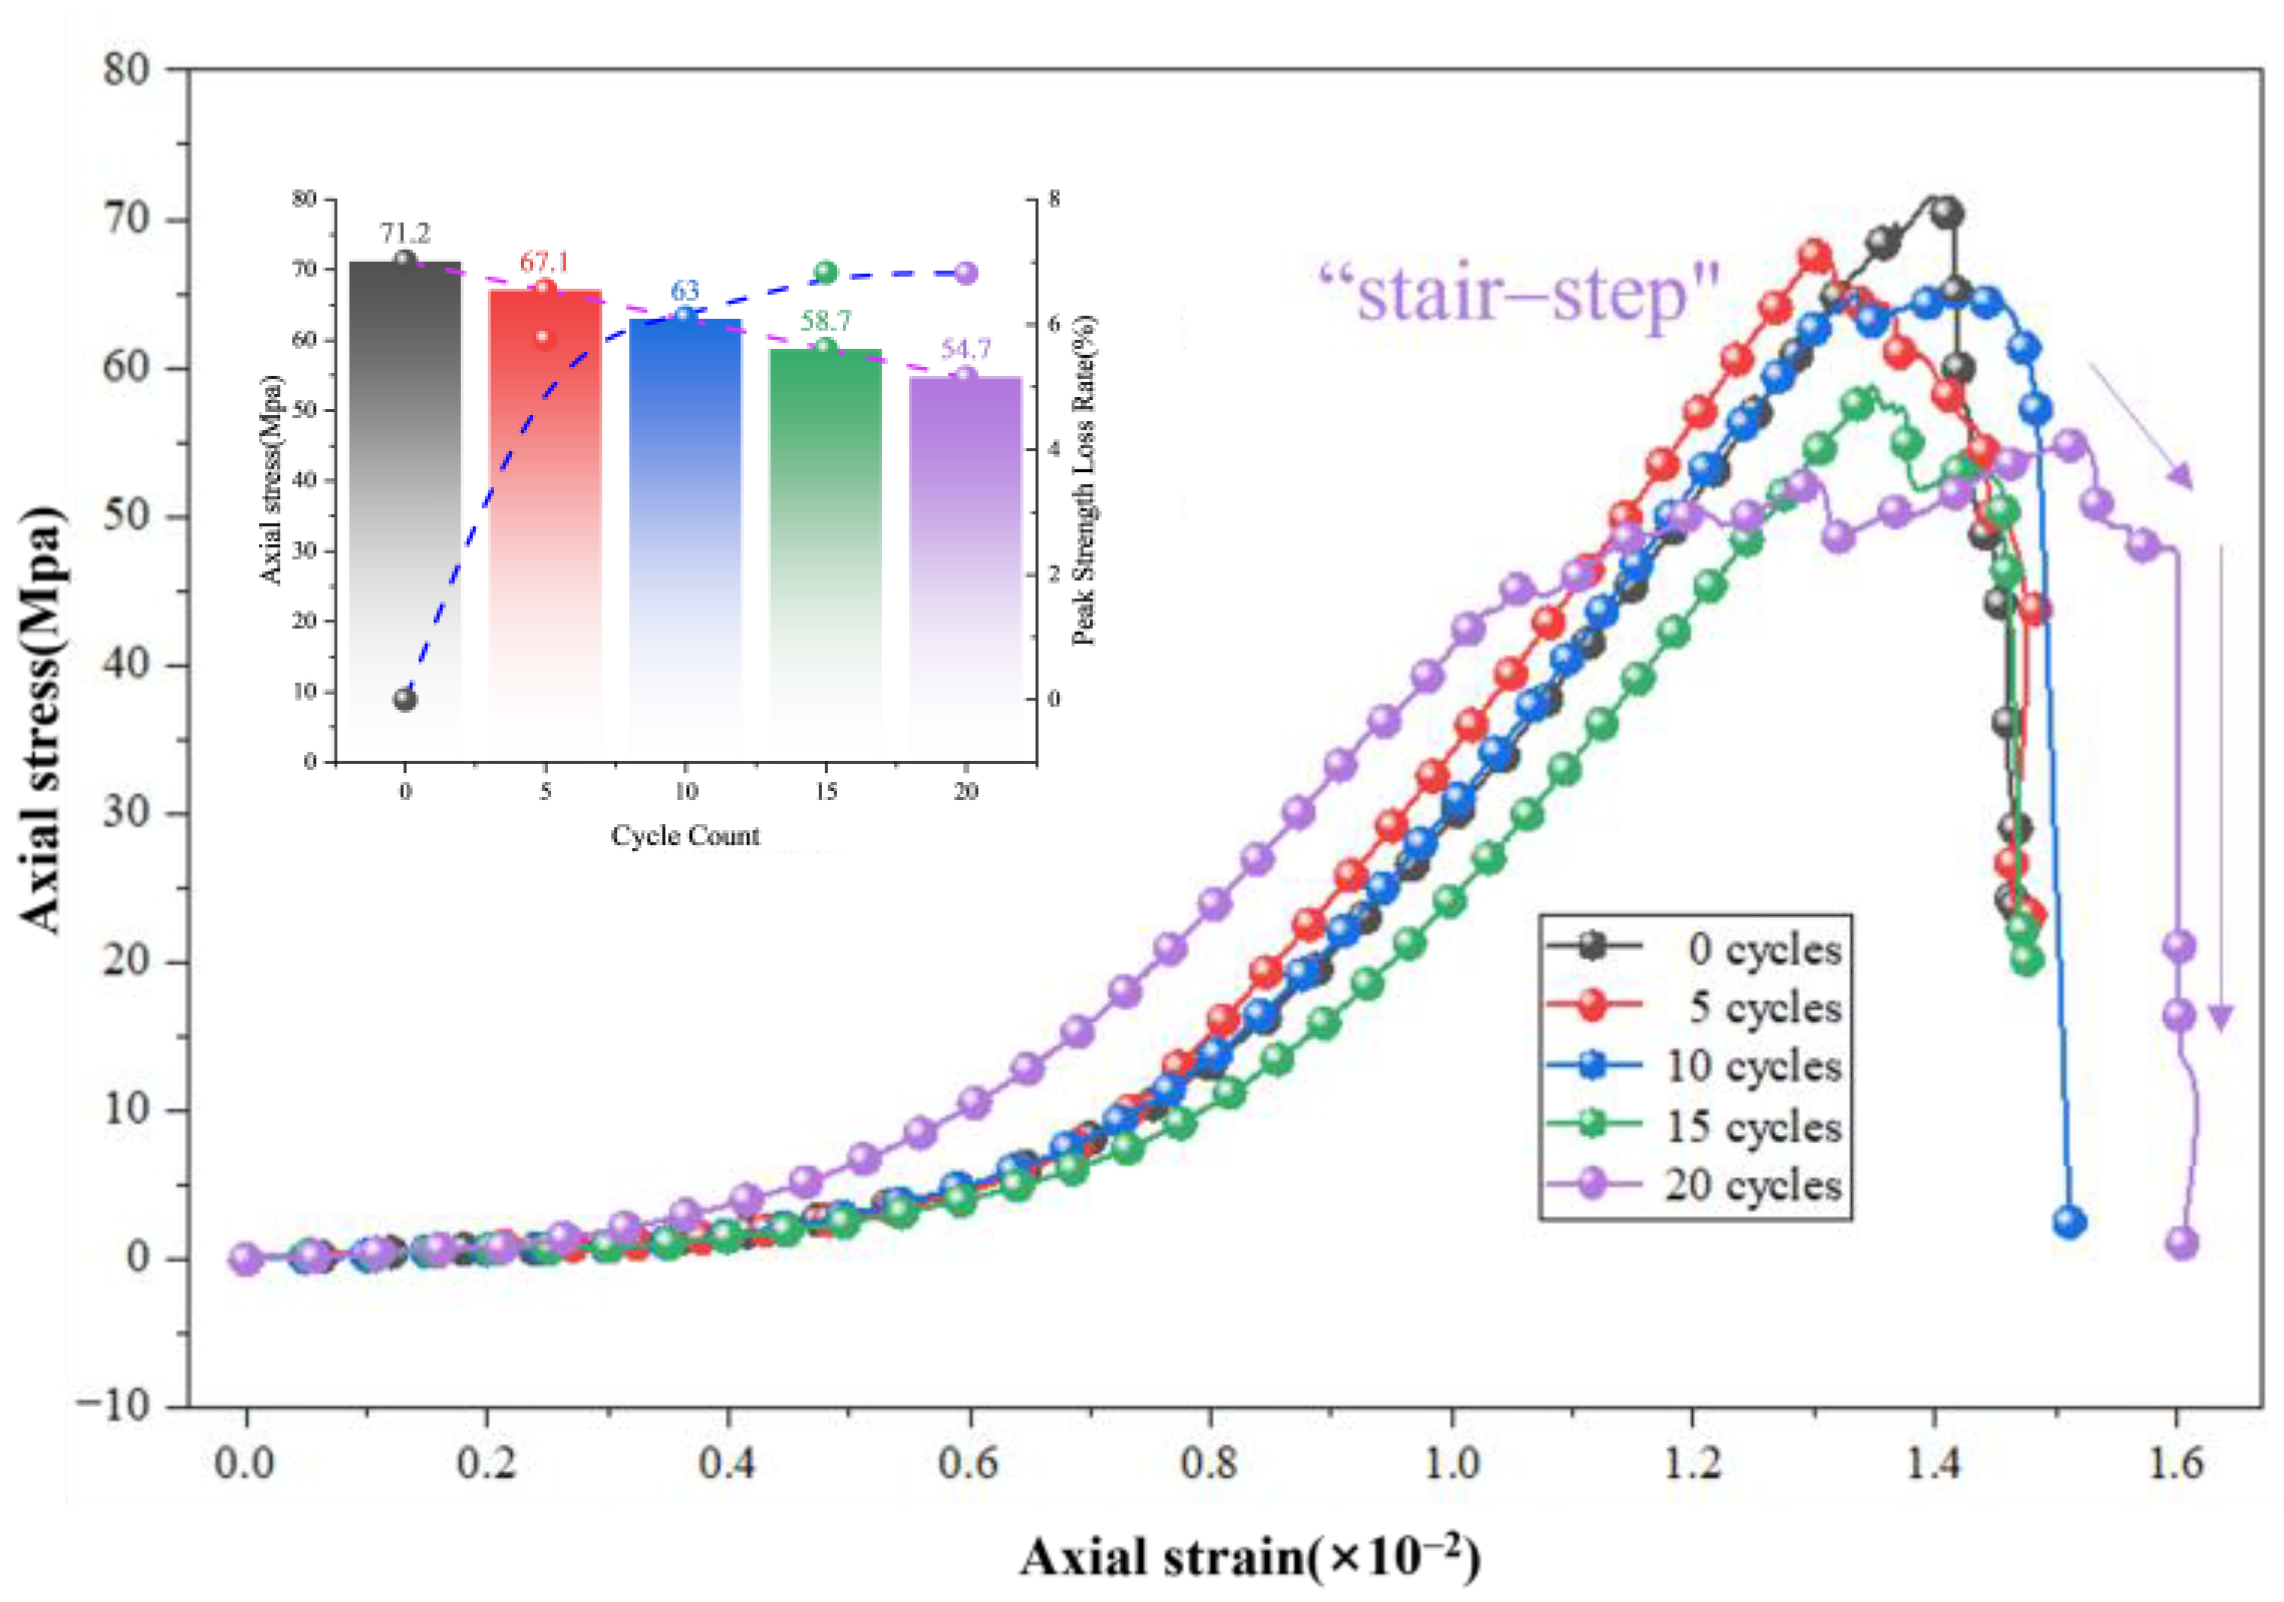
Figure 2 shows that the stress–strain response of green sandstone progressively deteriorates with increasing wetting–natural drying cycles, manifested by reduced peak strength, lower stiffness, and an increasingly unstable post-peak regime. Notably, the post-peak segment of the 20-cycle specimens exhibits a pronounced “stair-step” stress-drop behavior, suggesting intermittent crack coalescence and episodic frictional sliding along weakened interfaces under sustained axial deformation. The elastic modulus was determined from the linear elastic portion of the stress–strain curve after excluding the initial nonlinear segment associated with specimen–platen seating and local end compaction.
Figure 2.
Uniaxial stress–strain curves of green sandstone after different wetting–drying cycles. Note: Then elastic modulus was calculated from the linear elastic portion after excluding the initial seating-affected nonlinear stage.
Table 2 quantifies the degradation trend. Using the three replicates in each group, the mean peak stress decreases from 72.13 MPa (0 cycles) to 54.00 MPa (20 cycles), i.e., a reduction of 25.14%. The mean elastic modulus drops from 10.14 GPa to 7.18 GPa, corresponding to a stiffness loss of 29.25%. Meanwhile, the mass loss percentage increases monotonically from 0 to ~1.09% after 20 cycles, and the mass loss rate rises from ~1.14% (5 cycles) to ~2.30% (20 cycles). It should be noted that the elastic modulus values reported in Table 2 are determined from the corrected linear elastic segment after excluding the initial seating-affected portion of the stress–strain curves. Although some scatter exists among replicate specimens within each cycle group, both peak stress and elastic modulus show an overall decreasing trend with increasing wetting–air-drying cycles, indicating progressive deterioration of the load-bearing capacity and stiffness of the green sandstone. The observed intra-group variability is mainly attributed to the inherent heterogeneity of the rock and local differences in microcrack development during cycling, but it does not affect the overall inter-group degradation trend. The relatively small mass loss, accompanied by a substantial reduction in mechanical capacity, indicates that the dominant mechanism is internal microstructural deterioration (microcrack multiplication, grain-boundary debonding, and pore-network connectivity enhancement), rather than macroscopic material removal alone. Mechanistically, repeated wetting and drying promotes differential swelling–shrinkage among mineral constituents and accelerates subcritical crack growth driven by capillary tension and hydration–dehydration cycling. These effects amplify stress concentrations at pre-existing flaws and intergranular contacts, which directly explain the observed reduction in modulus and the earlier onset of nonlinear deformation in the stress–strain curves.
Table 2.
Summary of peak stress, elastic modulus, and mass loss indices of green sandstone under different wetting–drying cycles.
4.2. AE Ringing-Count Evolution: Staged Damage Accumulation
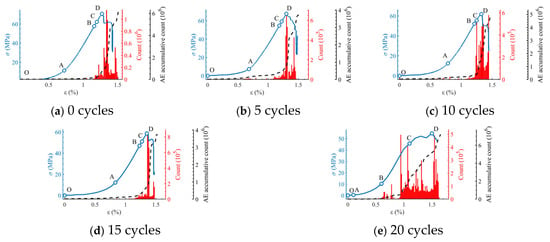
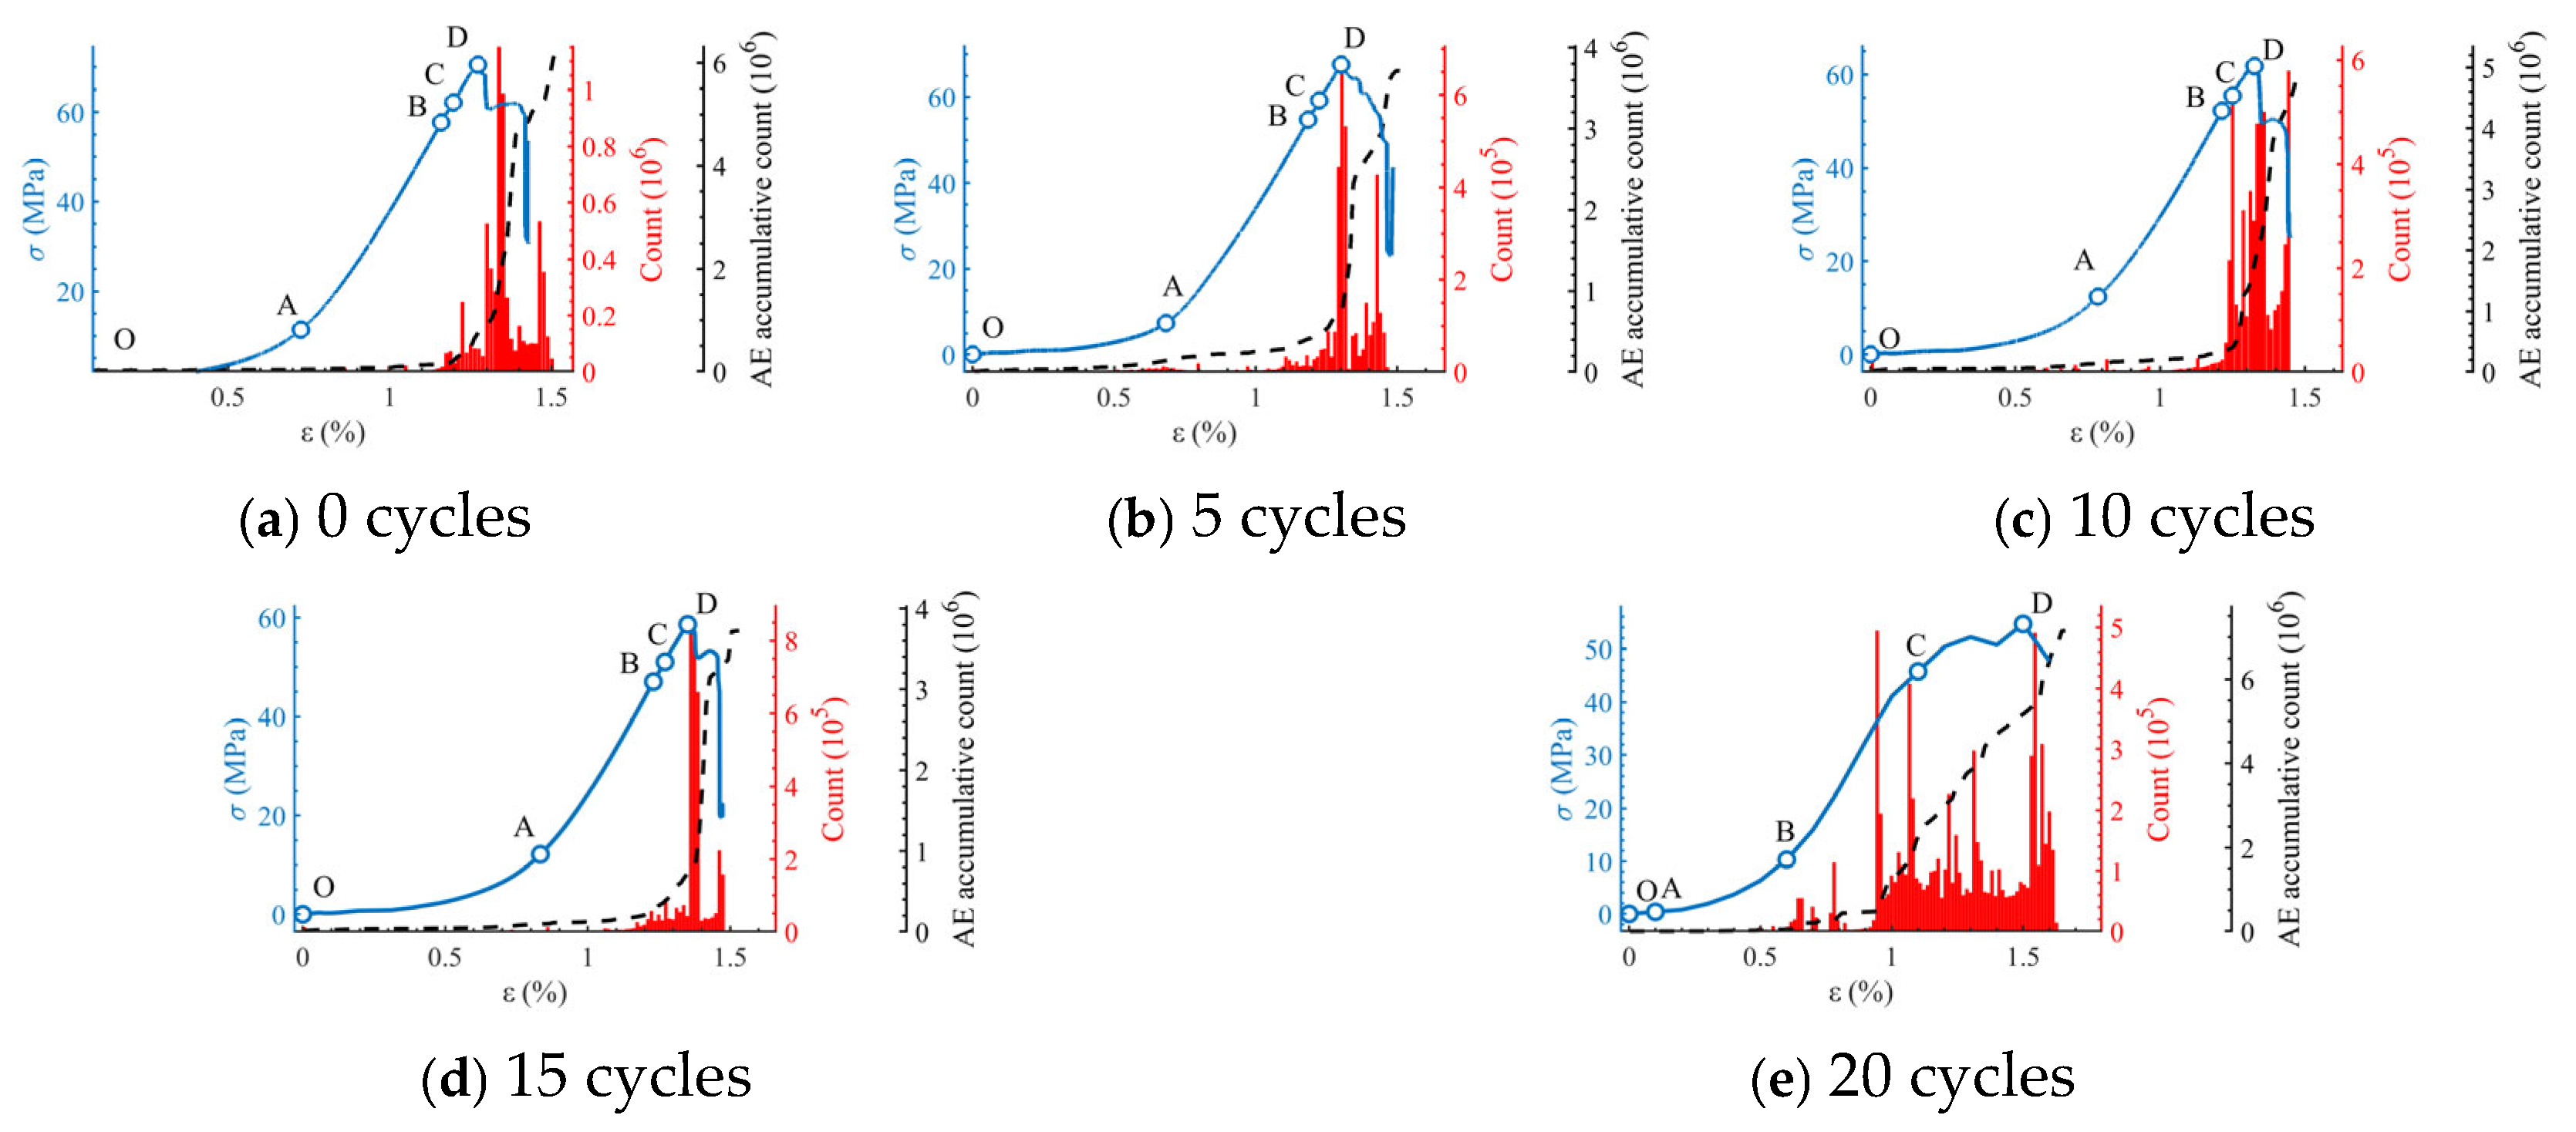
Figure 3 presents the coupling between mechanical response and AE activity. Across all cycle conditions, AE ringing counts exhibit a staged evolution consistent with the classical damage progression of brittle geomaterials: (i) a low-activity compaction stage (OA) dominated by closure of pre-existing pores and microcracks; (ii) a quasi-elastic stage (AB) with sparse AE events; (iii) a stable crack-growth stage (BC) where AE activity increases gradually; (iv) an unstable crack-coalescence stage approaching peak stress (CD), characterized by clustered bursts and rapidly rising cumulative counts; and (v) a post-peak stage (DE) where macrocrack formation governs the residual load-bearing behavior.
Figure 3.
Evolution of AE ringing counts of green sandstone under different wetting–drying cycles.
Hydraulic cycling markedly modifies this evolution in two key aspects. First, the onset of noticeable AE activity shifts to earlier strain levels as the cycle number increases, implying that microcrack activation requires a lower stress threshold in pre-damaged specimens. Second, AE activity becomes more persistent over the entire loading path at high cycle numbers (15–20 cycles), instead of being concentrated solely near the peak stress. This indicates a transition from “peak-dominated” brittle instability to “distributed progressive damage”, which is consistent with the observed stiffness degradation: a reduced modulus implies diminished resistance to microcrack opening/sliding and thus more frequent AE events during the nominally elastic-to-stable growth stages. The intensified pre-peak AE at high cycle numbers can be interpreted as the consequence of a densified defect population and weakened cementation. In such a microstructure, numerous microcracks are close to criticality and can be activated by relatively small stress increments, producing sustained AEs before the emergence of a dominant macrofracture. This indicates that wetting–air-drying cycling not only reduces the peak load-bearing capacity but also lowers the crack-initiation threshold, thereby triggering internal damage evolution at an earlier stage.
4.3. RA–AF Failure-Mode Transition Under Hydraulic Cycling
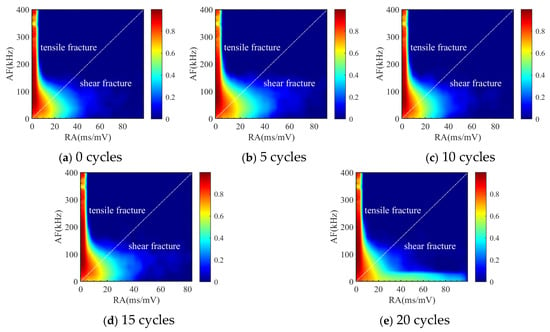
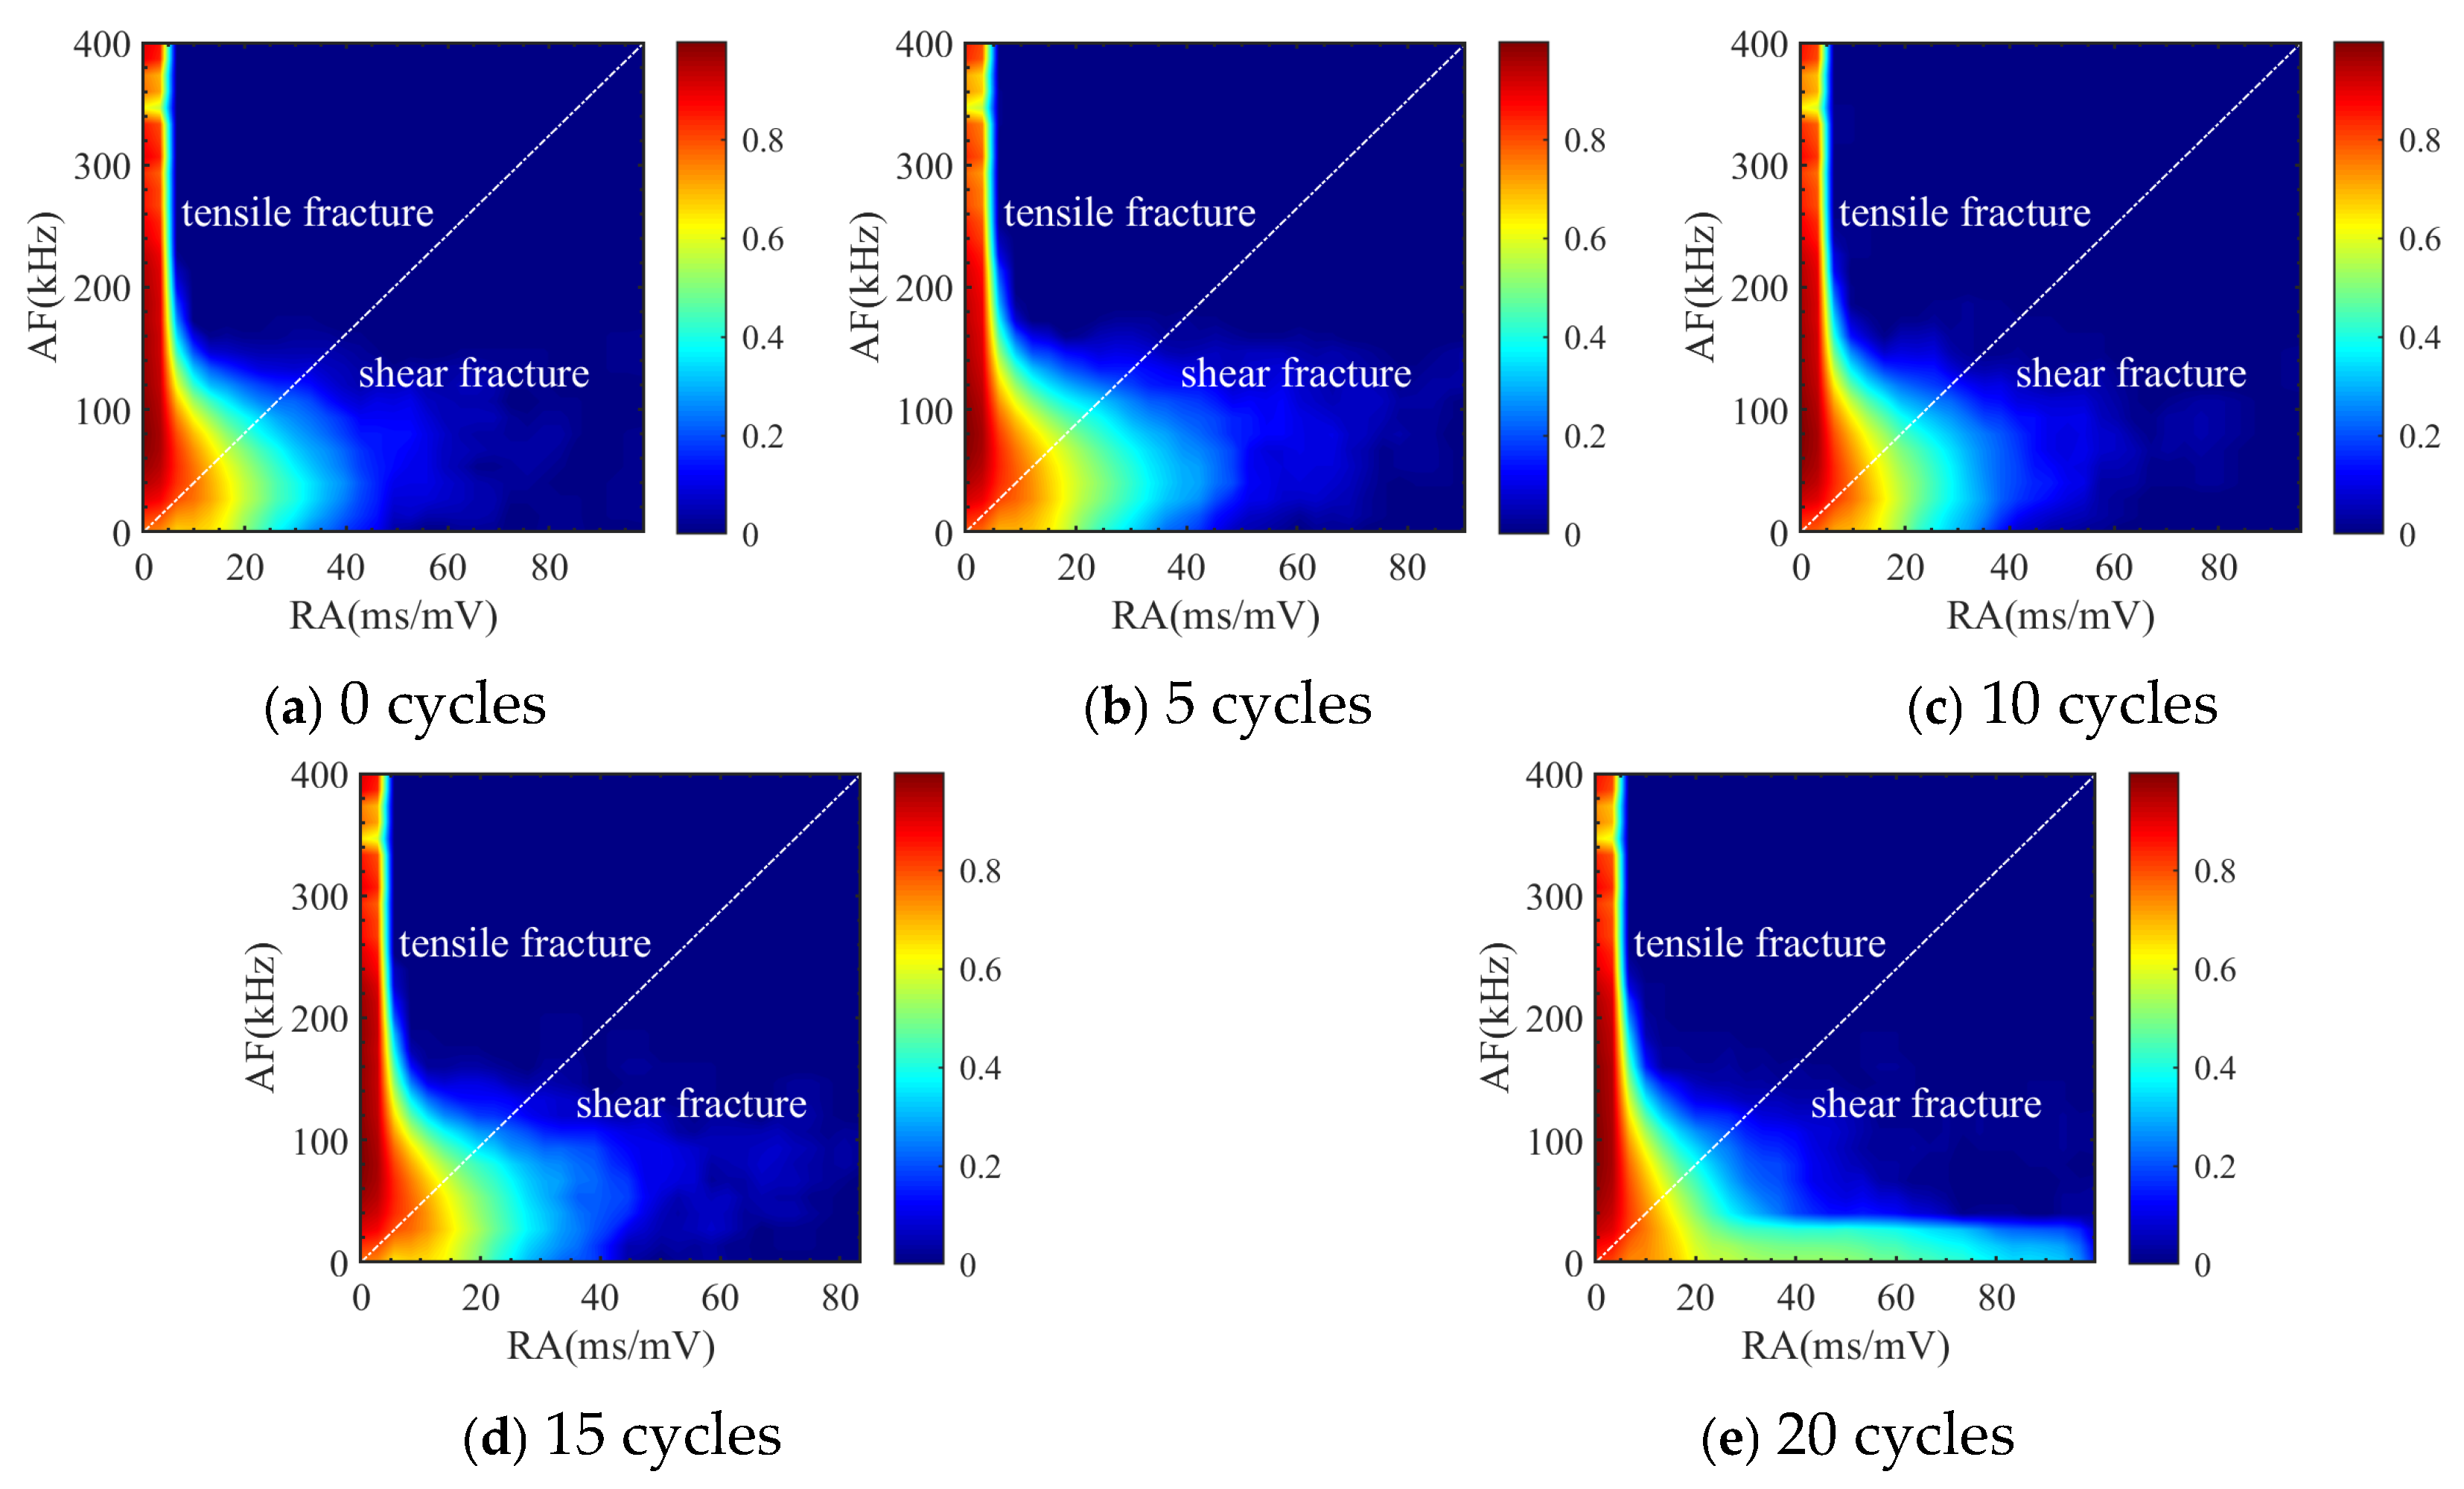
RA–AF density maps (Figure 4) provide insight into the dominant cracking modes. Following the definitions in Section 3, tensile-type cracking tends to occupy the region of low RA and relatively high AF, whereas shear-type signals are concentrated toward higher RA and lower AF.
Figure 4.
RA–AF feature distributions of AE events under different wetting–drying cycles.
To reduce subjectivity in crack-mode interpretation, no fixed empirical diagonal line with a prescribed RA/AF = k value was directly imposed. Instead, the separation slope was determined according to the dominant distribution trend of AE events in the RA–AF feature space, and the resulting classification was used to characterize the relative evolution of tensile–shear participation among groups rather than the absolute crack type of each individual event. With increasing cycle number, the event population exhibits an enhanced presence in the shear-dominated domain, indicating a systematic shift from predominantly tensile microcracking toward mixed-mode and shear-assisted fracture. This is consistent with the microstructural consequence of wetting–drying cycling: degradation of cementation and grain-boundary strength promotes frictional sliding and intergranular debonding, which are more likely to generate longer rise times and lower dominant frequencies.
From a failure-mechanics perspective, the observed mode transition implies that hydraulic cycling does not merely reduce strength but also reconfigures the fracture pathway. In low-cycle specimens, crack growth tends to be more localized and tensile-dominated near peak stress, reflecting brittle, splitting-like instability. In contrast, high-cycle specimens show stronger shear participation, facilitating distributed damage and stepwise post-peak stress drops (as observed in Figure 2), which is typical of frictional reactivation along weakened microplanes and intermittent macrocrack linkage.
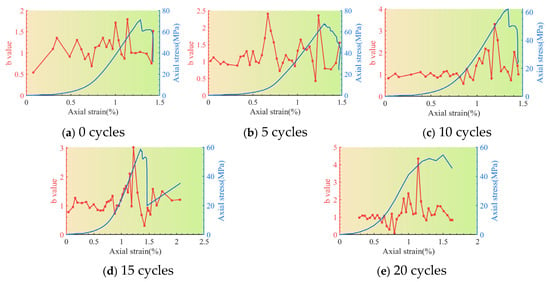
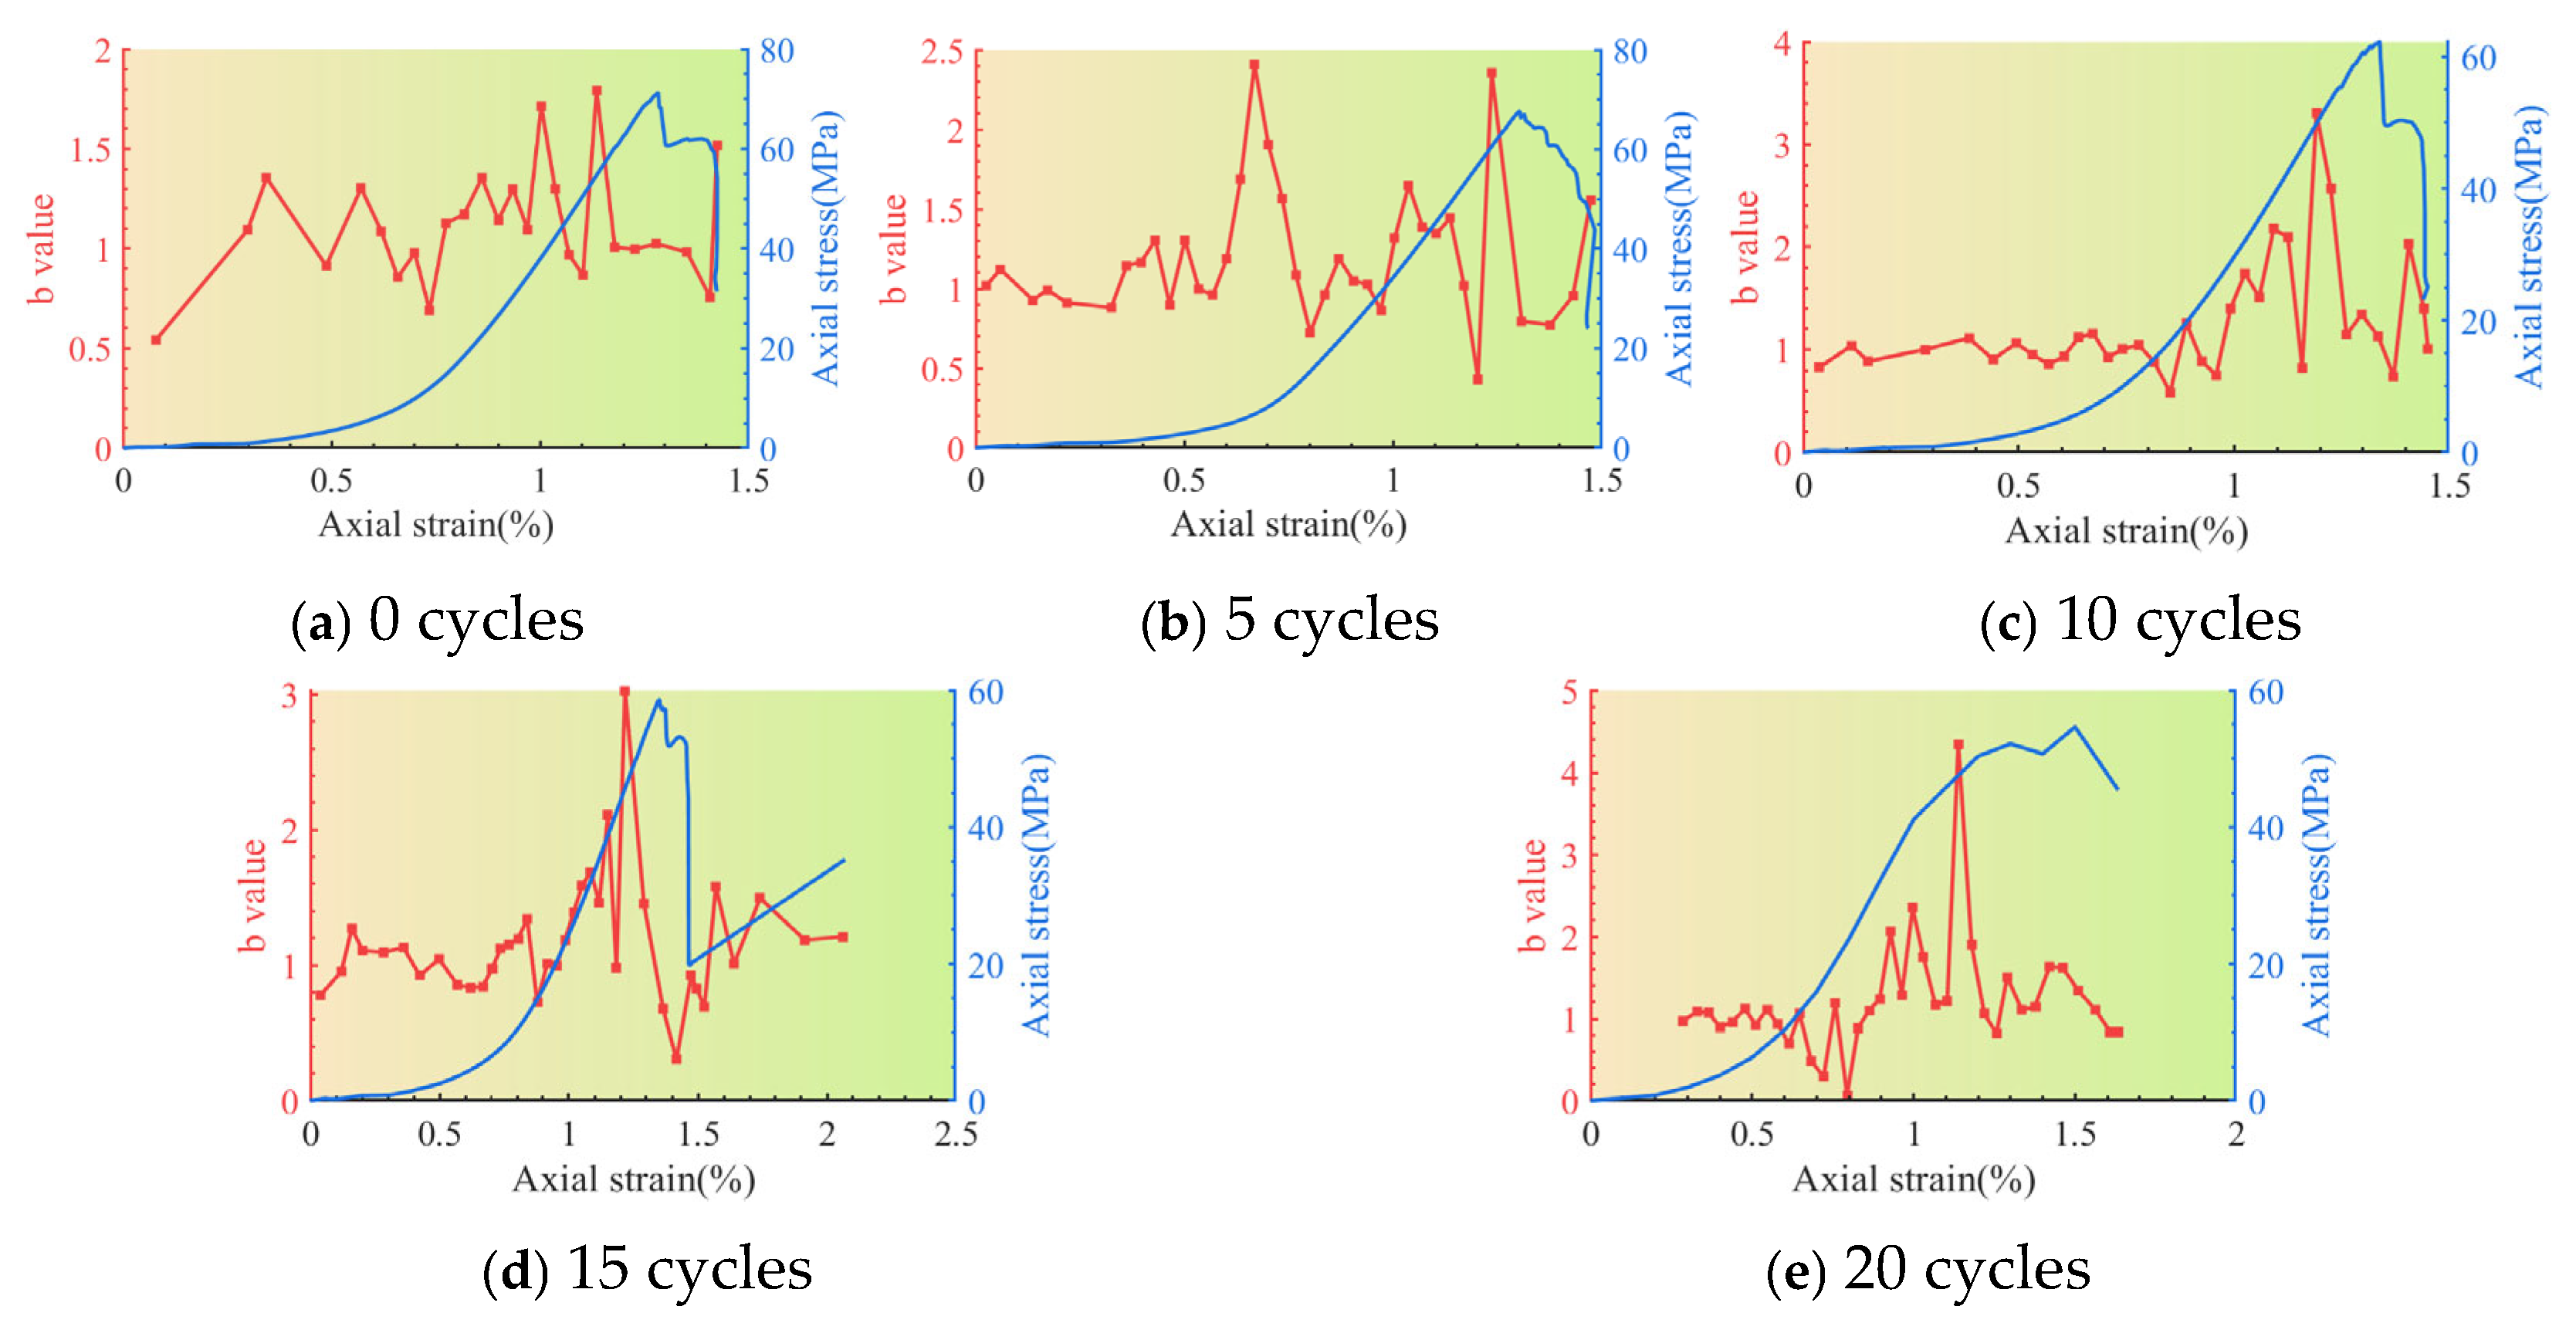
4.4. B-Value Evolution: Crack-Scale Redistribution and Instability
The moving-window b-value curves (Figure 5) reflect the evolving distribution of AE event amplitudes and, by implication, the crack-size hierarchy. As defined by the Gutenberg–Richter-type relation, a higher b value corresponds to a relatively larger proportion of small-amplitude events, whereas a decreasing b value indicates the increasing contribution of large events associated with macrocrack formation.
Figure 5.
Evolution of AE b value along the loading path under different wetting–drying cycles.
Across different cycle numbers, b values generally show pronounced fluctuations and commonly exhibit a pre-peak “increase–decrease” tendency: an early-stage rise suggests multiplication of small cracks and progressive microdamage, while the subsequent decline toward peak stress signifies crack coalescence and the emergence of dominant fractures. Importantly, at higher cycle numbers, b-value volatility becomes more pronounced, and the decline tends to occur earlier relative to the peak, implying that the system transitions to a state where large-event contribution becomes significant at lower stress levels. This aligns with the earlier AE activation and distributed damage observed in Figure 4.
The enhanced b-value fluctuation under high-cycle conditions can be attributed to the competition between (i) frequent activation of many small defects and (ii) intermittent linkage into larger slip/crack events along weakened interfaces. This competition yields a temporally heterogeneous rupture process, consistent with stepwise post-peak behavior and stronger shear participation inferred from RA–AF analysis.
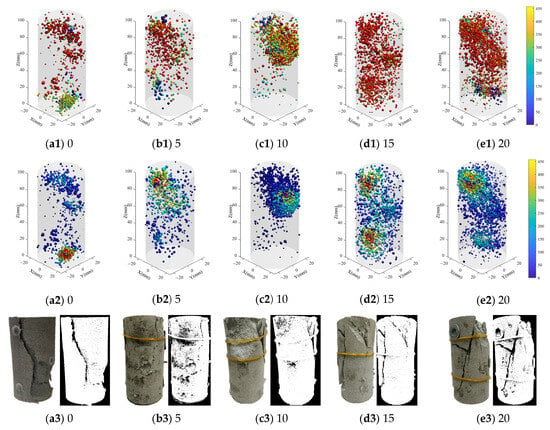
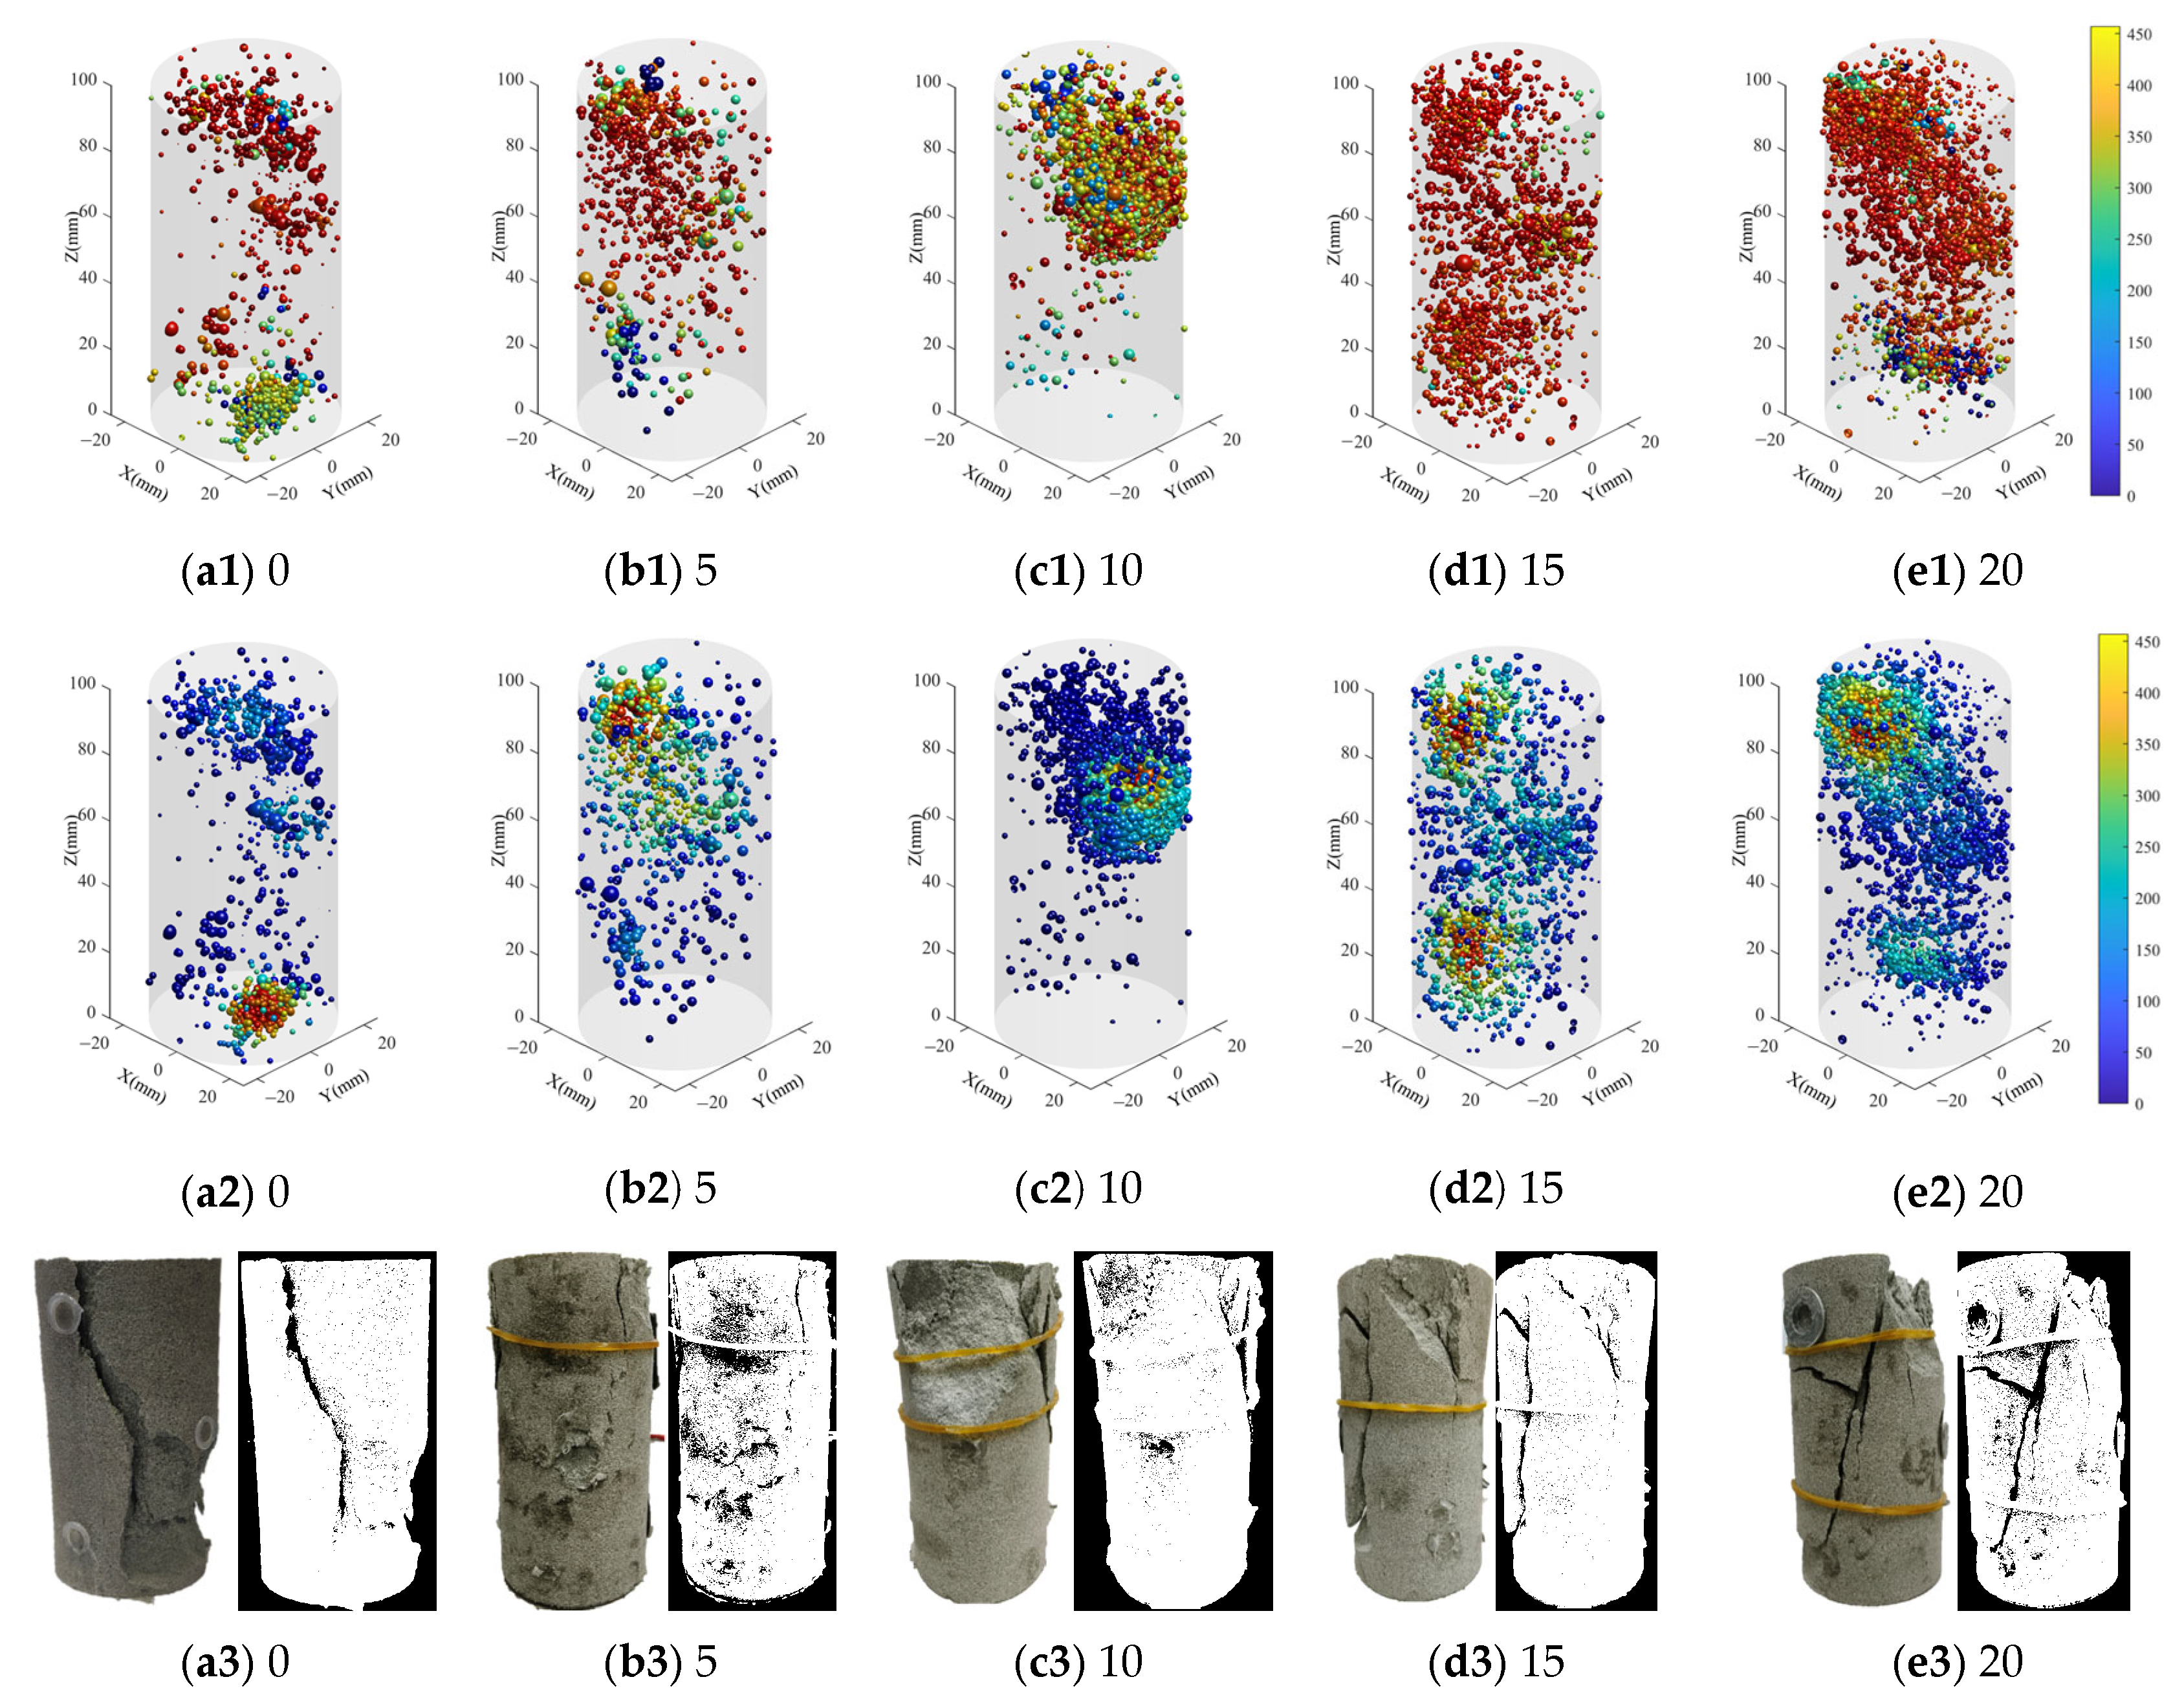
4.5. Spatial Localization of AE Events Coupled with Macroscopic Failure Patterns
Figure 6 couples AE source localization with post-failure photographs and binarized crack maps. Crack maps were obtained by image binarization (thresholding) of post-failure photographs. In the point–cloud plots, color encodes time, and sphere size denotes AE energy; thus, late-stage large spheres indicate energetic events near instability. In the KDE maps, color represents spatial density while sphere size still indicates energy, allowing simultaneous identification of “where” damage concentrates and “how intense” it is.
Figure 6.
Comparison of three-dimensional AE source localization, kernel-density distribution, and macroscopic failure morphology of green sandstone under different wetting–drying cycles.
In the localization plots, sphere size represents the relative AE energy of each AE event, and the brown-colored elements indicate the specimen outline/background reference for spatial visualization. At 0 cycles, AE hypocenters rapidly localize into a narrow damage band shortly before peak stress, and the energetic events align with a single through-going splitting crack in the photo/binary map—typical of localized brittle failure. After 5–10 cycles, sources appear earlier and scatter more widely, with multiple moderate-density KDE hotspots and more dispersed binary cracks, indicating distributed microdamage and multi-site nucleation prior to a dominant fracture. At 15 cycles, two or more competing clusters develop; the densest KDE hotspot progressively dominates and coincides with the eventual main crack trace, reflecting competitive growth and subsequent coalescence. At 20 cycles, the widest early–mid-stage scatter, multi-peak KDE structure, and several late-stage energetic clusters correspond to a branched, intersecting macrocrack network, implying mixed-mode rupture with intermittent linkage of multiple damage corridors.
Overall, hydraulic cycling shifts failure from single-corridor localization to multi-corridor competition: microstructural weakening lowers the activation threshold, promotes shear-assisted sliding and crack branching, and produces earlier, more spatially heterogeneous AE activity. Meanwhile, the final AE hotspots provide a consistent spatial precursor of the observed macroscopic fracture geometry.
4.6. Fractal Evolution of AE Dynamics: Phase Trajectory and Correlation Dimension
To quantitatively capture the nonlinear damage dynamics reflected by AE ringing-count time series, phase-space reconstruction was performed using the delay-coordinate embedding framework. Based on preliminary parameter-selection analyses using the FNN method and the autocorrelation function on representative specimens (see the Methods), a uniform parameter set was adopted for all specimens to ensure strict comparability among different wetting–drying cycle conditions: the embedding dimension was set to m = 5 and the time delay to τ = 6.
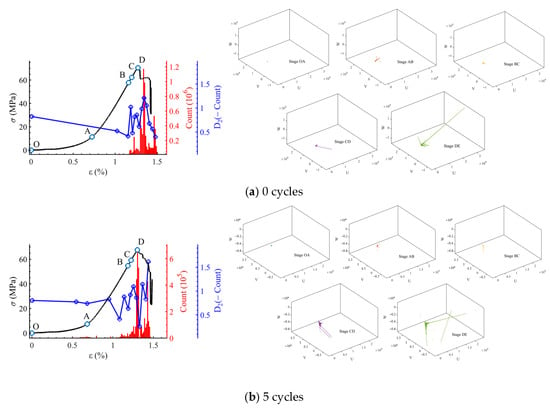
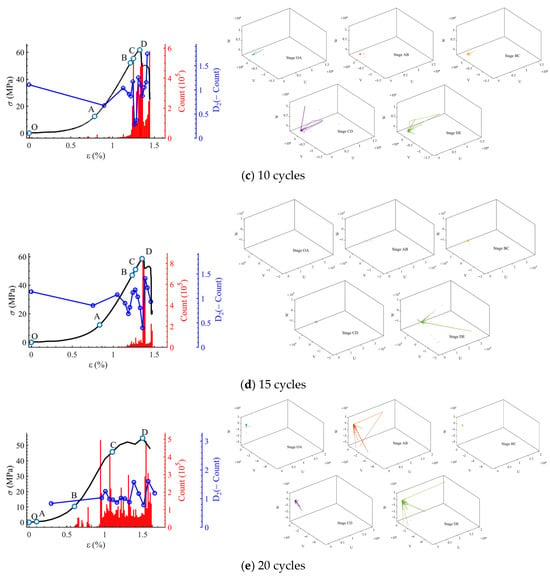
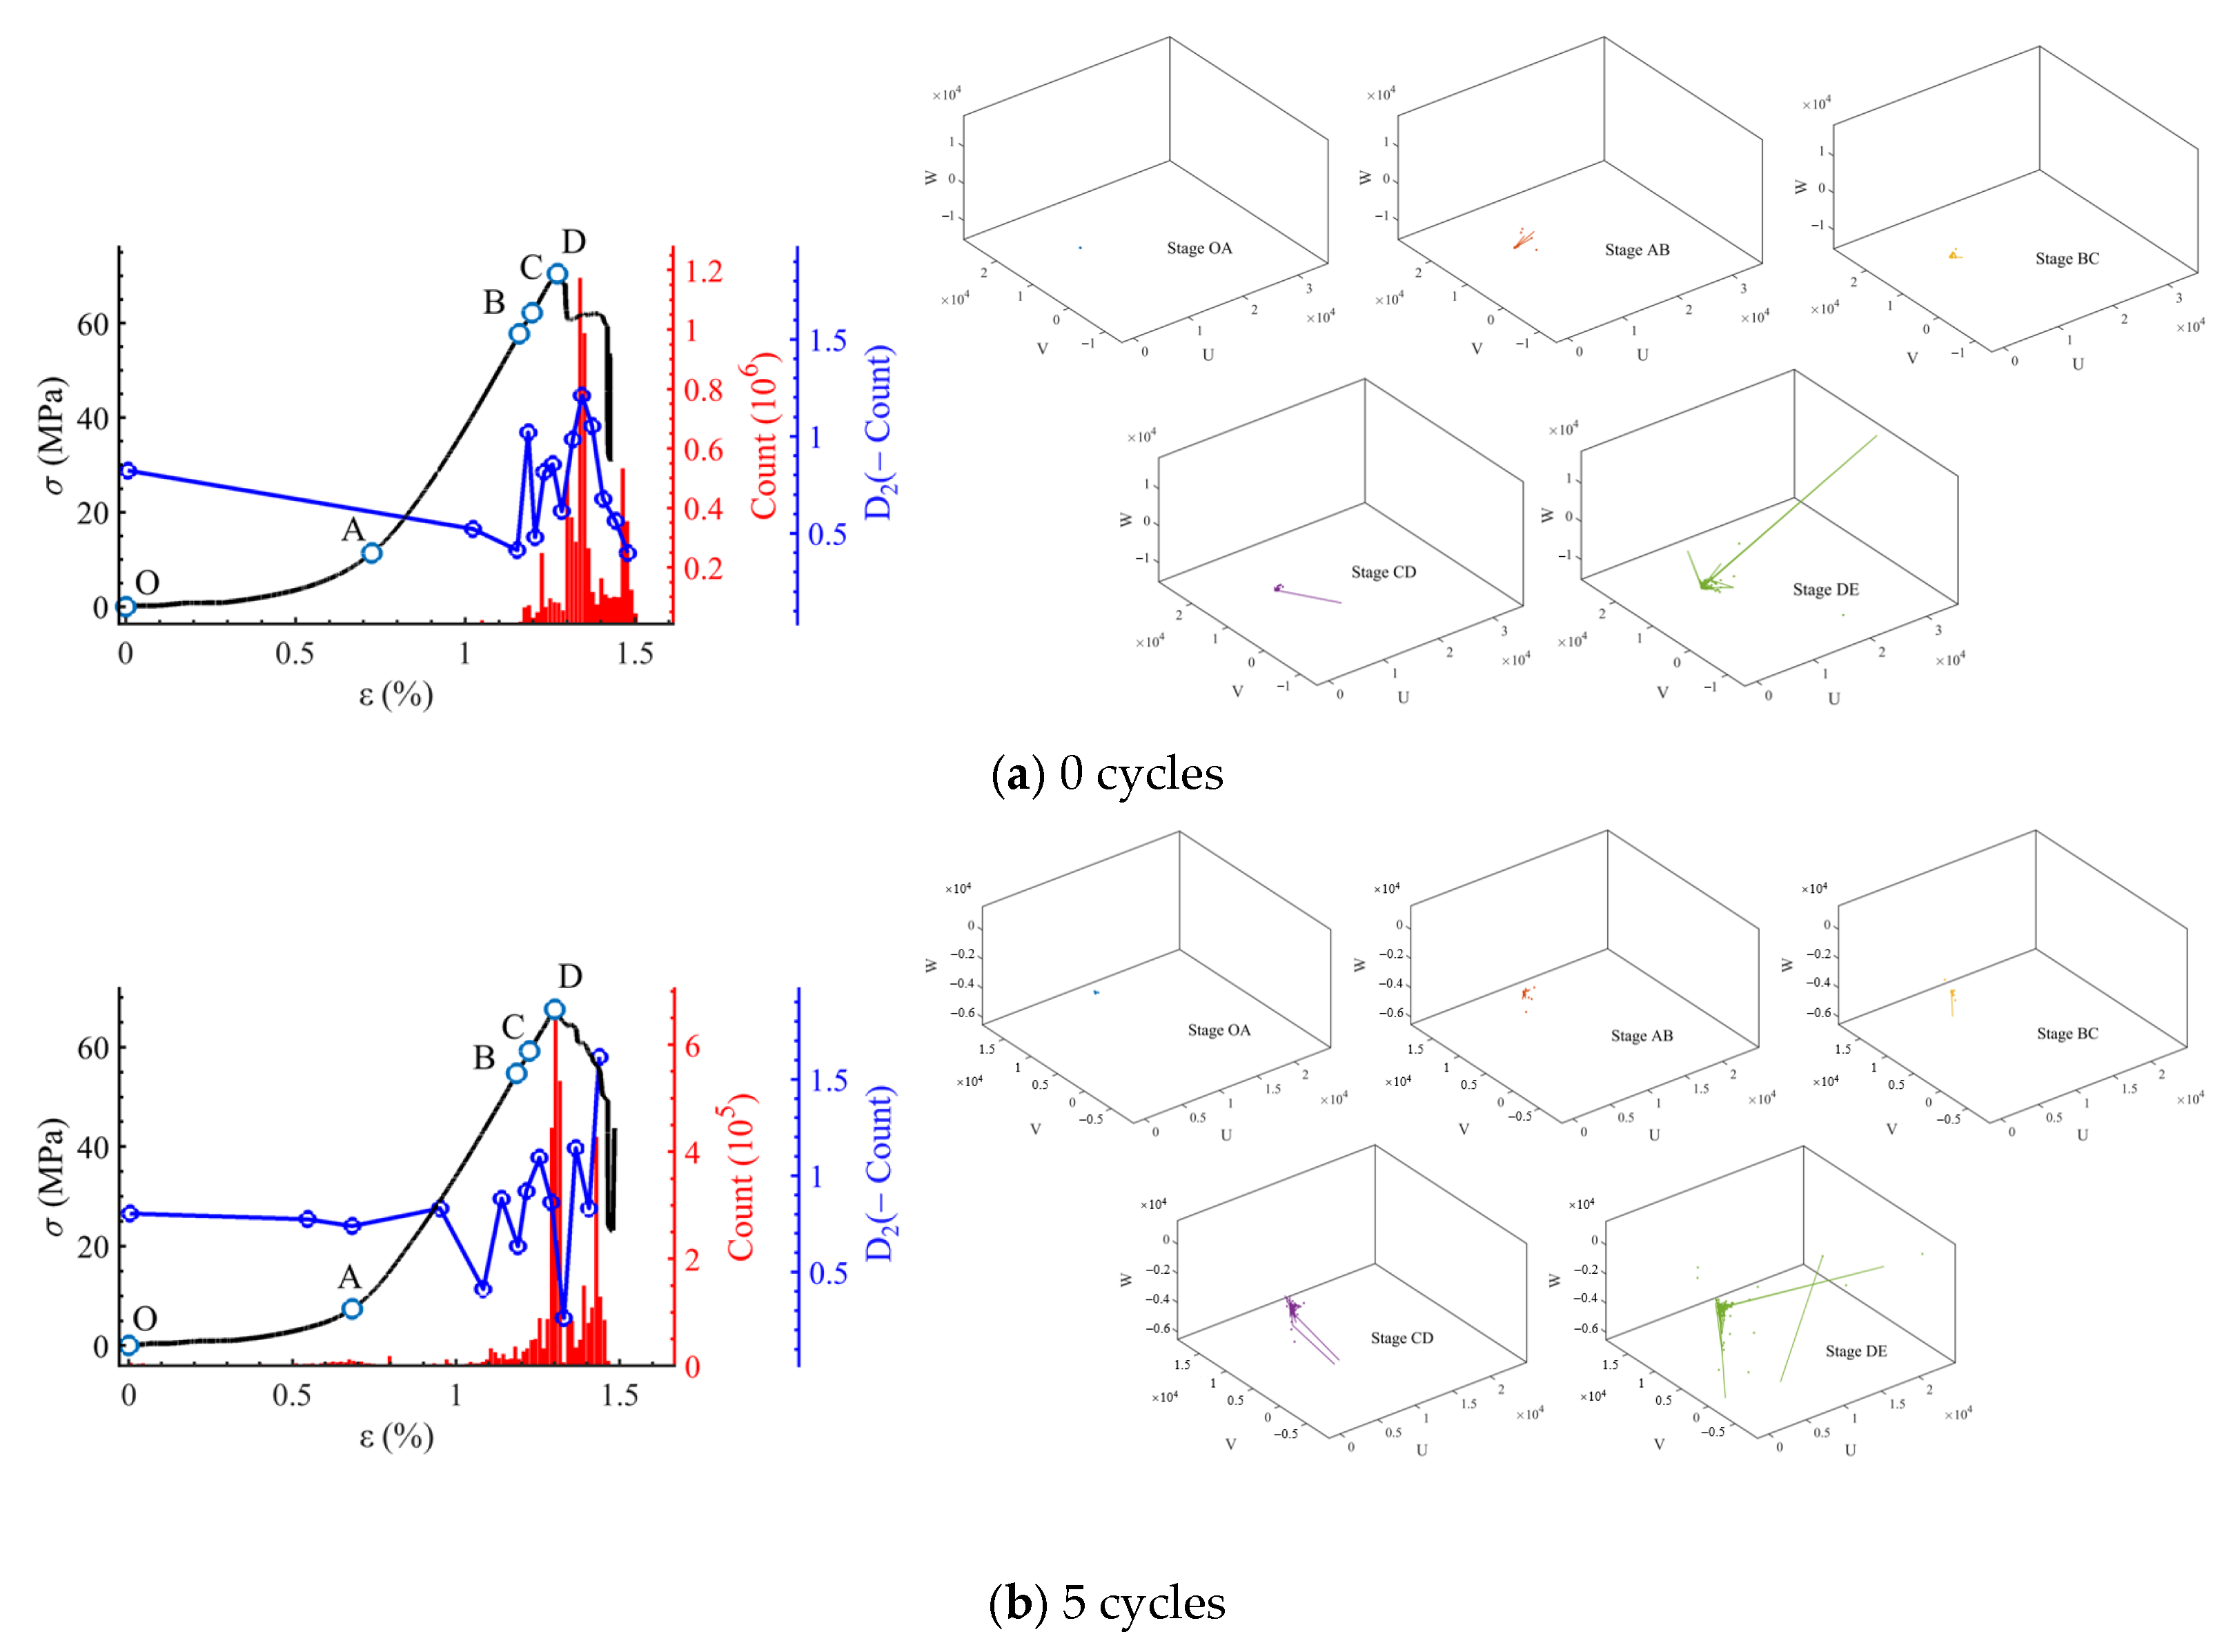
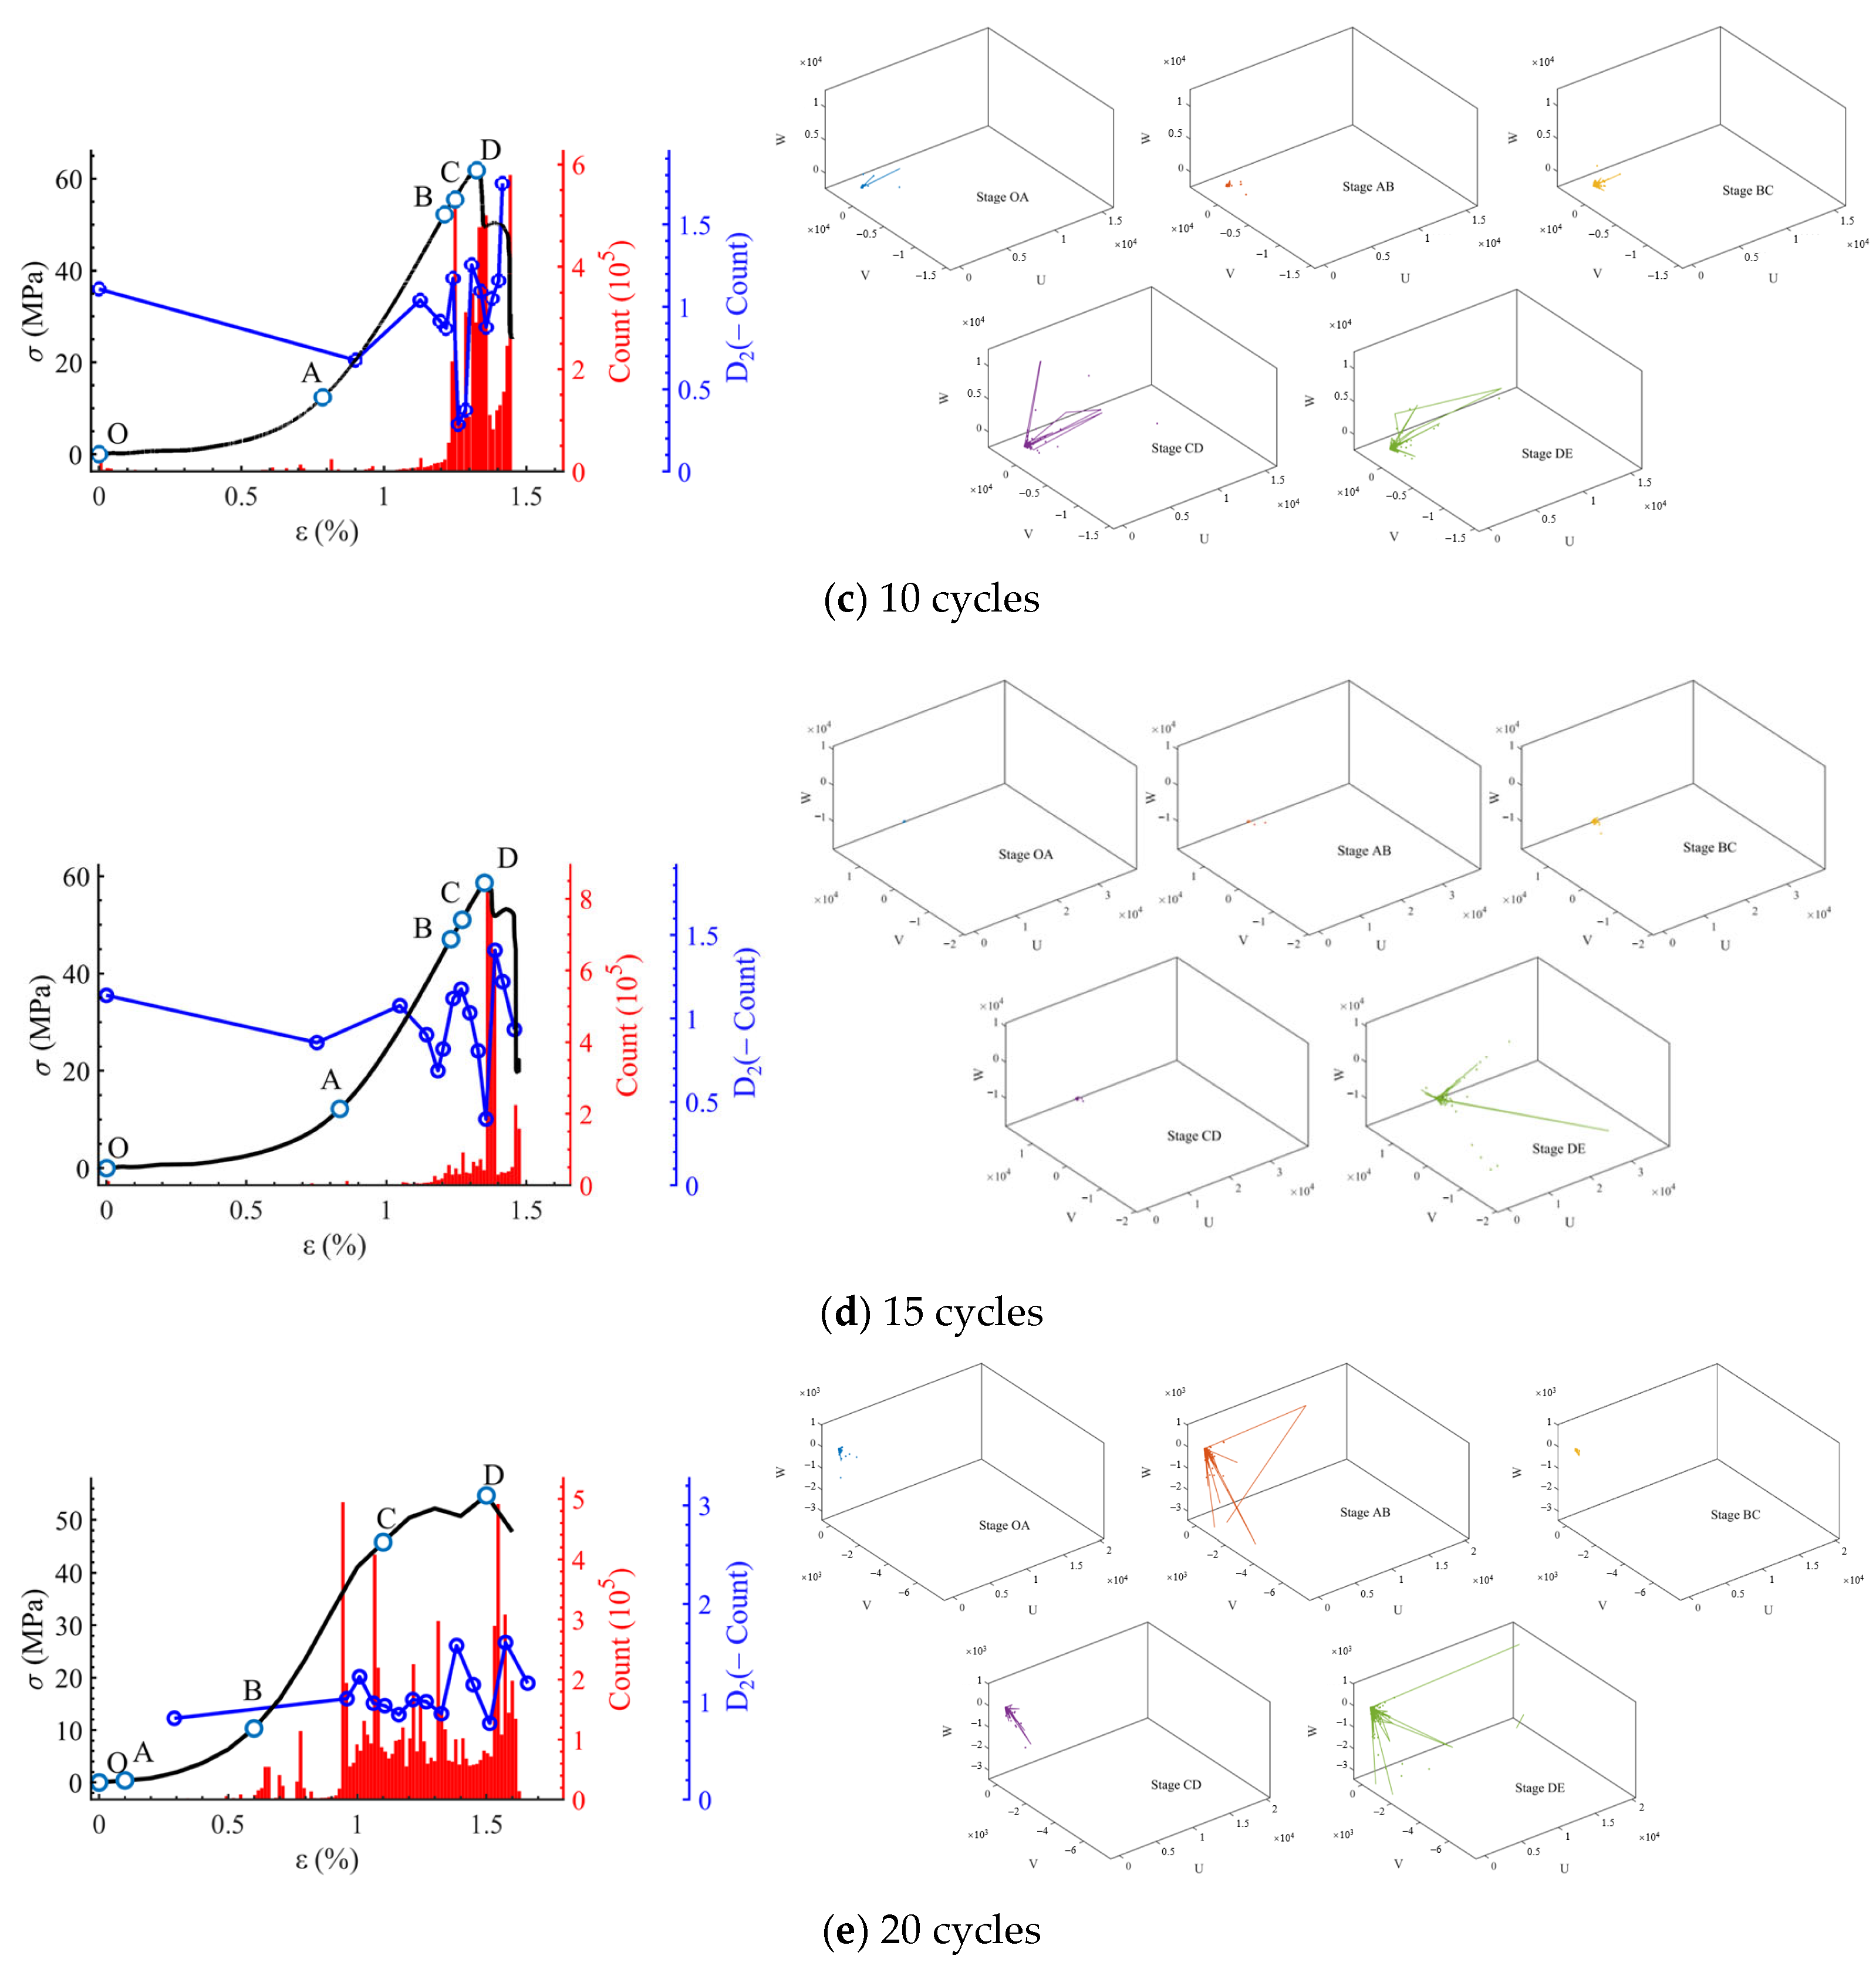
Figure 7 shows that the reconstructed phase trajectories exhibit pronounced stage dependence across the loading path (OA–DE). In the compaction and quasi-elastic stages, the trajectory remains compact with limited dispersion, indicating a low degree of freedom dominated by pore closure and reversible deformation. As loading progresses into stable crack growth, the trajectory gradually expands, reflecting increasing interactions among distributed microcracks. Approaching the unstable coalescence regime, the trajectory becomes markedly more tortuous and scattered, suggesting a transition toward collective crack coupling and intermittent instability. After peak stress, the trajectory tends to reorganize, consistent with macrofracture dominance and frictional reactivation along weakened planes.
Figure 7.
Fractal evolution of AE time-series dynamics under different wetting–drying cycles (phase-space trajectories/correlation-dimension characterization).
The correlation dimension D2, computed via the Grassberger–Procaccia algorithm, provides a compact scalar descriptor of complexity evolution. With increasing wetting–drying cycles, two robust trends emerge: (i) the baseline level of D2 increases, indicating a more heterogeneous and multi-scale damage system; and (ii) the amplitude of D2 fluctuations becomes larger and occurs earlier, implying that intermittently unstable crack interactions are triggered at lower stress levels in pre-damaged specimens. Mechanistically, hydraulic cycling weakens cementation and amplifies defect density, causing many microcracks to approach activation thresholds; consequently, the system shifts from a “late-stage complexity surge” (low cycles) to an “early-stage complexity intermittency” (high cycles). This fractal signature is consistent with the observed persistence of AE activity and the progressive transition toward mixed-mode fracture behavior. From the visual pattern, the AE dynamic trajectory evolves from a relatively dispersed form toward a more concentrated and constrained structure, which is consistent with the corresponding variation in D2, indicating that the complexity of the damage system undergoes a clear transition as the specimen approaches peak failure.
4.7. Turning Stress as an Instability Precursor: Comparison of D2- and B-Value-Based Criteria
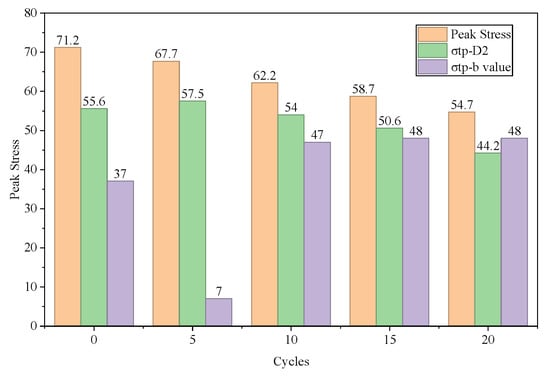
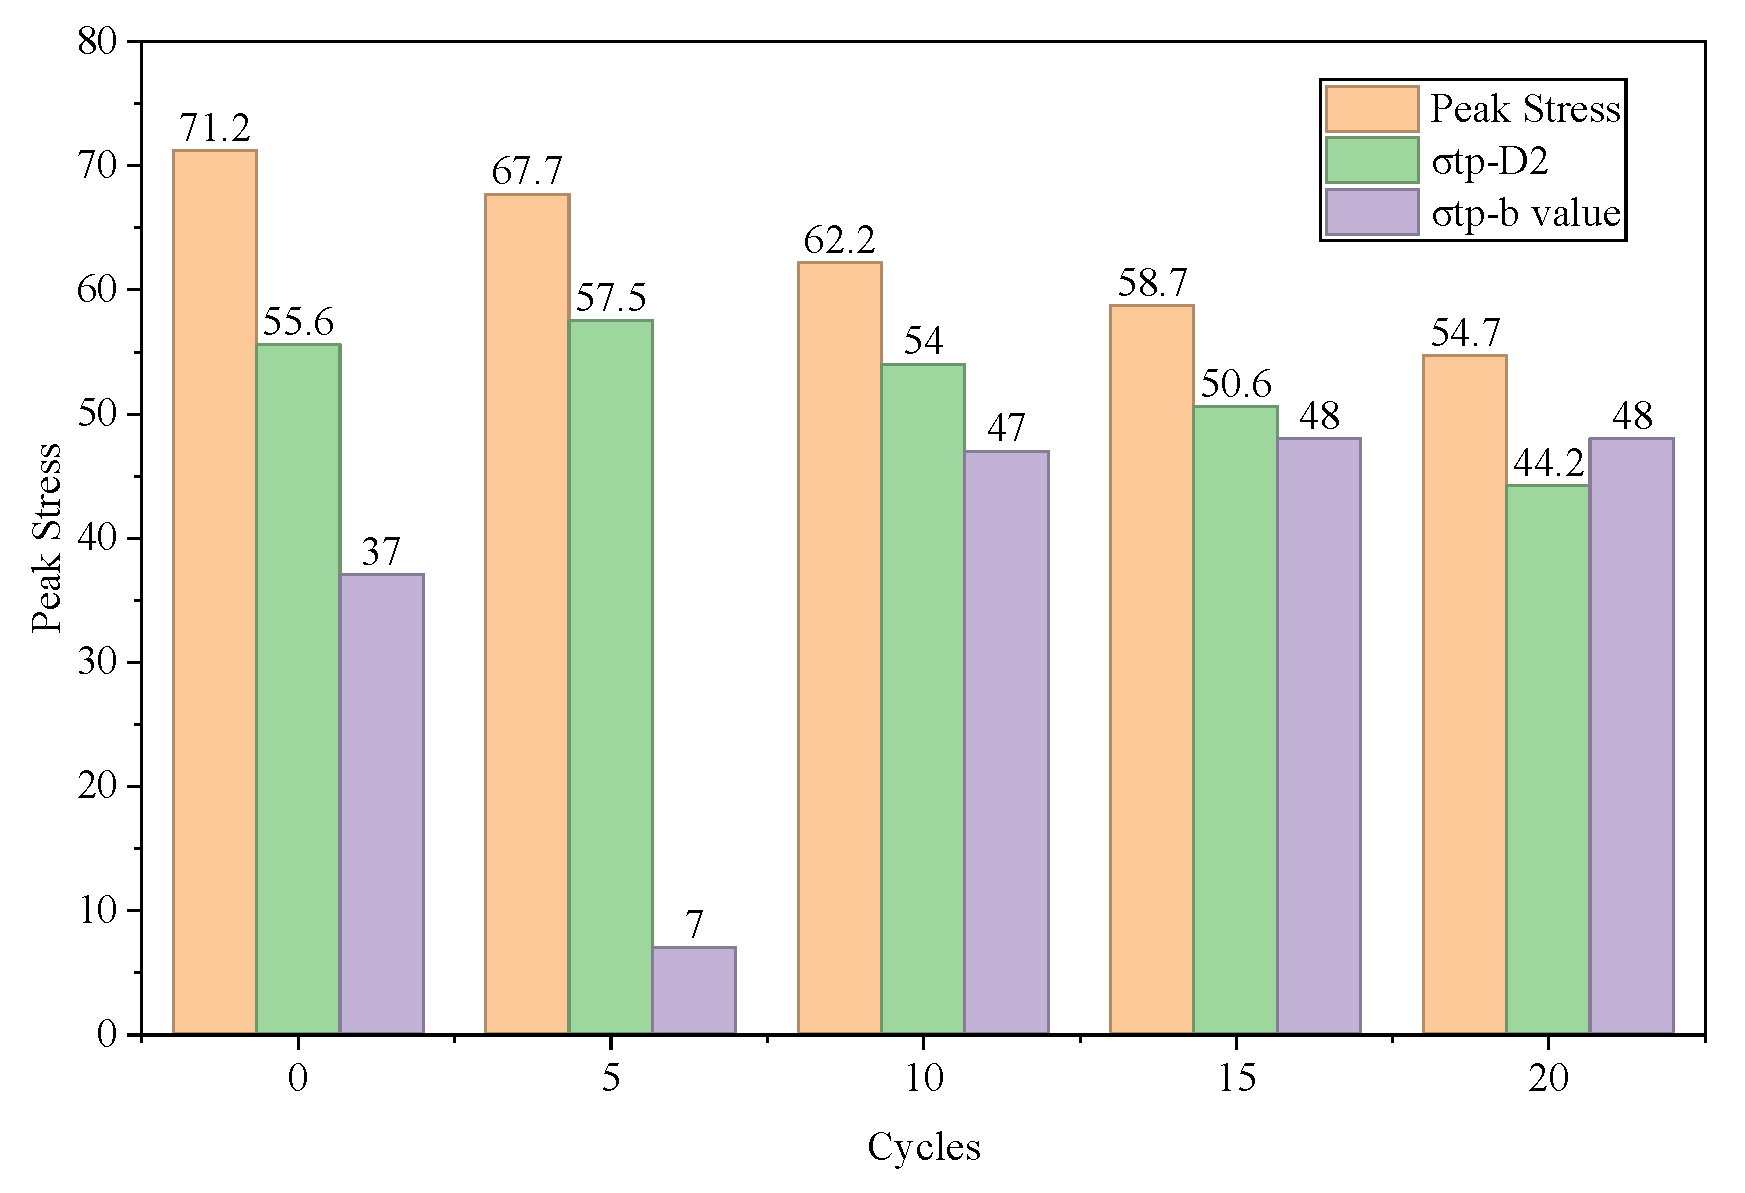
Figure 8 compares the peak stress with the turning stress inferred from the first local maximum of D2 (σtp–D2) and from b-value evolution (σtp–b). Peak stress decreases monotonically from 71.2 MPa (0 cycles) to 54.7 MPa (20 cycles). In parallel, σtp–D2 decreases from 55.6 MPa to 44.2 MPa, indicating that the onset of pronounced nonlinear complexity and impending instability is progressively advanced as hydraulic cycling accumulates. Normalized by peak stress, σtp–D2 remains within ~0.78–0.87 of σp, suggesting that the D2-based turning point provides a relatively stable early warning margin across different degradation states.
Figure 8.
Comparison between peak strength and precursor indicators under different wetting–drying cycles.
In contrast, σtp–b displays larger scatter, with an anomalously low value at 5 cycles in Figure 8. This implies that the b-value turning-point identification can be sensitive to moving-window stability and to the event-sampling structure in early loading, especially when AE activity is sparse or highly nonstationary. Therefore, for sandstone under wetting–drying degradation, D2 appears to be the more robust precursor indicator, while b-value analysis is better interpreted as a complementary descriptor of crack-scale redistribution rather than a standalone turning-stress predictor. A practical strategy is to use σtp–D2 as the primary instability precursor and to interpret concurrent b-value decline and RA–AF shear shift as corroborative evidence for macrocrack coalescence and imminent failure.
Under the present dataset, AE event-density conditions, and parameter settings, the D2 turning feature shows lower dispersion and better pre-peak consistency than the b value. This does not suggest that the b value is not informative; rather, under wetting–air-drying conditions, where damage evolution becomes increasingly nonstationary, the b value is more susceptible to local event fluctuations and moving-window settings because it is based on amplitude-distribution statistics. By contrast, the D2 response to changes in system dynamical complexity remains relatively more continuous in the present dataset. Therefore, D2 is interpreted here as a relatively more stable precursor indicator under the current experimental conditions, rather than as a universal replacement for the b value. More broadly, the present results are generally consistent with previous sandstone fracture studies in showing that crack initiation is accompanied by enhanced AE activity, crack propagation by accelerated AE-event release, and failure by increasingly pronounced localization. At the same time, compared with intact dry sandstone or simplified flawed sandstone, the wetting–air-drying specimens examined here exhibit earlier crack initiation, stronger AE nonstationarity, and a more evident shift toward mixed/shear-involved failure. These observations suggest that water-related deterioration affects not only the peak mechanical properties of sandstone, but also its crack-evolution pathway and AE response characteristics.
5. Conclusions
(1) Wetting–air-drying cycles induce progressive mechanical deterioration of green sandstone. With increasing cycle number, the peak stress decreases from 72.13 MPa to 54.0 MPa, the elastic modulus from 10.14 GPa to 7.18 GPa, and the mass loss rate increases from 0 to 2.30%, indicating continuous degradation of load-bearing capacity and stiffness. After excluding the initial seating-affected nonlinear segment, the corrected modulus results preserve the same inter-group trend, confirming the reliability of the observed degradation pattern.
(2) Hydraulic cycling significantly modifies the AE evolution process. AE activation occurs earlier, and pre-peak activity becomes more persistent as cycle number increases, indicating enhanced damage nonstationarity. Meanwhile, RA–AF results show a shift from tensile-dominated cracking toward mixed/shear-involved failure, and AE localization/KDE analysis reveals a transition from relatively concentrated damage zones to more dispersed, multi-corridor concentration patterns. These results show that wetting–air-drying deterioration changes not only the mechanical properties of sandstone, but also its crack-initiation timing, failure-mode composition, and spatial damage evolution.
(3) Under the present dataset, AE event-density conditions, and parameter settings, the D2 turning feature shows lower dispersion and better pre-peak consistency than the b value. The D2 turning stress decreases from 55.6 MPa to 44.2 MPa with increasing cycle number, while its ratio to peak stress remains within a relatively narrow range of 76.9–80.5%. This suggests that, under the present experimental conditions, D2 is relatively less affected by local event fluctuations and therefore can serve as a more stable precursor indicator in this dataset, although it should not be regarded as a universal replacement for the b value.
(4) From an engineering perspective, the relatively stable normalized level of the D2 turning stress suggests that this feature may provide a useful pre-peak warning margin for water-affected sandstone under similar loading conditions. More broadly, the results indicate that wetting–air-drying deterioration alters not only the peak mechanical properties of sandstone, but also its AE response, crack-evolution pathway, and damage localization behavior, thereby providing experimental support for AE-based instability identification and failure assessment in underground rock engineering subjected to repeated water disturbance.
Author Contributions
S.D.: Writing—review and editing, Supervision. S.C.: Conceptualization, Funding acquisition. Y.L.: Methodology, Writing—original draft. C.Z.: Methodology, Visualization. C.C.: Formal analysis, Software. J.L.: Data curation, Investigation. K.W.: Data curation. All authors have read and agreed to the published version of the manuscript.
Funding
This work was supported by the National Natural Science Foundation of China [grant number 52274143].
Data Availability Statement
All data, models, and code generated or used during the study are included in the published article.
Acknowledgments
The authors gratefully acknowledge everyone for their guidance and help during testing and writing.
Conflicts of Interest
The authors declare no conflicts of interest.
References
- Zhong, Z.; Hu, B.; Li, J.; Sheng, J.; Wan, C. Impact of rainfall dry-wet cycles on slope deformation and landslide prediction in open-pit mines: A case study of Mohuandang Landslide, Emeishan, China. Results Eng. 2025, 26, 105011. [Google Scholar] [CrossRef] [Scilit]
- Tang, L.; Yan, Y.; Zhang, F.; Li, X.; Liang, Y.; Yan, Y.; Zhang, H.; Zhang, X. A case study for analysis of stability and treatment measures of a landslide under rainfall with the changes in pore water pressure. Water 2024, 16, 3113. [Google Scholar] [CrossRef] [Scilit]
- Yang, P.; Li, C.; Wu, Z.; He, Z. Study on the microstructure and strength characteristics of marine soft soil under wet-dry cycle condition. Alex. Eng. J. 2024, 102, 240–249. [Google Scholar] [CrossRef] [Scilit]
- Zhu, M.; Li, X.; Deng, J.; Ye, Z. Generalized evaluation of the effects of wet/dry cycling on CFRP-concrete bond subjected to low-cycle fatigue loading. Eng. Struct. 2022, 269, 114762. [Google Scholar] [CrossRef] [Scilit]
- Williams, R.T.; Fagereng, A. The role of quartz cementation in the seismic cycle: A critical review. Rev. Geophys. 2022, 60, e2021RG000768. [Google Scholar] [CrossRef] [Scilit]
- Ma, J.; Li, D.; Luo, P.; Zhu, Q.; Zhang, C.; Su, X. Subcritical crack growth and fracture behavior of rocks and long-term strength estimation. Theor. Appl. Fract. Mech. 2022, 122, 103664. [Google Scholar] [CrossRef] [Scilit]
- Yu, L.; Yao, Q.; Chong, Z.; Li, Y.; Xu, Q.; Xie, H.; Ye, P. Mechanical and micro-structural damage mechanisms of coal samples treated with dry–wet cycles. Eng. Geol. 2022, 304, 106637. [Google Scholar] [CrossRef] [Scilit]
- Zhu, L.; He, Z.; Liu, R.; Li, T.; Du, R.; Sun, M. Effect of Wet-Dry Cycles on the Loading–Unloading Damage of Granite. Fatigue Fract. Eng. Mater. Struct. 2025, 48, 173–187. [Google Scholar] [CrossRef] [Scilit]
- Qi, S.; Zhang, H.; Bian, H.; Wang, J.; Xu, S.; Wu, B. Damage characteristics and degradation mechanism of silty mudstone under wet–dry cycling. Geotech. Geol. Eng. 2024, 42, 6095–6112. [Google Scholar] [CrossRef] [Scilit]
- Yang, Z.; Li, S.; Liu, Y.; Zhang, N. Experimental study on the influence of water–rock interaction on the time-varying characteristics of coal rock mass. Environ. Geochem. Health 2024, 46, 45. [Google Scholar] [CrossRef] [Scilit]
- You, X.; Wang, Y.; Liu, X.; Zhao, K.; Gong, B.; Liu, X. Intelligent Decision Supporting System for Precursors of Rock Instability: The Application of Early Warning of Rock Shear-Slip Instability. Int. J. Energy Res. 2025, 2025, 9267226. [Google Scholar] [CrossRef] [Scilit]
- Wang, Y.; Deng, H.; Deng, Y.; Chen, K.; He, J. Study on crack dynamic evolution and damage-fracture mechanism of rock with pre-existing cracks based on acoustic emission location. J. Pet. Sci. Eng. 2021, 201, 108420. [Google Scholar] [CrossRef] [Scilit]
- Dong, F.; Li, Y.; Li, B. Acoustic emission-driven fatigue damage evolution equation and life prediction of composite laminates. Int. J. Fatigue 2025, 198, 109012. [Google Scholar] [CrossRef] [Scilit]
- Qin, L.; Guo, C.; Sun, W.; Chu, X.; Ji, T.; Guan, H. Identification of damage mechanisms of polymer-concrete in direct shearing tests by acoustic emission. Constr. Build. Mater. 2022, 351, 128813. [Google Scholar] [CrossRef] [Scilit]
- Sun, J.; Liu, D.; He, P.; Guo, L.; Cao, B.; Zhang, L.; Li, Z. Experimental investigation on acoustic emission precursor of rockburst based on unsupervised machine learning method. Rock Mech. Bull. 2024, 3, 100099. [Google Scholar] [CrossRef] [Scilit]
- Tan, G.; Zhu, Z.; Wang, W.; Wu, C.; Ou, J.; Cui, G.; Zhang, D. Flexural ductility and crack-controlling capacity of polypropylene fiber reinforced ECC thin sheet with waste superfine river sand based on acoustic emission analysis. Constr. Build. Mater. 2021, 277, 122321. [Google Scholar] [CrossRef] [Scilit]
- Li, Z.; Xu, R. An early-warning method for rock failure based on Hurst exponent in acoustic emission/microseismic activity monitoring. Bull. Eng. Geol. Environ. 2021, 80, 7791–7805. [Google Scholar] [CrossRef] [Scilit]
- Wang, Y.; Song, Z.; Mao, T.; Zhu, C. Macro–meso fracture and instability behaviors of hollow-cylinder granite containing fissures subjected to freeze–thaw–fatigue loads. Rock Mech. Rock Eng. 2022, 55, 4051–4071. [Google Scholar] [CrossRef] [Scilit]
- Zhang, Y.; Tong, L.; Lai, X.; Cao, S.; Yan, B.; Yang, Y.; Liu, Y.; He, W. Research on coal-rock identification method and data augmentation algorithm of comprehensive working face based on FL-Segformer. Int. J. Coal Sci. Technol. 2024, 11, 48. [Google Scholar] [CrossRef] [Scilit]
- Ostapchuk, A.; Morozova, K.; Markov, V.; Pavlov, D.; Popov, M. Acoustic emission reveals multiple slip modes on a frictional fault. Front. Earth Sci. 2021, 9, 657487. [Google Scholar] [CrossRef] [Scilit]
- Dong, L.; Zhang, Y.; Bi, S.; Ma, J.; Yan, Y.; Cao, H. Uncertainty investigation for the classification of rock micro-fracture types using acoustic emission parameters. Int. J. Rock Mech. Min. Sci. 2023, 162, 105292. [Google Scholar] [CrossRef] [Scilit]
- Du, K.; Luo, X.; Liu, M.; Liu, X.; Zhou, J. Understanding the evolution mechanism and classification criteria of tensile-shear cracks in rock failure process from acoustic emission (AE) characteristics. Eng. Fract. Mech. 2024, 296, 109864. [Google Scholar] [CrossRef] [Scilit]
- Chen, Z.; Zhang, G.; He, R.; Tian, Z.; Fu, C.; Jin, X. Acoustic emission analysis of crack type identification of corroded concrete columns under eccentric loading: A comparative analysis of RA-AF method and Gaussian mixture model. Case Stud. Constr. Mater. 2023, 18, e02021. [Google Scholar] [CrossRef] [Scilit]
- Xu, W.; Yuan, J.; Zhang, D.; Qiu, X.; Zheng, K.; Su, Z.; Hong, H. Damage evolution and cracking behaviors of hot reclaimed asphalt mixtures with high recycled asphalt pavement (RAP) content based on acoustic emission (AE) parameters and waveform characteristics. Constr. Build. Mater. 2026, 514, 145533. [Google Scholar] [CrossRef] [Scilit]
- Wesnousky, S.G. The Gutenberg-Richter or characteristic earthquake distribution, which is it? Bull. Seismol. Soc. Am. 1994, 84, 1940–1959. [Google Scholar] [CrossRef] [Scilit]
- Dong, L.; Zhang, L.; Liu, H.; Du, K.; Liu, X. Acoustic emission b value characteristics of granite under true triaxial stress. Mathematics 2022, 10, 451. [Google Scholar] [CrossRef] [Scilit]
- Miao, S.; Pan, P.Z.; Zhao, X.; Shao, C.; Yu, P. Experimental study on damage and fracture characteristics of Beishan granite subjected to high-temperature treatment with DIC and AE techniques. Rock Mech. Rock Eng. 2021, 54, 721–743. [Google Scholar] [CrossRef] [Scilit]
- Liu, C.; Zhao, G.; Xu, W.; Meng, X.; Liu, Z.; Cheng, X.; Lin, G. Experimental study on failure characteristics of single-sided unloading rock under different intermediate principal stress conditions. Int. J. Min. Sci. Technol. 2023, 33, 275–287. [Google Scholar] [CrossRef] [Scilit]
- Li, S.; Lin, H.; Cao, R.; Wang, Y.; Zhao, Y. Mechanical behavior of rock-like specimen containing hole-joint combined flaw under uniaxial loading: Findings from DIC and AE monitoring. J. Mater. Res. Technol. 2023, 26, 3426–3449. [Google Scholar] [CrossRef] [Scilit]
- Xia, Z.; Yao, Q.; Li, X.; Yu, L.; Shan, C.; Li, Y.; Hao, Y. Acoustic emission characteristics and energy mechanism of CFRP-jacketed coal specimens under uniaxial compression. Constr. Build. Mater. 2022, 342, 127936. [Google Scholar] [CrossRef] [Scilit]
- Ge, Z.; Sun, Q. Acoustic emission characteristics of gabbro after microwave heating. Int. J. Rock Mech. Min. Sci. 2021, 138, 104616. [Google Scholar] [CrossRef] [Scilit]
- Zhou, X.; Liu, X.; Wang, X.; Liu, Y.; Xie, H.; Du, P. Acoustic emission characteristics of coal failure under triaxial loading and unloading disturbance. Rock Mech. Rock Eng. 2023, 56, 1043–1061. [Google Scholar] [CrossRef] [Scilit]
- Li, H.; Ma, H.; Yang, C.; Zhao, K.; Hu, Z.; Daemen, J.J.K. Acoustic emission characteristics of rock salt under multi-stage cyclic loading. Int. J. Fatigue 2023, 176, 107911. [Google Scholar] [CrossRef] [Scilit]
- Yu, X.; Zuo, J.; Mao, L.; Xu, X.; Lei, B.; Zhao, S. Uncovering the progressive failure process of primary coal-rock mass specimens: Insights from energy evolution, acoustic emission crack patterns, and visual characterization. Int. J. Rock Mech. Min. Sci. 2024, 178, 105773. [Google Scholar] [CrossRef] [Scilit]
- Chen, J.; Huang, H.; Rui, Y.; Pu, Y.; Zhang, S.; Li, Z.; Wang, W. Enhancing microseismic/acoustic emission source localization accuracy with an outlier-robust kernel density estimation approach. Int. J. Min. Sci. Technol. 2024, 34, 943–956. [Google Scholar] [CrossRef] [Scilit]
- Li, Z.; Zhang, Y.; Li, C.; Xu, M.; Dai, W.; Liu, Z. Modeling and nonlinear dynamic analysis of bolt joints considering fractal surfaces. Nonlinear Dyn. 2022, 108, 1071–1099. [Google Scholar] [CrossRef] [Scilit]
- Bounoua, W.; Bakdi, A. Fault detection and diagnosis of nonlinear dynamical processes through correlation dimension and fractal analysis based dynamic kernel PCA. Chem. Eng. Sci. 2021, 229, 116099. [Google Scholar] [CrossRef] [Scilit]
- Zhou, Z.; Zhao, C.; Cai, X.; Huang, Y. Three-dimensional modeling and analysis of fractal characteristics of rupture source combined acoustic emission and fractal theory. Chaos Solitons Fractals 2022, 160, 112308. [Google Scholar] [CrossRef] [Scilit]
- Xu, J.; Luo, X.; Qiu, X.; Hu, G. Wavelet and fractal analysis of acoustic emission characteristic of fatigue damage of asphalt mixtures. Constr. Build. Mater. 2022, 349, 128643. [Google Scholar] [CrossRef] [Scilit]
- Cheng, T.; Wang, L.; Xiao, Y.; He, M.; Wang, T.; Peng, M.; Li, H. Correlational fractal characteristics and damage progression of granite with different grain sizes based on acoustic emission monitoring. Eng. Geol. 2023, 327, 107358. [Google Scholar] [CrossRef] [Scilit]
- Yang, J.; Zhao, K.; Yu, X.; Yan, Y.; He, Z.; Zhou, Y.; Lai, Y. Fracture evolution of fiber-reinforced backfill based on acoustic emission fractal dimension and b-value. Cem. Concr. Compos. 2022, 134, 104739. [Google Scholar] [CrossRef] [Scilit]
- Zhang, R.; Liu, J.; Sa, Z.; Wang, Z.; Lu, S.; Lv, Z. Fractal characteristics of acoustic emission of gas-bearing coal subjected to true triaxial loading. Measurement 2021, 169, 108349. [Google Scholar] [CrossRef] [Scilit]
- Ali, M.; Wang, E.; Li, Z.; Khan, N.M.; Sabri Sabri, M.M.; Ullah, B. Investigation of the acoustic emission and fractal characteristics of coal with varying water contents during uniaxial compression failure. Sci. Rep. 2023, 13, 2238. [Google Scholar] [CrossRef] [Scilit] [PubMed]
- Zhao, C.; Cao, S.; Lang, S.; Du, S.; Che, C. Uniaxial Compressive Failure Characteristics and Fractal Analysis of Mud–Sand Composite Rock Samples Based on Acoustic Emission Tests. Fractal Fract. 2024, 8, 713. [Google Scholar] [CrossRef] [Scilit]
- Cao, K.; Xu, Y.; Khan, N.M.; Li, X.; Cui, R.; Hussain, S.; Armaghani, D.J.; Alarifi, S.S. A comprehensive model for evaluating infrared radiation and acoustic emission characteristics of sandstone fracture. Eng. Fract. Mech. 2023, 283, 109217. [Google Scholar] [CrossRef] [Scilit]
- Li, J.; Lian, S.; Huang, Y.; Wang, C. Study on crack classification criterion and failure evaluation index of red sandstone based on acoustic emission parameter analysis. Sustainability 2022, 14, 5143. [Google Scholar] [CrossRef] [Scilit]
- Shuai, W.; Ying, X.; Yanbo, Z.; Xulong, Y.; Peng, L.; Xiangxin, L. Effects of sandstone mineral composition heterogeneity on crack initiation and propagation through a microscopic analysis technique. Int. J. Rock Mech. Min. Sci. 2023, 162, 105307. [Google Scholar] [CrossRef] [Scilit]
- Yu, L.; Yao, Q.; Xu, Q.; Wang, W.; Niu, Z.; Liu, W. Experimental and numerical simulation study on crack propagation of fractured fine sandstone under the influence of loading rate. J. China Coal Soc. 2021, 46, 3488–3501. [Google Scholar]
- Jiao, Y.; Zuo, Y.; Wen, Z.; Chen, Q.; Zheng, L.; Lin, J.; Chen, B.; Rong, P.; Jin, K.; Du, S. Crack-tip propagation laws and energy evolution of fractured sandstone. Eng. Fail. Anal. 2024, 166, 108832. [Google Scholar] [CrossRef] [Scilit]

Disclaimer/Publisher’s Note: The statements, opinions and data contained in all publications are solely those of the individual author(s) and contributor(s) and not of MDPI and/or the editor(s). MDPI and/or the editor(s) disclaim responsibility for any injury to people or property resulting from any ideas, methods, instructions or products referred to in the content. |
© 2026 by the authors. Licensee MDPI, Basel, Switzerland. This article is an open access article distributed under the terms and conditions of the Creative Commons Attribution (CC BY) license.