


Abstract
Characterizing full-scale pore-throat systems constitutes a critical challenge in the investigation of hydrocarbon-bearing spaces within tight unconventional reservoirs. Given the intricate nature of micro–nano-scale pore throats, individual characterization techniques are insufficient to achieve a comprehensive and precise description. In response, this study develops a Gaussian Mixture Model (GMM)-oriented methodology for full-scale pore-throat analysis integrating multi-source data, which encompasses five successive procedures: data optimization, optimal cluster number determination, model analysis, data fusion, and data reconstruction. Taking tight mixed-lithology samples from Block D of the Qaidam Basin as the research object, effective pore-throat thresholds were defined based on lithology-dependent breakdown pressures to facilitate cluster analysis of multi-source datasets. Following the screening of representative pore-throat clusters and data fusion via Gaussian Mixture functions, the full-scale pore-throat distribution was ultimately derived. Comparative analysis demonstrates that Nuclear Magnetic Resonance (NMR) and High-Pressure Mercury Intrusion (HPMI) data exhibit satisfactory fitting consistency at major cluster peaks, with NMR being more effective in resolving nanopores and HPMI excelling in characterizing medium to large pores. Comprehensive evaluation results validate that the proposed methodology enables efficient integration of multi-technical data, uncovers hidden pore-throat systems, and realizes innovative fractal dimension analysis of full-scale pore-throat structures by taking pore-throat clusters as the basic analytical unit. Consequently, this work offers a novel methodological framework for the quantitative characterization of full-scale pore-throats using multi-source data.
1. Introduction
As the global energy demand continues to surge and conventional oil and gas resources gradually deplete, unconventional resources, including tight sandstone oil and gas, shale gas, coalbed methane, heavy oil, and oil sand, have increasingly captured the attention of the petroleum industry. These unconventional reservoirs are regarded as copious and dependable energy sources [1,2,3]. In contrast to conventional reservoirs, unconventional reservoirs feature pore-throat structures with a span of seven orders of magnitude [4]. The minuscule size of pore throats, intricate pore-throat structures, poor connectivity, and pronounced heterogeneity pose formidable challenges to the comprehensive characterization of pore throats [5,6]. These factors render the accurate and thorough characterization of pore-throat systems in unconventional reservoirs a complex task. The pore-throat structure is among the pivotal factors affecting the reservoir’s storage capacity and seepage ability [7,8,9]. Therefore, a comprehensive description and quantitative assessment of the pore-throat structure are imperative for quantifying the correlations among porosity, reserves, migration, and reservoir properties [10].
Currently, a plethora of experimental methods exist for characterizing the pore-throat structures of unconventional reservoirs, yet each method presents distinct advantages and limitations [11]. The principal research approaches for analyzing the pore structures of tight reservoirs encompass image analysis techniques, fluid invasion methods, and radiation methods [12,13]. Semi-quantitative methods grounded in image analysis, such as scanning electron microscopy (SEM), focusedion beam-scanning electron microscopy (FIB-SEM), and computed tomography (CT) scanning, are especially adept at examining pore morphology and connectivity. Significantly, CT scanning technology enables non-destructive reconstruction of the three-dimensional pore network [14,15]. Nevertheless, the restricted field of view in SEM and FIB-SEM impedes the acquisition of comprehensive information, and the characterization range is circumscribed by the instrument resolution [16]. Despite its formidable capabilities, CT scanning technology has a resolution inversely proportional to the sample size, typically confining it to the micrometer scale. Moreover, the processing and reconstruction of three-dimensional pore networks are intricate, demanding a high degree of expertise for data interpretation [17,18]. HPMI and nitrogen adsorption (NA) methods are well-established techniques for characterizing pore morphology and size distribution via fluid injection. Nevertheless, these methods may, to a certain extent, disrupt the original pore-throat structure [19,20,21]. To circumvent the impact of measurement data under high pressure in the latter stages of HPMI, it is commonly employed to characterize shale pore throats larger than 50 nm [22]. The NMR method, which assesses pore structures non-destructively by measuring hydrogen signals, has now become a prevalent technique for pore-throat characterization. It can characterize pores with sizes ranging from 2 nm to 1000 nm. However, the accuracy of its results is affected by testing conditions, fluid properties, and other factors, and it is generally utilized in combination with other methods [15,23,24]. Beyond these characterization techniques, fractal theory serves as a powerful complementary approach for pore-throat structure investigation, as it enables the integration of reservoir microscopic morphology and macroscopic performance to quantify the structural complexity of pore-throat systems [20,25]. Specifically, for pore-throat distribution datasets derived from HPMI, NMR, and NA measurements—the core techniques for full-scale pore-throat analysis—the relationship between cumulative volume percentage and pore-throat radius is leveraged to calculate fractal dimensions, which in turn quantify the complexity of pore-throats across different hierarchical scales [26,27,28].
Evidently, remarkable advancements have been achieved in the realm of pore-throat characterization. One of the pivotal research directions lies in the integration of multiple characterization techniques to accomplish comprehensive pore-throat characterization within micro–nano systems. For core-based laboratory experiments, characterizing pore-throat structures serves as a fundamental prerequisite for investigating the microscopic seepage mechanisms of fluids in pore-throat systems. Full-scale characterization of pore-throat structures further enhances the accuracy and rationality of various related studies. Studies have demonstrated that constant-rate mercury intrusion (CRMI) can be utilized to differentiate between pores and throats. By integrating the throat size distribution (TSD) curve derived from CRMI with the small-pore segment of the NMR curve, a comprehensive TSD curve can be constructed. Subsequently, by incorporating the pore size distribution (PSD) characterized via the NMR curve for the large-pore range, the comprehensive pore-throat characterization is realized [1,8]. Moreover, semi-quantitative methods, including SEM, FIB-SEM, and CT scanning, can also be employed to characterize the comprehensive pore-throat distribution. These methods are capable of evaluating both the fundamental volume and area of pores [20]. Additionally, certain researchers have classified pore space into seven distinct scales and utilized diverse experimental techniques to achieve thorough, comprehensive characterization [4].
Current full-scale characterization approaches are predominantly confined to data splicing or discrete representations, which are unable to effectively integrate multiple data types for comprehensive and holistic characterization [16,29,30]. This also leads to the current absence of analytical methods for characterizing the full-scale pore-throat structure and the fractal dimensions of its pore-throat system units. Simple data splicing fails to integrate multi-source data in a scientifically sound and reasonable manner. Determining the effective representation scope and weighting of different characterization methods in data fusion remains a crucial research topic [11,31].
The cross-application of mathematical algorithms and machine learning methods in the energy sector constitutes a pivotal approach to driving technological advancement [32,33,34,35]. A wide variety of algorithms can be employed for data fusion. Principal component analysis (PCA) is widely used for data redundancy removal and dimensionality reduction, while Bayesian data fusion methods are adopted for uncertainty quantification and optimal value estimation. Clustering algorithms also exhibit good performance in data fusion, as they cluster massive data into meaningful clusters to achieve real-time data fusion. Machine learning-based data fusion is mainly categorized into three types: signal-level data fusion, feature-level data fusion, and decision-level data fusion. According to the availability of supervised data, it can also be divided into supervised and unsupervised data fusion. For unsupervised pore-throat distribution data, we aim to extract geologically meaningful information through algorithms and then integrate the data via data fusion methods. Therefore, unsupervised feature-level fusion methods, such as clustering approaches, should be selected for feature extraction and re-fusion. The GMM is an algorithm proficient in clustering and estimating data that adhere to a Gaussian distribution, rendering it well-suited for multimodal data analysis [36]. Gaussian distributions have been extensively utilized in the domain of pore-throat characterization, demonstrating potent estimation capabilities for pore-throat distributions following a logarithmic pattern [37,38]. This model proves instrumental in uncovering latent pore systems and estimating the overall pore-throat distribution. It conforms to the data characteristics of the pore-throat structure and can extract and retain the pore-throat cluster features that reflect the original pore distribution, which carries practical geological significance. Moreover, it assigns quantitative weights to each cluster, making it an ideal data fusion model.
Presently, it is widely employed to estimate the NMR T2 spectra and PSD curves obtained from single pore-throat characterization techniques [39]. Dong et al. (2023) utilized a Gaussian bimodal function to fit the T2 spectral data and found that the fitting function exhibited an exceptionally high correlation with the measured curves, with R2 values typically surpassing 0.99 [28]. An unsupervised clustering approach based on GMM was proposed to extract quantitative pore structure information from the T2 spectra of NMR logging data [40]. This methodology involves fitting the dimensionality-reduced T2 spectra data (after Principal Component Analysis, PCA) using the GMM probability density function. Model parameters and the optimal number of clusters are determined via the Expectation-Maximization (E-M) algorithm and the Akaike Information Criterion (AIC). The study further investigates the T2 spectral characteristics and pore structure types associated with different cluster groups, providing a comprehensive understanding of pore systems. A truncated Gaussian distribution, analogous to the standard Gaussian function, was integrated with the core capillary bundle model [41]. Through a multimodal superposition approach, a multimodal distribution function for core pores was established, accurately characterizing the multimodal features of core pore volume distribution. A deconvolution method similar to GMM was employed to merge the pore-throat distributions derived from N2 and CO2 adsorption at a 2 nm threshold [42]. Gaussian mixture functions were applied to minimize the Sum of Squared Errors (SSE) during fitting, achieving a comprehensive characterization of pore throats. Additionally, an analysis of primary pore-throat clusters within the samples was conducted, offering in-depth insights into the pore structure.
Compared with other clustering and data fusion methods, GMM offers several distinct advantages in tackling the multi-source data fusion problem of pore-throat distributions: (1) Numerous previous studies have confirmed that the GMM exhibits excellent adaptability to pore-throat data with a lognormal distribution [28,37,38,41,42], and can efficiently fit and cluster the original datasets transformed into a Gaussian distribution via mapping. (2) It can effectively analyze the clusters of multi-source data and discern the weight distribution among different clusters [43]. Its ability to dynamically adjust the mixture weights of pore-throat clusters renders it a prime choice for ensuring data validity during the fusion of pore-throat distribution data. (3) Compared to hard clustering methods, GMM demonstrates superior performance in handling continuous data and gradual boundaries within natural datasets, especially for clustering tasks with ambiguous boundaries. This soft clustering approach enables the calculation of the membership probability of a single pore-throat to different pore-throat clusters, i.e., the contribution degree of a single pore-throat to various pore-throat clusters, which is more consistent with the geological reality of overlapping and gradual boundaries among the micro–nano pore-throat systems in tight reservoirs [44,45,46]. (4) The parameters of pore-throat clusters derived from the GMM possess geological interpretability: the mean, variance, and weight of the pore-throat clusters obtained by the GMM can respectively represent the dominant radius, heterogeneity, and volume contribution ratio of the pore-throat clusters.
Previous research efforts have witnessed substantial advancements in applying the GMM to the cluster analysis of individual T2 spectra and PSD curves. Explorations have also been carried out regarding the integration of PSD curves derived from multiple pore-throat characterization methods. Nevertheless, the rationality of data fusion strategies and the reliability of data obtained from diverse characterization techniques still necessitate further investigation.
To address the challenges in multi-source data fusion for full-scale pore-throat structure characterization, this study establishes a research framework centered on methodological innovation, with further extensions to physical insights and practical application value. Based on the GMM, a full-scale characterization method for pore-throat structures via multi-source data fusion is developed. Using NMR and HPMI test data obtained from tight mixed sedimentary rock samples in the D area of the Qaidam Basin as a case study, we achieve full-scale characterization of pore-throat structures and conduct targeted fractal dimension analysis on typical pore-throat clusters identified from the full-scale distribution data. The proposed method overcomes the limitations of traditional simple data-splicing strategies, provides a new perspective for pore-throat structure analysis and fractal research, and further establishes a reliable technical foundation for the evaluation and development of tight reservoirs.
2. Materials and Methods
2.1. Sample Characteristics
This study focused on four tight migmatite samples sourced from the D area of the Qaidam Basin. The cores were collected at depths ranging from 3332.83 to 3984.58 m. Table 1 presents the basic characteristics of these cores, along with the overburden pressure, porosity, and permeability test data.
Table 1.
Basic information about the core.
2.2. HPMI Principles
HPMI is a technique in which pressure is exerted on the non-wetting phase mercury to surpass the capillary forces of pore throats, thereby enabling mercury to penetrate into the pore throats. When the capillary forces reach equilibrium, the injection pressure and the volume of mercury injected at each constant pressure are meticulously recorded. By leveraging the formula that describes the relationship between capillary force and pore radius, this method indirectly ascertains the distribution of rock pore throat sizes [47].
The corresponding pore radius can be computed from the injection pressure, and the volume of mercury injected at this pressure corresponds to the volume of interconnected pores. The relationship between capillary force and pore throat radius is described as follows:
In Equation (1), P represents the capillary force, with the unit of Pa; γ is the surface tension of mercury, which is a constant value of 0.48 N/m; θ is the wetting contact angle of mercury, and it is generally taken as 140°; and r is the radius of the pore throat, with the unit of meters.
2.3. NMR Principles
NMR is capable of analyzing the pore-throat distribution by detecting the relaxation signals of hydrogen-containing fluids within water-saturated rock samples. The relaxation time T2 of the fluid in the pores can be expressed as follows [48]:
In Equation (2), T2B is the bulk relaxation time, which is determined by the intrinsic properties of the fluid; T2S is the surface relaxation time, which characterizes the process of energy attenuation caused by collisions between spin hydrogen nuclei and the rock pore wall; and T2D is the diffusion relaxation time, which is the relaxation time of the pore fluid due to diffusion induced by magnetic field gradients resulting from magnetic field inhomogeneity and other factors.
When there is only one type of fluid in the pores, T2B is typically greater than 3000 ms. Bulk relaxation is much slower than surface relaxation, so the former can be neglected. By optimizing the pulse sequence parameters and controlling the main magnetic field strength, the influence of the magnetic field gradient can be minimized as much as possible.
In a uniform magnetic field, the transverse relaxation time of atoms within a single water-saturated pore can be approximated as follows [10]:
In Equation (3), is the surface relaxivity; S is the pore surface area; and V is the pore volume.
When pore structures are simplified into spherical and cylindrical forms, the relationship between the specific surface area and the pore diameter can be expressed as follows [1]:
In Equation (4), r is the pore throat radius; S is the pore surface area; V is the pore volume; and Fs is the geometric factor of the pore shape. For spherical pores, Fs = 3; for cylindrical pores, Fs = 2; and for slab-like pores, Fs = 1.
NMR experiments can capture the pore-throat signals of samples, whereas HPMI is capable of measuring the pore-throat radius. Consequently, a correlation between the T2 spectrum and pore-throat radius can be established, and the T2 spectrum can be transformed into a pore-throat radius distribution, enabling an accurate depiction of the relationship between pore structure and fluid properties [49,50]. Previous research, based on the analysis of numerous experimental results, has shown that the T2 spectrum distribution has an exponential correlation with the pore radius [8]. Equation (5) is expressed as follows:
In Equation (5), rt represents the throat radius, n denotes the exponential constant in this relationship, and C is a constant composed of the shape factor and surface relaxation rate [51,52].
This constant can be expressed by Equation (6) as follows:
Currently, the majority of studies make use of the inverse cumulative curves of HPMI pore-throat distribution data and NMR T2 spectrum data to establish a one-to-one correspondence between T2 relaxation and pore-throat radius. Subsequently, the least squares method is applied to fit the relationship between T2 relaxation and pore-throat radius, thus enabling the transformation of NMR data. Research has indicated that during this conversion process, the non-uniform distribution of high-pressure mercury injection data may give rise to less-than-ideal fitting outcomes. However, the adoption of segmented fitting can effectively resolve this problem, yielding a higher correlation coefficient [53].
2.4. Pore-Throat Full-Scale Characteristics Method
2.4.1. GMM
The Gaussian Mixture Model (GMM) is a clustering algorithm within the realm of machine learning. It is capable of detecting clusters in datasets that adhere to Gaussian distributions. By fine-tuning the mean, covariance matrix, and weight coefficients of each Gaussian component, GMM accurately integrates multiple Gaussian distributions via linear superposition, enabling it to fit intricate probability density distributions [37,54,55].
For a D-dimensional vector X, if each of its elements follows a multivariate Gaussian distribution with mean vector M and covariance matrix Σ, the probability density function can be expressed as Equation (7):
In Equation (7), X denotes a D-dimensional vector, k represents the k-th Gaussian distribution cluster, Mk is the mean matrix of the k-th Gaussian distribution cluster, Σk stands for the covariance matrix of the k-th Gaussian distribution cluster, and T is a mathematical symbol indicating the transposition of a matrix.
Taking into account the linear superposition of K Gaussian distributions, the probability density function of the Gaussian Mixture Model can be expressed as Equation (8):
Equation (8) can be termed a Gaussian Mixture, in which f(X, Mk, Σk) represents the probability density function of each Gaussian distribution. Each Gaussian distribution serves as a component of the overall mixture model, accompanied by its respective mean vector Mk and covariance matrix Σk. The term πk signifies the mixing coefficients of the model, which reflect the weights assigned to each Gaussian distribution.
By performing integration on both sides of Equation (8) with respect to X, we are able to derive Equation (9):
The objective of the GMM is to maximize the likelihood function of the data by estimating the mean Mk, covariance matrix Σk, and weight πk of each Gaussian distribution.
2.4.2. E-M Algorithm
The E-M algorithm is an iterative optimization method designed to maximize the likelihood function of models with latent variables [56]. To facilitate calculations, the log-likelihood function is commonly utilized, transforming products into sums [37], as illustrated in Equations (10) and (11):
In Equations (10) and (11), W denotes the weight matrix of each Gaussian distribution. p denotes the Probability Density Function (PDF). It represents the marginal probability density of a single observed sample Xi, namely the probability density of observing sample Xi given the model parameters M, Σ, and W.
Substituting the probability density function of the GMM, we obtain:
In the GMM, latent variables are associated with the underlying Gaussian distributions to which each data point is attributed, mirroring the concealed pore systems within pore-throat distributions. The E-M algorithm optimizes the model parameters iteratively through two sequential steps: the Expectation Step (E-step) and the Maximization Step (M-step).
During the E-step, the posterior probability of each data point Xi belonging to each Gaussian distribution k is calculated. This probability quantifies the likelihood that the data point Xi is generated from Gaussian distribution k [36]:
In Equation (13), γik represents the posterior probability that the data point Xi belongs to the k-th Gaussian distribution, and f(Xi, Mk, Σk) denotes the probability density function of the k-th Gaussian distribution.
During the M-step, the new model parameters—the weight πk, mean Mk, and covariance matrix Σk—are updated based on the posterior probabilities γik obtained in the E-step:
In Equations (14)–(16), Equation (14) demonstrates that the weight πk represents the average probability of the k-th Gaussian distribution over all data points. Equation (15) elucidates that the mean Mk is the weighted average of all data points, with the weights being the probabilities of each data point belonging to the k-th Gaussian distribution. Equation (16) reveals that the covariance matrix Σk is the weighted covariance of the deviations of the data points from the mean, where the weights are the probabilities that each data point belongs to the k-th Gaussian distribution.
The E-M algorithm iteratively alternates between the E-step and the M-step. Eventually, it converges to a set of parameters (πk, Mk, Σk) that maximize the log-likelihood function of the Gaussian Mixture Model (as presented in Equation (12)), thereby reaching a local optimal solution.
2.4.3. GMM-Driven Multi-Source Fusion for Pore-Throat Characterization
To address the full-scale characteristics of rock pore-throat systems, this study presents a GMM-driven multi-source fusion approach for pore-throat characterization.
The following data optimization and preprocessing steps are applied to the pore-throat distribution data before GMM clustering. Firstly, the pore-throat distribution data derived from various characterization methods are sampled via the weighted Bootstrap method, generating datasets consistent with the original probability distribution. Subsequently, the raw data undergoes a logarithmic transformation to improve its approximation to a Gaussian distribution. Then, the data is uniformly mapped to the interval from 1 to 100, which effectively mitigates the adverse effects of uneven and overly broad data distributions on the GMM results [36]. Finally, before importing the data into the GMM, the K-means algorithm is employed to initialize the pore-throat clusters. Iteration is performed based on the parameters obtained from this initialization, which reduces the number of iterations and enhances the stability of the model.
Following that, input the processed data into the GMM. Calculate the AIC and the BIC to determine the optimal number of clusters for the data under different characterization methods. The AIC and the Bayesian Information Criterion (BIC) are utilized to construct a function for selecting the optimal number of model clusters [57,58,59]. The core selection criterion is that smaller AIC and BIC values indicate a better trade-off between GMM fitting accuracy and model complexity. In practice, the elbow point of the AIC/BIC curve is typically chosen as the optimal cluster number. By balancing model accuracy and complexity, a reasonable number of clusters is determined to avoid overfitting, as shown in Equations (17) and (18):
k represents the number of parameters in the model, n denotes the number of samples, and L is the likelihood function.
The optimized data obtained from various characterization methods were fitted by employing the GMM with the optimal number of clusters, thereby uncovering the concealed pore systems within the data distribution. Each cluster was characterized and described using parameters such as the mean, variance, and weight. Based on the effectiveness of different pore-throat characterization data as the selection criterion, representative typical pore-throat clusters were chosen, and the weights of each cluster were adjusted accordingly. The parameters of the typical clusters derived from all characterization methods were aggregated.
In this study, the adopted strategy follows empirical evidence from previous studies regarding the effectiveness of different characterization methods. The general framework involves using HPMI to characterize large pores and NMR to characterize small pores. Given that the high pressure applied during HPMI experiments may damage the structure of small pore throats, the characterization threshold of pore-throat radius is determined for cores of different lithologies according to the rock breakdown pressure with the aid of Equation (1). In this way, representative pore-throat clusters are selected. Regarding the weight correction for different clusters, this study assumes that the weights of pore-throat clusters obtained from nuclear magnetic resonance data, which covers a wider characterization range, are more reliable. Therefore, the weights of pore-throat clusters from high-pressure mercury intrusion are standardized against those from nuclear magnetic resonance. For detailed processing methods and examples, see Section 4.2 and Section 4.3.
After normalizing the weights, these parameters were fed into the Gaussian Mixture Function (as depicted in Equation (8)) for data fusion, leading to a fused distribution of the full-scale data. Finally, the data frequency was normalized, and the pore-throat data were remapped to the pore-throat distribution interval, generating the full-scale pore-throat characterization distribution curve and representative pore-throat clusters.
The workflow of the GMM-based multi-source data fusion method for full-scale characterization of pore-throat structures is depicted in Figure 1. The steps described above can be summarized into five distinct stages: data optimization, selection of the optimal number of clusters, model analysis, data fusion, and data restoration. The detailed steps are presented as follows:
Figure 1.
The flowchart of the GMM-based multi-source data fusion method for full-scale characterization of pore-throat structures.
- (1)
- Data Optimization: Conduct sampling based on various pore-throat distribution curves, simulate the original pore-throat data, and optimize the data through a data mapping approach.
- (2)
- Optimal Cluster Number Determination: Calculate the AIC and the BIC to determine the optimal number of clusters for the data under different characterization methods.
- (3)
- Model Analysis: Apply the GMM to the data from each characterization method using the optimal number of clusters. Analyze the distribution of clusters and derive the mean, variance, and weight of each cluster.
- (4)
- Data Fusion: Integrate the mean, variance, and weights of clusters from different characterization methods. Select representative clusters based on data validity, devise a rigorous weight allocation scheme, normalize the weights, and input them into a Gaussian mixture function to compute the comprehensive data distribution.
- (5)
- Data Reconstruction: Map the data back to the original interval to obtain the full-scale pore-throat characterization distribution curve and representative pore-throat clusters.
Among them, k is the number of characterization methods, m is the number of typical clusters, and X is the processed data set. W, M, and Σ are the sets of weights, means, and variances of the obtained pore-throat clusters. Wk, Mk, and Σk are the sets of weights, means, and variances of all pore-throat clusters of the k-th characterization method. π, m, and σ are the corrected weights, means, and variances corresponding to the typical cluster, respectively. F(x) is the Gaussian mixture function, and f(x) is the Gaussian function of a single pore-throat cluster.
2.5. Fractal Dimension Model
Based on fractal theory, for an arbitrarily selected radius value r, the number of pore throats with a radius larger than r satisfies the following relationship with this radius r [21]:
In Equation (19): N(r) denotes the number of pore throats with a radius larger than r, which is dimensionless; rmax represents the maximum pore throat radius, in micrometers μm; N0 is the proportional constant, which is dimensionless; P refers to the pore throat radius density distribution function; and D is the fractal dimension, which is dimensionless.
Based on the capillary tube model, the following expression is obtained:
where l is the capillary tube length, and VHg denotes the cumulative volume of mercury flowing through the capillary tube with a radius of r, which corresponds to the cumulative volume Vl starting from large pores.
Based on Equations (19) and (20), the following expression is derived [25,26]:
In Equation (21), V denotes the cumulative volume percentage starting from macropores, Ve is the total pore volume, and C is a constant.
Then, based on Equation (23), the slope k is obtained by fitting the linear relationship between lgV and lgr−1, and the fractal dimension D is calculated as D = k + 2.
3. Results
3.1. HPMI Results
The results of the HPMI experiment on the sample are presented in Figure 2. The sample exhibits a relatively high overall displacement pressure, accompanied by a relatively gentle slope of the curve plateau. These characteristics suggest a small maximum pore-throat radius, low permeability, good sorting, the pore-throat radius is on the finer side, and a relatively concentrated pore distribution.
Figure 2.
Capillary pressure curve.
In the figure, the mercury inlet curves of the corresponding samples are shown. It can be seen that the slope of the platform of the mercury inlet curves of most samples is small. The maximum mercury inlet saturation ranges from 88.9% to 63.3%, and the displacement pressure mainly concentrates between 2 MPa and 30 MPa.
Notably, no direct correlation was found between the porosity-permeability parameters and either the mercury injection saturation or the displacement pressure. Samples with inferior physical properties may still demonstrate good connectivity and possess a relatively large maximum connected pore-throat radius. Under higher pressures, in particular, mercury can infiltrate into more interconnected small pores. Even with lower porosity, these tiny interconnected pores can attain a high mercury saturation under elevated capillary pressure.
Based on the permeability contribution and pore-throat distribution measured by high-pressure mercury injection (as depicted in Figure 3), it can be observed that the overall pore-throats of the samples are concentrated and relatively small, predominantly below 0.4 μm. The average pore-throat radius falls within the range of 0.015 to 0.078 μm, and the pore-throat peak is situated within the range of 0.006 to 0.04 μm. The permeability contribution is predominantly governed by larger pores, with a secondary peak in permeability contribution near the pore-throat peak, which aligns with the hypothesis of excellent connectivity in smaller pores.
Figure 3.
Results of high-pressure mercury intrusion experiment. (a) Permeability contribution and pore-throat distribution of sample KF-4. (b) Permeability contribution and pore-throat distribution of sample 7B. (c) Permeability contribution and pore-throat distribution of sample 43. (d) Permeability contribution and pore-throat distribution of sample 1284.
Among the samples, both the KF-4 and 43 samples exhibit pore-throat peaks concentrated around 0.0063 μm. Nevertheless, the permeability contribution from larger pores in the KF-4 sample is significantly higher than that in the 43 sample. This disparity also leads to a higher mercury injection saturation in the KF-4 sample.
3.2. NMR Results
In this research, the NMR porosity of each sample was determined through calibration with standard samples of diverse porosities. Subsequently, the amplitude of the T2 spectrum acquired from NMR measurements was transformed into porosity components. This transformation aimed to more comprehensively characterize the features of the NMR T2 spectrum. By doing so, it enables a more precise depiction of the porosity distribution and significantly improves the interpretation of NMR data within the framework of reservoir characterization.
As depicted in the NMR results of water-saturated samples (Figure 4), the T2 spectrum predominantly features a bimodal distribution. The majority of T2 relaxation times are less than 100 ms, and all spectral peaks are positioned below 10 ms, indicating relatively short relaxation durations. The relaxation times of large pores are primarily concentrated within the 1–10 ms range, with fluctuations in the spectral peak amplitudes closely correlated with variations in physical properties. The relaxation times of small pores mostly hover around 0.1 ms, exhibiting minimal variability.
Figure 4.
The NMR T2 spectrum of the pore components of the water-saturated samples. The T2 spectra of all samples show a pore distribution in a bimodal shape, with a relatively large proportion distributed in the short relaxation range, which is in line with the characteristics of dense cores. There are significant differences in the spectral peaks of macro and mesopores, and the relaxation time of the spectral peaks of micropores is around 0.1 ms.
As the porosity of the samples decreases, the T2 amplitude representing large pores gradually diminishes, or the spectral peak shifts to the left. For example, the KF-4 sample, boasting the highest porosity, presents the highest spectral peak amplitude for large pores, attributable to its superior physical properties and the presence of fractures. The 7B sample, with a slightly lower porosity, displays the most pronounced rightward shift in the large-pore peak, suggesting relatively larger pore sizes. In contrast to the 7B sample, the 43 sample shows a leftward shift in the main peak, indicating smaller large pores and a corresponding deterioration in physical properties. The 1284 sample, characterized by the poorest physical properties, demonstrates a transition of the main peak from large pores to small pores.
3.3. Transformation Results of Pore-Throat Distribution by NMR
In this research, an empirical formula-based segmented fitting method was utilized to transform the NMR T2 spectrum into a pore-throat distribution curve. As shown in Figure 5, by segmenting the data and applying the empirical formula, an extremely accurate fit was achieved, with the coefficient of determination R2 values consistently surpassing 0.99.
Figure 5.
Results of transformation by the empirical formula method. (a) Fitting effect of the empirical formula method for sample KF-4. (b) Pore-throat distribution obtained by the empirical formula method for sample KF-4. (c) Fitting effect of the empirical formula method for sample 7B. (d) Pore-throat distribution obtained by the empirical formula method for sample 7B. (e) Fitting effect of the empirical formula method for sample 43. (f) Pore-throat distribution obtained by the empirical formula method for sample 43. (g) Fitting effect of the empirical formula method for sample 1284. (h) Pore-throat distribution obtained by the empirical formula method for sample 1284.
From the transformed NMR pore-throat distribution curves, it is clear that the pore size distribution displays a bimodal pattern, analogous to the T2 spectrum. The majority of the main peaks are centered around 0.01 μm. The 7B sample, in line with the characteristics of its T2 spectrum, features a relatively right-shifted main peak, with a range between 0.01 μm and 0.1 μm. As the physical properties deteriorate, the peak of the pore-throat distribution decreases in height, shifts to the left, or experiences a transition of the main peak. The KF-4 sample, which has the optimal physical properties, presents the highest main peak, while the 1284 sample, characterized by the poorest physical properties, has the same main peak position but exhibits more developed large pores, leading to an overall lower porosity. The 7B sample demonstrates a relatively broader pore size distribution and a wider T2 spectrum.
3.4. GMM Full-Scale Characterization Results
Based on the GMM-based full-scale characterization procedure proposed in Section 2.4, the processing of high-pressure mercury intrusion and NMR data resulted in fitting correlation coefficients all surpassing 0.9 (Table 2). The final full-scale characterization results are depicted in Figure 6.
Table 2.
Fitting effect of GMM.
Figure 6.
Results of pore-throat clusters by GMM. (a) Pore-throat clusters of sample KF-4. (b) Pore-throat clusters of sample 7B. (c) Pore-throat clusters of sample 43. (d) Pore-throat clusters of sample 1284.
It can be discerned that the pore-throat distribution of the 1284 sample is relatively narrow, spanning from 0.003 to 0.3 μm. However, the distribution has a wide spread and exhibits a tri-modal pattern. There are four typical pore-throat clusters, predominantly distributed around 0.01 μm, 0.015 μm, 0.03 μm, and 0.09 μm. The 7B sample exhibits a broader pore-throat distribution, ranging from 0.0001 to 4 μm, presenting a bi-modal pattern. It possesses three typical pore-throat clusters, mainly distributed around 0.001 μm and within the range of 0.01–0.1 μm. The main peak is formed within the latter range, with a secondary peak at 0.001 μm. The pore-throat distribution of the KF-4 sample ranges from 0.0005 to 0.2 μm, with a concentration around 0.007 μm, also showcasing a bi-modal pattern. It has four typical pore-throat clusters, with dominant spectral peaks around 0.007 μm and 0.01 μm, which constitute the main peak morphology. Meanwhile, the clusters around 0.003 μm and 0.02 μm contribute to the leftward and rightward spread of the distribution. The 43 sample has a distribution range similar to that of the KF-4 sample, from 0.0004 to 0.3 μm, with a concentration around 0.007 μm and a bi-modal pattern. It has three typical pore-throat clusters, with dominant spectral peaks around 0.007 μm and 0.009 μm, forming the main peak morphology. Additionally, there is a nanopore cluster around 0.0016 μm, providing supplementary nanopore information within the pore-throat distribution.
As revealed by the results in conjunction with Figure 6, the pore-throat clusters identified by NMR and high-pressure mercury intrusion exhibit remarkable similarity within the macropore and mesopore ranges. Both techniques effectively elucidate the pore-throat distribution patterns. Nevertheless, when it comes to the nanopore range, NMR-detected pore-throat clusters predominantly contribute to the pore information. The integrated pore-throat distribution, which assimilates data from both testing methodologies, enables a comprehensive and full-scale characterization of the pore-throat distribution.
4. Discussion
4.1. Data Optimization and Optimal Cluster Number Selection
The original pore-throat distribution data conform to a log-Gaussian distribution. However, the segmented fitting procedure applied during the transformation of NMR data has led to a non-uniform distribution of data points within the dataset. Notably, there is a significant clustering of data points near zero (Figure 7a). The exceedingly small intervals between data points may render the covariance matrix singular (approaching a zero matrix), thereby triggering numerical computation errors. Moreover, the aggregation of clusters in high-density regions and the inflation of covariance in sparse regions can cause the AIC and BIC values to remain persistently high. The wide range of the data may cause parameter initialization to be predominantly influenced by outliers, resulting in premature convergence to local optima and decreased fitting accuracy in high-density data regions. Without proper data optimization, the fitting performance of the GMM will be negatively impacted.
Figure 7.
Mapping effect of the NMR data of sample 1284. (a) Distribution of the original data. (b) Distribution of the optimized data.
To tackle this issue, in this study, the pore-throat distribution data were first transformed into a Gaussian distribution by taking the logarithm and then uniformly mapped to a predefined interval (1–100). Subsequently, the mapped data were utilized for GMM fitting (Figure 7b). This method ensured that the data distribution adhered to a Gaussian pattern, effectively alleviating the detrimental impacts of uneven and excessively wide data distributions on the GMM outcomes.
Following data processing, the K-means model was employed to initialize the parameters, thereby circumventing the influence of outliers and reducing the number of iterative computations. The AIC and BIC values for the NMR and HPMI data of each sample were calculated for various cluster numbers using specific formulas. For the pore-throat data of each sample, we calculated the AIC and BIC values corresponding to the cluster number from 1 to 9, and identified the elbow point of the AIC/BIC value curve (the point where the value decreases rapidly and then tends to be stable) as the quantitative basis for determining the optimal cluster number. For example, the NMR data of sample 1284 showed that the AIC/BIC values decreased sharply from 87,400 to the minimum when the cluster number increased from 1 to 2, and there was no significant decrease in the values with the further increase in the cluster number, thus the optimal cluster number of 2 was determined for the NMR data of this sample (Figure 8). The optimal number of clusters, which strikes a balance between fitting accuracy and computational complexity, was determined by identifying the elbow point of the descending curve. This approach established a robust foundation for the subsequent GMM fitting process.
Figure 8.
Selection of the optimal number of clusters for sample 1284. (a) AIC/BIC values of NMR. (b) AIC/BIC values of HPMI. The optimal number of pore-throat clusters for sample 1284 are 2 for NMR and 4 for HPMI, respectively.
Through the above data preprocessing and optimization strategies, the uniqueness of the model parameters is guaranteed. Sensitivity analysis conducted over 100 random initializations shows that the absolute coefficients of variation for the pore-throat cluster parameters (mean, variance, and weight) remain below 0.1, demonstrating the low sensitivity and high stability of the proposed model. The excessive influence of initial values and random factors on the modeling results is effectively avoided.
4.2. Comparison of HPMI and NMR Pore-Throat Cluster
This study utilized NMR and HPMI data as data sources to implement a full-scale characterization method of pore-throat structure based on GMM multi-source data fusion. Taking sample 7B as an example, the fitting results of NMR and HPMI data are shown in Figure 9. It is evident that the GMM effectively fitted both the NMR and HPMI data and provided representative pore-throat clusters for both datasets.
Figure 9.
GMM fitting of different data from sample 7B. (a) GMM fitting results of NMR data. (b) Comparison between NMR data and GMM results (R2 = 0.9907). (c) GMM fitting results of HPMI data. (d) Comparison between HPMI data and GMM results (R2 = 0.9802).
The NMR data revealed two pore-throat clusters, with spectral peaks located approximately at 0.001 μm and 0.03 μm. In contrast, the HPMI data identified three pore-throat clusters, with spectral peaks at approximately 0.02 μm, 0.035 μm, and 0.08 μm. It is evident from the pore-throat clusters that the main distributions characterized by the two testing techniques are quite similar, both centered around 0.03 μm. The primary distinction lies in the fact that NMR technology captured more information on nanopore clusters smaller than 10 nm, while HPMI data predominantly provided insights into medium and large pores. This difference aligns well with the effective characterization range observed in our research.
4.3. Typical Cluster Selection
Drawing upon previous studies that have summarized the effective ranges of HPMI and NMR data, the HPMI technique is relatively mature. Nevertheless, its effective characterization scope is rather limited. The progressively increasing pressure during the testing process can cause damage to the pore-throat structures, rendering it inappropriate for characterizing pores smaller than 3 nm [4,22]. The NMR technology boasts a broad characterization range and is especially effective in characterizing small pores. However, the accuracy of its outcomes is affected by experimental conditions and sample characteristics, thus necessitating its application in combination with other methods. Considering that the influence of environmental and sample factors on the experimental results is relatively consistent, and the pore-throat distribution scale measured by NMR is comprehensive, it realistically restores the proportions of various pore-throat components throughout the entire spectrum of the pore-throat distribution. On the other hand, the HPMI data more accurately characterizes the pore-throat distribution components within the larger pore range [15,23,24].
Taking into account the substantial disparities in core fracture pressures among various lithologies, the pore-throat thresholds corresponding to the breakdown pressures of different lithologies in HPMI experiments also exhibit significant variations. To retain more authentic pore-throat cluster information and achieve a comprehensive characterization of the pore-throat distribution across the entire spectrum, this study recommends taking into consideration the capillary pressure associated with the breakdown pressure of each lithology. The lower limit of the pore-throat characterization range in HPMI can be computed using the Washburn equation, which will function as the pore-throat threshold for the classification of pore-throat clusters.
Previous research has shown that the average breakdown pressure of limestone is 76 MPa, corresponding to a pore-throat threshold of 9.68 nm [60]. The breakdown pressure of dolomite is 33.75 MPa, corresponding to a pore-throat threshold of 21.99 nm [61]. Production data from algal limestone reservoirs in the same region as the study cores reveal that the breakdown pressure of algal limestone in this area is 62.18 MPa, corresponding to a pore-throat threshold of 11.93 nm [62].
Taking the pore-throat thresholds of cores with different lithologies as the selection criteria (Table 3), and using pore-throat clusters as data units, pore-throat clusters with spectral peak relaxation times below the threshold are assigned to NMR clusters, while those with spectral peak relaxation times above the threshold are assigned to HPMI clusters (Figure 10). Based on the selected weights of NMR clusters, the weights of typical pore-throat clusters for medium and large pores are adjusted proportionally. By integrating the typical pore-throat clusters obtained from both methods, a full-scale characterization is achieved through the application of a Gaussian mixture function. The weight correction formulas are presented as follows (24) and (25):
Table 3.
Average breakdown pressure of different lithologies.
Figure 10.
Schematic diagram of the classification of pore-throat clusters of sample 7B. (a) Classification of pore-throat clusters of NMR data (with the pore-throat threshold being 21.99 nm). (b) Classification of pore-throat clusters of high-pressure mercury intrusion data (with the pore-throat threshold being 21.99 nm).
In this scenario, Sf represents the scaling factor, wsi denotes the weight of the i-th typical small-pore pore-throat cluster derived from NMR, wli is the original weight of the i-th typical medium-to-large-pore pore-throat cluster, and wcori is the corrected weight of the i-th typical medium-to-large-pore pore-throat cluster.
In this formula, refers to the cumulative weight of all NMR pore-throat clusters with sizes below the pore-throat threshold, and refers to the cumulative weight of all HPMI pore-throat clusters with sizes above the pore-throat threshold. Sf is defined as the ratio of the total weight of all NMR pore-throat clusters above the pore-throat threshold to that of all HPMI pore-throat clusters above the pore-throat threshold.
Accordingly, multiplying Sf by wli enables the calibration of the weights of all HPMI pore-throat clusters above the pore-throat threshold, making them consistent with the weight proportions of NMR-derived pore-throat clusters.
The full-scale characterization results of sample 7B using the GMM are presented in Figure 11. These results illustrate a successful integration of the pore-throat distributions derived from NMR and HPMI, effectively merging the pore-throat information obtained from both techniques. The pre-transformation Gaussian mixture function can be formulated as Equation (26):
Figure 11.
Comparison diagram of the full-scale characterization results of sample 7B by GMM and the test results. The green curve represents the pore-throat distribution curve obtained by the HPMI technique. The blue curve is the pore-throat distribution curve obtained by combining the test results of the NMR technique with the HPMI data and performing segmented fitting transformation using the empirical formula method. The red curve is the full-scale pore-throat characterization curve obtained by the GMM-based multi-source data fusion method for full-scale characterization of pore-throat structures, which integrates the data from the above two testing techniques.
The parameters of mean, variance, and weight are tabulated in Table 4. Leveraging these parameter characteristics, the full-scale characterization results for each core sample were successively computed by applying the Gaussian mixture function, as depicted in Figure 6.
Table 4.
Parameters of a typical cluster.
4.4. Fractal Dimension Analysis of Pore-Throat Clusters
Fractal dimension can be physically plausibly interpreted as a comprehensive quantitative indicator that reflects the core physical properties of pore-throat systems at the pore scale, including surface roughness, tortuosity, and connectivity. Fractal dimension analysis of pore-throat clusters is grounded in the statistical self-similarity of fractal geometry and the geological independence of GMM-identified pore-throat clusters, supported by three core theoretical principles: (1) The pore-throat system in tight reservoirs constitutes a statistical fractal object, and the cumulative pore volume and pore-throat radius follow a power-law scaling relationship (Equation (21)), which serves as the fundamental theoretical premise for fractal dimension analysis [25,26]. (2) Pore-throat clusters identified by GMM correspond to distinct geological origins and seepage characteristics, and each cluster represents a geologically independent fractal subsystem with complete statistical self-similarity. Therefore, the fractal calculation method applicable to the overall pore-throat structure is also valid for individual pore-throat clusters [63]. (3) Lithology-dependent pore-throat threshold partitioning (Table 3) ensures the physical rationality of cluster division, and the GMM algorithm guarantees the statistical integrity of each cluster, such that the cumulative volume of a single cluster independently satisfies the fractal power-law relationship [54,55,56].
Based on the above theoretical foundation, this study adopts GMM-identified pore-throat clusters as independent analytical units. The fractal dimensions of small pores (D2) and large pores (D1) for each cluster are obtained by fitting the linear relationship of lgV-lg(1/r), thereby enabling the quantitative characterization of the structural complexity and heterogeneity of different pore-throat clusters.
For all GMM-identified pore-throat clusters (Figure 12, Table 5), the lgV-lg(1/r) fractal plots display two distinct linear scaling regions, separated by a well-defined, cluster-specific scaling transition (inflection point). Notably, the morphology and inflection points of the lgV-lg(1/r) plot are consistent with those reported in previous studies on pore-throat distribution [25]. Importantly, such scaling transitions are consistently reproducible across all pore-throat clusters and samples (KF-4, 7B, 43, 1284), demonstrating that the dual fractal scaling regime represents an intrinsic feature of the pore-throat system in tight mixed-lithology reservoirs. The pore-throats within each cluster are therefore classified into large pore-throats and small pore-throats for independent analysis. The final fitting results were found to be satisfactory. In each pore-throat cluster system, the fractal dimension of small pores D2 ranged from 2 to 3, specifically between 2.0101 and 2.3908, with an average value of 2.1364. In contrast, the fractal dimension of large pores D1 exceeded 3, spanning from 3.1662 to 5.8411, with an average value of 4.5122 (Table 5). It can thus be concluded that within a single pore-throat cluster system, the fractal dimension of small pores is relatively stable with weak heterogeneity, and the heterogeneity is mainly concentrated in the large pores of the cluster. Small pores exhibit low surface roughness and tortuosity with relatively good connectivity, whereas large pores show the opposite characteristics.
Figure 12.
Pore-throat radius vs. cumulative volume for 43 samples. (a) Pore-throat radius vs. cumulative volume for Cluster 1; (b) Pore-throat radius vs. cumulative volume for Cluster 2; (c) Pore-throat radius vs. cumulative volume for Cluster 3.
Table 5.
Parameter of fractal dimensions for pore-throat clusters.
According to the literature review, some scholars have proposed that the fractal dimension of large pore-throat systems is generally greater than 3. This is because the radii of pores and throats in large pore-throat systems differ significantly, and the absence of fractal characteristics is the result of the oversimplification of “ink-bottle-shaped” pore throats [26,28]. The “skin effect” at the initial stage of the mercury intrusion experiment and high operating pressure can also lead to fractal dimensions of large pores greater than 3. Previous studies have also indicated that the fractal dimensions of pore-throat structures in some coals are greater than 3, and it is considered that under the same test conditions, fractal dimensions greater than 3 are valid indicators for characterizing the physical properties of reservoirs [25,27]. On the other hand, diagenesis plays an important role in the fractal properties exhibited by reservoir rocks. Compaction increases the contact between particles and reduces pore size, while carbonate cementation and authigenic mineral formation modify the particle-pore system by adding substances to particle contact points and grain boundaries [26,64]. From the perspective of the results, fractal dimensions of the larger pores are rather descriptive than fractal in a mathematical sense.
4.5. Existing Problem
The GMM-based multi-source data full-scale pore-throat characterization method successfully integrates pore-throat distribution data from diverse characterization techniques. By capitalizing on the effectiveness of different characterization methods reported in previous studies, it offers a more accurate depiction of the pore-throat distribution within reservoirs. Nevertheless, the quantitative assessment of the data effectiveness of various characterization methods remains a crucial challenge in this field. If the effectiveness of different techniques across different pore size ranges can be quantitatively and rationally characterized, the weights of different pore-throat clusters can be adjusted correspondingly. This adjustment would enable a more rational integration and representation of the full-scale pore-throat distribution.
Moreover, validation methods for full-scale pore-throat characterization are yet to be developed. This study is premised on the assumption that the accuracy of previous experience and testing techniques is reliable. The validation of the GMM-based full-scale pore-throat characterization method proposed in this study relies on the consistency of internal fitting, rather than external validation. The absence of external validation represents a key limitation within the scope of the present study. If more objective parameters or methods for validating the pore-throat distribution become available, they can be used to verify the reliability of the characterization methods. Additionally, these parameters or methods can serve as constraints to inversely derive the weights of different pore-throat clusters, thereby achieving a more reasonable full-scale pore-throat distribution.
As a further extension, research efforts on the fractal dimensions of tight carbonate rocks should be strengthened in two aspects: (1) Supplementing independent morphological validation (e.g., FIB-SEM, micro-CT) to verify the fractal characteristics of pore-throat clusters. (2) Exploring fractal dimensions using alternative characterization methods to improve the reliability of fractal–microstructure relationships. The current absence of morphological validation represents a scope limitation, as it restricts fractal interpretations to physically plausible inferences rather than definitive structural conclusions.
5. Conclusions
This study conducted systematic research on the full-scale pore-throat characterization of tight reservoirs, constructed a multi-source data fusion method based on the GMM, and clarified the distribution law of pore-throat clusters, fractal characteristics, and the collaborative characterization mechanism of multiple technologies. The main conclusions are as follows:
- (1)
- A technical framework for full-scale pore-throat characterization integrating GMM-based multi-source data fusion was established, which systematically clarifies the distribution patterns of pore-throat clusters across diverse characterization techniques. This framework encompasses five sequential procedures: data optimization, optimal cluster number determination, model analysis, data fusion, and data reconstruction.
- (2)
- A pore-throat radius corresponding to the breakdown pressure of different lithologies was proposed as the cluster division threshold, realizing the accurate matching and division of labor between HPMI and NMR data: pore-throat clusters derived from HPMI are used to characterize macro-mesopore components, while those derived from NMR focus on micropore components; combined with the proportion of different pore-throats in NMR data, the weights of micropore and macro-mesopore components can be quantitatively determined. Finally, through the fusion of valid data from the two characterization technologies, the accurate characterization of full-scale pore-throat distribution is achieved.
- (3)
- Fractal dimension analysis was carried out on effective pore-throat clusters. The results show that the fractal dimension D1 of macropores ranges from 3.1662 to 5.8411 with an average value of 4.5122; the fractal dimension D2 of small pores ranges from 2.0101 to 2.3908 with an average value of 2.1364. Potential causes for the excessively high fractal dimension of macropores include: simplified processing of the calculation model, “skin effect” and excessive pressure impact during HPMI testing, and modifications to the pore-throat system caused by diagenetic processes.
- (4)
- To further improve the rationality and accuracy of full-scale pore-throat distribution characterization, future research can focus on two directions: first, quantitatively evaluate the effectiveness of other characterization technologies such as N2/CO2 adsorption and CT scanning; second, deepen the exploration and verification of full-scale pore-throat characterization methods and improve the technical system of multi-source data fusion.
Author Contributions
Methodology, C.L. and H.L.; Formal analysis, Q.T.; Investigation, H.L.; Writing—original draft, C.L. and J.Y.; writing—review and editing, C.L., J.Y. and Q.T.; funding acquisition, H.L. All authors have read and agreed to the published version of the manuscript.
Funding
This study was sponsored by CNPC Innovation Fund (2024DQ02-0115), the National Natural Science Foundation of China (42102184 and 52574038), the China National Science and Technology Major Project (2025ZD1404302), and the Chongqing Graduate Research and Innovation Project (CYS25816).
Data Availability Statement
The original contributions presented in this study are included in the article. Further inquiries can be directed to the corresponding authors.
Conflicts of Interest
The authors declare no competing interests.
References
- Yang, Y.; Xiao, W.; Zheng, L.; Lei, Q.; Qin, C.; He, Y.; Liu, S.; Li, M.; Li, Y.; Zhao, Z.; et al. Pore throat structure heterogeneity and its effect on gas-phase seepage capacity in tight sandstone reservoirs: A case study from the Triassic Yanchang Formation, Ordos Basin. Pet. Sci. 2023, 20, 2892–2907. [Google Scholar] [CrossRef] [Scilit]
- Schmitt, M.; Fernandes, C.P.; Wolf, F.G.; Bellini da Cunha Neto, J.A.; Rahner, C.P.; Santiago dos Santos, V.S. Characterization of Brazilian tight gas sandstones relating permeability and Angstrom-to micron-scale pore structures. J. Nat. Gas Sci. Eng. 2015, 27, 785–807. [Google Scholar] [CrossRef] [Scilit]
- Flewelling, S.A.; Tymchak, M.P.; Warpinski, N. Hydraulic fracture height limits and fault interactions in tight oil and gas formations. Geophys. Res. Lett. 2013, 40, 3602–3606. [Google Scholar] [CrossRef] [Scilit]
- Lei, J.; Pan, B.; Guo, Y.; Fan, Y.; Xue, L.; Deng, S.; Zhang, L.; Ruhan, A. A comprehensive analysis of the pyrolysis effects on oil shale pore structures at multiscale using different measurement methods. Energy 2021, 227, 120359. [Google Scholar] [CrossRef] [Scilit]
- Li, P.; Zheng, M.; Bi, H.; Wu, S.; Wang, X. Pore throat structure and fractal characteristics of tight oil sandstone: A case study in the Ordos Basin, China. J. Pet. Sci. Eng. 2017, 149, 665–674. [Google Scholar] [CrossRef] [Scilit]
- Zhu, R.; Wu, S.; Su, L.; Cui, J.; Mao, Z.; Zhang, X. Problems and future works of porous texture characterization of tight reservoirs in China. Acta Pet. Sin. 2016, 37, 1323–1336. [Google Scholar]
- Su, Y.; Lai, J.; Dang, W.; Bie, K.; Zhao, Y.; Zhao, X.; Li, D.; Zhao, F.; Wang, G. Pore structure characterization and reservoir quality prediction in deep and ultra-deep tight sandstones by integrating image and NMR logs. J. Asian Earth Sci. 2024, 272, 106232. [Google Scholar] [CrossRef] [Scilit]
- Zhang, F.; Jiang, Z.; Sun, W.; Li, Y.; Zhang, X.; Zhu, L.; Wen, M. A multiscale comprehensive study on pore structure of tight sandstone reservoir realized by nuclear magnetic resonance, high pressure mercury injection and constant-rate mercury injection penetration test. Mar. Pet. Geol. 2019, 109, 208–222. [Google Scholar] [CrossRef] [Scilit]
- Xi, K.; Cao, Y.; Haile, B.G.; Zhu, R.; Jahren, J.; Bjørlykke, K.; Zhang, X.; Hellevang, H. How does the pore-throat size control the reservoir quality and oiliness of tight sandstones? The case of the Lower Cretaceous Quantou Formation in the southern Songliao Basin, China. Mar. Pet. Geol. 2016, 76, 1–15. [Google Scholar] [CrossRef] [Scilit]
- Lai, J.; Wang, G.; Wang, Z.; Chen, J.; Pang, X.; Wang, S.; Zhou, Z.; He, Z.; Qin, Z.; Fan, X. A review on pore structure characterization in tight sandstones. Earth-Sci. Rev. 2018, 177, 436–457. [Google Scholar] [CrossRef] [Scilit]
- Xiao, Q.; Yang, Z.; Wang, Z.; Qi, Z.; Wang, X.; Xiong, S. A full-scale characterization method and application for pore-throat radius distribution in tight oil reservoirs. J. Pet. Sci. Eng. 2020, 187, 106857. [Google Scholar] [CrossRef] [Scilit]
- Clarkson, C.R.; Freeman, M.; He, L.; Agamalian, M.; Melnichenko, Y.B.; Mastalerz, M.; Bustin, R.M.; Radliński, A.P.; Blach, T.P. Characterization of tight gas reservoir pore structure using USANS/SANS and gas adsorption analysis. Fuel 2012, 95, 371–385. [Google Scholar] [CrossRef] [Scilit]
- Sarna-Boś, K.; Skic, K.; Sobieszczański, J.; Boguta, P.; Chałas, R. Contemporary approach to the porosity of dental materials and methods of its measurement. Int. J. Mol. Sci. 2021, 22, 8903. [Google Scholar] [CrossRef] [Scilit]
- Wang, Y.; Li, J.; Feng, F.; Qu, C.; Tang, C.; Wang, Q.; Zhang, W.; Yan, X.; Lin, Z. Unveiling the role of pore characteristics in sludge dewatering: Visualization by Nano-CT and micromodel study. Water Res. 2024, 252, 121191. [Google Scholar] [CrossRef] [Scilit]
- Qian, Y.; Gao, P.; Fang, X.; Sun, F.; Cai, Y.; Zhou, Y. Microstructure characterization techniques for shale reservoirs: A review. Front. Earth Sci. 2022, 10, 930474. [Google Scholar] [CrossRef] [Scilit]
- Wei, Q.; Li, X.; Zhang, J.; Hu, B.; Zhu, W.; Liang, W.; Sun, K. Full-size pore structure characterization of deep-buried coals and its impact on methane adsorption capacity: A case study of the Shihezi Formation coals from the Panji Deep Area in Huainan Coalfield, Southern North China. J. Pet. Sci. Eng. 2019, 173, 975–989. [Google Scholar] [CrossRef] [Scilit]
- Siddiqui, S. Some Useful Guidelines for Whole Core CT-Scanning for Petrophysical Applications. E3S Web Conf. 2023, 367, 01013. [Google Scholar] [CrossRef] [Scilit]
- Ishola, O.; Vilcáez, J. Augmenting X-ray micro-CT data with MICP data for high resolution pore-scale simulations of flow properties of carbonate rocks. Geoenergy Sci. Eng. 2024, 239, 212982. [Google Scholar] [CrossRef] [Scilit]
- Shen, Z.; Meng, Z.; Liu, Y.; Lei, J.; Shen, W.; Ren, H.; Gao, T.; Zhang, K.; Wang, Y.; Tan, L. Relationship between multiscale nanopore structure and coal connectivity during coalification process. Microporous Mesoporous Mater. 2023, 360, 112717. [Google Scholar] [CrossRef] [Scilit]
- Wu, B.; Xie, R.; Wang, X.; Wang, T.; Yue, W. Characterization of pore structure of tight sandstone reservoirs based on fractal analysis of NMR echo data. J. Nat. Gas Sci. Eng. 2020, 81, 103483. [Google Scholar] [CrossRef] [Scilit]
- Wang, F.; Jiao, L.; Liu, Z.; Tan, X.; Wang, C.; Gao, J. Fractal analysis of pore structures in low permeability sandstones using mercury intrusion porosimetry. J. Porous Media 2018, 21, 1097–1119. [Google Scholar] [CrossRef] [Scilit]
- Mo, W.; Wang, M.; Chen, F.; Huang, Z.; Li, Y.; Yan, Y.; Jiang, R.; Lin, T.; Cui, J. Types and microstructures of pores in shales of the Ordovician Wulalike Formation at the western margin of the Ordos Basin, China. Energy Geosci. 2023, 4, 100155. [Google Scholar] [CrossRef] [Scilit]
- Liu, B.; Yao, S.; Hu, W.; Cao, J.; Xie, D. Application of nuclear magnetic resonance cryoporometry in unconventional reservoir rocks. Acta Pet. Sin. 2017, 38, 1401–1410. [Google Scholar]
- Yu, S.; Bo, J.; Li, M.; Hou, C.; Xu, S. A review on pore-fractures in tectonically deformed coals. Fuel 2020, 278, 118248. [Google Scholar] [CrossRef] [Scilit]
- Lai, J.; Wang, G. Fractal analysis of tight gas sandstones using high-pressure mercury intrusion techniques. J. Nat. Gas Sci. Eng. 2015, 24, 185–196. [Google Scholar] [CrossRef] [Scilit]
- Lai, J.; Wang, G.; Fan, Z.; Chen, J.; Wang, S.; Zhou, Z.; Fan, X. Insight into the pore structure of tight sandstones using NMR and HPMI measurements. Energy Fuels 2016, 30, 10200–10214. [Google Scholar] [CrossRef] [Scilit]
- Fu, W.; Hu, W.; Yi, T.; Kane, O.I.; Zhang, M.; Huang, X. Fractal dimension analysis of pores in coal reservoir and their impact on petrophysical properties: A case study in the province of Guizhou, SW China. Minerals 2022, 12, 1425. [Google Scholar] [CrossRef] [Scilit]
- Dong, X.; Meng, X.; Pu, R. Occurrence characteristics of movable fluids based on the division of pore throat system in tight gas reservoir by fractal theory. Nat. Gas Ind. 2023, 43, 78–90. [Google Scholar]
- Chi, L.; Su, H.; Zio, E.; Qadrdan, M.; Li, X.; Zhang, L.; Fan, L.; Zhou, J.; Yang, Z.; Zhang, J. Data-driven reliability assessment method of Integrated Energy Systems based on probabilistic deep learning and Gaussian mixture Model-Hidden Markov Model. Renew. Energy 2021, 174, 952–970. [Google Scholar] [CrossRef] [Scilit]
- Wang, D.; Jiao, D.Y.; Zhang, Z.H.; Zhou, R.Z.; Guo, W.Z.; Su, H. Interpretable Combinatorial Machine Learning-Based Shale Fracability Evaluation Methods. Energies 2025, 18, 186. [Google Scholar] [CrossRef] [Scilit]
- Ouyang, B.; Zhang, G.C.; Liu, W.; Qiu, S.J.; Ding, W.D.; Zhang, Z.H.; Su, H. A Method for Predicting the Gel Point of Mixed Crude Oil Based on Deep Learning. In Proceedings of the 2024 International Conference on Image Processing, Computer Vision and Machine Learning (ICICML), Shenzhen, China, 22–24 November 2024. [Google Scholar]
- Hu, J.; Yang, Z.; Su, H. Dynamic prediction of natural gas calorific value based on deep learning. Energies 2023, 16, 799. [Google Scholar] [CrossRef] [Scilit]
- Hossain, M. A simple and effective approach to investigate the dominant contaminant sources and accuracy in water quality estimation through Monte Carlo simulation, Gaussian Mixture Models (GMMs), and GIS machine learning methods. Ecol. Indic. 2025, 171, 113188. [Google Scholar] [CrossRef] [Scilit]
- Kutílek, M.; Jendele, L.; Panayiotopoulos, K.P. The influence of uniaxial compression upon pore size distribution in bi-modal soils. Soil Tillage Res. 2006, 86, 27–37. [Google Scholar] [CrossRef] [Scilit]
- Cui, J.; Cheng, L. A theoretical study of the occurrence state of shale oil based on the pore sizes of mixed Gaussian distribution. Fuel 2017, 206, 564–571. [Google Scholar] [CrossRef] [Scilit]
- Wang, L.; Zhang, Y.; Zhang, N.; Zhao, C.; Wu, W. Pore structure characterization and permeability estimation with a modified multimodal Thomeer pore size distribution function for carbonate reservoirs. J. Pet. Sci. Eng. 2020, 193, 107426. [Google Scholar] [CrossRef] [Scilit]
- Ge, X.; Xue, Z.; Zhou, J.; Hu, F.; Li, J.; Zhang, H.; Wang, S.; Niu, S.; Zhao, J. An unsupervised clustering method for nuclear magnetic resonance transverse relaxation spectrums based on the Gaussian mixture model and its application. Pet. Explor. Dev. 2022, 49, 339–348. [Google Scholar] [CrossRef] [Scilit]
- Liu, J.; Jiang, L.; Gu, C.; You, X.; Liu, Z.; Yuan, H. Characterization method of core pore structure based on truncated Gaussian and its application in shale cores. Geoenergy Sci. Eng. 2023, 227, 211853. [Google Scholar] [CrossRef] [Scilit]
- Liu, K.; Ostadhassan, M.; Zhou, J.; Gentzis, T.; Rezaee, R. Nanoscale pore structure characterization of the Bakken shale in the USA. Fuel 2017, 209, 567–578. [Google Scholar] [CrossRef] [Scilit]
- Liu, J.; Song, S.; Cao, X.; Meng, Q.; Pu, H.; Wang, Y.; Liu, J. Determination of full-scale pore size distribution of Gaomiaozi bentonite and its permeability prediction. J. Rock Mech. Geotech. Eng. 2020, 12, 403–413. [Google Scholar] [CrossRef] [Scilit]
- Mu, Q.; Meng, L.; Zhou, C. Stress-dependent water retention behaviour of two intact aeolian soils with multi-modal pore size distributions. Eng. Geol. 2023, 323, 107233. [Google Scholar] [CrossRef] [Scilit]
- Zhao, P.; Wang, L.; Xu, C.; Fu, J.; Shi, Y.; Mao, Z.; Xiao, D. Nuclear magnetic resonance surface relaxivity and its advanced application in calculating pore size distributions. Mar. Pet. Geol. 2020, 111, 66–74. [Google Scholar] [CrossRef] [Scilit]
- Zhao, D.; Wang, Y.; Wang, Q.; Wang, X. Comparative analysis of different characteristics of automatic sleep stages. Comput. Methods Programs Biomed. 2019, 175, 53–72. [Google Scholar] [CrossRef] [Scilit]
- Heil, J.; Häring, V.; Marschner, B.; Stumpe, B. Advantages of fuzzy k-means over k-means clustering in the classification of diffuse reflectance soil spectra: A case study with West African soils. Geoderma 2019, 337, 11–21. [Google Scholar] [CrossRef] [Scilit]
- Rahbar, A.; Vadiati, M.; Talkhabi, M.; Güler, C.; Kisi, O. Hard and soft clustering methods employed in groundwater research: A systematic review. J. Hydrol. 2025, 667, 134841. [Google Scholar] [CrossRef] [Scilit]
- Omran, M.; Engelbrecht, A.; Salman, A. An overview of clustering methods. Intell. Data Anal. 2007, 11, 583–605. [Google Scholar] [CrossRef] [Scilit]
- Wu, S.; Cai, Z.; Shi, S. Oil and Gas Reservoir Geology; Petroleum Industry Press: Beijing, China, 2007. [Google Scholar]
- Zhang, P.; Lu, S.; Li, J.; Chen, C.; Xue, H.; Zhang, J. Petrophysical characterization of oil-bearing shales by low-field nuclear magnetic resonance (NMR). Mar. Pet. Geol. 2018, 89, 775–785. [Google Scholar] [CrossRef] [Scilit]
- Kleinberg, R.L. Utility of NMR T2 distributions, connection with capillary pressure, clay effect, and determination of the surface relaxivity parameter ρ2. Magn. Reson. Imaging 1996, 14, 761–767. [Google Scholar] [CrossRef] [Scilit] [PubMed]
- Elsayed, M.; Isah, A.; Hiba, M.; Hassan, A.; Al-Garadi, K.; Mahmoud, M.; El-Husseiny, A.; Radwan, A.E. A review on the applications of nuclear magnetic resonance (NMR) in the oil and gas industry: Laboratory and field-scale measurements. J. Pet. Explor. Prod. Technol. 2022, 12, 2747–2784. [Google Scholar] [CrossRef] [Scilit]
- Xu, R.; Yang, S.; Xiao, Z.; Jin, Y. Quantitatively study on imbibition of fracturing fluid in tight sandstone reservoir under high temperature and high pressure based on NMR technology. J. Pet. Sci. Eng. 2022, 208, 109623. [Google Scholar] [CrossRef] [Scilit]
- Zeng, Y.; Pang, Y.; Ding, S.; Di, K.; Shen, Z.; Chen, S. Pore-fracture network alteration during forced and spontaneous imbibition processes in shale formation. J. Pet. Sci. Eng. 2022, 209, 109846. [Google Scholar] [CrossRef] [Scilit]
- Huang, H.; Li, R.; Xiong, F.; Hu, H.; Sun, W.; Jiang, Z.; Chen, L.; Wu, L. A method to probe the pore-throat structure of tight reservoirs based on low-field NMR: Insights from a cylindrical pore model. Mar. Pet. Geol. 2020, 117, 104344. [Google Scholar] [CrossRef] [Scilit]
- Bishop, C.M. Pattern Recognition and Machine Learning; Springer: New York, NY, USA, 2006; Volume 2, pp. 1122–1128. [Google Scholar]
- Qi, G.; Zhang, Y.; Li, Z.; Mo, H.; Chen, J. Detection of carotid intima and media thicknesses based on ultrasound B-mode images clustered with Gaussian mixture model. J. Biomed. Eng. 2020, 37, 1080–1088. [Google Scholar]
- Wang, Y.; Liu, H.; Song, P.; Hu, Z.; Wu, L. Short-term power forecasting method of wind farm based on Gaussian mixture model clustering. Autom. Electr. Power Syst. 2021, 45, 37–43. [Google Scholar]
- Akaike, H. A new look at the statistical model identification. IEEE Trans. Autom. Control 1974, 19, 716–723. [Google Scholar] [CrossRef] [Scilit]
- Schwarz, G. Estimating the dimension of a model. Ann. Stat. 1978, 461–464. [Google Scholar] [CrossRef] [Scilit]
- Fan, J.; Lv, J. A selective overview of variable selection in high dimensional feature space. Stat. Sin. 2010, 20, 101. [Google Scholar]
- Chen, S.; Liu, Y.; Zhang, J.; Li, P.; Tang, X.; Li, Z.; Dong, Z.; Xu, L.; Zhao, X. Formation conditions and evolution of fractures in multiple tight rocks: Implications for unconventional reservoir exploitation. J. Pet. Sci. Eng. 2021, 200, 108354. [Google Scholar] [CrossRef] [Scilit]
- Shi, X.; Ge, X.; Zhang, Y.; Kong, X.; Huang, W.; Jiang, S. Experimental study on hydraulic fracture propagation behavior on dolomite rocks with open-hole completion. J. Pet. Sci. Eng. 2022, 218, 110840. [Google Scholar] [CrossRef] [Scilit]
- Zheng, H.; Ma, X.; Lin, H.; Guo, D.; Liu, Y. Physical simulation of fracture propagation patterns in algal limestone fracturing. Oil Drill. Prod. Technol. 2023, 45, 607–615. [Google Scholar]
- Khaluf, Y.; Ferrante, E.; Simoens, P.; Huepe, C. Scale invariance in natural and artificial collective systems: A review. J. R. Soc. Interface 2017, 14, 20170662. [Google Scholar] [CrossRef] [Scilit]
- He, H.; Xie, L.; Li, X.; He, J.; Li, S.; Hou, M.; Ma, P. Characteristics and Diagenesis Analysis of Lacustrine Hybrid Rocks of the Lower Youshashan Formation, Neogene System in the Dafengshan Structural Belt, Qaidam Basin. Spec. Oil Gas Reserv. 2025, 1–13. [Google Scholar]
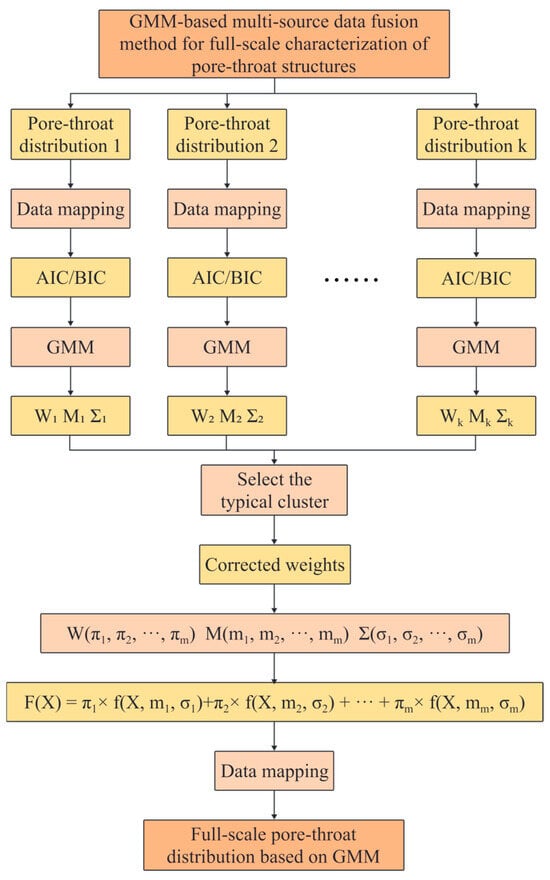
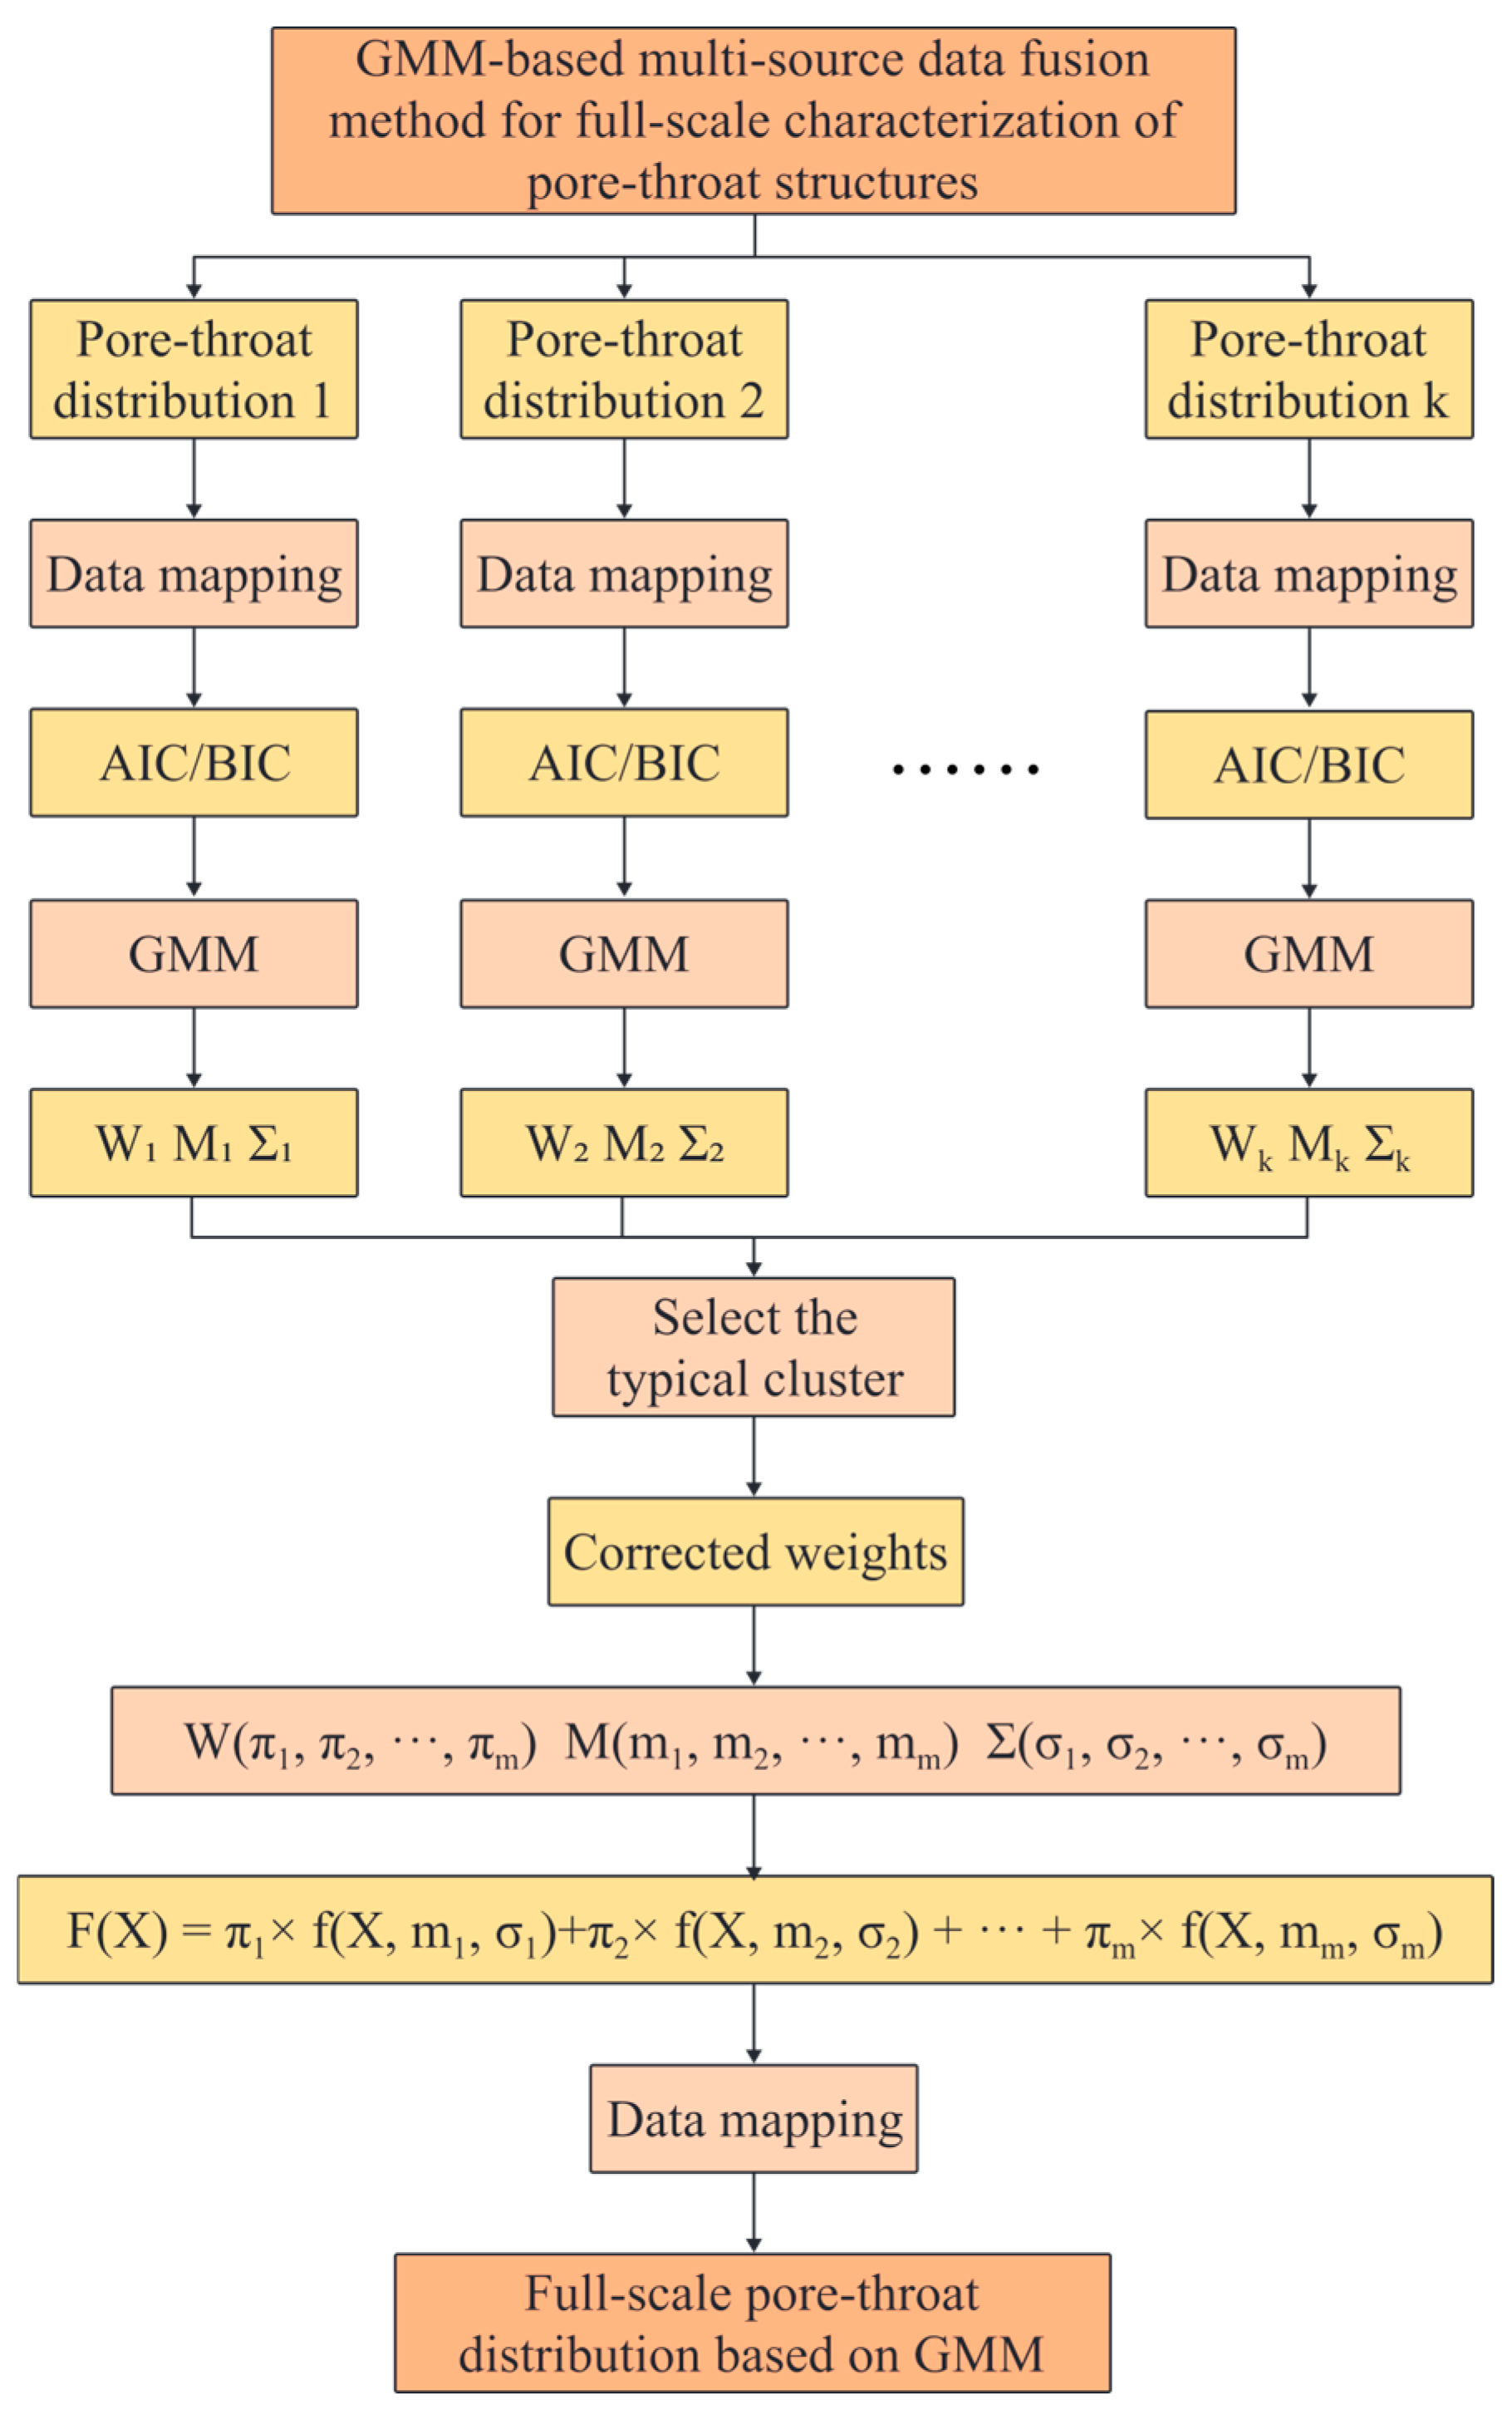
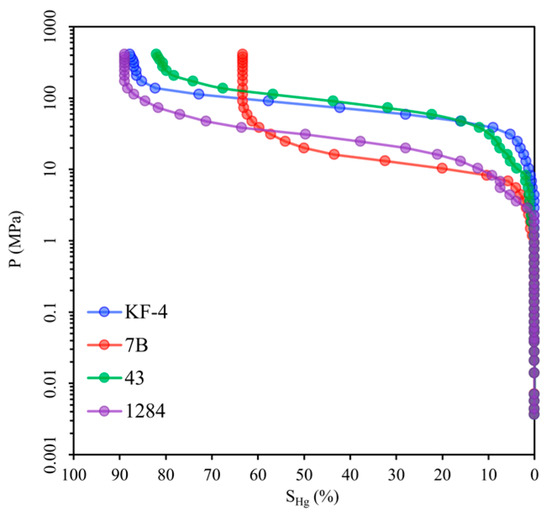
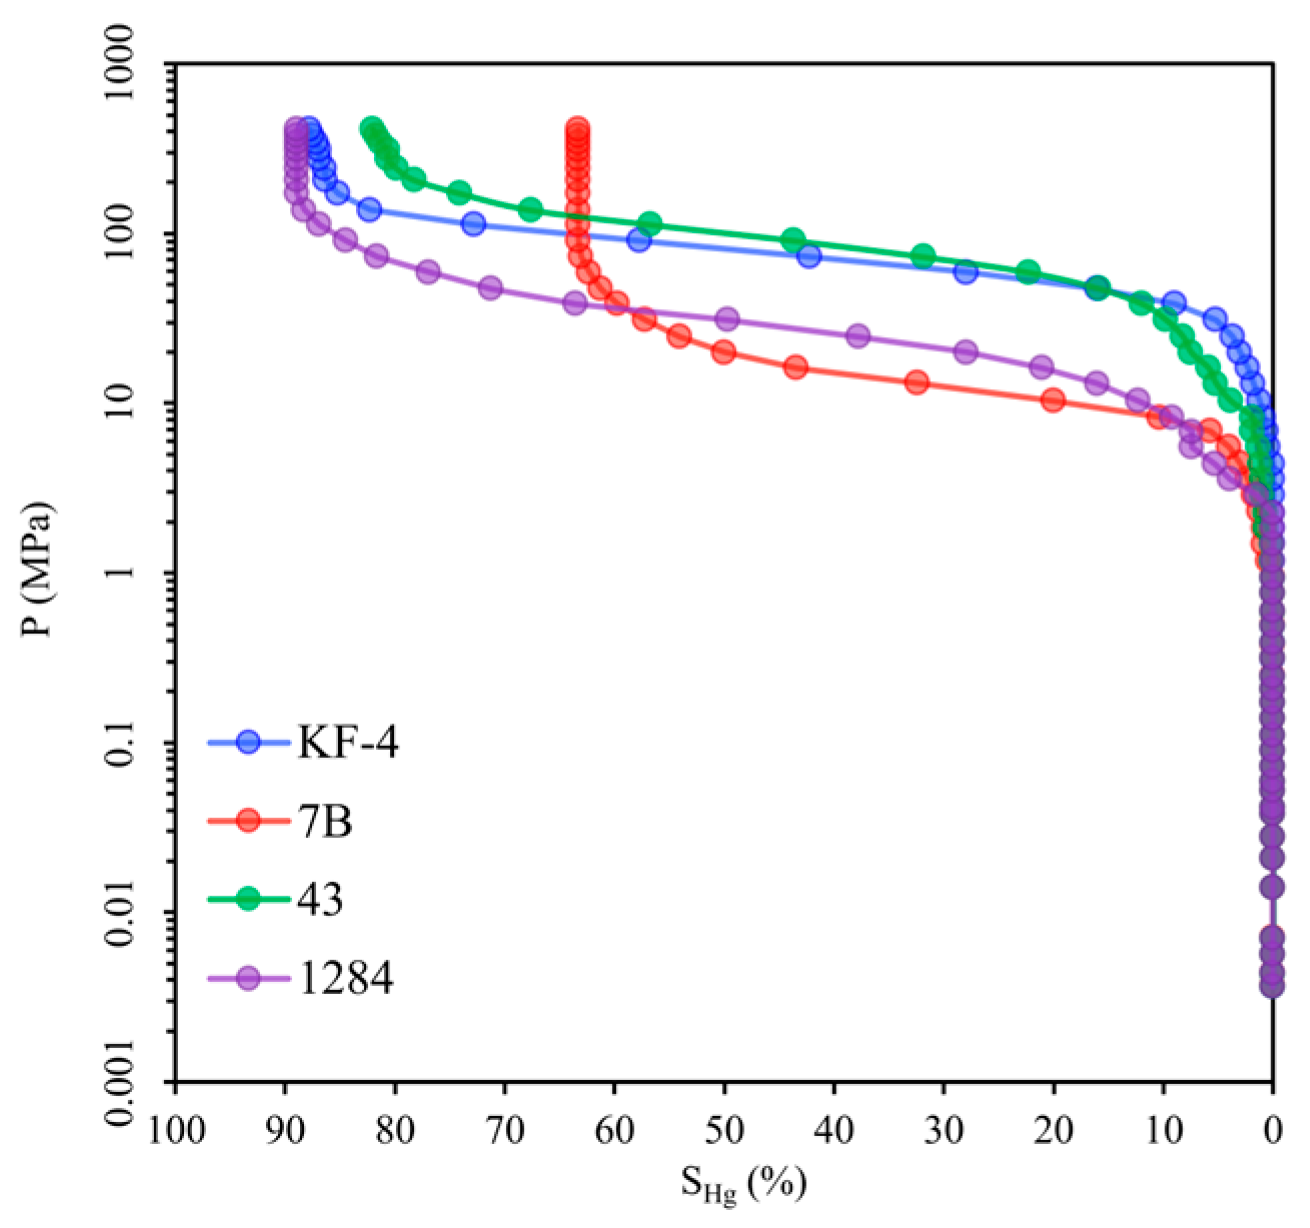
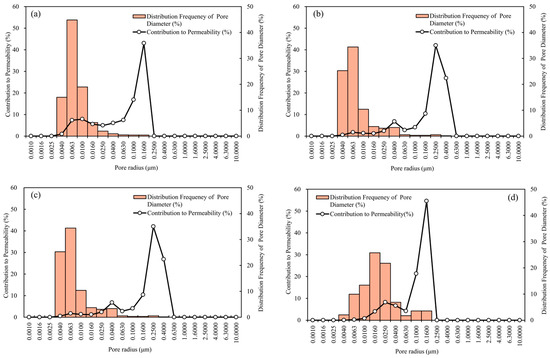
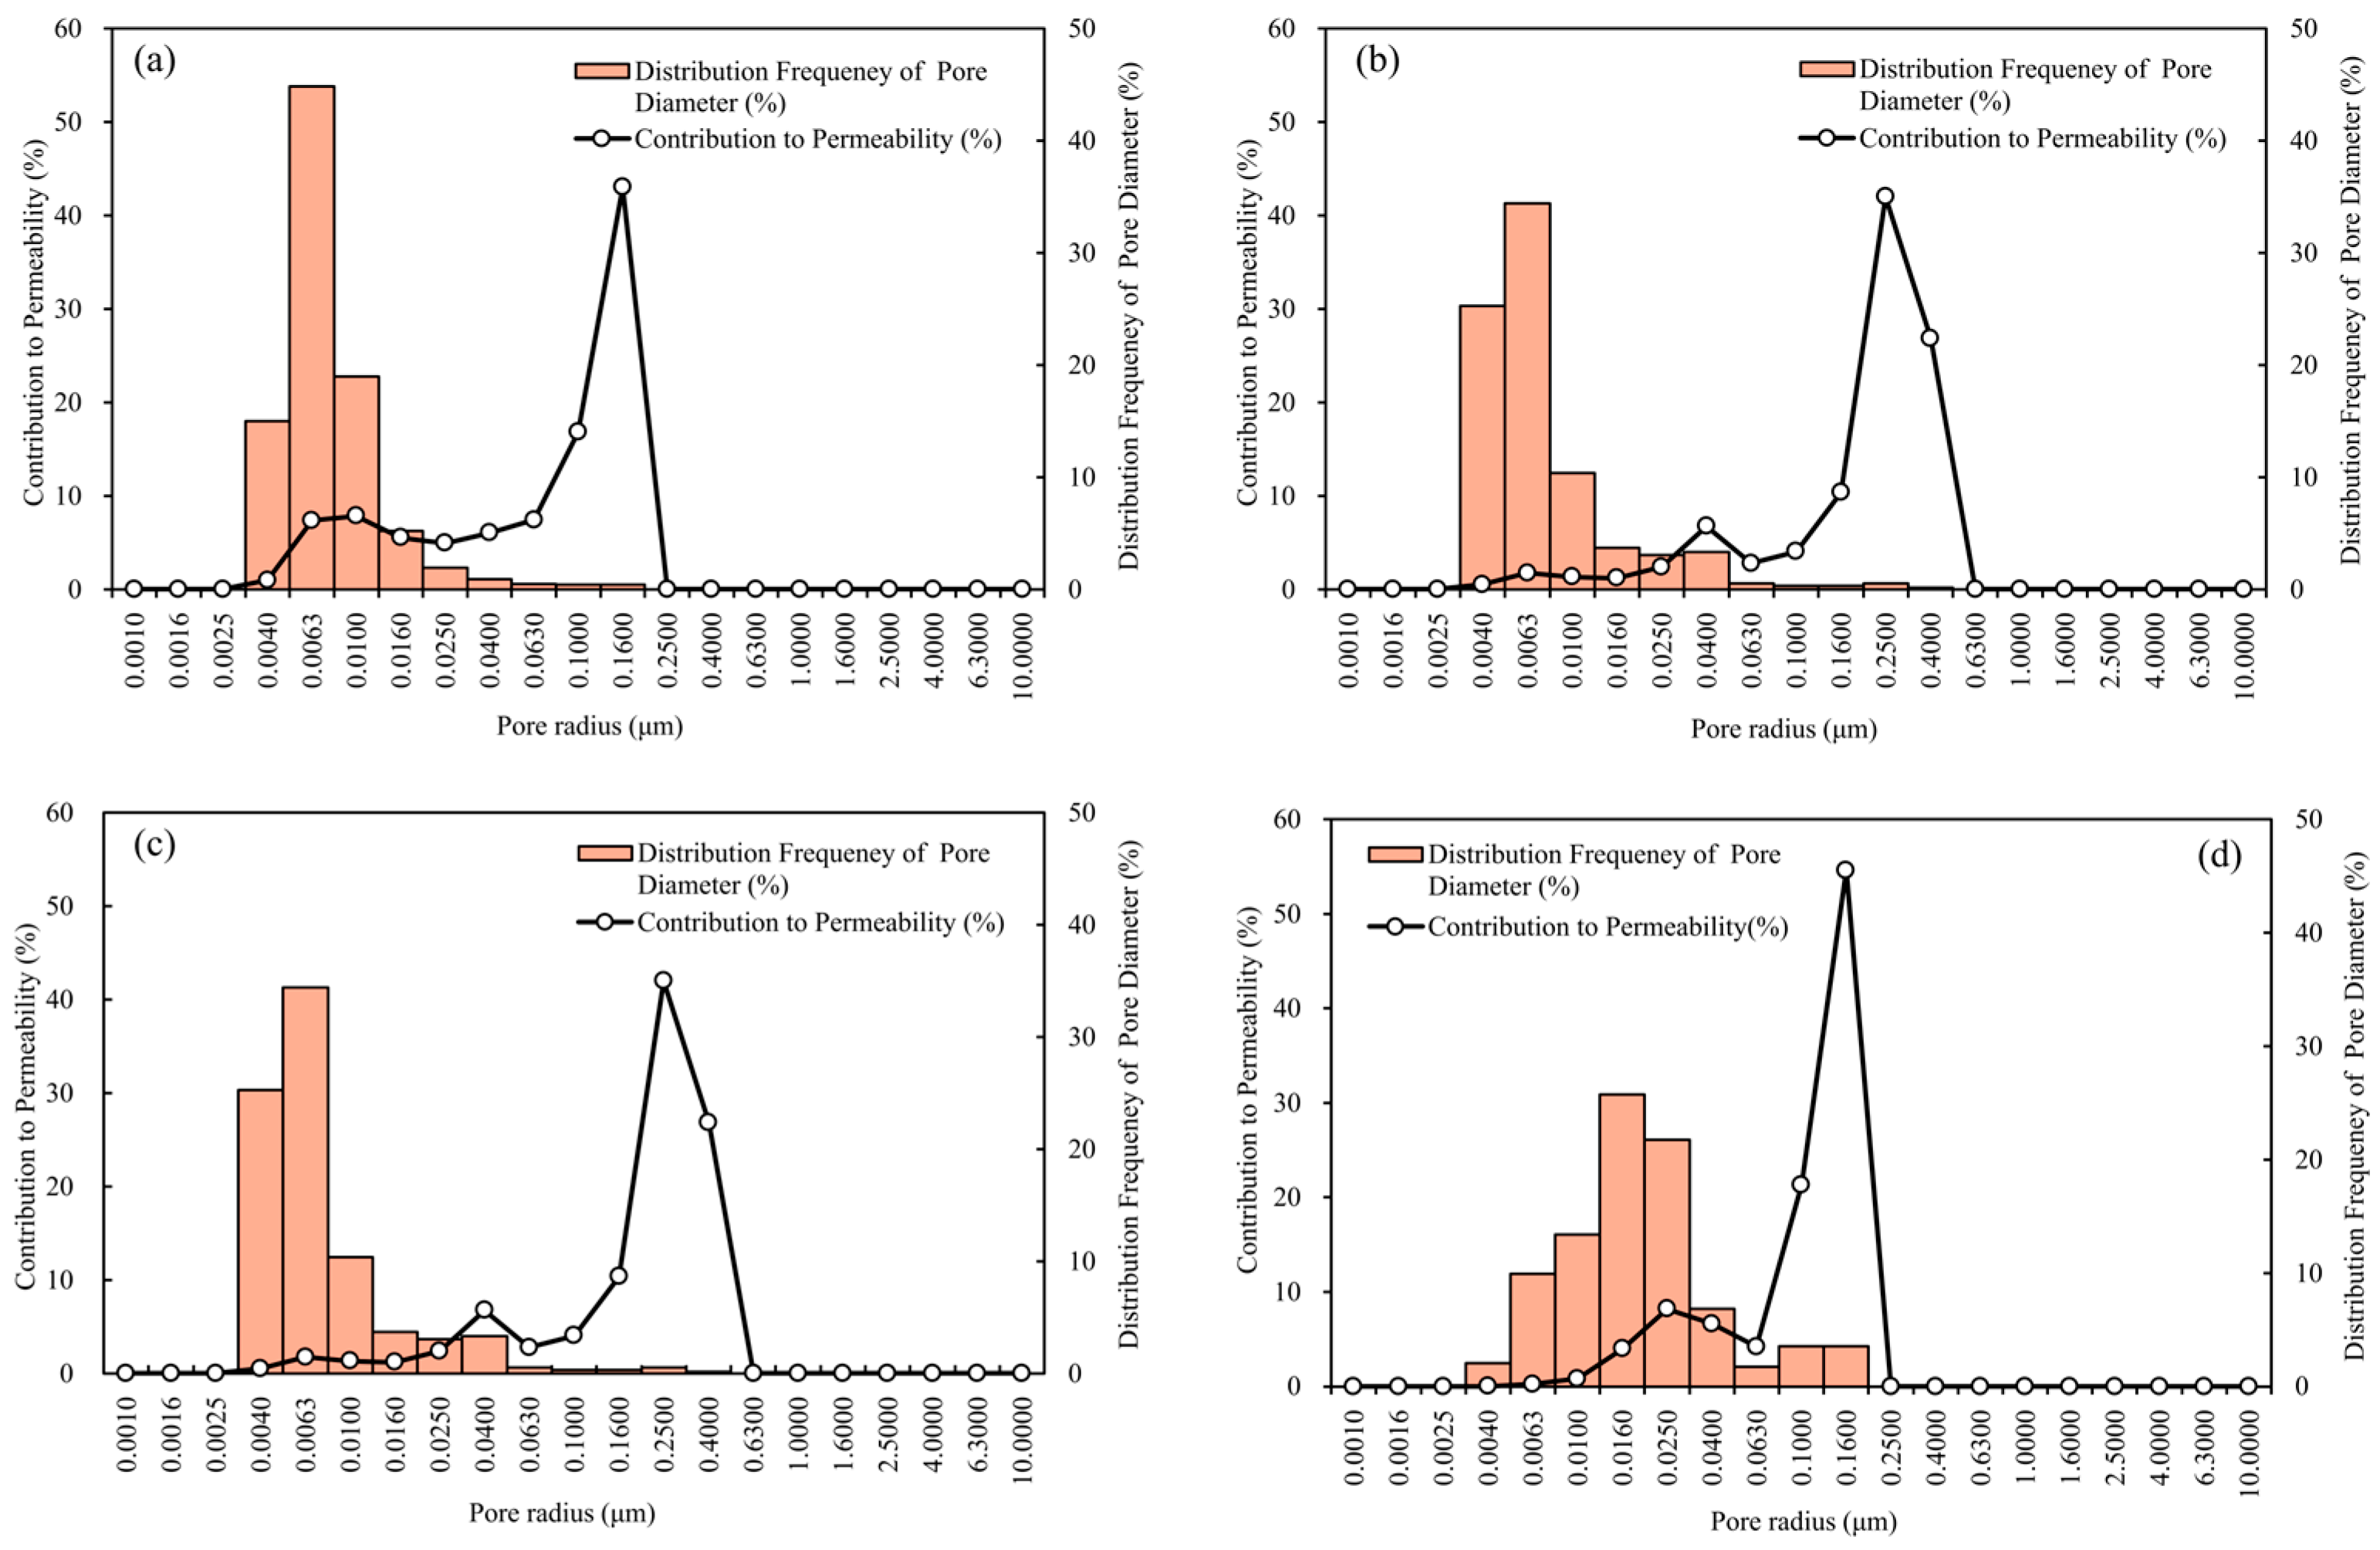
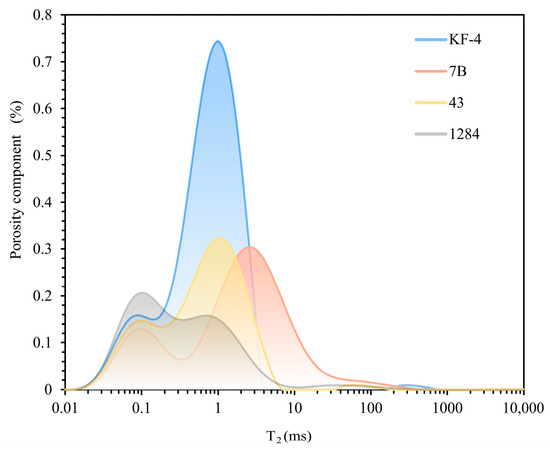
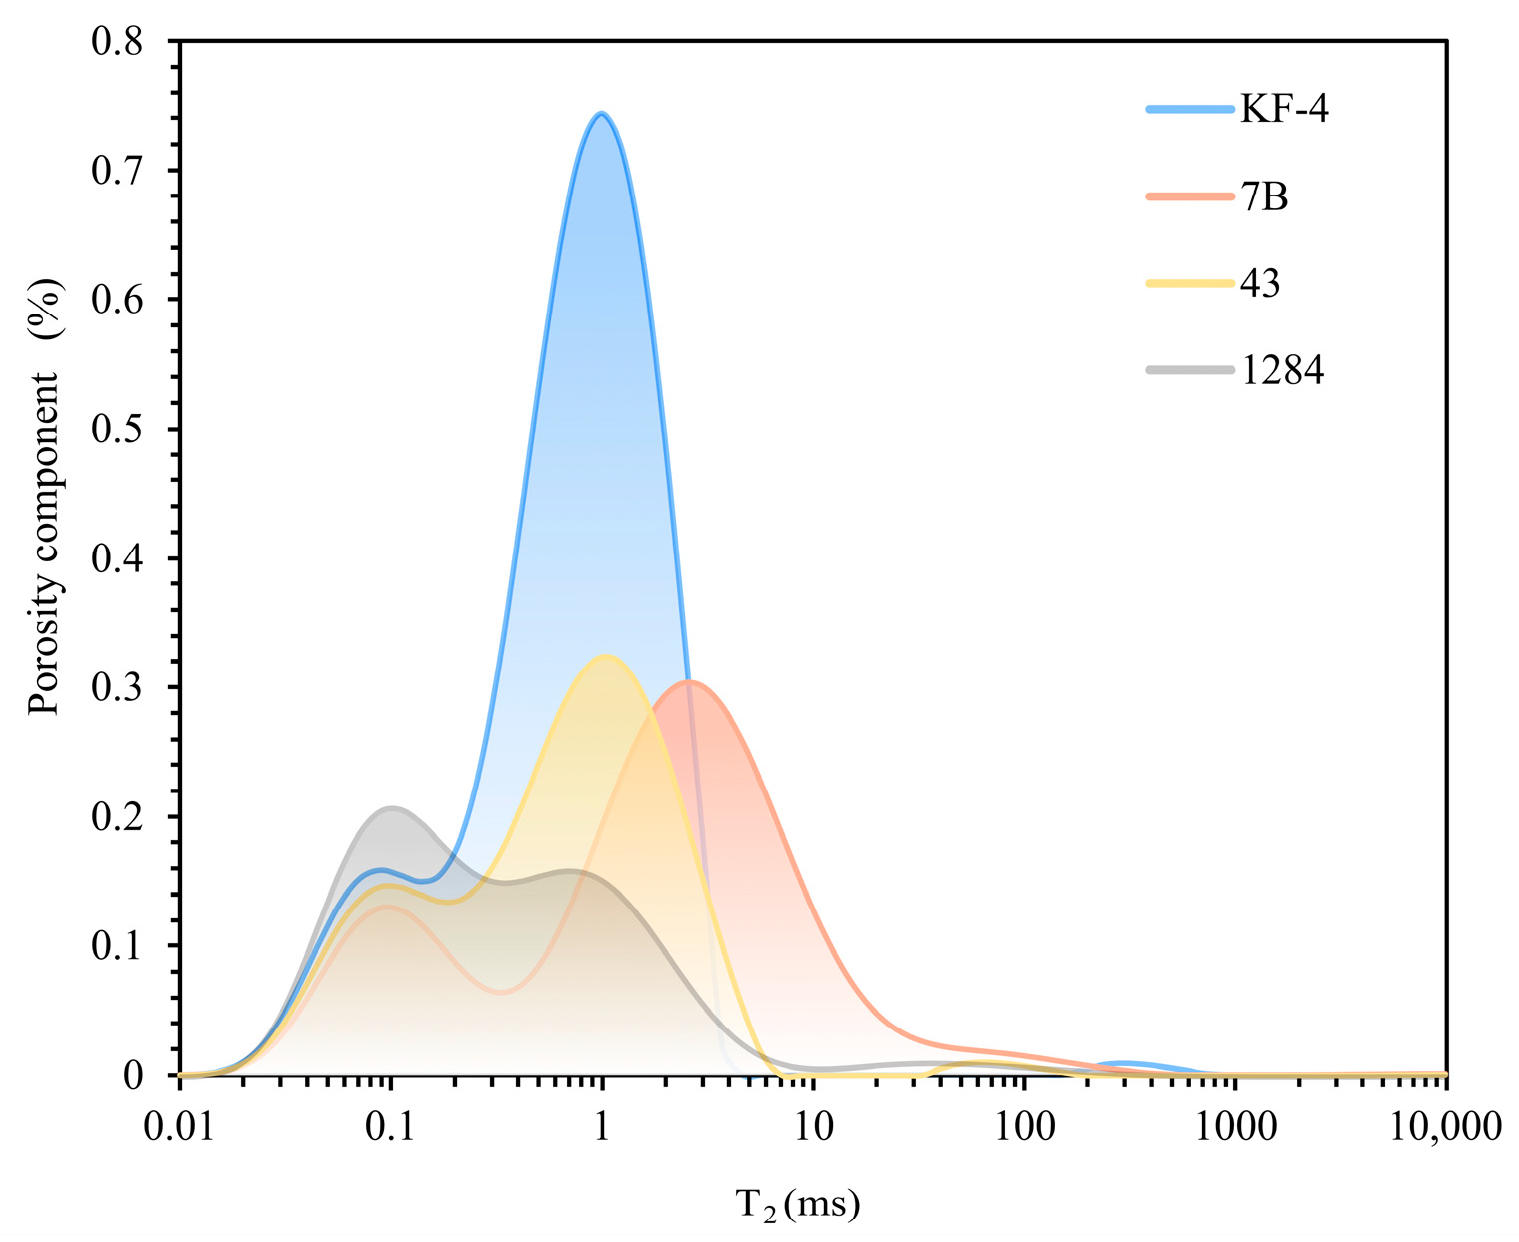
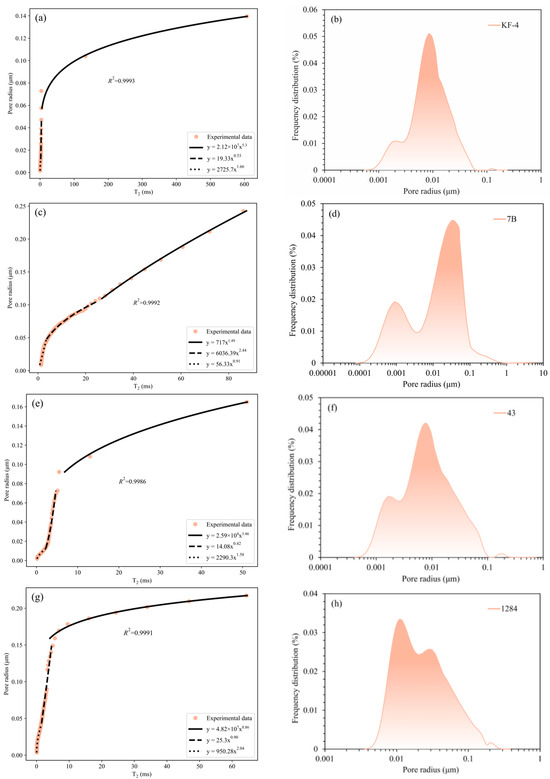
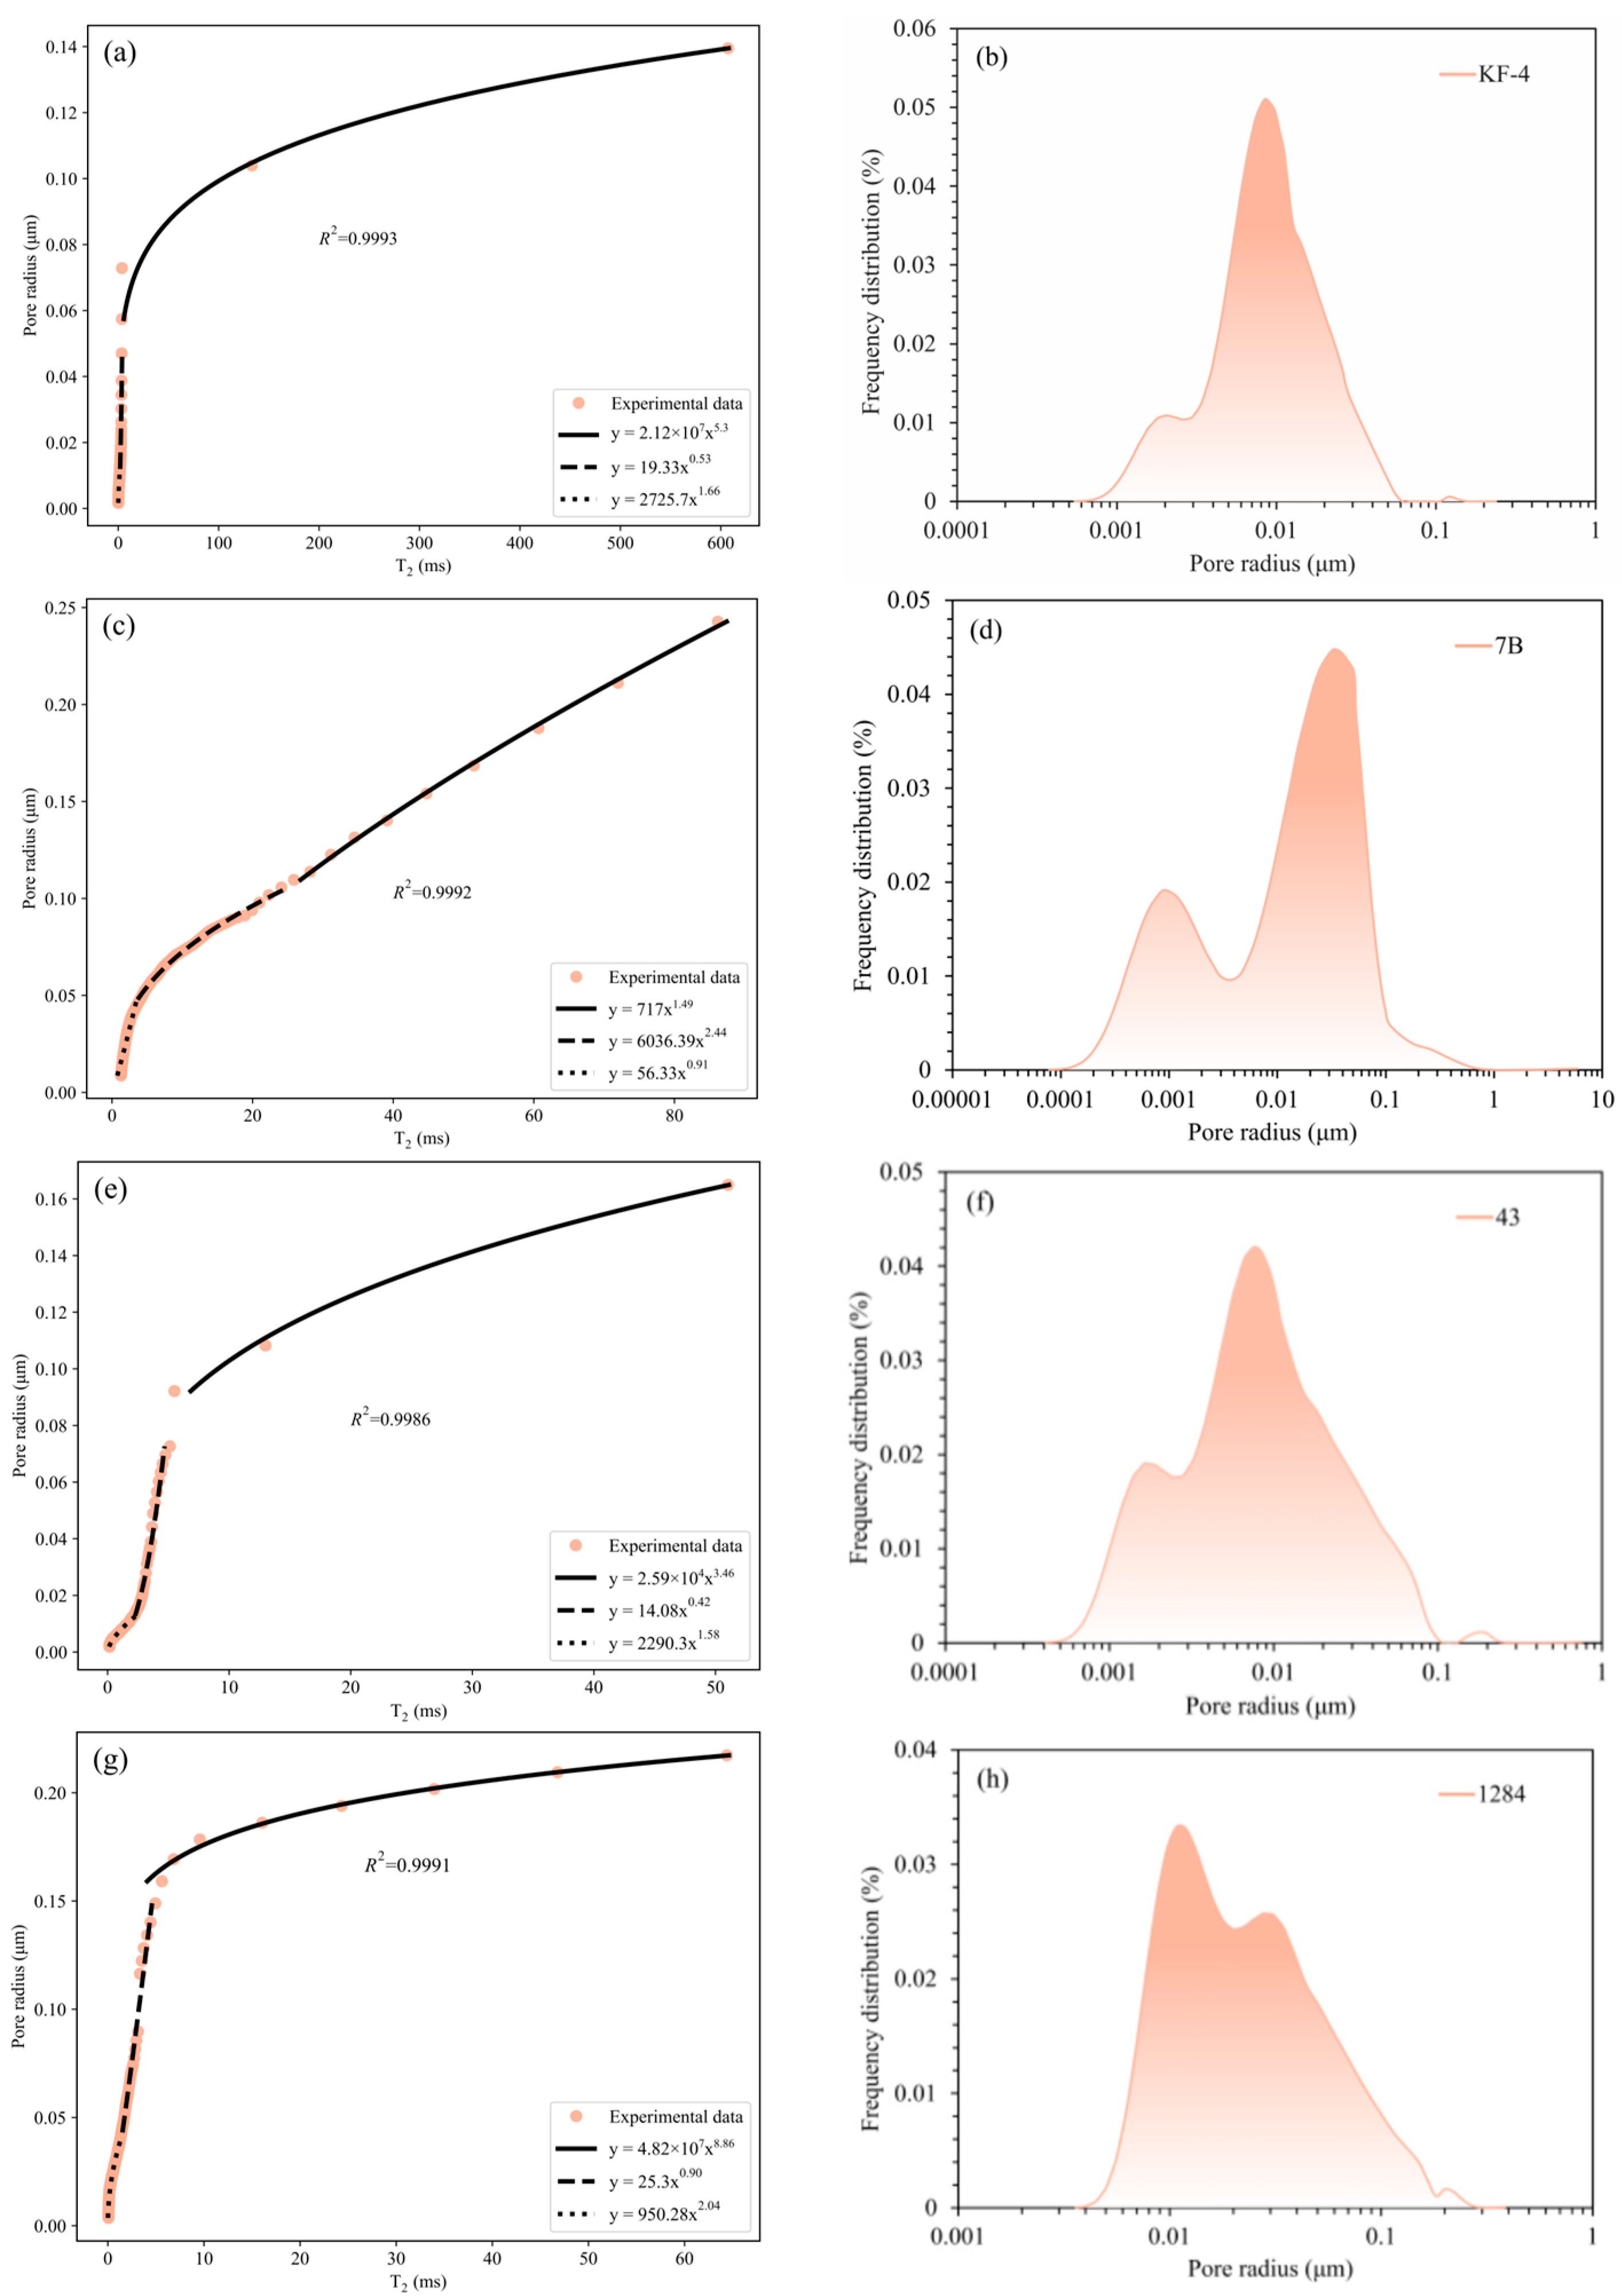
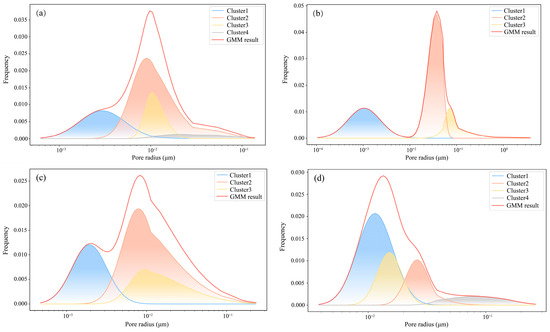
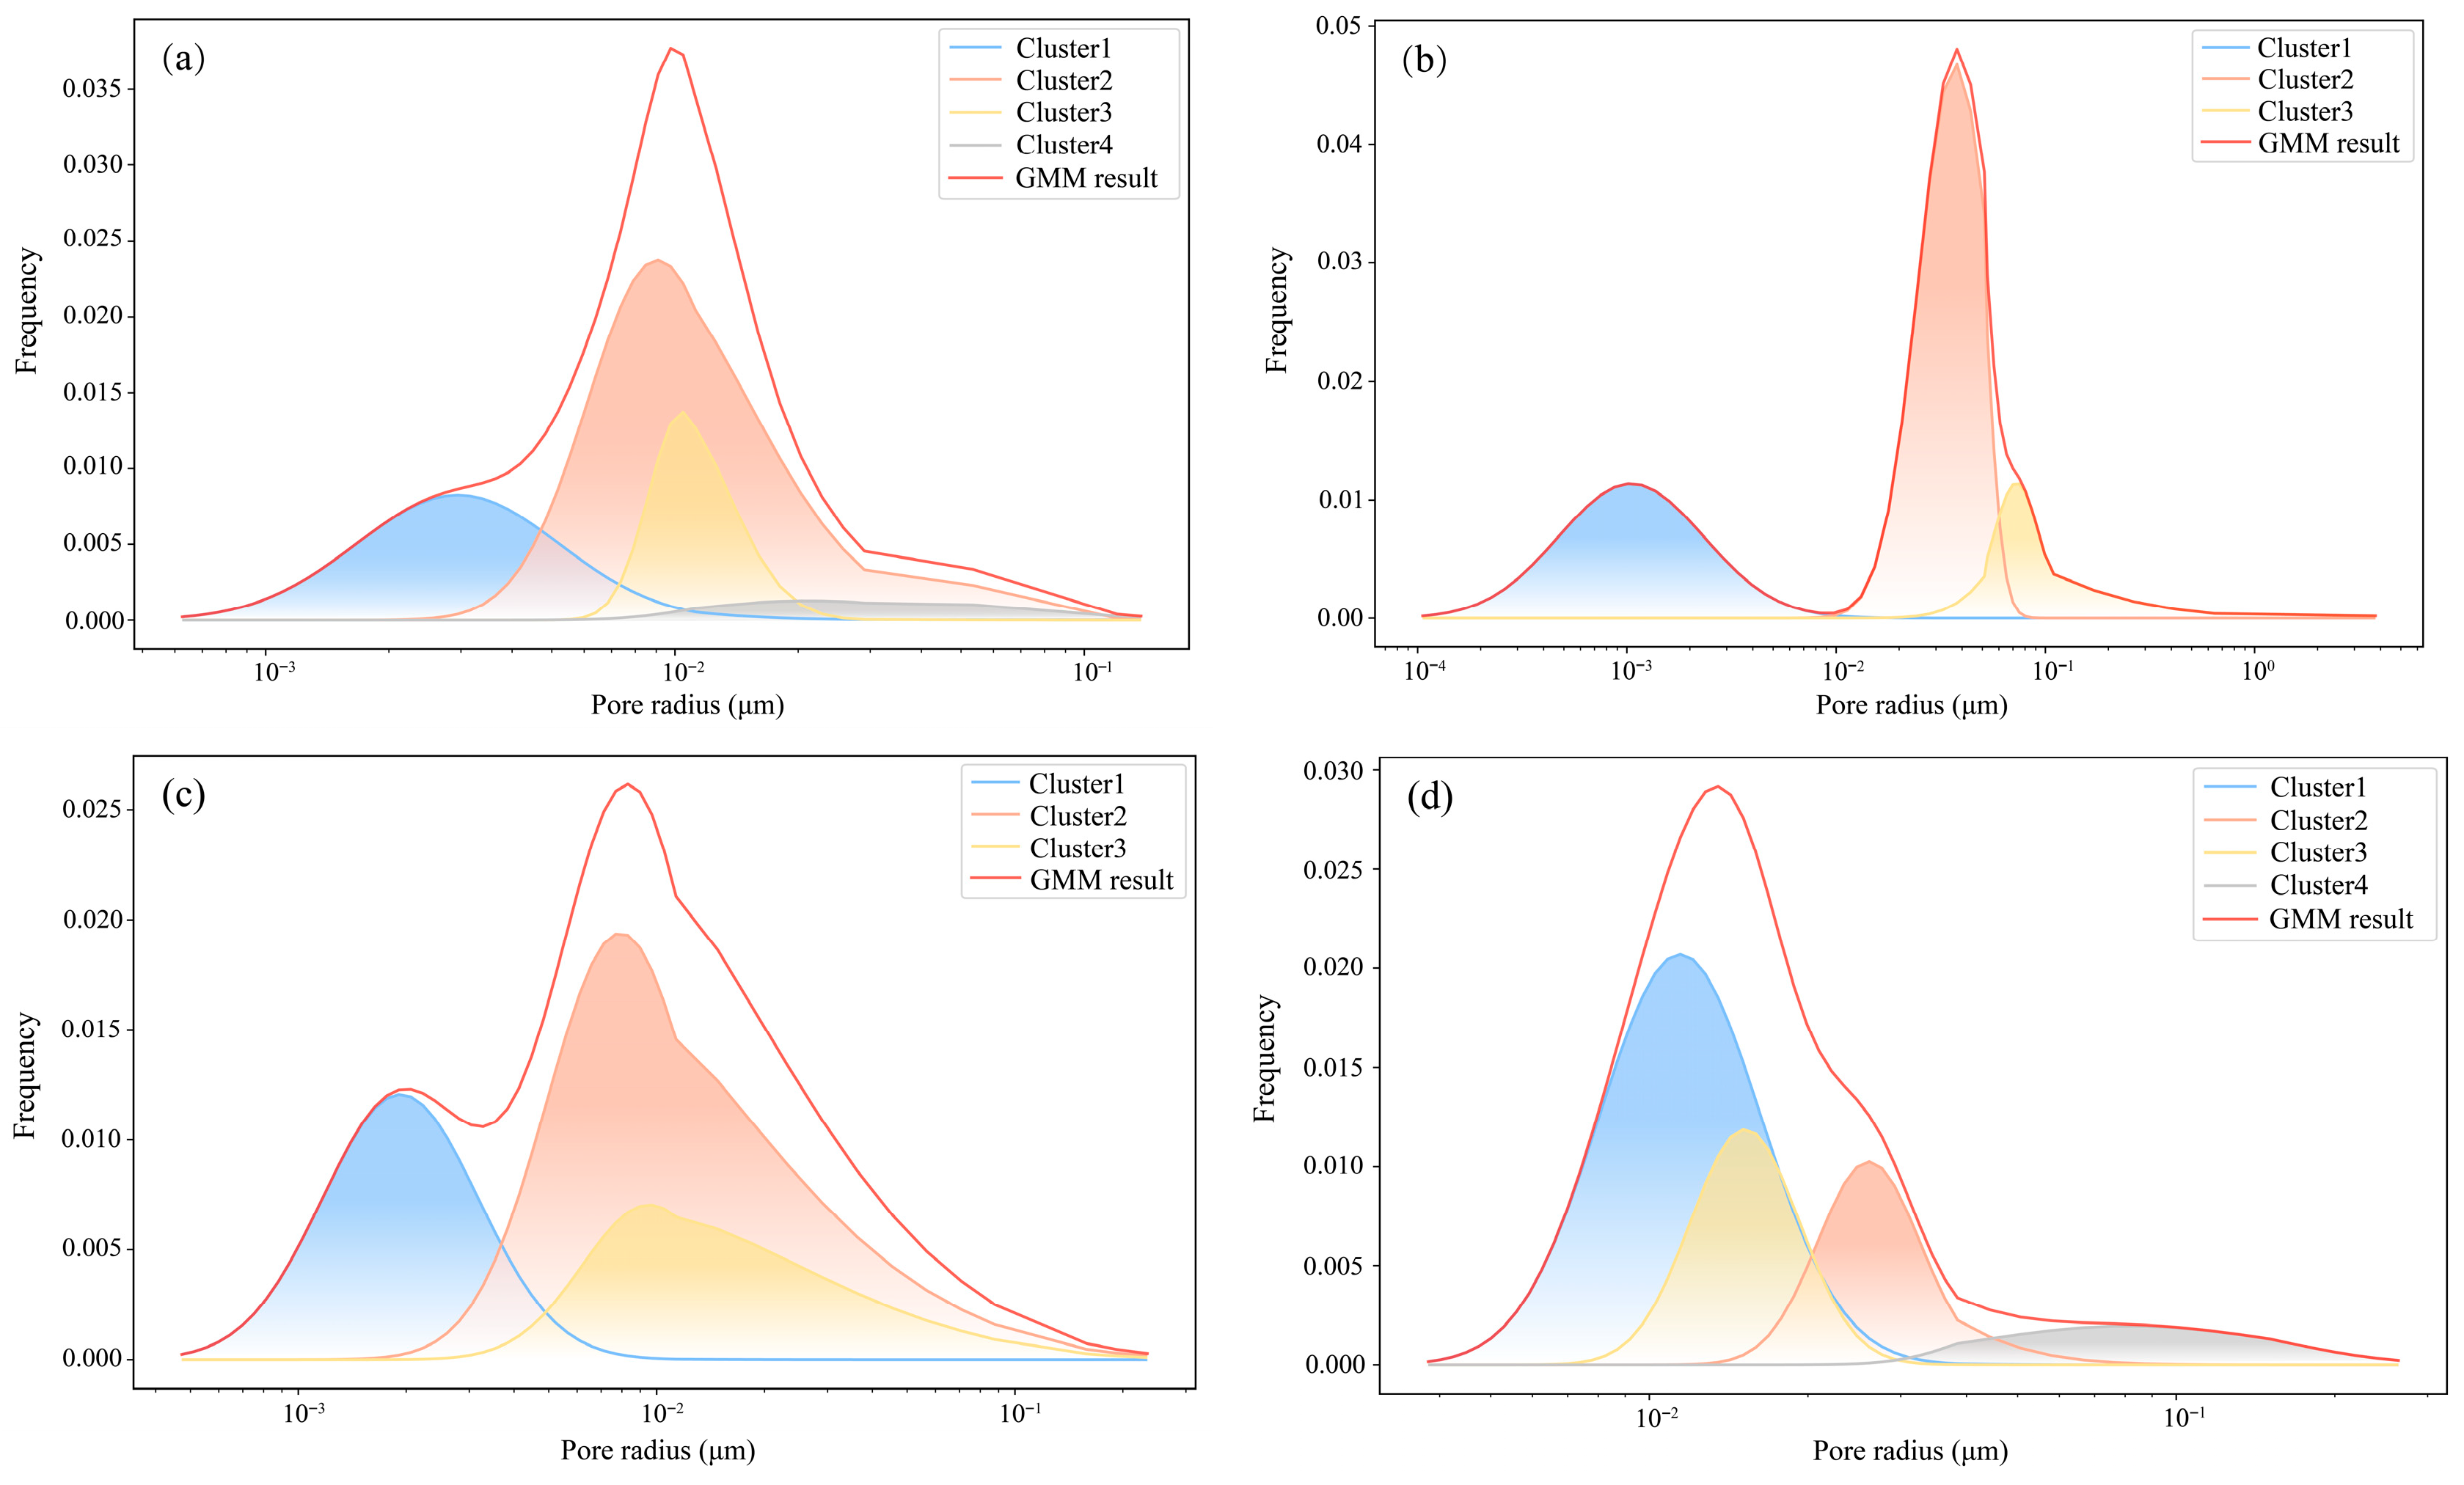
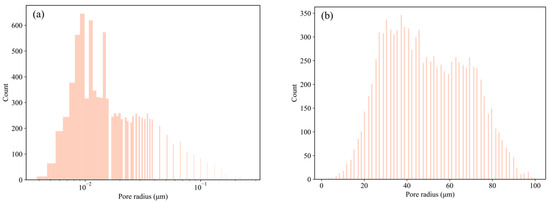
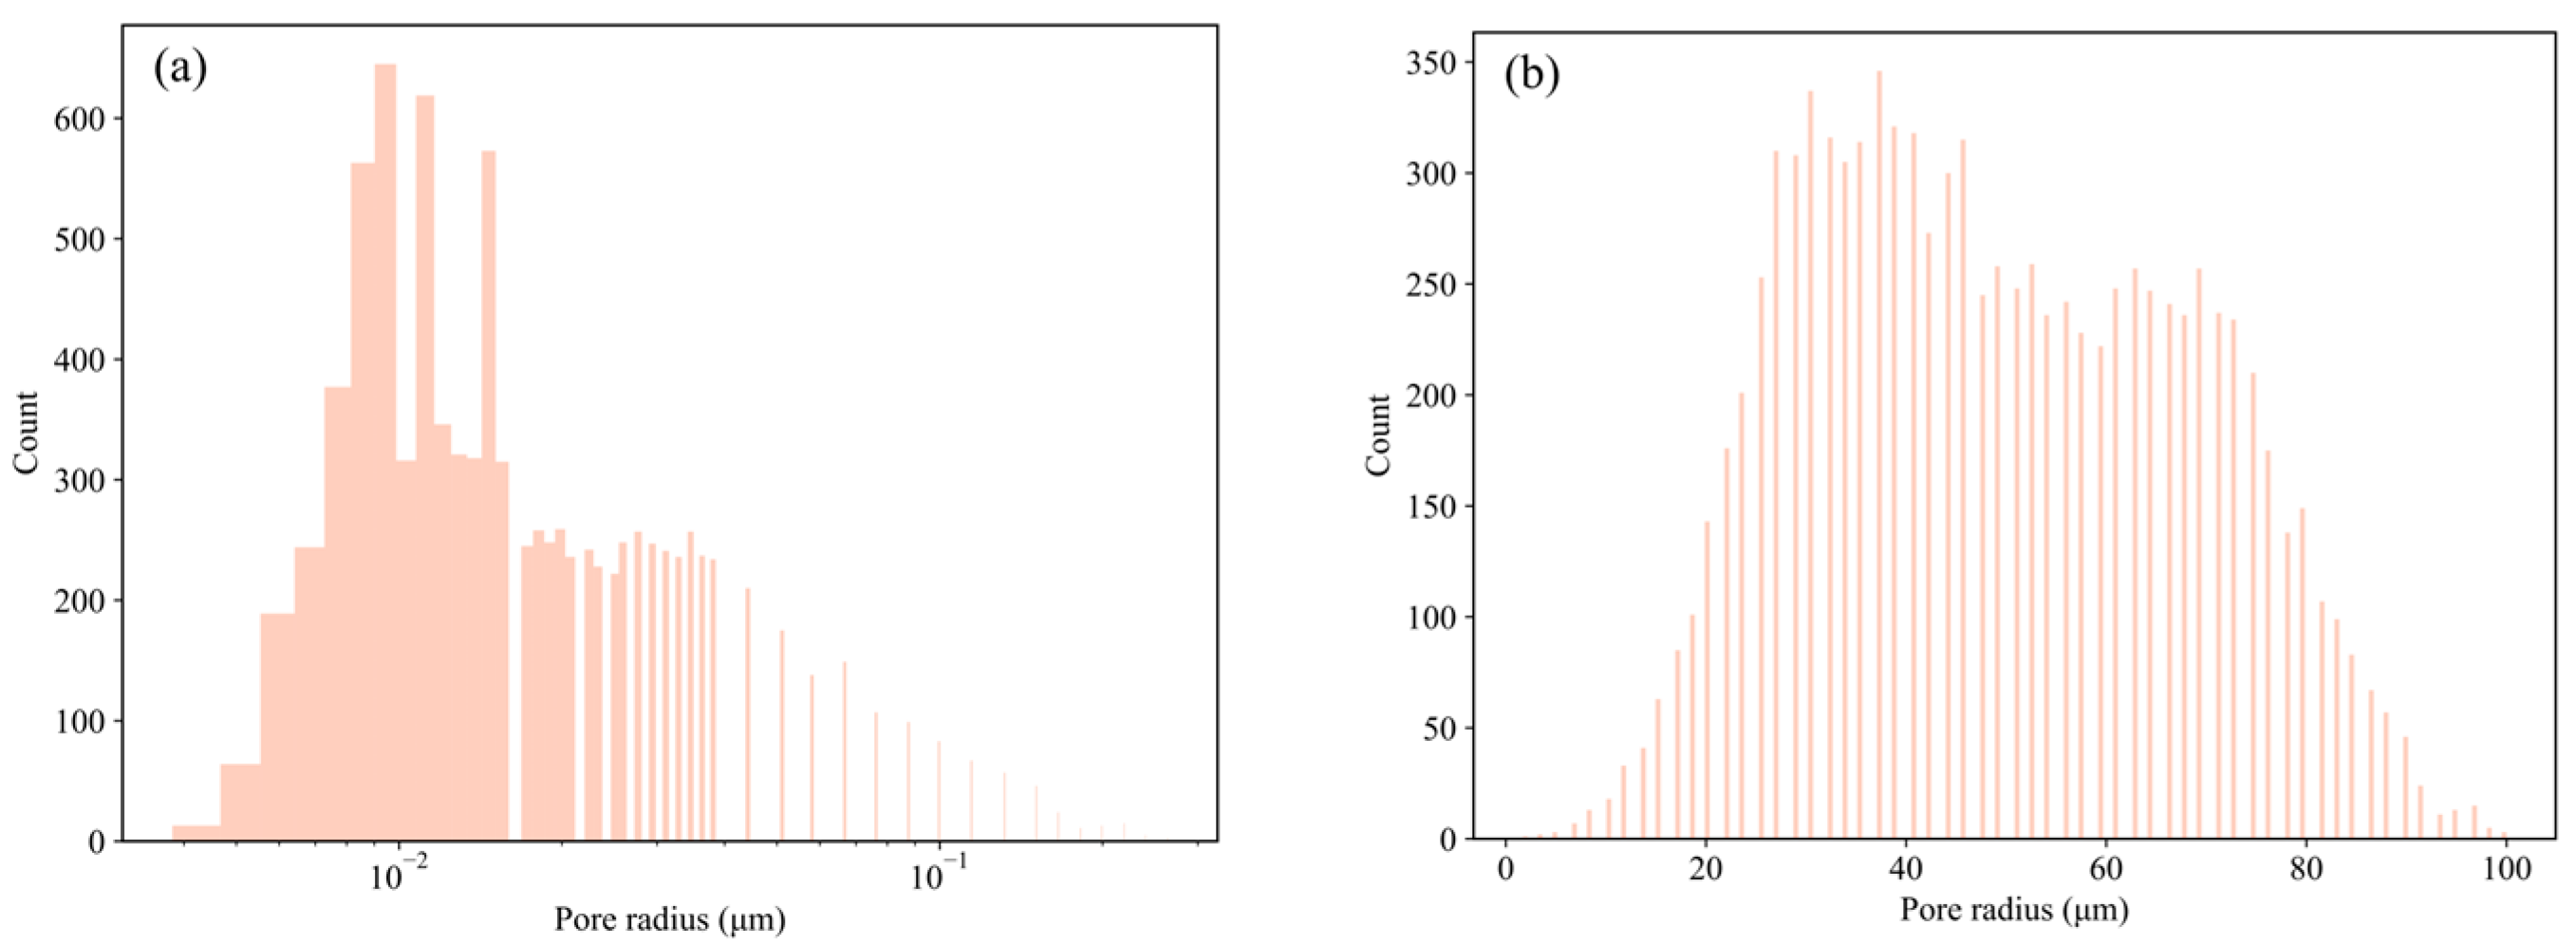
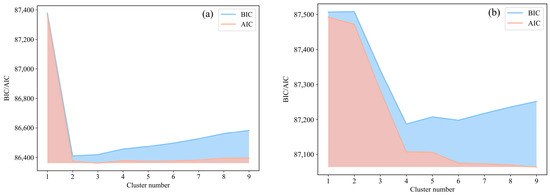
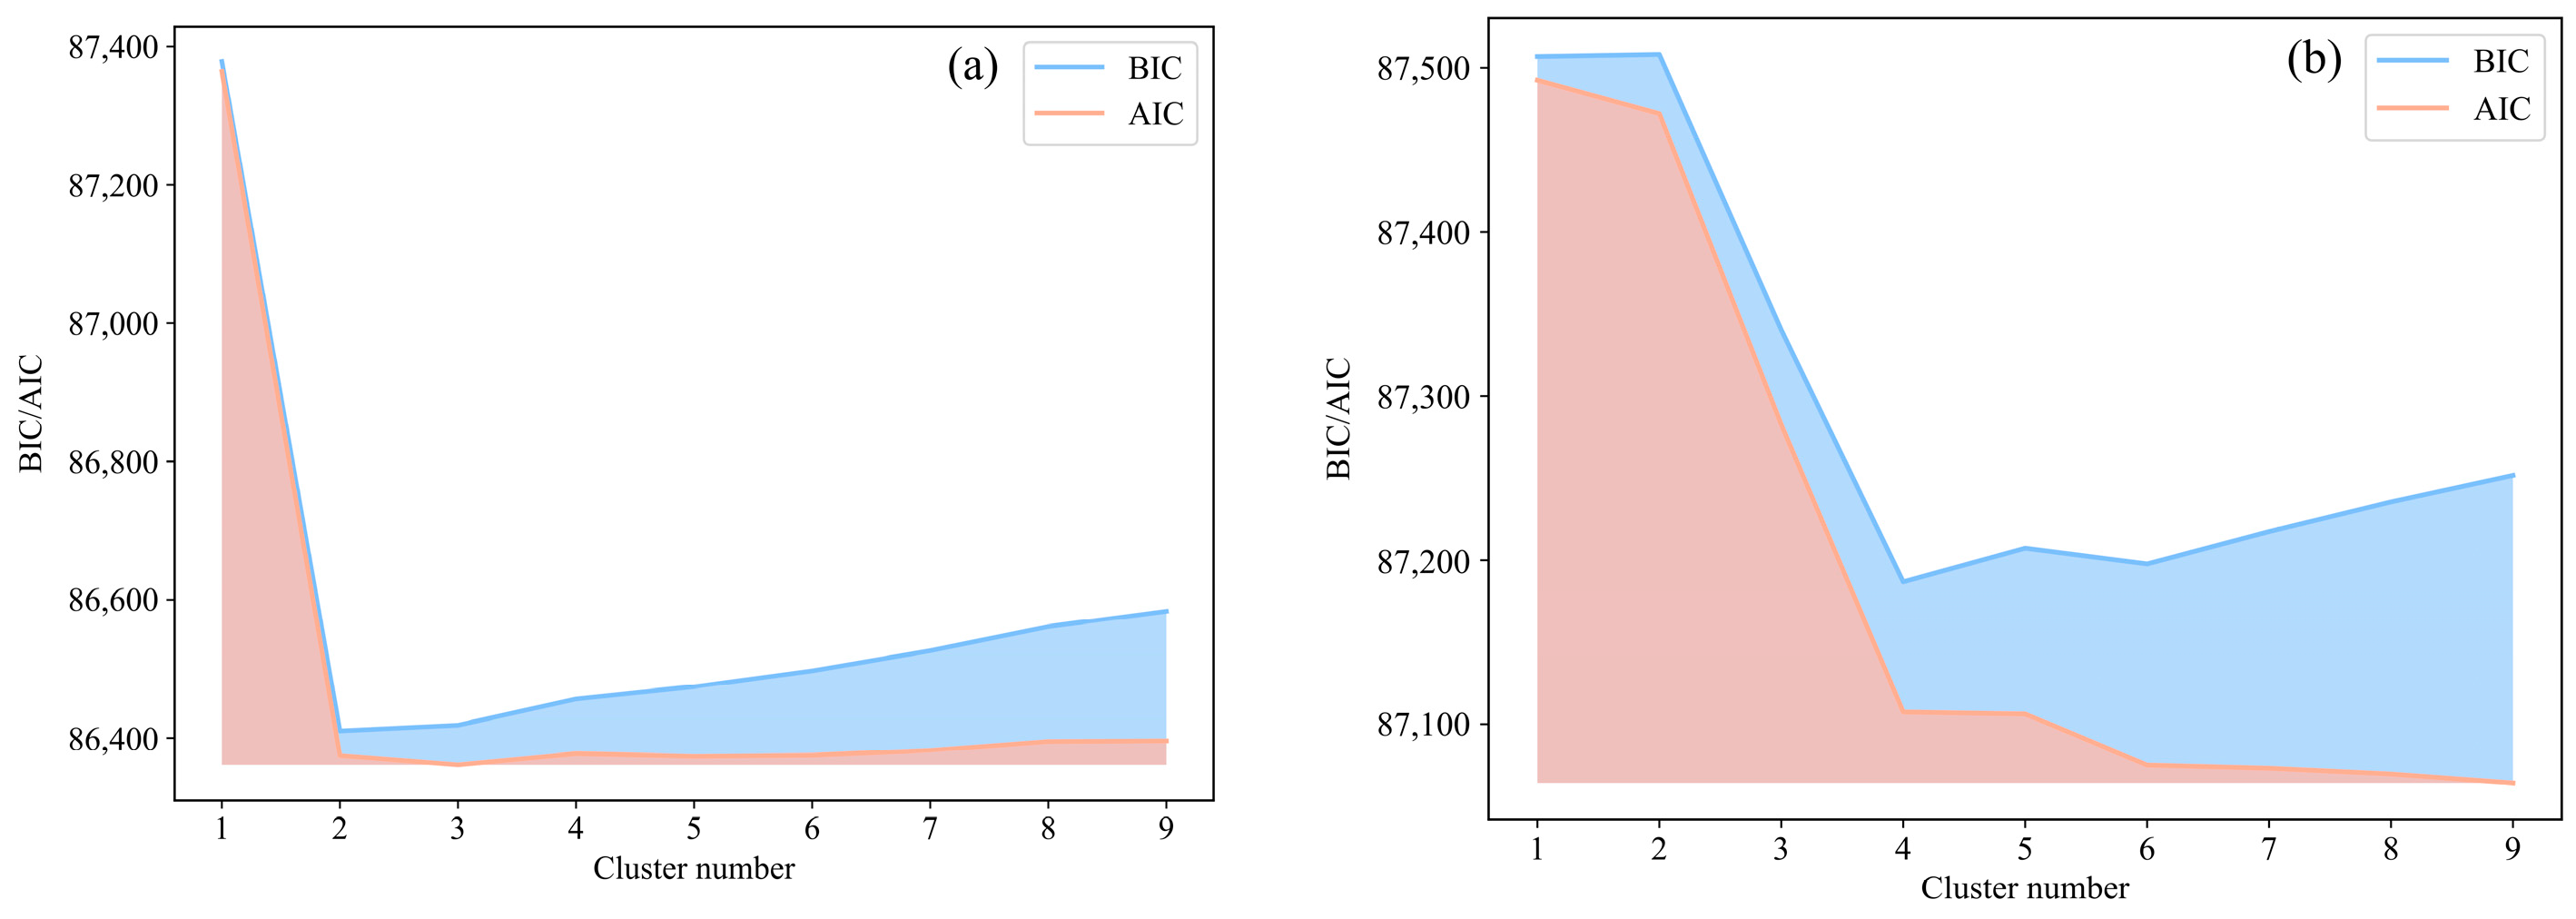
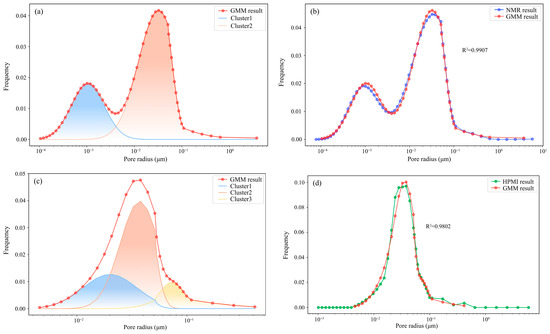
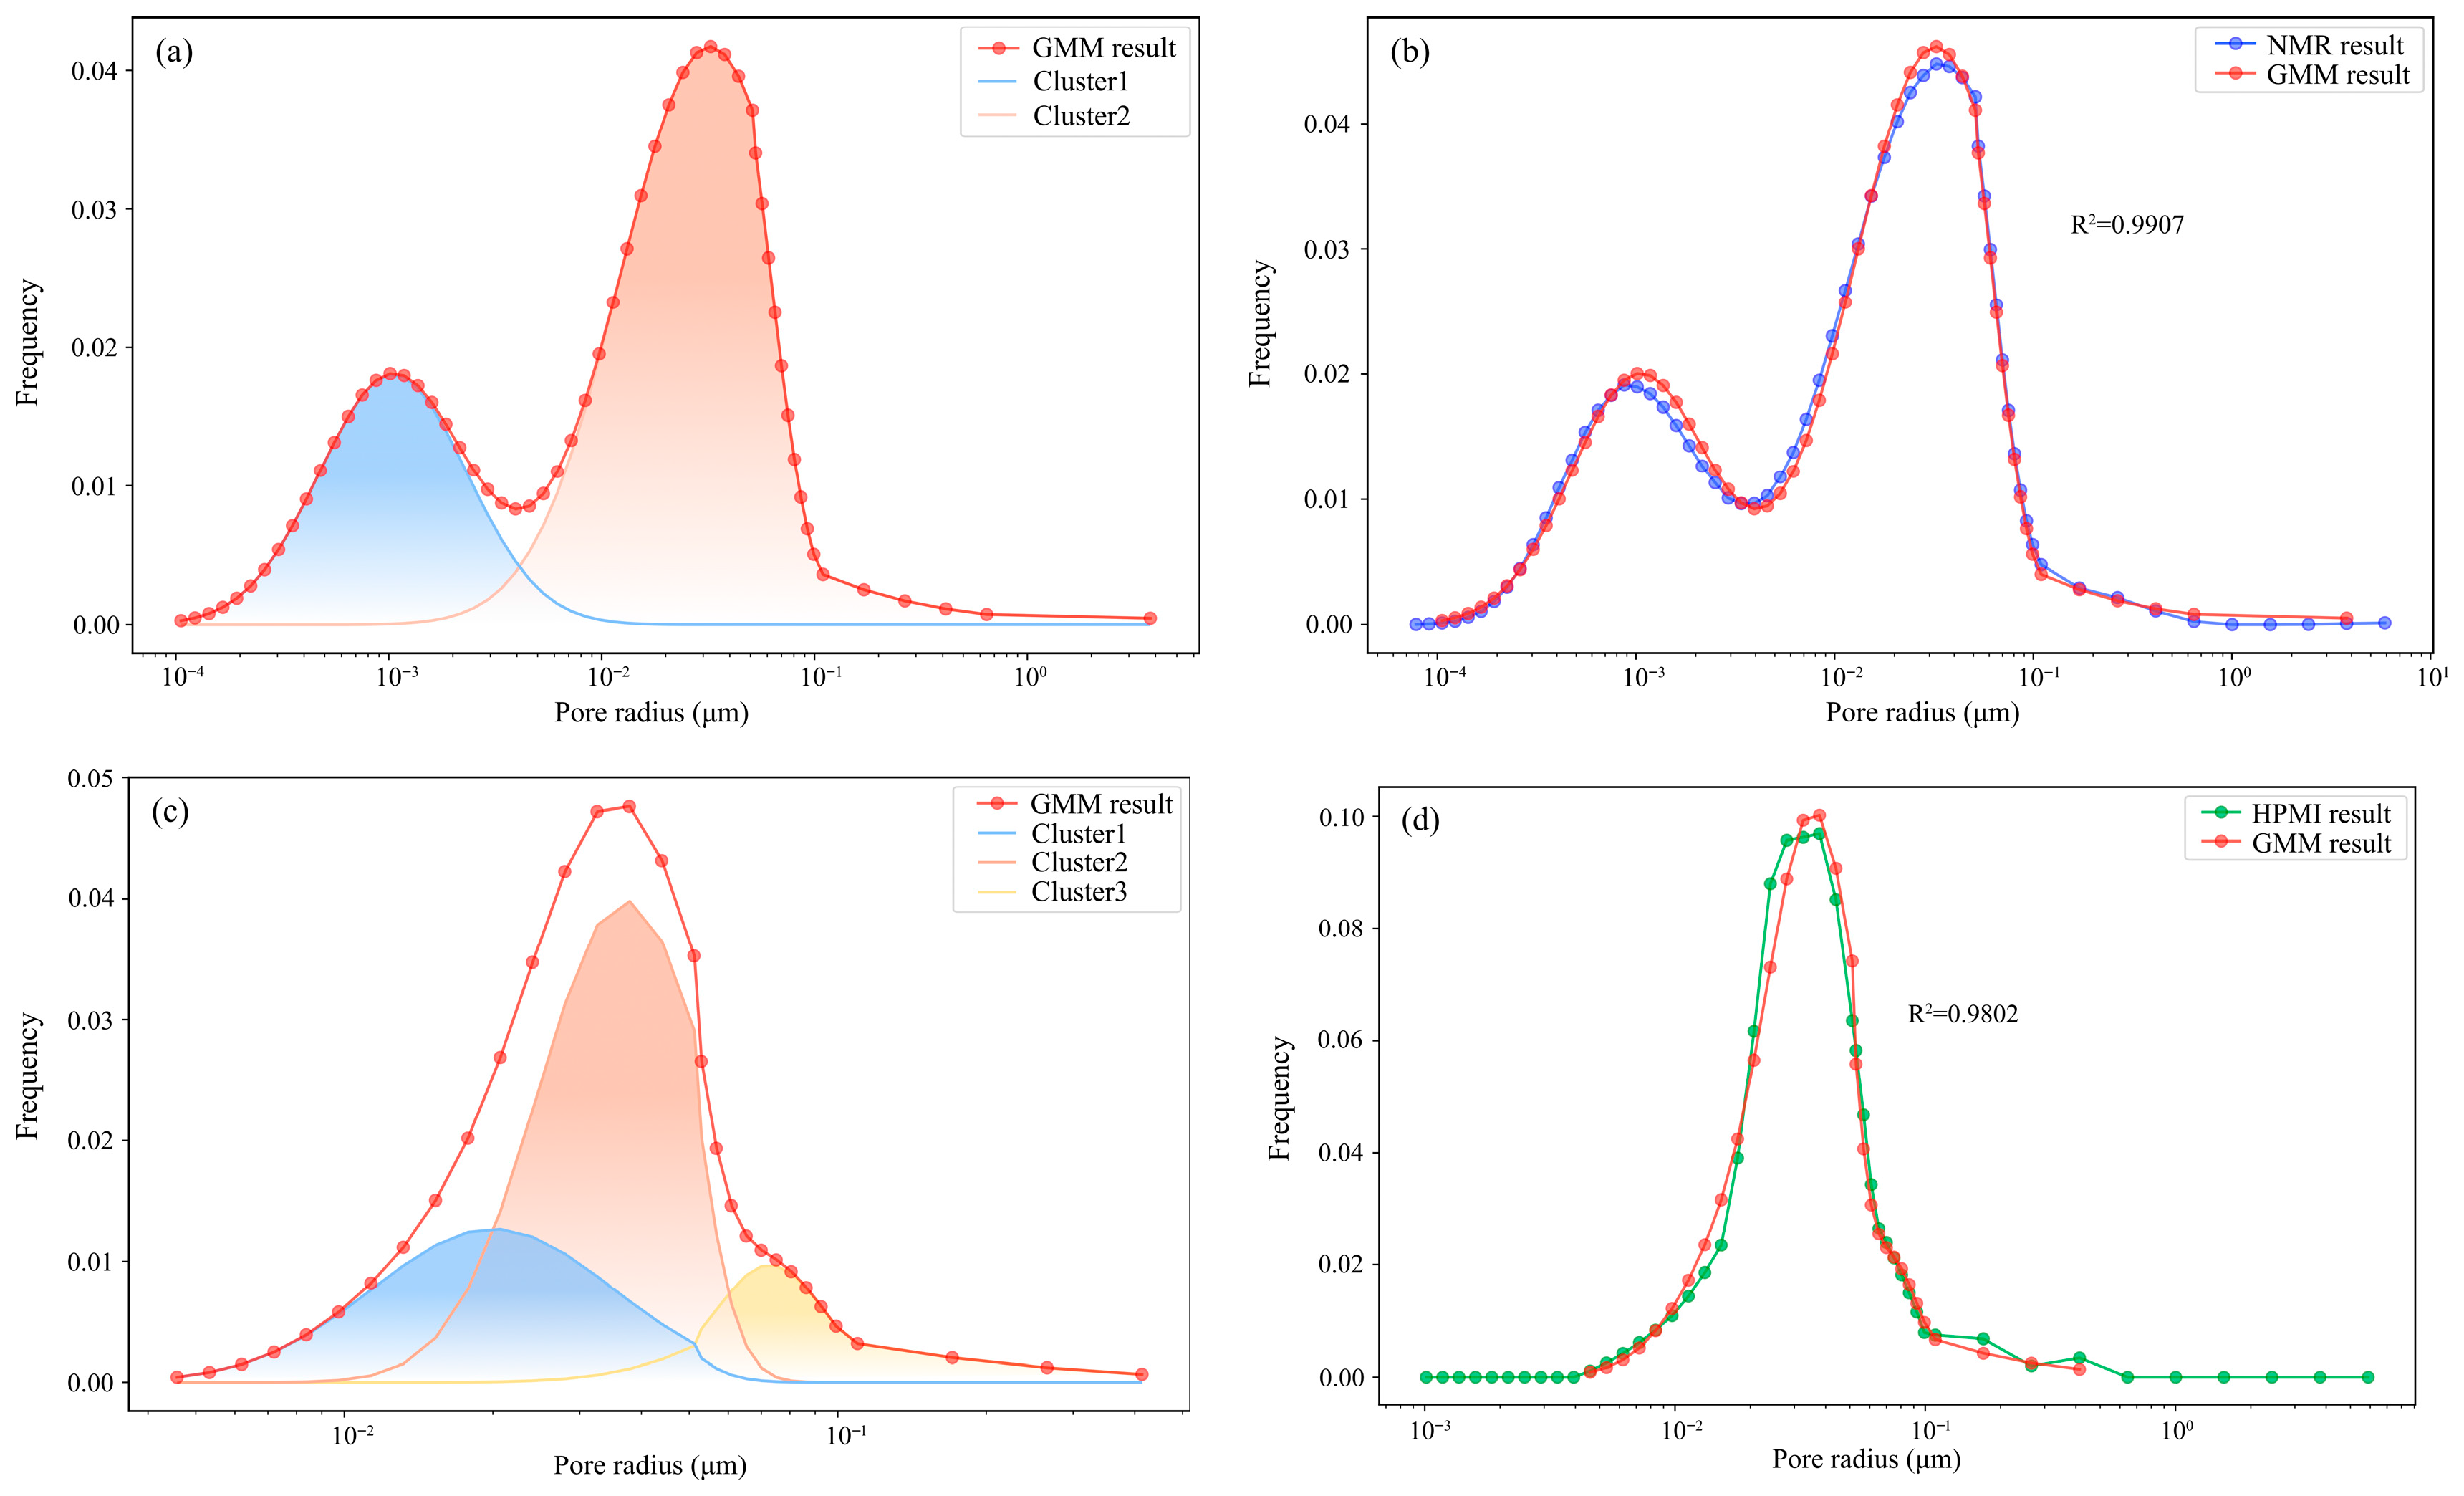
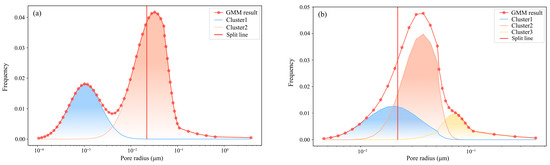
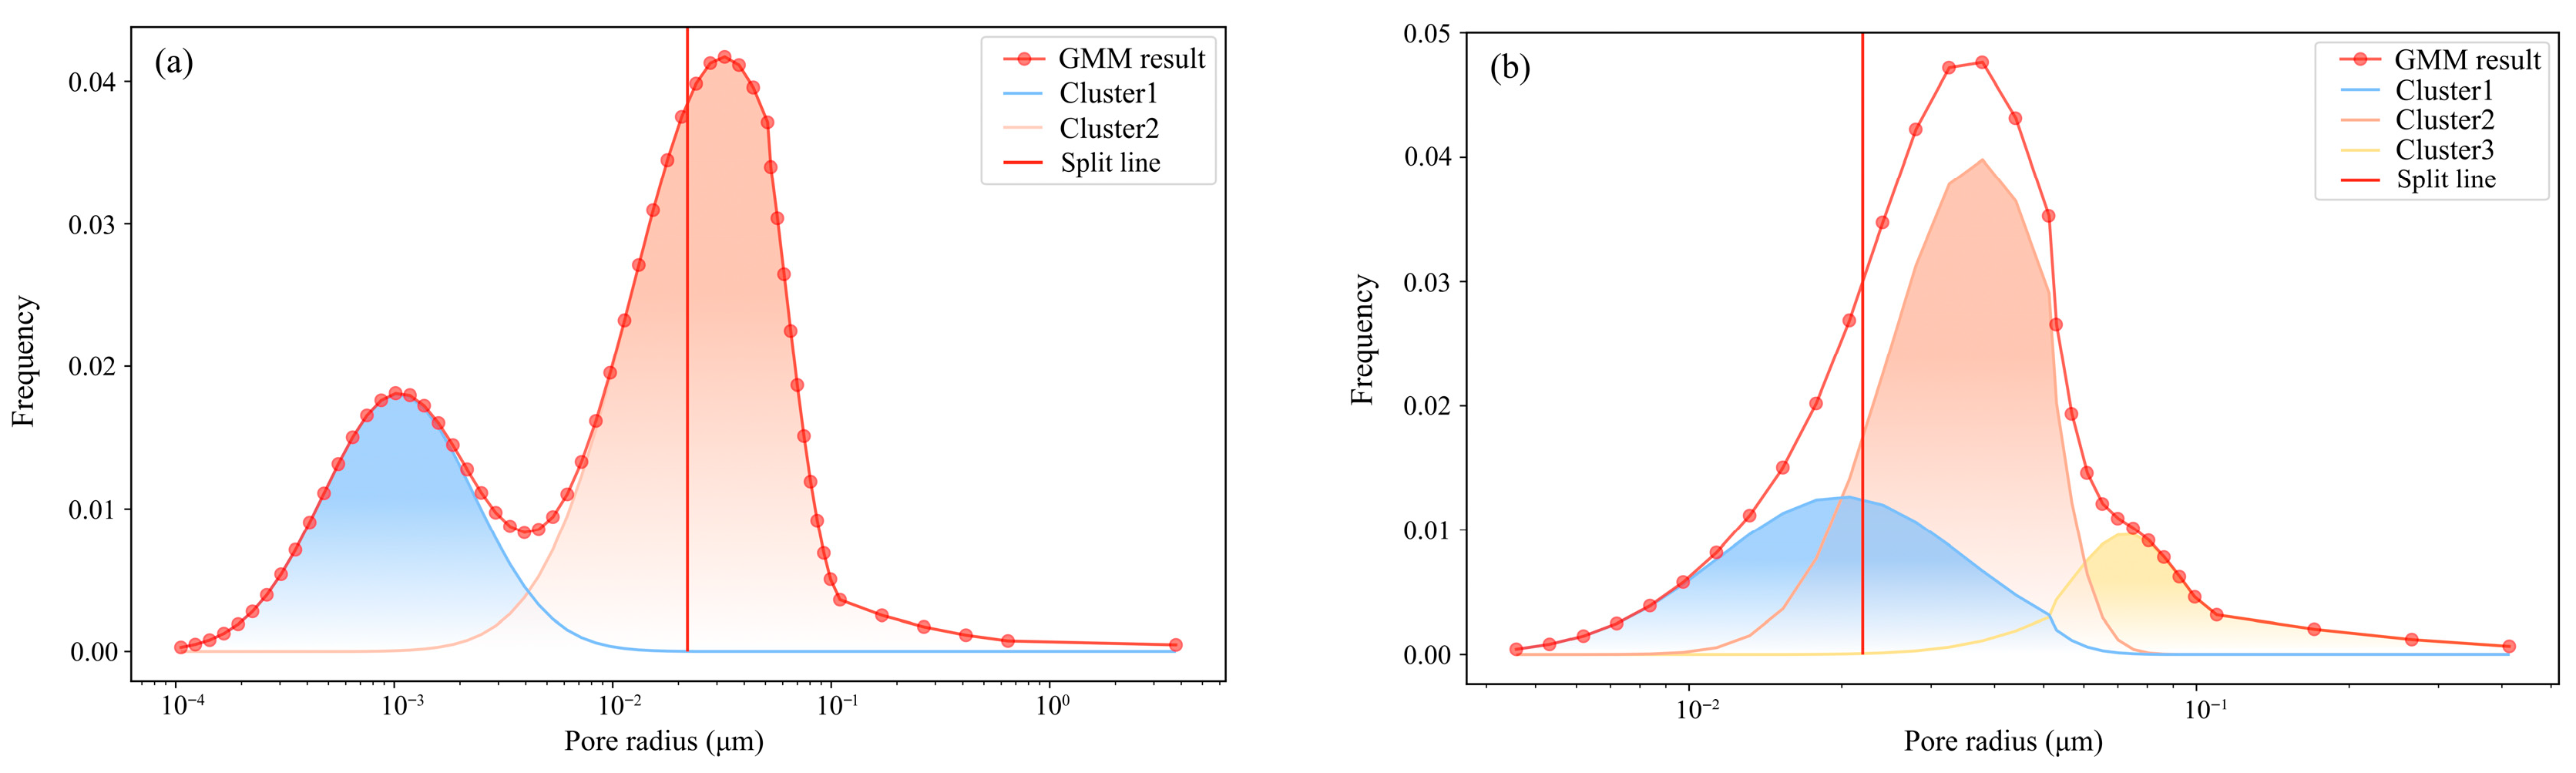
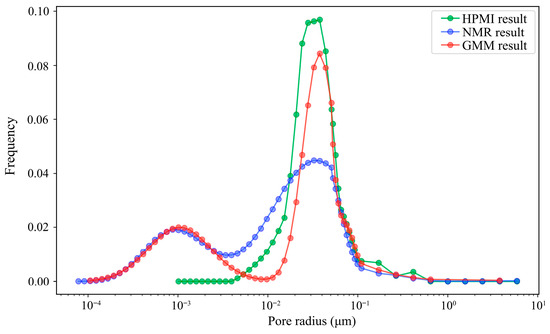
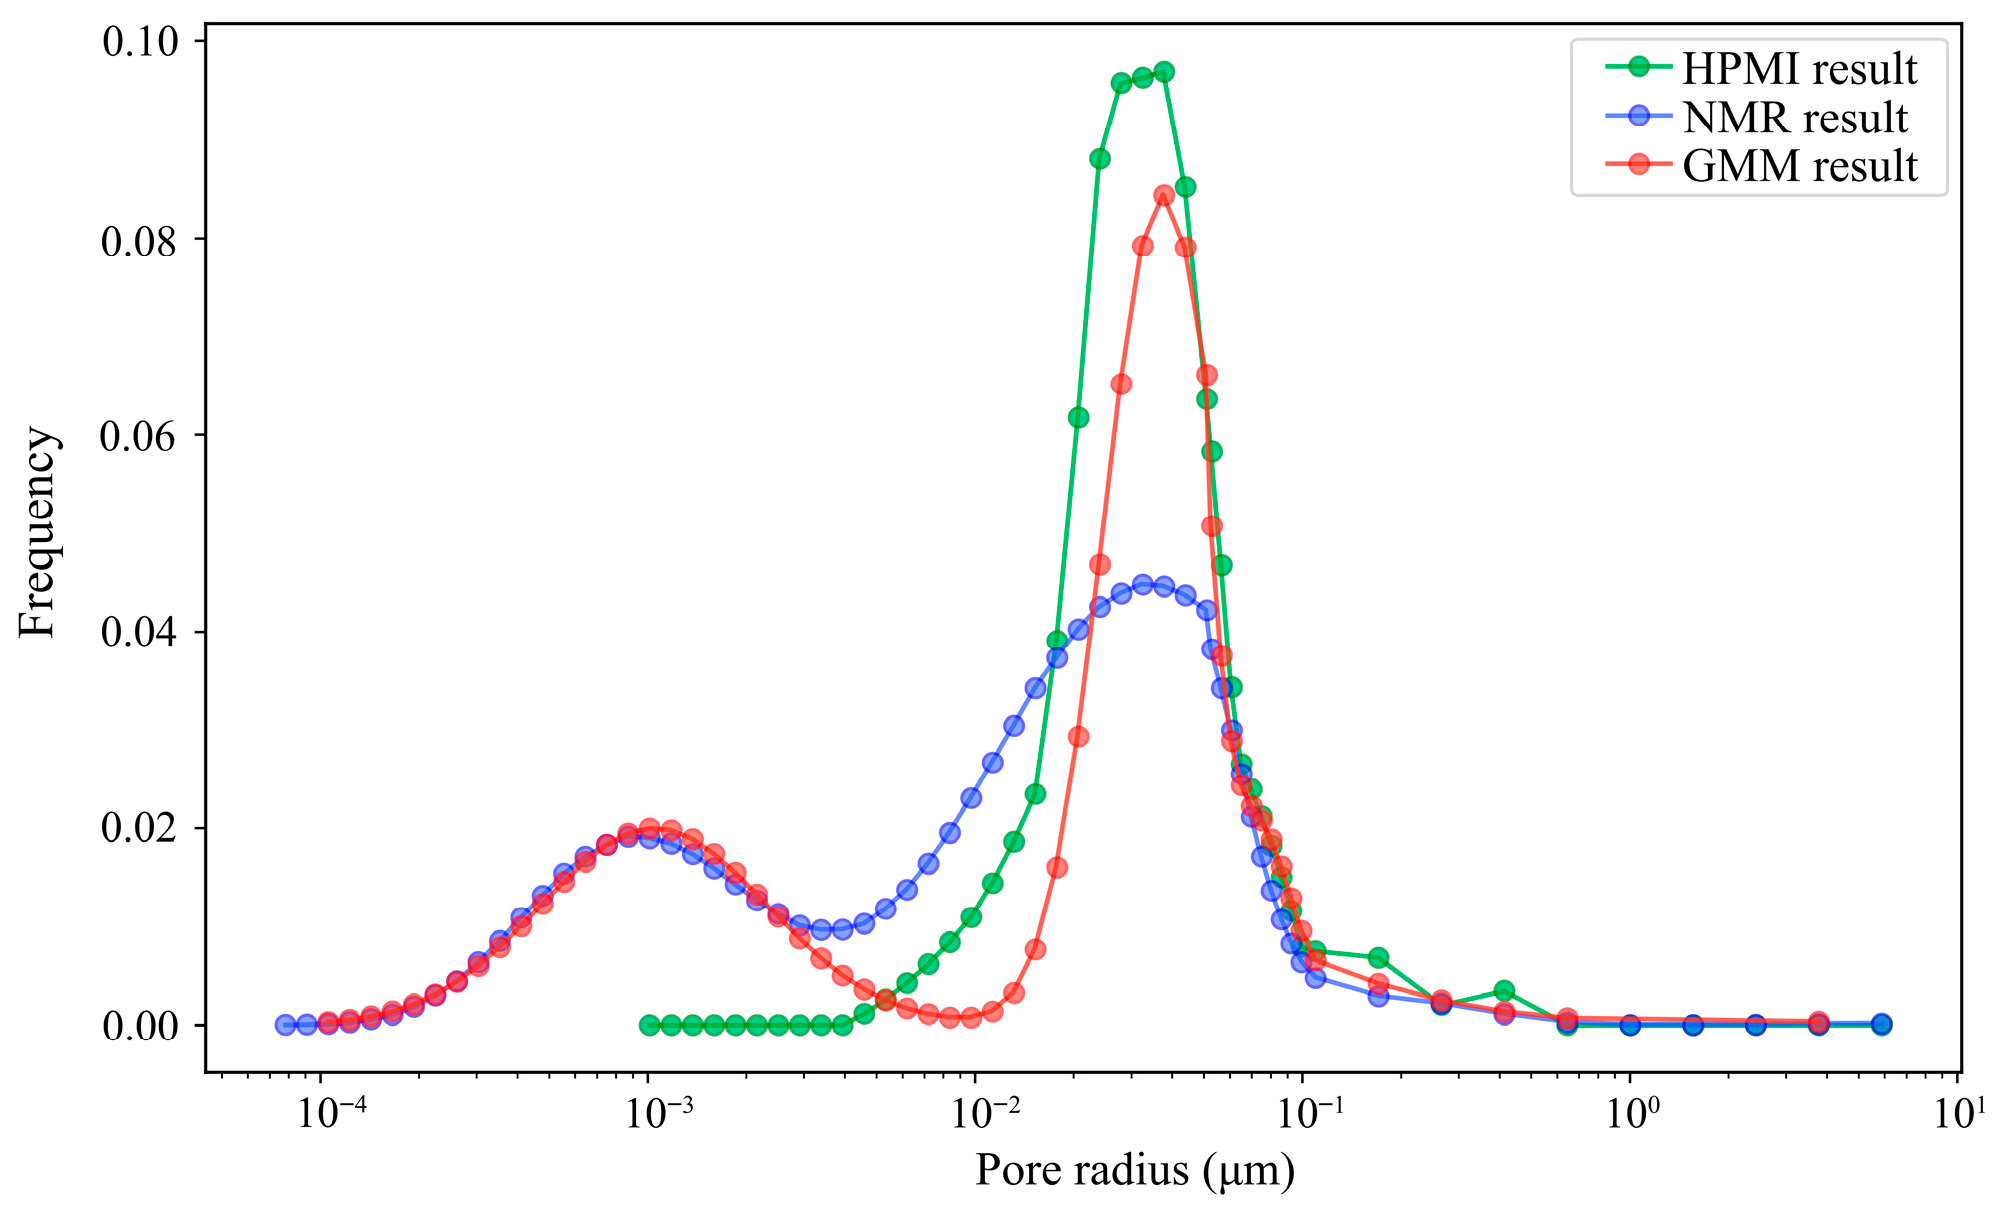
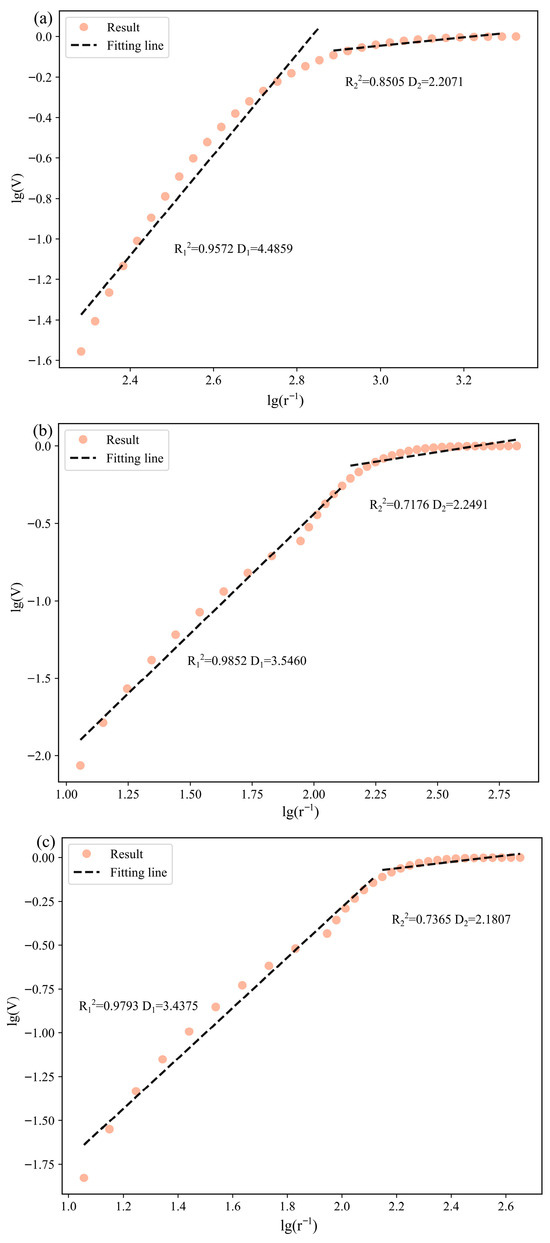
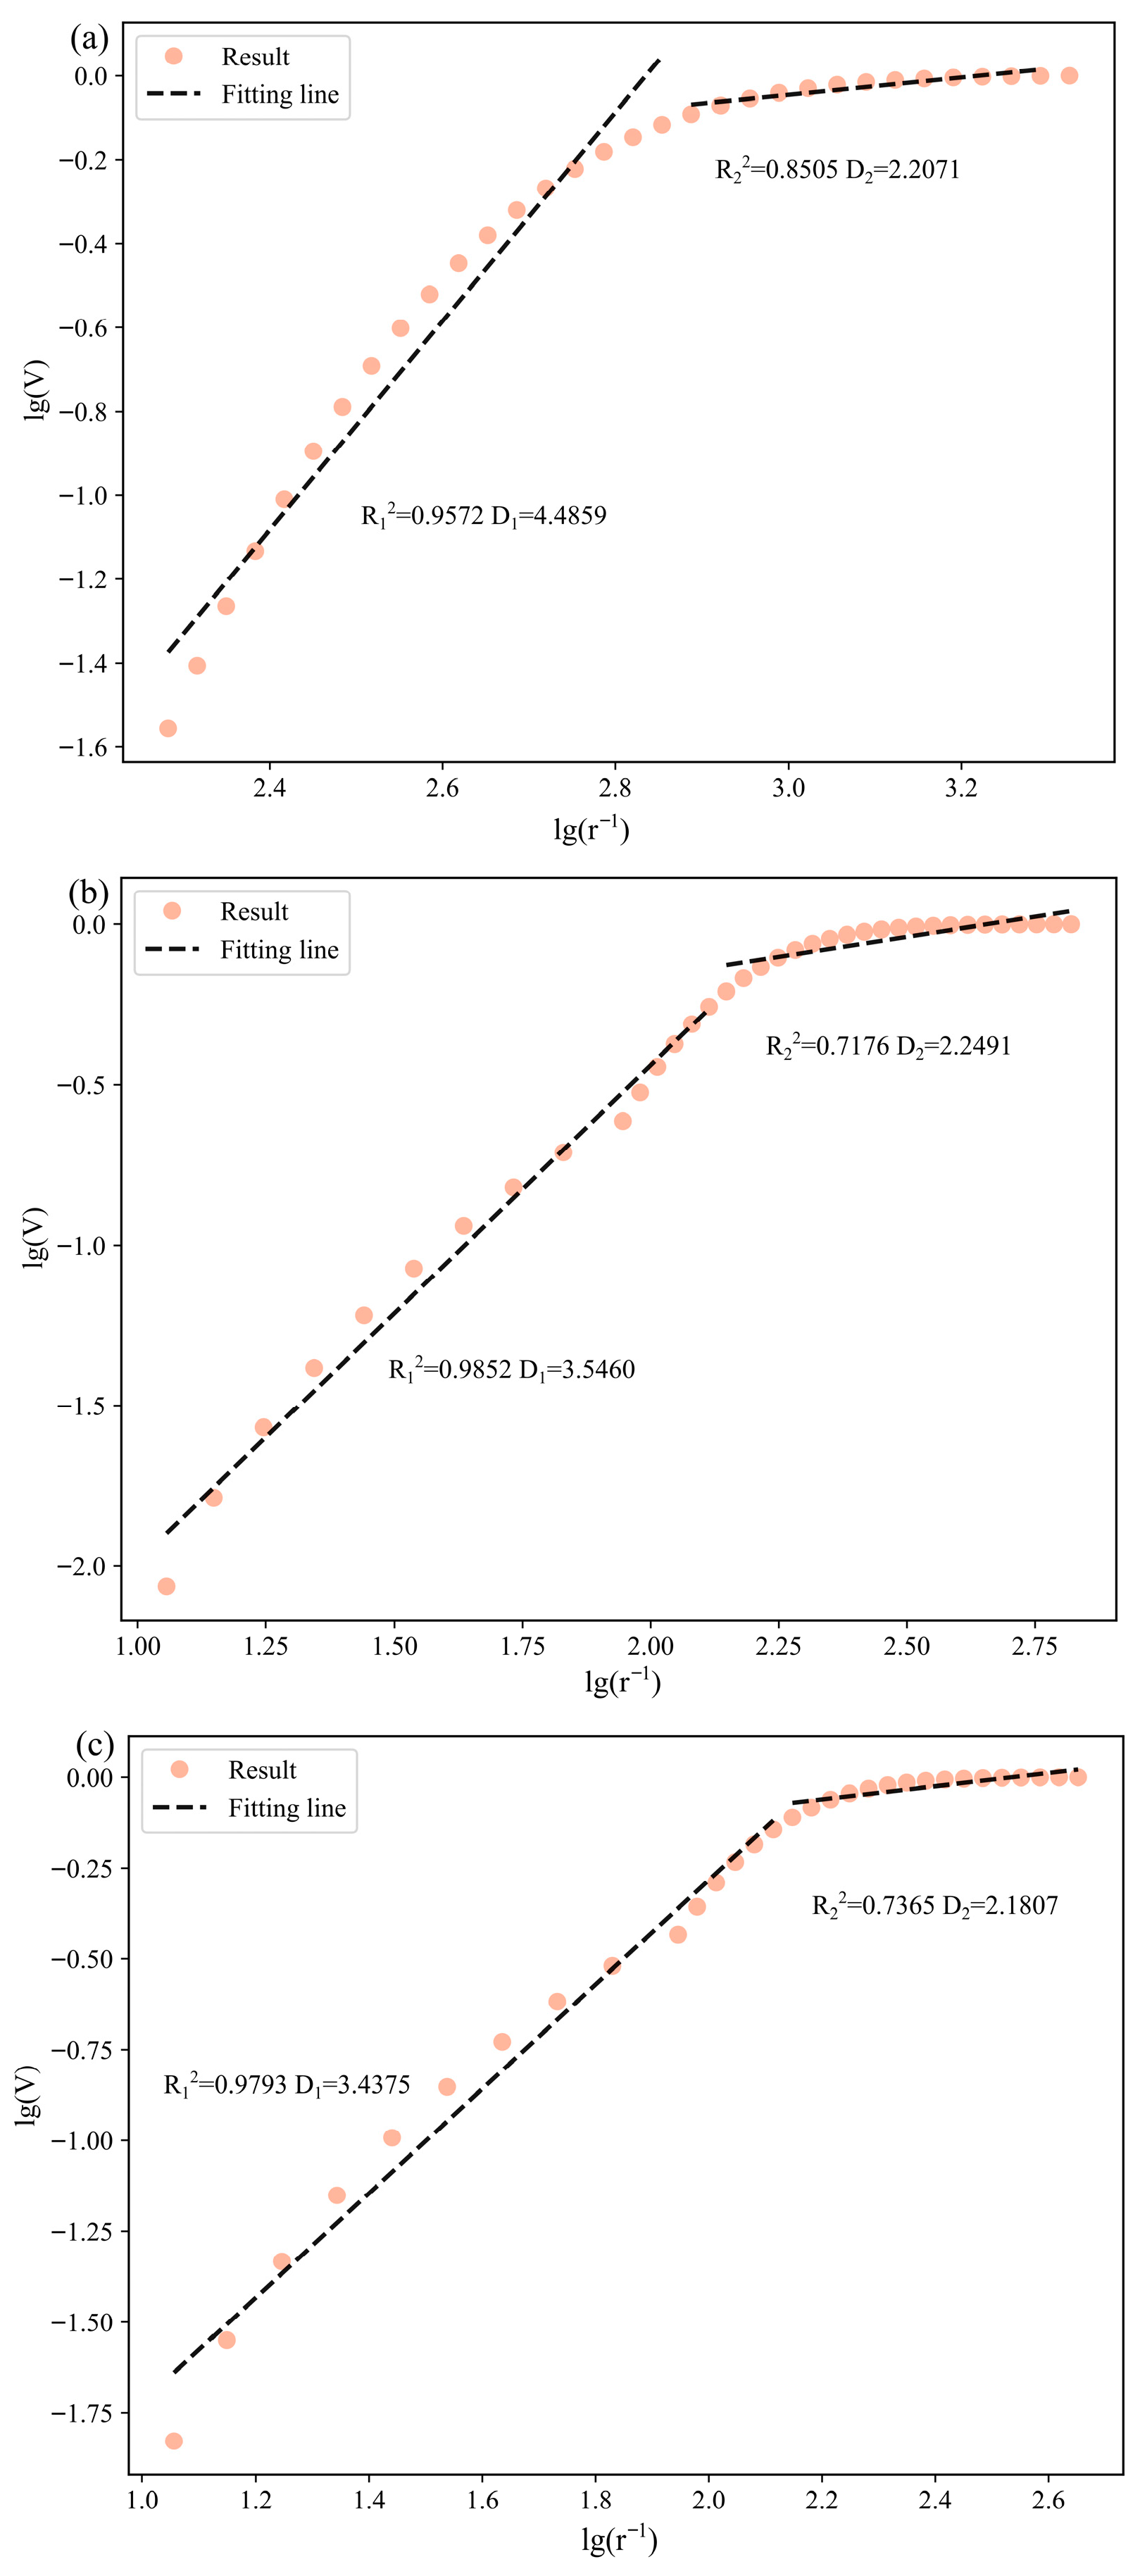

Disclaimer/Publisher’s Note: The statements, opinions and data contained in all publications are solely those of the individual author(s) and contributor(s) and not of MDPI and/or the editor(s). MDPI and/or the editor(s) disclaim responsibility for any injury to people or property resulting from any ideas, methods, instructions or products referred to in the content. |
© 2026 by the authors. Licensee MDPI, Basel, Switzerland. This article is an open access article distributed under the terms and conditions of the Creative Commons Attribution (CC BY) license.