


Abstract
Accurate obesity risk classification is often hindered by the asymmetric and heteroscedastic nature of health data, where traditional mean-based machine learning models fail to capture critical distribution tails. This study addresses this gap by proposing a robust Expectile Random Forest (ERF) model, a novel ensemble architecture that integrates an expectile learning framework via the Asymmetric Least Squares (ALS) loss function for seven-level (multilevel) classification. Utilizing a dataset of 2111 empirical records, the sensitivity analysis identifies as the optimal configuration, achieving an overall Accuracy of 94.6 ± 0.7% and a Macro F1-Score of 94.5 ± 0.7%. This performance represents a significant quantitative improvement over state-of-the-art benchmarks, outperforming XGBoost by 1.8% and standard Random Forest by 3.9%. Feature importance analysis identifies body weight, age, and sedentary factors as primary predictors, while the ERF model demonstrates exceptional ordinal consistency and robustness against clinical outliers. These findings provide a superior methodological framework for developing precise medical decision support systems, shifting the paradigm from central-tendency predictions to tail-sensitive health risk mapping.
1. Introduction
In recent decades, the prevalence of obesity has increased significantly in various countries, making it one of the most crucial global health issues. The Americas have the highest prevalence of adult obesity among all World Health Organization (WHO) regions. In Latin America, approximately 64% of adults are classified as overweight (Body Mass Index (BMI) > 25 kg/m2), of whom 30.5% are obese (BMI ≥ 30 kg/m2) [1]. This upward trend is particularly concerning, as it indicates a growing burden that emerges early in life and extends into later stages of development. Obesity is a multifactorial condition arising from complex interactions between systemic factors, the physical environment, food exposure, economic and political interests, social inequity, limited access to scientific knowledge, culture, contextual behavior, and individual genetics, which often evolve dynamically over the life course [2]. Obesity is not only associated with an increased risk of chronic diseases, such as diabetes, hypertension, and cardiovascular disease, but also impacts quality of life and places an economic burden on healthcare systems [3,4,5].
Despite its widespread use, conventional indicators such as body mass index (BMI) and standard risk classification approaches may fail to capture underlying heterogeneity in body composition and risk profiles across populations [6]. Therefore, the accurate classification of obesity risk is a crucial step in supporting data-driven prevention and early intervention efforts. With technological advancements, data-driven approaches and artificial intelligence are increasingly being used to improve the accuracy of health risk classification compared to conventional methods, which often rely on simple statistical analysis and specific distributional assumptions.
In this context, various machine learning methods have been developed to address the complexity of nonlinear relationships between variables in health data. Models such as Random Forest [7], Support Vector Machine [8,9], LSTM [10], Gated Recurrent Unit (GRU) [11,12], and Gradient Boosting [13,14] have proven effective across various classification tasks, particularly in the healthcare domain. For example, research by Leo Breiman introduced Random Forest as an ensemble method robust to noise and overfitting, making it widely used in high-dimensional data analysis [15,16]. Furthermore, recent research has demonstrated that ensemble learning-based approaches can improve disease classification accuracy by leveraging complex, heterogeneous feature combinations [17,18,19,20]. Research by Hastie et al. Research by Hastie et al. [21] also confirmed that tree ensemble-based models have an advantage over traditional linear methods in capturing nonlinear interactions between variables.
However, most conventional machine learning methods still focus on mean-based learning, which tends to be sensitive to outliers and asymmetric data distributions. In the case of health data, such as obesity, variable distributions are often skewed and heterogeneous, making mean-based approaches suboptimal. To address this limitation, the concept of expectile regression was introduced as a generalization of mean regression, allowing for emphasis on specific parts of the distribution through the parameter (tau) [22,23]. This approach has been widely developed in modern statistical literature, including the work of Roger Koenker [24], which demonstrated the importance of distribution-based methods for analyzing asymmetric data. Expectile learning offers flexibility in capturing the dynamics of data distributions by adjusting penalty rates for positive and negative deviations, potentially increasing model robustness against outliers [25].
While standard ensemble approaches like Random Forest and Gradient Boosting exhibit strong predictive capabilities, they predominantly rely on mean-based optimization metrics (e.g., Gini impurity or standard cross-entropy) that treat data variance symmetrically, making them vulnerable to the outliers and heteroscedasticity typical of medical and lifestyle data [26,27,28]. Conversely, while expectile-based learning has emerged as a solution for asymmetric data, existing methods in the literature have largely been confined to continuous regression tasks, econometric forecasting, or simple binary classification. They fail to address the complex, ordinal nature of multilevel medical risk strata. While expectile learning has been established in recent statistical literature, particularly for regression and financial forecasting, its systematic integration into a tree-based ensemble for multilevel health risk classification remains relatively underexplored. The primary contribution of this research lies in the specialized adaptation of the Expectile Random Forest (ERF) model to handle the unique ordinal structure of obesity risk categories. By embedding the Asymmetric Least Squares (ALS) loss function into the recursive partitioning mechanism, this study extends existing expectile frameworks to better address the heteroscedasticity and non-linear transitions inherent in metabolic health data. This approach allows for a more nuanced mapping of health risk hierarchies, providing a robust alternative to conventional mean-based classifiers without claiming to invent the broader expectile learning paradigm itself. This mechanism is mathematically tuned to capture the highly overlapping decision boundaries and extreme tail variances of high-risk obesity profiles.
Based on the identified research gaps, the primary objective of this research is to develop and validate a novel Expectile Random Forest (ERF) model tailored for multilevel classification of obesity risk. While traditional mean-based machine learning algorithms often struggle with the inherent heteroscedasticity and asymmetric presence of outliers in empirical health data, this research aims to overcome these limitations by integrating an Asymmetric Least Squares (ALS) loss function within a tree-based ensemble architecture. The value of this research lies in its methodological contribution to intelligent health risk assessment, shifting the paradigm from conventional central-tendency predictions to a more dynamic, tail-sensitive probabilistic mapping. By explicitly investigating the influence of the expectile parameter () on the classification boundaries of seven distinct ordinal obesity categories, this research provides a comprehensive sensitivity framework that is rarely explored in the current literature. Ultimately, the successful implementation of this proposed model will significantly advance precision medicine and bioinformatics. It offers healthcare practitioners a highly robust, mathematically transparent, and reliable decision-support system capable of accurately capturing subtle lifestyle and anthropometric variations that trigger critical transitions in metabolic health risks.
2. Methods
2.1. Multilevel Classification Framework
The multilevel classification framework in this research is designed to map a multidimensional input feature space representing an individual’s lifestyle behaviors and physical attributes into an ordered set of obesity risk category labels. Formally, given an observational dataset , where is a feature vector that includes variables such as frequency of high-calorie food consumption, physical activity level, and age, while is a target label belonging to the discrete category set . In this obesity risk research, the number of classes is defined as , covering a spectrum of underweight, normal weight, two levels of overweight, and three levels of obesity. This multilevel approach assumes a non-linear mapping function that aims to estimate the posterior probability of each class for each given data instance [29]. The probability that a sample belongs to the class can be expressed by the softmax normalization function as in Equation (1) [30]:
where represents the score function or output of the base model for the -th class.
In this classification framework, the training procedure is performed by minimizing the categorical cross-entropy loss function [30], which is mathematically formulated for the entire dataset in Equation (2):
where is an indicator function that has a value of 1 if the condition in it is met and 0 otherwise, while represents the model parameters optimized during the learning process. To build an efficient predictive model on this multilevel structure, the algorithm used is based on a decision tree that performs a recursive partitioning of the feature space [31]. At each internal node , the algorithm searches for the optimal split consisting of the feature index and the threshold value .
This splitting rule procedure or separation rule is determined by minimizing the impurity measure or loss function on the resulting child node [32]. If represents data at node , then the selection of the separation parameter is done by minimizing the objective function in Equation (3):
In the context of multilevel classification of obesity risk, is often represented as Gini impurity or entropy, which measures the homogeneity of class labels within each partition. The percentage of observations from the class at node is defined as , so the Gini impurity function can be expressed by Equation (4) [33]:
This systematic training procedure continues recursively until a stopping criterion is met, such as a maximum tree depth or a minimum number of samples at each leaf node. The result is a multilevel classification model capable of capturing complex decision boundaries between different levels of obesity risk, which will be further enhanced through the integration of expectancy learning to achieve robustness to extreme data variance. Within this framework, each prediction produces not only a single category label but also a probability distribution reflecting the model’s confidence in the individual’s position on the health risk continuum.
2.2. Expectile-Based Classification Method
The development of an expectile-based classification method in this research is motivated by the need for a more flexible and robust estimate of asymmetric data distributions and by the presence of outliers in obesity risk. Unlike quantile regression, which minimizes the asymmetric absolute loss (-norm), the expectile method utilizes the asymmetric least squares loss (ALS), which is a generalization of the mean squares (-norm) [34]. The main advantage of the expectile approach over quantiles is its continuously differentiable functional form across the domain, which simplifies gradient-based optimization without sacrificing the ability to capture the tail characteristics of the data distribution. Mathematically, the expectile loss function for an The residual is defined by the asymmetric least squares loss function , as shown in Equation (5) [35]:
In this equation, is an expectancy parameter that determines the asymmetric weights given to positive and negative residuals. If , then the function becomes a standard quadratic function that produces the mean as its optimal solution. However, by varying the value of , the model can place different emphasis on data deviations; a higher value of will impose a greater penalty on observations that are above the estimate, while a lower value of will be more sensitive to observations at the bottom of the distribution.
The population expectancy value for the random variable is defined as the value that minimizes the expectation of the asymmetric loss function, which is formulated in Equation (6) [36]:
In the context of multilevel obesity risk classification, an expectancy approach is integrated to transform probability estimates into more weighted risk scores based on the latent distribution of individual lifestyle features. For each class in the set of risk categories, the model estimates an expectancy-based scoring function that minimizes the asymmetric empirical risk. This estimation provides a more robust framework than standard classification due to its ability to adjust the decision boundary based on the confidence level. Formally, for a training data set, the optimal parameters are found by minimizing a modified objective function with asymmetric weights, as expressed in Equation (7) [37]:
The integration of the mechanism enables the simulation of various risk scenarios, allowing the model to be tuned to be more “conservative” or “sensitive” to specific categories within a multilevel classification. In this scheme, deviations from the target label are no longer treated uniformly, but rather processed through an asymmetric lens that captures the variance structure within a complex obesity risk dataset. This procedure provides the foundation for building a model that is not only accurate on average but also robust to data anomalies that often blur the boundaries between classes in conventional classification models. Thus, the parameter plays a crucial role as a tuning instrument, enabling clinicians to explore individual risk profiles beyond the single-point estimates provided by traditional machine learning algorithms.
2.3. Proposed Expectile Random Forest for Multilevel Classification
The Expectile Random Forest (ERF) model proposed in this research is an ensemble learning architecture that integrates the Asymmetric Least Squares principle into the recursive partitioning structure of random forests. Unlike conventional Random Forests, which construct each decision tree to minimize Gini impurity or mean entropy, the ERF model constructs a set of Expectile Decision Trees (), each trained to minimize an asymmetric quadratic loss function at a specified level of . This procedure begins with the formation of a bootstrap sample by drawing with replacement from the original dataset . For each tree in the forest, the algorithm performs random feature selection at each node to increase model diversity and reduce inter-tree correlation. The final estimate of the ERF model for input at expectile level is the average of the outputs of all individual trees, as formulated in Equation (8):
To facilitate technical implementation and ensure reproducibility of the proposed model, the systematic procedure for constructing the ERF ensemble is operationalized via a recursive partitioning process. This pipeline integrates bootstrap aggregating (bagging) with a modified node-splitting mechanism based on the ALS loss function. By substituting standard class-homogeneity metrics with an iterative expectation maximization at each node, the model effectively transforms the forest into a distribution-sensitive classifier. The step-by-step logic of the model’s training phase, from initial data sampling to final prediction aggregation, is summarized in Algorithm 1.
| Algorithm 1. Expectile Random Forest (ERF) Training Pipeline | |
| 1 | Input: Dataset , Number of trees , Expectile level . |
| 2 | For to |
| |
| 3 | End For |
| 4 | Output: |
The main innovation in this ERF model lies in modifying the splitting rule at each internal node of the tree. While in standard decision trees, splitting is performed to maximize label homogeneity, in the ERF, splitting the node is performed by finding the parameters that minimize the total asymmetric expectancy loss at the left and right child nodes. Mathematically, the objective function for splitting nodes at the level is expressed in Equation (9):
The ALS-based splitting criterion in Equation (9) functions by identifying the feature and threshold that minimize the sum of asymmetric squared residuals across the resulting child nodes. Unlike the Gini impurity used in standard random forests, which measures class homogeneity, the ERF splitting objective minimizes the local expectancy variance. For each potential split, the local expectiles and are estimated iteratively at each node. The algorithm selects the partition that minimizes the total asymmetric error , effectively ensuring that the resulting nodes are optimized for the specific distribution tail defined by the parameter . This mechanism makes the tree more sensitive to specific risk segments, particularly in high-risk categories where outliers are more prevalent. By using this ALS-based splitting rule, the model becomes much more robust to outliers in lifestyle features and can capture the risk structure across different parts of the data distribution more precisely. Once the tree structure is formed, multilevel probabilities for obesity risk classification are calculated by mapping the continuous expectiles generated by the model to discrete categories . This transformation is performed by applying a scoring function that calibrates the proximity of the expected estimate to the centroid of each risk class, formulated through the weighted distance function in Equation (10):
In this equation, represents a typical expectancy representation for the -th risk class at a given level. This training procedure enables the ERF model to play a crucial role in risk simulations; by varying , researchers can evaluate how the decision boundary shifts across different data-uncertainty scenarios. For example, using will force the model to be more sensitive to the high-obesity category, which often exhibits greater data variance than the normal weight category. Through this systematic integration of bagging and asymmetric optimization mechanisms, the proposed ERF model not only achieves competitive classification accuracy but also provides a robust statistical framework for addressing the heteroscedasticity and asymmetry inherent in empirical obesity and cardiovascular risk data. Thus, the model effectively overcomes the limitations of standard machine learning methods in providing reliable multilevel classification that is robust to data noise.
To ensure the continuous expectile outputs are precisely mapped to the discrete obesity risk labels, the class-specific expectancy representation in Equation (10) is calculated as the arithmetic mean of the predicted expectiles for all training instances belonging to the class at a given level. This centroid-based calibration ensures that the decision boundaries are sensitive to the local variance of each risk category within the training set. When a predicted value is equidistant between two class centroids (a tie), the model uses a conservative tie-breaking rule that assigns the sample to the class with the higher ordinal rank, prioritizing the identification of higher health risks. This calibration procedure effectively transforms the regression-like flexibility of expectile learning into a robust classification framework while strictly preserving the ordinal hierarchy of obesity risks.
2.4. Data Description and Preprocessing
This research utilizes a comprehensive public empirical dataset specifically designed to evaluate and estimate obesity levels and cardiovascular disease (CVD) risk based on individuals’ dietary habits and underlying physical conditions. This dataset is openly accessible on the Kaggle repository and is characterized as semi-synthetic. While the initial data were based on empirical field surveys conducted with respondents in Mexico, Peru, and Colombia, the original researchers subsequently used computational tools to generate synthetic records. This augmentation was performed to ensure a balanced distribution across all seven obesity risk levels while preserving the core statistical characteristics and non-linear relationships found in the real-world survey responses. Acknowledging the semi-synthetic nature of the data is crucial for transparency, as it provides a structured environment for testing the robustness of classification models against heterogeneous variance. The geographic and demographic characteristics of this data provide a representative population with high variability in dietary habits and lifestyles, making it ideal for testing the robustness of classification models to data distributions with heterogeneous variance and the potential presence of outliers. This dataset contains 17 attributes and 2111 records. This dataset includes 16 independent variables (predictor features) and 1 dependent variable (classification target) that hierarchically represent a spectrum of health risks. In terms of dataset composition and transparency, it is important to disclose that the 2111 records consist of both empirical and synthetically generated data. Specifically, approximately 23% of the records were collected directly from users through a web platform based on field surveys. To address the inherent class imbalance found in the initial survey and ensure a robust multilevel classification, the remaining 77% of the records were generated synthetically. This augmentation process was conducted by the original dataset authors using the Weka tool and the Synthetic Minority Over-sampling Technique (SMOTE) filter.
The predictor features in this dataset can be classified into three main groups that describe a comprehensive profile of each individual. The first group is Demographic and Anthropometric Attributes, consisting of Age, Gender, Height, and Weight. The second group includes Dietary Habits indicators, formulated through dietary monitoring variables such as frequency of high-calorie food consumption (FAVC), frequency of daily vegetable consumption (FCVC), number of main meal portions per day (NCP), habit of snacking between meals (CAEC), daily water consumption (CH2O), and alcohol consumption (CALC). The third group measures Lifestyle & Physical Condition, extracted through variables such as smoking status (SMOKE), frequency of calorie-burning physical activity (FAF), duration of time spent using technological devices that promote a sedentary lifestyle (TUE), presence or absence of self-monitoring of calories (SCC), and the type of primary mode of transportation used daily (MTRANS), such as motorized vehicles, bicycles, or walking.
The dependent or target variable used in this modeling is “NObeyesdad”, which defines obesity risk labels. Given that this research uses a multilevel classification framework, the target variable is represented as an ordinal class representing the progression of health risks. The seven classes include: (1) Insufficient Weight, (2) Normal Weight, (3) Overweight Level I, (4) Overweight Level II, (5) Obesity Type I, (6) Obesity Type II, and (7) Obesity Type III. The ordinal multilevel nature of the data is the main justification for why the classical regression approach or a standard binary classifier is inadequate, requiring the implementation of an asymmetric expectile loss function-based separation to capture vulnerable boundary transitions within each risk class. Comprehensive descriptive statistics of the dataset utilized in this research are presented in Table 1 and Table 2.
Table 1.
Descriptive statistics of the numerical dataset.
Table 2.
Descriptive statistics of the categorical dataset.
To ensure the Expectile Random Forest (ERF) model optimally isolates feature patterns without being distorted by differences in data scale and type, a series of rigorous data preprocessing procedures is performed before training. First, an encoding transformation is applied to categorical features. Variables with binary nominal properties (such as Gender, FAVC, SMOKE, and SCC) are encoded using the representation. In contrast, multi-class categorical variables without levels (such as MTRANS) are encoded using One-Hot encoding. For categorical variables with ordinal or intrinsically ordered properties (such as consumption frequency in CAEC and CALC, which ranges from “Never” to “Always”), an ordered Label Encoding transformation is applied to preserve their numerical ordering. Second, considering that continuous numeric features have a highly skewed range of values—for example, Age ranges in the tens of years, inversely proportional to Height in decimal meters—a standardization procedure using Z-score Normalization was applied to the features (Age, Height, Weight, FCVC, NCP, CH2O, FAF, TUE). This standardization recenters the mean at zero and scales the variance to 1, so that the spatial distance metric derived from the expectile asymmetric loss function is not dominated by variables with large absolute values.
2.5. Experimental Design and Modeling Workflow
The experimental design and modeling workflow in this research were systematically designed to validate the robustness of the proposed Expectile Random Forest (ERF) model. As a core component of this research, the workflow comprises several critical stages, including preprocessing, iterative training, asymmetric sensitivity analysis, and comprehensive model comparison.
2.5.1. Modeling Steps
- Dataset Partitioning
The cleaned dataset, comprising 2111 records, was partitioned using a rigorous stratified V-fold cross-validation scheme with . This stratification approach guarantees that the original empirical proportions of the seven ordinal obesity risk classes are strictly preserved in both the training (80%) and testing (20%) folds. To completely prevent data leakage during this process, all continuous numerical transformations (e.g., Z-score Normalization) are fit only on the training fold and subsequently applied to the testing fold. Implementing this strict isolation strategy is crucial to avoid look-ahead bias, ensure robust generalization to unseen data, and prevent evaluation bias from local class imbalances.
- ERF Model Initialization
The ensemble architecture is built upon the asymmetric formulation outlined in Equations (5)–(9). Unlike standard random forests, the base decision trees in our model compute optimal feature splits by minimizing the Asymmetric Least Squares (ALS) loss function rather than conventional Gini impurity. To ensure algorithmic stability, the trees were trained in parallel using bootstrap aggregating (bagging) with random feature selection at each node. This mechanism maximizes inter-tree diversity and minimizes prediction variance, allowing the final aggregated model to produce robust probabilities across the multilevel risk spectrum.
- Performance Optimization and Evaluation
Because obesity risk classification involves a multilevel ordinal structure (), relying solely on overall Accuracy could obscure the model’s failure to identify extreme or minority classes. Therefore, the training optimization and primary evaluation were driven by the Macro F1-Score. This metric assigns equal weight to every obesity risk category regardless of its sample frequency, ensuring that the model is penalized equally for misclassifying extreme cases (e.g., Insufficient Weight or Obesity Type III) as it is for majority cases. This metric is formulated in Equation (11):
where and for each class , with representing True Positive, False Positive, and False Negative.
2.5.2. Sensitivity Analysis Procedure of Value
The expectile parameter () serves as the primary distributional control mechanism in this research. Its role was comprehensively investigated through a structured sensitivity experiment designed to measure the model’s stability response to asymmetric weighting.
- The Value Grid Determination
A discrete symmetric grid of values is defined as The step size of 0.2 is intentionally chosen to efficiently cover the full range of distributional asymmetry, from strong lower-tail emphasis (), through the median or mean-equivalent case (), to strong upper-tail emphasis (), without introducing unnecessary computational complexity. Although a finer grid (e.g., increments of 0.05 around the optimal region) could yield minor improvements in numerical precision, the selected specification is sufficient to capture meaningful structural changes in decision boundaries. Given that multilevel obesity risk modeling focuses on ordinal macro-class separation rather than small continuous variations, extensive hyper-tuning of is unlikely to alter the main conclusion of this study.
- Iterative Training
For every specific value , the entire ERF model was completely reinitialized and trained from scratch on the identical cross-validation folds. During this process, all other hyperparameters (e.g., maximum depth, number of estimators) were held strictly constant. This controlled isolation guarantees that any observed fluctuations in classification performance or boundary shifts are exclusively attributable to the expectile parameter adjustments.
- Risk Profile Recording
Beyond standard evaluation metrics, detailed confusion matrices and probabilistic scores were extracted for each iteration. The analysis systematically tracked decision boundary shifts in overlapping transitional categories (e.g., distinguishing Overweight Level II from Obesity Type I). Furthermore, the magnitude of misclassification was continuously monitored to evaluate the model’s ordinal consistency, ensuring that when prediction errors occur, they remain strictly limited to adjacent risk levels and thereby minimize the clinical risk of drastic misdiagnoses.
2.5.3. Hyperparameter Configuration Setup
To ensure a fair comparison between the proposed ERF model and competing machine learning algorithms (baseline models) such as Standard Random Forest (RF), eXtreme Gradient Boosting (XGBoost), and Support Vector Machine (SVM), hyperparameter tuning was performed using Grid Search CV. The details of the experimental parameter settings are shown in Table 3.
Table 3.
Hyperparameter configuration for ERF modeling and competing algorithms.
Through the experimental design outlined in Table 3, this research not only validates the algorithm’s capabilities in general but also specifically tests how a modified asymmetric expectancy function outperforms traditional heuristic frameworks in mapping complex obesity risk hierarchies. The experimental setup was implemented using Python 3.11.9, the Scikit-learn and XGBoost libraries, on a system equipped with a 12th Gen Intel® Core™ i7-12700H processor and 24 GB of RAM. All models were trained using a standardized 5-fold cross-validation scheme to ensure consistency in performance reporting. In terms of computational cost, the proposed ERF model requires training time that is not much different from that of the Standard Random Forest, despite additional optimization of the Asymmetric Least Squares (ALS) loss function for each tree split. However, it remains significantly more efficient than complex deep learning architectures and is highly suitable for real-time medical decision-support systems. It is important to note that the current experimental design intentionally focuses on the sensitivity analysis of the expectile parameter () as the primary distributional control instrument. Consequently, to isolate and clearly evaluate the specific role of expectile learning in mapping complex health risk transitions, other hyperparameters—such as forest density and maximum tree depth—were constrained to standardized optimal values across all compared models. This controlled approach ensures that any observed performance gains are strictly attributed to the model’s robust handling of data asymmetry rather than exhaustive hyperparameter tuning.
In terms of computational complexity, the ERF model introduces an additional overhead compared to the standard Random Forest. While the overall tree construction follows the complexity, the estimation of the expectile at each node split requires an iterative numerical solution, typically via Iteratively Reweighted Least Squares (IRLS). This process adds a constant factor to the training time, which in this study resulted in a runtime approximately 1.8 times longer than the baseline RF. However, this complexity remains significantly lower than that of deep learning architectures (e.g., LSTM or GRU) and is considered a viable trade-off for the gains in predictive robustness and ordinal consistency, especially for offline clinical model training.
To provide a clear visualization of the research process, the overall methodology is illustrated in Figure 1. This workflow diagram outlines the end-to-end process of the research, encompassing data preprocessing, the integration of the asymmetric loss function into the ensemble architecture, the node-splitting optimization mechanism, and the systematic sensitivity analysis of the expectile parameter.
Figure 1.
The overall research workflow diagram of the Expectile Random Forest (ERF) model. The process highlights the integration of the Asymmetric Least Squares (ALS) loss function () and the expectile-based node splitting criteria () for multilevel obesity risk classification.
3. Results
3.1. Sensitivity Analysis of Expected Parameters ()
To evaluate the role and effectiveness of the asymmetric quadratic learning mechanism within the Expectile Random Forest (ERF) framework, a systematic sensitivity analysis was performed on the expectile parameter (). The value acts as an asymmetric equalizer that controls the penalty level against prediction deviation; the value assumes a symmetric error distribution, while the and ranges progressively provide more aggressive weighting towards the lower and upper bounds of the feature data distribution. Simulations were performed by training and revalidating the ERF model using the hyperparameter network. The aggregate performance of each iteration was measured using the Macro F1-Score metric to ensure that accuracy fluctuations in both minority and extreme classes are fairly captured.
The sensitivity analysis results presented in Figure 2 show a non-linear performance fluctuation pattern that is highly responsive to changes in the value. In the lower extreme asymmetric configurations ( and ), the model’s Macro F1-Score performance recorded suboptimal results, at 82.4% and 86.5%, respectively. This decrease indicates that overly sensitive weighting of the lowest-value observations (such as low-calorie features in underweight individuals) actually distorts the decision tree’s ability to capture patterns in the high-level obesity class. When the model was evaluated under the mean absolute symmetric condition (), the model’s performance significantly improved to 90.2%. The stable performance on confirms the fundamental feasibility of the Random Forest architecture, which can adapt well to the centroids of general distributions.
Figure 2.
Sensitivity analysis curve showing the trend of changes in Macro F1-Score and overall Accuracy as the expected parameter value () varies from to . The peak of the curve indicates optimal model performance.
The most crucial finding from this simulation occurs when the parameter is shifted towards the upper asymmetry. The highest performance point is achieved at the parameter, where the Macro F1-Score peaks at 94.5%, or a relative increase of 4.3% compared to the symmetric configuration. At this level, the Asymmetric Least Squares (ALS) loss function imposes a greater penalty on samples that fall below the predicted estimate (the right tail of the distribution), which clinically closely resembles a group of individuals with unusual lifestyle variables (e.g., extremely high-calorie food consumption frequency without physical activity). This asymmetric weighting forces the ERF model to be more careful in partitioning frequently overlapping boundary classes, such as moving from Overweight Level II to Obesity Type I.
However, continued optimization until it reached the upper extreme limit () proved counterproductive, with the Macro F1-Score performance dropping back to 89.1%. This condition confirmed the phenomenon of over-penalization, in which the model becomes highly biased in its attempt to accommodate upper-weight outliers, thereby compromising classification accuracy in both normal-weight and underweight populations. Based on the empirical pattern from this asymmetric sensitivity simulation, the value was determined to be the optimal configuration. This hyperparameter value is formally implemented into the ERF model for detailed multilevel classification evaluation and subsequent comparative testing.
3.2. Performance Evaluation of Optimal Parameter-Based Multilevel Classification
Based on the results of the previous sensitivity analysis, the expected parameter was adopted as the optimal Expectile Random Forest (ERF) model configuration for multilevel obesity risk classification. The use of the value offers advantages for handling asymmetric data variance in a dataset of 2111 respondents, where the class distributions are relatively balanced. However, overlapping feature characteristics occur in the transitional categories. The final evaluation of the ERF model at this optimal level shows a significant increase in predictive stability across the health risk spectrum. Table 4 presents details of the classification performance for the seven risk categories, including Precision, Recall, and F1-Score metrics calculated from testing on unseen data.
Table 4.
Multilevel classification performance of the ERF model on optimal parameters ().
Data analysis in Table 4 shows that implementing expectancy learning with successfully improved classification performance evenly, with a Macro F1-Score of 94.5%. The Obesity Type III category showed near-perfect performance, with an F1-Score of 99.5%, indicating that the ERF model is highly robust at identifying extreme risk profiles across the 324 samples in that category. This success was followed by the Obesity Type II (98.1%) and Insufficient Weight (96.8%) categories. Most notable among these results is improved performance in previously critical intermediate classes, such as Overweight Level I and Overweight Level II, which each achieved an F1-Score above 90.0%. This demonstrates that asymmetric weighting in effectively sharpens the decision boundary in the transition region between normal weight and early obesity.
The robustness of the ERF model to outliers is explicitly demonstrated through its performance in the extreme tail categories—Insufficient Weight and Obesity Type III—which represent the most significant deviations in the dataset’s BMI distribution. At the optimal , the model achieved an exceptional F1-Score of 94.5% and 99.5% for these respective classes, significantly outperforming standard mean-based models, which often struggle with the high variance in these groups. Furthermore, the Mean Absolute Error (MAE) of 0.07 serves as a key robustness metric; it quantifies that even when the model encounters extreme lifestyle or anthropometric outliers, its predictions remain ordinally consistent, with errors strictly confined to adjacent risk levels. This empirical evidence confirms that the expectile-based splitting mechanism effectively isolates the influence of outliers, preventing the drastic misclassifications that typically compromise the reliability of conventional algorithms.
Despite the model’s highly competitive performance, the Normal Weight category remains the most difficult to classify, with an F1-Score of 89.6%. This lower metric compared to other classes is due to the model’s tendency to misclassify some normal weight samples into the Insufficient Weight or Overweight Level I categories. This phenomenon can be visually observed through the confusion matrix generated by the optimal model.
The visualization in Figure 3 presents the confusion matrix of an Expectile Random Forest (ERF) model optimized with parameters to classify 2111 obesity-risk samples. Overall, the elements along the main diagonal demonstrate a very high level of predictive success, with the model identifying the majority of respondents at each risk level with sharp Precision. The model’s robustness is most evident in the extreme risk categories, particularly Obesity Type III, which recorded 322 correct predictions out of 324 samples, and Insufficient Weight, with 265 correct predictions out of 272 samples. The model’s success in isolating these tail categories demonstrates that the asymmetric weighting in provides appropriate sensitivity to recognizing deterministic patterns of physical features in both very low- and very high-weight groups.
Figure 3.
Confusion matrix for the classification of 2111 obesity risk samples using the ERF model with optimal parameters . The distribution on the main diagonal indicates high accuracy in each class, while the off-diagonal distribution indicates error minimization in the transitional category.
Further analysis of the distribution of classification errors (elements outside the main diagonal) reveals that the model’s predictive characteristics are highly stable and ordinally consistent. The prediction errors were marginal and largely confined to cells immediately adjacent to the actual category. For example, in the Normal Weight category, which included 287 samples, 15 were misclassified as Insufficient Weight and 16 as Overweight Level I. A similar pattern was observed for the Overweight Level II and Obesity Type I categories, in which the residual error shifted by only one level up or down the risk hierarchy. These characteristics indicate that the ERF model has a sound understanding of the health risk continuum; the model never produced drastic misclassifications (e.g., predicting Normal Weight individuals as Obesity Type III), which is crucial in clinical applications to avoid fatal misdiagnosis.
The degree of fragmentation of predictions in the transition zone, particularly between Overweight Level I and Normal Weight, reflects the natural overlap in lifestyle features such as physical activity frequency and diet between the two groups. Nevertheless, the concentration of numbers on the main diagonal for these transition classes remains above 89%, confirming that the Asymmetric Least Squares loss function on the parameter successfully provides a robust decision boundary. By minimizing the propagation of errors across non-ordinal categories, this model demonstrates its ability to map the obesity risk hierarchy precisely and systematically. These results provide confidence that the ERF model, in its optimal configuration, is not only mathematically accurate in handling 2111 samples but also highly reliable for use as a medical decision-support system in multilevel obesity assessment.
3.3. Performance Comparison with Other Machine Learning Models
The final stage of the experimental evaluation in this research involved comparative testing between the proposed Expectile Random Forest (ERF) model at optimal parameters of and several advanced (state-of-the-art) machine learning algorithms. The purpose of this comparison was to determine whether integrating asymmetric learning mechanisms provides significant advantages over mean-based models for classifying multilevel obesity risk. All models were trained and tested on the same dataset of 2111 respondents, using a 5-fold Cross-Validation scheme to ensure the objectivity of the results. The algorithms used for comparison include Standard Random Forest (RF), eXtreme Gradient Boosting (XGBoost), Support Vector Machine (SVM) with RBF kernel, and Logistic Regression (LR). Table 5 summarizes the main performance metrics, including overall Accuracy, Macro F1-Score, and Mean Absolute Error (MAE) as indicators of predictive accuracy on the ordinal scale of obesity risk.
Table 5.
Performance comparison of the ERF model () with other machine learning algorithms.
Based on the results presented in Table 5, the proposed ERF model consistently outperformed all competing models across all evaluation metrics, not only in terms of central tendency but also in predictive stability. By analyzing the standard deviations across the 5-fold cross-validation, the ERF model recorded an Accuracy of 94.6% (±0.7) and a Macro F1-Score of 94.5% (±0.7). This very tight standard deviation demonstrates that the ERF model’s performance is highly stable and robust across data folds. In comparison, the conventional Standard Random Forest exhibited lower performance and higher variance (Accuracy 90.7% ± 0.9), and statistical testing confirms this difference is highly significant (p < 0.001). This proves that integrating the Asymmetric Least Squares (ALS) loss function is fundamentally more effective in handling heteroscedasticity than the standard mean-based Gini impurity function. Furthermore, the ERF model recorded the lowest Mean Absolute Error (MAE) value of 0.07, indicating that prediction errors are practically confined within one ordinal level of the actual target class.
To ensure the reliability of the reported performance, the potential for overfitting was rigorously evaluated by monitoring the variance across cross-validation folds. The narrow gap between the training and testing metrics, as evidenced by the low standard deviation (±0.7% for Accuracy), indicates that the ERF model maintains high generalization capability despite the relatively small dataset. Furthermore, while traditional classification baselines are used for comparative analysis, the ERF model itself constitutes an ordinal-specific evolution of the random forest architecture. By utilizing the expectile-based distance mapping in Equation (10), the model inherently respects the ordinal hierarchy of obesity risks (), providing a more mathematically appropriate framework for ordered health data than standard multiclass classifiers. This combination of high stability and ordinal sensitivity confirms that the model’s superiority is not an artifact of overfitting but a result of its robust architectural design.
Although XGBoost demonstrated very competitive performance with an average Accuracy of 92.8% (±1.2), the wider standard deviation suggests it is slightly more sensitive to variations in outlier distributions across folds than the proposed method. Statistical testing further reveals that the ERF model’s superiority over XGBoost remains statistically significant (p = 0.012). This highlights that the ERF’s dynamic expectancy approach provides mathematically verifiable robustness. The SVM and Logistic Regression algorithms performed significantly lower (p < 0.001) and with the highest cross-validation variances, confirming their limitations in modeling complex non-linear feature relationships across the seven obesity risk classes.
Overall, the comparison results in Figure 4 demonstrate that the Expectile Random Forest framework, with appropriately tuned parameters, provides a superior solution for multilevel risk classification problems. The model’s ability to balance bias and variance through an asymmetric mechanism makes it a highly reliable predictive tool for health data with irregular distributions. The performance advantages achieved over established models, such as XGBoost and Standard RF, position ERF as a significant methodological contribution in the field of bioinformatics and intelligent decision support systems for global obesity risk analysis.
Figure 4.
Comparative bar graph showing the Macro F1-Score and Accuracy performance of the five tested machine learning models. The ERF () model consistently performs as the most precise and robust model for multilevel obesity risk classification.
3.4. Feature Importance Analysis
To provide a deeper understanding of the most influential factors in multilevel obesity risk classification, this research conducted a feature importance analysis using the Expectile Random Forest (ERF) model with optimal parameters (). Unlike the standard Random Forest feature importance method, which uses the Gini-based Mean Decrease in Impurity (MDI), the analysis in this ERF model is based on the total reduction in the Asymmetric Least Squares (ALS) loss function produced by each feature during node splitting throughout the decision tree. This approach provides a more accurate estimate of the variable’s contribution to the asymmetric risk structure by explicitly accounting for the tail variance in the data distribution. Table 6 presents the rankings and relative contribution values of all 16 predictor features used in this modeling.
Table 6.
Distribution of feature importance scores in the optimal ERF model ().
Based on the data in Table 6, the variable “Weight” emerged as the most dominant predictor, accounting for 28.45%. This finding makes clinical sense, as weight is the primary physical indicator directly correlated with body mass index (BMI) classification in the formation of the obesity risk hierarchy. Age (14.20%) and Height (11.55%) ranked second and third, respectively, indicating that an individual’s baseline anthropometric profile plays a crucial role in determining risk categories in the multilevel model. Interestingly, the variable “family health history” (family_history_with_overweight) ranked fourth (9.80%), confirming a strong genetic or household environmental component in the triggering of obesity risk among respondents.
In addition to physical and genetic factors, lifestyle variables also significantly influenced the ERF model’s decision-making process. Vegetable consumption (FCVC) and physical activity (FAF) accounted for 14.55% combined, demonstrating that dietary habits and body metabolism are determinants in distinguishing between Overweight and Obesity Type I categories. Sedentary behavior variables, such as technology usage time (TUE) and snacking habits (CAEC), also had a greater influence than smoking or alcohol consumption variables. SMOKE and SCC variables had the lowest contribution, indicating that these features have low variance or lack strong discriminatory power in the seven-level risk classification structure in this dataset. Visually, the distribution of feature importance is shown in Figure 5, which illustrates the dominance of physical features and the significant contribution of healthy lifestyle variables.
Figure 5.
Feature importance plot generated by the ERF model (). This graph shows the order of variables from most to least influential on multilevel obesity risk classification decisions.
The results of this analysis provide important insights for public health policy development. The dominance of dietary habits and physical activity variables in the ERF model indicates that lifestyle interventions remain key for mitigating obesity risk. Furthermore, the ERF model’s ability to extract feature importance through an asymmetric expectancy lens ensures that features contributing to extreme risk (such as type III obesity) receive equal attention during decision tree splitting. Overall, this feature importance analysis not only statistically validates the model’s reliability but also provides healthcare practitioners with meaningful interpretations of the key drivers of the multilevel obesity crisis.
3.5. Model Interpretability with SHAP (SHapley Additive exPlanations)
To move beyond global importance metrics and provide a more granular understanding of how specific features drive obesity risk predictions, this study implements SHAP (Shapley Additive exPlanations). While traditional feature importance rankings quantify the contribution of variables to the overall model performance, they often fail to illustrate the directionality or the specific nature of feature influences across individual observations. SHAP addresses this limitation by utilizing a game-theoretic approach to assign each feature an importance value for a particular prediction, thereby offering both global transparency and local interpretability. The results of this analysis are visualized in Figure 6, which provides a comprehensive overview of how individual lifestyle and anthropometric attributes shift the model’s output across the multilevel health risk continuum.
Figure 6.
Explainability analysis of the Expectile Random Forest (ERF) model using SHAP (SHapley Additive exPlanations): (a) SHAP summary plot illustrating the distribution and directionality of feature impacts on model output; (b) Global feature importance ranking based on the mean absolute SHAP values. All abbreviations contained in the figures have been explained at the end of the manuscript, specifically in the “Abbreviations” section.
Figure 6a displays the SHAP summary plot, where each dot represents a specific data instance, and the color gradient indicates the feature value from low (blue) to high (red). A clear and clinically consistent directional pattern emerges for anthropometric attributes; high values of weight, age, height, and a positive family history of obesity consistently yield positive SHAP values, thereby directly increasing the predicted obesity risk score. Conversely, the model effectively captures the protective influence of healthy lifestyle behaviors through their inverse relationship with the output. Higher frequencies of vegetable consumption (FCVC) and physical activity (FAF) are characterized by red dots clustering significantly on the negative side of the SHAP axis, indicating that these factors systematically lower the predicted risk. Furthermore, sedentary habits represented by time spent using technological devices (TUE) and the frequent consumption of high-calorie food (FAVC) exhibit a positive correlation with risk advancement, where higher values contribute to an increased risk score.
The global impact magnitude of these features is further quantified in Figure 6b, which ranks the variables based on their mean absolute SHAP values across all instances. Body weight is identified as the most deterministic driver within the ERF model’s logic, exerting an average impact magnitude of approximately 0.23, which is nearly double that of secondary predictors such as age and height. This ranking reinforces the findings from the previous feature importance analysis while providing a more robust measure of the average impact on the model’s output magnitude. The minimal SHAP values observed for variables such as smoking status and self-monitoring of calories (SCC) suggest that while these factors are integrated into the multi-dimensional risk profile, they exert the least influence on the final classification decision. Ultimately, the SHAP visualizations confirm that the ERF model’s decision-making process is not only mathematically robust but also aligns precisely with established medical paradigms regarding metabolic health determinants.
4. Discussion
The interpretation of the experimental results in this research provides in-depth insights into the effectiveness of integrating expectancy learning into the Random Forest architecture for multilevel obesity risk classification. Key findings indicate that the Expectile Random Forest (ERF) model with the optimal parameter can achieve higher accuracy and stability than conventional machine learning models. This superiority stems from the ability of the Asymmetric Least Squares (ALS) loss function to handle the characteristics of health datasets, which often exhibit asymmetric distributions and high heteroscedasticity. In the context of the 2111 samples analyzed, the parameter serves as a tuning parameter, imposing a greater penalty on deviations to the right of the distribution (high risk). This technically strengthens the decision boundary in categories that often overlap, such as Overweight Level II and Obesity Type I.
By shifting the model’s focus from simply estimating the mean (mean-based) to one that is sensitive to the distribution’s tail variance, the ERF model successfully minimizes misclassification in the extreme-risk group without sacrificing accuracy in the normal-weight group. The reliability of the ERF model is further demonstrated by comparison with other state-of-the-art algorithms, such as XGBoost and Standard Random Forest. While XGBoost is known for its robustness in iteratively minimizing residuals, it remains susceptible to outliers in nonlinear lifestyle features. In contrast, the proposed ERF model achieved a Macro F1-Score of 94.5%, outperforming both XGBoost and standard RF. This phenomenon indicates that, in multilevel ordinal classification problems, modeling the data’s variance structure via expectation is far more robust than simply minimizing Gini impurity or entropy. The predicted errors generated by the ERF also exhibit a consistent “ordinality” pattern, where the most mistakes are only one level off from the true target class. This is crucial in practical medical applications: a decision support system that is only “slightly off” is much more acceptable to healthcare practitioners than one that produces drastic misclassifications, as the risk of fatal misdiagnosis is minimized. To contextualize the methodological contribution of this research, it is essential to compare our findings with prior research on obesity risk classification. Existing studies employing conventional machine learning approaches, such as Random Forest (RF), Support Vector Machines (SVM), and neural networks, have been widely applied to healthcare classification tasks. Recent systematic reviews indicate that these models remain among the most frequently used techniques in medical prediction problems, particularly for disease classification and risk stratification tasks [38,39]. Reported performance in healthcare applications commonly ranges from 85% to 92%, though this varies with dataset complexity, feature quality, and class imbalance [38]. However, these conventional approaches often struggle in high-risk or transitional categories due to their reliance on symmetric loss functions and global decision boundaries, which limit their ability to model distributional asymmetry in clinical data [40].
From a feature importance perspective, the dominance of Weight, Age, and Height as primary predictors confirms that basic anthropometric profiles remain the strongest foundation for assessing obesity levels. However, the significant contributions of family health history and lifestyle variables, such as frequency of vegetable consumption (FCVC) and physical activity (FAF), add a new dimension to risk modeling. The high ranking of family history in feature importance suggests a strong interaction between genetic factors and household lifestyle in triggering obesity. The finding that sedentary behavior variables, such as time spent using technology (TUE), have a greater influence than smoking status or alcohol consumption in this dataset reflects the shifting health challenges of the digital age, particularly in the Latin American population studied. The ERF model effectively captures that the transition from Overweight to Obesity is often driven by a combination of age and decreased physical activity. This pattern is more precisely captured through the lens of asymmetric expectancy.
Although the ERF model demonstrates superior performance, several aspects of its practical implementation require attention. The process of finding the optimal value through sensitivity analysis requires a slightly higher computational load than standard models, as it requires retraining at multiple levels of the expectancy grid. Furthermore, the use of cross-sectional secondary data limits the model’s ability to capture longitudinal changes in individual risk. However, with an Accuracy of 94.6%, these computational limitations are offset by significantly stronger prediction reliability. The practical implications of this research are broad; the ERF model can be integrated into digital health platforms as an objective early screening tool, helping clinicians identify individuals at critical thresholds for a transition in obesity risk. Overall, this research demonstrates that expectancy learning approaches are not merely theoretical alternatives but robust methodological solutions for improving Precision in intelligent classification systems for global health risk management.
Beyond its statistical performance, the ERF model has important clinical implications for the real-world management of metabolic health. Its strong ordinal consistency, where any misclassification is constrained to adjacent risk levels, provides a practical safety mechanism for clinicians by reducing the risk of severe misclassification, such as incorrectly assigning a high-risk patient (e.g., Obesity Type III) to a low-risk category. In a clinical setting, this model can function as an automated triage tool, allowing healthcare providers to prioritize intensive interventions for individuals at critical transition points, such as those moving from Overweight Level II to Obesity Type I, where the ERF model demonstrated superior sensitivity. Furthermore, the dominance of easily measurable anthropometric and lifestyle features in our importance analysis suggests that this system can be deployed in resource-limited primary care settings where expensive diagnostic equipment is unavailable. By integrating this model into digital health platforms, practitioners can shift from reactive treatments to proactive, personalized prevention strategies, utilizing the model’s ability to interpret ‘edge cases’ or outliers that are typically overlooked by standardized BMI-based guidelines. Ultimately, this approach empowers a more nuanced clinical decision-making process that accounts for individual variability in lifestyle and genetic predisposition, directly addressing the complexities of the global obesity crisis.
Despite the superior performance of the Expectile Random Forest (ERF) model in this research, several strategic directions for future research could further expand the capabilities of this obesity risk classification system. First, future research should explore the use of longitudinal datasets rather than cross-sectional data. With data capturing an individual’s weight progression over time, expectancy models can be developed to predict future health risk trajectories, enabling preventive medical interventions before an individual actually enters the advanced obesity category. Second, the computational efficiency of parameter determination can be improved by developing an AutoML-based automatic optimization mechanism or intelligent heuristic algorithms that dynamically adjust expectancy values based on feature variance characteristics, without requiring intensive manual grid searches. Third, integrating advanced Explainable AI (XAI) methods, such as LIME (Local Interpretable Model-agnostic Explanations), specifically tailored to asymmetric loss functions, would be a valuable contribution to increasing model transparency for clinical practitioners. A deeper explanation of why the model assigns specific weights to different levels will help clinicians understand the logic behind risk assessment in marginal cases. Fourth, external validation in broader global populations—especially in Asia and Europe, which have different dietary profiles and genetic makeup than Latin American populations—is essential to test the generalizability of the ERF model. Finally, this expectancy learning framework also has great potential to be extended to more complex Deep Learning or Gradient Boosting architectures to handle multisensory health data from wearable devices. Through continued development in these directions, expectancy-based learning approaches are expected to transform into the new gold standard in intelligent classification systems for precision risk management of metabolic and cardiovascular diseases.
In addition, this research provides a significant methodological contribution; several limitations must be acknowledged to provide a balanced perspective on the findings. First, the dataset size of 2111 records, although sufficient for robust training and validation, remains relatively small compared to the massive longitudinal health databases available in some clinical domains, which may limit the model’s ability to capture extremely rare lifestyle variations. Second, there is a notable geographic and demographic bias, as the empirical data are predominantly sourced from Latin American countries, potentially limiting the direct generalizability of the decision boundaries to populations with different genetic baselines or cultural dietary habits. Finally, the computational cost of the ERF model is inherently higher than that of standard ensemble methods. The integration of the Asymmetric Least Squares (ALS) loss function at each node split requires more intensive calculations, resulting in longer training runtimes compared to mean-based models. Although this additional cost is manageable for the current application, it should be carefully considered when scaling the model to much larger datasets or real-time streaming environments. A critical limitation of this study that warrants emphasis is the absence of external validation on a purely independent, non-synthetic real-world clinical dataset. While using a semi-synthetic dataset enabled a balanced evaluation of the ERF framework across seven risk levels, it may not fully capture the irregular noise and missing-data patterns observed in raw clinical environments. The performance metrics reported, although statistically significant within the current experimental setup, should be interpreted as a proof-of-concept for the model’s architectural robustness. Future work must focus on testing the generalizability of these findings using independent medical records from diverse geographic regions to confirm that the ALS-based decision boundaries remain valid across different healthcare systems and population baselines. Consequently, while the methodological framework of expectile learning is highly portable and theoretically sound, the specific decision boundaries identified in this study may shift when applied to populations with diverse metabolic baselines. To address this constraint, future research must prioritize cross-population validation and the integration of multi-center longitudinal data to refine the model’s robustness further and ensure its reliability as a universal clinical tool for obesity risk assessment.
5. Conclusions
This research has successfully developed and validated a robust Expectile Random Forest (ERF) model for multilevel classification of obesity risk. By integrating the Asymmetric Least Squares (ALS) loss function into an ensemble architecture, the proposed model overcomes the limitations of conventional machine learning algorithms in handling asymmetric health data distributions and high heteroscedasticity. Experimental results on an empirical dataset of 2111 respondents demonstrate that the expectile parameter plays a crucial role as a distribution control instrument. Sensitivity analysis consistently confirms that the value provides the most optimal configuration, effectively strengthening the decision boundary in high-risk categories through precise asymmetric weighting.
Quantitatively, the ERF model with optimal parameters achieves highly competitive performance with an overall Accuracy of 94.6 ± 0.7% and a Macro F1-Score of 94.5 ± 0.7%. This performance significantly outperforms other state-of-the-art algorithms, including eXtreme Gradient Boosting (XGBoost) with an Accuracy of 92.8% and Standard Random Forest with an Accuracy of 90.7 ± 0.9%. The superiority of the ERF model is also reflected in the lowest MAE value of 0.07, demonstrating that the model’s prediction error remains within a reasonable risk ordinality range. Further feature importance analysis revealed that, in addition to basic anthropometric variables such as weight and height, family history and sedentary lifestyle factors are key drivers of the obesity risk hierarchy, which the model accurately identified through an expectancy-learning lens.
The key contribution of this research is an intelligent classification framework that is not only statistically accurate but also robust to outliers, which often obscure diagnosis in real-world clinical data. These findings have important implications for the development of medical decision support systems, where the ERF model can serve as a reliable digital screening tool for early identification of obesity risk levels. However, further exploration of longitudinal data and automation of the parameter tuning remain important agendas for future research. In conclusion, the expectancy-based learning approach proposed in this research proves to be a robust methodological solution for advancing artificial intelligence for precision risk management of metabolic and cardiovascular diseases globally.
While this study establishes a robust methodological foundation for obesity risk classification, certain limitations persist, primarily regarding the semi-synthetic nature of the dataset and its geographical focus on Latin American populations. To address these constraints, future research should prioritize external validation across broader global demographics and the integration of longitudinal datasets to capture individual weight trajectories over time. Furthermore, exploring automated hyperparameter optimization for the expectile parameter () and developing specialized advanced explainable AI (XAI) frameworks tailored for asymmetric learning could further enhance the clinical transparency and scalability of the ERF model. These advancements will be critical in transitioning this framework from a validated research model into a globally applicable clinical decision-support tool.
Author Contributions
Conceptualization, W.H.S. and S.J.A.; methodology, W.H.S.; software, W.H.S.; validation, W.H.S. and S.J.A.; formal analysis, S.J.A.; data curation, S.J.A.; writing—original draft preparation, W.H.S. and S.J.A.; writing—review and editing, W.H.S.; visualization, W.H.S.; supervision, W.H.S. All authors have read and agreed to the published version of the manuscript.
Funding
This research was funded by the Mandiri scheme of Bina Nusantara University. The Article Processing Charge (APC) of this publication/research is funded by the Indonesian Endowment Fund for Education (LPDP), Ministry of Finance of Indonesia, for funding this research publication.
Institutional Review Board Statement
Not applicable.
Informed Consent Statement
Not applicable.
Data Availability Statement
The dataset used in this research is publicly available and can be accessed from the Kaggle repository titled “Obesity or CVD Risk (Classify/Regressor/Cluster)” at the following link: https://www.kaggle.com/datasets/aravindpcoder/obesity-or-cvd-risk-classifyregressorcluster (accessed on 20 January 2026). This dataset consists of 2111 observations with 17 features related to demographic characteristics, dietary habits, physical activity, and lifestyle factors associated with obesity risk. All data has been anonymized and provided under a Creative Commons license by the dataset authors. Because this dataset is publicly accessible, no additional data was generated or collected for this research. To ensure the scientific reproducibility of the findings in this study, all critical hyperparameter configurations, random seeds, and experimental settings have been meticulously detailed within the Section 2 (Section 2.5), Table 1 and Table 2. Furthermore, the source code, pre-trained model weights, and supplemental documentation for the Expectile Random Forest (ERF) architecture are available upon request.
Conflicts of Interest
The authors declare no conflicts of interest.
Abbreviations
The following abbreviations are used in this manuscript:
| RF | Random Forest |
| ERF | Expectile Random Forest |
| ALS | Asymmetric Least Squares |
| XGBoost | eXtreme Gradient Boosting |
| SVM | Support Vector Machine |
| XAI | Explainable AI |
| SHAP | SHapley Additive exPlanations |
| MAE | Mean Absolute Error |
| MDI | Mean Decrease in Impurity |
| CVD | Cardiovascular Disease |
| BMI | Body Mass Index |
| FAVC | Frequent consumption of high-calorie food |
| FCVC | Frequency of consumption of vegetables |
| NCP | Number of main meals |
| CAEC | Consumption of food between meals |
| CH2O | Consumption of water daily |
| CALC | Consumption of alcohol |
| SCC | Calorie consumption monitoring |
| FAF | Physical activity frequency |
| TUE | Time using technology devices |
| MTRANS | Transportation used |
References
- Albala, C.; Vio, F. Obesity and Diabetes in Latin America: The Impact of Socioeconomic Status on Programs and Outcomes. In Global Challenges in Cardiovascular Prevention in Populations with Low Socioeconomic Status; Romero, T., Nazal, C.N., Lanas, F., Eds.; Springer: Cham, Switzerland, 2025. [Google Scholar]
- Ferreira, S.R.G.; Macotela, Y.; Velloso, L.A.; Mori, M.A. Determinants of obesity in Latin America. Nat. Metab. 2024, 6, 409–432. [Google Scholar] [CrossRef] [Scilit]
- Blueher, M. An overview of obesity-related complications: The epidemiological evidence linking body weight and other markers of obesity to adverse health outcomes. Diabetes Obes. Metab. 2025, 27, 3–19. [Google Scholar]
- Kwok, C.S.; Phillips, A.; Mukherjee, S.; Patel, M.G.; Hanif, W. Missed opportunities in type 2 diabetes mellitus: A narrative review. Curr. Diabetes Rev. 2024, 20, 111–117. [Google Scholar] [CrossRef] [Scilit] [PubMed]
- Sorn, V.; Suon, M.; Chea, S. Recent trends of non-communicable diseases in Cambodia: A narrative review of challenges, risk factors, and public health strategies. Front. Public Health 2026, 14, 1799131. [Google Scholar] [CrossRef] [Scilit] [PubMed]
- Wu, Y.; Li, D.; Vermund, S.H. Advantages and Limitations of the Body Mass Index (BMI) to Assess Adult Obesity. Int. J. Environ. Res. Public Health 2024, 21, 757. [Google Scholar] [CrossRef] [Scilit] [PubMed]
- King, C.; Strumpf, E. Applying random forest in a health administrative data context: A conceptual guide. Health Serv. Outcomes Res. Methodol. 2022, 22, 96–117. [Google Scholar]
- Guido, R.; Ferrisi, S.; Lofaro, D.; Conforti, D. An overview on the advancements of support vector machine models in healthcare applications: A review. Information 2024, 15, 235. [Google Scholar] [CrossRef] [Scilit]
- Alkhammash, E.H.; Hadjouni, M.; Elshewey, A.M. A hybrid ensemble stacking model for gender voice recognition approach. Electronics 2022, 11, 1750. [Google Scholar] [CrossRef] [Scilit]
- Elshewey, A.M.; Shams, M.Y.; Tarek, Z.; Megahed, M.; El-Kenawy, E.S.M.; El-Dosuky, M.A. Weight Prediction Using the Hybrid Stacked-LSTM Food Selection Model. Comput. Syst. Sci. Eng. 2023, 46, 765–781. [Google Scholar] [CrossRef] [Scilit]
- Tarek, Z.; Shams, M.Y.; Towfek, S.K.; Alkahtani, H.K.; Ibrahim, A.; Abdelhamid, A.A.; Eid, M.M.; Khodadadi, N.; Abualigah, L.; Khafaga, D.S.; et al. An optimized model based on deep learning and gated recurrent unit for COVID-19 death prediction. Biomimetics 2023, 8, 552. [Google Scholar] [CrossRef] [Scilit] [PubMed]
- Shams, M.Y.; Tarek, Z.; Elshewey, A.M. A novel RFE-GRU model for diabetes classification using PIMA Indian dataset. Sci. Rep. 2025, 15, 982. [Google Scholar] [CrossRef] [Scilit] [PubMed]
- Wassan, S.; Suhail, B.; Mubeen, R.; Raj, B.; Agarwal, U.; Khatri, E.; Gopinathan, S.; Dhiman, G. Gradient boosting for health IoT federated learning. Sustainability 2022, 14, 16842. [Google Scholar] [CrossRef] [Scilit]
- Elshewey, A.M. Enhancing crop yield prediction based on dove optimization algorithm and gradient boosting model. Signal Image Video Process. 2025, 19, 951. [Google Scholar] [CrossRef] [Scilit]
- Breiman, L. Random forests. Mach. Learn. 2001, 45, 5–32. [Google Scholar] [CrossRef] [Scilit]
- Kunapuli, G. Ensemble Methods for Machine Learning; Simon and Schuster: New York, NY, USA, 2023. [Google Scholar]
- Mahajan, P.; Uddin, S.; Hajati, F.; Moni, M.A.; Gide, E. A comparative evaluation of machine learning ensemble approaches for disease prediction using multiple datasets. Health Technol. 2024, 14, 597–613. [Google Scholar] [CrossRef] [Scilit]
- Khalilia, M.; Chakraborty, S.; Popescu, M. Predicting disease risks from highly imbalanced data using random forest. BMC Med. Inform. Decis. Mak. 2011, 11, 51. [Google Scholar] [CrossRef] [Scilit] [PubMed]
- Jackins, V.; Vimal, S.; Kaliappan, M.; Lee, M.Y. AI-based smart prediction of clinical disease using random forest classifier and Naive Bayes. J. Supercomput. 2021, 77, 5198–5219. [Google Scholar]
- Saha, R.; Saif, S.; Khan, T.; Alabdultif, A. A critical systematic review of ensemble learning methods for predictive healthcare. Discov. Comput. 2026, 29, 117. [Google Scholar] [CrossRef] [Scilit]
- Hastie, T.; Tibshirani, R.; Friedman, J.H. The Elements of Statistical Learning: Data Mining, Inference, and Prediction; Springer: New York, NY, USA, 2009. [Google Scholar]
- Raheem, S.H.; Mohamed, E.A.A. Expectile regression with adaptive elastic net penalty. Int. J. Stat. Appl. Math. 2025, 10, 101–106. [Google Scholar] [CrossRef] [Scilit]
- Saputra, W.H.; Nariswari, R.; Owen, M. On the recurrent neural network model with robust expectile-based loss function in economic data forecasting. MethodsX 2025, 15, 103718. [Google Scholar] [CrossRef] [Scilit] [PubMed]
- Koenker, R. Quantile regression: 40 years on. Annu. Rev. Econ. 2017, 9, 155–176. [Google Scholar] [CrossRef] [Scilit]
- Schnabel, S.K.; Eilers, P.H. Optimal expectile smoothing. Comput. Stat. Data Anal. 2009, 53, 4168–4177. [Google Scholar] [CrossRef] [Scilit]
- Saputra, W.H.; Nariswari, R.; Noviantri, V.; Chek, M.Z.A.; Owen, M. Random Forest Regression Model with Expectile-Based Learning for Commodity Price Data Prediction. In Proceedings of the 2025 1st International Conference on Emerging Trends in Information Systems and Informatics (ICETISI), Jakarta, Indonesia, 1–2 December 2025; IEEE: New York, NY, USA, 2025; pp. 1–5. [Google Scholar]
- Cai, C.; Dong, H.; Wang, X. Expectile regression forest: A new nonparametric expectile regression model. Expert Syst. 2023, 40, e13087. [Google Scholar]
- Saputra, W.H.; Nariswari, R.; Noviantri, V.; Chek, M.Z.A.; Owen, M. Modeling and Backtesting Commodity Market Risk Using Expectile Random Forest and Expectile-based Value-at-Risk. In Proceedings of the 2025 9th International Conference on Information Technology, Information Systems and Electrical Engineering (ICITISEE), Banyumas, Indonesia, 15–16 December 2025; IEEE: New York, NY, USA, 2025; pp. 376–381. [Google Scholar]
- Chen, J.; Wang, X.; Lei, F. Data-driven multinomial random forest: A new random forest variant with strong consistency. J. Big Data 2024, 11, 34. [Google Scholar] [CrossRef] [Scilit]
- Jiang, S.; Liao, X.; Feng, Y.; Gao, Z.; Onasanya, B.O. A new fusion neural network model and credit card fraud identification. PLoS ONE 2024, 19, e0311987. [Google Scholar] [CrossRef] [Scilit] [PubMed]
- Aaboub, F.; Chamlal, H.; Ouaderhman, T. Statistical analysis of various splitting criteria for decision trees. J. Algorithms Comput. Technol. 2023, 17, 17483026231198181. [Google Scholar] [CrossRef] [Scilit]
- Ali, D.; Orifama, D.; Olaleye, O.; Ibe, B.O.; Ajani, A.A.; Oyeleke, O.D. IoTLSDT hybrid method for anomaly detection in internet of things environments. Discov. Internet Things 2026, 6, 1. [Google Scholar] [CrossRef] [Scilit]
- Fan, G.Z.; Ong, S.E.; Koh, H.C. Determinants of house price: A decision tree approach. Urban Stud. 2006, 43, 2301–2315. [Google Scholar] [CrossRef] [Scilit]
- Burdejová, P.; Härdle, W.K. Dynamic semi-parametric factor model for functional expectiles. Comput. Stat. 2019, 34, 489–502. [Google Scholar] [CrossRef] [Scilit]
- Saputra, W.H.; Prastyo, D.D.; Fithriasari, K. An expectile-based neural network approach for mixed-frequency economic forecasting. Decis. Anal. J. 2025, 18, 100666. [Google Scholar]
- Waltrup, L.S.; Sobotka, F.; Kneib, T.; Kauermann, G. Expectile and quantile regression—David and Goliath? Stat. Model. 2015, 15, 433–456. [Google Scholar]
- Tyralis, H.; Papacharalampous, G.; Khatami, S. Expectile-based hydrological modelling for uncertainty estimation: Life after mean. J. Hydrol. 2023, 617, 128986. [Google Scholar] [CrossRef] [Scilit]
- Kolasa, K.; Admassu, B.; Hołownia-Voloskova, M.; Kędzior, K.J.; Poirrier, J.E.; Perni, S. Systematic reviews of machine learning in healthcare: A literature review. Expert Rev. Pharmacoecon. Outcomes Res. 2024, 24, 63–115. [Google Scholar] [PubMed]
- An, Q.; Rahman, S.; Zhou, J.; Kang, J.J. A comprehensive review on machine learning in healthcare industry: Classification, restrictions, opportunities and challenges. Sensors 2023, 23, 4178. [Google Scholar] [CrossRef] [Scilit] [PubMed]
- Badawy, M.; Ramadan, N.; Hefny, H.A. Healthcare predictive analytics using machine learning and deep learning techniques: A survey. J. Electr. Syst. Inf. Technol. 2023, 10, 40. [Google Scholar] [CrossRef] [Scilit]
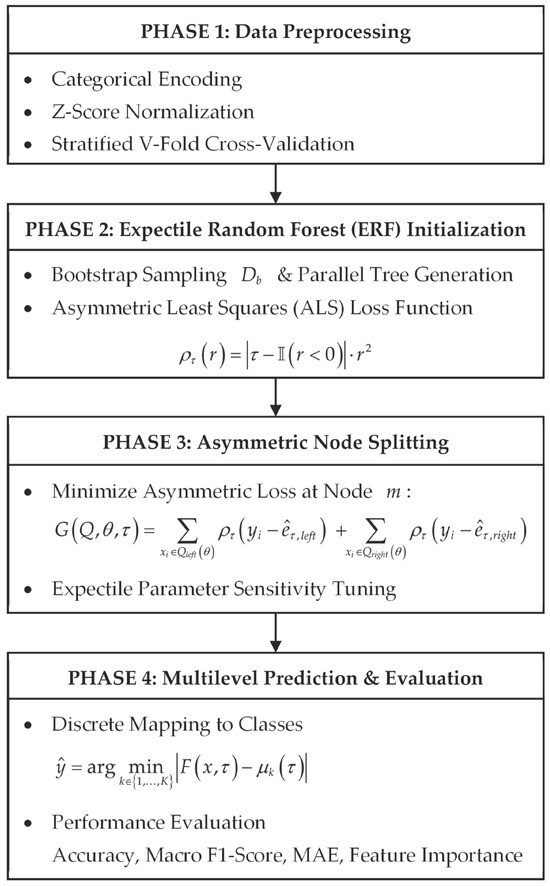
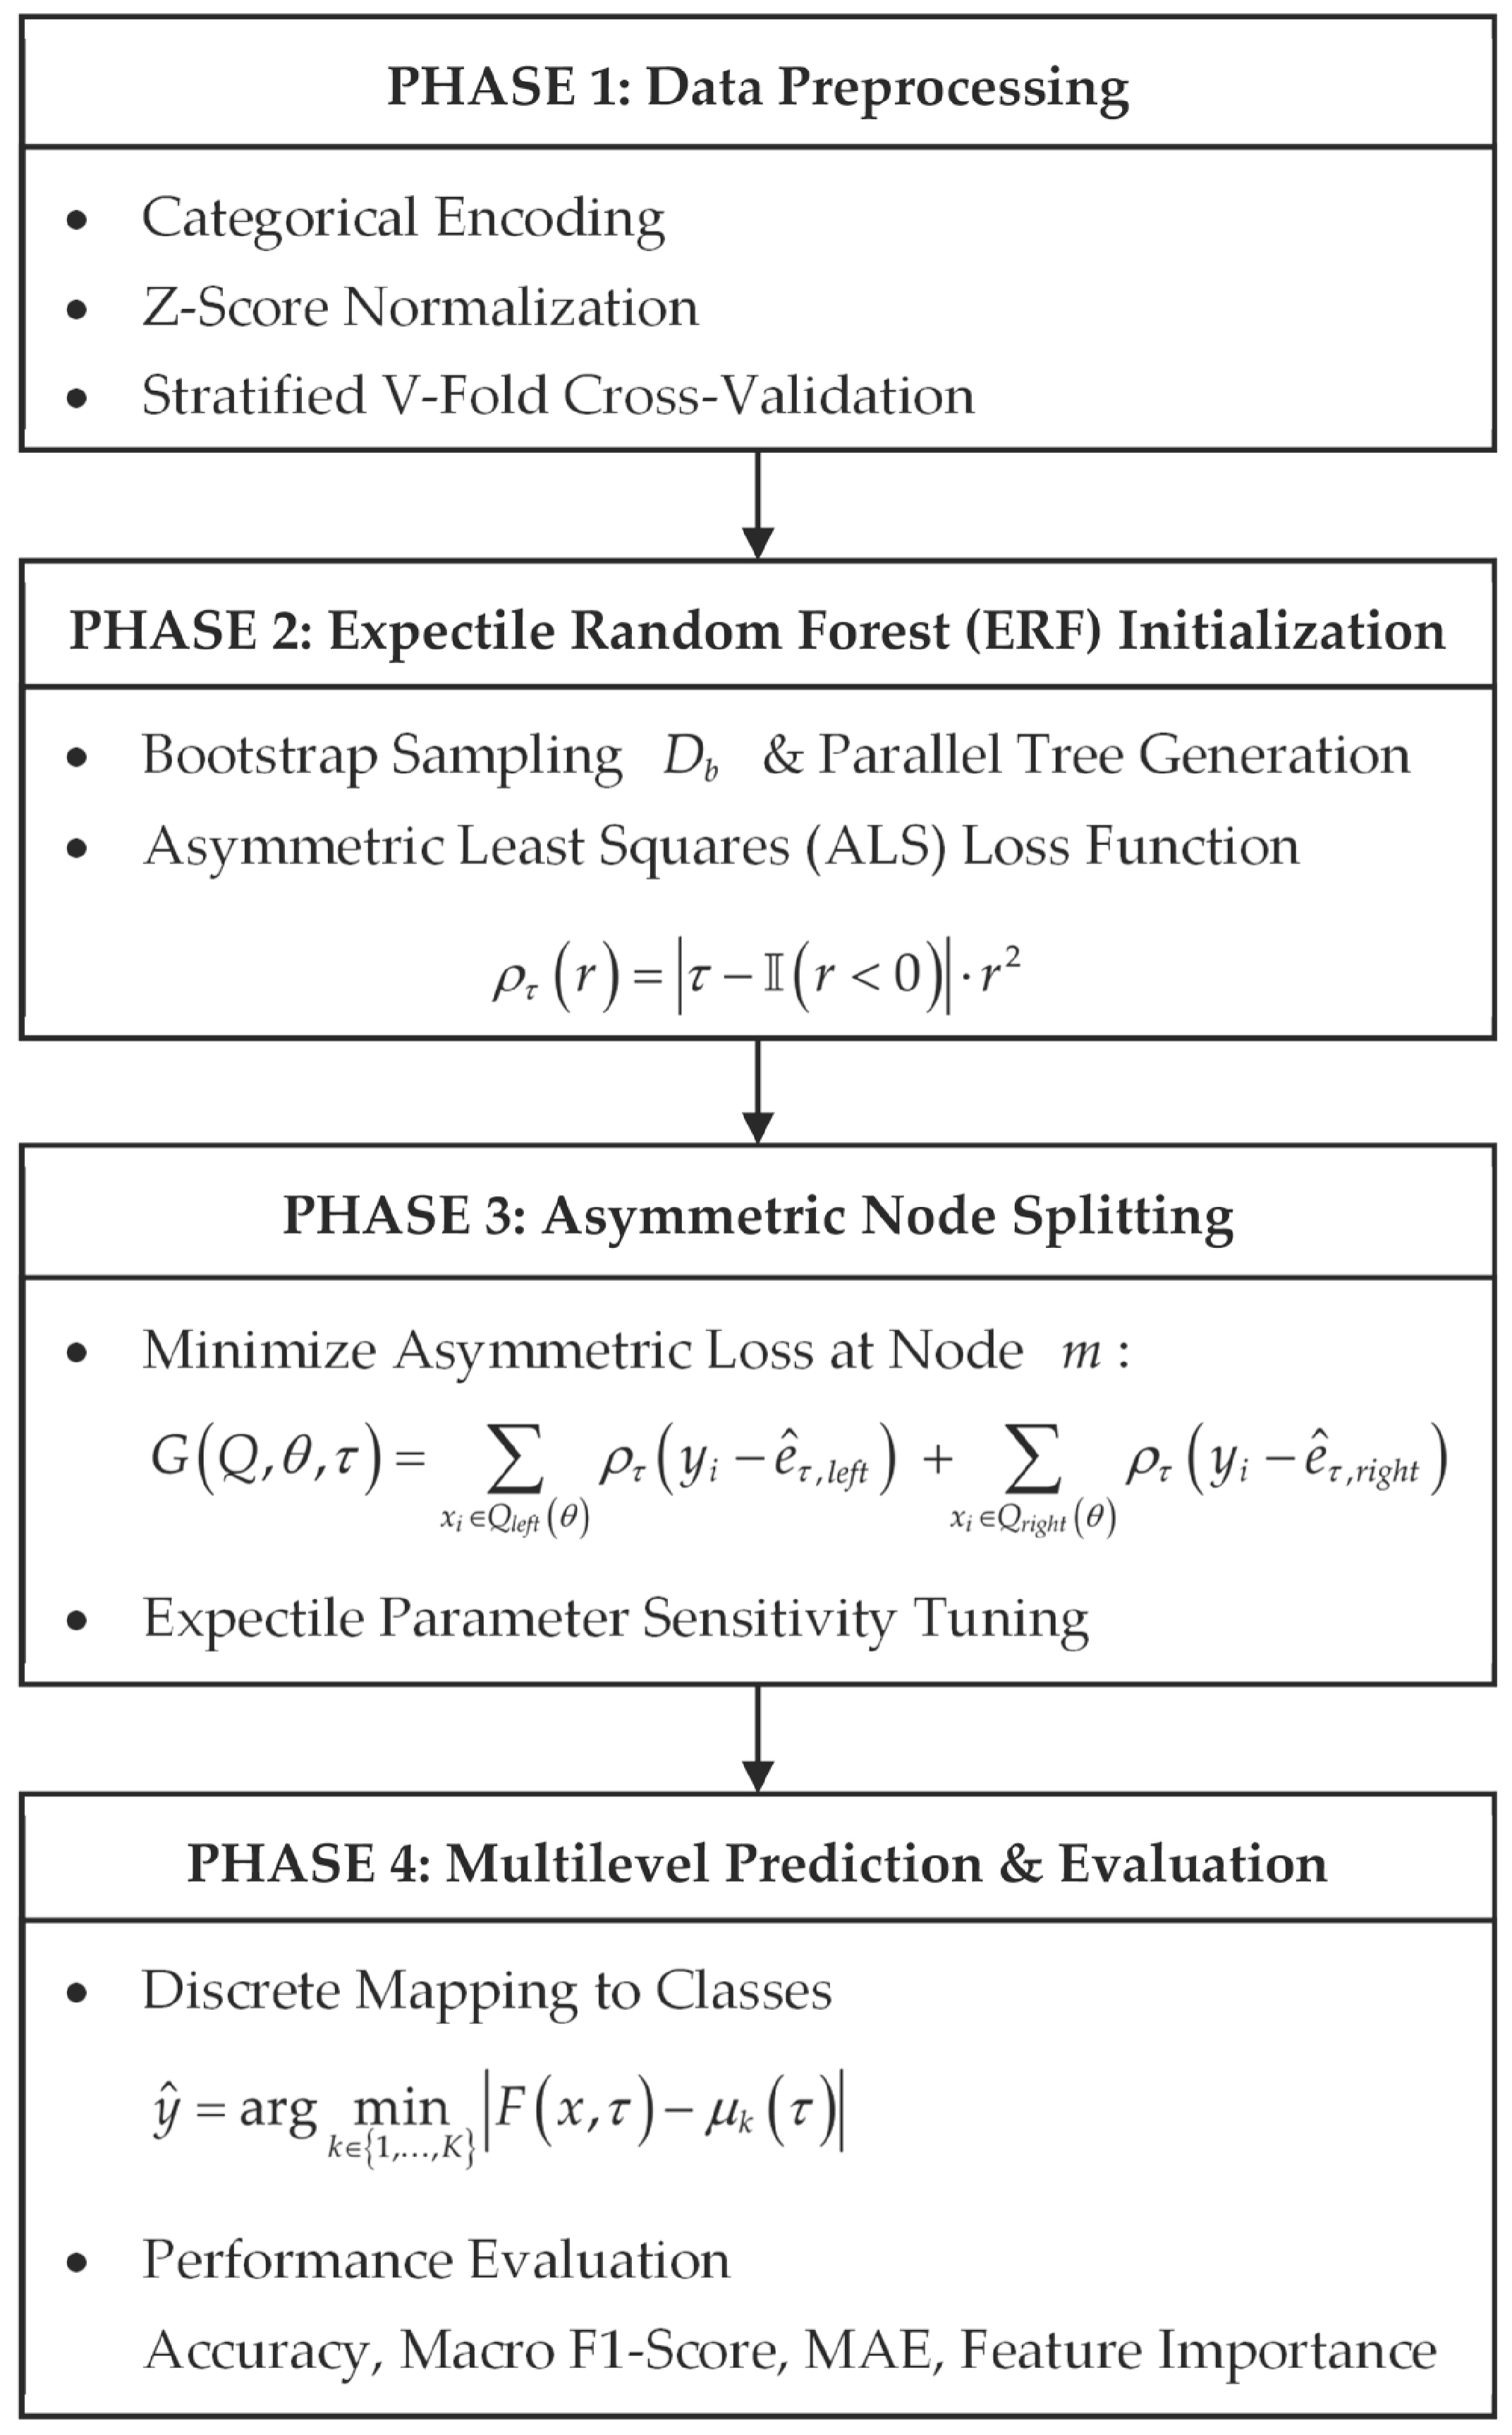
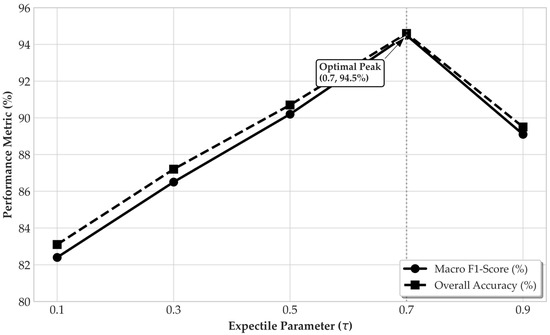
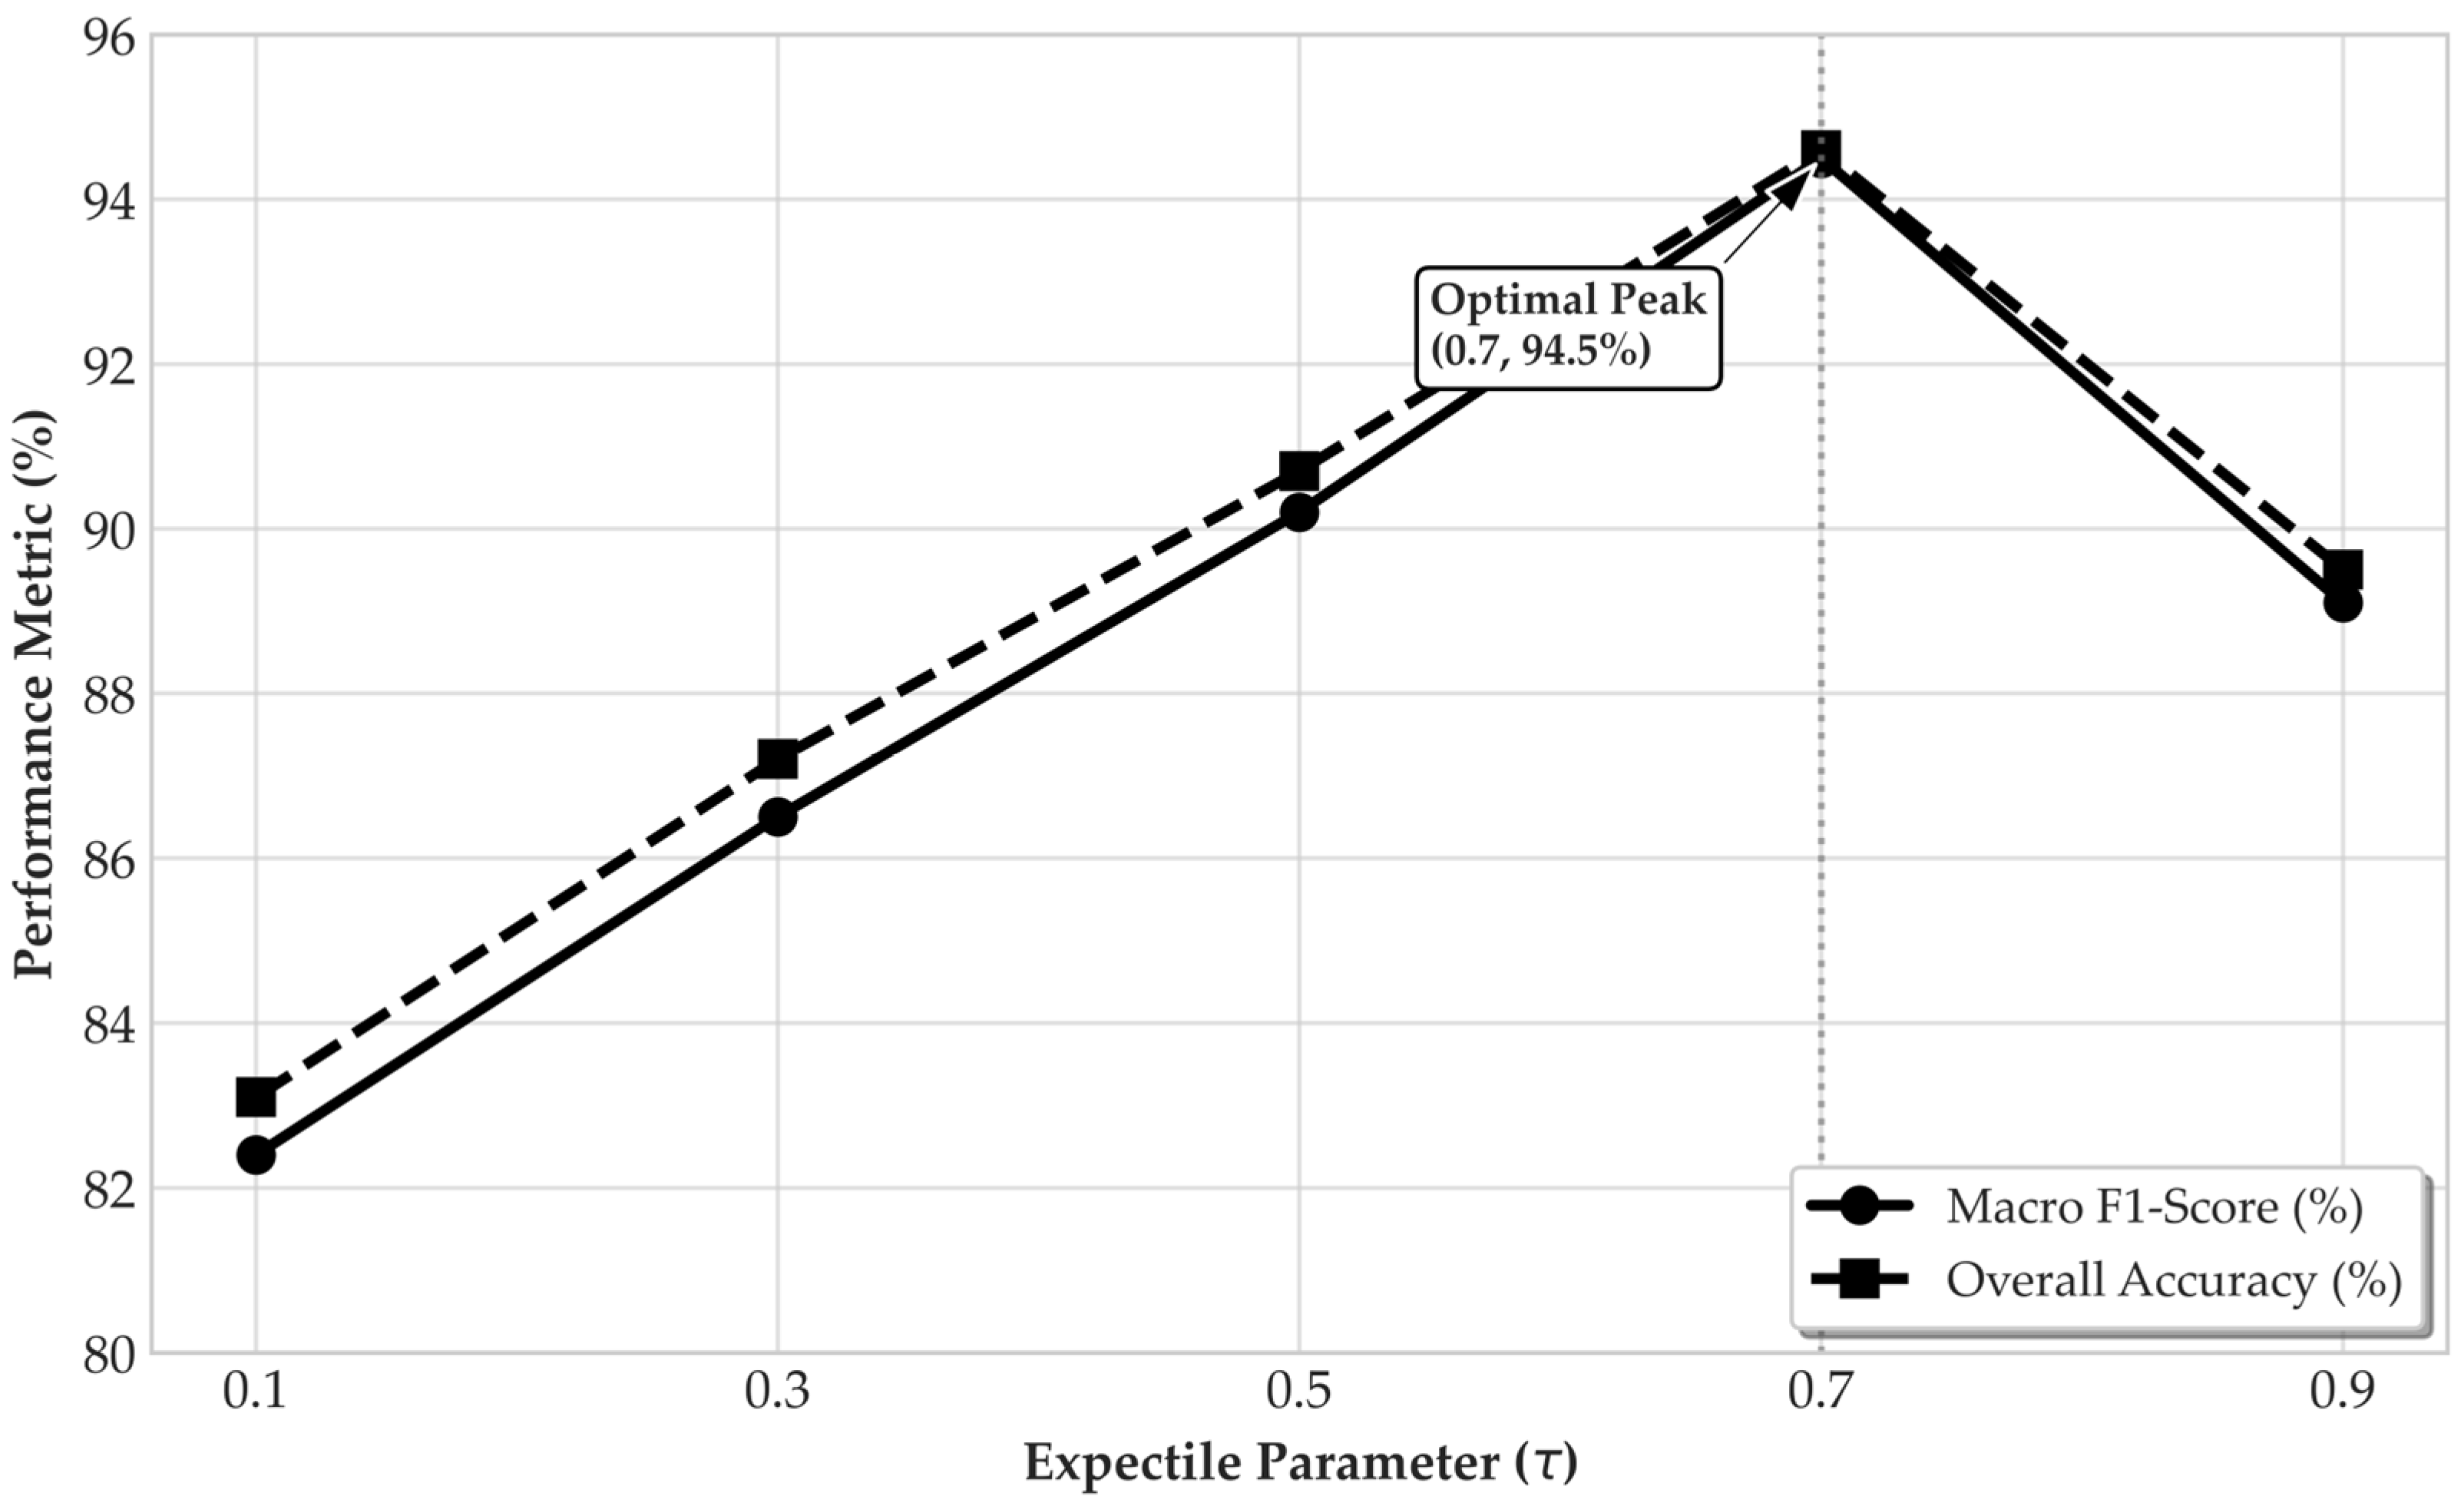
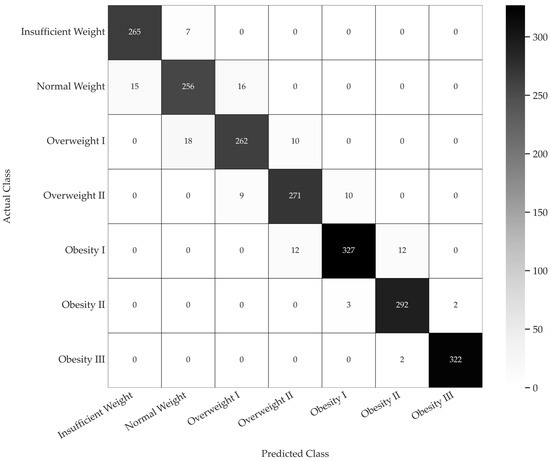
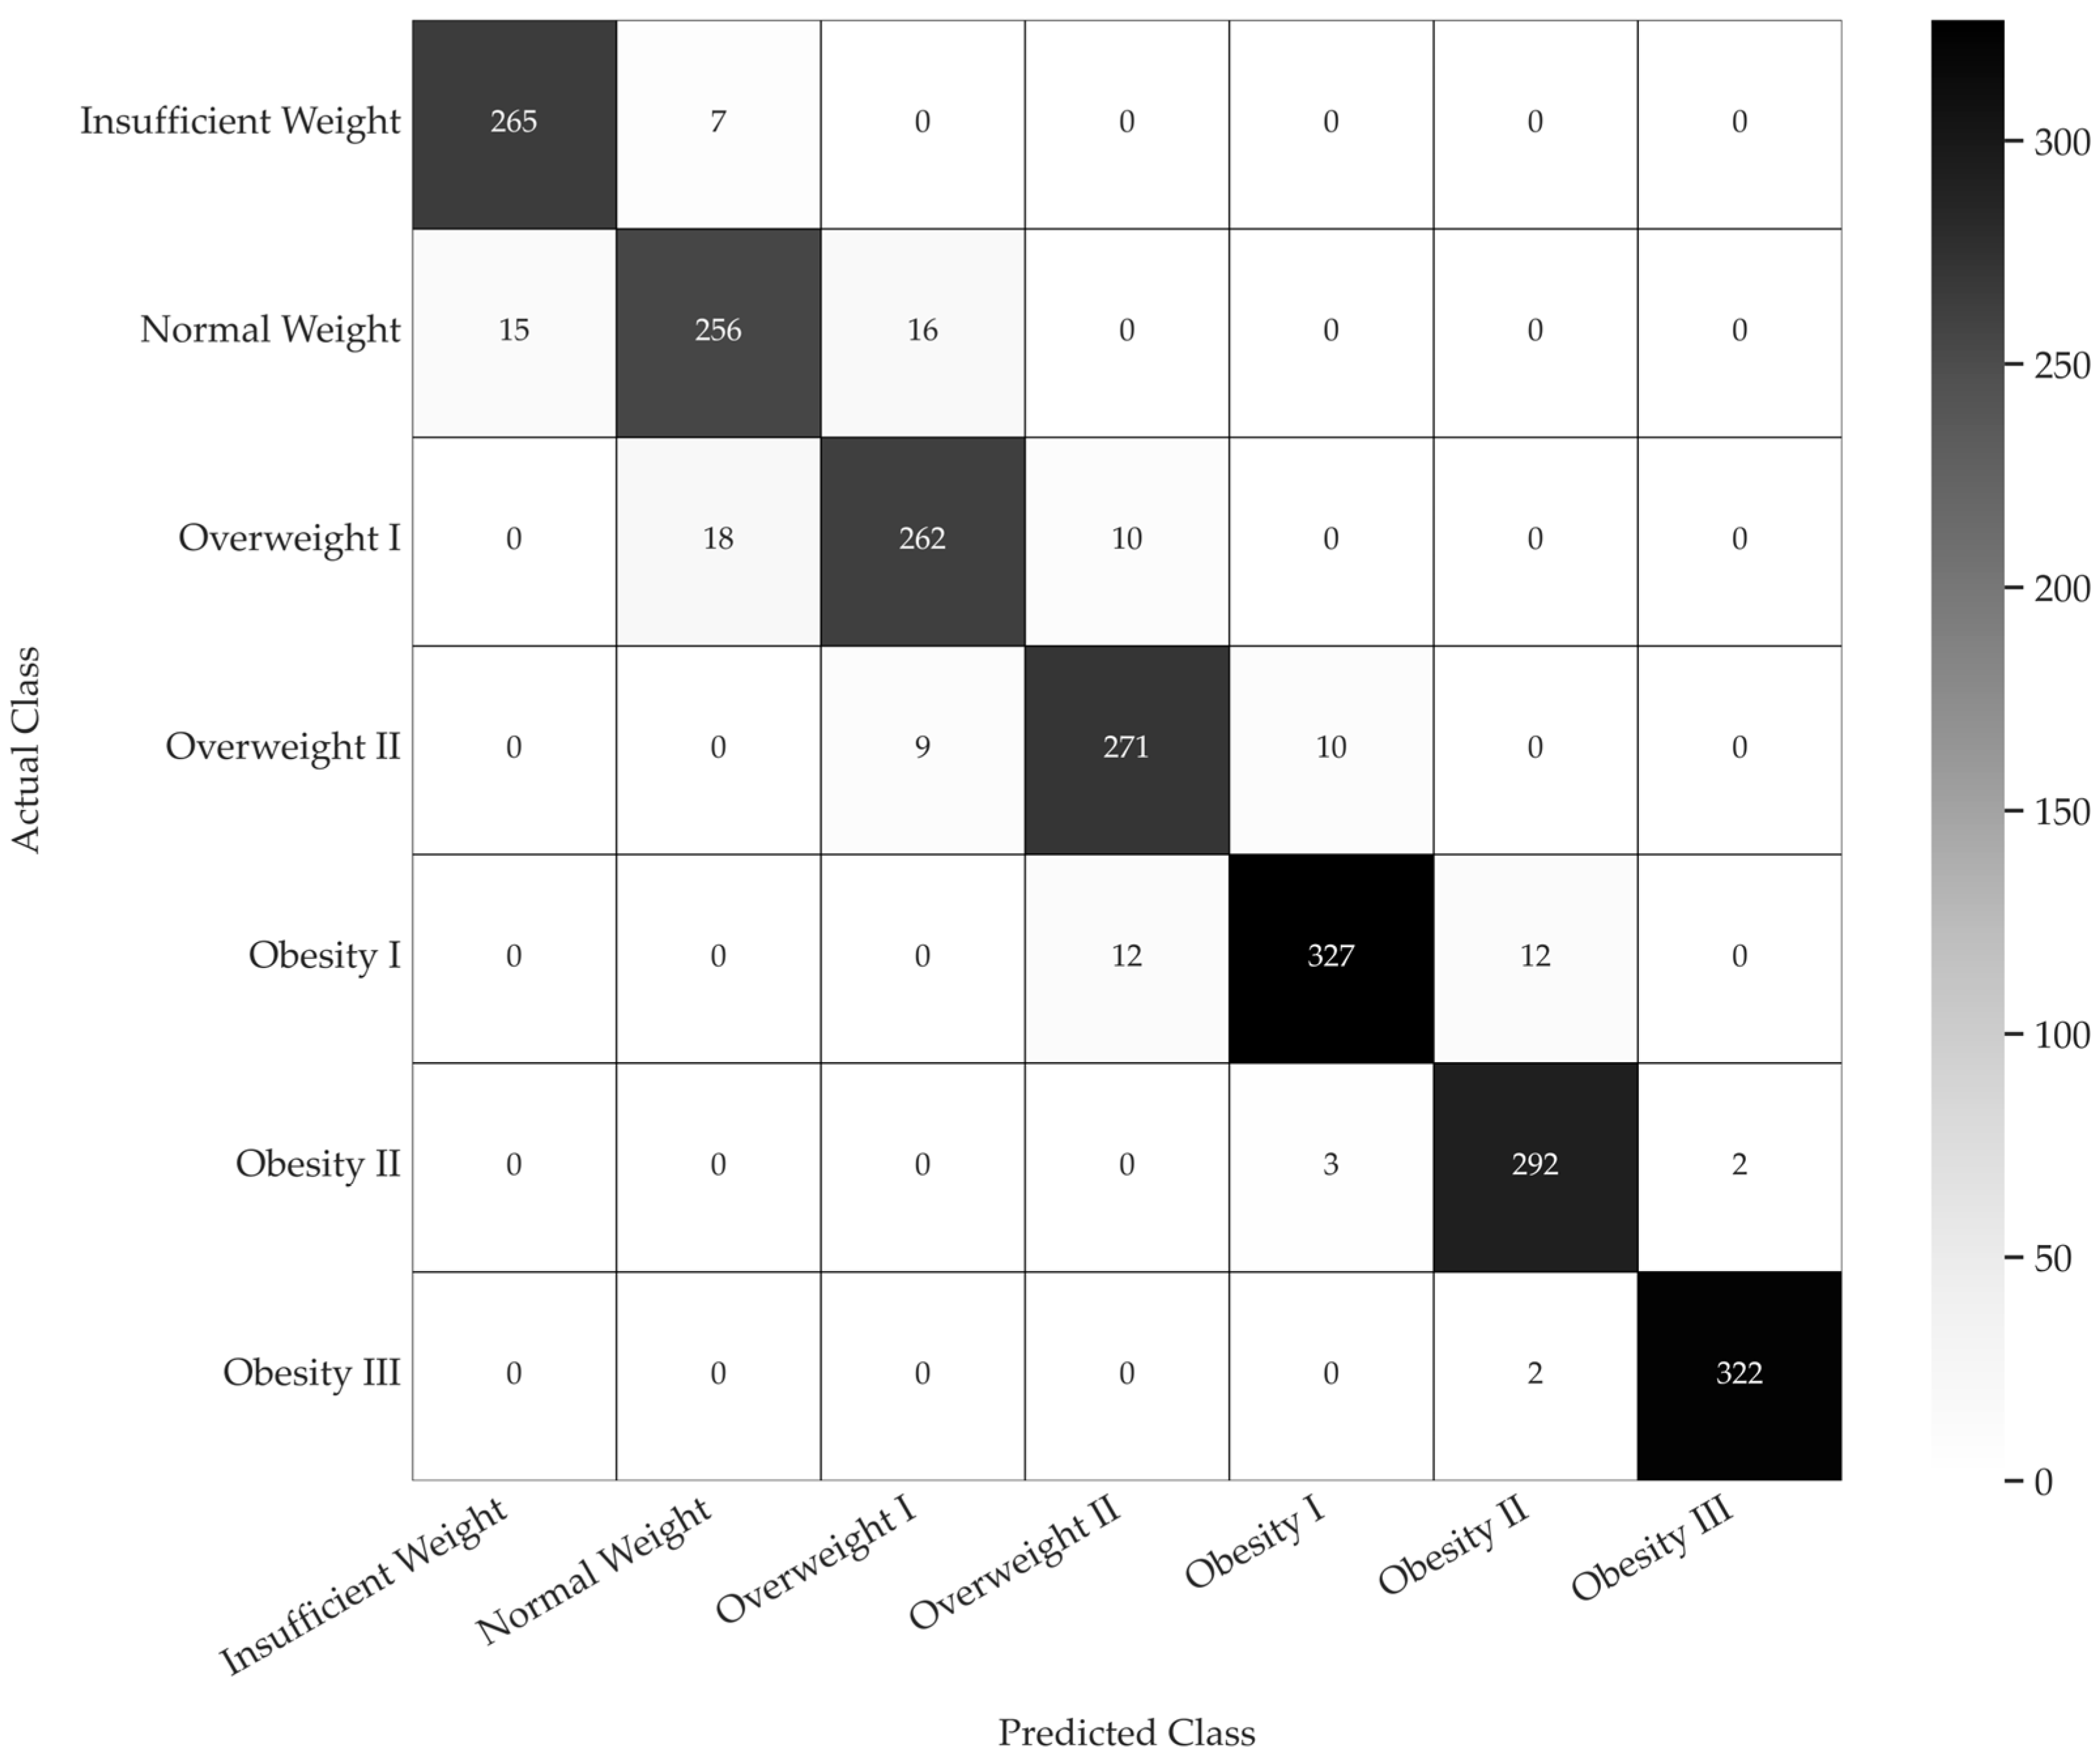
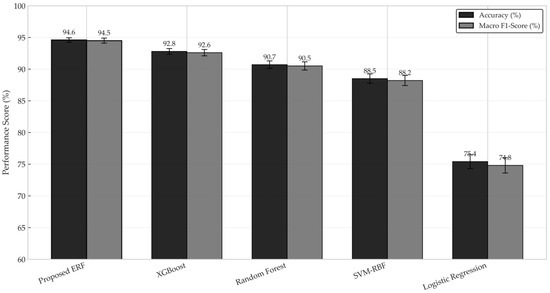
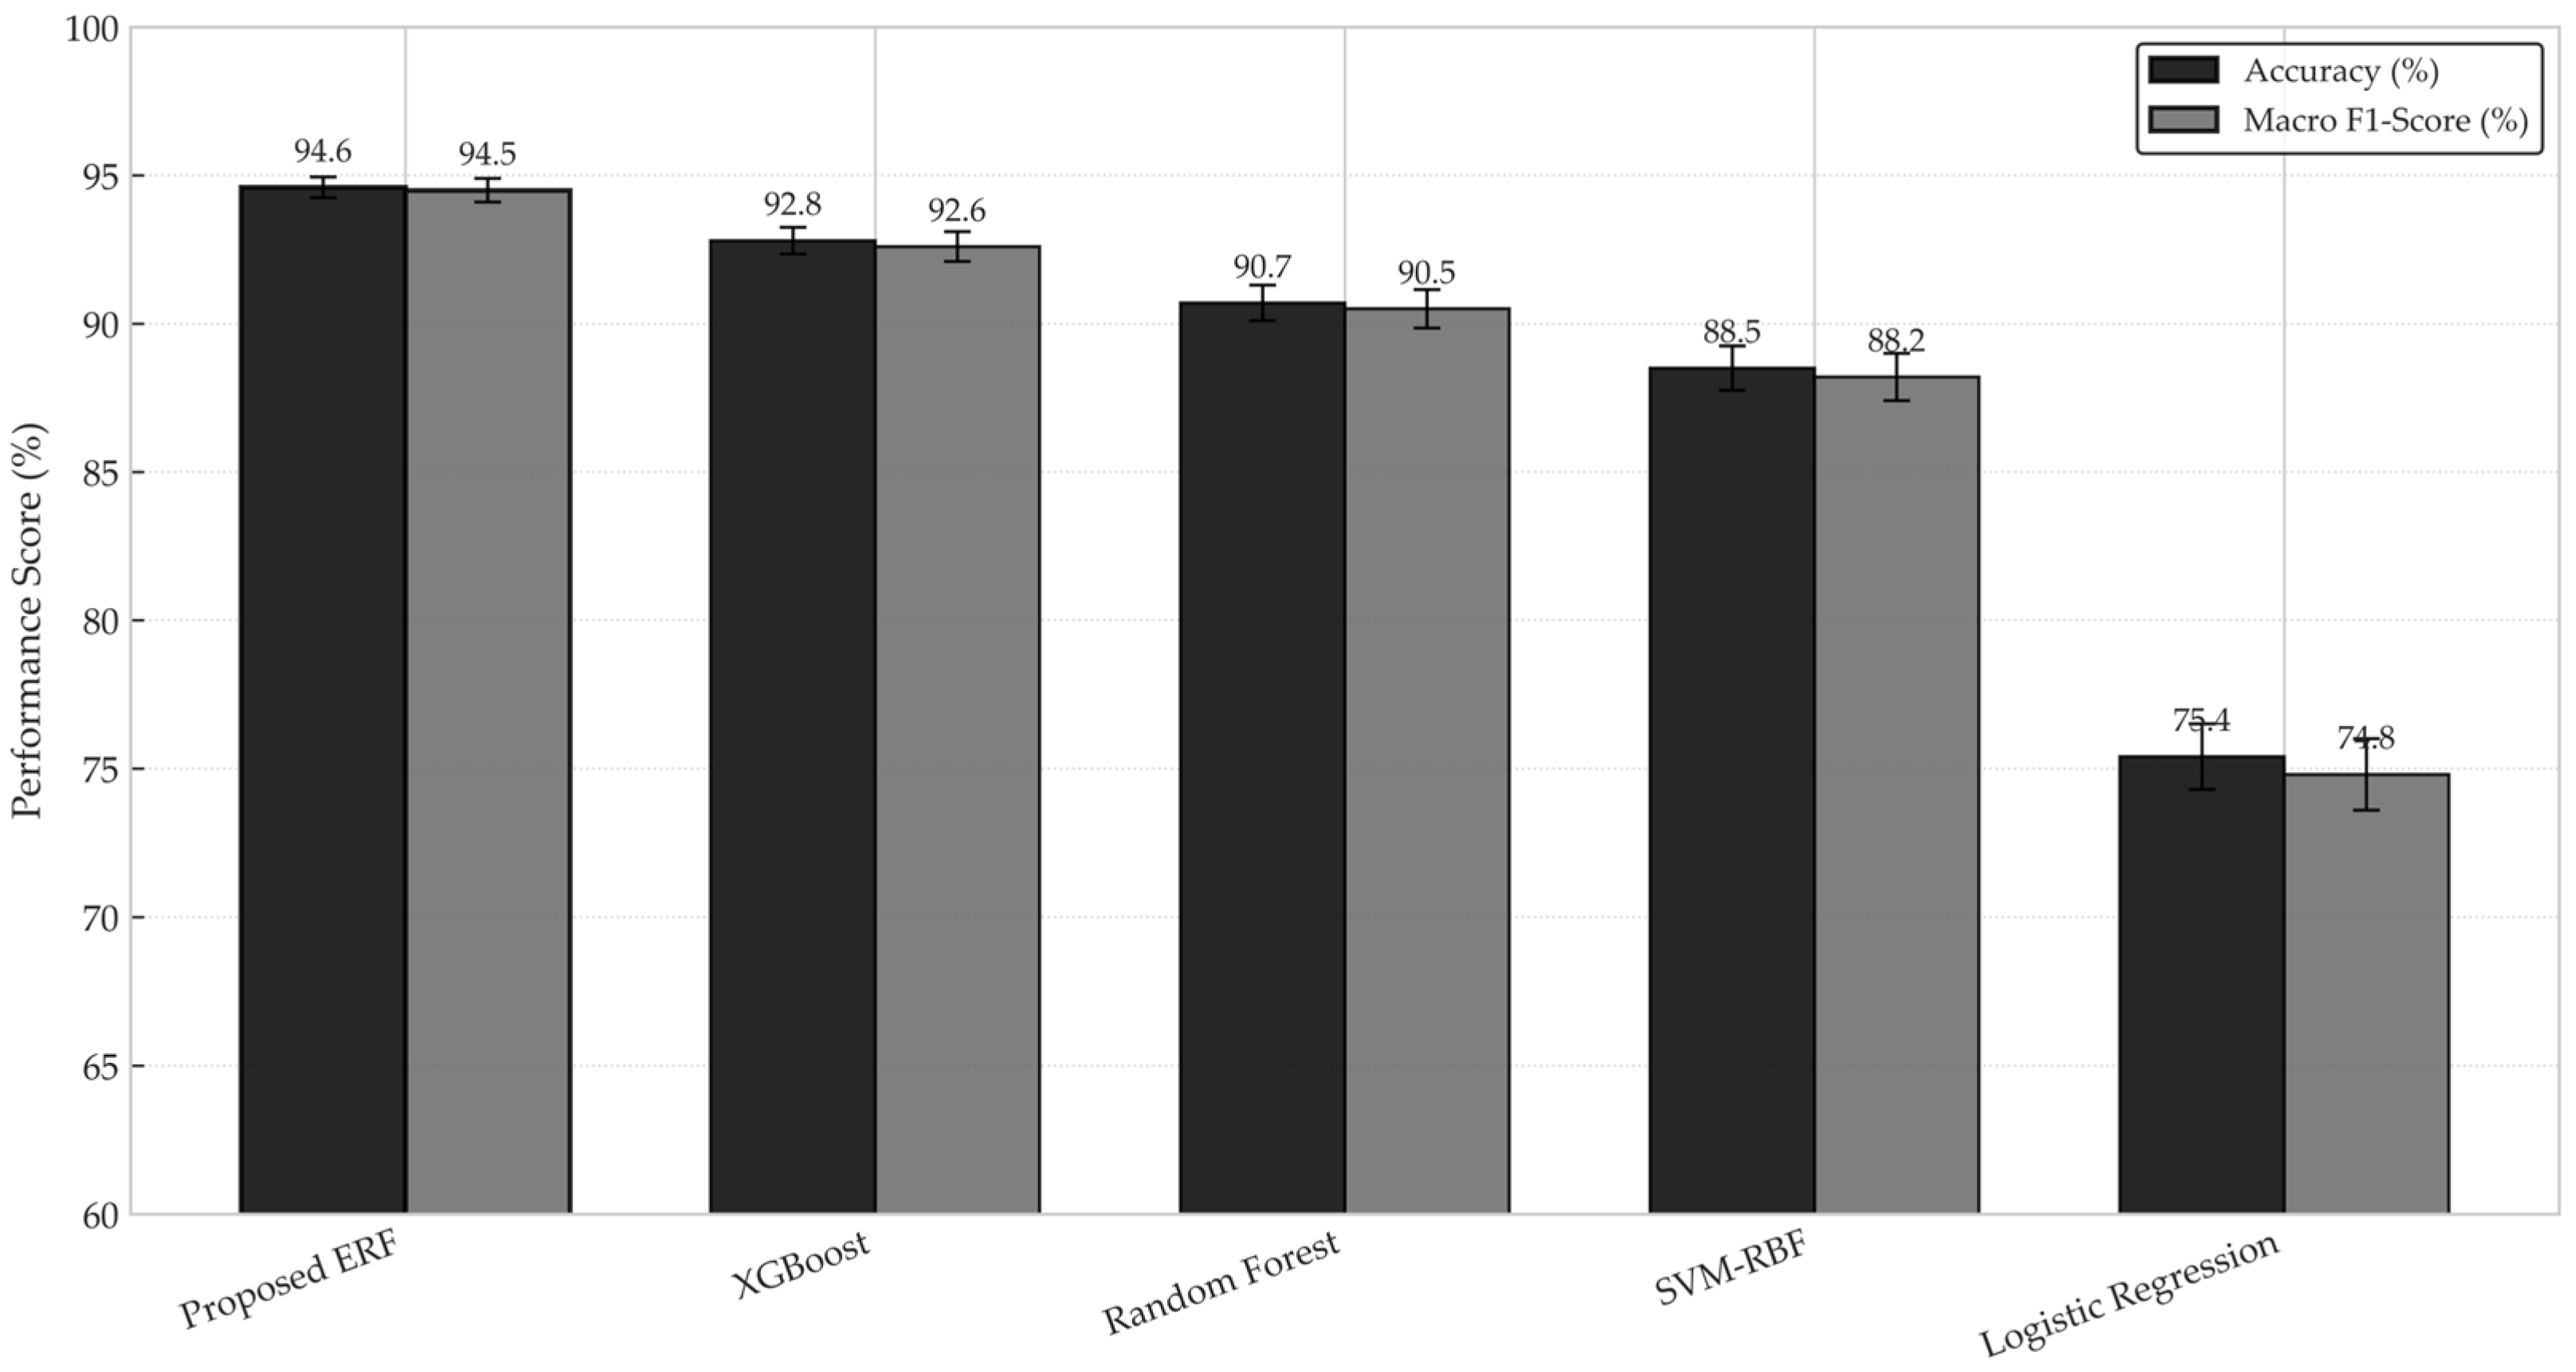
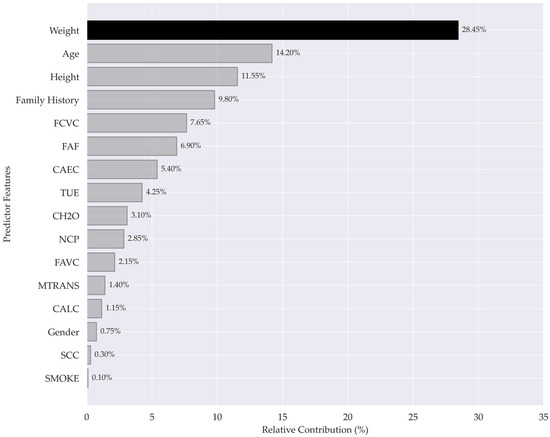
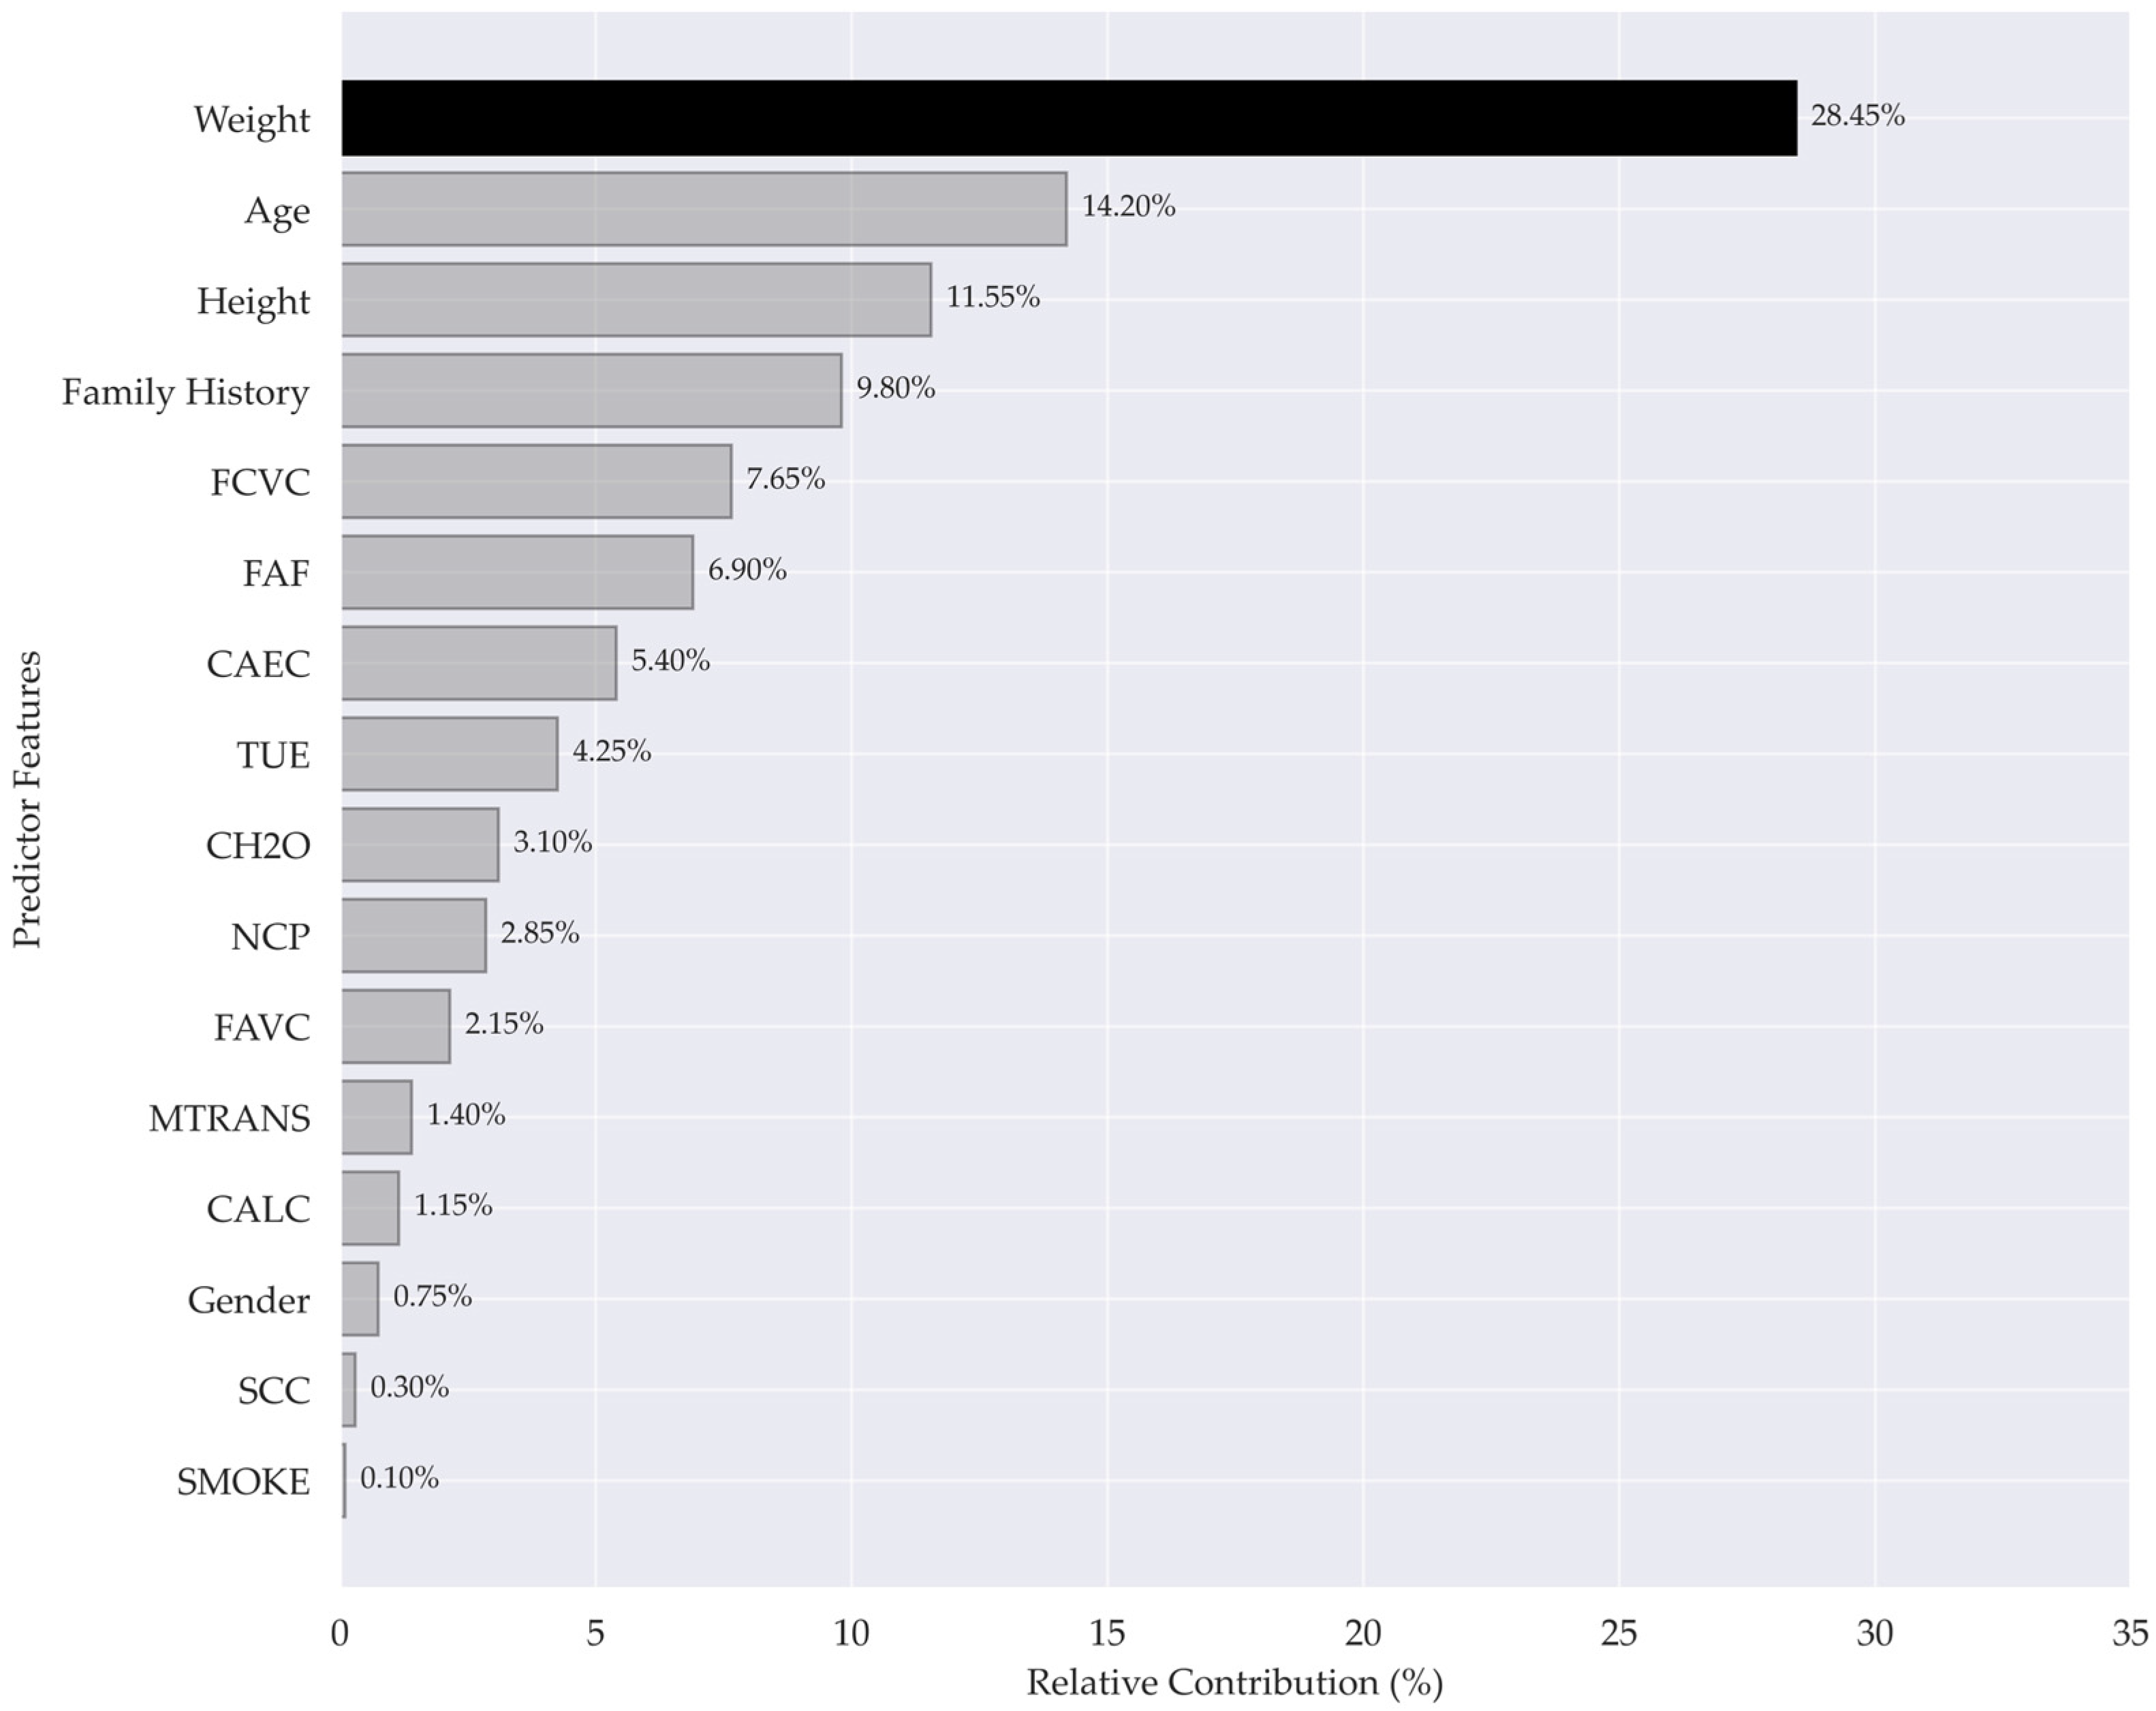
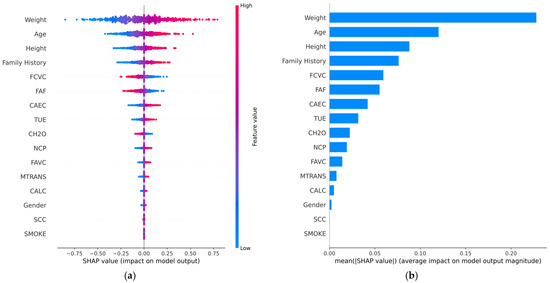
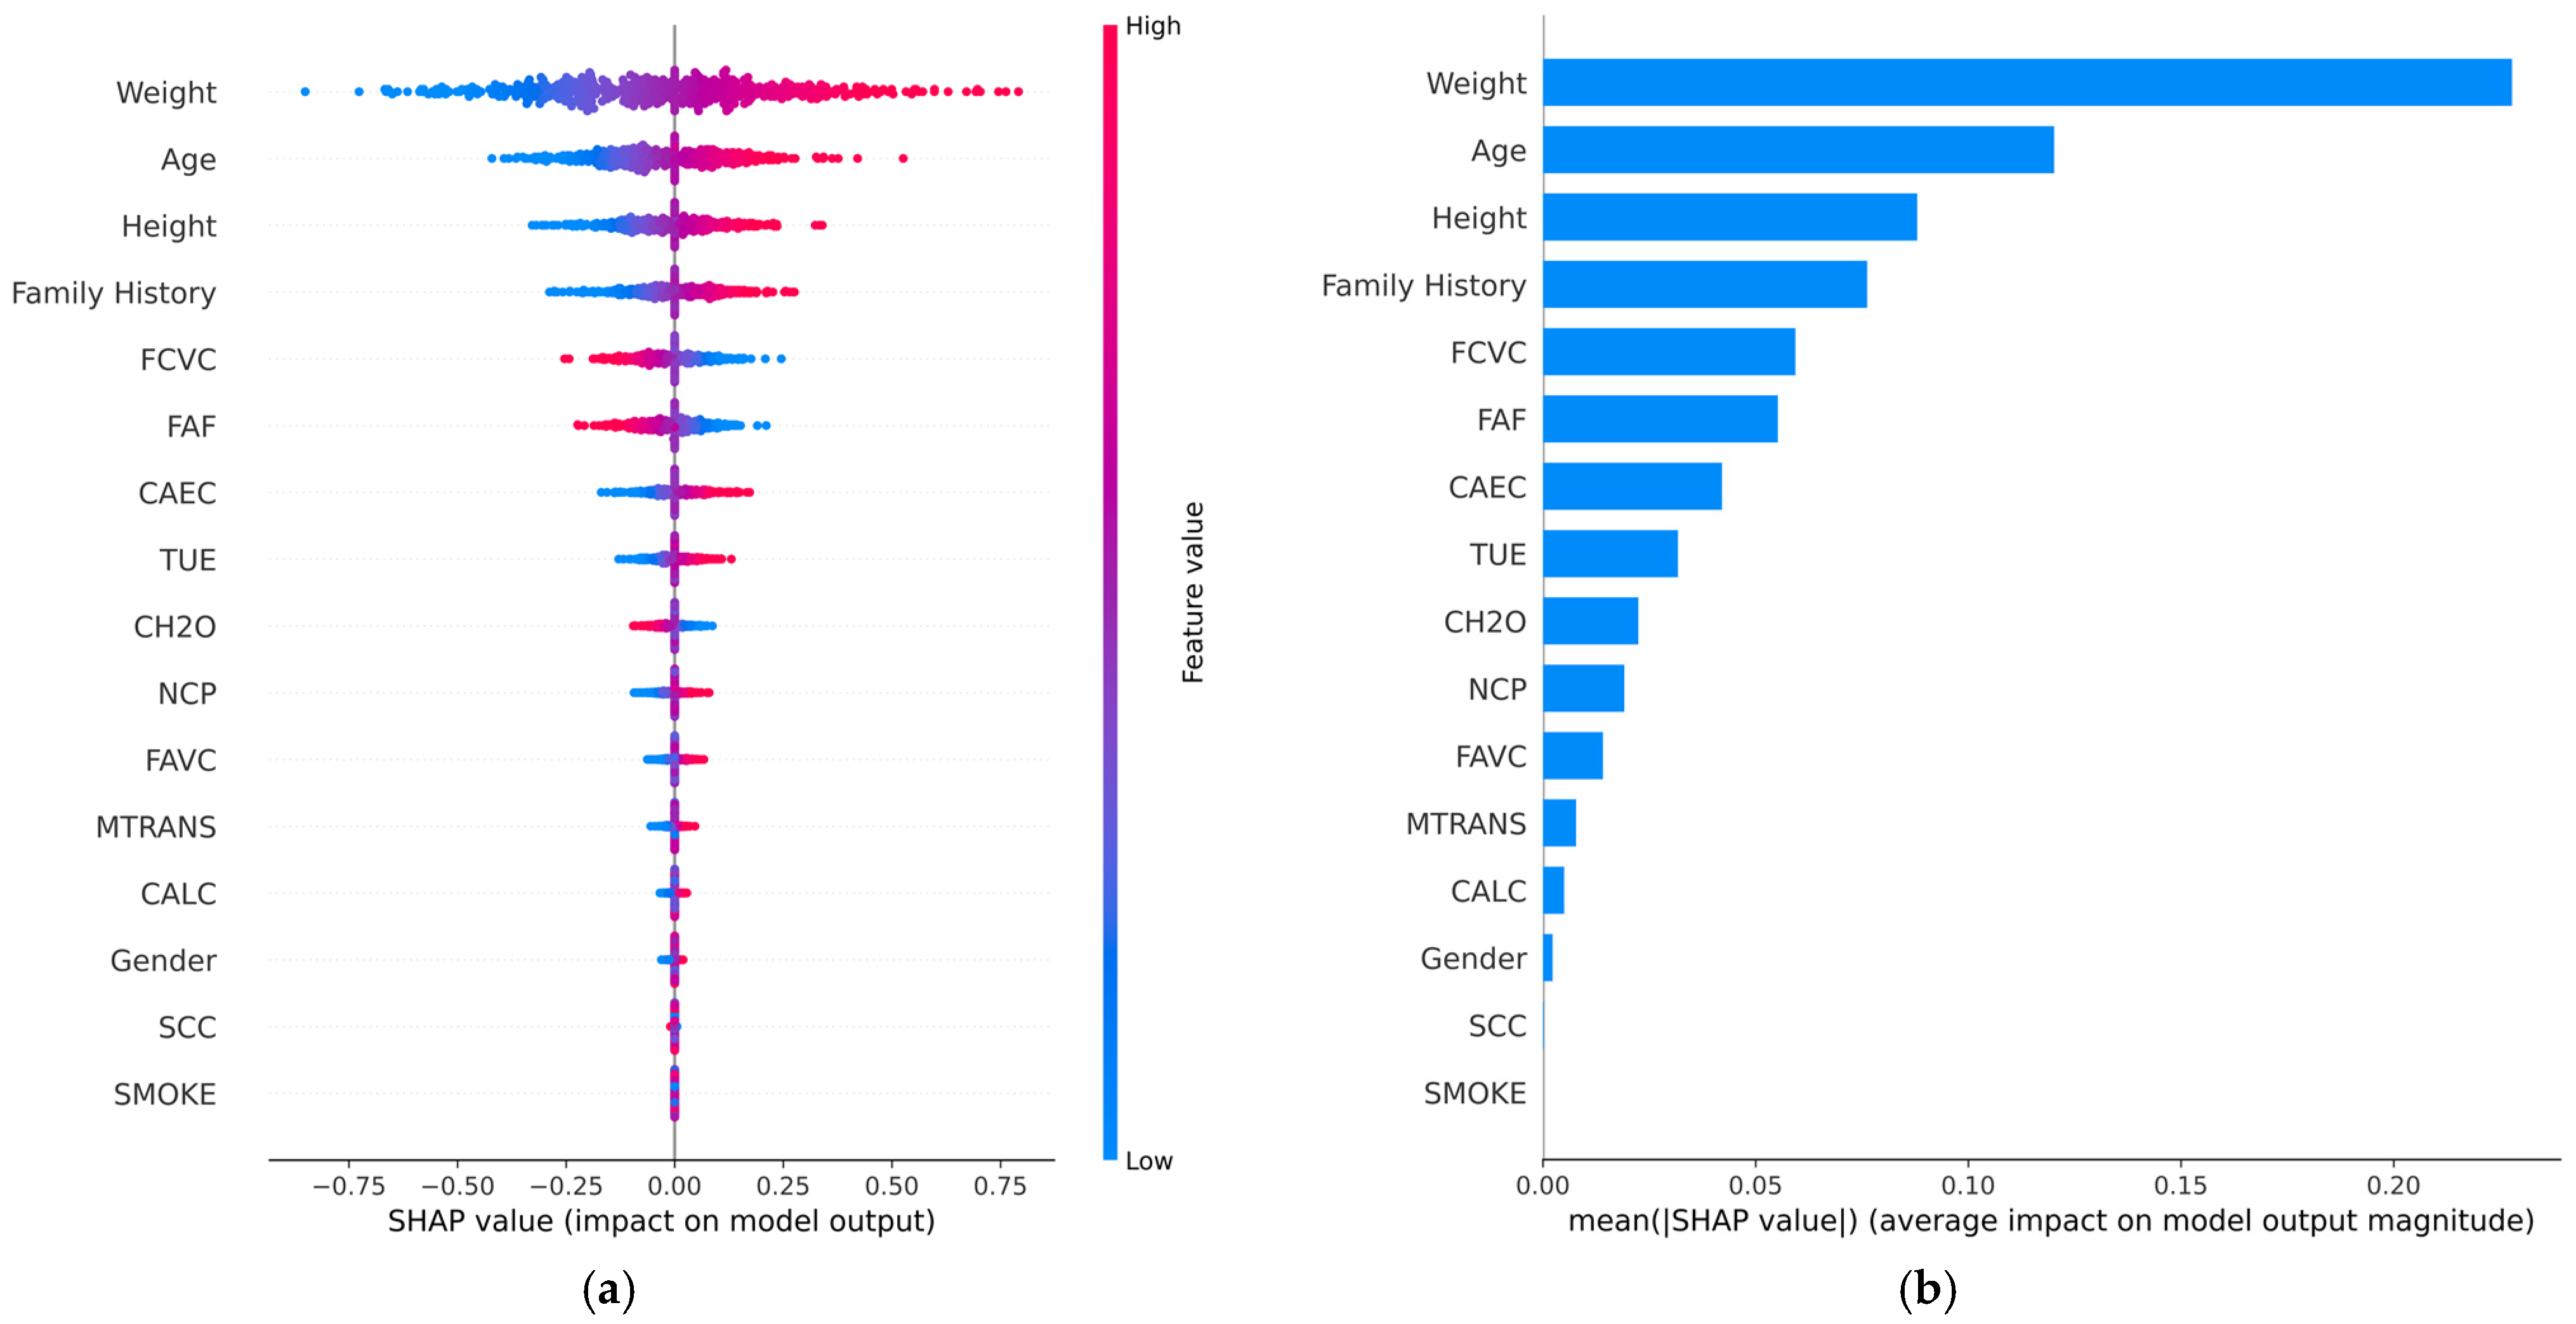

Disclaimer/Publisher’s Note: The statements, opinions and data contained in all publications are solely those of the individual author(s) and contributor(s) and not of MDPI and/or the editor(s). MDPI and/or the editor(s) disclaim responsibility for any injury to people or property resulting from any ideas, methods, instructions or products referred to in the content. |
© 2026 by the authors. Licensee MDPI, Basel, Switzerland. This article is an open access article distributed under the terms and conditions of the Creative Commons Attribution (CC BY) license.