


Abstract
Environmental noise may interfere with the reading experience by increasing cognitive load and psychophysiological arousal, yet these effects are difficult to perceive and communicate in real time. This study presents Reading Noise, an interactive installation that combines physiological sensing and sound-driven visualization to externalize perceived noise-related disturbance and psychophysiological strain during reading. In a controlled experiment, 46 participants completed reading tasks under four levels of background conversational noise (0–30, 31–60, 61–90, and >90 dB) while ambient sound level, electrodermal activity (EDA), and electrocardiogram (ECG) were recorded in real time. Following data quality screening, inferential statistical analyses were performed on the analyzable physiological subset (n = 16). Based on these data, a hybrid mapping strategy combining rule-based assignment and LMM-informed exploratory calibration was developed to map acoustic and physiological changes onto dynamic text-based visual parameters, including deformation intensity, jitter, and motion instability, for real-time feedback. Within the analyzable subset, noise level was associated with significant changes in the recorded physiological indicators (all p < 0.05): skin conductance level (SCL) and skin conductance responses per minute (SCRs/min) increased (4.69 ± 2.13 to 5.93 ± 2.19 μS; 1.49 ± 1.59 to 2.51 ± 2.13), whereas the percentage of successive RR intervals differing by more than 50 ms (pNN50) and the root mean square of successive differences (RMSSD) decreased (15.84 ± 16.52% to 10.57 ± 11.35%; 36.63 ± 17.62 to 29.67 ± 16.66 ms). Subjective cognitive load also increased significantly (2.06 ± 0.29 to 6.38 ± 0.31). A follow-up installation study with 24 cross-disciplinary participants, with reported group interaction observations drawn from a 12-participant subset, suggested that the installation may facilitate shared interpretation of attention-related disruption and cognitive strain, indicating the potential of physiology-informed visual translation as a boundary object approach for empathetic, sound-mediated communication.
1. Introduction
Reading is often imagined as a quiet, introspective act, yet few contemporary reading environments are truly silent. In classrooms, libraries, and digital workspaces, the hum of background conversations and everyday noise constantly intrudes on cognitive focus [1]. Such acoustic interference is not merely a sensory distraction but also shapes how attention, cognitive strain, and comprehension unfold over time [2]. Environmental noise during reading has been consistently shown to interfere with cognitive processing, attentional regulation, and attentional focus [3,4]. Even moderate background conversations, such as speech or ambient chatter, can increase mental workload, reduce comprehension, and induce physiological arousal, leading to fragmented attention and reading fatigue [5]. These disturbances are associated with measurable changes in physiological signals, including electrodermal activity (EDA) and electrocardiogram (ECG), highlighting the close coupling between auditory environments and cognitive load [6]. Importantly, noise-induced cognitive disruption is context-dependent: the degree of interference varies with individual susceptibility, reading difficulty, task engagement, and social context [7]. As research on noise and reading continues to advance, the effects themselves remain largely imperceptible and challenging to articulate. Most assessments still privilege quantifiable performance or localized physiological metrics, while offering limited support for making the dynamic, embodied, and experiential dimensions of cognitive disruption perceptible in real time. This limited visibility continues to pose challenges for cross-disciplinary understanding, making it difficult for educators, designers, and researchers who approach sound from distinct theoretical and practical perspectives to collaboratively apprehend how noise affects reading performance, engagement, and psychophysiological experience.
To address this gap, this study translates the otherwise imperceptible effects of reading-related noise into tangible, experiential forms through design. Rather than treating noise merely as a disturbance, we explore how it can be externalized and visualized to reveal the interplay between cognition, emotion, and auditory input. Within the frameworks of sound-driven design, noise is reinterpreted as a medium for reflection, empathy, and shared understanding across disciplinary boundaries. Building on this conceptual framing, we developed Reading Noise, an interactive installation that integrates physiological sensing and sound-driven visualization. Through real-time monitoring of EDA and ECG, as well as ambient noise levels, the system dynamically maps physiological and auditory indicators onto dynamic text-based visual parameters, including deformation intensity, jitter, and motion instability, rendering cognitive disturbance perceptible as visual fluctuation. This hybrid methodological approach bridges scientific measurement with design expression and situates the work within the notion of the sonic boundary object [8], emphasizing its potential to mediate understanding across disciplinary communities. Ultimately, the study provides a novel pathway for investigating how sound-mediated visualization can cultivate empathetic engagement and deepen cross-group understanding of environmental stressors.
Based on prior research on auditory distraction, cognitive load, and physiological arousal, this study formulated three hypotheses. First, increasing ambient noise during reading was expected to increase psychophysiological arousal, reflected in higher electrodermal activity and reduced heart rate variability. Second, higher noise levels were expected to be associated with greater self-reported cognitive load and perceived reading disruption. Third, it was expected that these physiological changes could inform an interpretable prototype mapping to visual parameters, enabling the installation to approximate otherwise imperceptible aspects of noise-related cognitive strain during reading. Accordingly, three research questions guide this study:
- How does ambient noise affect readers’ cognitive load and emotional arousal during reading?
- How can physiological signals be translated into dynamic visual feedback to make cognitive disturbance perceptible?
- How can sound-mediated visualizations support empathetic engagement and cross-disciplinary understanding of noise-induced cognitive effects?
The contributions of this study are threefold. First, it provides an empirical investigation of how ambient noise affects reading-related psychophysiological responses by combining electrodermal activity, heart rate variability, and subjective cognitive-load assessment. Second, it proposes a hybrid sound-driven visualization framework that translates physiological and acoustic changes into dynamic text-based visual parameters, making noise-related cognitive disruption perceptible in real time. Third, it implements this framework in the Reading Noise installation and explores its value as a sonic boundary object for empathetic engagement and cross-disciplinary understanding. The structure of this paper is as follows. Section 2 reviews related work on sound-driven cognition and cognitive load in noisy environments, and introduces the concept of sound-driven boundary objects as a theoretical lens for cross-disciplinary communication. Section 3 describes the materials and methods, including participants, apparatus and data acquisition, experimental procedure, data analysis, and the sound-driven installation design framework. Section 4 presents the results of the physiological measures, subjective questionnaire responses, linear mixed-effects modelling (LMM) analysis, and the installation experience with qualitative reflections. Section 5 discusses the cognitive and emotional effects of noise, the role of physiology-to-visual translation in making cognitive disturbance perceptible, and the implications of Reading Noise as a sonic boundary object for empathetic engagement and cross-disciplinary understanding. Finally, Section 6 and Section 7 conclude the paper by summarizing the main findings, limitations, and directions for future work.
2. Related Work
2.1. Sound-Driven Cognition and Load in Noisy Environments
Sound-driven design emphasizes the active role of auditory stimuli in shaping human cognition, perception, and emotional experience [9,10]. Unlike static environmental elements, sound conveys temporal patterns, intensity fluctuations, and spatial cues, allowing designers to create dynamic interactions that respond to user behavior and context. In educational and reading contexts, auditory stimuli have been shown to affect attention, comprehension, and mental workload. Lee et al. [11] found that irrelevant speech in open-plan offices increased cognitive errors and self-reported annoyance, while Cvijanović et al. [12] demonstrated that background conversations significantly elevated physiological arousal, including heart rate and skin conductance. Mattys et al. [13] further revealed that reading performance deteriorates under moderate background speech, particularly for tasks requiring sustained attention. Collectively, these findings highlight how noise imposes additional cognitive demands, increasing what cognitive load theory identifies as extraneous load [14], which is the unnecessary mental effort caused by poorly structured or distracting environments.
Cognitive load theory conceptualizes mental effort as the sum of intrinsic, extraneous, and germane loads, which together determine the efficiency of information processing [15]. Environmental noise primarily increases extraneous load by disrupting attention, comprehension, and memory encoding [16]. These disruptions manifest not only in behavioral outcomes, such as slower reading speed or lower recall accuracy, but also in physiological markers, including elevated electrodermal activity and heart rate variability [17,18]. These findings highlight the cognitive cost of environmental noise and the importance of methods capable of rendering its effects perceptible. Recent studies demonstrate that real-time measurement of physiological signals provides objective insights into cognitive load and emotional arousal. Wearable devices monitoring EDA and HRV have been used to track stress, attentional fluctuations, and momentary cognitive effort [19]. In reading contexts, these metrics capture transient, context-dependent effects of noise that conventional comprehension tests often miss [20]. Integrating cognitive load assessment with design interventions enables the externalization of otherwise invisible mental processes, informing interactive systems that adapt to user attention, engagement, and environmental conditions [21,22]. This approach establishes a systematic pathway for exploring the interplay between environmental factors, physiological responses, and design interventions, providing guidance for effectively applying physiological data in interactive design research.
In design research, integrating such physiological monitoring with sound-driven interaction enables the externalization of otherwise invisible cognitive processes. For example, Delle Monache et al. [23] developed sound-based systems that sonify users’ emotional and attentional states, revealing the affective dimension of listening as a design material. Complementing these perspectives, Chung et al. [24] introduce Soundscape Fiction, a speculative method that uses layered auditory compositions to stimulate experiential imagination and situated reflection. Together, these studies demonstrate that sound can serve not only as a stimulus affecting cognition but also as a representational medium for rendering cognitive and emotional states perceptible. This dual role of sound provides a foundation for developing hybrid design methodologies that merge physiological computing with sound-based interaction design, allowing for the empirical assessment and experiential communication of how auditory environments modulate cognitive load and reading performance.
2.2. Sound-Driven Boundary Objects
While physiological and behavioral metrics provide valuable insights into how sound influences cognition, these internal processes often remain opaque to designers, educators, and end-users. To bridge this perceptual and disciplinary gap, we adopt the concept of the sonic boundary object, an extension of Star & Griesemer’s [25] notion of boundary objects, to describe auditory artifacts that mediate understanding and collaboration across different epistemic communities. Boundary objects are artifacts that maintain a coherent identity while allowing multiple interpretations, enabling coordination among diverse stakeholders [26]. In design research, they have been used to support communication between designers, engineers, and researchers, making complex or invisible processes more tangible [27,28,29]. Extending this framework, sonic boundary objects translate cognitive and affective responses into auditory forms, allowing sound to function simultaneously as data representation, emotional expression, and collaborative medium. For example, Chen and Ibrahim [30] demonstrate how auditory cues embedded in interactive installations can communicate stress and engagement levels in team environments. Similarly, Guastavino et al. [31] and Truax et al. [32] show that the sonification of physiological and environmental data fosters reflection and negotiation among heterogeneous groups, helping them align around shared experiences while maintaining disciplinary diversity. Additionally, Avci and Aran [33] illustrate how auditory representations of group stress can support real-time collaborative decision-making. In such contexts, sound acts as both a representational and affective bridge, linking subjective experience with empirical observation. In this study, the sonic boundary object serves as a methodological lens for rendering noise-induced cognitive and emotional responses perceptible and actionable. By externalizing how environmental noise shapes attention and cognitive load, it enables dialogue among educators, designers, and researchers, facilitating empathy, shared interpretation, and evidence-based design intervention.
3. Materials and Methods
3.1. Participants
The study involved two separate participant groups corresponding to distinct experimental phases. Participant characteristics are summarized in Table 1.
Table 1.
Demographic characteristics of participants in both experimental phases.
3.1.1. Phase 1: Cognitive Load Experiment
Forty-six university students (23 male, 23 female) participated in the controlled noise-reading experiment. To ensure representativeness, participants were recruited from diverse academic backgrounds, including design, engineering, and social sciences, with varying levels of reading proficiency and familiarity with digital media [34]. This diversity was intended to capture a broad range of cognitive and perceptual profiles relevant to reading-related tasks. Inclusion criteria for Phase 1 required participants to have normal or corrected-to-normal vision, normal hearing ability, and no self-reported history of neurological or psychiatric disorders. Participants with hearing impairments, uncorrected visual difficulties, or conditions likely to interfere with physiological recording were not included. None had prior exposure to the experimental setup, ensuring unbiased engagement and authentic physiological responses during data collection. Participants were recruited through campus announcements and online bulletin boards. Prior to the experiment, all provided written informed consent in accordance with institutional ethical standards. Upon completion, they received a small monetary compensation for participation. Recordings from participants who were unable to complete the full procedure or whose physiological data contained excessive artifacts were excluded from further analysis. As a result, 16 of the 46 recruited participants met the predefined physiological signal-quality criteria and were included in the inferential analyses. The study was conducted in accordance with the Declaration of Helsinki and approved by the Institutional Review Board of the School of Design, Hunan University (Protocol code: P103924; date of approval: 5 June 2025).
3.1.2. Phase 2: Installation Experience
A separate group of twenty-four participants (12 male, 12 female) took part in the interactive installation experience and post-session discussion. This phase was designed as an experiential and qualitative validation stage to explore how participants interpreted the visual deformation and related it to their reading experience under noise. This group was intentionally composed of individuals from diverse professional backgrounds, including designers, educators, researchers, and graduate students from the humanities and engineering, to encourage cross-disciplinary reflection on the sonic visualization interface. Inclusion criteria for Phase 2 required participants to have normal or corrected-to-normal vision and hearing, no prior participation in Phase 1, and the ability to complete the installation experience and follow-up interview. Individuals who had participated in the first experiment or were unable to complete the session were excluded. None of these participants had taken part in the first experiment. Each participant experienced the installation individually, followed by a semi-structured interview regarding perceptual and interpretive responses. In addition, a subset of 12 participants was subsequently organized into four small groups for the “reader + conversers” interaction setup. This group-based stage was determined by the interaction design requirements of the installation, which aimed to support coordinated participation, dialogic reflection, and shared interpretation of the visualization experience. The qualitative observations and quotations reported in this study are derived from this group interaction phase. Participation was voluntary, and written informed consent was obtained prior to engagement. Ethical approval for this phase was covered under the same Institutional Review Board protocol (Protocol code: P103936; date of approval: 12 June 2025).
3.2. Apparatus and Data Acquisition
The cognitive load experiment adopted a within-subject factorial design with noise level as the independent variable. Noise was categorized into four intensity levels: low (0–30 dB), moderate (31–60 dB), high (61–90 dB), and very high (>90 dB). Each participant experienced all four conditions in a counterbalanced order to minimize learning and fatigue effects. Dependent measures included physiological responses, and subjective ratings. EDA and ECG signals were recorded to capture noise-related psychophysiological responses during reading under varying noise levels [35]. In this study, these measures were used as complementary indicators associated with arousal regulation, autonomic reactivity, and perceived reading disruption [35]. The experiment was conducted on a desktop computer equipped with an Intel Core i7 processor, 16 GB RAM, and Windows 11, which was used for stimulus presentation, physiological data acquisition, and real-time synchronization of the visualization system. Data acquisition setup is shown in Figure 1.
Figure 1.
Data acquisition setup.
- EDA data was measured using the ErgoLAB EDA system. EDA signals were acquired using the ErgoLAB EDA system (ErgoLAB, Beijing Kngfar Technology Co., Ltd., Beijing, China) at a sampling rate of 1000 Hz. Before data collection, the EDA sensors were attached according to the manufacturer’s guidelines, and signal quality was checked to ensure stable skin contact before the formal trials began. Two Ag/AgCl electrodes were attached to the central areas of the left and right palms, and the signal was recorded in microsiemens (μS). A baseline recording was then obtained prior to the experimental conditions to support participant-level calibration. Skin conductance level (SCL) was used to characterize tonic electrodermal activity, while skin conductance responses (SCRs) captured phasic changes associated with transient reactions to noise events [36]. Because electrodermal activity may reflect both emotional arousal and task-related effort, these measures were interpreted cautiously in combination with ECG-derived HRV indices, subjective ratings, and controlled experimental conditions.
- ECG data were collected using the ErgoLAB Chest system, which provides high-resolution heart rate acquisition through a chest-mounted wireless module. ECG signals were recorded using the ErgoLAB Chest system (ErgoLAB, Beijing Kngfar Technology Co., Ltd., Beijing, China) at a sampling rate of 1000 Hz via a wireless chest-mounted module. Prior to the experiment, the chest-mounted ECG device was positioned and checked to ensure stable signal acquisition. The device placement followed the manufacturer’s standard instructions to ensure stable R-wave acquisition. Baseline ECG activity was recorded before the noise conditions to reduce the influence of inter-individual physiological variability. Two HRV indices were analyzed: pNN50 (percentage of successive RR intervals differing by more than 50 ms), and RMSSD (root mean square of successive RR differences), reflecting short-term heart rate variability and parasympathetic activity, indicative of autonomic responsiveness [37]. These ECG-derived features were considered jointly with EDA and subjective reports to support a multimodal interpretation of noise-related psychophysiological disruption during reading.
- Environmental noise was measured with a calibrated sound level meter (Brüel & Kjær Type 2250, Brüel & Kjær, Nærum, Denmark) positioned near the reading area [38]. Sound levels were recorded in real time and synchronized with physiological data to align auditory events temporally with participant responses. In Phase 1, the conversational noise stimulus consisted of prerecorded multi-speaker background speech presented through calibrated speakers at controlled sound pressure levels. The recordings were composed of neutral everyday conversations in Mandarin Chinese, involving three adult speakers. The same type of conversational material was used across conditions, while playback intensity was adjusted to achieve the target noise ranges. This conversational-speech stimulus simulated real-world reading environments with background talk as a common distraction, with the highest level representing brief intense auditory disruption. To characterize participants’ actual acoustic exposure more precisely, equivalent continuous sound pressure levels (LAeq) were additionally monitored at ear position for each condition. Specifically, sound levels were sampled every 3 s at three spatial points around the seated participant’s ear position, and the highest observed ear-level reading within each 3-min condition was reported as a conservative estimate of effective exposure. The resulting values were approximately 21.4 dB for the low-noise condition, 45.6 dB for the moderate-noise condition, 71.3 dB for the high-noise condition, and 80.1 dB for the very-high-noise condition. Each noise condition lasted three minutes, with rest intervals between trials, and participants were informed that they could stop the experiment at any time if discomfort occurred.
After each noise condition, participants completed a five-item questionnaire based on a 7-point Likert scale (1 = strongly disagree, 7 = strongly agree) to assess subjective cognitive load and perceived distraction during reading [39]. The questionnaire evaluated five aspects: difficulty in maintaining concentration, perceived mental demand, level of annoyance, perceived decline in comprehension, and overall cognitive overload. The mean score across all items represented participants’ self-reported cognitive effort under each auditory condition. The full questionnaire items are provided in Appendix A.
3.3. Experimental Procedure
All participants completed the experiment individually in a sound-attenuated laboratory to minimize environmental noise interference. Upon arrival, participants were briefed about the study’s objectives and procedures. They were seated comfortably in front of a 24-inch monitor positioned approximately 60 cm away. The ambient temperature (22 ± 1 °C) and illumination (400 lx) were kept constant across all sessions. Before the formal trials, each participant completed a 3-min baseline session. During this period, they silently read a neutral passage to establish individual baseline levels of EDA and ECG. These baseline measurements were used to reduce the influence of inter-individual physiological variability and to support more comparable within-subject interpretation across noise conditions.
The experiment consisted of four noise conditions, presented in a randomized counterbalanced order to control for order effects. In each condition, participants read a short text (approximately 300 words) while the corresponding noise level was played through two calibrated speakers placed symmetrically beside the monitor. Four different passages were used across the four noise conditions. The passages were selected to be comparable in length, general readability, and expository style in order to reduce material-related variability across conditions. The order of noise conditions was counterbalanced across participants, and the assignment of passages to conditions followed the experimental sequence to minimize systematic order effects. Each reading session lasted three minutes, during which EDA and ECG signals were continuously recorded. After each condition, participants completed the same five-item 7-point Likert questionnaire assessing subjective cognitive load and perceived reading disruption. A 2-min rest interval was provided between consecutive conditions to reduce fatigue and physiological carryover effects. The total experimental duration for each participant was approximately 45 min, including preparation, baseline measurement, four reading sessions under different noise levels, rest periods, and questionnaire completion. This structured protocol ensured controlled collection of both physiological and subjective data, allowing reliable comparison across noise intensity levels.
3.4. Data Analysis
Physiological and subjective data were analyzed to evaluate the effects of noise level on psychophysiological responses associated with reading disruption. In particular, EDA and ECG features were interpreted as complementary indicators of autonomic and arousal-related changes, without being treated as independent measures capable of fully distinguishing cognitive load from emotional arousal. All preprocessing and analyses were performed in Python (v3.11) using NumPy, SciPy, Pingouin, and Statsmodels. EDA and ECG data were segmented according to the experimental conditions, with each reading trial treated as a separate 3-min analysis segment. Baseline recordings were processed separately and used for participant-level calibration. No additional sliding-window segmentation or alternative windowing function was applied. EDA signals were recorded at a sampling rate of 1000 Hz and preprocessed using a fourth-order Butterworth band-pass filter (0.05–5 Hz) and then decomposed into SCL and SCR using continuous decomposition analysis [40]. Continuous decomposition analysis was implemented in Python using NeuroKit2 (eda_phasic, method = “cvxEDA”), based on standard tonic–phasic separation procedures described in the literature. No additional trough-to-peak window constraint or overlap correction was applied beyond the default settings of the implemented event-detection procedure. Artifacts were handled conservatively during preprocessing. For EDA, segments showing visually obvious motion-related distortion, abrupt non-physiological spikes, or signal dropouts were identified during signal inspection and excluded before feature extraction rather than corrected at the signal level. After filtering, continuous decomposition analysis was used to separate tonic and phasic components, from which mean SCL and spontaneous SCRs/min were computed for each condition. SCL was computed as the mean value of the tonic component within each condition segment, whereas SCRs/min was computed as the number of spontaneous phasic skin conductance responses detected within that segment divided by its duration in minutes. Spontaneous SCRs were identified from the phasic component using a conservative minimum amplitude threshold of 0.01 μS. Mean SCL (μS) and spontaneous SCRs/min were extracted as sympathetic activity indicators. ECG signals were recorded at a sampling rate of 1000 Hz and preprocessed using a fourth-order Butterworth band-pass filter (0.5–35 Hz), and R peaks were detected to derive successive R–R intervals [41]. R peaks were detected using an automated peak detection algorithm implemented in Python based on the Pan–Tompkins procedure with amplitude and refractory-period constraints, followed by visual inspection for quality control. For ECG/HRV, segments containing obvious artifacts or irregular signal loss were excluded before HRV computation. Ectopic-beat correction was not applied; instead, segments with clearly irregular R–R intervals, excessive motion artifacts, or unreliable signal quality were excluded to ensure conservative HRV estimation. HRV indices were computed for each condition using the full 3-min segment, with a minimum valid duration of 2 min required for inclusion in the analysis. RMSSD was computed as the root mean square of successive differences between adjacent R–R intervals, while pNN50 was computed as the percentage of successive R–R interval pairs differing by more than 50 ms. These indices were then calculated for each reading condition. To improve interpretative stability, subsequent visualization mapping was based on extracted physiological features rather than raw signal fluctuations. In addition, temporal smoothing was applied during data processing to reduce abrupt transient variations that might otherwise lead to unstable visual responses.
Statistical analyses were performed to examine the effects of noise conditions on cognitive and physiological responses. Before conducting the repeated-measures ANOVA, the assumptions of normality and homoscedasticity were assessed using appropriate statistical tests. For repeated-measures factors with more than two levels, sphericity was additionally evaluated using Mauchly’s test, and Greenhouse–Geisser corrections were applied when violations were detected. The significance threshold for all statistical analyses was set at α = 0.05. A one-way repeated-measures ANOVA was first conducted to identify condition differences, followed by pairwise comparisons with Bonferroni correction to determine specific contrasts. To address multiplicity, post hoc multiple comparisons were controlled within each dependent variable using Bonferroni adjustment. Physiological outcomes were interpreted within theoretically distinct domains, namely electrodermal activity (SCL, SCR/min) and heart rate variability (RMSSD, pNN50), rather than as a single family of interchangeable tests. Because these measures reflect different psychophysiological processes, no additional across-measure familywise correction was applied. Effect sizes (Cohen’s d) were calculated to quantify the magnitude of observed effects. To account for inter-individual variability in baseline reactivity, linear mixed-effects models (LMMs) with participant-level random intercepts were fitted for each physiological outcome. This modelling strategy allowed the analysis to account for baseline physiological differences across participants while estimating within-subject effects of noise conditions. In the present study, the LMMs were used to characterize exploratory associations between environmental noise conditions and psychophysiological responses, which informed the prototype visualization framework, which were subsequently used to inform the real-time visualization framework. Noise level was coded as an ordered continuous predictor (1 = low, 2 = moderate, 3 = high, 4 = very high) to estimate the overall linear trend across the four experimental conditions. Models were estimated using maximum likelihood. To examine potential nonlinearity, quadratic and cubic model specifications were also fitted and compared with the linear model using AIC and BIC. The explanatory power of the models was assessed using both marginal and conditional R2, computed from the fitted mixed-effects models in Python based on variance partitioning of the fixed-effects, random-effects, and residual components. Marginal R2 reflects the variance explained by the fixed effects only, whereas conditional R2 reflects the variance explained by both fixed and random effects. Model estimates are reported as fixed-effect coefficients (β) with corresponding p-values. Subjective cognitive load was assessed using a five-item 7-point Likert questionnaire, and the mean score of each item was used in the statistical analysis. Finally, the fitted model was deployed to drive a real-time visualization installation, dynamically modulating text jitter based on inferred noise-related psychophysiological variation associated with reading disruption, thereby making otherwise imperceptible bodily responses perceptually accessible. The linear component of this calibration was adopted as a first-order approximation to support interpretability, computational tractability, and real-time deployment. The LMM-based mapping was derived from the participant data collected in Phase 1, whereas the visualization was implemented and examined in Phase 2 using a newly recruited and different participant sample. Therefore, the calibration and deployment stages were not based on the same participants, which reduces the risk of circularity and provides an initial form of independent evaluation beyond the original modeling sample.
3.5. Sound-Driven Installation Design Framework
3.5.1. Session 1: System Architecture and Interaction Flow
The Reading Noise installation was conceived as an integrated, modular system designed to externalize and visualize the hidden physiological responses of readers under varying auditory conditions (Figure 2a). Its architecture establishes a continuous feedback loop linking physiological sensing, acoustic monitoring, data processing, and visual transformation, thereby bridging empirical measurement and perceptual experience. The system comprises three interlinked modules: (1) signal acquisition, (2) data transmission and processing, and (3) real-time visual output. Each module operates semi-independently yet communicates through synchronized data pipelines to ensure stable, low-latency interaction. At the hardware level, the acoustic subsystem is built on an Arduino-based circuit that serves as the primary control and communication hub. As illustrated in Figure 2b, this circuit integrates a high-sensitivity sound transducer, Arduino Uno microcontroller, breadboard interface, Dupont cable connections, and LED indicators. The transducer continuously captures variations in ambient sound pressure and converts them into analog voltage signals. These signals are transmitted to the Arduino for preprocessing, including amplitude normalization and temporal smoothing, and managed via the Arduino programming interface (Figure 2c) before being sent to a connected computer via serial communication. The LED module provides immediate and intuitive feedback by flickering proportionally to the detected sound intensity, establishing a tangible physical correspondence between environmental noise fluctuations and system response. Simultaneously, the physiological subsystem collects EDA and ECG signals through a wireless biosensing interface. Both devices transmit signals to a computer via a Bluetooth receiver integrated within the acquisition module. The physiological and acoustic data streams are synchronized in real time through a custom Python-based synchronization framework that ensures millisecond-level temporal alignment between sound events and physiological reactions. This synchronization is essential for correlating auditory stimuli with individual cognitive and emotional responses during reading.
Figure 2.
(a) Experimental scene schematic. The dashed circle highlights the sound sensing module; (b) “Reading Noise” installation; (c) Programming interface.
At the data-processing and visualization level, the system uses a hybrid analog-digital pipeline for high signal fidelity and real-time responsiveness. Physiological signals undergo analog conditioning, digital filtering (0.05–35 Hz), and normalization, with artifacts automatically detected and corrected. Acoustic inputs are filtered to reduce environmental interference. Preprocessed multimodal data are then fed into a Python-based visualization engine, where EDA and ECG variations drive dynamic text deformation. To avoid artificially amplifying stress, the visualization parameters were intentionally constrained: deformation amplitude and update frequency were bounded, and temporal smoothing was applied to prevent abrupt escalation in visual intensity. To support interpretative stability, the system applies temporal smoothing and bounded parameter ranges, preventing abrupt changes in visual output caused by short-lived physiological transients or environmental fluctuations. In addition, the rule-based layer constrains the magnitude and update rate of deformation, so that the visualization remains perceptually coherent during real-time interaction. SCL modulates display brightness and color, while SCR triggers transient text jitter, providing an interpretable visual proxy for fluctuations in psychophysiological arousal associated with distraction during reading. Simultaneously, acoustic data modulate background texture and animation, linking noise amplitude to perceived environmental disturbance.
3.5.2. Session 2: Hybrid Sound-Driven Design Framework
The visualization module of the hybrid sound-driven design framework (Figure 3) translates real-time auditory and physiological inputs into dynamic text deformation on screen. This mapping strategy was informed by the experimental findings from Phase 1, in which increased noise intensity was associated with higher electrodermal activity and reduced heart rate variability. These physiological patterns guided the selection of deformation-related parameters, so that stronger arousal-related responses were translated into more salient visual disturbance. In the current implementation, the physiological inputs used for visualization included mean SCL, spontaneous SCR rate, RMSSD, and pNN50, and the visual outputs included jitter amplitude, displacement range, and motion frequency. As ambient noise levels fluctuate, the system continuously monitors corresponding EDA and ECG signals, with different physiological features assigned to different visual parameters rather than being merged into a single undifferentiated deformation response. In the present implementation, this mapping was intentionally designed as a first-order approximation, allowing changes in physiological activity to be rendered through interpretable and computationally stable visual parameters. The degree of deformation was designed to visually reflect variations in physiological arousal-related signals, while rhythmic modulation reflects temporal changes in environmental sound intensity. This prototype mapping from acoustic and physiological input to visual behavior was designed to provide an accessible visual approximation of participants’ responses to sound in real time.
Figure 3.
Hybrid sound-driven design framework.
A two-layer mapping strategy was implemented to ensure both immediacy and accuracy. The first layer, a rule-based mapping, establishes direct correspondences between noise intensity and text deformation parameters such as jitter amplitude, displacement range, and motion frequency to produce intuitive visual feedback. More specifically, ambient sound intensity provided the base temporal modulation of the animation, mean SCL was used to scale the overall displacement range of the text, spontaneous SCR activity modulated transient jitter amplitude, and reductions in RMSSD and pNN50 were used to increase motion irregularity and deformation instability. The second layer, a data-informed prototype calibration, incorporates coefficients derived from offline LMM analyses of physiological data to adjust these parameters in an empirically informed but exploratory manner in a way that remains sensitive to participant-level physiological variation. In this layer, the fixed-effect slopes derived from the LMMs were used to rescale the relative contribution of each physiological feature to its corresponding visual parameter, such that features showing larger condition-related changes exerted stronger visual influence in the final rendering. At the current stage, this calibration was implemented empirically to support an exploratory prototype and to preserve design interpretability during real-time interaction, rather than through a fully systematic optimization procedure. In this sense, the calibration component should be understood as a practical design layer within the hybrid framework. More specifically, the direction and relative magnitude of the observed physiological changes across noise conditions informed how text deformation parameters such as jitter amplitude, displacement range, and motion frequency were scaled in the installation. In this way, the visualization design was grounded not only in intuitive rule-based correspondences but also in experimentally observed psychophysiological responses. To operationalize this mapping, all physiological features were first normalized relative to participant-specific baseline recordings in order to reduce inter-individual variability. For each feature Xt, baseline normalization was defined as = (Xt − Xbase)/Xbase, where Xbase denotes the participant-specific baseline value and denotes the normalized feature used for visual rendering. Based on this normalization, the visual parameters were computed as first-order mappings:
where Dt denotes displacement range, Jt denotes jitter amplitude, and Ft denotes motion frequency at time t; D0, J0 and F0 are the corresponding baseline visual parameters; and α1–α5 are scaling coefficients determined by combining rule-based initial parameter settings with LMM-informed calibration. In this formulation, higher tonic arousal increased overall displacement, stronger phasic activity increased transient jitter, and reductions in HRV contributed to greater motion instability and temporal irregularity.
The mapping procedure can be summarized as follows: physiological features were baseline-normalized, assigned to predefined visual parameters in the rule-based layer, rescaled by LMM-derived coefficients in the calibration layer, temporally smoothed, and then rendered as dynamic text deformation. All data streams, including sound, EDA, and ECG, were temporally synchronized through the custom Python interface. The physiological features used for mapping were temporally smoothed prior to rendering in order to reduce abrupt transient fluctuations in the visual output. Specifically, a 3-s moving average window was applied to the normalized control signals before frame-wise display updates. The visualization engine updates text deformation continuously at 60 frames per second, ensuring perceptual continuity and real-time responsiveness. The LMM-derived calibration coefficients were estimated from the participant data collected in Phase 1, whereas the visualization was implemented and examined in Phase 2 using a different participant sample. Therefore, the calibration and deployment stages were not based on the same participants, which reduces the risk of circularity. No formal hold-out validation was performed within the Phase 1 modeling stage. This framework transforms the invisible micro-fluctuations of physiological responses into perceivable, temporally coherent visual phenomena, providing an experiential medium through which participants engage with the sonic environment as a dynamic, data-mediated process.
4. Results
Inferential statistical analyses were conducted on the analyzable subset (n = 16). Therefore, the physiological findings reported below should be interpreted as exploratory.
4.1. Physiological Indicators
4.1.1. EDA Measures
A repeated-measures ANOVA on EDA data, with Greenhouse–Geisser correction applied following violations of sphericity indicated by Mauchly’s test, suggested significant differences across noise conditions for both SCL (F(1.49, 22.36) = 9.75, p = 0.002) and SCR (F(1.77, 26.54) = 12.74, p < 0.001) components (Table 2).
Table 2.
Result of ANOVA test for physiological measures (SCL, SCR, pNN50, RMSSD) across noise conditions.
- SCL: Mean SCL values increased progressively with rising noise intensity, measuring 4.69 ± 2.13 μS under low noise (0–30 dB), 5.02 ± 2.00 μS under moderate noise (31–60 dB), 5.59 ± 1.87 μS under high noise (61–90 dB), and 5.93 ± 2.19 μS under very high noise (>90 dB). Repeated-measures t-tests with Bonferroni correction indicated significant differences between low and very high noise (t(15) = 5.02, adjusted p = 0.001, Cohen’s d = 1.26) and between moderate and very high noise (t(15) = 4.10, adjusted p = 0.005, Cohen’s d = 1.03), whereas no other pairwise comparisons reached statistical significance after correction. The trend is illustrated in Figure 4a.
- SCR: As shown in Figure 4b, the mean number of spontaneous SCRs per minute increased gradually with rising noise levels, measuring 1.49 ± 1.59, 1.82 ± 1.92, 2.38 ± 1.96, and 2.51 ± 2.13 for low, moderate, high, and very high noise conditions, respectively. Significant differences were found between low and high (t(15) = 4.16, adjusted p = 0.005, Cohen’s d = 1.04), low and very high (t(15) = 6.39, adjusted p < 0.001, Cohen’s d = 1.60), and moderate and very high noise levels (t(15) = 3.22, adjusted p = 0.03, Cohen’s d = 0.81), whereas no other pairwise comparisons reached statistical significance after Bonferroni correction. Detailed post hoc pairwise results are summarized in Table 3.
Figure 4.
Mean and standard deviation of (a) skin conductance level (SCL), (b) skin conductance response (SCR), (c) percentage of successive normal-to-normal intervals differing by more than 50 ms (pNN50), and (d) root mean square of successive differences (RMSSD) across four experimental conditions.
Table 3.
Results of pairwise t-tests comparing physiological measures between different noise levels.
4.1.2. ECG Measures
A Greenhouse–Geisser-corrected repeated-measures ANOVA indicated that noise condition had a significant main effect on HRV time-domain (pNN50: F(1.70, 25.43) = 8.38, p = 0.003; RMSSD: F(1.50, 22.49) = 9.04, p = 0.003; see Table 2). As shown in Table 3, post hoc t-tests further showed a systematic decrease in pNN50 and RMSSD values with increasing environmental noise intensity.
- pNN50: Mean pNN50 values were 15.84 ± 16.52% under low noise (0–30 dB), 15.59 ± 15.81% under moderate noise (31–60 dB), 12.67 ± 12.15% under high noise (61–90 dB), and 10.57 ± 11.35% under very high noise (>90 dB). Post hoc comparisons revealed a significant difference between very high noise and each of the other three conditions, including low vs. very high (t(15) = 4.66, adjusted p = 0.002, Cohen’s d = 1.17), moderate vs. very high (t(15) = 3.55, adjusted p = 0.02, Cohen’s d = 0.89), and high vs. very high noise (t(15) = 3.59, adjusted p = 0.02, Cohen’s d = 0.90), whereas no other pairwise comparisons reached statistical significance after Bonferroni correction (see Figure 4c).
- RMSSD: As illustrated in Figure 4d, RMSSD values showed a declining trend across the four noise levels: 36.63 ± 17.62 ms, 35.33 ± 15.11 ms, 31.79 ± 15.29 ms, and 29.67 ± 16.66 ms. Pairwise comparisons indicated significant differences between low and high noise conditions (t(15) = 3.47, adjusted p = 0.02, Cohen’s d = 0.87) between low and very high noise conditions (t(15) = 5.59, adjusted p < 0.001, Cohen’s d = 1.40), and between high and very high noise conditions (t(15) = 3.30, adjusted p = 0.03, Cohen’s d = 0.83), while the difference between low and moderate conditions was not significant.
4.2. Subjective Questionnaire Responses
Participants reported varying levels of cognitive load across different noise conditions (Table 4). The questionnaire comprised five distinct subjective dimensions rather than a single composite scale. Repeated-measures ANOVAs on the five dimensions revealed significant main effects of noise level on difficulty in maintaining concentration (F(1.75, 26.20) = 79.28, p < 0.001, η2 = 0.84), perceived mental demand (F(2.17, 32.50) = 36.30, p < 0.001, η2 = 0.71), frustration level (F(1.97, 29.48) = 297.18, p < 0.001, η2 = 0.95), perceived difficulty understanding (F(1.68, 25.19) = 93.34, p < 0.001, η2 = 0.86), and self-rated Overall Cognitive Load (F(2.11, 31.59) = 484.95, p < 0.001, η2 = 0.97).
Table 4.
Subjective ratings on 7-Point Likert Scales across experimental conditions.
4.3. LMM Analysis
Given the limited analyzable physiological sample (n = 16), these mixed-effects results are reported as exploratory associations intended to inform the prototype mapping framework rather than to support broad generalizable calibration claims. LMMs of the form Yij = β0 + β1 Xij + u0j + εij were fitted to examine the association between physiological measures in response and noise level where X was coded as an ordered continuous predictor from 1 = low to 4 = very high (Figure 5), u0 denotes the participant-specific random intercept, and ε denotes the residual error. Model diagnostics included visual inspection of residual distributions, Q-Q plots, fitted-versus-residual plots, and checks for influential observations to assess whether model assumptions were reasonably satisfied. For EDA, exploratory linear associations were observed within the analyzable subset, with SCL (β0 = 4.23, p < 0.001; β1 = 0.43, p < 0.001; marginal R2 = 0.86, conditional R2 = 0.91) and SCR (β0 = 1.15, p = 0.022; β1 = 0.36, p < 0.001; marginal R2 = 0.91, conditional R2 = 0.95) increasing as noise levels rose. Significant negative linear trends were observed for HRV measures, with both pNN50 (β0 = 18.35, p < 0.001; β1 = −1.87, p < 0.001; marginal R2 = 0.94, conditional R2 = 0.96) and RMSSD (β0 = 39.47, p < 0.001; β1 = −2.44, p < 0.001; marginal R2 = 0.92, conditional R2 = 0.95) decreasing with increasing noise levels. Quadratic and cubic LMMs were also fitted for each physiological measure. The higher-order terms were not significant in any model (all p > 0.24), and the linear model had the lowest AIC and BIC values for all four physiological indices (see Table 5), suggesting that a linear specification provided the most parsimonious fit within this sample with noise level. Because noise level was experimentally manipulated as a four-level condition, supplementary mixed-effects analyses treating noise condition as a categorical factor were also conducted. These categorical models showed significant overall condition effects for all four physiological measures (all omnibus likelihood-ratio test p values < 0.001), with patterns broadly consistent with the ordered linear specification. Specifically, the moderate noise condition did not differ significantly from the low condition, whereas the high and very high noise conditions showed larger deviations from the low-noise reference level, suggesting a threshold-like separation between lower and higher noise levels rather than a strictly uniform increment across adjacent conditions. Accordingly, the linear model is retained here as a parsimonious summary of the overall ordered trend, whereas the categorical models provide a more fine-grained description of the condition structure. The relatively high marginal and conditional R2 values should be interpreted cautiously, given the repeated-measures structure, the ordered manipulation of noise level, and the limited analyzable sample; they are reported here as descriptive indicators of model fit within the present sample.
Figure 5.
Estimated relationships between noise level and physiological responses based on linear mixed-effects models (LMMs) fitted to the analyzable subset (n = 16). (a) Skin conductance level (SCL), (b) skin conductance response (SCR), (c) percentage of successive normal-to-normal intervals differing by more than 50 ms (pNN50), and (d) root mean square of successive differences (RMSSD). Each dot represents an individual participant’s observation under a given noise condition, with colors indicating different participants (P1–P16). Solid blue lines represent model-estimated trends across noise levels.
Table 5.
Comparison of linear, quadratic, and cubic linear mixed-effects models for physiological responses across noise levels.
4.4. Reading Noise Installation Experience and Qualitative Reflections
Of the 24 participants involved in Phase 2, 12 were subsequently organized into four groups, each comprising one reader and two conversers who generated controlled background speech during the reading task. The qualitative observations and quotations reported in this section are derived from this group interaction phase. All participants experienced the Reading Noise installation, which dynamically visualized changes in the auditory environment through text deformation. Ambient sound pressure level (dB), measured continuously via an Arduino-based sensing module, was transmitted to the interface and mapped to deformation parameters including jitter amplitude, displacement range, and motion frequency. Figure 6 illustrates the visual states corresponding to four noise ranges. As noise intensity increased, the interface displayed progressively stronger deformation, making changes in reading rhythm and hesitation perceptible in real time. A representative session was video-recorded for documentation and supplementary demonstration of the installation behavior (see Supplementary Materials). The recording is used to illustrate the system’s real-time expressive mapping rather than as a standalone measure of reading performance.
Figure 6.
Visual mapping of text deformation under four levels of environmental noise. The text shown is adapted from an English literary passage for experimental purposes. The deformation and color changes were intentionally introduced to represent the visual distortion effects associated with different noise levels.
Post-session comments from both readers and conversers indicated four recurring themes: (1) visualization of attention disruption, (2) increased awareness of how conversational noise affects others, (3) embodied perception of cognitive strain, and (4) support for cross-disciplinary discussion. Participants frequently described the deformation as making concentration “visible” and “discussable,” while conversers reported heightened awareness of their role in shaping the reader’s experience. These responses support the use of Reading Noise as a boundary object that externalizes otherwise internal cognitive and affective states. Participants are identified as P1–P12; quotes are annotated with participant role and disciplinary background where relevant. Representative comments include: “When it was quiet, the text felt calm and readable; once noise appeared, it was as if the words lost balance and my focus slipped away” (P1, Reader, Designer); “Seeing the letters shake made me realize how even mild conversation can interrupt someone’s focus” (P5, Converser, Educator); “The visualization turned attention into something observable—you could literally see concentration fluctuate in real time” (P6, Converser, Researcher); “Under high noise, I could not maintain reading flow; the text motion seemed to embody frustration and fatigue” (P4, Reader, Designer); and “The installation externalized what we normally experience internally; distraction became shared, visible, and discussable” (P11, Converser, Educator).
5. Discussion
5.1. Cognitive and Emotional Effects of Noise
Addressing the first research question regarding how ambient noise affects readers’ cognitive load and emotional arousal, the present study provides preliminary converging physiological and subjective evidence that environmental noise may be associated with psychophysiological strain during reading tasks. As noise intensity increased, EDA showed a progressive rise, reflecting heightened sympathetic nervous system activation and sustained arousal. In contrast, HRV indices declined significantly, suggesting diminished parasympathetic modulation and impaired autonomic balance. These physiological changes corresponded with participants’ self-reports of increased mental effort, frustration, and subjective difficulty understanding the text. Taken together, the multimodal pattern in this sample suggests that higher noise levels may be associated with increased psychophysiological burden during reading, although these physiological findings remain exploratory given the limited analyzable subset [42,43]. Similar psychophysiological patterns have been observed in studies of auditory distraction, where exposure to unpredictable or high-intensity noise elevates sympathetic activation and reduces HRV coherence [44]. Likewise, prolonged noise exposure has been linked to elevated cortisol and electrodermal responses indicative of stress and attentional fatigue [45]. From a cognitive perspective, these exploratory findings are broadly consistent with Cognitive Load Theory, although the limited physiological sample constrains the strength of generalization [46], in that extraneous auditory stimulation may increase task-related effort and interfere with attentional regulation during reading. As environmental noise increases, readers may need to allocate additional attentional effort to inhibit irrelevant auditory input, potentially reducing the cognitive resources available for semantic processing and contributing to perceived comprehension difficulty.
Qualitative and observational evidence during the reading sessions was broadly consistent with these physiological findings. Under low noise (40–60 dB), participants maintained steady posture and fluent reading. Under moderate noise, participants showed greater visual hesitation and less fluent reading behavior, suggesting increased attentional effort. Under the highest noise condition, participants appeared more fatigued and less engaged with the task, accompanied by pronounced physiological reactivity. The convergence across these multimodal measures suggests that rising noise intensity was associated with simultaneous physiological activation, perceived strain, and observable signs of reading difficulty or hesitation. Collectively, these exploratory results suggest a possible extension of traditional cognitive load frameworks by incorporating physiological evidence, illustrating that noise-induced reading difficulty involves not only information-processing constraints but also measurable autonomic and emotional reactions.
5.2. Sonic Boundary Objects for Cross-Group Understanding
With respect to the third research question concerning whether sound-mediated visualization can support empathetic and cross-disciplinary understanding of noise-induced cognitive effects, the findings suggest that the Reading Noise installation may function as a shared interpretive reference across disciplinary perspectives. Prior research in sonic interaction design and participatory sound studies has demonstrated how auditory media can serve as mediating tools across disciplinary boundaries [47,48,49]. The interactive installation developed in this study functions as a sonic boundary object, converting synchronized sound, EDA, and HRV data into dynamic text deformation in real time. This perceptual mapping provided a shared sensory reference through which participants could anchor their interpretations of psychophysiological strain and the experiential aspects of noise-related subjective reading difficulty. Qualitative observations indicated that participants spontaneously used the deformed text visuals as conversational anchors when reflecting on their reading experience. Designers described the “jittering text” as a visualization of attention loss, educators interpreted the patterns as indicators of cognitive fatigue, and researchers viewed them as proxies for physiological reactivity. These qualitative responses suggest that the text deformation was generally interpreted as a representation of distraction, cognitive strain, and reading disruption rather than as a purely decorative or aesthetic effect. Accordingly, Phase 2 is presented here as providing preliminary experiential evidence of interpretability. Through this process, the installation fostered a cross-group dialogue that transcended disciplinary jargon, promoting mutual intelligibility and empathy toward the phenomenon of noise-induced cognitive disruption [50]. It not only visualized the physiological burden of reading under noise but also facilitated mutual learning: educators gained a concrete understanding of cognitive strain, designers appreciated the temporal dynamics of user attention, and researchers obtained rich qualitative data grounded in lived experience. Such outcomes demonstrate the communicative and epistemic potential of sonic boundary objects in facilitating interdisciplinary translation of complex, intangible phenomena [51]. Ultimately, this study shows that by mediating between physiological data and perceptual experience, sonic boundary objects can foster interdisciplinary understanding and lay the groundwork for sound-driven approaches to cognitive and affective design.
5.3. Hybrid Sound-Driven Design Framework
In relation to the second research question, the present study examines the feasibility of translating real-time auditory and physiological data into dynamic text deformation through a hybrid sound-driven visualization framework. The hybrid sound-driven visualization framework developed in this study uses real-time auditory and physiological data to generate dynamic visual feedback, providing an interpretable prototype representation of cognitive and affective variation through design. Unlike conventional sound-driven installations that primarily create atmospheric or experiential effects, this framework emphasizes perceptual representation of measurable cognitive and emotional responses. By mapping physiological indices such as EDA and HRV into text deformation in real time, the system allowed participants to perceive a visualized approximation of noise-related psychophysiological changes associated with reading disruption [52]. Similar approaches in affective computing and embodied interaction have demonstrated that heart rate, galvanic skin response, and other physiological data can be converted into dynamic visual or auditory cues to enhance awareness and interaction [53]. At the same time, the framework invites critical consideration of interpretive and perceptual fidelity, as participants may perceive visual deformations differently and the translation from physiological signals to visual output necessarily simplifies complex internal states [54]. The current mapping strategy should also be understood as an empirically calibrated design solution rather than a fully optimized physiological-to-visual model. This study aimed to establish an interpretable and deployable real-time prototype. Nevertheless, more systematic optimization procedures, including parametric tuning, model-based calibration, and user-in-the-loop adjustment, may further improve mapping precision, robustness, and reproducibility. These directions remain important priorities for future work. At the same time, interpretative stability remains a challenge in more dynamic real-world environments, where physiological fluctuations may be influenced by multiple uncontrolled factors. The present findings should therefore be understood as evidence of feasibility under controlled experimental conditions rather than as a guarantee of stable interpretation across all contexts. Future work should evaluate robustness under more ecologically complex acoustic and interaction settings. Overall, this hybrid approach exemplifies a rigorous yet fluent design strategy that bridges empirical measurement and experiential design, highlighting the potential of sound-driven visualizations to inform not only interactive installations but also broader applications in cognitive ergonomics, affective design, and educational technologies [55], and demonstrating the value of translating embodied data into actionable design insights. Beyond the installation context, the proposed framework may have broader implications for educational and cognitive-support environments. For example, real-time visualization of noise-related cognitive burden could help inform environmental design in classrooms, libraries, or study spaces by making otherwise hidden sources of distraction more perceptible. In cognitive ergonomics, such a framework may support the design of environments that better align with users’ attentional and physiological capacities. It may also contribute to adaptive learning systems, where real-time awareness of cognitive load could help optimize learning conditions and support more responsive educational interventions.
6. Limitations and Future Work
While this study provides novel insights, several limitations should be noted. The four discrete noise levels simplify the complex acoustic variability of real-world reading environments. Accordingly, future work should explore continuous acoustic modelling and non-linear psychophysiological response patterns to improve ecological validity and modelling precision. Physiological measures such as EDA and ECG capture arousal but do not directly isolate higher-order cognitive processes like comprehension or internal distraction. In addition, although 46 participants took part in Phase 1, the inferential physiological analyses and LMM-based modelling were conducted on the analyzable subset (n = 16) after data quality screening. This relatively limited effective sample size is not sufficient to support claims of universal mapping. Although the LMM-based mapping was subsequently implemented and examined in Phase 2 using a newly recruited participant sample, no formal within-phase cross-validation or hold-out validation was conducted during the Phase 1 modelling stage. Accordingly, the current framework should be interpreted as a preliminary and experimentally calibrated mapping approach that has received an initial independent examination, rather than as a fully validated or universally generalizable predictive model. From a design perspective, the Reading Noise installation was tested in a controlled laboratory, potentially limiting ecological validity and experiential aspects such as engagement, immersion, and interpretive variability. In addition, novelty effects were not independently measured in the present study, particularly during the experiential installation phase. Interactions in naturalistic or collaborative settings may differ, leaving some behavioral responses and design affordances underexplored. In more complex real-world environments, the framework may also be affected by overlapping sound sources, irregular acoustic events, and contextual factors that were not present in the controlled laboratory setting. These conditions may influence both physiological responses and the interpretability of the resulting visual feedback, and may require additional calibration or adaptive mechanisms for robust deployment. Future research should incorporate more complex noise patterns, including intermittent speech, overlapping conversations, and dynamic spatial distributions [56], alongside additional measurements such as eye-tracking or EEG to better relate auditory stimuli to cognitive load and emotional responses [57]. Future work should also incorporate repeated-exposure or longitudinal designs to better distinguish interpretability effects from novelty-related responses. Future work should also incorporate formal participant-level cross-validation and/or external validation datasets to more rigorously assess the predictive stability and generalizability of the current mapping framework. Deploying the installation in authentic educational or public contexts could reveal how participants interpret dynamic auditory feedback over time, enabling evaluation of user engagement and guiding improvements in design and pedagogical interventions.
7. Conclusions
Reading Noise integrates real-time physiological sensing with sound-driven visualization, serving as a boundary object to bridge understanding across disciplines. Results suggested that increasing environmental noise was associated with psychophysiological strain and higher subjective cognitive load within the present study conditions, evidenced by elevated EDA, reduced HRV, and higher subjective cognitive load, observational indications of disrupted reading engagement and fatigue. By mapping physiological signals to dynamic text deformation, the installation provided an interpretable prototype visualization of otherwise difficult-to-perceive cognitive and emotional responses, enabling participants from diverse backgrounds to perceive and discuss otherwise imperceptible phenomena. This framework demonstrates the potential of sound-driven visualization to convey cognitive and affective states, foster interdisciplinary dialogue, and inform research, educational interventions, and affective design. Overall, Reading Noise illustrates how physiological sensing and interactive visualization may help make otherwise difficult-to-perceive aspects of noise-related reading experience more tangible and support cross-disciplinary insight.
Supplementary Materials
The supplementary video is available at: https://www.youtube.com/watch?v=nwvhMWeHbUs (accessed on 25 December 2025).
Author Contributions
Conceptualization, X.L. and Y.W.; methodology, X.L. and Y.W.; validation, X.L., Y.L. and Z.J.; formal analysis, X.L., Z.J. and Y.W.; writing—original draft preparation, X.L. and Y.W.; writing—review and editing, X.L., Y.L. and Z.J.; visualization, X.L. and Y.W.; supervision, Y.L.; funding acquisition, Y.L. All authors have read and agreed to the published version of the manuscript.
Funding
This research was funded by the Key Project Supported by the National Social Science Fund of China (grant number 20ZD09-4) and the Key Research and Development Program of Hunan Province of China (grant number 2024JK2025).
Institutional Review Board Statement
The study was conducted in accordance with the Declaration of Helsinki and approved by the Institutional Review Board of the School of Design, Hunan University. Phase 1 (Cognitive Load Experiment) was approved under Protocol code P103924 (date of approval: 5 June 2025), and Phase 2 (Installation Experience) was approved under Protocol code P103936 (date of approval: 12 June 2025).
Informed Consent Statement
Informed consent was obtained from all subjects involved in the study prior to participation, including consent for physiological data collection and video recording for research documentation and Supplementary Materials. Written informed consent was obtained from participants for the publication of identifiable materials, where applicable.
Data Availability Statement
The data presented in this study are available on request from the corresponding author. The data are not publicly available due to privacy or ethical restrictions.
Acknowledgments
The authors thank all participants for their time and thoughtful contributions to the Reading Noise study. We are also grateful to the School of Design, Hunan University, for providing support for the development and testing of the interactive installation. We thank colleagues who assisted with pilot testing and technical setup.
Conflicts of Interest
The authors declare no conflict of interest.
Appendix A
Table A1.
Subjective Questionnaire Items.
References
- Harmon, T.G.; Dromey, C.; Nelson, B.; Chapman, K. Effects of background noise on speech and language in young adults. J. Speech Lang. Hear. Res. 2021, 64, 1104–1116. [Google Scholar] [CrossRef] [Scilit] [PubMed]
- Marsh, J.E.; Bell, R.; Röer, J.P.; Hodgetts, H.M. Emerging perspectives on distraction and task interruptions: Metacognition, cognitive control and facilitation—Part I. J. Cogn. Psychol. 2024, 36, 1–7. [Google Scholar] [CrossRef] [Scilit]
- Gheewalla, F.; McClelland, A.; Furnham, A. Effects of background noise and extraversion on reading comprehension performance. Ergonomics 2021, 64, 593–599. [Google Scholar] [CrossRef] [Scilit]
- Ke, J.; Du, J.; Luo, X. The effect of noise content and level on cognitive performance measured by electroencephalography (EEG). Autom. Constr. 2021, 130, 103836. [Google Scholar] [CrossRef] [Scilit]
- Massonnié, J.; Frasseto, P.; Mareschal, D.; Kirkham, N.Z. Learning in noisy classrooms: Children’s reports of annoyance and distraction from noise are associated with individual differences in mind-wandering and switching skills. Environ. Behav. 2022, 54, 58–88. [Google Scholar] [CrossRef] [Scilit]
- Que, Y.; Zheng, Y.; Hsiao, J.H.; Hu, X. Using eye movements, electrodermal activities, and heart rates to predict different types of cognitive load during reading with background music. Sci. Rep. 2025, 15, 32635. [Google Scholar] [CrossRef] [Scilit]
- Zdorova, N.; Malyutina, S.; Laurinavichyute, A.; Kaprielova, A.; Ziubanova, A.; Lopukhina, A. Do we rely on good-enough processing in reading under auditory and visual noise? PLoS ONE 2023, 18, e0277429. [Google Scholar] [CrossRef] [Scilit]
- Grond, F.; Devos, P. Sonic boundary objects: Negotiating disability, technology and simulation. Digit. Creat. 2016, 27, 334–346. [Google Scholar] [CrossRef] [Scilit]
- Delle Monache, S.; Misdariis, N.; Ozcan, E. Conceptualising sound-driven design: An exploratory discourse analysis. In Proceedings of the 13th Conference on Creativity and Cognition, Venice, Italy, 22–23 June 2021. [Google Scholar] [CrossRef] [Scilit]
- Bostan, I.; van Egmond, R.; Gommers, D.; Özcan, E. ICU alarm management reimagined: Sound-driven design and the role of acoustic biotope. In Proceedings of the DRS2024, Boston, MA, USA, 23–28 June 2024. [Google Scholar] [CrossRef] [Scilit]
- Lee, S.; Kim, J.; Kim, S.; Song, H.; Ryu, J. An online survey on self-reported workplace design and personal factors concerning speech privacy satisfaction in open-plan office environment. Appl. Acoust. 2023, 202, 109179. [Google Scholar] [CrossRef] [Scilit]
- Cvijanović, N.; Kechichian, P.; Janse, K.; Kohlrausch, A. Effects of noise on arousal in a speech communication setting. Speech Commun. 2017, 88, 127–136. [Google Scholar] [CrossRef] [Scilit]
- Mattys, S.L.; O’Leary, R.M.; McGarrigle, R.A.; Wingfield, A. Reconceptualizing cognitive listening. Trends Cogn. Sci. 2025; in press. [CrossRef] [Scilit] [PubMed]
- Grenzebach, J.; Romanus, E. Quantifying the effect of noise on cognitive processes: A review of psychophysiological correlates of workload. Noise Health 2022, 24, 199–214. [Google Scholar] [CrossRef] [Scilit]
- Orru, G.; Longo, L. The evolution of cognitive load theory and the measurement of its intrinsic, extraneous and germane loads: A review. In Proceedings of the International Symposium on Human Mental Workload: Models and Applications, Rome, Italy, 20–21 September 2018; pp. 23–48. [Google Scholar] [CrossRef] [Scilit]
- Marois, A.; Vachon, F. Psychophysiological markers of auditory distraction: A scoping review. Aud. Percept. Cogn. 2024, 7, 9–49. [Google Scholar] [CrossRef] [Scilit]
- Que, Y.; Hu, X. Examining the effect of background music on learners’ attention and cognition in virtual reality environments: A psychophysiological study. Int. J. Hum.-Comput. Interact. 2026, 42, 211–224. [Google Scholar] [CrossRef] [Scilit]
- Fan, Y.; Liang, J.; Cao, X.; Pang, L.; Zhang, J. Effects of noise exposure and mental workload on physiological responses during task execution. Int. J. Environ. Res. Public Health 2022, 19, 12434. [Google Scholar] [CrossRef] [Scilit]
- Zahmat Doost, E.; Zhang, W. Mental workload variations during different cognitive office tasks with social media interruptions. Ergonomics 2023, 66, 592–608. [Google Scholar] [CrossRef] [Scilit]
- Horvers, A.; Tombeng, N.; Bosse, T.; Lazonder, A.W.; Molenaar, I. Detecting emotions through electrodermal activity in learning contexts: A systematic review. Sensors 2021, 21, 7869. [Google Scholar] [CrossRef] [Scilit]
- Xie, X.; Wang, Y.; Cui, Y.; Yu, S.; Chen, D.; Chu, J. Evaluation of cognitive load and user experience in alternative interaction modes under different noise degrees. Adv. Eng. Inform. 2025, 65, 103328. [Google Scholar] [CrossRef] [Scilit]
- Faudzi, M.A.; Cob, Z.C.; Ghazali, M.; Omar, R.; Sharudin, S.A. User interface design in mobile learning applications: Developing and evaluating a questionnaire for measuring learners’ extraneous cognitive load. Heliyon 2024, 10, e37494. [Google Scholar] [CrossRef] [Scilit]
- Delle Monache, S.; Misdariis, N.; Özcan, E. Semantic models of sound-driven design: Designing with listening in mind. Des. Stud. 2022, 83, 101134. [Google Scholar] [CrossRef] [Scilit]
- Chung, W.M.; Tsai, W.C.; Liang, R.H.; Liu, M.; Kong, B.; Huang, Y.; Chang, F.C. Soundscape fiction: Designing and situating sonic design fiction to stimulate the imagination. Digit. Creat. 2025, 36, 1–23. [Google Scholar] [CrossRef] [Scilit]
- Star, S.L.; Griesemer, J.R. Institutional ecology, ‘translations’ and boundary objects: Amateurs and professionals in Berkeley’s Museum of Vertebrate Zoology, 1907–1939. Soc. Stud. Sci. 1989, 19, 387–420. [Google Scholar] [CrossRef] [Scilit]
- Klein, J.T. Beyond Interdisciplinarity: Boundary Work, Communication, and Collaboration; Oxford University Press: Oxford, UK, 2021. [Google Scholar]
- Yoo, M.; Odom, W.; Berger, A.; Barnett, S.; Kenny, S.; Lo, P. Remembering through sound: Co-creating sound-based mementos together with people with blindness. In Proceedings of the 2024 CHI Conference on Human Factors in Computing Systems, Honolulu, HI, USA, 11–16 May 2024; pp. 1–19. [Google Scholar] [CrossRef] [Scilit]
- Terlouw, G.; Kuipers, D.; Veldmeijer, L.; van’t Veer, J.; Prins, J.; Pierie, J.P. Boundary objects as dialogical learning accelerators for social change in design for health: Systematic review. JMIR Hum. Factors 2022, 9, e31167. [Google Scholar] [CrossRef] [Scilit]
- Zurba, M.; Land, G.; Bullock, R.; Graham, B. Exploring Indigenization and decolonization in cross-cultural education through collaborative land-based boundary education. J. Cult. Geogr. 2022, 39, 8–31. [Google Scholar] [CrossRef] [Scilit]
- Chen, X.; Ibrahim, Z. A comprehensive study of emotional responses in AI-enhanced interactive installation art. Sustainability 2023, 15, 15830. [Google Scholar] [CrossRef] [Scilit]
- Guastavino, C.; Fraisse, V.; D’Ambrosio, S.; Legast, E.; Lavoie, M. Designing sound installations in public spaces: A collaborative research-creation approach. In Designing Interactions for Music and Sound; Focal Press: Oxford, UK, 2022. [Google Scholar]
- Truax, B. Acoustic sustainability in urban design: Lessons from the World Soundscape Project. Cities Health 2021, 5, 122–126. [Google Scholar] [CrossRef] [Scilit]
- Avci, U.; Aran, O. Predicting the performance in decision-making tasks: From individual cues to group interaction. IEEE Trans. Multimed. 2016, 18, 643–658. [Google Scholar] [CrossRef] [Scilit]
- Stanley, M. Qualitative descriptive: A very good place to start. In Qualitative Research Methodologies for Occupational Science and Occupational Therapy; Routledge: London, UK, 2023. [Google Scholar]
- Boffet, A.; Arsac, L.-M.; Ibanez, V.; Sauvet, F.; Deschodt-Arsac, V. Detection of cognitive load modulation by EDA and HRV. Sensors 2025, 25, 2343. [Google Scholar] [CrossRef] [Scilit]
- Lin, Y.D.; Tan, Y.K.; Ku, T.; Tian, B. A frequency estimation scheme based on Gaussian average filtering decomposition and Hilbert transform: With estimation of respiratory rate as an example. Sensors 2023, 23, 3785. [Google Scholar] [CrossRef] [Scilit]
- Maduro, P.A.; Maduro, L.A.R.; Lima, P.E.; Silva, A.C.C.; Silva, R.D.C.M.D.; Rocha, A.S.L.; Ribeiro, M.J.S.; Matoso, J.M.D.; Gambassi, B.B.; Schwingel, P.A. Cardiac autonomic modulation and cognitive performance in community-dwelling older adults: A preliminary study. Neurol. Int. 2025, 17, 74. [Google Scholar] [CrossRef] [Scilit]
- Bosch-Alcaraz, A.; Fernández-Lorenzo, R.; Saz-Roy, M.A.; Domínguez-Delso, M.C.; Santaolalla-Bertolin, M.; Ferrer-Orona, M.; Alcolea-Monge, S. Comparative analysis of environmental noise levels in two paediatric intensive care units. Enferm. Intensiva (Engl. Ed.) 2021, 32, 11–17. [Google Scholar] [CrossRef] [Scilit]
- Zielińska, A.; Lebuda, I.; Karwowski, M. Scaling the creative self: An item response theory analysis of the short scale of creative self. Creat. Res. J. 2022, 34, 431–444. [Google Scholar] [CrossRef] [Scilit]
- Tsirmpas, C.; Konstantopoulos, S.; Andrikopoulos, D.; Kyriakouli, K.; Fatouros, P. Transformer-based decomposition of electrodermal activity for real-world mental health applications. Sensors 2025, 25, 4406. [Google Scholar] [CrossRef] [Scilit]
- Jaen, I.; Fuentes-Sanchez, N.; Escrig, M.A.; Suso-Ribera, C.; Reyes del Paso, G.; Pastor, M.C. Covariate effects of resting heart rate variability on affective ratings and startle reflex during cognitive reappraisal of negative emotions. Cogn. Emot. 2021, 35, 1039–1048. [Google Scholar] [CrossRef] [Scilit] [PubMed]
- Zhang, J.; Pang, L.; Yang, C.; Fan, Y.; Zhao, B.; Cao, X. Experimental evaluation of noise exposure effects on subjective perceptions and cognitive performance. Buildings 2024, 14, 1100. [Google Scholar] [CrossRef] [Scilit]
- Karageorghis, C.I.; Kuan, G.; Mouchlianitis, E.; Payre, W.; Howard, L.W.; Reed, N.; Parkes, A.M. Interactive effects of task load and music tempo on psychological, psychophysiological, and behavioural outcomes during simulated driving. Ergonomics 2022, 65, 915–932. [Google Scholar] [CrossRef] [Scilit]
- Radun, J.; Maula, H.; Rajala, V.; Scheinin, M.; Hongisto, V. Acute stress effects of impulsive noise during mental work. J. Environ. Psychol. 2022, 81, 101819. [Google Scholar] [CrossRef] [Scilit]
- Labonté, K.; Marsh, J.E.; Vachon, F. Distraction by auditory categorical deviations is unrelated to working memory capacity: Further evidence of a distinction between acoustic and categorical deviation effects. Aud. Percept. Cogn. 2022, 4, 139–164. [Google Scholar] [CrossRef] [Scilit]
- Sweller, J. Cognitive load theory and individual differences. Learn. Individ. Differ. 2024, 110, 102423. [Google Scholar] [CrossRef] [Scilit]
- Cheng, L.; Lam, C.Y. Developing communicative competencies in children with functional diversity through music technology: A posthuman perspective. Music Educ. Res. 2025, 27, 230–244. [Google Scholar] [CrossRef] [Scilit]
- Che, M.; Li, H.; Chen, Z.; Li, Q.; Kim, N. Voice-interactive 2D serious game with three-tier scaffolding for teaching acoustics in primary schools: A randomized comparison of knowledge, motivation, and cognitive load. Appl. Sci. 2025, 15, 11761. [Google Scholar] [CrossRef] [Scilit]
- Liu, W.; Dementyev, A.; Schwarz, D.; Flety, E.; Mackay, W.E.; Beaudouin-Lafon, M.; Bevilacqua, F. Sonichoop: Using interactive sonification to support aerial hoop practices. In Proceedings of the 2021 CHI Conference on Human Factors in Computing Systems, Yokohama, Japan, 8–13 May 2021. [Google Scholar] [CrossRef] [Scilit]
- Burns-O’Connell, G.; Stockdale, D.; Cassidy, O.; Knowles, V.; Hoare, D.J. Surrounded by sound: The impact of tinnitus on musicians. Int. J. Environ. Res. Public Health 2021, 18, 9036. [Google Scholar] [CrossRef] [Scilit]
- Dolan, E.I.; MacGregor, E.; Schwartz, A. Sonic Circulations: Music, Modernism, and the Politics of Knowledge; University of Pennsylvania Press: Philadelphia, PA, USA, 2025. [Google Scholar]
- Jing, A.; Frederick, M.; Sewell, M.; Karlson, A.; Simpson, B.; Smith, M. How visualising emotions affects interpersonal trust and task collaboration in a shared virtual space. In Proceedings of the 2023 IEEE International Symposium on Mixed and Augmented Reality (ISMAR), Sydney, NSW, Australia, 16–20 October 2023. [Google Scholar] [CrossRef] [Scilit]
- Arslan, E.E.; Akşahin, M.F.; Yilmaz, M.; Ilgın, H.E. Towards emotionally intelligent virtual environments: Classifying emotions through a biosignal-based approach. Appl. Sci. 2024, 14, 8769. [Google Scholar] [CrossRef] [Scilit]
- Kuipers, M.; Kappen, M.; Naber, M. How nervous am I? How computer vision succeeds and humans fail in interpreting state anxiety from dynamic facial behaviour. Cogn. Emot. 2023, 37, 1105–1115. [Google Scholar] [CrossRef] [Scilit]
- Delle Monache, S.; Moleman, R.; Ozcan, E. Soundstorm, a collaborative ideation game for sound-driven design. In Proceedings of the 19th International Audio Mostly Conference: Explorations in Sonic Cultures, Milan, Italy, 18–20 September 2024. [Google Scholar] [CrossRef] [Scilit]
- Shen, H.; Hao, M.; Ren, J.; Chen, K.; Gao, Y. Experimental study on the effects of cockpit noise on physiological indicators of pilots. Sensors 2025, 25, 4175. [Google Scholar] [CrossRef] [Scilit] [PubMed]
- Xu, H.; Wang, L.; Zou, J.; Zhang, J.; Li, R.; Ma, X.; Wang, Y.; Zhao, Y. Recognising and explaining mental workload using low-interference method by fusing speech, ECG and eye tracking signals during simulated flight. Ergonomics 2025, 6, 1–18. [Google Scholar] [CrossRef] [Scilit] [PubMed]
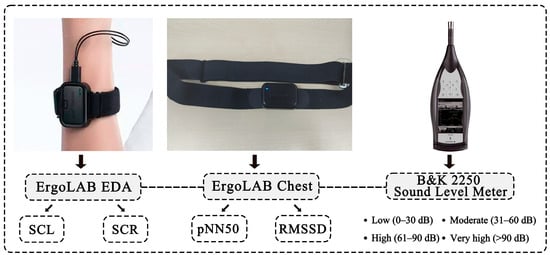
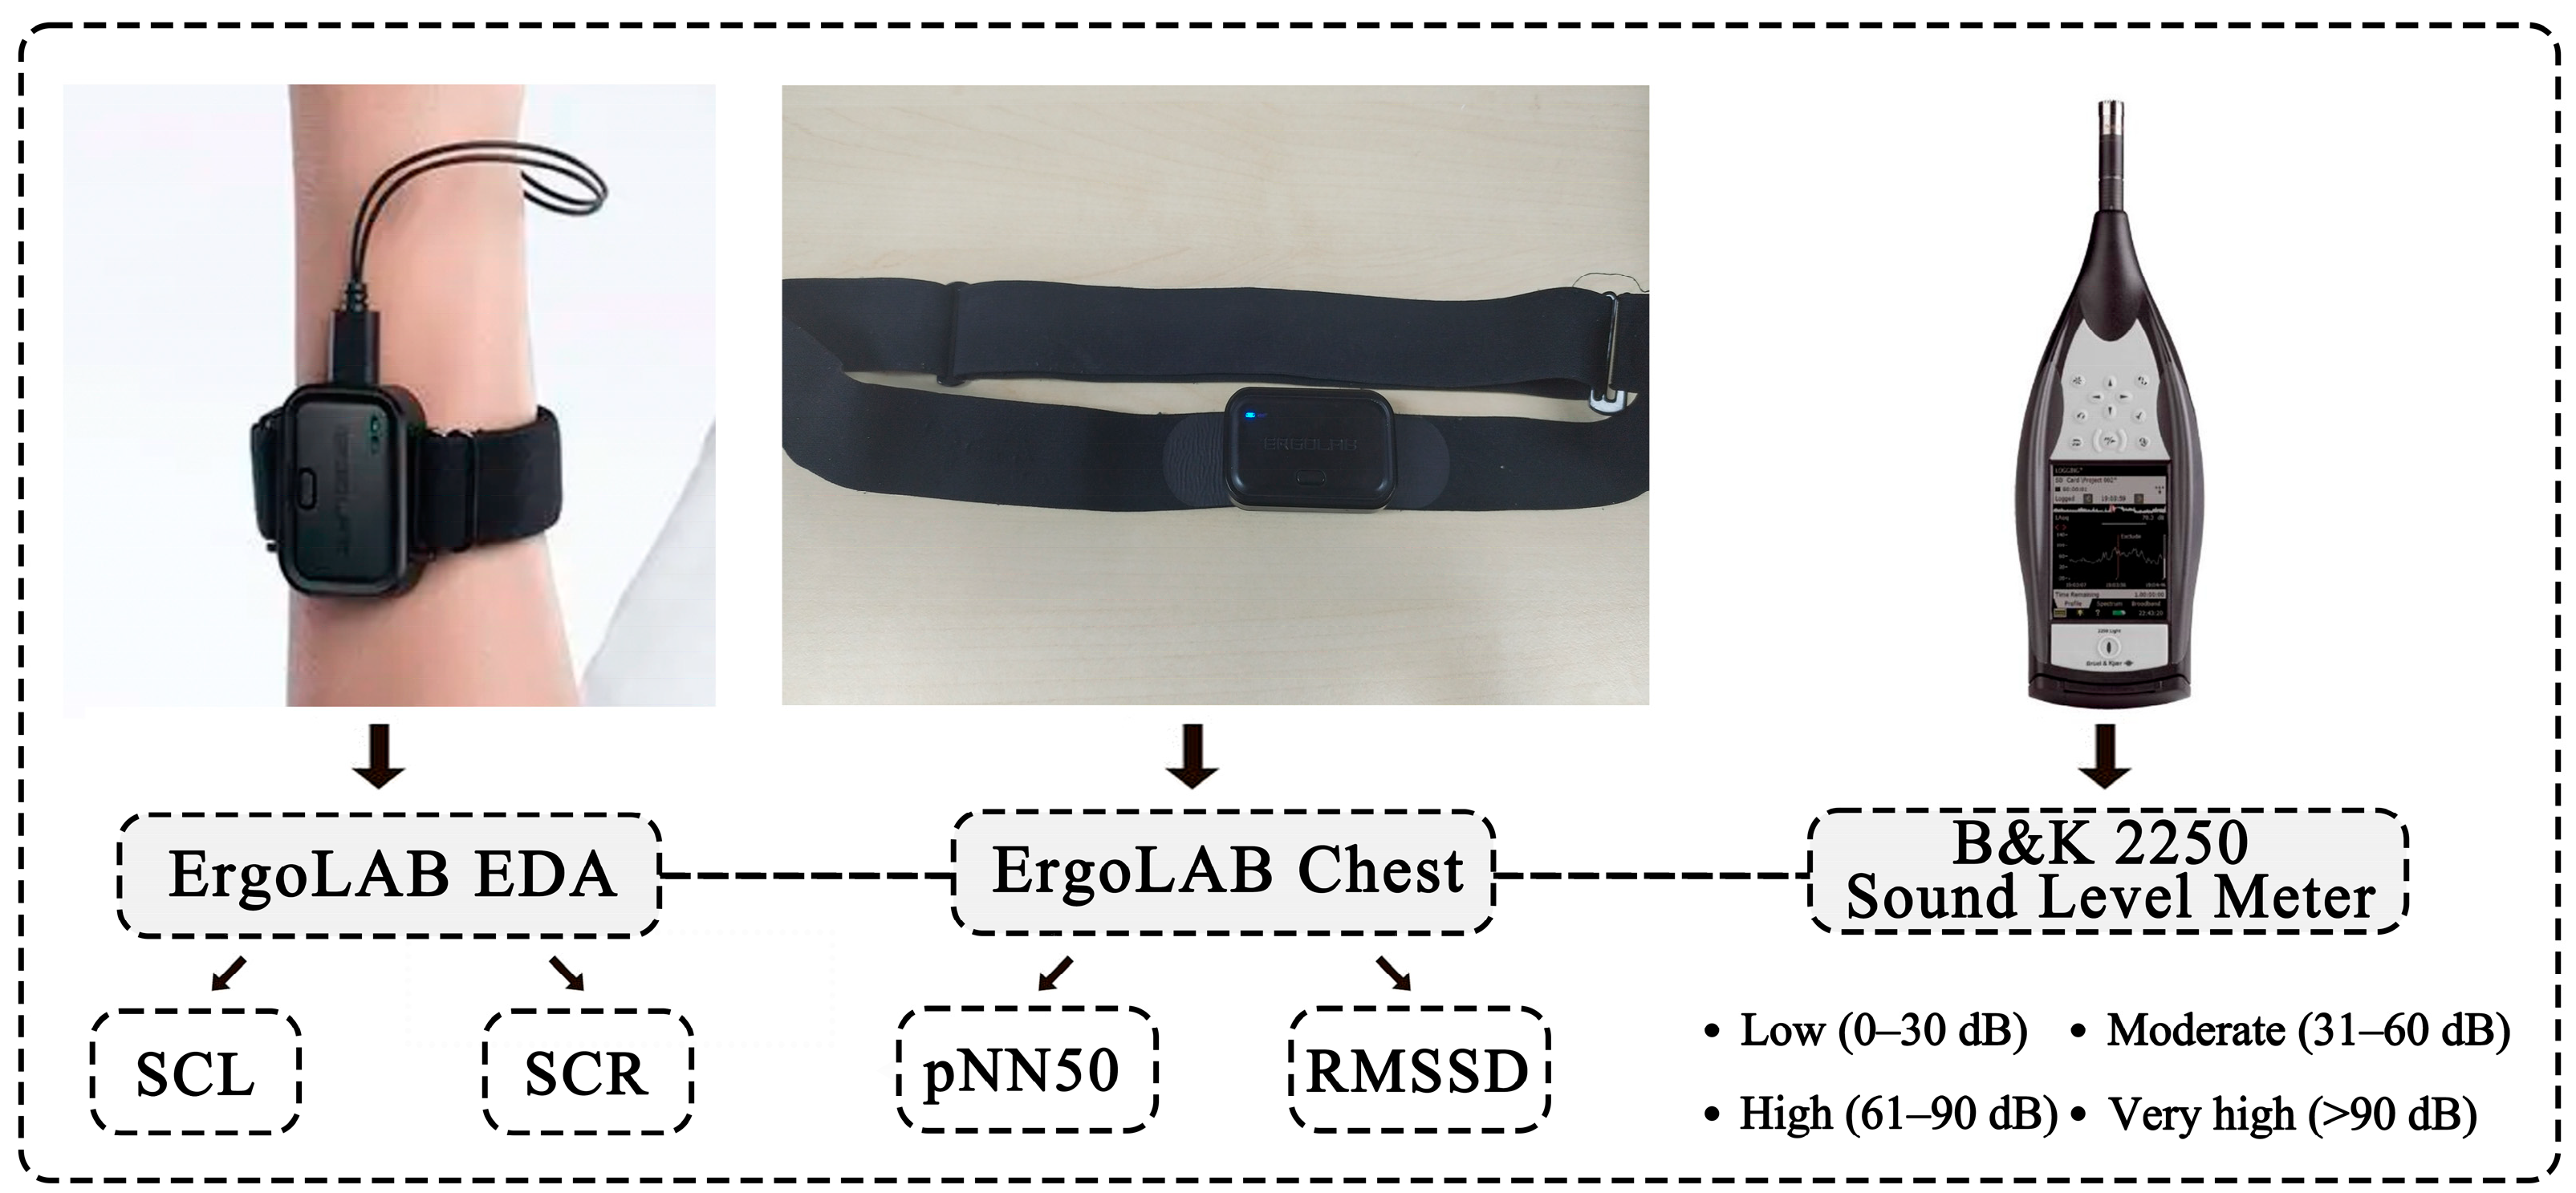
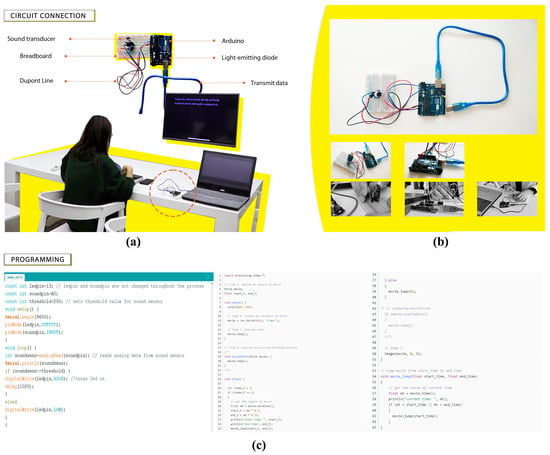
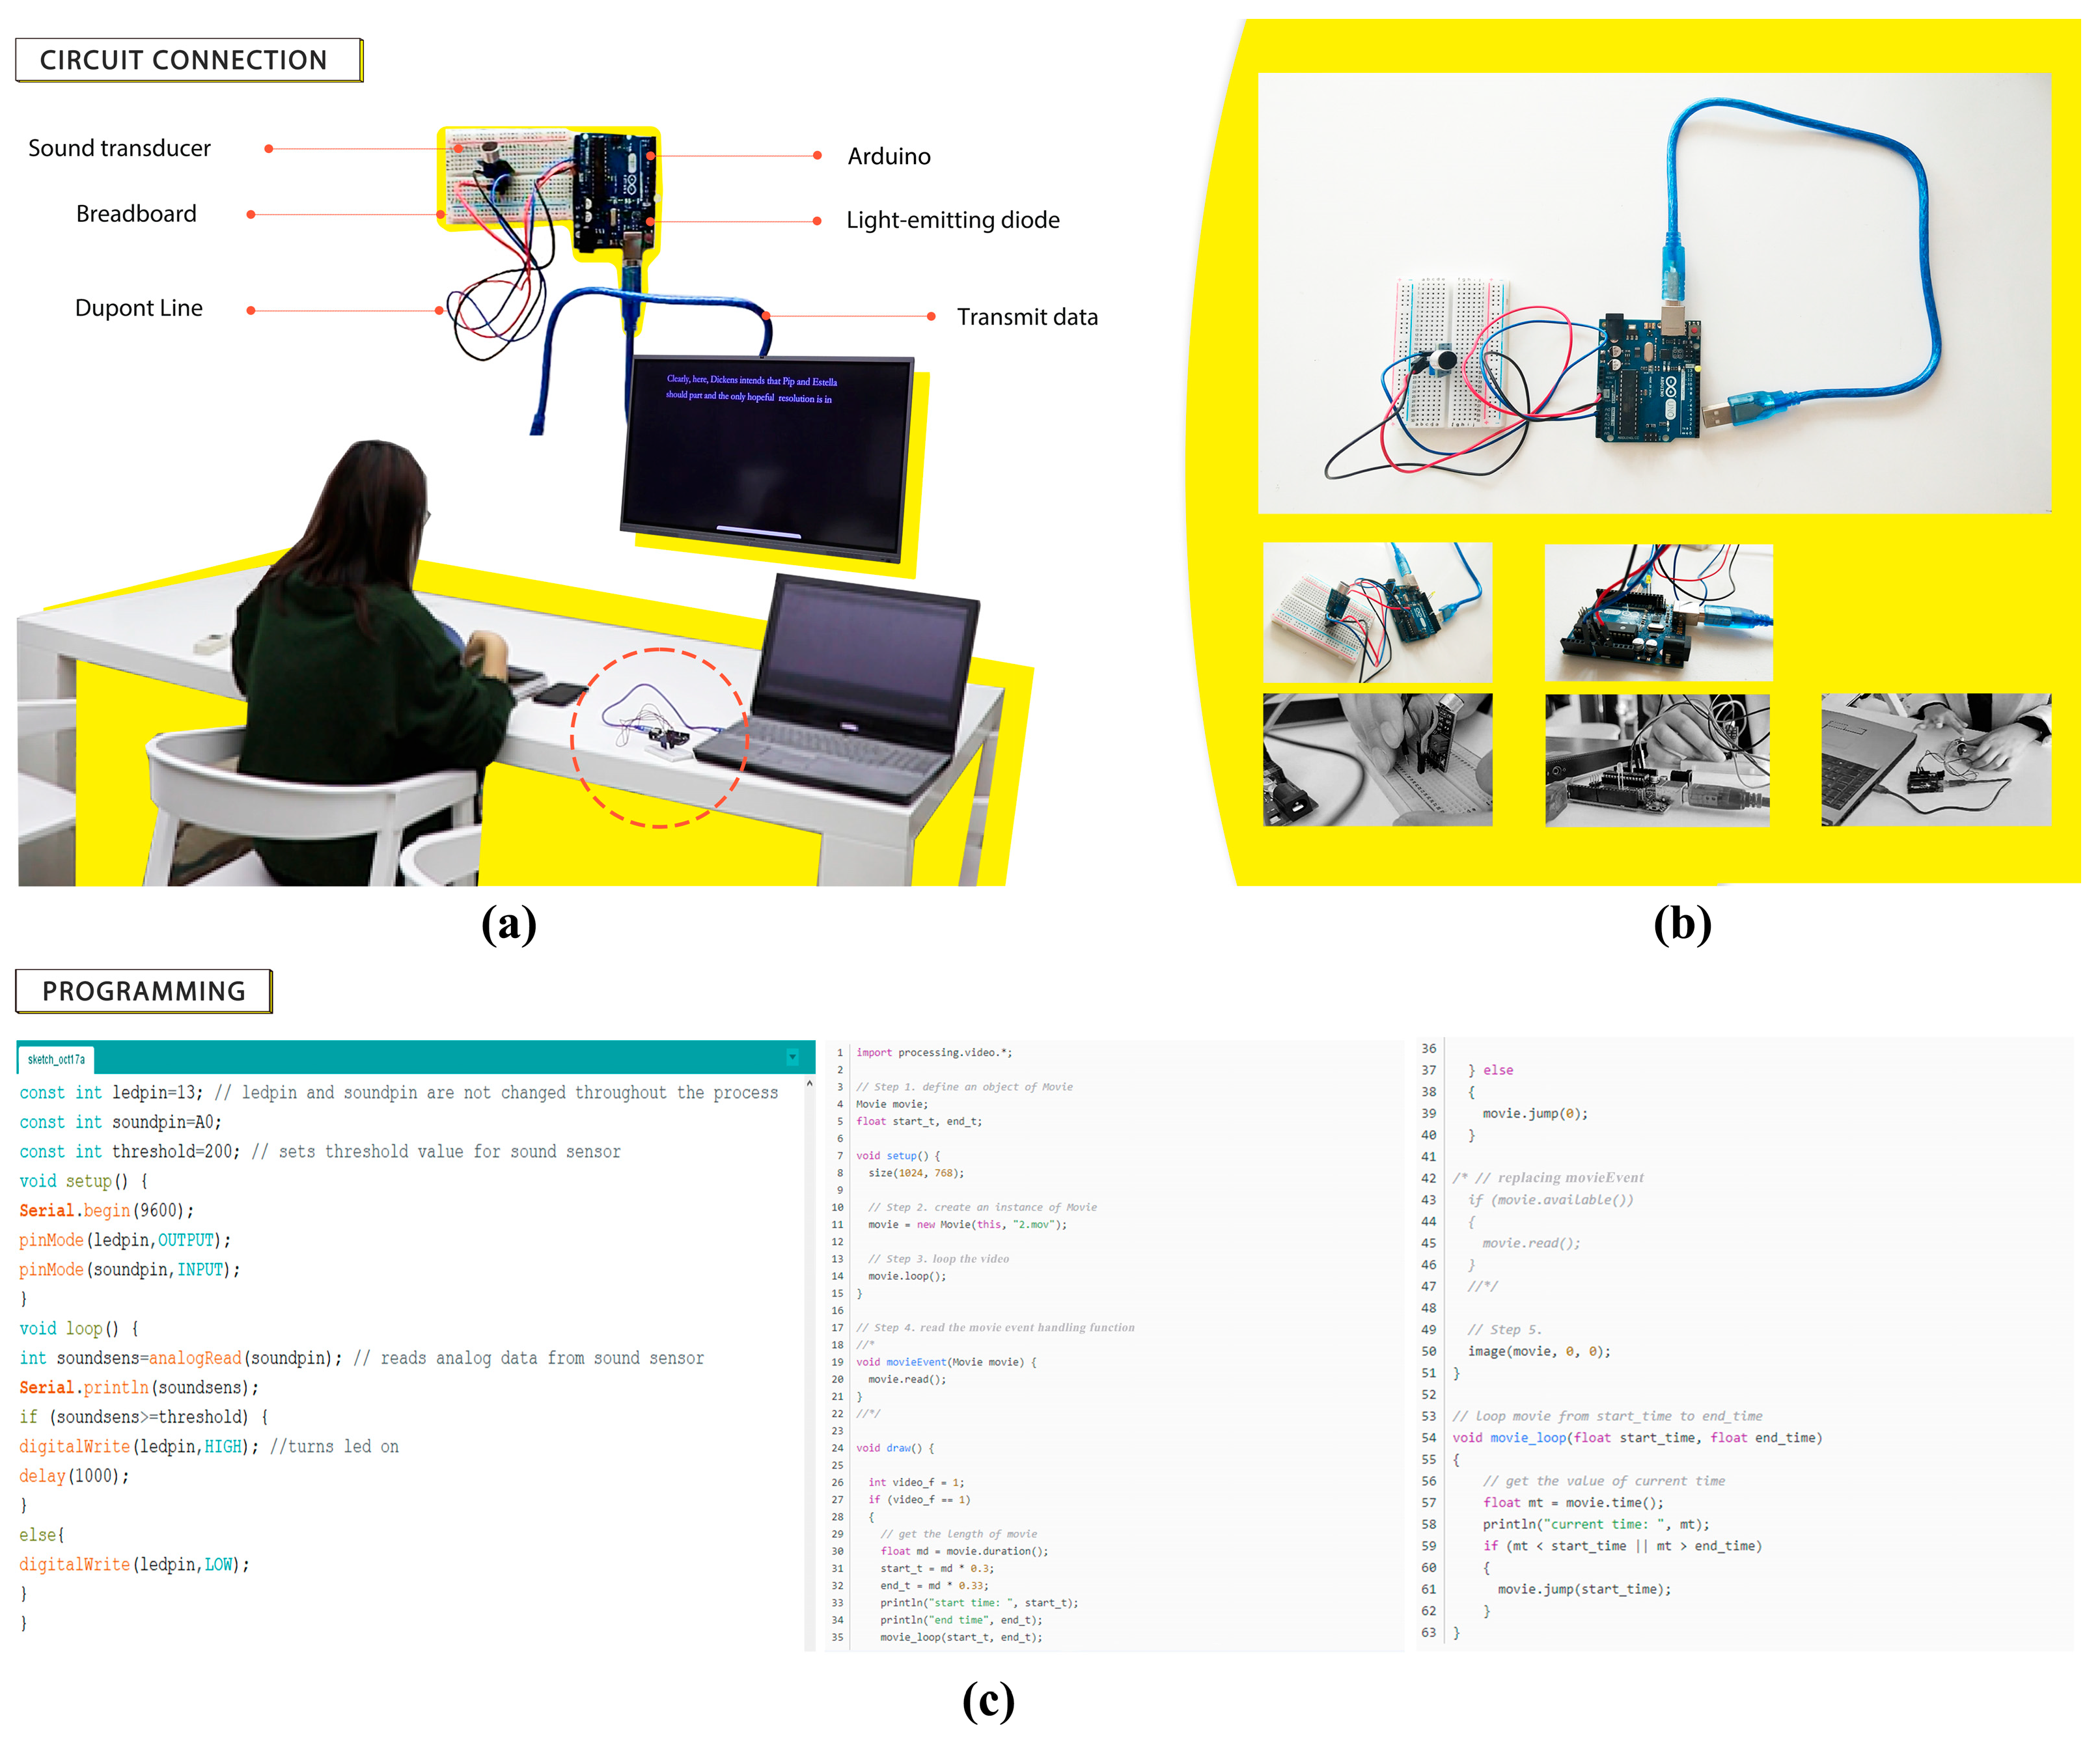
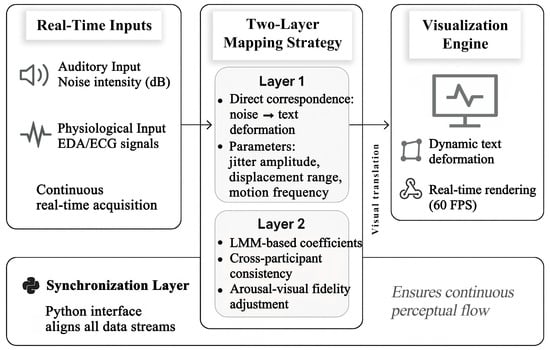
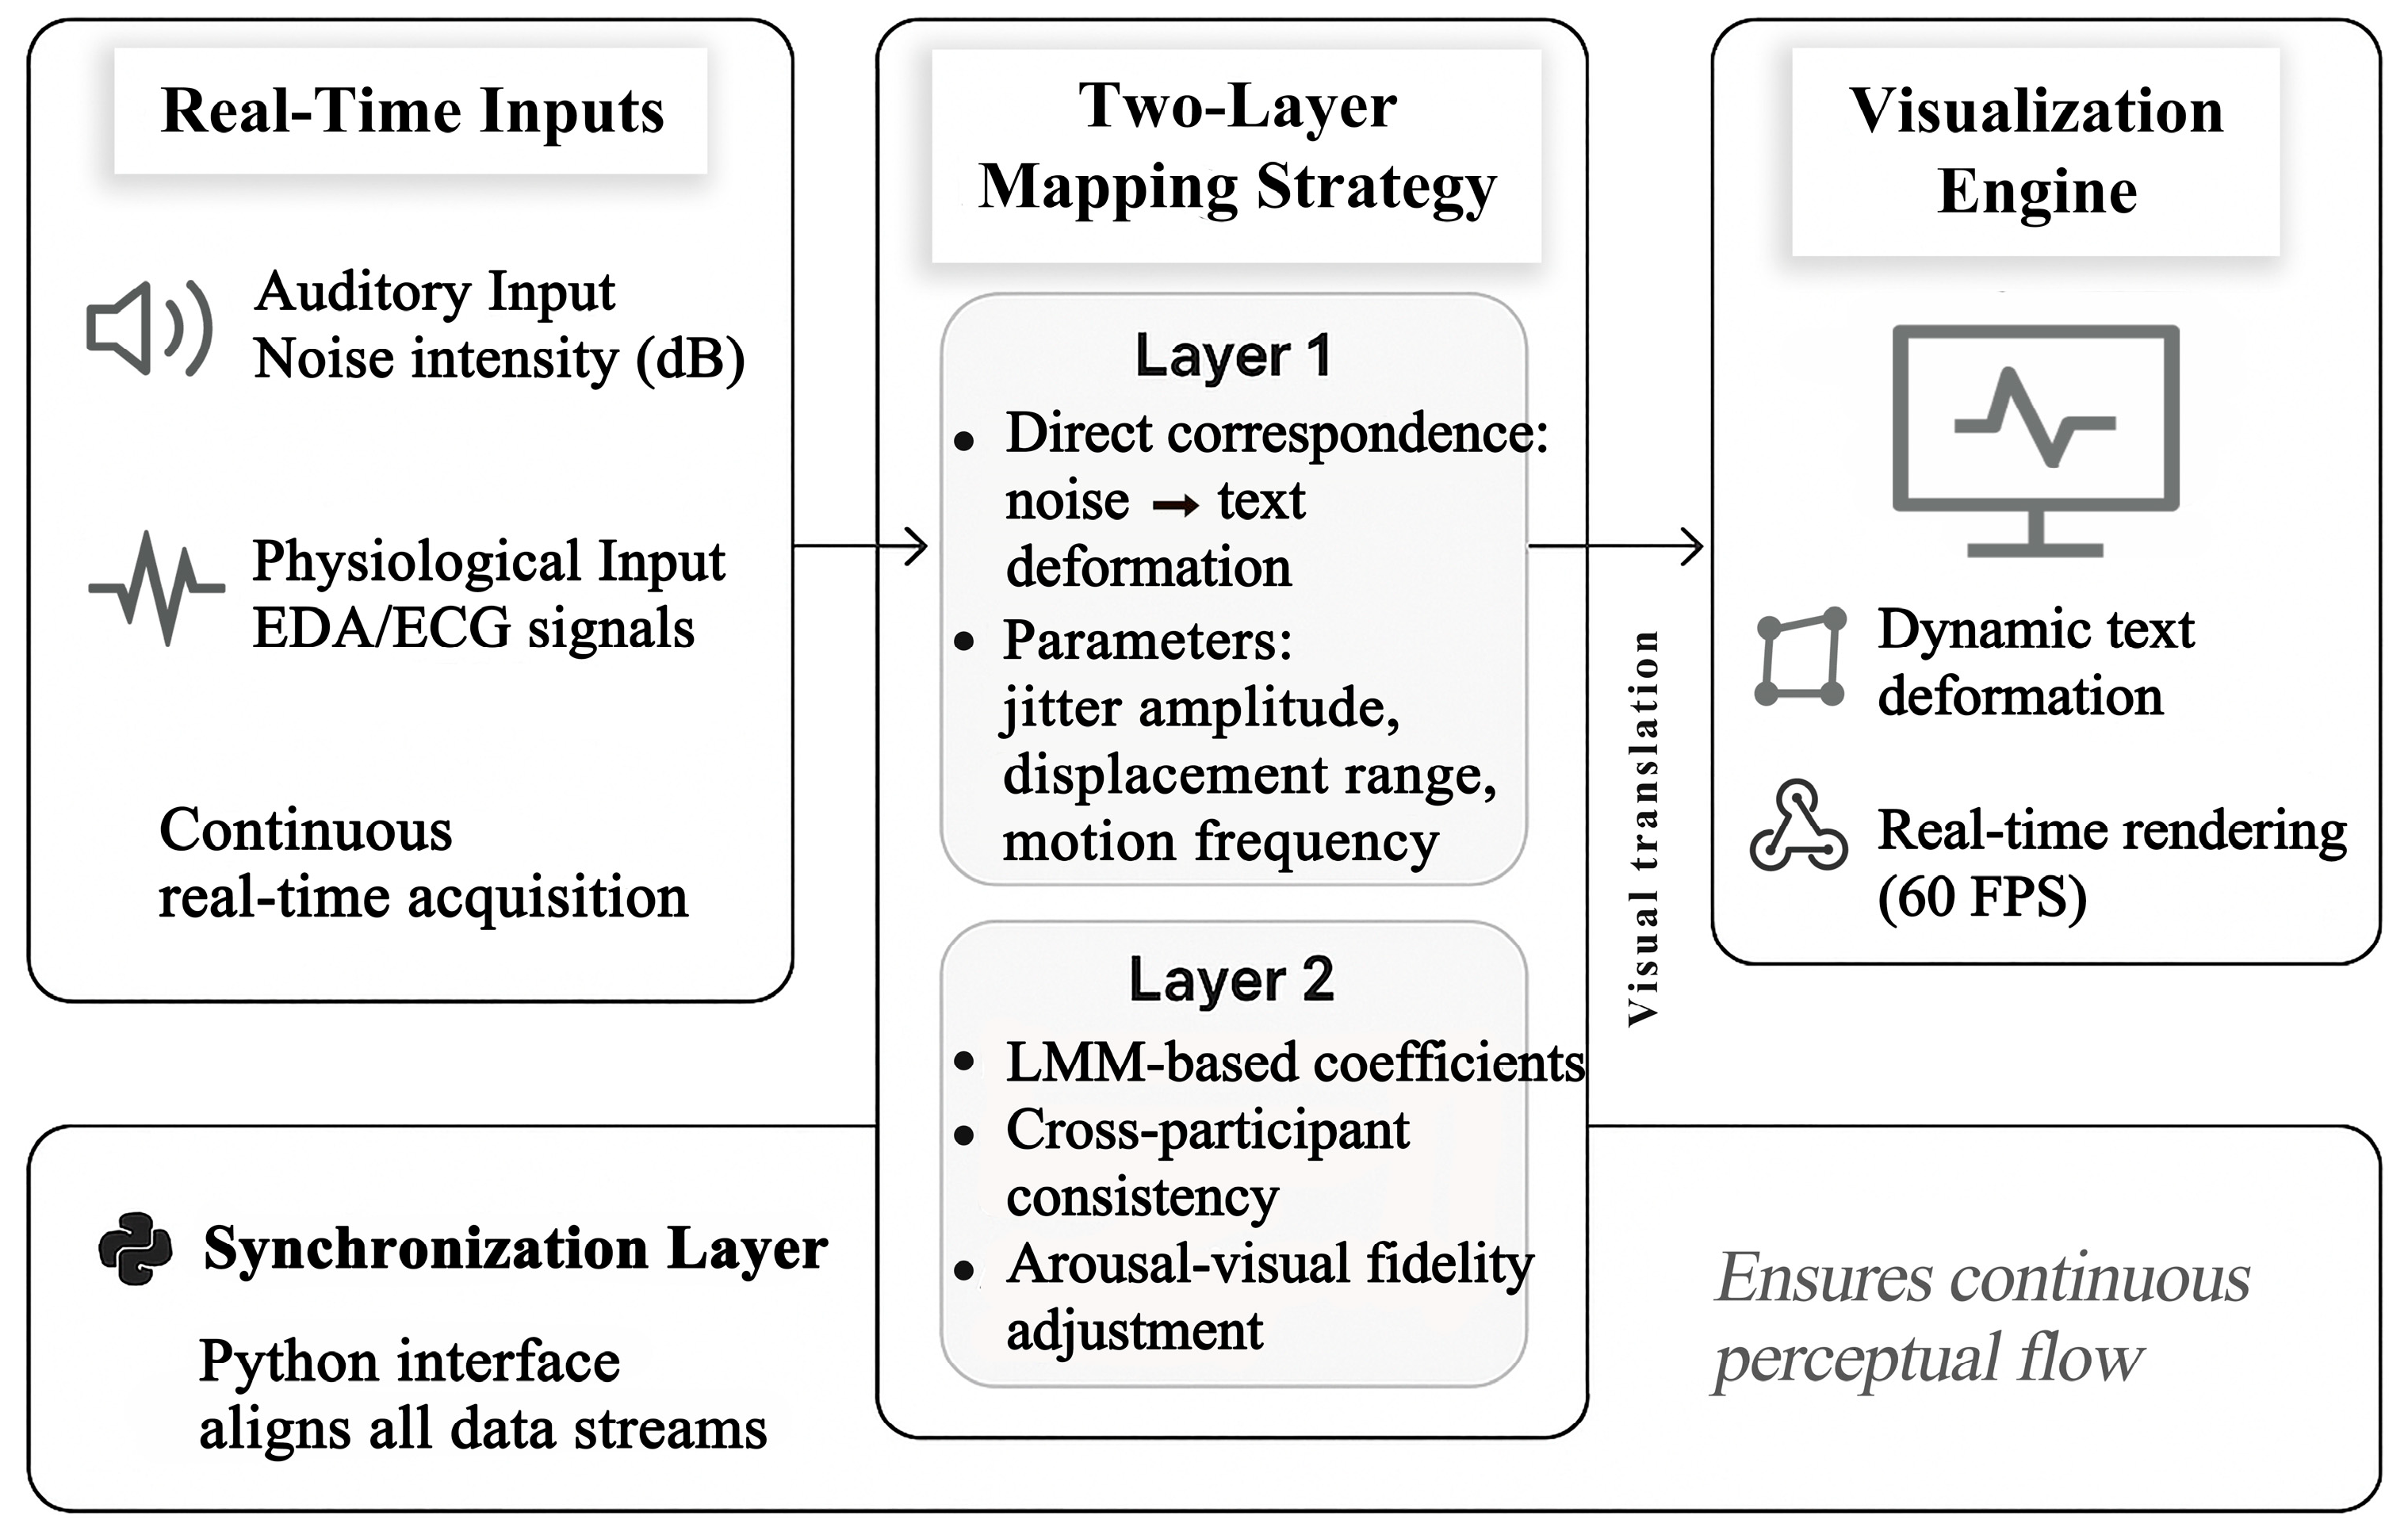
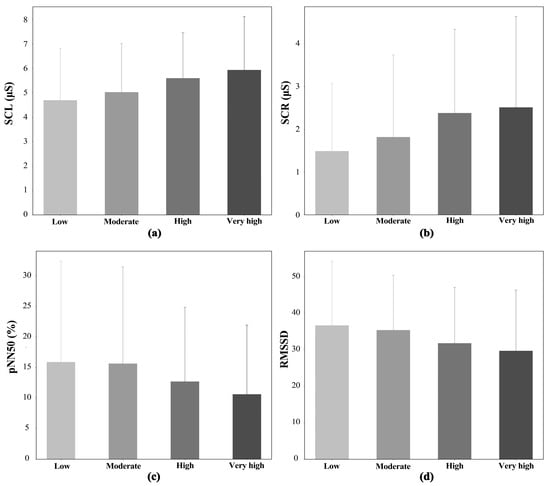
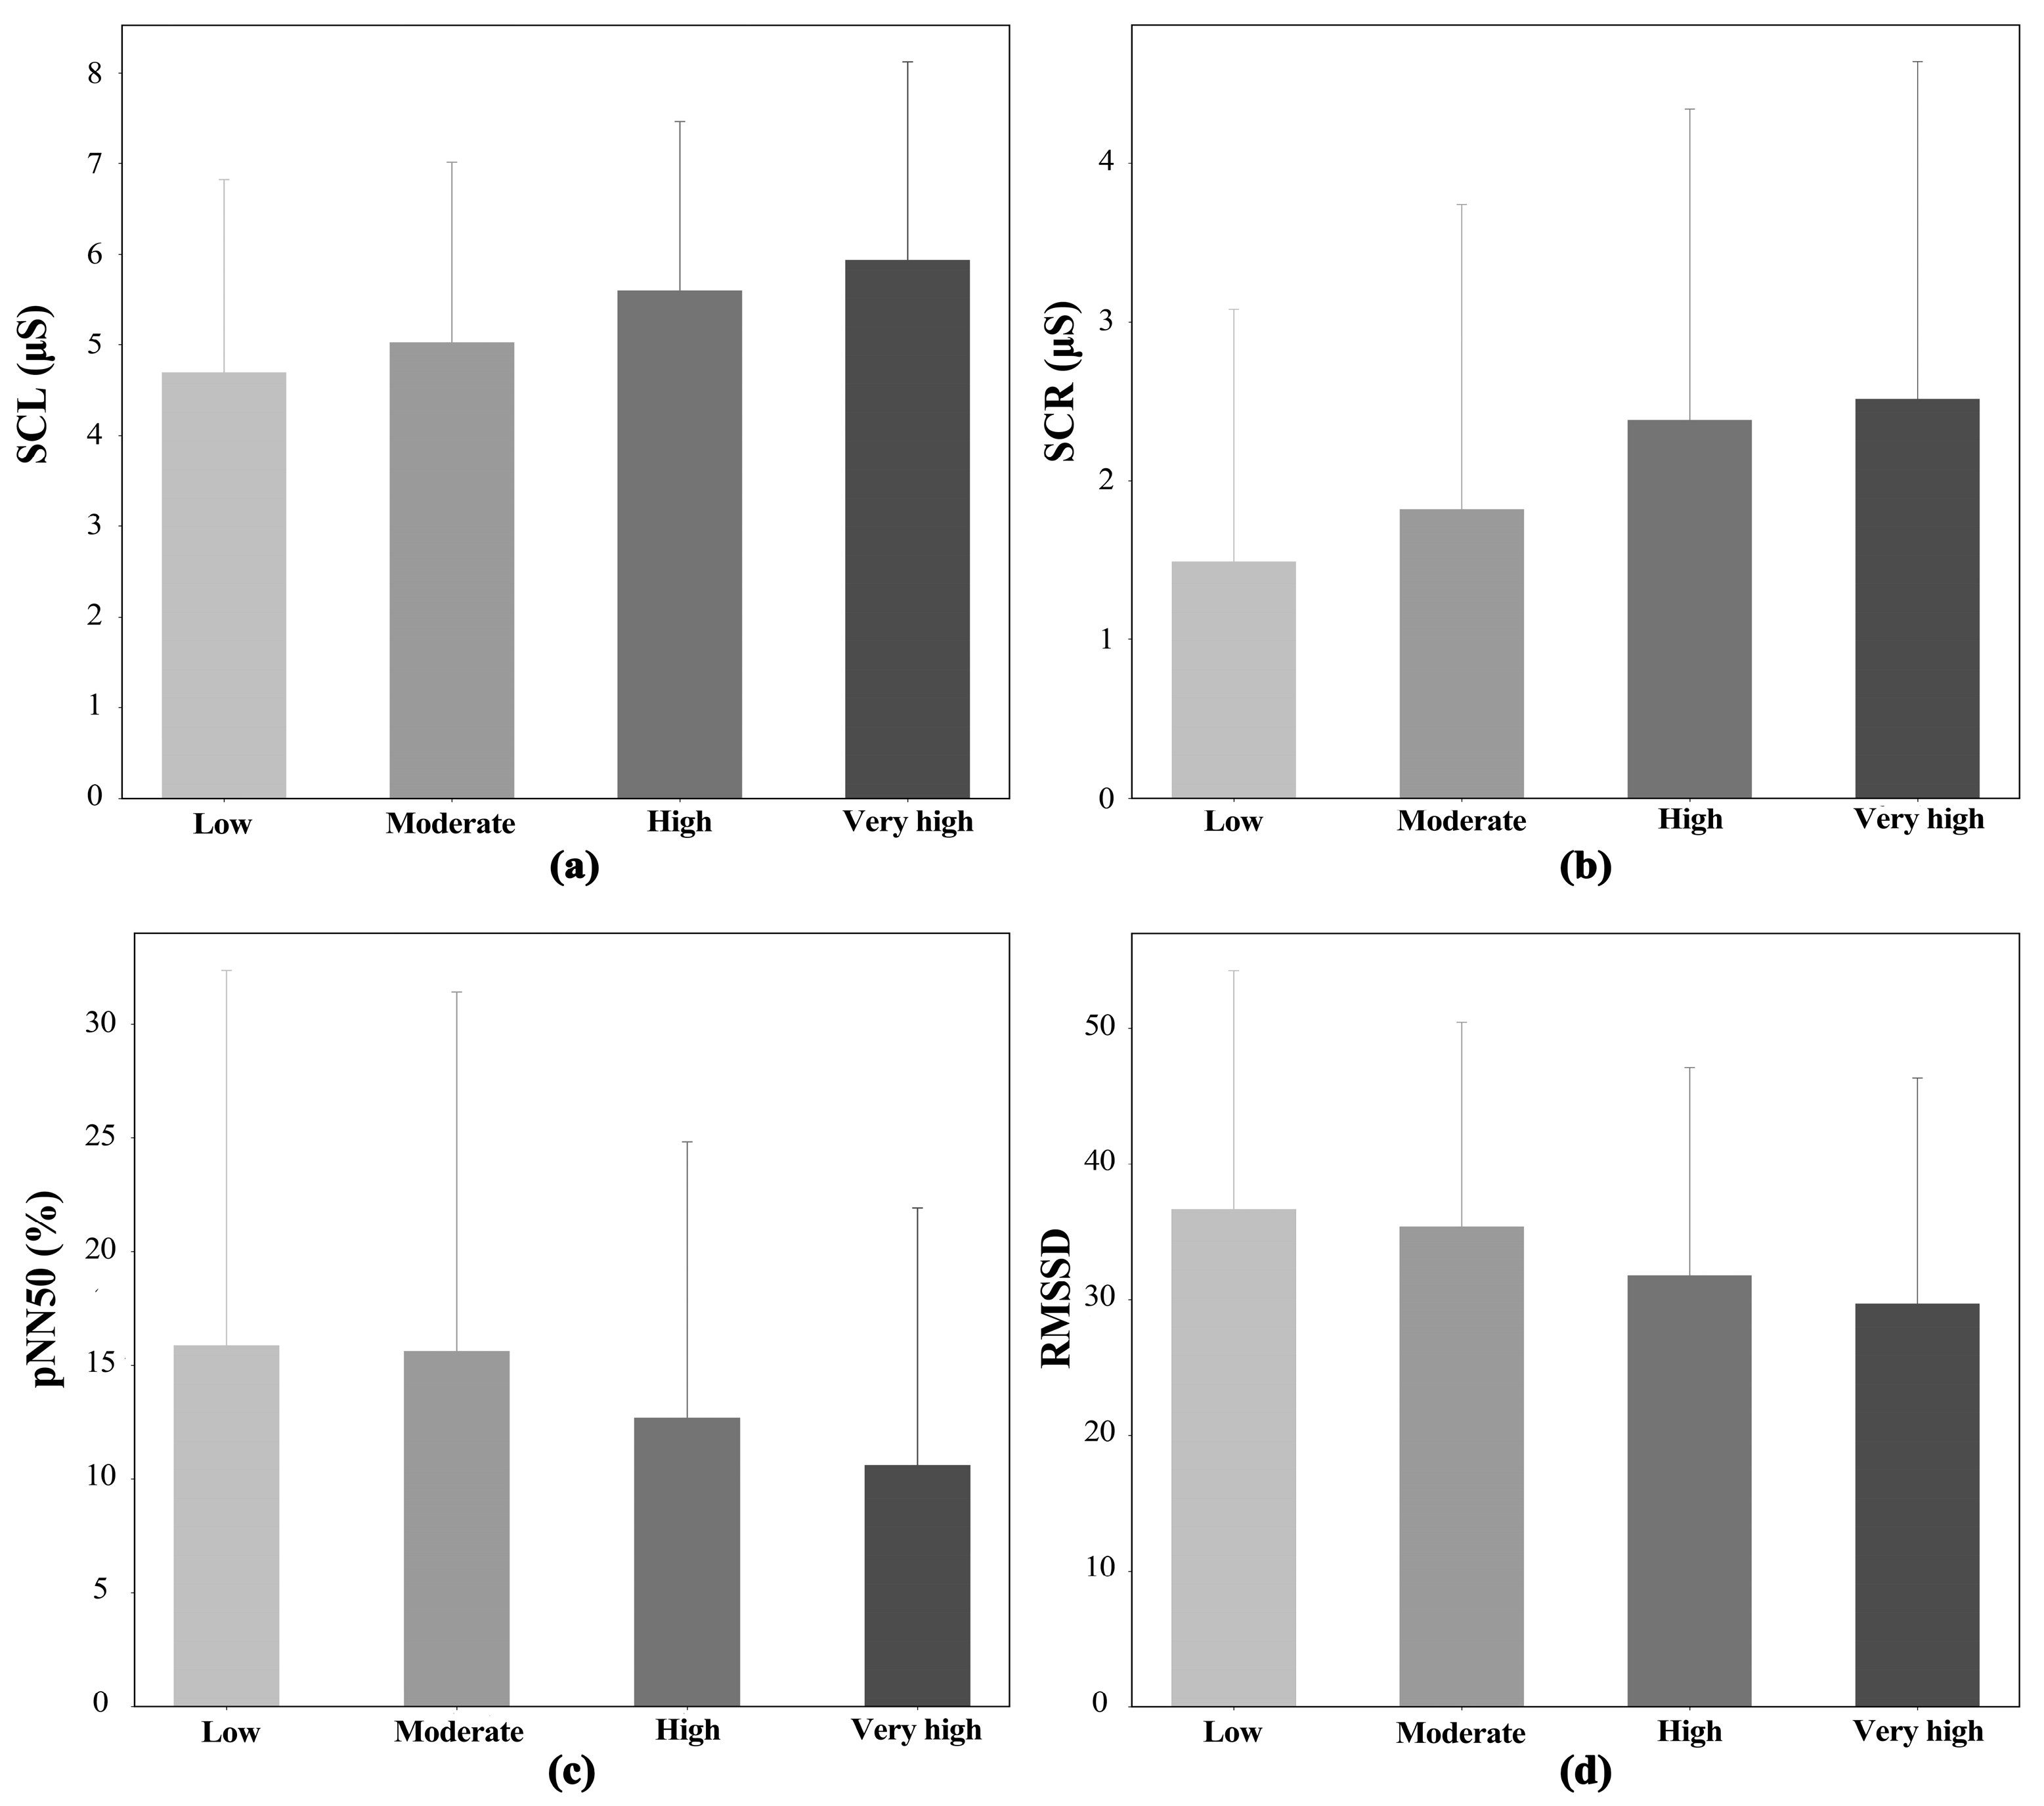
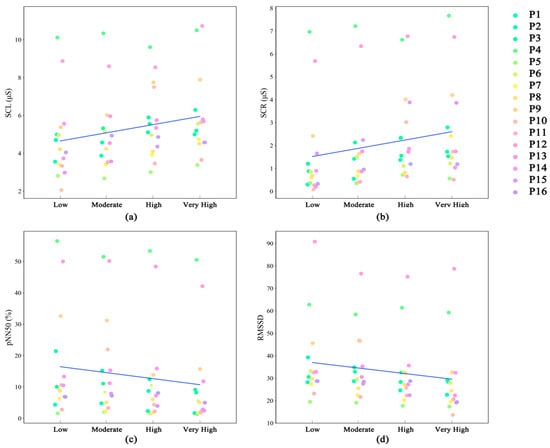
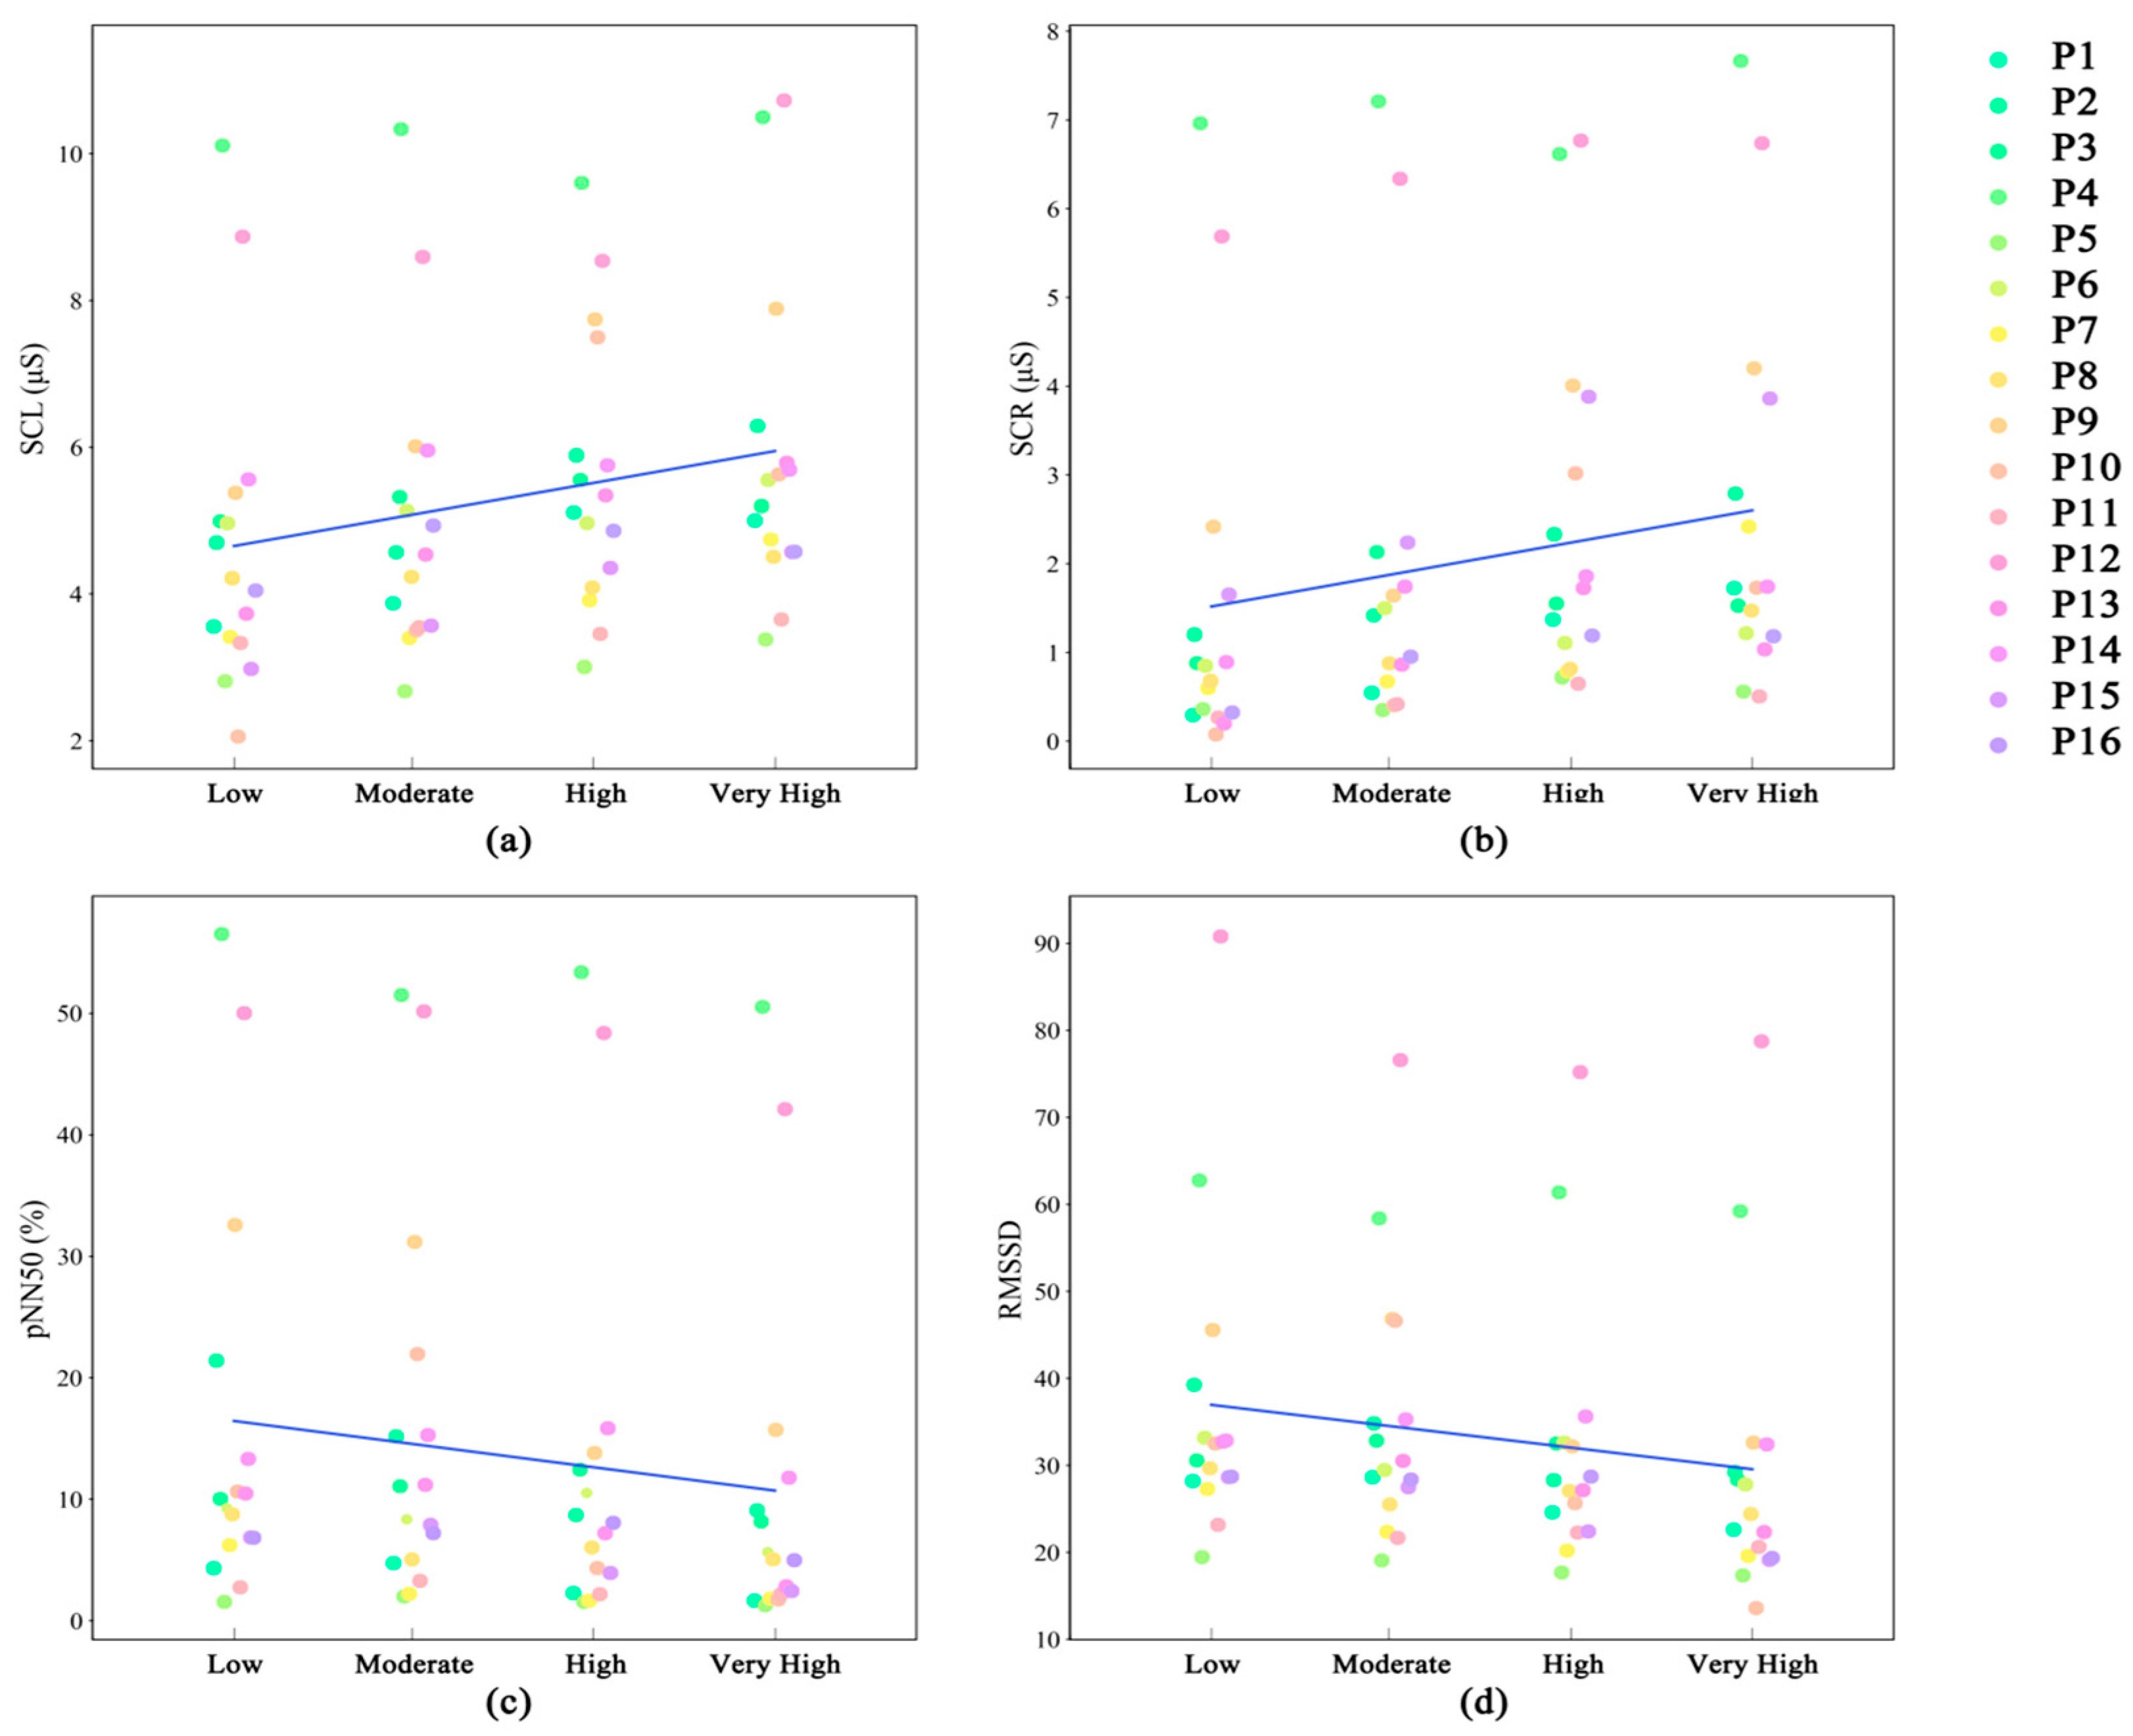
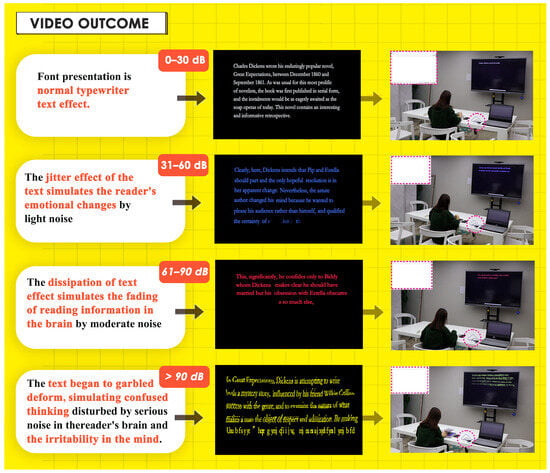
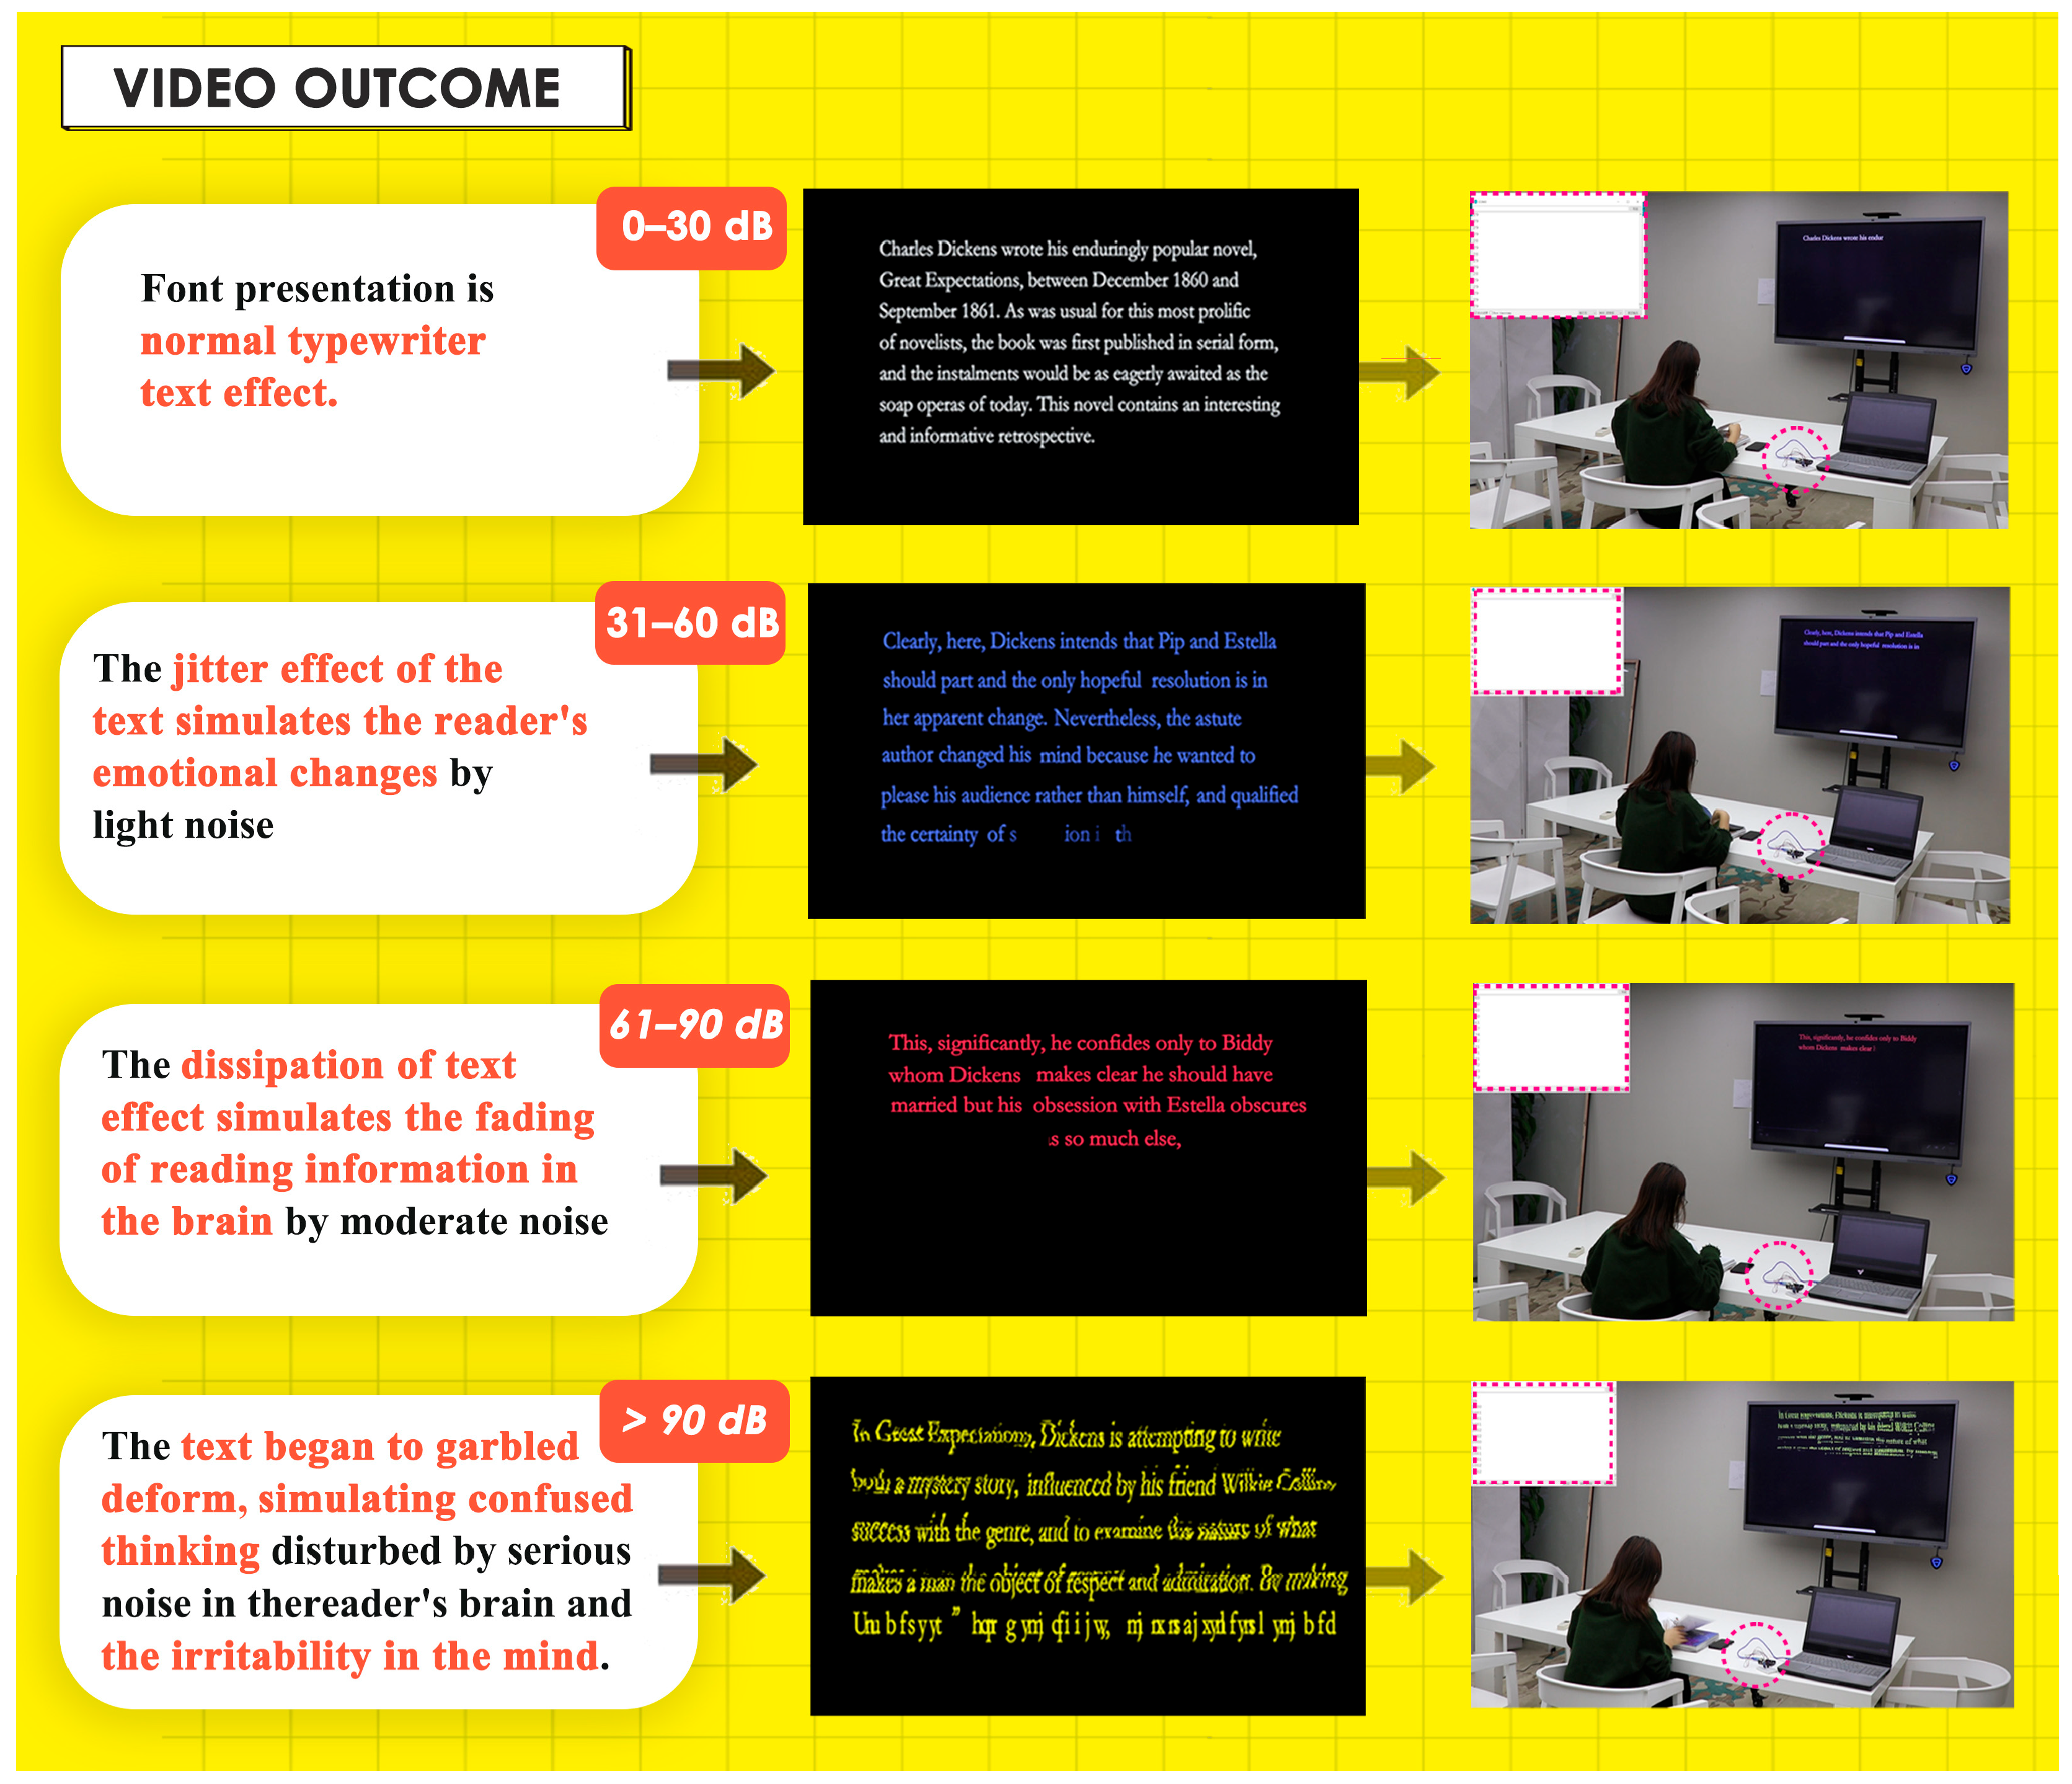

Disclaimer/Publisher’s Note: The statements, opinions and data contained in all publications are solely those of the individual author(s) and contributor(s) and not of MDPI and/or the editor(s). MDPI and/or the editor(s) disclaim responsibility for any injury to people or property resulting from any ideas, methods, instructions or products referred to in the content. |
© 2026 by the authors. Licensee MDPI, Basel, Switzerland. This article is an open access article distributed under the terms and conditions of the Creative Commons Attribution (CC BY) license.