


Abstract
European urban policy increasingly requires city benchmarks that are people-centred, multidimensional and methodologically defensible, yet perception-based environmental evidence is rarely aggregated without arbitrary weighting. Accordingly, this paper develops and justifies a synthetic index of perceived urban environmental performance (UEP) for European cities. Specifically, using the environmental module of the 2023 Eurostat Urban Audit Perception Survey (UAPS) for 83 Functional Urban Areas (FUAs), four satisfaction indicators (air quality, noise, cleanliness and green spaces) are aggregated with a benefit-of-the-doubt (BoD) composite indicator that assigns each city endogenous, self-favouring weights. Standard, weight-restricted and cross-efficiency variants are estimated, benchmarked against an equal-weight comparator, and embedded in an exploratory spatial data analysis. The results demonstrate that nine cities form the efficient frontier, led by Oulu, Luxembourg and Zurich, while Skopje, Naples and Athens anchor the lower tail. Additionally, a robust North–South gradient emerges, and green space satisfaction is the dominant structural driver of composite scores, partially compensating weak air quality in many cities. The study addresses perception-based BoD benchmarking—uncovering dimension-specific environmental governance deficits masked by national indicators—and complements objective environmental monitoring for European Union (EU) cohesion and climate-neutrality policy.
1. Introduction
European urban policy is increasingly shaped by a double imperative: cities must improve environmental performance while also preserving everyday liveability. This imperative is no longer abstract. In 2023, the European Commission published a report on the quality of life in cities, based on the sixth European city survey covering 83 cities across EU member states, EFTA countries, the United Kingdom, the Western Balkans and Türkiye. It reports that quality of life remains generally high, but it also identifies a persistent North–South divide, continuing catch-up among eastern European Union (EU) cities, and systematically lower satisfaction in larger urban areas on issues such as air quality, noise and cleanliness. The same report emphasises that small and medium-sized cities are more often perceived as safer, cleaner and less noisy than large metropolitan areas [1]. In parallel, the EU’s climate-neutral and smart-cities mission has raised expectations for rapid urban transitions, while European auditors have warned that many cities are unlikely to meet more demanding future air- and noise-pollution targets [2].
Urban policies are understood as deliberate courses of action adopted by public authorities, increasingly in interaction with private and civic actors, whose goals, instruments and target populations are directed at urban areas or at problems that are predominantly urban in character [3,4]. In Howlett’s nested model, any such policy operates simultaneously at three levels of abstraction: overarching governance modes (e.g., the EU’s cohesion and climate-neutrality frameworks), policy regime logics (national and municipal environmental strategies) and concrete operational instruments and their calibrations (emission limits, waste-collection standards, green space provision norms) [3]. Typologically, Holland classifies urban policies along three continua—public-led versus private-led, place-based versus people-based, and social versus economic in orientation—yielding eight ideal types of territorial intervention [4]. In the European multi-level setting, these types coexist: supranational agenda-setting and funding, national regulation, and municipal service delivery and spatial planning jointly constitute what this paper terms “urban policy” [5].
To make explicit the notion of policy that underpins the indicators used here, this study understands urban environmental policy as the set of instruments through which municipal and supra-municipal authorities seek to protect and improve the biophysical quality of the urban living environment. Three broad types can be distinguished: (i) regulatory and normative instruments, such as emission, noise and waste standards and land-use regulation; (ii) planning and provisioning instruments that deliver environmental public goods and services, such as green space creation, sustainable-mobility schemes and street-cleaning services; and (iii) monitoring and benchmarking instruments, including perception surveys such as the Urban Audit Perception Survey (UAPS), that generate the evidence base for evaluation and target-setting. The four satisfaction indicators analysed in this paper correspond to the perceived outcomes of instrument types (ii) and (iii); they capture how effectively environmental policy is experienced by residents rather than the policy inputs or the regulatory texts themselves. The clarification situates the composite index proposed below as an outcome-side, citizen-centred instrument for policy evaluation and comparative benchmarking. This is consistent with the indicator literature, which stresses that urban sustainability indicator frameworks acquire meaning when aligned with the policy objectives and instruments they are intended to monitor [6], and with evidence that localising supranational agendas requires city-level measurement matched to municipal competences [5].
Against this backdrop, urban environmental performance (UEP) has become a central concept in comparative urban research [7,8,9,10]. UEP is inherently multidimensional [11,12]; it spans not only air pollution, noise, cleanliness and access to green space, water quality, climate resilience and the quality of public space but also broader socioeconomic attributes such as population and housing density, unemployment rate, electricity and housing gas coverage rate, etc. [9,11,13]. Crucially, these dimensions are experienced unevenly across cities and rank differently in residents’ minds. That is why residents’ perceptions are a distinct layer of evidence about how environmental conditions are translated into lived urban experience, residential satisfaction and perhaps even the perceived competence of local institutions [9].
This distinction matters for city benchmarking. A large share of the smart-city, urban sustainability and quality-of-life literature still relies on composite indicators built from fixed or externally imposed weights [14,15]. That design choice is often convenient, but it is conceptually fragile when cities are heterogeneous and when no shared normative consensus exists about the relative importance of air quality, cleanliness, green accessibility, public transport, governance or affordability. The classical critique, advanced in the composite-indicator literature and made especially explicit in the benefit-of-the-doubt (BoD) tradition, is that rankings can become artefacts of arbitrary-weighting assumptions as much as reflections of urban reality. Data Envelopment Analysis (DEA)-based BoD models were developed precisely to respond to this problem by allowing each decision-making unit to receive the “benefit of the doubt” through endogenous weights, subject to a common efficiency frontier [16].
Thus, this paper aims to answer a specific and still underdeveloped question: how can UEP in European cities be benchmarked in a way that is simultaneously people-centred, multidimensional, and methodologically defensible? Recent works already prove the feasibility of combining perception-based urban indicators with BoD-DEA in broader smart-city sustainability assessments [10,17], but the environmental dimension has usually been embedded in wider liveability or smartness frameworks rather than being treated as the main evaluative object [18,19]. The present paper’s narrower environmental focus is thus important, because environmental quality is not merely one city attribute among many; it is increasingly a binding constraint on health, mobility, public-space use, distributive justice and climate adaptation.
A second gap concerns the relationship between objective and subjective measurement. Objective environmental indicators remain indispensable, but they are not sufficient on their own. Residents assess not only pollutant concentrations or park acreage, but whether public spaces feel clean, whether noise is intrusive, whether green areas are accessible rather than merely present [20], and whether environmental conditions are improving or deteriorating. The European Commission report is particularly instructive in this sense. It shows that greater access to green areas is associated with higher satisfaction with green spaces, yet it also stresses that accessibility and distribution matter more than aggregate land cover alone [1]. A city may have a large amount of green land and still leave many residents without nearby access [20]. Similarly, larger cities are more negatively evaluated on air quality and noise, and satisfaction with public transport explains a substantial share of variation in overall city satisfaction [1]. In theoretical terms, environmental quality must therefore be conceptualised as a relational urban outcome jointly shaped by material conditions, spatial distribution, service performance and citizens’ expectations [21].
Perception-based environmental benchmarking does not replace causal evaluation, but it creates a comparative diagnostic instrument for urban governance [22]. A BoD index based on the UAPS can identify cities that perform strongly across different environmental profiles, reveal where environmental dissatisfaction clusters are geographically, and show whether cities are strong because they deliver balanced outcomes or because they compensate a weakness in one domain with strength in another. In a European context increasingly organised around climate-neutrality missions [2], place-sensitive urban policy [23] and cohesion objectives, that kind of benchmarking is not merely descriptive; it is part of how evidence is translated into prioritisation.
For these reasons, the paper’s objective is to develop and justify a synthetic index of UEP for European cities using UAPS data (air quality, green spaces, urban cleanliness, noise pollution, and related dimensions) and a BoD-DEA aggregation logic, and to use that measure for city benchmarking. The contribution is fourfold. It advances a theoretically grounded definition of UEP as lived and perceived environmental performance; it shows why equal-weight or expert-weight urban rankings are often normatively overconfident; it mobilises a harmonised, EU-wide perception dataset uniquely suited to cross-city comparison; and it locates environmental benchmarking within the broader debate on what should count as UEP in contemporary Europe.
Although the study is exploratory rather than confirmatory, it is guided by three analytical expectations derived from the academic literature reviewed in Section 2. First, we expect a pronounced North–South performance gradient, with Nordic and north-western cities clustering near the perceived-performance frontier and southern and south-eastern cities concentrated in the lower tail. Second, we expect frequent divergence between perceived and objective environmental conditions, such that some cities with documented pollution burdens nevertheless record high satisfaction, and vice versa. Third, we expect green space satisfaction to play a compensatory role, partially offsetting dissatisfaction with nuisance dimensions such as air quality and noise in residents’ overall environmental evaluation. These expectations organise the interpretation of the results rather than imposing a formal hypothesis-testing structure on an inherently descriptive benchmarking exercise.
The remainder of this paper is organised as follows. Section 2 reviews the literature on perception-based measurement of UEP and composite-indicator benchmarking. Section 3 presents the data and the BoD methodology. Section 4 reports the results, including city rankings, weight profiles and geographic patterns. Section 5 discusses the findings, their policy implications and the study’s limitations, while Section 6 presents the conclusion.
2. Literature Review
2.1. UEP: Objective and Subjective Measurement
UEP is among the most frequently invoked yet least standardised concepts in comparative urban research. Its intellectual roots lie in the social-indicators movement of the late 1960s, when Lansing and Marans argued that a high-quality environment is one that conveys a sense of well-being and satisfaction to its residents through characteristics that may be physical, social or symbolic [24]. Five decades of subsequent scholarship have broadened rather than settled the concept. In an influential literature review, van Kamp et al. concluded that no agreement exists on terminology, construction methods or constituent criteria, and positioned UEP as an umbrella concept overlapping with liveability, environmental quality, quality of life and sustainability [8]. Pacione’s socio-geographical perspective made the interactional character of the concept explicit: environmental quality is not an attribute inherent in places, but the outcome of the interaction between environmental characteristics and the characteristics, needs and expectations of the people who use them [7]. Environmental psychology developed this insight into a measurement programme, operationalising perceived residential environment quality as residents’ multidimensional evaluation of the architectural-planning, human-social, functional and contextual features of their surroundings [12,25]. In parallel, a more technically oriented academic literature treats UEP as a synthetic construct that can be objectively approximated by integrating remotely sensed biophysical variables with census-based socioeconomic data [9,13,26], or defines it as the capacity of the urban environment to satisfy the material and non-material needs of its inhabitants [10].
This definitional plurality maps onto two distinct measurement traditions [27,28]. The objective tradition relies on secondary data such as environmental monitoring networks, census statistics, land-use inventories and, increasingly, satellite remote sensing to characterise the material conditions of cities without reference to how residents evaluate them. Liang and Weng combined Landsat imagery with census data to track environmental quality change in Indianapolis [13]; Musse et al. integrated remote sensing and census variables to map intra-UEP in Cali [9]; Faisal and Shaker employed principal component analysis and geographically weighted regression to synthesise environmental, urban and socioeconomic parameters for Canadian cities [26]; and Mahmoudzadeh et al. applied multi-criteria decision-making to satellite-derived and station-based indicators in Tabriz [10]. At the inter-urban scale, the same logic underpins composite city rankings and DEA-based benchmarking exercises built on UAPS data [17,22,29]. The strengths of this tradition are considerable: objective indicators are comparable, replicable, spatially granular and immune to response biases. Its limitations, however, are equally well documented. Indicator selection and weighting embed normative judgements that are rarely made explicit [14,16]; aggregate provision measures blend presence with accessibility and actual exposure [30]; and, most fundamentally, objective data remain silent on how environmental conditions are experienced, evaluated and translated into residential satisfaction or political demands.
The subjective tradition addresses precisely this silence. Rooted in the quality-of-urban-life research programme consolidated by Marans and Stimson [28], it collects primary survey data on residents’ assessments, such as satisfaction with air quality, noise, cleanliness, green space and related domains, and treats perception as the analytically relevant outcome. Validated multi-item instruments such as the perceived residential environment quality indicators have been replicated across countries and urban contexts [12,25], while harmonised cross-national surveys, most notably the European Commission’s perception survey covering 83 cities, have made large-scale comparative analysis of perceived environmental quality feasible [1]. Perception data capture the evaluative and expectational layer of environmental quality that objective indicators cannot reach, and they carry direct policy salience: dissatisfaction is itself a governance signal, regardless of whether it closely tracks measured conditions [11,22]. The limitations of this tradition mirror those of the objective one in inverted form. Survey responses are sensitive to cultural response styles, adaptation and shifting expectations, which complicates cross-city comparison, and typical city-level sample sizes constrain within-city disaggregation.
Crucially, the two traditions do not converge on the same picture. A recurrent empirical finding is that associations between objective conditions and subjective evaluations are positive but modest, domain-specific and non-linear (Table 1) [27]. Rather than treating this divergence as measurement error, recent scholarship interprets it as substantively informative, because it reveals where material provision fails to translate into experienced quality. Giannico et al. show at the European scale that objective greenness predicts perceived quality of life, but that the relationship operates through residents’ subjective evaluations and is stronger in lower-GDP cities [30]; Mouratidis identifies the multiple pathways, such as travel, leisure, health, emotional response, through which built-environment conditions become subjective well-being [21]; and Ekkel and de Vries’s accessibility research demonstrates that the same aggregate green endowment can produce very different levels of experienced access [20].
Table 1.
Empirical studies of UEP by measurement approach.
The methodological implication, increasingly reflected in mixed research designs (Table 1), is that objective and subjective measurement are complements rather than substitutes [7,8,27]. For comparative benchmarking, this argues for treating perception data as a distinct evidential layer in its own right: a perception-based composite monitoring does not replace objective environmental monitoring, but it captures the dimension of environmental performance that ultimately matters for residential satisfaction, legitimacy and behaviour, and it does so in a form that is harmonised across cities [1,17]. How such multidimensional perception data can be aggregated without imposing arbitrary weights is the question to which the BoD literature responds, and to which the next subsection turns [16].
This complementarity should not, however, obscure the epistemological limitations that attach to each tradition. Perception data are shaped by cultural, cognitive and contextual factors: satisfaction judgements are anchored to locally variable expectations and reference points, are subject to adaptation and reporting-style effects, and may diverge systematically across linguistic and national contexts, so that identical material conditions can elicit different evaluations. Cross-national survey research has repeatedly documented that response styles, such as acquiescence, extreme-versus-midpoint responding and social-desirability bias, vary systematically with cultural context, so that identical material conditions can yield different satisfaction scores across countries [31,32]. Adaptation, shifting reference points and expectation effects further mean that residents in chronically deprived or historically polluted areas may report tolerable satisfaction, while affluent residents express dissatisfaction at comparatively minor deficits—a pattern that risks conflating perceived quality with normalised deprivation. Conversely, the apparent neutrality of objective indicators is itself qualified, since the choice of variables, spatial units, thresholds and aggregation rules embeds normative judgements about what counts as environmental quality, and monitoring networks vary in density and coverage across cities [33]. More advanced objective approaches, such as ecosystem-assessment frameworks that translate ecological structure and function into decision-relevant information for land-use planning [34], illustrate both the richness and the model dependence of the objective tradition. The choice to measure aggregate green cover rather than equitable access, for instance, is itself a normative act that can conceal precisely the socio-spatial inequalities that matter most for wellbeing. Recent environmental-justice scholarship makes this vivid: in cities widely regarded as green, poorer and more vulnerable districts are systematically more exposed to air pollution and heat and enjoy less accessible blue–green space, so that indicators reporting high aggregate provision can mask sharp distributive injustice [35,36]. Recognising these limitations reframes the objective–subjective relationship as one between two partial and value-laden evidential layers and strengthens rather than weakens the case for treating perceived environmental performance as an analytical object in its own right.
A further critical consideration concerns environmental justice and socio-spatial inequality. Because the UAPS reports city-level aggregates, it cannot by itself reveal how environmental burdens and amenities are distributed within cities, where exposure to poor air quality, noise and limited green space is frequently concentrated among lower-income and marginalised residents. Aggregate satisfaction may therefore mask distributional inequities, and a high average score is not equivalent to equitable environmental provision. Self-reported satisfaction also has intrinsic limits as a governance target: it can be insensitive to slow-onset or invisible hazards and may reward visible amenities over less salient but health-critical dimensions. The composite developed below is accordingly interpreted as a diagnostic of average perceived performance that should be complemented, wherever disaggregated data permit, by distributional and objective analyses.
2.2. The UAPS: Perception-Based Evidence in EU Urban Policy and Research
The empirical backbone of perception-based comparative urban research in Europe is the UAPS, carried out on behalf of the European Commission’s Directorate-General for Regional and Urban Policy as part of the Flash Eurobarometer programme and disseminated under the title Quality of Life in European Cities [1]. As the subjective complement to Eurostat’s Urban Audit/City Statistics programme, it has been fielded at roughly triennial intervals since the mid-2000s [22,37]. The sixth and most recent wave, conducted in 2023, covered 83 cities in the EU member states, EFTA countries, the UK, the Western Balkans and Türkiye, with more than 70,000 interviews (around 840 randomly selected residents per city) [1]. Respondents evaluate a wide range of urban-life domains, and the survey contains a well-developed environmental module: satisfaction with air quality, noise level, cleanliness, green spaces and public spaces, alongside items on public transport. Two design features explain its analytical prominence: identical question wording, scales and sampling across cities and waves make UAPS one of very few instruments permitting genuinely harmonised cross-city comparison of perceptions, and city-level representativeness allows linkage to objective data from Eurostat, CORINE or the Urban Atlas in mixed designs [30,38,39].
Within EU policy, UAPS results are published in the triennial Reports on the Quality of Life in European Cities, which have become reference documents for cohesion and urban policy [1]. The environmental findings of the 2020 and 2023 editions anticipate several of the facts motivating this paper: satisfaction with air quality, noise and cleanliness is systematically lower than satisfaction with most other domains and deteriorates with city size; perceived air quality tracks measured PM2.5 concentrations only imperfectly; and satisfaction with green space is more strongly associated with accessibility than with aggregate green endowment [1]. The survey thus serves both as an official monitoring instrument and as an evidence base increasingly reused in research.
Three research streams have developed around these data. The first models the determinants of overall satisfaction with city life. Using the 2012 wave for 79 cities, Węziak-Białowolska showed that dissatisfaction with air quality and green space, alongside public transport and institutional trust, contributes significantly to dissatisfaction with life in a city [40]. Moeinaddini et al. applied non-parametric decision-tree techniques to the same instrument, again identifying environmental and safety perceptions among the critical predictors [41]. Castelli et al., analysing around 58,000 responses from the 2019 wave, found that amenities, including green spaces and air quality, together with safety, trust and inclusiveness explain most of the variation in city-life satisfaction, while individual socioeconomic characteristics matter far less [42]. A consistent message of this stream is that environmental domains behave largely as “dissatisfiers”: their deficits depress overall satisfaction more than their abundance raises it, which underscores their policy salience.
The second stream focuses on the environmental module itself or links it to external objective data. Coisnon et al. pooled four UAPS waves with CORINE Land Cover data for 75 cities to disentangle the individual and contextual determinants of satisfaction with public urban green spaces, showing marked between-city heterogeneity and differences by green space type [38]. Olsen et al. joined the 2012 and 2015 perception microdata with Urban Atlas land-cover classes for 66 cities and found that a city’s landscape composition is associated with residents’ life satisfaction and with within-city inequalities in it [39]. Giannico et al. combined satellite-derived greenness with the same perception data, demonstrating that objective green endowment translates into perceived quality of life through residents’ subjective evaluations [30]. The survey’s reach extends beyond the environment-satisfaction nexus: Ribeiro et al. constructed domain-specific dissatisfaction scores, including an environmental one, from the 2004–2015 waves and linked them to all-cause mortality across 74 cities [43], while Medgyesi and Csathó used the 2012–2019 waves in multi-level models of financial satisfaction among urban youth [44]. The instrument has also been adapted beyond its original coverage, for instance for Kocaeli [45]. Collectively, this demonstrates the versatility of UAPS, but also that its environmental items are almost always deployed as explanatory variables or single-domain outcomes rather than integrated into a synthetic measure of environmental performance.
The third stream, closest to the present study, uses Urban Audit data for composite indicators and DEA-based benchmarking. Morais and Camanho built a DEA composite of quality of life for 206 cities from objective Urban Audit statistics [22], Morais et al. extended the approach to cities’ attractiveness for qualified human capital, explicitly acknowledging that weights are value judgements whose specification drives rankings [37], and Zanella et al. integrated well-being and environmental impact indicators in a BoD-type model [29]. The BoD logic has been recently applied directly to UAPS perception data. Marjanović et al. constructed a perceived smart-city sustainability index for European cities from the 2023 wave, deriving endogenous weights across six dimensions, of which the environment is one [17]. These studies confirm both the feasibility and the attractiveness of BoD-DEA aggregation for Urban Audit-type data, precisely because it neutralises the arbitrary-weighting critique of composite indicators [16].
Reading the three streams together reveals a clear gap. Environmental perceptions from UAPS have been used as disaggregated regressors [40,41,42], as single-domain outcomes linked to objective data [30,38,39], or folded into broad quality-of-life and smartness composites in which the environment is one dimension among many and can be compensated by non-environmental strengths [17,29]; yet no study has treated the UAPS environmental module as the sole and central input of a composite index of perceived UEP. Moreover, few analyses exploit the 2023 wave, although it captures the post-pandemic and energy-crisis context in which the Commission itself documents declining environmental satisfaction in larger cities [1]. The present paper addresses this gap by constructing a BoD-DEA composite index of UEP exclusively from the environmental perception items of the 2023 UAPS. In doing so, it isolates the environmental signal that broader composites obscure, extends the perception-based BoD benchmarking agenda [17] to the domain where citizen experience and EU policy targets are most tightly coupled, and delivers a people-centred, methodologically defensible ranking of European cities together with city-specific weight profiles showing how each city earns its position.
Taken together, these three streams motivate the empirical strategy pursued below. To operationalise perceived UEP as a distinct evaluative object rather than one dimension of a broader liveability composite, the analysis draws exclusively on the environmental module of the 2023 UAPS wave and aggregates its satisfaction items through a BoD-DEA composite that lets each city reveal, rather than be assigned, the environmental priorities on which it performs best. The following section details the data, the indicator set, the family of BoD models, and the spatial-analytical framework used to benchmark the 83 cities and to test whether perceived environmental performance clusters geographically.
3. Data and Methodology
3.1. Data Source
The empirical foundation of this study is the sixth wave of the Eurostat UAPS, conducted between January and April 2023 on behalf of the European Commission’s Directorate-General for Regional and Urban Policy (DG REGIO). The 2023 edition is the most recent publicly available wave and covered 83 European cities across 36 countries, including all EU Member States plus Iceland, Norway, Switzerland, Turkey, the United Kingdom, and six Western Balkan countries, collecting 71,153 completed interviews at a minimum of 800 respondents per city using a stratified random digit dialling design [1]. The September 2024 revision of the aggregated city-level dataset, which corrects several city-level figures from the initial December 2023 release, is used throughout this analysis. Cities are defined as Functional Urban Areas (FUAs), combining the administrative city with its commuting zone, ensuring comparability of environmental exposure patterns across differently sized administrative units. This geographic definition is particularly important for environmental assessments, where pollution gradients and green space accessibility do not respect administrative boundaries [46,47].
It should be emphasised that the set of 83 cities is not a selection made by the authors but is fully determined by the coverage of the 2023 UAPS: every Functional Urban Area for which harmonised environmental-perception data were released is included, and none is omitted by design. The sample accordingly spans the full range of city sizes present in the survey, from large capitals and global cities such as London, Madrid, Rome, Berlin, Warsaw and Brussels, through second-tier metropolises such as Barcelona, Hamburg, Munich and Kraków, to medium-sized regional centres such as Oulu, Groningen, Rennes and Ostrava. Cities not covered by the 2023 wave are necessarily absent; this survey-driven coverage is a property of the data source rather than an analytical choice, and its implications for generalisation are revisited among the limitations in Section 5.5. To avoid over-generalisation, the regional regularities reported below are framed as patterns observed within the surveyed FUAs rather than as universal laws of European urban performance.
Inspection of the 2023 UAPS aggregated data reveals that the environmental module contains four core perception items directly relevant to urban environmental quality (Table 2). These are: satisfaction with air quality (Q1b_1), satisfaction with noise levels (Q1b_2), satisfaction with urban cleanliness (Q1b_3), and satisfaction with green spaces (Q1a_5). Accordingly, this study operationalises UEP using four indicators that are measured on a 4-point Likert satisfaction scale and are aggregated to the city level as the share of respondents answering “satisfied” or “very satisfied” (Top-2 Box, %), following standard Eurobarometer coding conventions. Table 2 presents the full indicator inventory together with the cross-sample means.
Table 2.
UAPS 2023 environmental perception indicators used in the BoD analysis.
A fifth item, satisfaction with public spaces (Q1a_6), is available in the dataset and is used as an auxiliary sensitivity check but is excluded from the primary BoD analysis to maintain parsimony and restrict the indicator set to items unambiguously within the environmental domain. Prior to BoD estimation, all four indicators are normalised to the [0, 1] interval via min-max transformation applied across the cross-sectional distribution of 83 cities, following the OECD/JRC Handbook on Constructing Composite Indicators [48].
The exclusion of the public-space item (Q1a_6) warrants further justification given its evident relevance to urban quality of life. The item was set aside from the primary composite for three reasons. Conceptually, satisfaction with public spaces captures a socio-functional and design dimension of urban life, such as the availability and quality of squares, meeting places and pedestrian areas, that extends beyond the strictly biophysical-environmental focus of the index. Empirically, it overlaps substantially with the retained green space and cleanliness items, so that its inclusion would risk double-counting and dilute the environmental interpretation of the composite. Methodologically, retaining a parsimonious four-indicator set keeps the number of dimensions small relative to the 83 decision-making units, which preserves the discriminating power of the BoD model. The item is nonetheless retained as an auxiliary variable in the sensitivity analysis (Section 3.3), where it is used to confirm that the substantive ranking is robust to the choice of indicator set.
3.2. Analytical Framework: The BoD Model
The four normalised environmental perception indicators are aggregated into a synthetic UEP index using the BoD model [16,49]. This study estimates three BoD variants together with an equal-weight comparator, as summarised in Table 3.
Table 3.
BoD model variants estimated.
Before presenting the formal specification, it is useful to state the methodological principles that govern the analysis. In plain terms, the aim is to combine the four perception indicators into a single environmental performance score for each city without deciding in advance how important each indicator should be. The approach rests on three principles. First, it is people-centred: the evidence base is residents’ own evaluations of their environment rather than externally imposed technical standards. Second, it is non-compensatory in its weighting logic, in the specific sense that no fixed exchange rate between dimensions is imposed by the analyst; instead, each city is assessed under the weighting most favourable to it, subject to common constraints, so that a high score cannot be manufactured merely by assuming that one dimension matters more. Third, it is comparative and reproducible: all cities are evaluated on identical, harmonised data using a transparent optimisation procedure whose inputs and code can be re-executed. The quantitative technique that operationalises these principles is the benefit-of-the-doubt variant of data envelopment analysis, complemented by weight restrictions, cross-efficiency scoring and exploratory spatial data analysis, while the qualitative interpretation of the resulting scores treats self-reported satisfaction as valid, if partial, evidence of experienced environmental quality, in line with the quality-of-urban-life tradition discussed in Section 2.
For each city (), the standard BoD model (M1) solves:
subject to:
where is the normalised value of the indicator for city , and is the endogenous weight assigned by city to indicator . The composite score is bounded in (0, 1], with indicating frontier status. Cities with identical frontier scores are differentiated through super-efficiency [50], which removes each frontier city from its own constraint set and measures how far above the frontier it would sit.
Model M2 adds lower bounds to prevent zero-weight solutions that would implicitly exclude an environmental domain from a city’s score [16,51]. Model M3 computes peer-appraisal cross-efficiency scores by evaluating each city under the optimal weight vectors derived for all other 82 cities and averaging across them [52,53]. High cross-efficiency scores identify cities that perform well regardless of which weighting scheme is applied, representing a more demanding standard of environmental excellence.
Furthermore, BoD scores are embedded in an exploratory spatial data analysis framework to test for geographic clustering of environmental performance. Cities are geocoded to their FUA centroids using GISCO [54], and spatial relationships are encoded through a K-nearest neighbours’ matrix (K = 5). Global spatial autocorrelation is assessed using Moran’s I, tested against a permutation-based reference distribution (999 random permutations). The spatial autocorrelation analyses (global Moran’s I, the LISA cluster classification, and the associated 999-permutation inference) were implemented in Python using the PySAL library (specifically the esda and libpysal modules), while the BoD linear programmes were solved with SciPy 1.17.1 (scipy.optimize.linprog, HiGHS solver). Local spatial patterns are examined through LISA cluster maps [55], classifying cities into High-High (HH), Low-Low (LL), High-Low (HL), and Low-High (LH) typologies at p < 0.05.
3.3. Robustness and Sensitivity Analysis
To assess whether the M1 ranking is an artefact of specific modelling choices, four complementary robustness checks are performed. First, the weight-restricted (M2) and cross-efficiency (M3) variants of Table 3 are compared with the standard model. Second, an equal-weight (EW) composite is computed as an external comparator. Third, the sensitivity of M2 to the weight-restriction parameter is examined across α ∈ {0.25, 0.50, 0.75}. Fourth, a LOO procedure re-estimates the composite after removing each environmental indicator in turn, isolating its marginal influence on the ranking. Agreement between each perturbed ranking and the M1 baseline is quantified with Spearman’s ρ and Kendall’s τ rank-correlation coefficients, together with top-10 and bottom-10 overlap counts. Results are reported in Section 4.5.
For full reproducibility, the complete analytical pipeline is specified as follows. All linear programmes were solved in Python 3.12 with scipy.optimize.linprog using the HiGHS solver at its default optimality and feasibility tolerances; every one of the 83 city programmes, together with their weight-restricted and cross-efficiency variants, converged to a unique optimal solution without numerical warnings. No observations were removed as outliers: because the four indicators are bounded satisfaction shares that were min–max normalised across the 83 cities (Section 3.1), extreme values are substantively meaningful and were retained. The exploratory spatial analysis was carried out using the PySAL packages esda (version 2.11.0) and libpysal (version 4.15.0) (PySAL, a NumFOCUS-affiliated project; NumFOCUS, Austin, TX, USA), with FUA centroids projected to the ETRS89-LAEA Europe reference system (EPSG:3035) using pyproj 3.7.2 before constructing the K = 5 nearest-neighbour weights matrix; global Moran’s I and the local indicators of spatial association were evaluated against 999 conditional random permutations under a fixed random seed, so that the reported inference is exactly reproducible.
4. Results
4.1. Descriptive Overview: Cross-City Variation in Environmental Satisfaction
Table 2 and the descriptive statistics in the companion Excel file reveal substantial cross-city heterogeneity in all four environmental domains. Mean satisfaction with air quality (ENV1) stands at 59.5% across 83 cities but ranges from a low of 12.1% (Skopje, North Macedonia) to a high of 88.0% (Zurich, Switzerland), yielding a range of 75.9 percentage points and a coefficient of variation of 32.5%. Noise satisfaction (ENV2) shows a mean of 62.0% (range: 30.3–85.9%; CV = 22.6%), while cleanliness satisfaction (ENV3) exhibits the widest dispersion relative to its mean (mean = 59.0%; range: 6.2–92.8%; CV = 30.4%). Green space satisfaction (ENV4) records the highest mean (75.0%) and the narrowest relative spread (CV = 20.4%), suggesting that access to and satisfaction with green spaces is more uniformly distributed across European cities than the biophysical environmental dimensions.
A key structural finding from the descriptive analysis is that ENV4 (green spaces) exhibits a markedly different distributional profile from ENV1–ENV3. While the latter three indicators are moderately positively skewed (more cities scoring below average than above), ENV4 is negatively skewed (skewness = −1.07), indicating that most cities achieve relatively high green space satisfaction and that the distribution is compressed at the upper end. This asymmetry has direct implications for the BoD weight structure, as discussed in Section 4.3.
4.2. BoD Rankings: M1 Standard Model
Table 4 presents the complete BoD ranking under the M1 standard model, sorted by super-efficiency score to break ties among the nine frontier cities (θ = 1.000). The M3 cross-efficiency rank is included for comparative purposes.
Table 4.
BoD rankings—UEP, 83 European cities, UAPS 2023.
Read together, Table 4 and Figure 1 convey three features of the perceived-performance distribution that are central to the analysis. First, the frontier is shared: nine cities attain the maximal score (θ = 1.000) with distinct indicator profiles, confirming that top performance is reached through different environmental strengths rather than a single dominant pattern. Second, the descent from the frontier is gradual across the upper and middle ranks but steepens markedly in the lower tail, where the lowest-ranked cities combine weak scores on several indicators simultaneously; the dashed frontier line in Figure 1 makes this asymmetry visible. Third, the regional colouring of Figure 1 shows that position in the ranking is not randomly distributed in space but is organised along the North–South gradient examined in Section 4.4. At the level of individual indicators, the four dimensions contribute unequally: green space satisfaction is high and comparatively compressed across cities, whereas air quality and cleanliness satisfaction are both lower on average and considerably more dispersed, so that it is chiefly these latter two dimensions that separate high- from low-ranked cities. This reading of the graphic material motivates the weight and regional analyses that follow.
Figure 1.
City ranking by perceived UEP (M1 BoD score), coloured by region; data from the UAPS 2023 [1]. The number preceding each city name is the city’s rank under the M1 model, and the value at the end of each bar is its M1 BoD score. Bars are ordered by score. Cities with reported scores are shown; intermediate ranks (31–73) are omitted as in Table 4. The dashed line marks the efficient frontier (BoD = 1.000).
4.2.1. Frontier Cities
Nine cities achieve the maximum BoD score of 1.000 under M1, constituting the empirical best-practice frontier: Oulu, Luxembourg, Zurich, Malmo, Geneva, Helsinki, Groningen, Munich, and Rostock. These cities are not uniformly strong across all four environmental dimensions; rather, each occupies a distinct position on the frontier by excelling along its own comparative strengths, a defining feature of the BoD approach.
Oulu (Finland), the super-efficiency leader (rank 1 after tie-breaking), achieves near-maximum scores on three of four indicators: air quality (85.1%), noise (85.9%), and green spaces (86.2%), with particularly strong performance on noise, the highest noise satisfaction of any European city in the sample. This multidimensional balance is confirmed by Oulu’s rank-1 position under the cross-efficiency model (M3 = 0.948), indicating that its performance is robust across all peer-evaluated weight vectors. Luxembourg achieves frontier status primarily through its record-highest cleanliness score (92.8%) and high green space satisfaction (87.2%), a profile reflecting consistent EU-level recognition of the Grand Duchy’s urban management standards. Zurich and Geneva anchor Switzerland’s dual frontier presence: Zurich on the basis of leading air quality (88.0%) and cleanliness (88.9%), Geneva on the remarkable concentration of green space satisfaction (93.2%, the highest in the entire sample). Munich achieves frontier status through superior green space satisfaction (90.8%) and cleanliness (83.0%), while Malmo’s status rests on exceptional green space scores (91.7%) combined with the highest noise satisfaction among all Nordic cities.
Among the frontier cities, Rostock (Germany) presents the most specialised profile: the endogenous BoD weighting places 80% of its weight on air quality, reflecting Rostock’s outstanding score of 87.2% on ENV1, the second-highest in the sample, while its cleanliness score (69.5%) is comparatively modest. Under the cross-efficiency model M3, Rostock falls to rank 19 (M3 = 0.866), the sharpest drop among all frontier cities. This divergence is analytically informative: it signals that Rostock’s high BoD score is sensitive to the weighting scheme, and that its frontier status reflects dimensional specialisation rather than broad-based environmental excellence.
4.2.2. High-Performing Non-Frontier Cities
Immediately below the frontier, Bialystok (Poland, rank 10; M1 = 0.994) stands out as the best-performing Eastern European city and the highest-ranked city to lie just off the frontier. Bialystok achieves near-frontier scores across three dimensions simultaneously: air quality (83.5%), cleanliness (88.8%), and green spaces (86.1%), a balanced profile that reflects the city’s investments in urban greening and pedestrianisation since its designation as an EU Green Capital candidate. Dublin (Ireland, rank 12; M1 = 0.978) achieves frontier-proximate status through consistently high scores across all dimensions, while its noise satisfaction (82.3%) is particularly notable given Dublin’s high population density. Aalborg (Denmark, rank 13) represents the archetype of Nordic environmental governance: strong air quality (84.9%), noise (80.3%), and green space (86.3%) satisfaction, with scores clustered in the upper quartile of the distribution on all four dimensions.
Among Western European capitals and large cities, performance is more dispersed. Vienna (rank 18; M1 = 0.948) performs strongly on cleanliness (82.2%) and green spaces (86.4%), while Paris (rank 57; M1 = 0.762) records the lowest air quality satisfaction of any Western European capital (25.7%) and the lowest noise satisfaction of any French city (42.5%), a pattern consistent with objective PM2.5 and traffic noise data for the Ile-de-France region. Berlin (rank 29; M1 = 0.907) occupies a mid-upper position primarily through its green space satisfaction (86.6%), despite a relatively modest cleanliness score (46.8%) that pulls its equal-weight rank down to 42.
4.2.3. Underperforming Cities
The lower tail of the performance distribution reveals a geographically concentrated cluster of underperformers. The four bottom-ranked cities, Palermo (rank 80), Athens (rank 81), Naples (rank 82), and Skopje (rank 83), share a structural profile characterised by low scores on all four environmental dimensions simultaneously. Skopje records the lowest air quality satisfaction in the entire sample (12.1%), reflecting the city’s documented status as one of the most heavily polluted cities in Europe by PM2.5 concentrations, driven by coal combustion and old vehicle stock. Naples and Palermo exhibit the two lowest cleanliness satisfaction scores (24.5% and 6.2%, respectively), with Palermo’s cleanliness score standing as the single most extreme observation in the dataset—a value that anchors the lower end of the normalised indicator distribution.
Among Western European cities, Marseille (rank 75; M1 = 0.537) is the poorest-performing city, with particularly low cleanliness satisfaction (22.0%) and below-average scores on three of four dimensions. Within France, Marseille’s performance contrasts sharply with Rennes (rank 15; M1 = 0.957) and Strasbourg (rank 23; M1 = 0.924), highlighting substantial intra-national variation that city-level analysis can expose but national-level indicators would obscure.
4.3. Weight Structure: Which Environmental Dimensions Drive Performance?
A distinctive contribution of the BoD approach is its generation of endogenous, city-specific weight vectors that reveal which environmental dimension each city leverages most in constructing its composite score. Analysis of the M1 weight distribution across all 83 cities yields several structural findings.
First, green space satisfaction (ENV4) is the dominant indicator for the majority of cities. Across the 83-city sample, the mean weight share assigned to ENV4 is 56.8%, compared to 16.6% for ENV1 (air quality), 11.5% for ENV2 (noise), and 19.2% for ENV3 (cleanliness). ENV4 receives a zero weight in only 23 cities, compared to 48 zero-weight assignments for ENV1 and 50 for ENV2. This pattern reflects ENV4’s distributional properties: as the indicator with the highest mean (75.0%) and moderate spread, green space satisfaction provides a relatively safe “floor” on which many cities can achieve a reasonable composite score even when performing poorly on air quality or noise.
Second, zero-weight solutions are frequent for ENV1 and ENV2. Among the 83 cities, 48 cities assign zero weight to air quality and 50 assign zero weight to noise satisfaction under M1. This is a direct manifestation of the zero-weight pathology identified in the BoD literature [16] and motivates the WR-BoD model M2. Notably, many large European capitals, including Paris, Brussels, Budapest, Warsaw, and Rome, achieve their M1 scores entirely through the green space dimension, effectively allowing poor air quality or cleanliness performance to be compensated by relatively strong green space provision.
Third, several cities display highly specialised frontier profiles that rely on a single indicator. Oulu assigns 100% of its weight to noise satisfaction, Irakleio and Lefkosia to air quality, and Cluj-Napoca, Athina, and Valletta to cleanliness, a pattern that reveals how these cities achieve frontier status through a single comparative strength rather than broad environmental balance. This finding motivates the cross-efficiency correction in M3, where such extreme specialisation is penalised through peer appraisal.
4.4. Regional Patterns
Table 5 and Figure 2 report mean BoD scores and indicator values by geographic region, revealing a clear and statistically coherent North–South gradient in UEP.
Table 5.
Regional summary: mean BoD scores and environmental satisfaction values.
Figure 2.
Regional gradient in perceived UEP. Panel (a): mean M1 BoD score by region (n in parentheses). Panel (b): mean satisfaction (% top-2 box) by environmental domain, showing that the North–South gap is widest on air quality and cleanliness and narrowest on green space. Source: authors’ calculations based on UAPS 2023 [1] (Table 5).
Nordic cities (N = 8) achieve the highest mean M1 BoD score (0.951), driven by consistently high performance across all four dimensions, particularly air quality (78.7%) and noise (77.9%), reflecting both geographic advantages (lower traffic and industrial density, prevailing wind patterns) and long-established Nordic environmental regulatory cultures. Western European cities (N = 26) achieve a mean M1 score of 0.899, with strong green space satisfaction (84.4%) compensating for more variable air quality and cleanliness performance across the sub-sample. UK cities (N = 5; mean M1 = 0.886) perform comparably to Western Europe overall, with notably high noise satisfaction (73.5%) relative to city size.
Eastern European cities (N = 19; mean M1 = 0.772) occupy the middle of the distribution, with considerable intra-regional variation: Bialystok (rank 10) and Ljubljana (rank 20) perform at near-frontier level, while Bucharest (rank 77) and Sofia (rank 73) fall in the lower quartile. Within the region, cleanliness (61.6%) and green space (76.1%) satisfaction are relatively strong, while air quality (52.8%) remains a persistent weakness consistent with the post-transition legacy of heavy industry and coal heating in parts of Central and Eastern Europe.
Southern European cities (N = 17; mean M1 = 0.646) display the most pronounced within-region heterogeneity of any group. Oviedo (rank 17) and Braga (rank 39) perform at Western European levels, while Italian cities as a group score markedly below the EU average on cleanliness (mean ENV3 = 38.7%) and air quality (mean ENV1 = 35.2%), with all six Italian cities in the sample ranking in the bottom half of the overall distribution. This divergence between northern and southern European cities is consistent with prior cross-national comparisons of perceived urban quality of life [56,57].
Western Balkan cities (N = 3; mean M1 = 0.412) and Turkish cities (N = 5; mean M1 = 0.710) complete the distribution. Skopje (North Macedonia) anchors the global performance minimum, while Turkish cities exhibit high intra-group variability - Diyarbakir (rank 40; M1 = 0.861) outperforms several EU capitals, a result driven primarily by high air quality satisfaction in this inland Anatolian city.
4.5. Robustness of Rankings
Table 6 reports the robustness analysis across all sensitivity perturbations described in Section 3.3. The findings are consistently reassuring: all four model variants and sensitivity specifications produce high Spearman rank correlations with the M1 baseline (range: 0.900–0.995), indicating that the broad ranking is not an artefact of specific methodological choices.
Table 6.
Robustness analysis—rank correlations across model variants and LOO perturbations.
The LOO analysis reveals that ENV4 (green spaces) is the single most influential indicator: its exclusion produces the largest drop in rank correlation (ρ = 0.900) and the highest number of top-10 position changes (3 of 10). This confirms the structural dominance of green space satisfaction identified in the weight analysis. ENV2 (noise) exercises the least influence (ρ = 0.995), consistent with its low average weight share and the relatively narrow cross-city variance of noise satisfaction compared to the other three indicators.
The M2 WR-BoD model (α = 0.50) is nearly indistinguishable from M1 (ρ = 0.989), suggesting that at the applied weight restriction level, the endogenous weights already distribute broadly enough that the constraint is rarely binding. Sensitivity analysis across alpha values {0.25, 0.75} confirms this stability (ρ > 0.97 in all cases). The M3 cross-efficiency model produces the most notable rank changes for specialised frontier cities, most prominently Rostock, which falls from M1 rank 9 to M3 rank 19 while consistently outperformed cities such as Bialystok (rank 10 in both M1 and M3) are confirmed as robustly high-performing.
4.6. Spatial Pattern of Environmental Performance
Mapping the M1 BoD scores to the cities’ FUA locations makes the regional gradient documented in Section 4.4 geographically explicit (Figure 3). High-performing cities form a compact northern and north-western cluster spanning the Nordic countries, the Low Countries, Switzerland and Germany, whereas the lowest scores concentrate along a southern and south-eastern arc running from the Italian south through the Balkans to North Macedonia. Well-performing Eastern European cities such as Bialystok and Ljubljana appear as local high outliers within an otherwise middle-tier neighbourhood, while Marseille and Valletta stand out as low-performing points within Western and Southern Europe respectively. This visual clustering is consistent with the positive global spatial autocorrelation and the High-High/Low-Low local groupings anticipated by the exploratory spatial framework of Section 3.2. The formal test confirms this pattern: the global Moran’s I for the M1 BoD score is 0.57 (z = 9.2; pseudo p = 0.001 under 999 random permutations), indicating statistically significant positive spatial autocorrelation. The LISA classification identifies a significant High-High cluster concentrated in the Nordic and northern-continental belt and a Low-Low cluster spanning the southern and south-eastern arc (p < 0.05), consistent with the North–South gradient described above.
Figure 3.
Spatial distribution of perceived UEP (M1 BoD score) across European FUAs [47]. Marker size and colour both encode the composite score. Cities shown are those with reported scores; intermediate ranks (31–73) are largely omitted in the source table. Source: authors’ calculations; country outlines used as basemap.
Taken together, these results speak directly to the objectives set out in Section 1. The ranking, weight and spatial analyses jointly demonstrate that a people-centred, non-compensatory benchmark of perceived environmental performance is both feasible and informative: it discriminates among cities, it attributes their standing to identifiable indicator profiles rather than to an imposed weighting, and it reveals a spatially structured North–South gradient. Rather than dwelling on individual cities, it is this general pattern that matters for the study’s contribution: perceived environmental performance behaves as a coherent, measurable and geographically organised construct, distinct from objective environmental data yet systematically related to it. The individual cases discussed above, such as Paris, Białystok and the Nordic frontier cities, are illustrative instances of these regularities rather than findings in their own right, and they are revisited in the Discussion only insofar as they clarify the mechanisms, most notably green compensation, that link perceived to objective environmental quality.
5. Discussion
The results reported above can now be read against the conceptual and empirical framework set out in Section 1 and Section 2. Three connections are central. First, the benchmark operationalises the interactional, perception-based definition of environmental quality advanced by Pacione [7] and van Kamp et al. [8]: cities are ranked not on biophysical measurements but on how residents evaluate their environment, exactly the evidential layer that objective indicators cannot reach [27]. Second, the frequent divergence between perceived and objective conditions documented below echoes the modest, domain-specific objective–subjective association reported across the quality-of-urban-life literature [21,27,30], reframing that divergence as a governance signal rather than measurement noise. Third, by letting each city select its own environmental weights, the BoD design directly answers the arbitrary-weighting critique [16] that motivated the study, while the cross-efficiency and weight-restricted extensions guard against the compensation effects that broad quality-of-life composites permit [17,29]. The following subsections develop these connections in turn.
5.1. Perceived Versus Objective Environmental Quality: What BoD Reveals?
The BoD composite scores derived in this study constitute a measure of perceived UEP, one that is distinct from, and complementary to, objective indicators such as PM2.5 concentrations, noise exposure levels, or per capita park area. The relationship between objective and perceived environmental quality is well-established to be imperfect: subjective satisfaction is mediated by individual adaptation, demographic characteristics, comparative reference frames, and the quality of public communication around environmental issues [58,59]. Several of our findings illustrate this gap concretely.
Paris records an air quality satisfaction of only 25.7%, placing it in the bottom quartile of the sample and yielding a low overall BoD score (rank 57). This is consistent with Paris’s historically poor air quality record (the Ile-de-France region has consistently exceeded EU NO2 and PM2.5 limit values), but Paris’s green space satisfaction (78.2%) is comparatively high, suggesting that residents’ compensation strategies (accessing urban parks and the bois) partially offset perceived air quality dissatisfaction. Strasbourg (rank 23) presents an almost inverse pattern: despite modest air quality satisfaction (49.6%), its exceptional green space satisfaction (88.1%) and cleanliness scores support a near-top-quartile BoD score under the standard model. This “green compensation” mechanism, whereby high green space provision partially offsets low satisfaction with biophysical environmental quality, emerges as a recurring structural pattern in the data and has direct implications for urban environmental policy design.
Conversely, several cities from Central and Eastern Europe score well on perceived environmental quality relative to their objective environmental performance. Bialystok (Poland, rank 10) registers a near-frontier BoD score despite Poland’s documented air quality challenges, reflecting the city’s specific history of deindustrialisation and its location in the Podlaskie region, where lower traffic density and proximity to the Bialowieza Forest biosphere reserve may shape residents’ comparisons with other Polish cities. Piatra Neamt (Romania, rank 24) similarly outperforms the regional average substantially, recording high satisfaction with cleanliness (77.0%) and air quality (81.1%), which is a result that likely reflects the city’s small size, mountain location, and the relative novelty of its urban infrastructure compared to older industrial centres.
5.2. The Structural Dominance of Green Spaces in European Urban Environmental Satisfaction
One of the most robust structural findings of this analysis is the dominant role of green space satisfaction (ENV4) in determining composite BoD scores. Across 83 cities, ENV4 receives the highest mean weight share (56.8%) in the endogenous BoD solution and exercises the greatest influence on the ranking, as confirmed by both the weight analysis and the LOO sensitivity test (ρ = 0.900 when excluded, compared to 0.972–0.995 for the other three indicators).
This finding is not merely a methodological artefact of the BoD approach. It reflects two substantive realities. First, green space satisfaction has the highest mean (75.0%) and the most positively skewed distribution among the four indicators, making it the dimension on which cities can most reliably claim a high-enough score to anchor their composite index. Second, and more substantively, green space satisfaction captures a dimension of urban environmental quality that European residents appear to evaluate more generously than ambient environmental quality dimensions such as air quality and noise. The EEA and WHO have long documented the role of urban green infrastructure in buffering residents’ perceptions of overall environmental quality [60], and our results provide systematic, cross-European quantitative evidence for this buffering effect at the city level.
The policy implication is significant: cities that have invested heavily in urban greening, regardless of their performance on air quality or noise, can achieve high composite environmental satisfaction scores. This creates a potential “greening illusion” in perception-based environmental governance benchmarking, whereby cities that have strategically prioritised visible green space investments may appear to outperform cities with objectively better air or noise environments but lower green space provision. Complementing perception-based BoD scores with objective environmental indicators is therefore essential for policy-relevant interpretation, an approach consistent with the EU Mission on Climate-Neutral Cities’ mixed-indicator monitoring framework [61].
The green compensation mechanism identified above deserves a more critical reading than a purely descriptive one. Normatively, it implies that visible amenity provision can raise a city’s perceived environmental standing even where health-critical burdens such as air pollution and noise remain unresolved. For policy design, this carries a genuine risk: if perception-based benchmarks are used to allocate recognition or resources, they may inadvertently reward the most salient and politically rewarding investments, such as parks and greening schemes, over less visible but epidemiologically more consequential interventions in air quality and noise abatement. The composite should therefore be read as a diagnostic of experienced performance rather than as a licence to substitute greening for pollution control; its dimension-specific decomposition (Section 4.4) is precisely what allows this trade-off to be surfaced rather than concealed.
These findings also invite comparison beyond Europe and connection to wider debates on urban environmental governance. Studies of North American, Latin American and Asian cities report a similarly imperfect coupling between objective environmental conditions and residents’ satisfaction, suggesting that the divergence documented here is not a European peculiarity but a general feature of perception-based assessment, albeit conditioned by local expectations and provision levels. Interpreted through the lens of multi-level governance, the results are relevant to the European Union’s layered environmental architecture, in which municipal service delivery, national regulation, and EU-level missions and cohesion instruments jointly shape the outcomes residents experience. They also connect to scholarship on urban environmental governance and knowledge co-production, which argues that robust urban sustainability depends on integrating citizens’ situated knowledge into planning and monitoring [62]. Perception-based composites such as the one developed here can serve as one formal channel for that co-production, provided their limitations, including the distributional and salience biases noted in Section 2, are made explicit.
5.3. Geographic Clustering and the North–South Gradient
The regional analysis reveals a pronounced and statistically coherent North–South gradient in UEP. Nordic and Northern/Western European cities dominate the upper performance tier, Eastern European cities occupy the middle, and Southern European and Western Balkan cities are disproportionately concentrated in the lower tail. This gradient aligns with prior findings from the broader urban quality-of-life literature [1,51] but adds substantive specificity by identifying the precise environmental dimensions driving the gradient.
The gradient is not symmetric across dimensions. On green space satisfaction (ENV4), the North–South gap narrows considerably: several Southern European cities (e.g., Oviedo: 79.8%; Braga: 72.0%) achieve scores comparable to the European median, and even cities at the bottom of the overall ranking (e.g., Napoli: 30.4%) are not dramatically worse than some Eastern European comparators. The gap is instead most acute on air quality and cleanliness, where Southern European cities as a group score 11.2 and 17.3 percentage points below the EU sample mean, respectively.
This dimensional decomposition of the geographic gradient has direct policy implications for EU Cohesion Policy targeting. Rather than treating “low-performing Southern European cities” as a monolithic category, the BoD analysis enables dimension-specific diagnosis: investments in cleanliness and solid waste management infrastructure are the highest-priority environmental governance lever for Italian and Balkan cities, while air quality improvement, likely requiring regulation of vehicle emissions and heating sources, is the priority for cities in the Western Balkans and parts of Eastern Europe. The multi-directional improvement potential embedded in the BoD framework [63] can be applied to decompose each city’s gap from the frontier into dimension-specific improvement targets, providing actionable benchmarks for urban environmental governance planning.
5.4. Intra-National Variation and the Limitations of National-Level Analysis
A recurring theme in the results is the magnitude of within-country variation, which substantially exceeds the variation one would infer from national-level environmental performance indices. Within France, BoD scores range from 0.537 (Marseille) to 0.957 (Rennes), a spread of 0.420 BoD units. Within Germany, the range is 0.867–1.000 (Rostock–Munich/Oulu range); within Italy, 0.279–0.700 (Naples–Verona range); and within Romania, 0.459–0.920 (Bucharest–Piatra Neamt range). In each case, the best-performing national city achieves scores comparable to the top-performing countries in other regional groupings, while the worst-performing national city falls to the bottom quartile of the full European distribution.
This intra-national heterogeneity highlights the analytical value of the city-level BoD framework as a complement to national-level environmental performance indices such as the EPI [64] or the EU Environmental Performance Assessment. National aggregates mask the specific city-level governance successes and deficits that the UAPS and BoD approach expose. The finding is consistent with the EU’s own Cohesion Policy rationale for city-level targeting and with the arguments of Storper [65] regarding the primacy of cities as units of economic and environmental governance.
5.5. Limitations and Directions for Future Research
This study is subject to several limitations that should guide its interpretation and motivate future research. First, the four-indicator specification is constrained by the items available in the released 2023 aggregated UAPS data. The microdata release contains additional environmental items, including climate responsiveness perceptions not available in the aggregated file, which, when accessible, would allow a richer seven-indicator BoD model as originally proposed. Second, the cross-sectional design of the current wave precludes longitudinal efficiency change decomposition; the sequential BoD approach of Walheer [66] would be applicable once the 2026 UAPS wave becomes available, enabling a Malmquist-type decomposition of environmental performance change. Third, the UAPS samples approximately 800 respondents per city, yielding sampling errors of ±3–4 percentage points at the city level; formal propagation of these measurement uncertainties into BoD score confidence intervals, following the bootstrap approach of Simar and Wilson [67], would strengthen the inferential basis of the ranking.
A further limitation concerns the scope of the sample. Because the analysis is bounded by the coverage of the 2023 UAPS wave, it includes only the 83 Functional Urban Areas surveyed and cannot speak to cities, or city types, that the survey does not cover; the findings should therefore be generalised to the wider European urban system only with caution. As successive UAPS waves extend or revise their coverage, the benchmark can be re-estimated on the enlarged sample, as discussed below.
Future research should further explore the relationship between BoD-derived perception scores and objective environmental data, specifically the extent to which the green space dominance finding holds when objective green space provision metrics (e.g., percentage of urban area covered by vegetation) are incorporated as exogenous conditioning variables in a conditional BoD framework. Additionally, applying the multi-directional robust BoD variant [63] would allow dimension-specific improvement potential to be quantified for each underperforming city, providing a more directly policy-actionable output than the global efficiency score. Finally, it should be emphasised that the analytical framework proposed here is not tied to the 2023 wave: because it operates on the harmonised, periodically released Eurostat UAPS data, the entire pipeline including normalisation, BoD estimation, robustness checks, and spatial analysis can be updated and re-run without modification whenever new data become available. This updatable design reinforces the longevity and continuing relevance of the approach and helps justify publishing a benchmark based on the consolidated 2023 dataset, since successive data releases can be incorporated directly to support longitudinal and comparative analyses.
6. Conclusions
This paper has applied the BoD composite-indicator framework to the 2023 Eurostat UAPS to produce the first comprehensive, methodologically rigorous ranking of European cities by perceived UEP across 83 cities in 36 countries. The analysis yields several substantive contributions.
Methodologically, the BoD approach proves well-suited to cross-European urban environmental benchmarking: it accommodates the value pluralism inherent in comparing cities with radically different environmental profiles without imposing an arbitrary common weighting structure, while the cross-efficiency and weight-restricted extensions ensure that the rankings are robust and that no single environmental dimension can be ignored. The very high rank correlations across model variants (ρ = 0.900–0.995) confirm that the fundamental ranking of European cities by perceived environmental quality is a stable empirical finding.
Substantively, the analysis establishes a clear North–South gradient in perceived urban environmental quality, with Nordic and Northern/Western European cities dominating the frontier, Eastern European cities occupying the middle tier, and Southern European and Western Balkan cities concentrated in the lower tail. Green space satisfaction emerges as the dominant structural driver of composite environmental performance across the continent, with air quality and cleanliness satisfaction as the primary discriminating factors in the lower half of the distribution. These findings have direct implications for how EU Cohesion Policy, the Mission on Climate-Neutral and Smart Cities, and national urban environmental governance programmes allocate resources and set performance benchmarks at the city level.
The results also demonstrate the significant analytical value of perception-based composite indicators as complements to objective environmental data: several cities perform markedly differently on perceived versus objective environmental quality dimensions, with the “green compensation” mechanism, whereby high green space satisfaction offsets low air quality satisfaction in residents’ overall environmental evaluation, emerging as a structurally important and policy-relevant pattern.
These contributions can be summarised along three axes. Theoretically, the study advances a conception of perceived urban environmental performance as an autonomous, non-compensatory construct rather than a subordinate component of broader liveability or smart-city composites. Methodologically, it demonstrates a transparent and reproducible benchmarking architecture that combines the benefit-of-the-doubt model with weight restrictions, cross-efficiency appraisal and exploratory spatial data analysis, and that can be applied to any harmonised wave of perception data. Empirically, it delivers the first comprehensive European ranking of perceived environmental performance for 2023, documents a robust North–South gradient, and identifies green space satisfaction and the green compensation mechanism as central structural features. Building on these axes, future research could proceed in four directions: linking perceived scores to objective environmental data within a conditional benchmarking framework; exploiting successive UAPS waves to move from a cross-sectional to a longitudinal, convergence-oriented analysis; extending the approach below the city scale to examine the distributional and environmental-justice dimensions that aggregate data conceal; and testing the transferability of the framework to non-European urban systems. Together, these directions would consolidate perception-based environmental benchmarking as a cumulative and policy-relevant research programme.
Supplementary Materials
The following supporting information can be downloaded at: https://www.mdpi.com/article/10.3390/urbansci10080470/s1, Table S1: BoD Rankings; Table S2: Regional Summary; Table S3: Weight Analysis; Table S4: Robustness; Table S5: Descriptive Statistics.
Author Contributions
Conceptualization, I.M. and M.M.; methodology, I.M.; software, I.M.; validation, I.M. and S.M.Z.; formal analysis, I.M. and M.M.; investigation, I.M. and S.M.Z.; resources, I.M.; data curation, I.M.; writing—original draft preparation, I.M. and S.M.Z.; writing—review and editing, S.M.Z. and M.M.; visualisation, S.M.Z.; supervision, M.M.; funding acquisition, I.M. and M.M. All authors have read and agreed to the published version of the manuscript.
Funding
This research was funded by the European Union under the Horizon Europe Widening Participation and Spreading Excellence Programme, grant number 101187119, and the Ministry of Science, Technological Development, and Innovation of the Republic of Serbia, decision numbers 451-03-33/2026-03/200371 and 451-03-34/2026-03/200100. The APC was funded by Horizon Europe Widening Participation and Spreading Excellence programme, grant number 101187119.
Data Availability Statement
Publicly available datasets were analysed in this study. These data can be found here: https://ec.europa.eu/eurostat/data/database/ (accessed on 30 June 2026).
Acknowledgments
(i) This paper is part of the research conducted within the international project “Advancing Data-Based Policy-Making in Urban and Regional Development and Wide-Scale Implementation for Sustainable Environments” that has received funding from the European Union under the Horizon Europe Widening Participation and Spreading Excellence programme, grant agreement No. 101187119. The usual disclaimers apply. (ii) The paper is a part of research financed by the Ministry of Science, Technological Development, and Innovation of the Republic of Serbia, as agreed in decisions no. 451-03-33/2026-03/200371 and 451-03-34/2026-03/200100, and contributes to SDG 3, SDG 11, and SDG 15.
Conflicts of Interest
The authors declare no conflicts of interest.
Abbreviations
The following abbreviations are used in this manuscript:
| UAPS | Urban Audit Perception Survey |
| UEP | Urban Environmental Performance |
| BoD | Benefit-of-the-doubt |
| DEA | Data Envelopment Analysis |
| FUA | Functional Urban Area |
| LOO | Leave-one-out |
| EU | European Union |
References
- European Commission. Report on the Quality of Life in European Cities, 2023; Publications Office of the European Union: Luxembourg, 2023. [Google Scholar]
- European Union. EU Mission: Climate-Neutral and Smart Cities; Publications Office of the European Union: Luxembourg, 2025. [Google Scholar]
- Howlett, M. Governance Modes, Policy Regimes and Operational Plans: A Multi-Level Nested Model of Policy Instrument Choice and Policy Design. Policy Sci. 2009, 42, 73–89. [Google Scholar] [CrossRef] [Scilit]
- Holland, B. Typologies of National Urban Policy: A Theoretical Analysis. Cities 2015, 48, 125–129. [Google Scholar] [CrossRef] [Scilit]
- Perry, B.; Diprose, K.; Taylor Buck, N.; Simon, D. Localizing the SDGs in England: Challenges and Value Propositions for Local Government. Front. Sustain. Cities 2021, 3, 746337. [Google Scholar] [CrossRef] [Scilit]
- Michalina, D.; Mederly, P.; Diefenbacher, H.; Held, B. Sustainable Urban Development: A Review of Urban Sustainability Indicator Frameworks. Sustainability 2021, 13, 9348. [Google Scholar] [CrossRef] [Scilit]
- Pacione, M. Urban Environmental Quality and Human Wellbeing—A Social Geographical Perspective. Landsc. Urban Plan. 2003, 65, 19–30. [Google Scholar] [CrossRef] [Scilit]
- Van Kamp, I.; Leidelmeijer, K.; Marsman, G.; De Hollander, A. Urban Environmental Quality and Human Well-Being: Towards a Conceptual Framework and Demarcation of Concepts; a Literature Study. Landsc. Urban Plan. 2003, 65, 5–18. [Google Scholar]
- Musse, M.A.; Barona, D.A.; Santana Rodriguez, L.M. Urban Environmental Quality Assessment Using Remote Sensing and Census Data. Int. J. Appl. Earth Obs. Geoinf. 2018, 71, 95–108. [Google Scholar] [CrossRef] [Scilit]
- Mahmoudzadeh, H.; Abedini, A.; Aram, F.; Mosavi, A. Evaluating Urban Environmental Quality Using Multi-Criteria Decision Making. Heliyon 2024, 10, e24921. [Google Scholar] [CrossRef] [Scilit] [PubMed]
- Brosz, M.; Dymnicka, M.; Sagan, I.; Załęcki, J. The Environmental Dimension of City Dwellers’ Quality of Life and the City’s Social and Spatial Variability. Misc. Geogr. 2023, 27, 5–10. [Google Scholar] [CrossRef] [Scilit]
- Bonnes, M.; Scopelliti, M.; Fornara, F.; Carrus, G. Urban Environmental Quality. In Environmental Psychology: An Introduction; Steg, L., de Groot, J.I.M., Eds.; John Wiley & Sons Ltd.: Chichester, UK, 2019; pp. 113–122. [Google Scholar]
- Liang, B.; Weng, Q. Assessing Urban Environmental Quality Change of Indianapolis, United States, by the Remote Sensing and GIS Integration. IEEE J. Sel. Top. Appl. Earth Obs. Remote Sens. 2011, 4, 43–55. [Google Scholar] [CrossRef] [Scilit]
- Giffinger, R.; Fertner, C.; Kramar, H.; Pichler-Milanović, N.; Meijers, E. Smart Cities: Ranking of European Medium-Sized Cities; Centre of Regional Science, Vienna University of Technology: Vienna, Austria, 2007. [Google Scholar]
- Pequeno, N.P.F.; Cabral, N.L.d.A.; Marchioni, D.M.; Lima, S.C.V.C.; Lyra, C.d.O. Quality of Life Assessment Instruments for Adults: A Systematic Review of Population-Based Studies. Health Qual. Life Outcomes 2020, 18, 208. [Google Scholar] [CrossRef] [Scilit] [PubMed]
- Cherchye, L.; Moesen, W.; Rogge, N.; Van Puyenbroeck, T. An Introduction to “Benefit of the Doubt” Composite Indicators. Soc. Indic. Res. 2007, 82, 111–145. [Google Scholar] [CrossRef] [Scilit]
- Marjanović, I.; Zbiljić, S.M.; Stanković, J.J.; Marković, M. Towards Urban Sustainability: Composite Index of Smart City Performance. Sustainability 2026, 18, 372. [Google Scholar] [CrossRef] [Scilit]
- Stanković, J.J.; Popović, Ž.; Marjanović, I. Assessing Smartness and Urban Development of the European Cities: An Integrated Approach of Entropy and VIKOR. In Multiple Criteria Decision Making. MCDM 2019. Contributions to Management Science; Topcu, Y.I., Özaydın, Ö., Kabak, Ö., Önsel Ekici, Ş., Eds.; Springer: Cham, Switzerland, 2021; pp. 69–97. [Google Scholar]
- Saeed, U.; Ahmad, S.R.; Mohey-ud-din, G.; Butt, H.J.; Ashraf, U. An Integrated Approach for Developing an Urban Livability Composite Index—A Cities’ Ranking Road Map to Achieve Urban Sustainability. Sustainability 2022, 14, 8755. [Google Scholar] [CrossRef] [Scilit]
- Ekkel, E.D.; de Vries, S. Nearby Green Space and Human Health: Evaluating Accessibility Metrics. Landsc. Urban Plan. 2017, 157, 214–220. [Google Scholar] [CrossRef] [Scilit]
- Mouratidis, K. Urban Planning and Quality of Life: A Review of Pathways Linking the Built Environment to Subjective Well-Being. Cities 2021, 115, 103229. [Google Scholar] [CrossRef] [Scilit]
- Morais, P.; Camanho, A.S. Evaluation of Performance of European Cities with the Aim to Promote Quality of Life Improvements. Omega 2011, 39, 398–409. [Google Scholar] [CrossRef] [Scilit]
- Iammarino, S.; Rodriguez-Pose, A.; Storper, M. Regional Inequality in Europe: Evidence, Theory and Policy Implications. J. Econ. Geogr. 2019, 19, 273–298. [Google Scholar] [CrossRef] [Scilit]
- Lansing, J.B.; Marans, R.W. Evaluation of Neighborhood Quality. J. Am. Inst. Plann. 1969, 35, 195–199. [Google Scholar] [CrossRef] [Scilit]
- Bonaiuto, M.; Fornara, F.; Bonnes, M. Indexes of Perceived Residential Environment Quality and Neighbourhood Attachment in Urban Environments: A Confirmation Study on the City of Rome. Landsc. Urban Plan. 2003, 65, 41–52. [Google Scholar] [CrossRef] [Scilit]
- Faisal, K.; Shaker, A. Improving the Accuracy of Urban Environmental Quality Assessment Using Geographically-Weighted Regression Techniques. Sensors 2017, 17, 528. [Google Scholar] [CrossRef] [Scilit] [PubMed]
- McCrea, R.; Shyy, T.K.; Stimson, R. What Is the Strength of the Link between Objective and Subjective Indicators of Urban Quality of Life? Appl. Res. Qual. Life 2006, 1, 79–96. [Google Scholar] [CrossRef] [Scilit]
- Marans, R.W.; Stimson, R. Investigating Quality of Urban Life: Theory, Methods, and Empirical Research; Springer Science & Business Media: Dordrecht, The Netherlands, 2011; Volume 45. [Google Scholar]
- Zanella, A.; Camanho, A.S.; Dias, T.G. The Assessment of Cities’ Livability Integrating Human Wellbeing and Environmental Impact. Ann. Oper. Res. 2015, 226, 695–726. [Google Scholar] [CrossRef] [Scilit]
- Giannico, V.; Spano, G.; Elia, M.; D’Este, M.; Sanesi, G.; Lafortezza, R. Green Spaces, Quality of Life, and Citizen Perception in European Cities. Environ. Res. 2021, 196, 110922. [Google Scholar] [CrossRef] [Scilit] [PubMed]
- Harzing, A.W. Response Styles in Cross-National Survey Research: A 26-Country Study. Int. J. Cross Cult. Manag. 2006, 6, 243–266. [Google Scholar] [CrossRef] [Scilit]
- de Beuckelaer, A.; Weijters, B.; Rutten, A. Using Ad Hoc Measures for Response Styles: A Cautionary Note. Qual. Quant. 2010, 44, 761–775. [Google Scholar] [CrossRef] [Scilit]
- Greco, S.; Ishizaka, A.; Tasiou, M.; Torrisi, G. On the Methodological Framework of Composite Indices: A Review of the Issues of Weighting, Aggregation, and Robustness. Soc. Indic. Res. 2019, 141, 61–94. [Google Scholar] [CrossRef] [Scilit]
- Córdoba Hernández, R.; Camerin, F. The Application of Ecosystem Assessments in Land Use Planning: A Case Study for Supporting Decisions toward Ecosystem Protection. Futures 2024, 161, 103399. [Google Scholar] [CrossRef] [Scilit]
- Yan, L.; Jin, X.; Zhang, J. Equity in Park Green Spaces: A Bibliometric Analysis and Systematic Literature Review from 2014–2023. Front. Environ. Sci. 2024, 12, 1374973. [Google Scholar] [CrossRef] [Scilit]
- Venter, Z.S.; Figari, H.; Krange, O.; Gundersen, V. Environmental Justice in a Very Green City: Spatial Inequality in Exposure to Urban Nature, Air Pollution and Heat in Oslo, Norway. Sci. Total Environ. 2023, 858, 160193. [Google Scholar] [CrossRef] [Scilit] [PubMed]
- Morais, P.; Miguéis, V.L.; Camanho, A.S. Quality of Life Experienced by Human Capital: An Assessment of European Cities. Soc. Indic. Res. 2013, 110, 187–206. [Google Scholar] [CrossRef] [Scilit]
- Coisnon, T.; Musson, A.; Pene, S.D.; Rousselière, D. Disentangling Public Urban Green Space Satisfaction: Exploring Individual and Contextual Factors across European Cities. Cities 2024, 152, 105154. [Google Scholar] [CrossRef] [Scilit]
- Olsen, J.R.; Nicholls, N.; Mitchell, R. Are Urban Landscapes Associated with Reported Life Satisfaction and Inequalities in Life Satisfaction at the City Level? A Cross-Sectional Study of 66 European Cities. Soc. Sci. Med. 2019, 226, 263–274. [Google Scholar] [CrossRef] [Scilit] [PubMed]
- Węziak-Białowolska, D. Quality of Life in Cities—Empirical Evidence in Comparative European Perspective. Cities 2016, 58, 87–96. [Google Scholar] [CrossRef] [Scilit]
- Moeinaddini, M.; Asadi-Shekari, Z.; Aghaabbasi, M.; Saadi, I.; Shah, M.Z.; Cools, M. Applying Non-Parametric Models to Explore Urban Life Satisfaction in European Cities. Cities 2020, 105, 102851. [Google Scholar] [CrossRef] [Scilit]
- Castelli, C.; d’Hombres, B.; De Dominicis, L.; Dijkstra, L.; Montalto, V.; Pontarollo, N. What Makes Cities Happy? Factors Contributing to Life Satisfaction in European Cities. Eur. Urban Reg. Stud. 2023, 30, 319–342. [Google Scholar] [CrossRef] [Scilit]
- Ribeiro, A.I.; Fraga, S.; Barros, H. Residents’ Dissatisfaction and All-Cause Mortality. Evidence from 74 European Cities. Front. Psychol. 2018, 8, 2319. [Google Scholar] [CrossRef] [Scilit] [PubMed]
- Medgyesi, M.; Csathó, Á. The Effect of the Local Economic Context and Local Public Services on Financial Satisfaction among Youth in European Cities. Front. Sociol. 2024, 9, 1207807. [Google Scholar] [CrossRef] [Scilit] [PubMed]
- Şenlier, N.; Yıldız, R.; Aktaş, D.D. A Perception Survey for the Evaluation of Urban Quality of Life in Kocaeli and a Comparison of the Life Satisfaction with the European Cities. Soc. Indic. Res. 2009, 94, 213–226. [Google Scholar] [CrossRef] [Scilit]
- Dijkstra, L.; Poelman, H. Cities in Europe: The New OECD-EC Definition. Regional Focus 01/2012; DG REGIO, European Commission: Brussels, Belgium, 2012. [Google Scholar]
- Eurostat. City Statistics (Urban Audit)—Methodological Manual on City Statistics; Eurostat: Luxembourg, 2024. [Google Scholar]
- Nardo, M.; Saisana, M.; Saltelli, A.; Tarantola, S.; Hoffmann, A.; Giovannini, E. Handbook on Constructing Composite Indicators: Methodology and User Guide; OECD Publishing/JRC: Paris, France, 2008. [Google Scholar]
- Melyn, W.; Moesen, W. Towards a Synthetic Indicator of Macroeconomic Performance: Unequal Weighting When Limited Information Is Available; Public Economics Research Paper No. 17; KU Leuven: Leuven, Belgium, 1991. [Google Scholar]
- Andersen, P.; Petersen, N.C. A Procedure for Ranking Efficient Units in Data Envelopment Analysis. Manag. Sci. 1993, 39, 1261–1264. [Google Scholar] [CrossRef] [Scilit]
- Reig-Martínez, E.; Gómez-Limón, J.A.; Picazo-Tadeo, A.J. Weight-Constrained DEA Measurement of the Quality of Life in Spanish Municipalities in 2011. Soc. Indic. Res. 2016, 136, 1293–1310. [Google Scholar] [CrossRef] [Scilit] [PubMed]
- Sexton, T.R.; Silkman, R.H.; Hogan, A.J. Data Envelopment Analysis: Critique and Extensions. New Dir. Program Eval. 1986, 32, 73–105. [Google Scholar] [CrossRef] [Scilit]
- Liu, Y.; Chen, S.; Zhang, R.; Lin, X.; Li, A. Understanding the Efficiency Changes of Green Institutional Environment: An Application of Two New Cross-Efficiency Benefit-of-the-Doubt Models to China. J. Clean. Prod. 2022, 380, 134864. [Google Scholar] [CrossRef] [Scilit]
- Eurostat. GISCO—Geographical Information and Maps: Administrative and Statistical Units; Eurostat: Luxembourg, 2023. [Google Scholar]
- Anselin, L. Local Indicators of Spatial Association—LISA. Geogr. Anal. 1995, 27, 93–115. [Google Scholar] [CrossRef] [Scilit]
- European Commission. Quality of Life in European Cities 2019; DG REGIO, Publications Office of the European Union: Luxembourg, 2020. [Google Scholar]
- Dissart, J.C.; Deller, S.C. Quality of Life in the Planning Literature. J. Plan. Lit. 2000, 15, 135–161. [Google Scholar] [CrossRef] [Scilit]
- Gotink, J.; Gadeyne, S. Perception of the Residential Living Environment: The Relationship between Objective and Subjective Indicators and Health. Int. J. Environ. Res. Public Health 2025, 22, 391. [Google Scholar] [CrossRef] [Scilit] [PubMed]
- Hornsey, M.J.; Fielding, K.S. Understanding (and reducing) inaction on climate change. Soc. Issues Policy Rev. 2020, 14, 3–35. [Google Scholar] [CrossRef] [Scilit]
- European Environment Agency (EEA). Urban Green Infrastructure: Connecting People and Nature for Sustainable Cities; EEA Report; Publications Office of the European Union: Luxembourg, 2020. [Google Scholar]
- European Commission. EU Mission on 100 Climate-Neutral and Smart Cities: Mission Implementation Plan; Publications Office of the European Union: Luxembourg, 2022. [Google Scholar]
- Frantzeskaki, N.; Kabisch, N.; McPhearson, T. Advancing urban environmental governance: Understanding theories, practices and processes shaping urban sustainability and resilience. Environ. Sci. Policy 2016, 62, 1–6. [Google Scholar] [CrossRef] [Scilit]
- Vidoli, F.; Fusco, E.; Pignataro, G.; Guccio, C. Potential Improvements Approach in Composite Indicators Construction: The Multi-Directional Benefit of the Doubt Model. Socio-Econ. Plan. Sci. 2023, 87, 101316. [Google Scholar]
- Yale Center for Environmental Law and Policy. Environmental Performance Index 2022; Yale University: New Haven, CT, USA, 2022. [Google Scholar]
- Storper, M. Keys to the City: How Economics, Institutions, Social Interaction, and Politics Shape Development; Princeton University Press: Princeton, NJ, USA, 2013. [Google Scholar]
- Walheer, B. A Sequential Benefit-of-the-Doubt Composite Indicator. Eur. J. Oper. Res. 2024, 316, 228–239. [Google Scholar] [CrossRef] [Scilit]
- Simar, L.; Wilson, P.W. Sensitivity Analysis of Efficiency Scores: How to Bootstrap in Nonparametric Frontier Models. Manag. Sci. 1998, 44, 49–61. [Google Scholar] [CrossRef] [Scilit]
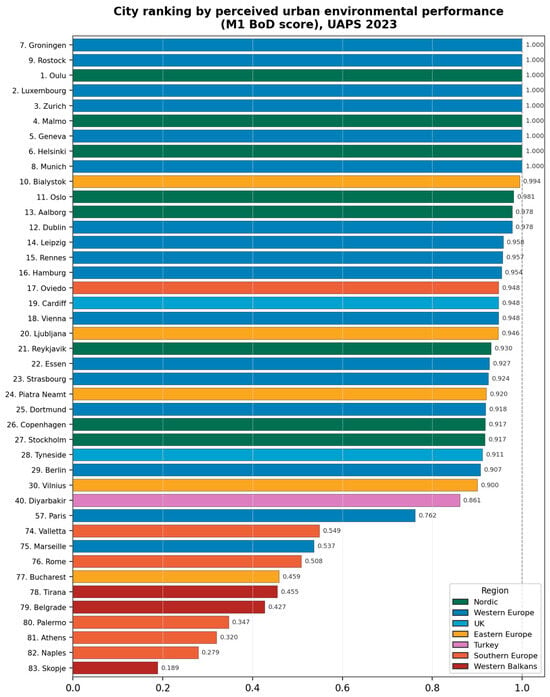
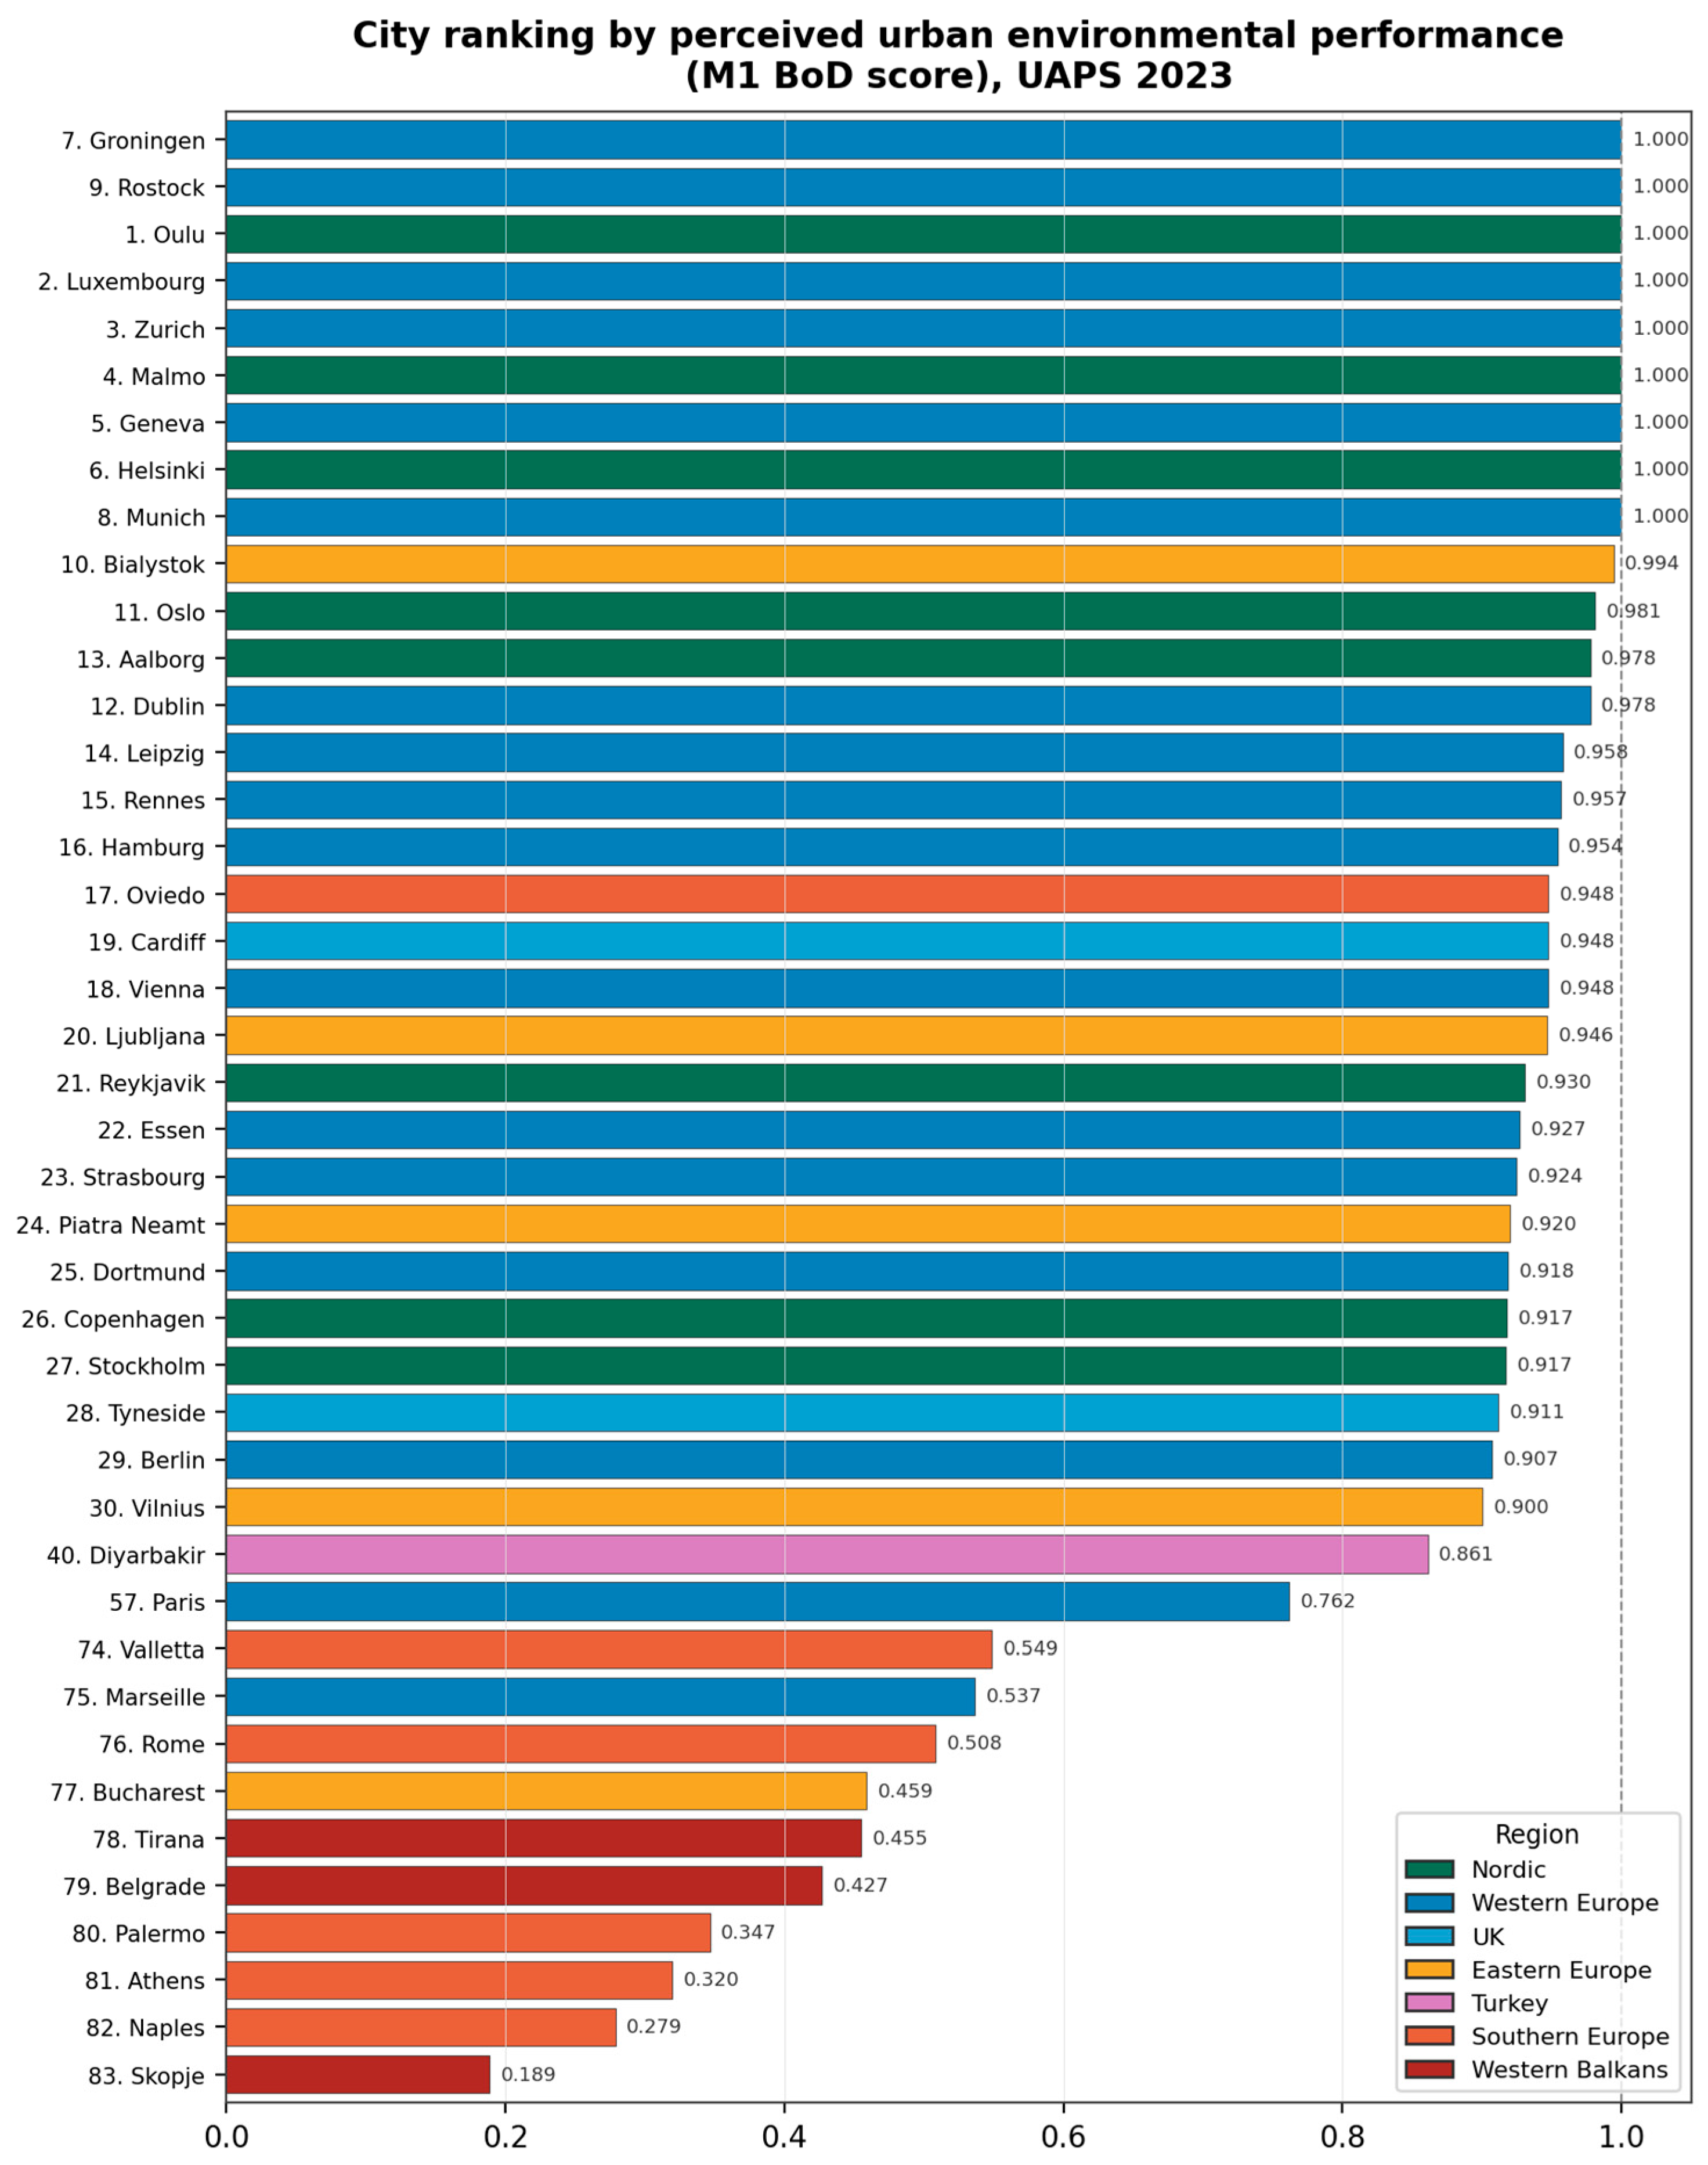
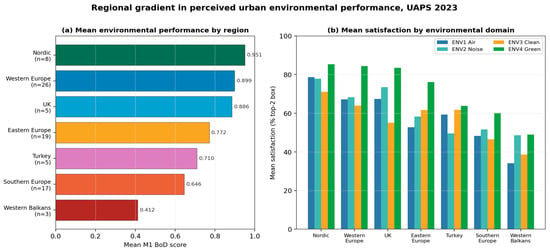
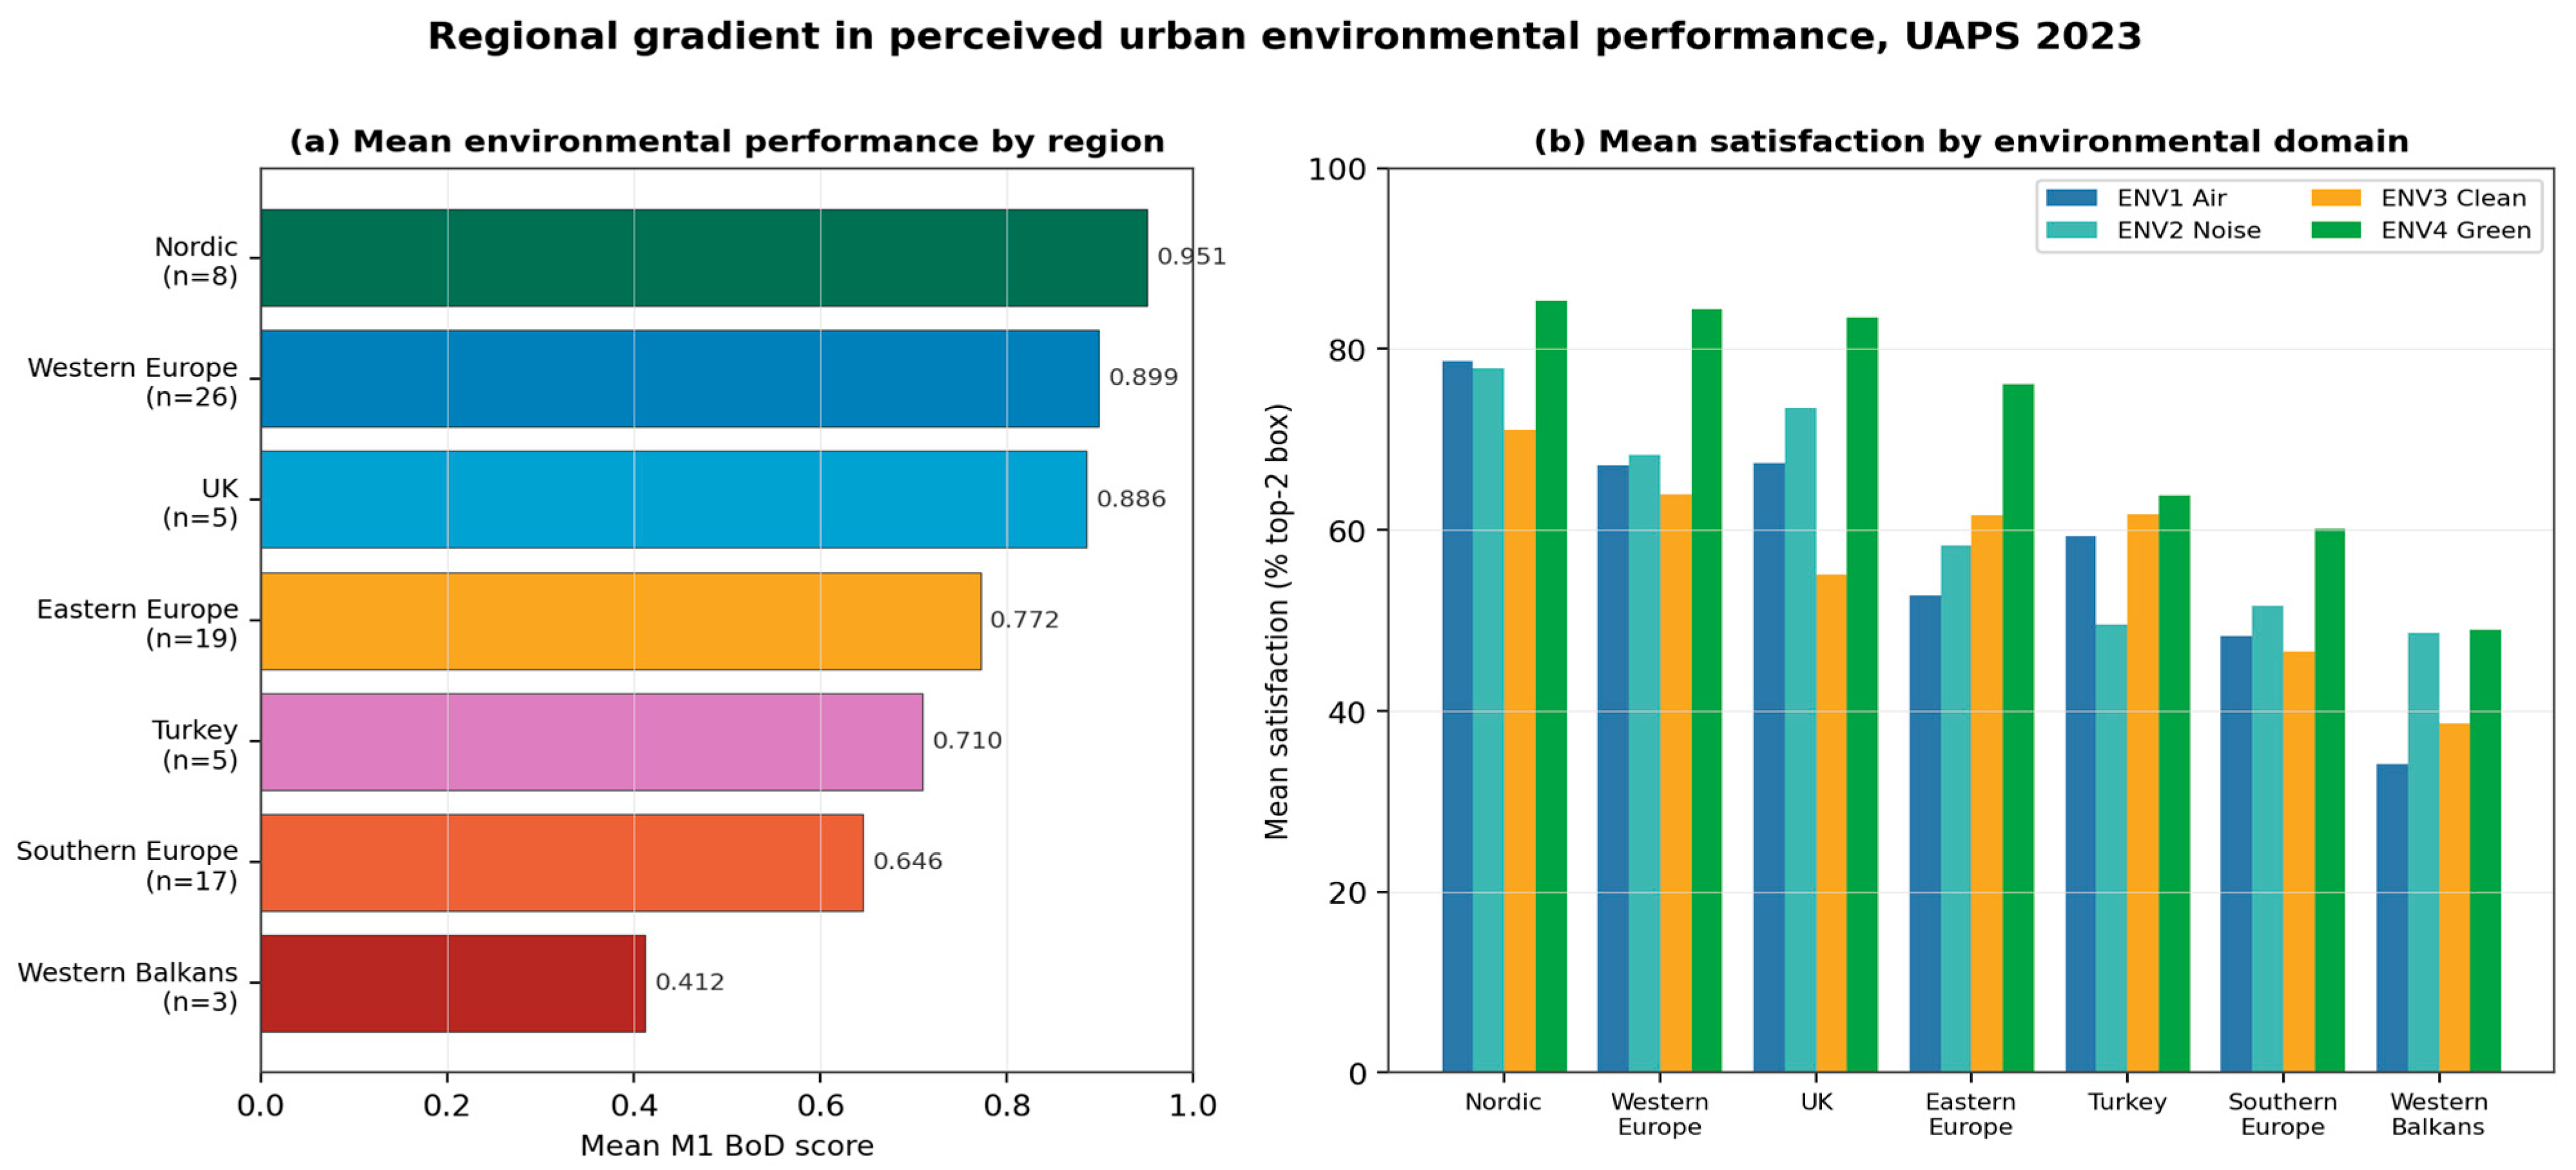
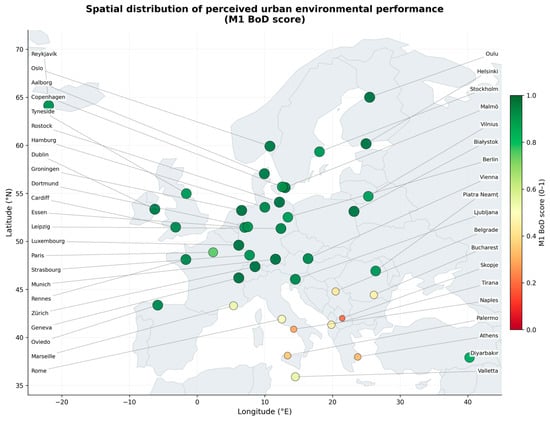
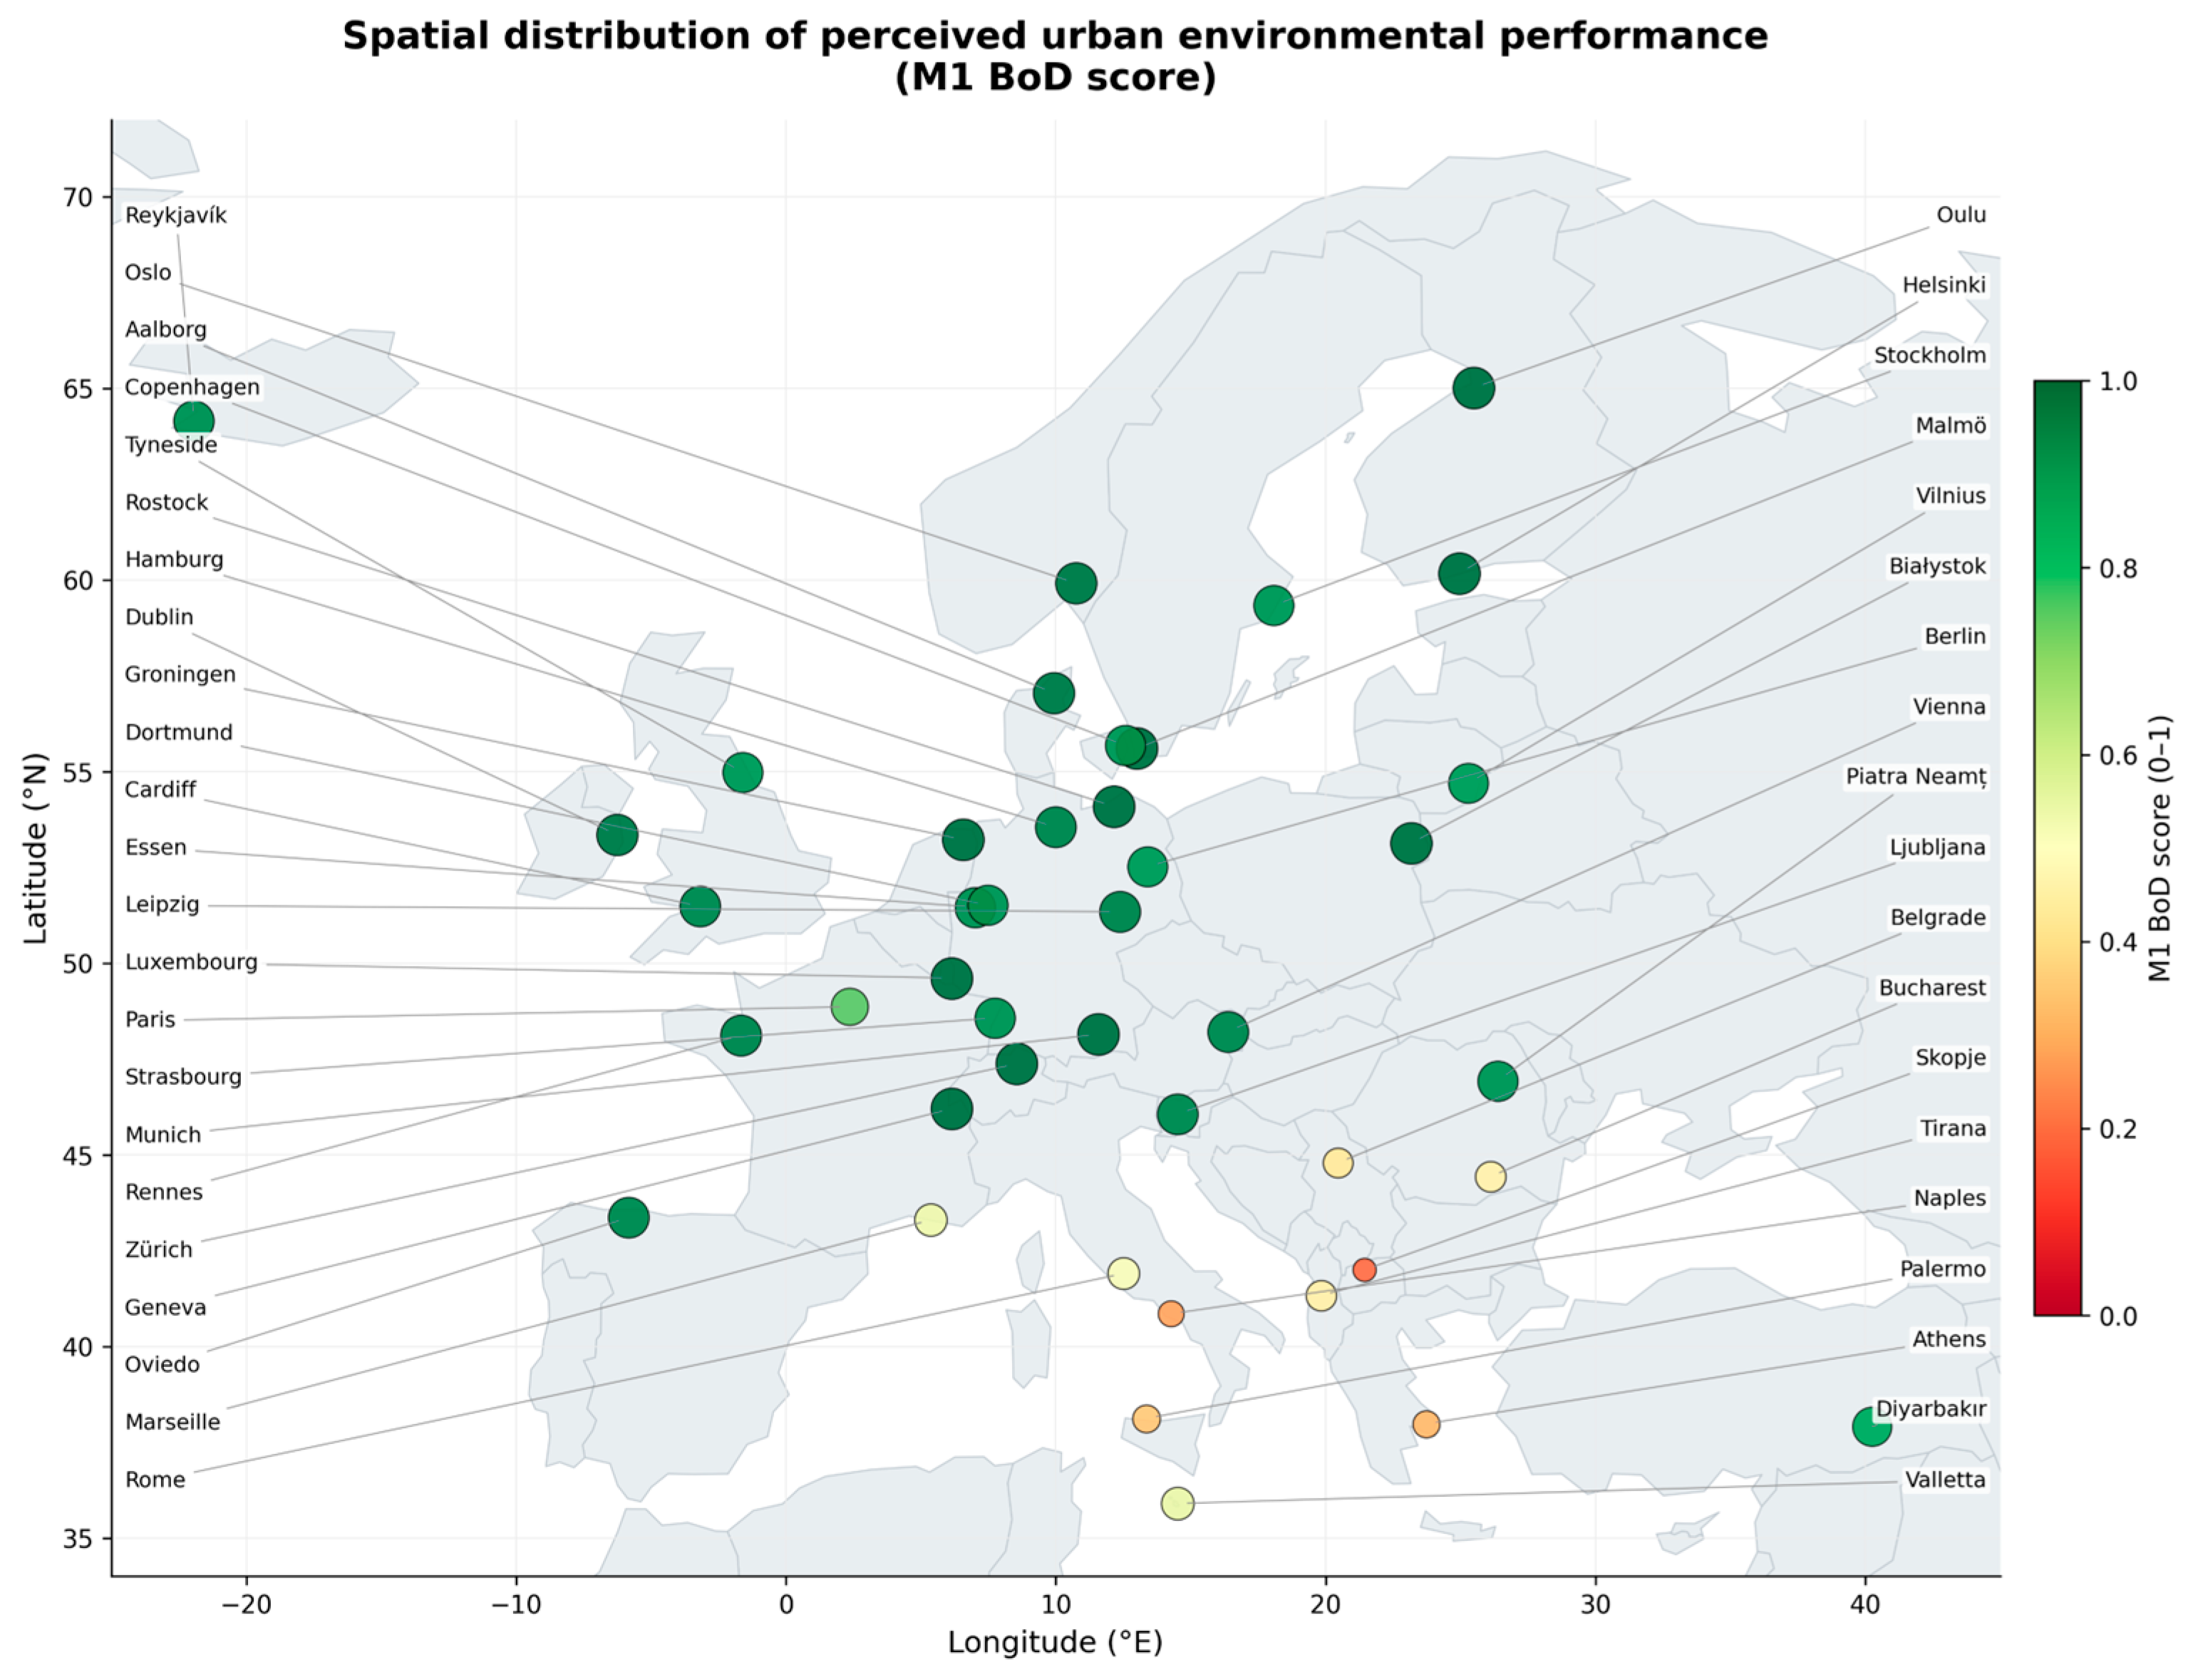

Disclaimer/Publisher’s Note: The statements, opinions and data contained in all publications are solely those of the individual author(s) and contributor(s) and not of MDPI and/or the editor(s). MDPI and/or the editor(s) disclaim responsibility for any injury to people or property resulting from any ideas, methods, instructions or products referred to in the content. |
© 2026 by the authors. Licensee MDPI, Basel, Switzerland. This article is an open access article distributed under the terms and conditions of the Creative Commons Attribution (CC BY) license.