


Abstract
Winter road snow significantly alters surface friction conditions and traffic capacity, serving as a critical factor contributing to traffic accidents, congestion, and temporary traffic control measures. Compared with sparsely deployed road sensors and labor-intensive field inspections, traffic surveillance cameras offer advantages such as dense spatial coverage, low deployment cost, and continuous observation capability, providing a feasible solution for segment-level winter road condition monitoring. To meet traffic management needs, this study categorizes the impact of road snow on passability into four classes: Clear, Light, Medium, and Heavy. A road snow coverage dataset containing 10,498 images under complex traffic scenarios was constructed and has been publicly released. Furthermore, nine representative deep learning models were systematically evaluated to compare their recognition performance and applicability for this task. Experimental results show that all models achieved over 89% classification accuracy on the test set. To further examine cross-regional generalization capability, 48 surveillance cameras from Canada and Norway were selected for real-world validation. Among all models, Swin Transformer achieved the highest accuracy of 81.2% under complex lighting conditions and varying viewpoints, demonstrating superior stability and transferability. The findings provide quantitative guidance for model selection and engineering deployment of camera-based winter road monitoring systems.
1. Introduction
Winter snowfall and road snow cover can significantly alter pavement adhesion conditions and traffic capacity, serving as critical factors that trigger traffic accidents, congestion, and temporary traffic control measures [1]. For traffic management authorities, rapid identification of road conditions must go beyond simply determining whether snow is present; it is equally important to characterize the degree of impact that snow exerts on traffic operations. Such graded assessment supports decision-making processes including tiered warnings, dynamic speed regulation, snow-removal scheduling, and, when necessary, road closure or traffic suspension.
Currently, winter road condition monitoring primarily relies on pavement sensors, meteorological station inference, and manual inspections. However, these approaches generally suffer from limited spatial coverage, high installation and maintenance costs, and strong dependence on local site conditions [2,3]. Satellite- and remote-sensing-based observations provide broader macroscopic coverage, yet their effectiveness is constrained by revisit intervals and cloud obstruction, making them insufficient for near-real-time, road-segment-scale monitoring required by traffic management [4,5,6]. Against this background, there is an urgent need to explore a monitoring paradigm for road snow impacts that offers wide coverage, controllable costs, and sustainable long-term operation.
Recent studies have proposed multiple technical approaches to road snow perception, among which two representative paradigms have emerged: vehicle-mounted vision-based methods and traffic surveillance camera-based approaches [7,8]. Vehicle-based vision systems can capture high-resolution, fine-grained pavement information from the driver’s perspective [9,10], providing direct relevance to individual vehicle safety. However, their spatial coverage is inherently constrained by vehicle trajectories and traffic flow distribution, resulting in limited continuity and regional consistency, which makes it challenging to support large-scale, all-weather road condition monitoring. In contrast, traffic surveillance cameras leverage existing urban road infrastructure and offer distinct advantages, including wide spatial coverage, dense deployment, relatively low operational cost, and the capability for long-term continuous observation [11,12,13,14,15]. Moreover, such systems can be naturally integrated into traffic management and emergency response frameworks. As a result, traffic surveillance cameras have increasingly attracted attention as a promising sensing platform for both research and practical applications in road snow cover monitoring.
Road snow detection based on traffic surveillance cameras can be traced back to exploratory studies in the late twentieth century [16,17]. Early efforts primarily focused on coarse-grained road condition categorization, such as distinguishing rainy, snowy, or dry surfaces [18,19], and predominantly relied on traditional computer vision and pattern recognition techniques. With the rapid advancement of deep learning, this line of research has progressively shifted toward data-driven models, particularly convolutional neural networks, which markedly improve robustness under challenging illumination, background clutter, and occlusions [20,21], and enable finer-grained road condition classification [22]. Meanwhile, emerging imaging sensors and multimodal observation schemes have been increasingly incorporated, including near-infrared imagery [23], thermal imaging [24], and visible–near-infrared fusion [25], providing enhanced sensing capability for low-light and complex environments. In addition, some studies have integrated external information (e.g., meteorological variables) into visual recognition frameworks to improve applicability and decision-making value in real-world traffic management scenarios [26,27,28]. Table 1 provides a comparative overview of datasets used in previous studies, including dataset size, sensing platform, road type, number of classes, availability, and the deep learning methods applied.
Table 1.
Comparison of datasets in different studies.
As shown in Table 1, several recent studies have not publicly released their datasets, which limits reproducibility and restricts further comparative research. Among the studies that do provide publicly available datasets, some remain relatively limited in scale. For example, the dataset used by Qian et al. [32] contains only 100 images. The dataset introduced by Cordes and Broszio [9] was collected using FLIR Blackfly cameras rather than conventional traffic surveillance cameras, which reduces its representativeness for real-world traffic monitoring scenarios. In contrast, Karaa et al. [38] released a large-scale dataset containing 249,000 images that is the closest to our study; however, it primarily focuses on urban scenes and therefore lacks broader scene diversity.
Although deep learning methods for road snow perception have rapidly proliferated in recent years, existing studies often rely on self-constructed datasets and customized training protocols [30,34]. Consequently, reported performance is highly sensitive to the underlying data distribution and scene composition, making it difficult to conduct fair cross-study comparisons or reproduce results under a unified setting. More critically, there is still no consensus on label definitions and categorization criteria for road snow conditions. For example, Kawai et al. adopt a classification scheme based on road appearance (e.g., Dry/Wet/Snow) [33], whereas Ishizuki et al. group surface states such as icy and slushy conditions within the same taxonomy [36], which further increases evaluation inconsistency across studies. In addition, differences in research objectives also lead to variations in labeling strategies. For instance, Karaa et al. categorize road snow conditions into four classes: Clear, Light-covered, Medium-to-heavy-covered, and Plowed [38]. Such discrepancies in classification schemes hinder the establishment of unified labeling standards and complicate direct comparison of model performance across datasets. Therefore, it is necessary to establish a unified grading standard and a reproducible benchmark protocol tailored to traffic surveillance applications, so as to improve cross-scenario comparability and facilitate practical deployment and decision support for road snow monitoring. Driven by practical demands in traffic management and winter road safety assurance, this study makes three main contributions.
First, it introduces a surveillance-camera-oriented four-level taxonomy of winter road conditions and constructs a dedicated dataset containing 10,498 images, addressing the lack of standardized benchmarks for this task.
Second, it provides the first systematic and controlled comparison of nine representative deep learning architectures for road snow-cover classification under a unified evaluation framework.
Third, it validates model generalization through cross-regional experiments in Canada and Norway, demonstrating the feasibility of camera-based snow-cover monitoring under diverse real-world conditions.
2. Methodology and Dataset
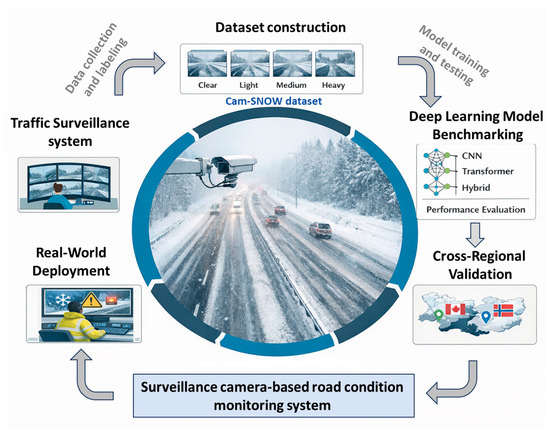
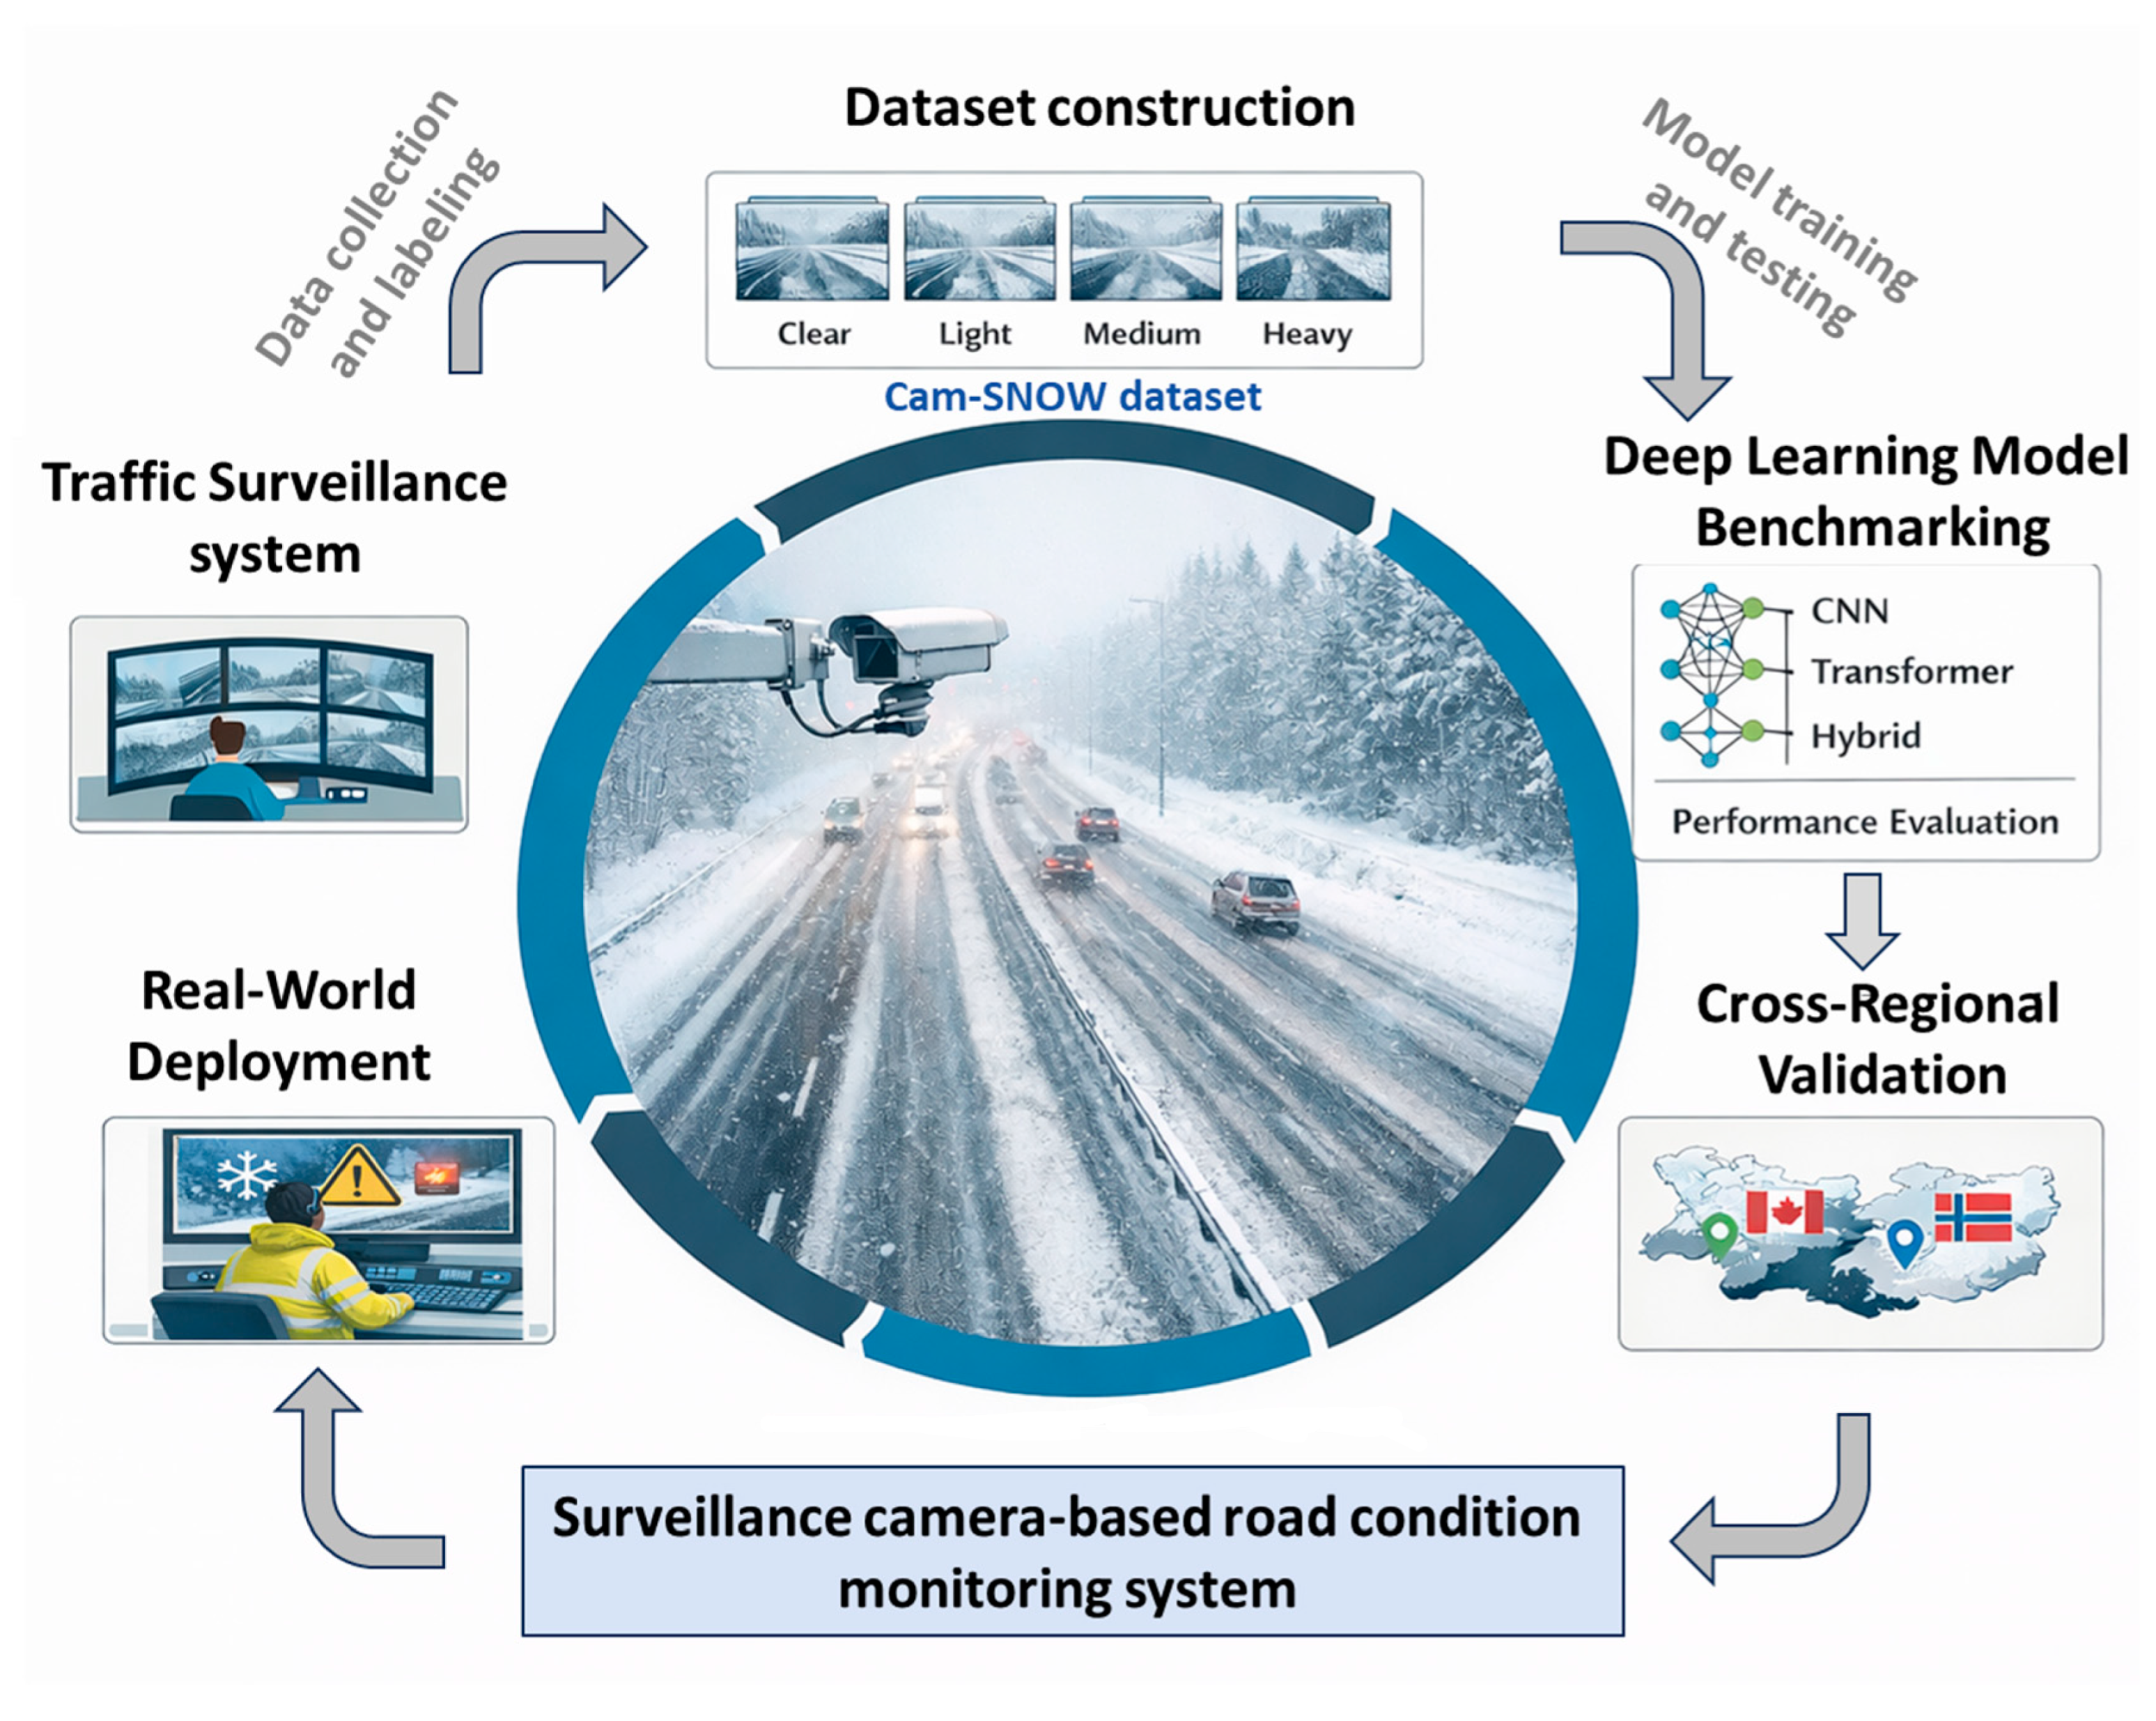
Driven by practical demands in traffic management and winter road safety assurance, this study develops a road snow-cover recognition framework that bridges visual representation and risk-based grading. First, an engineering-interpretable snow-cover classification standard is established to enable direct mapping between visual road conditions and corresponding traffic control and snow-removal responses. Second, a four-class image classification task is formulated based on traffic surveillance imagery, and multiple mainstream deep learning models are systematically evaluated under a unified data partitioning and benchmarking protocol. Finally, a cross-scene, multi-source dataset is constructed to validate model generalization under real-world traffic surveillance conditions. As shown in Figure 1, the proposed framework emphasizes a clear linkage between snow-cover grading criteria, observable visual evidence, and traffic risk response levels, thereby providing reproducible baselines and model selection references for practical deployment.
Figure 1.
The proposed surveillance-based road snow condition monitoring system. This figure was created by the authors.
2.1. Definition of Road Snow-Cover Levels
From a traffic surveillance perspective, the impact of road snow cover on traffic capacity and safety risk is not solely determined by its physical thickness, but is more prominently reflected in whether the effective drivable space is compressed and whether structural visual cues essential for driving—such as tire tracks, lane markings, and pavement textures—are obscured. Since traffic surveillance cameras are typically installed facing roadways, the road region usually dominates the scene and exhibits relatively stable geometric structures and vanishing point directions. Under such observational characteristics, changes in snow coverage can be consistently captured through variations in overall appearance and the degradation of structural road cues. Accordingly, this study conceptualizes road snow conditions as a “visual passability level” oriented toward traffic management, enabling recognition results to directly support winter road safety assurance and graded response strategies. Based on the above considerations, in this study, road snow cover conditions are classified into four categories—clear, light, medium, and heavy—based on their impacts on road surface visibility and traffic operability, and are further quantified using the Snow Coverage Ratio (SCR).
- Clear indicates that only a small amount of scattered snow is present on the road surface, typically with SCR less than 10%, and vehicles can operate normally.
- Light refers to conditions where continuous snow exists but tire tracks remain clearly visible, corresponding to an SCR of approximately 10–40%, with minimal impact on traffic flow and only moderate speed reduction required.
- Medium represents situations where a large portion of the road surface is covered by snow but tire tracks are still partially visible, with SCR ranging from approximately 40% to 80%, leading to noticeably reduced traffic capacity and the need for snow removal operations and speed control measures.
- Heavy indicates that the road surface is almost completely covered by snow, with SCR exceeding 80%, where tire tracks are difficult to distinguish and traffic safety is significantly compromised, often requiring emergency snow removal or temporary traffic control measures.
This classification scheme integrates spatial snow coverage characteristics with practical traffic conditions and provides a consistent and quantifiable basis for road snow cover recognition using surveillance imagery and related transportation meteorology applications.
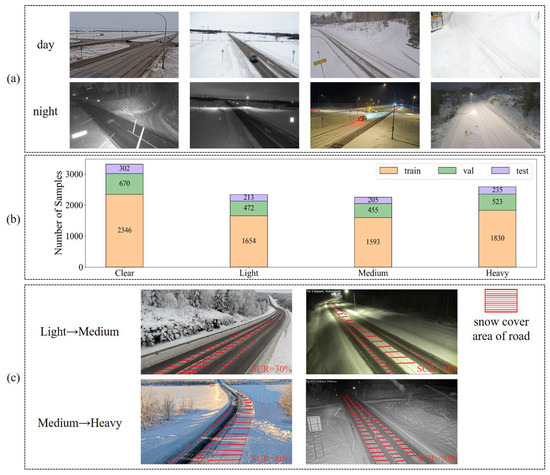
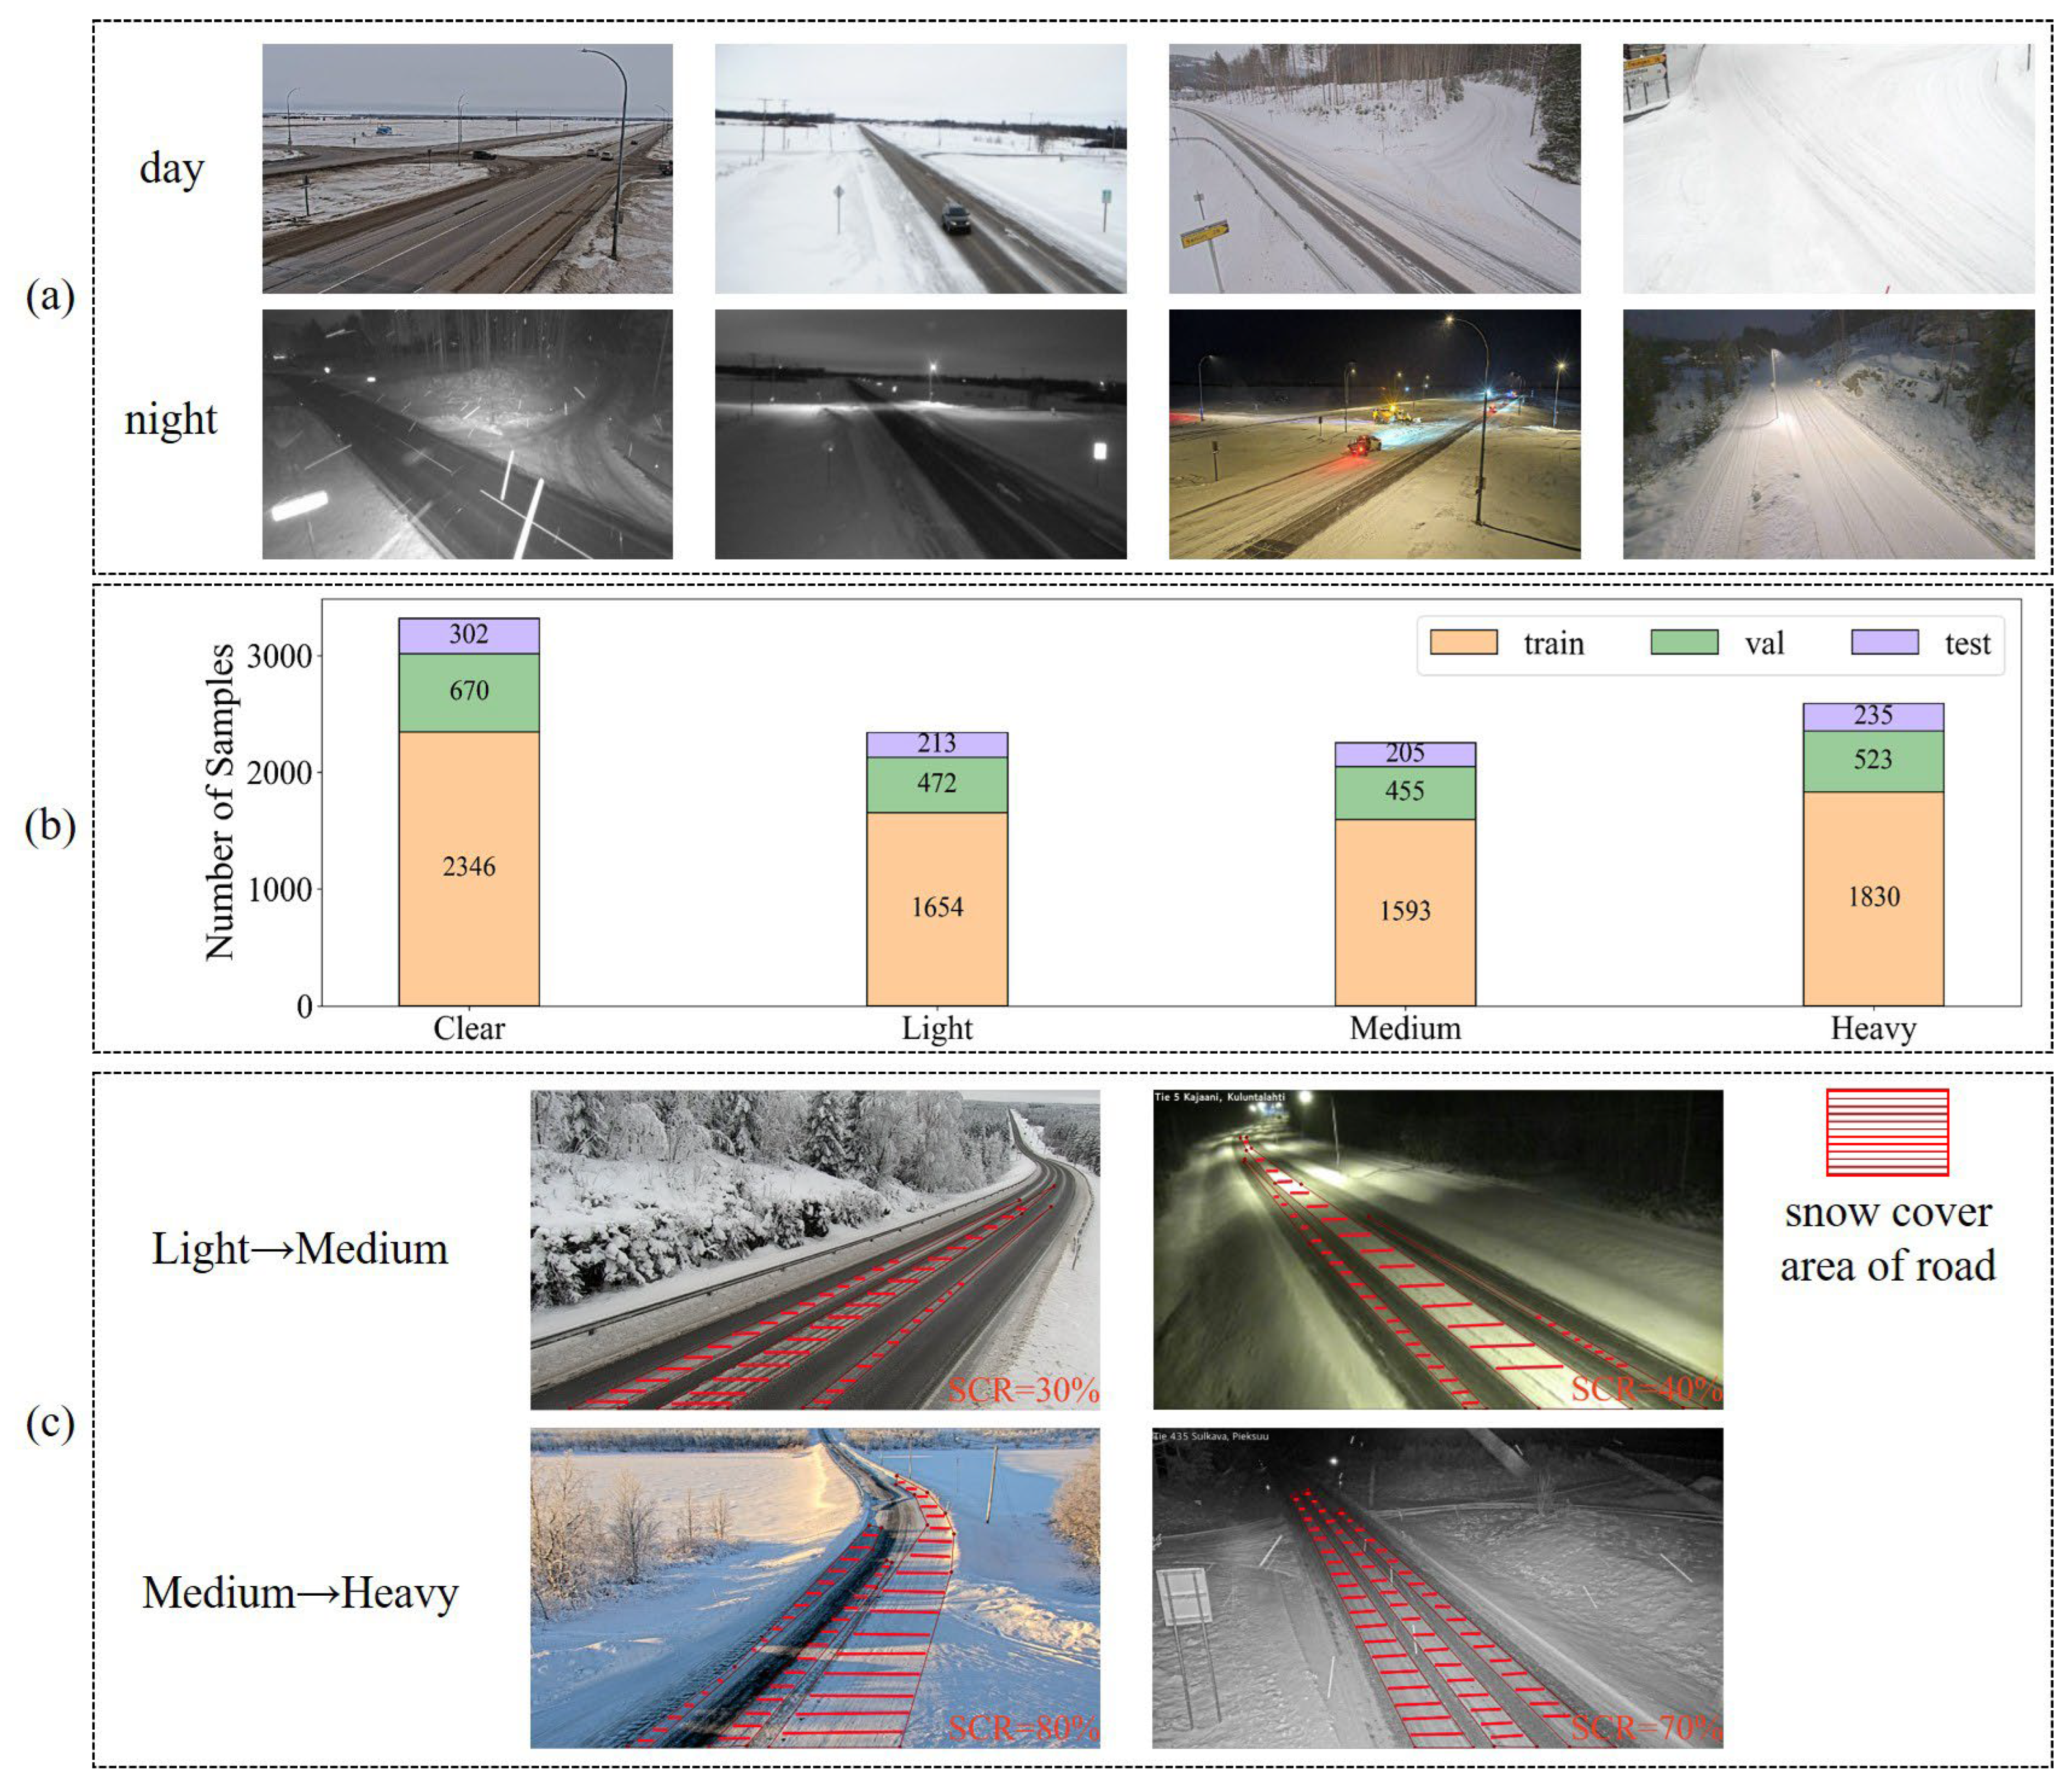
Typical examples of different snow-cover categories under both daytime and nighttime conditions are shown in Figure 2.
Figure 2.
Overview of the Cam-SNOW dataset. (a) Example images of the four road snow-cover categories under both daytime and nighttime conditions. (b) The number of samples in the training, validation, and test sets for each category in the Cam-SNOW dataset. (c) Example images illustrating boundary cases between the Light and Medium categories, as well as between the Medium and Heavy categories under both daytime and nighttime conditions, with corresponding SCR values provided. The road snow images were obtained from Windy (https://www.windy.com/, accessed on 19 April 2026).
Compared with prior work that delineates snow-covered areas via semantic segmentation [39,40], this study formulates road snow conditions as an image-level four-class classification problem. This choice is motivated by the operational needs of traffic surveillance, where the primary objective is rapid assessment of the overall road state and corresponding graded interventions rather than pixel-accurate boundary extraction. Because the roadway typically dominates the camera field of view and exhibits relatively stable geometry, whole-image classification can reliably leverage both global scene context and salient local cues—such as tire tracks, lane markings, and pavement texture—to infer snow-cover levels. This formulation also supports scalable dataset expansion and consistent benchmarking across heterogeneous cameras and regions, while producing outputs that naturally align with traffic management response intensity. In addition, the resulting inference pipeline is simpler and more efficient, better meeting the engineering constraints of real-time monitoring and large-scale deployment. Overall, the proposed grading strategy directly links observable surveillance evidence to actionable traffic responses, enhancing both engineering interpretability and practical utility.
2.2. Deep Learning Baselines for Snow-Cover Classification
Based on the road snow-cover grading criteria defined in Section 2.1, the task is formulated as a four-class image classification problem. Considering the practical constraints of traffic surveillance scenarios—including day–night illumination variations, differences in camera viewpoints and imaging scales, background disturbances (e.g., vehicle occlusions, roadside facilities, and shadow/reflection effects), as well as cross-regional distribution shifts—this study introduces multiple representative visual models for systematic comparative evaluation. The objective is to assess the stability and generalization capability of different network architectures for road snow-cover level recognition.
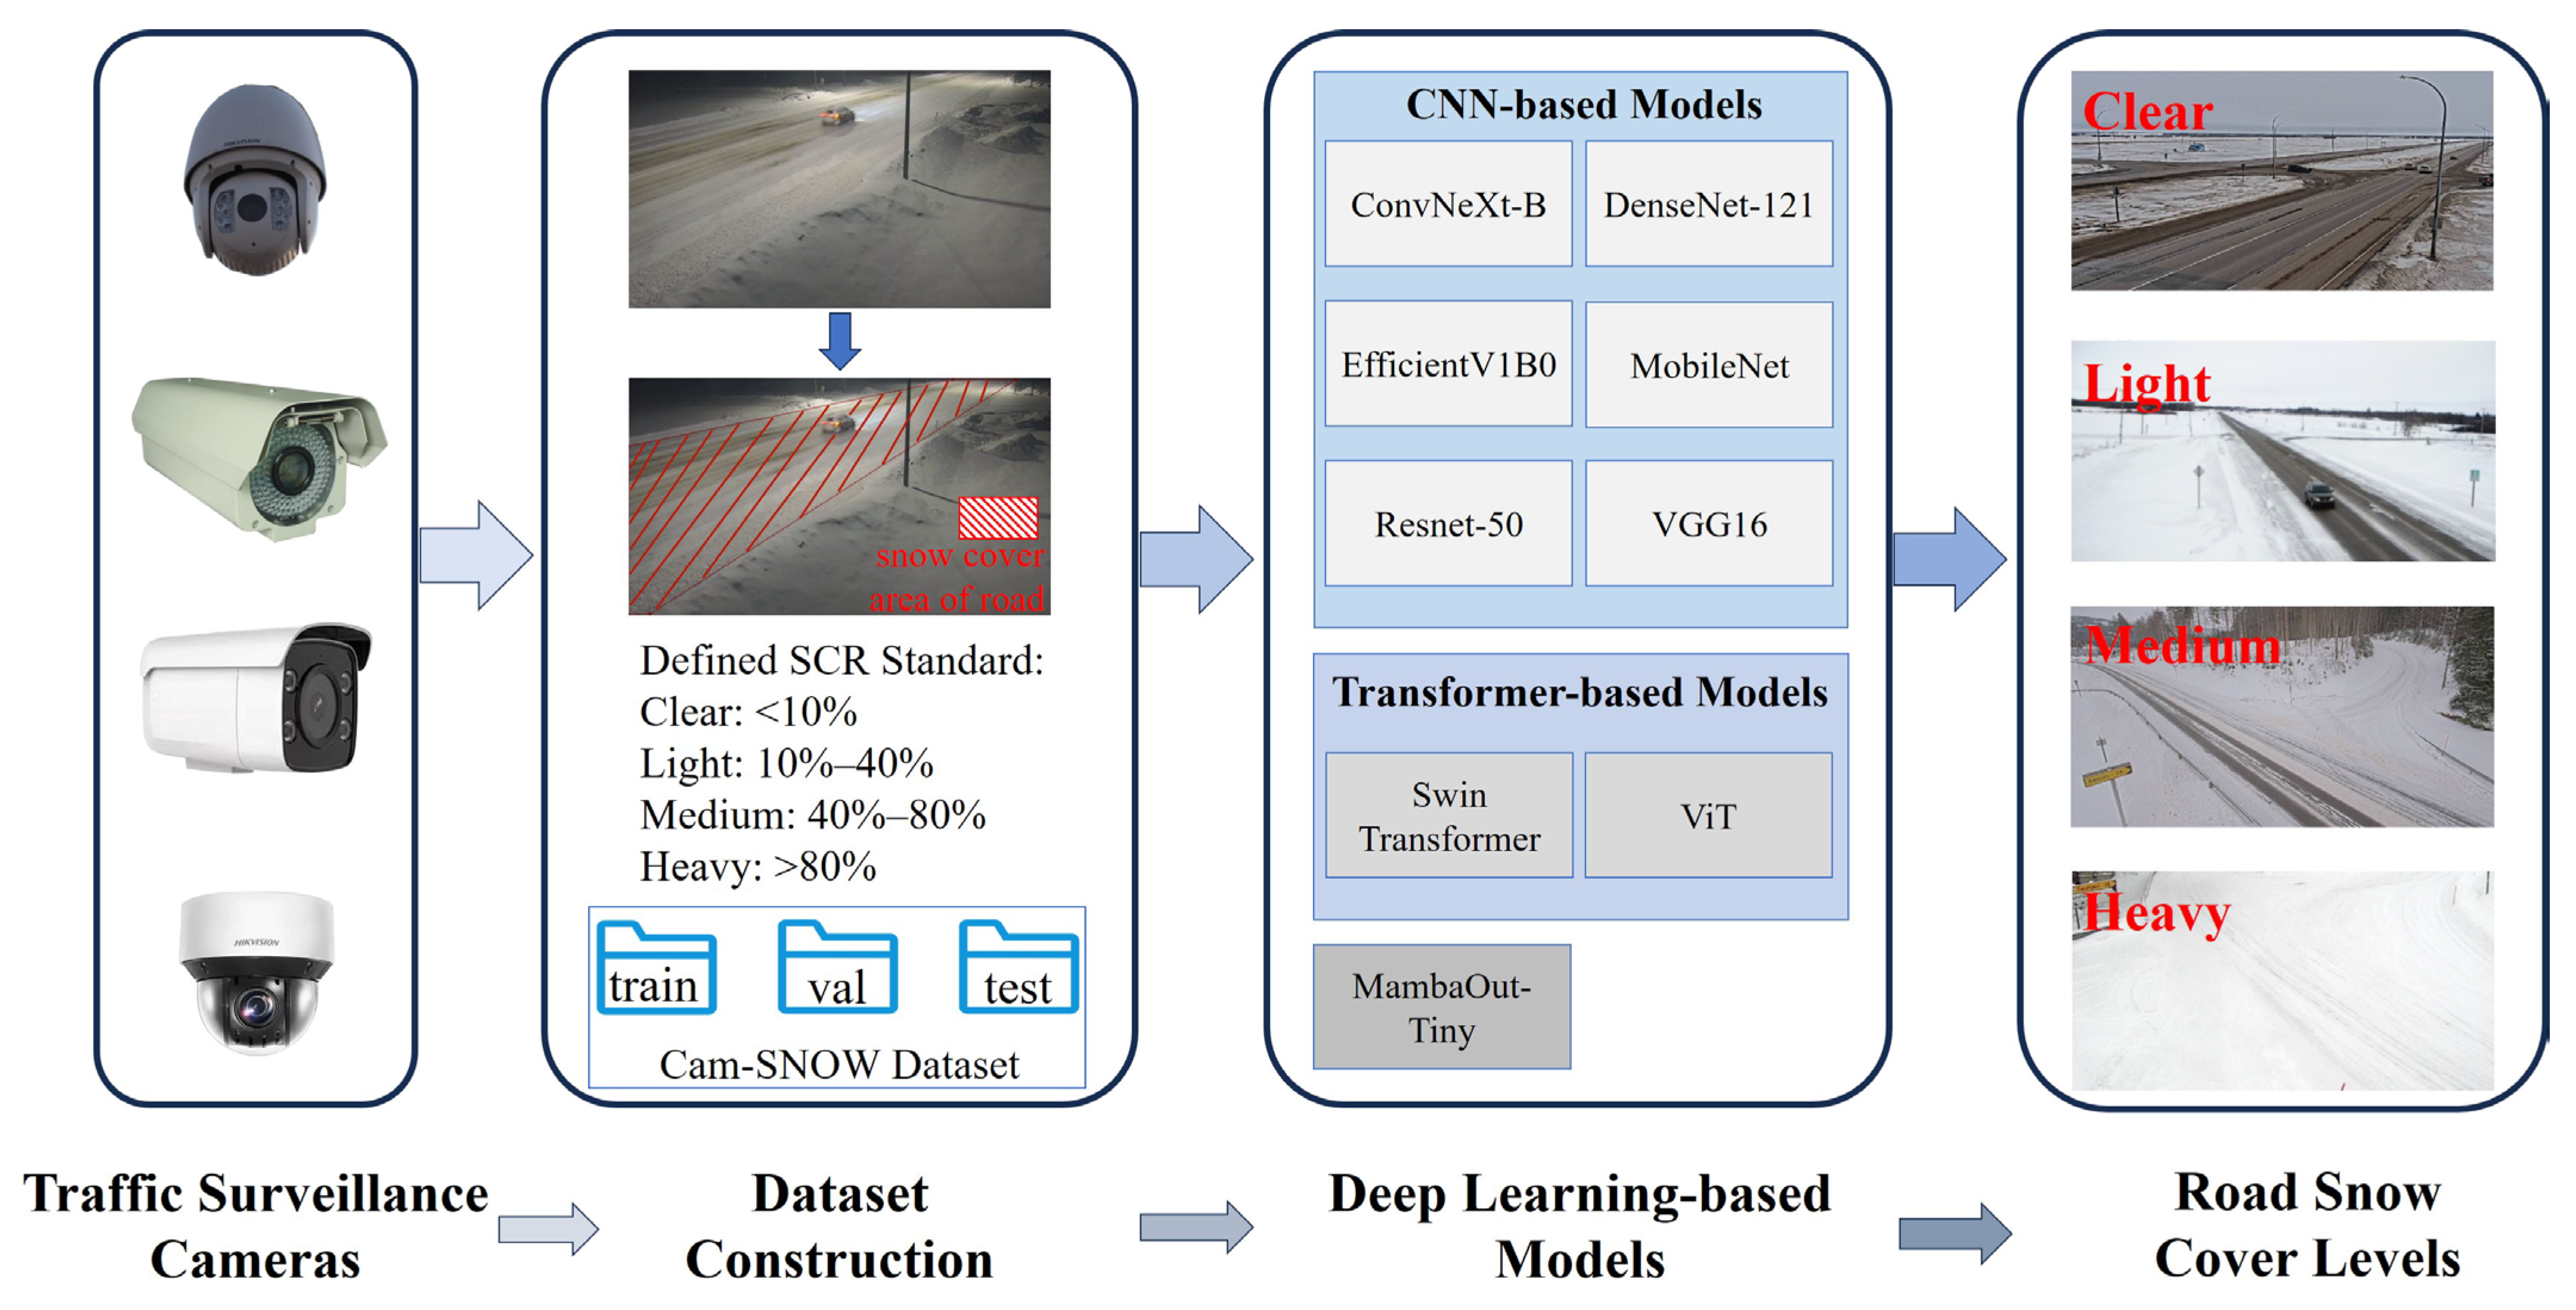
Specifically, nine representative deep learning models are selected, covering classical convolutional neural networks (CNNs), lightweight and efficient architectures, modern convolutional designs, Transformer-based models, and state space models. Among classical CNNs, VGG16 [41], ResNet-50 [42], and DenseNet-121 [43] represent stacked deep convolutional structures, residual learning, and densely connected paradigms, respectively, and serve as reliable baseline models. In terms of lightweight and efficient networks, MobileNet [44] employs depthwise separable convolutions to reduce computational cost, while EfficientNetV1-B0 [45] adopts a compound scaling strategy to balance model size and accuracy, making them suitable for resource-constrained or real-time deployment scenarios. For modern convolutional architectures, ConvNeXt-B [46] retains the inductive bias of convolutions while incorporating design principles inspired by Transformers, resulting in enhanced representation capability. Among attention-based models, Vision Transformer (ViT) [47] captures long-range dependencies through global self-attention, whereas Swin Transformer [48] leverages hierarchical window-based attention to balance multi-scale modeling and computational efficiency, making them well-suited for tasks involving both local texture variations and global structural changes in road snow conditions. Additionally, MambaOut-Tiny [49] is introduced as a representative architecture based on state space modeling to explore its applicability and potential advantages in complex traffic surveillance environments.
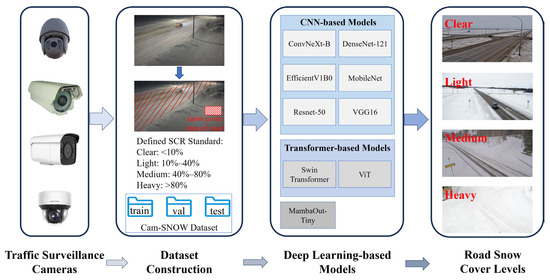
The flow chart of the research is shown in Figure 3.
Figure 3.
Flow chart of the research. The road snow images were obtained from Windy (https://www.windy.com/, accessed on 19 April 2026).
2.3. Surveillance Camera-Based Snow Cover Dataset Building
This study builds upon the publicly available ViSnow [38], from which samples consistent with the traffic surveillance perspective, roadway scene characteristics, and the four-level snow-cover classification criteria defined in this study were carefully selected rather than fully adopted. In addition, supplementary images were collected from multiple publicly accessible traffic surveillance platforms, including Windy (https://www.windy.com/, accessed on 19 April 2026), Fintraffic (https://www.fintraffic.fi/fi, accessed on 19 April 2026), DriveBC (https://www.drivebc.ca/cameras, accessed on 19 April 2026), and Tirol (https://www.tirol.gv.at/, accessed on 19 April 2026), among others. Based on this curated and expanded data source, a winter road snow-cover image dataset tailored to traffic surveillance scenarios, named Cam-SNOW, was constructed. Both the selection from ViSnow and the additional data collection followed consistent criteria: the roadway must be clearly visible, the snow-cover level must be distinguishable, and the image quality must meet recognition requirements. The dataset covers typical traffic environments, including urban roads, highways, and bridges, and intentionally incorporates realistic surveillance factors such as daytime and nighttime variations, illumination reflections, streetlight interference, vehicle occlusions, and compression artifacts, thereby enhancing representativeness and complexity under real-world deployment conditions.
The Cam-SNOW dataset contains a total of 10,498 images, including 3318 Clear samples, 2339 Light samples, 2253 Medium samples, and 2588 Heavy samples. The class distribution is relatively balanced, facilitating stable training and generalization across different snow-cover levels. The dataset includes data collected from multiple countries, such as Austria, Germany, and the Netherlands in Europe, as well as the United States and China, thereby ensuring broad geographic diversity, and excluding the regions used in the real-world validation set, where the use of distinct geographic areas effectively prevents potential data leakage. All data were collected during the winter season under various weather conditions, including sunny, cloudy, and snowy scenarios. In terms of road types, the dataset contains a wide variety, including urban roads, rural roads, and highways, thereby enhancing its diversity and practical relevance. For reproducibility and fair evaluation, the dataset is divided into training, validation, and test sets at a ratio of 7:2:1, while maintaining consistent class proportions across subsets to minimize bias caused by distribution imbalance. Representative examples of different snow-cover levels under both daytime and nighttime conditions are shown in Figure 2.
The Cam-SNOW dataset can be download from: https://pan.baidu.com/s/1LcdvpddsYTOTUwKik1pXpg?pwd=w912 (accessed on 19 April 2026).
In the real-world validation, a total of 48 cameras were used. For each camera, 3–10 images were selected, resulting in a test set comprising 330 images in total. The dataset includes both daytime and nighttime conditions, as well as diverse weather scenarios, including sunny, cloudy, and snowy conditions. In addition, all four snow-cover categories are represented in the dataset. Since ground snow coverage typically changes gradually, images were manually selected to ensure that all four categories were adequately represented, thereby enabling a more comprehensive evaluation of model performance. As shown in Figure 2c, the distinction between certain boundary cases remains challenging. To address this issue, the labels were assigned through manual annotation by nine trained annotators. The inter-annotator agreement was assessed using Cohen’s Kappa coefficient [50], with a value of 0.9 for the self-constructed Cam-SNOW dataset and 0.85 for the real-world validation, indicating a high level of consistency of the road snow coverage labels.
3. Experimental Results and Analysis
3.1. Training Details of the Models
The hardware and software configuration for model training is summarized in Table 2. All models were trained using an input resolution of 224 × 224 and an initial learning rate of 1 × 10⁻⁴. Training was conducted for up to 100 epochs, with early stopping enabled (patience = 10) to reduce overfitting. Cross-entropy loss was adopted as the optimization objective for model training. All models were trained using the Adam optimizer with a fixed learning rate, and the batch size was set to 8. No data augmentation strategies were applied. All architectures were initialized with ImageNet pre-trained weights. To ensure a fair comparison, model-specific hyperparameter tuning was not performed; instead, all architectures were trained using the same optimizer, learning rate schedule, and training hyperparameters.
Table 2.
Hardware and software configuration for model training.
3.2. Evaluation Metrics
We report Overall Accuracy together with Precision, Recall, and F1-score to assess performance across categories, and present confusion matrices to analyze misclassification patterns between snow cover levels. The above four metrics are computed as follows:
where represents the actual is positive, predicted is positive. means the actual is negative, predicted is negative. represents the actual is negative, predicted is positive. means the actual is positive, predicted is negative.
To further evaluate discriminative ability and threshold sensitivity, multi-class receiver operating characteristic (ROC) curves are plotted using a one-vs-rest strategy, and the area under the ROC curve (AUC) is computed for each class [51].
3.3. Experiments on the Cam-Snow Dataset
In this section, nine representative deep learning models were systematically evaluated on the Cam-SNOW test set. Accuracy, Precision, Recall, and F1-score were selected as the primary evaluation metrics, and the detailed results are presented in Table 3.
Table 3.
Performance comparison of deep learning models on the Cam-SNOW test set.
Overall, all models achieved stable and competitive performance, with accuracy values exceeding 89%. Among them, ViT achieved the highest accuracy (93.7%), followed by Swin Transformer (93.5%) and ConvNeXt-B (92.7%). Compared with conventional convolutional neural networks (e.g., VGG16, ResNet-50, and MobileNet), these models demonstrated superior overall performance, suggesting that more expressive architectural designs contribute positively to snow severity classification in traffic monitoring scenarios.
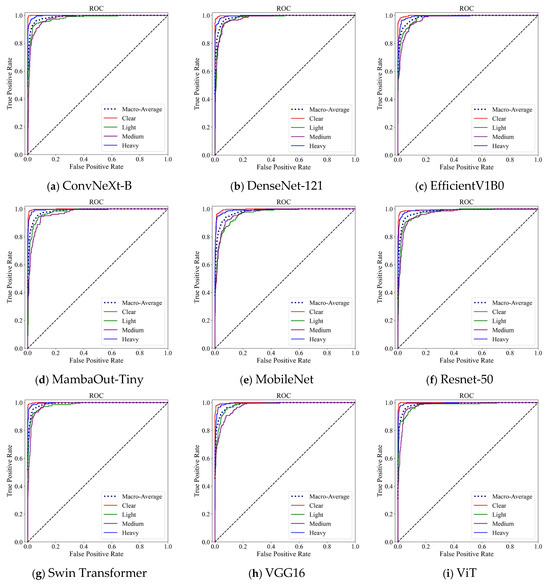
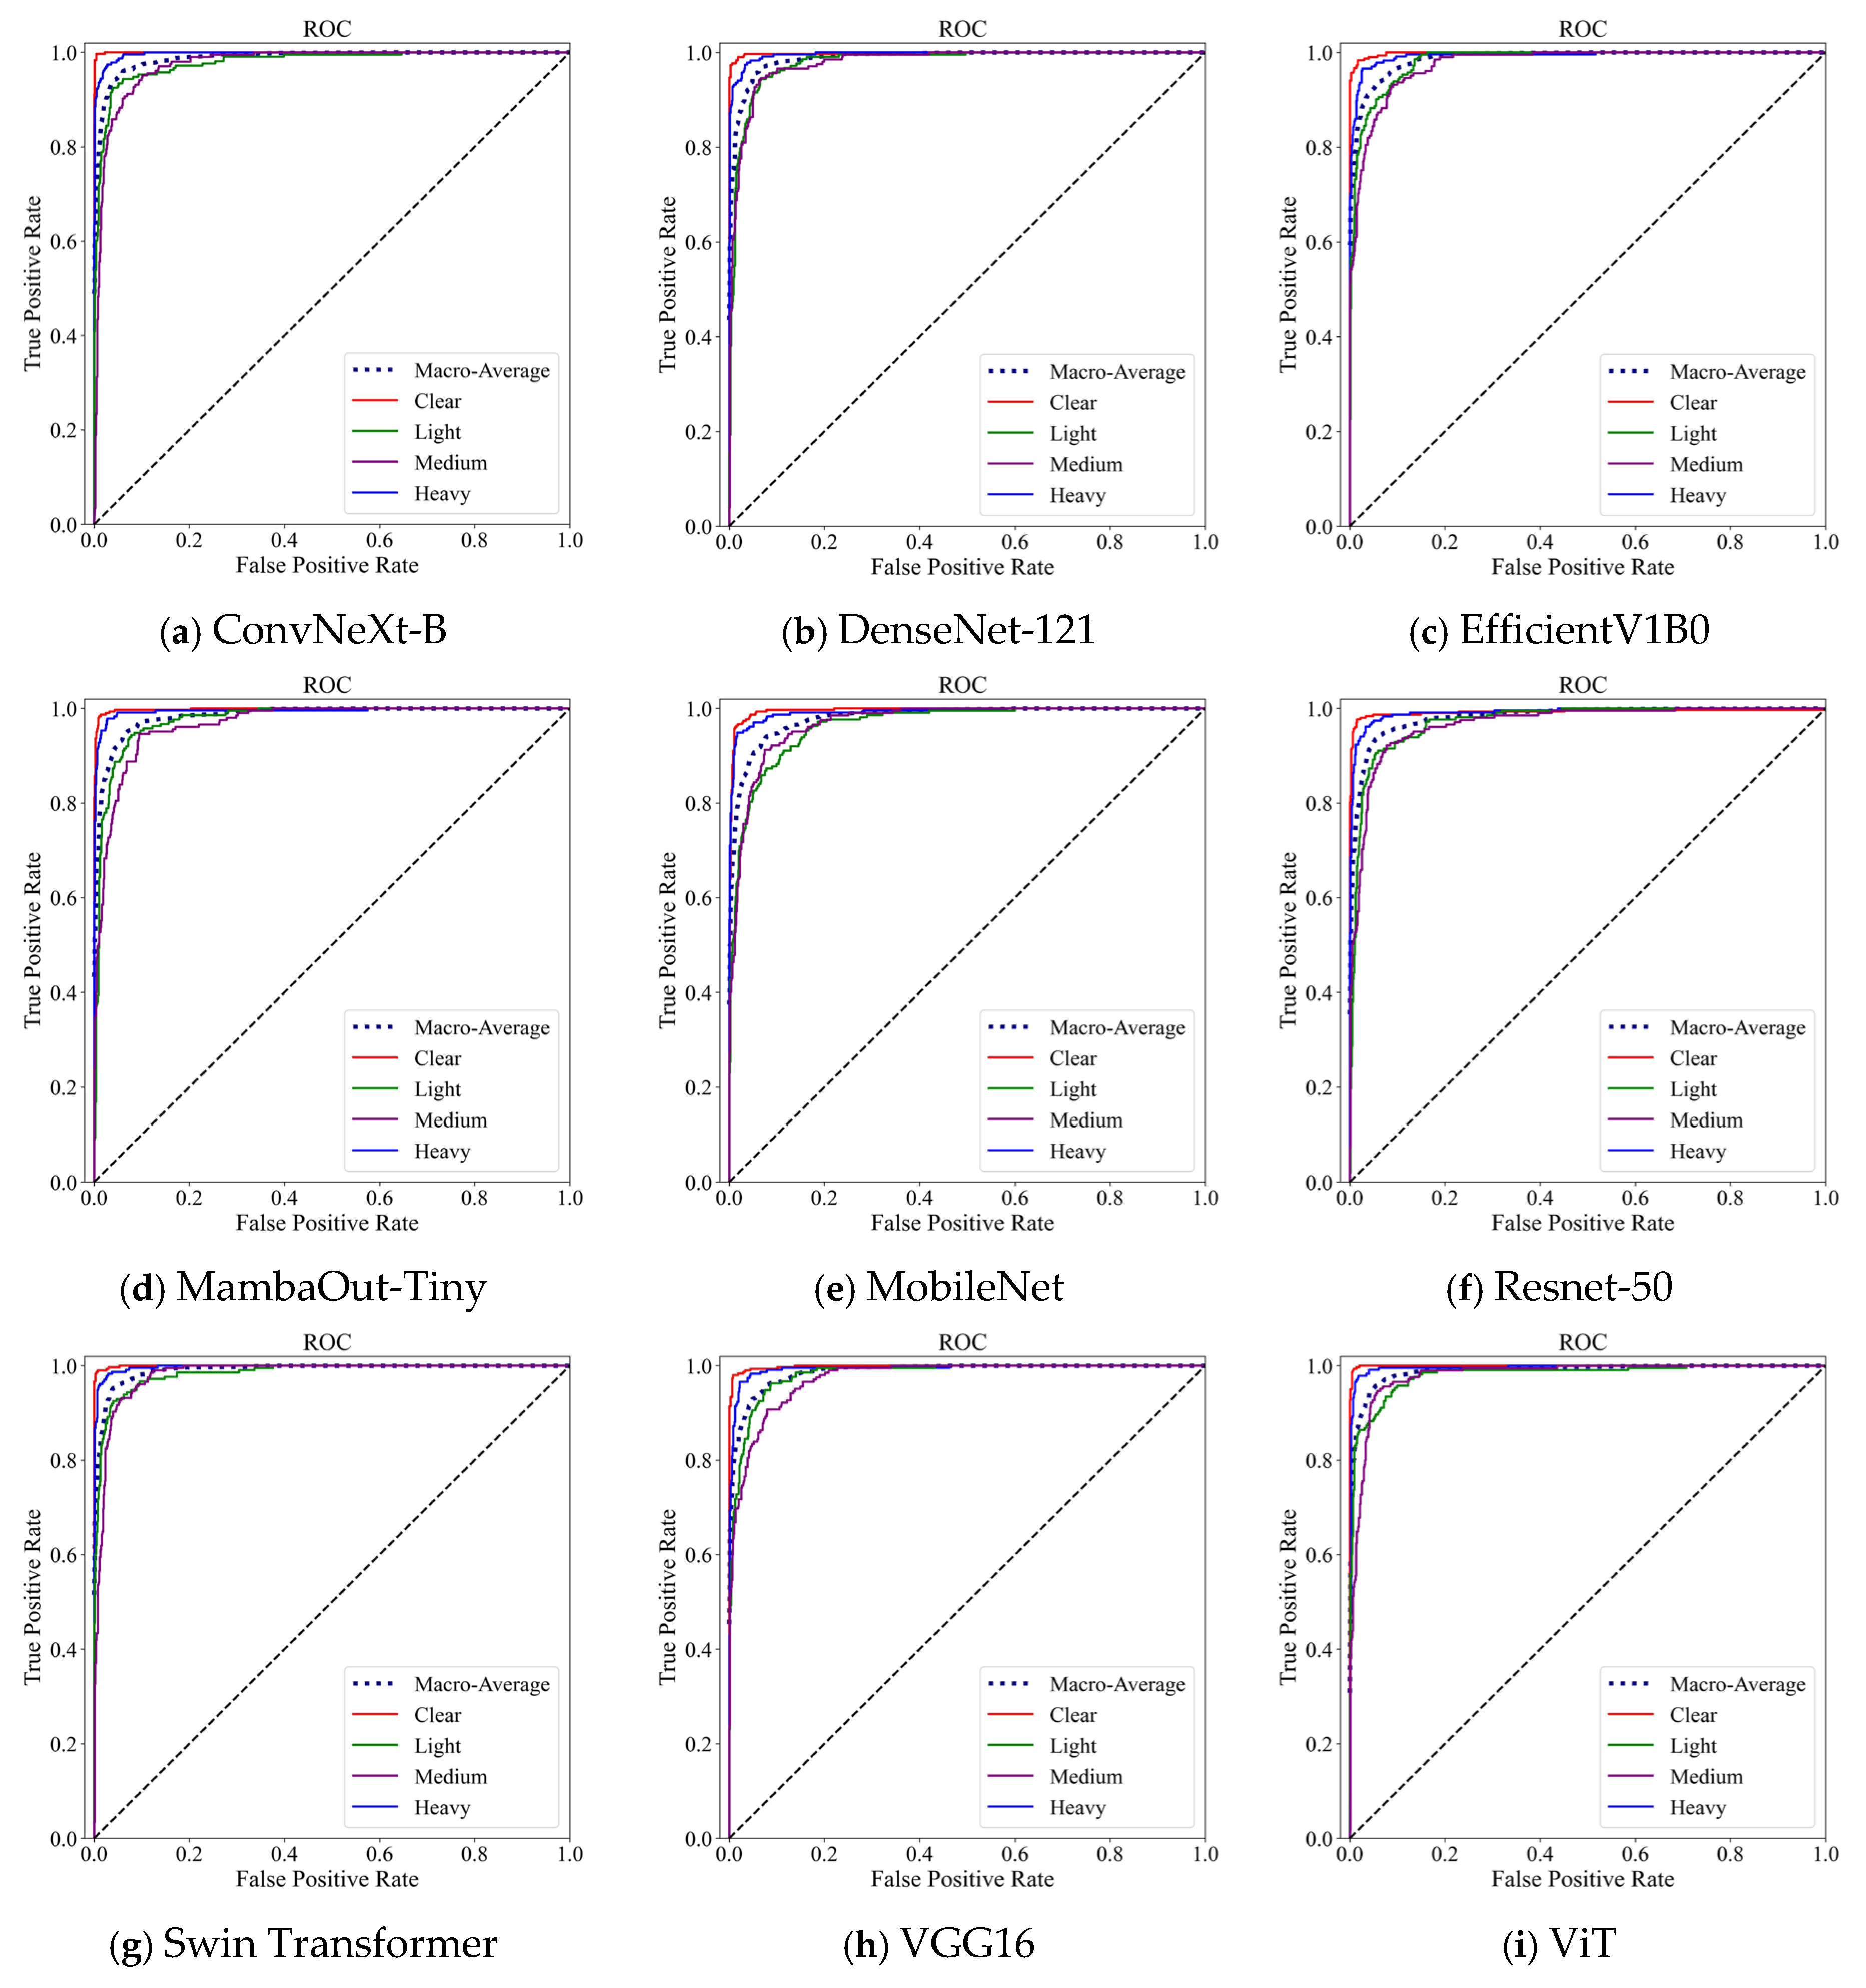
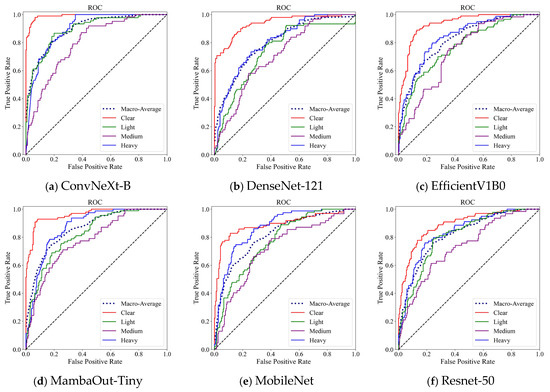
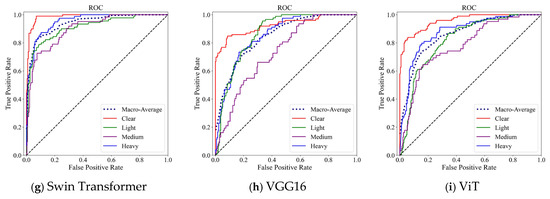
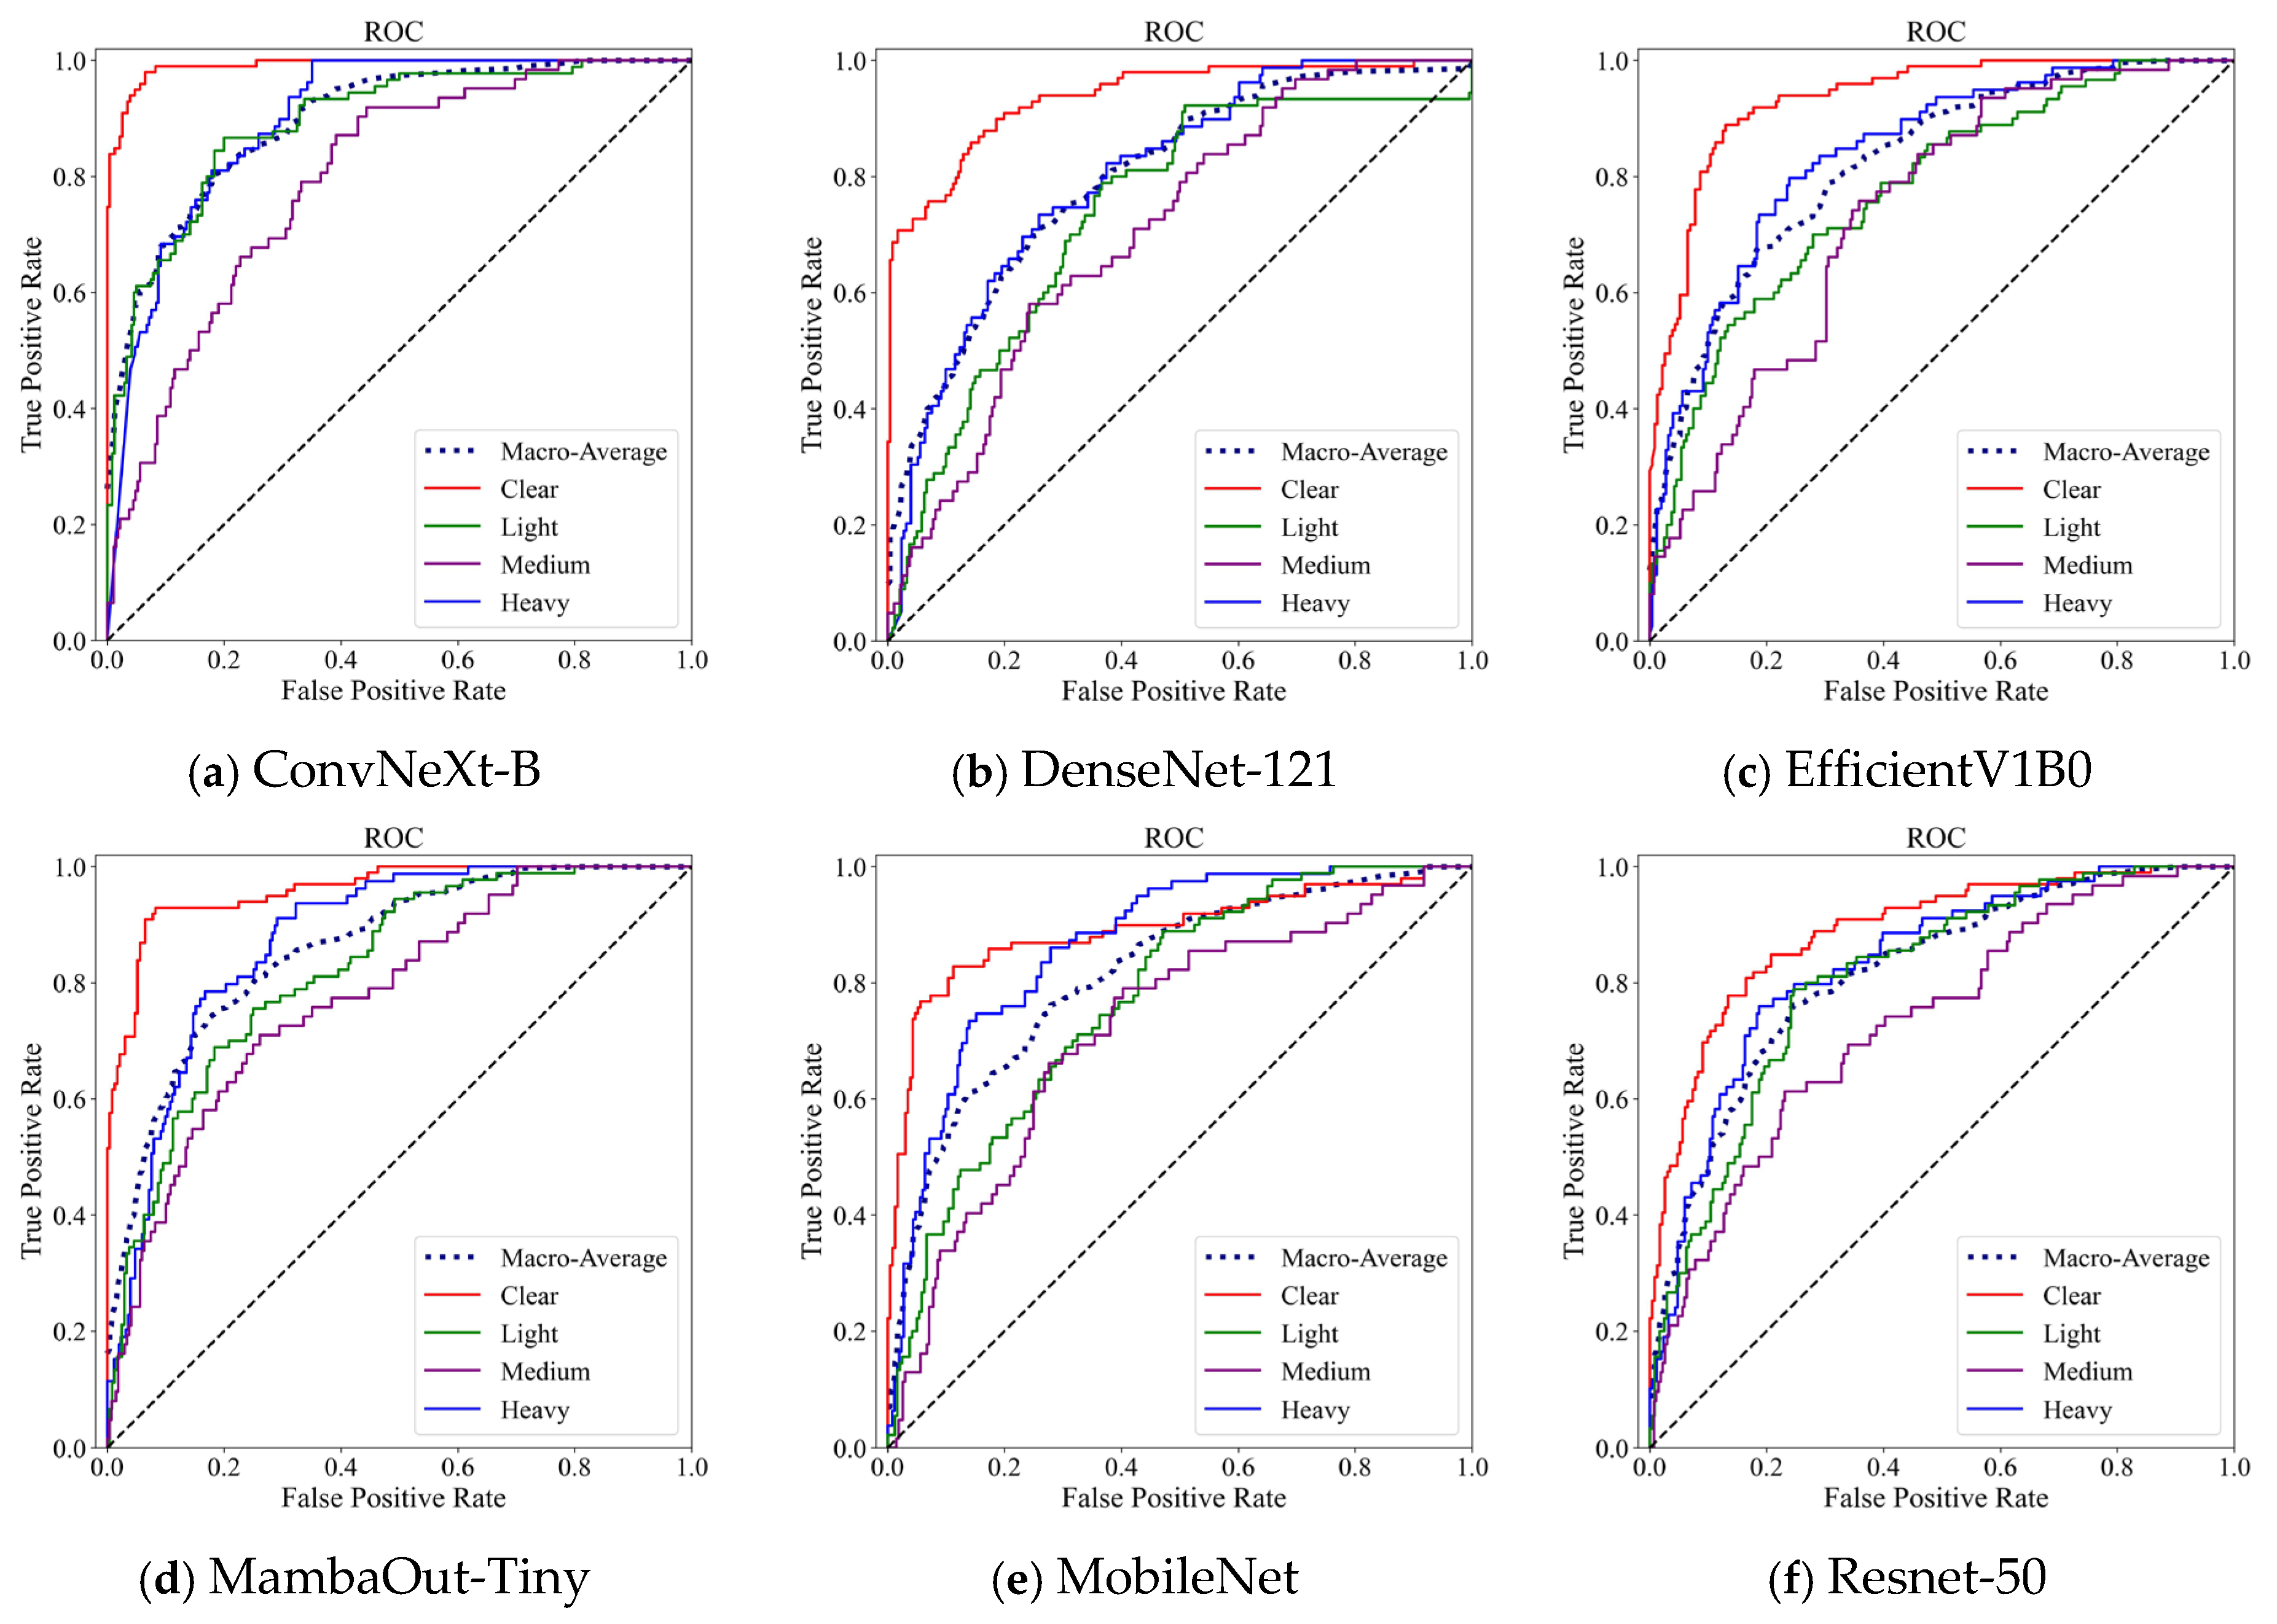
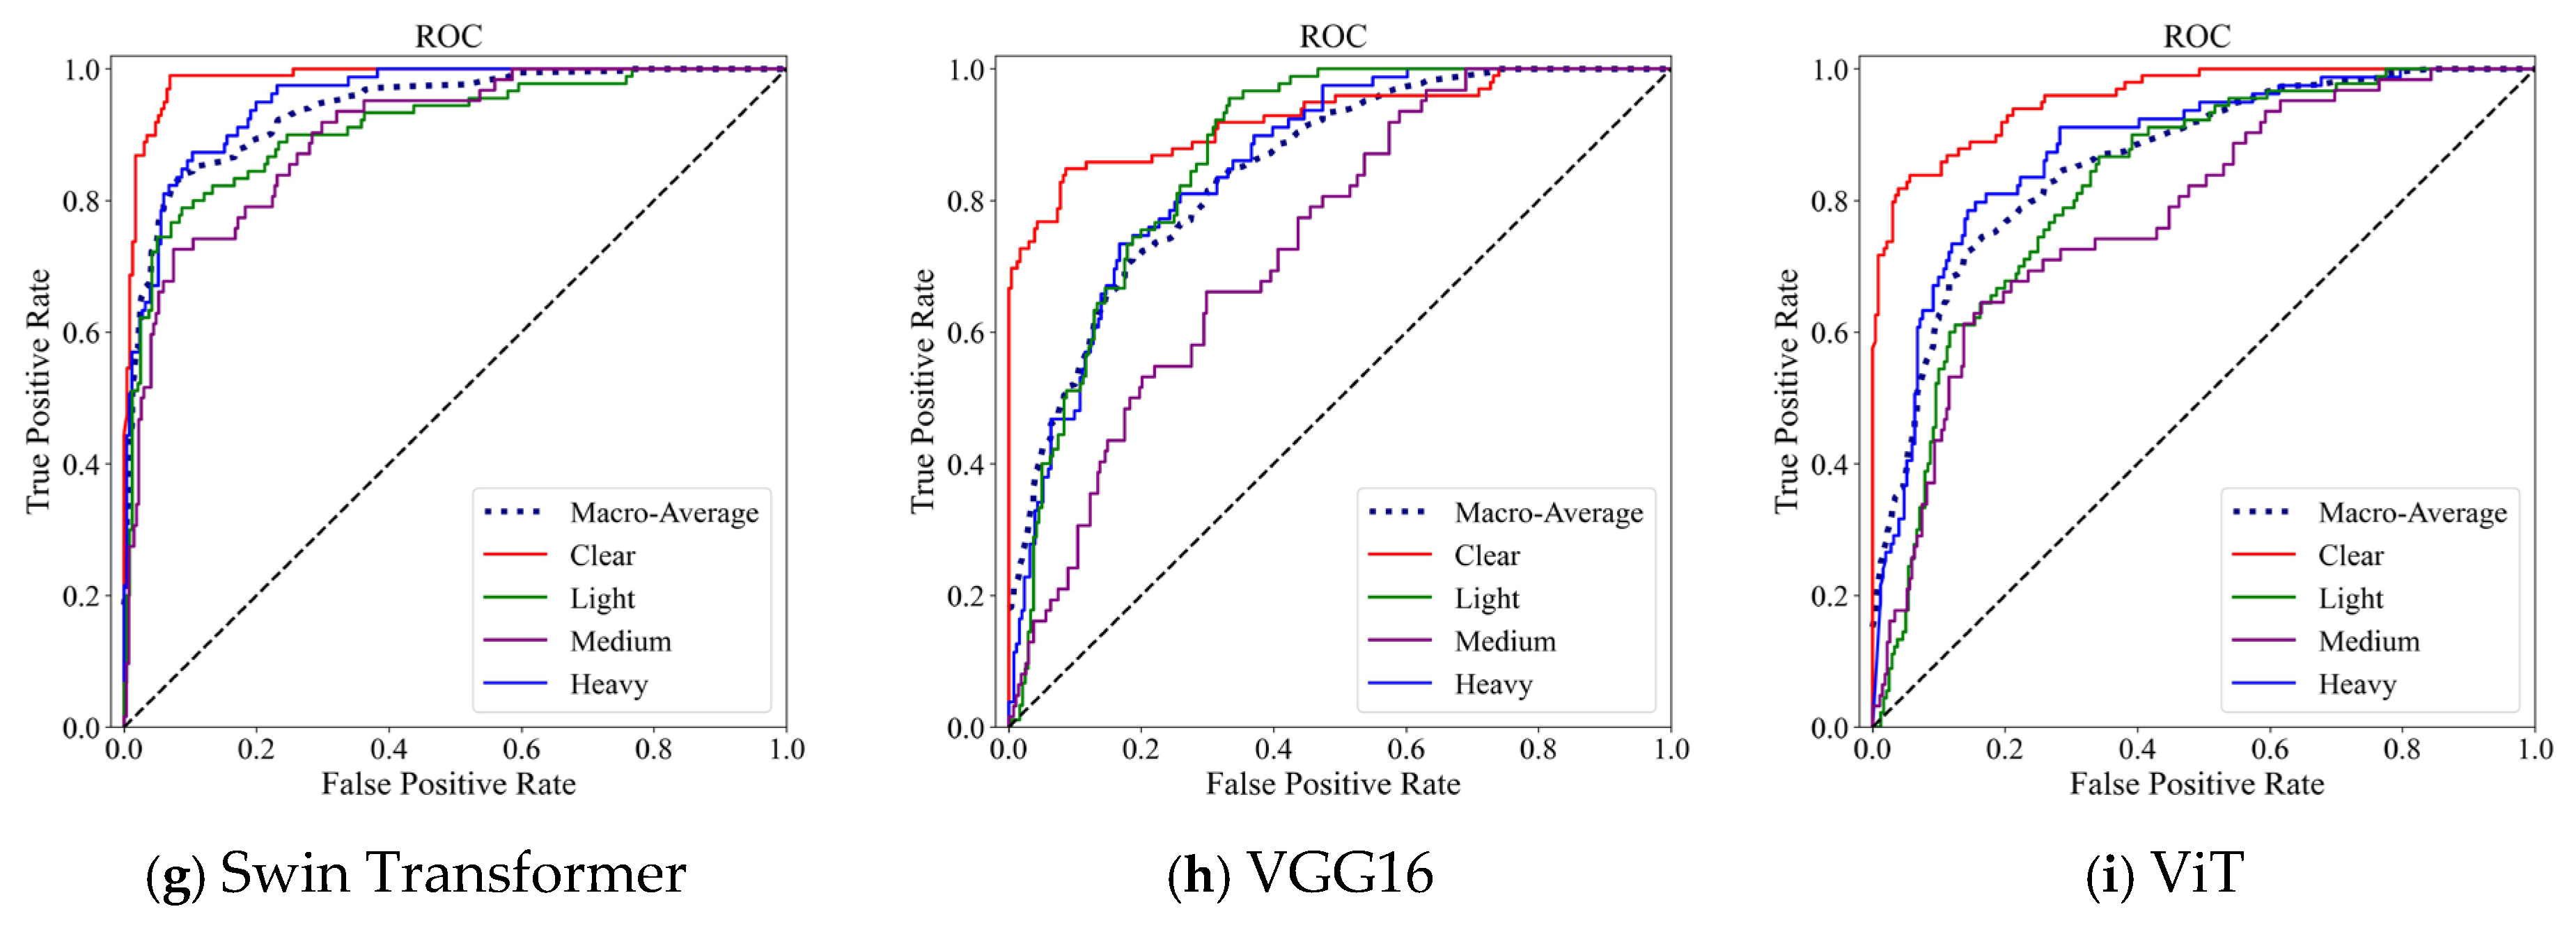
To further evaluate the discriminative capability of each model under varying decision thresholds, ROC curve analysis was first conducted. The ROC curve characterizes the trade-off between the True Positive Rate and the False Positive Rate, thereby reflecting the model’s classification behavior across different thresholds. For the multi-class setting, a one-vs-rest strategy was adopted to compute class-wise ROC curves, and macro-averaging was employed to summarize the overall discriminative performance. The ROC curves of different models are shown in Figure 4.
Figure 4.
ROC curves of deep learning models on the Cam-SNOW test set. The diagonal dotted line represents the performance of a random classifier.
As illustrated in Figure 4, the ROC curves of all models are close to the upper-left corner, with macro-average AUC values approaching 1.0, indicating strong separability among different snow severity levels. Notably, the Transformer-based models, including ViT and Swin Transformer, exhibit smoother and more stable macro-average curves, remaining consistently closer to the ideal operating point. This suggests that the global feature modeling capability enabled by the self-attention mechanism enhances the representation of large-scale structural patterns in snow-covered road scenes, thereby improving inter-class discrimination.
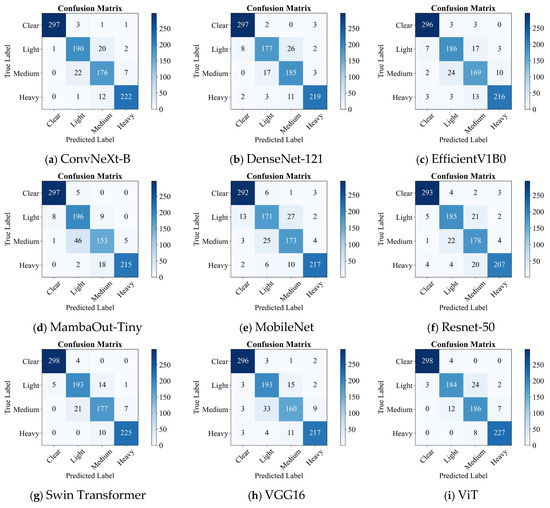
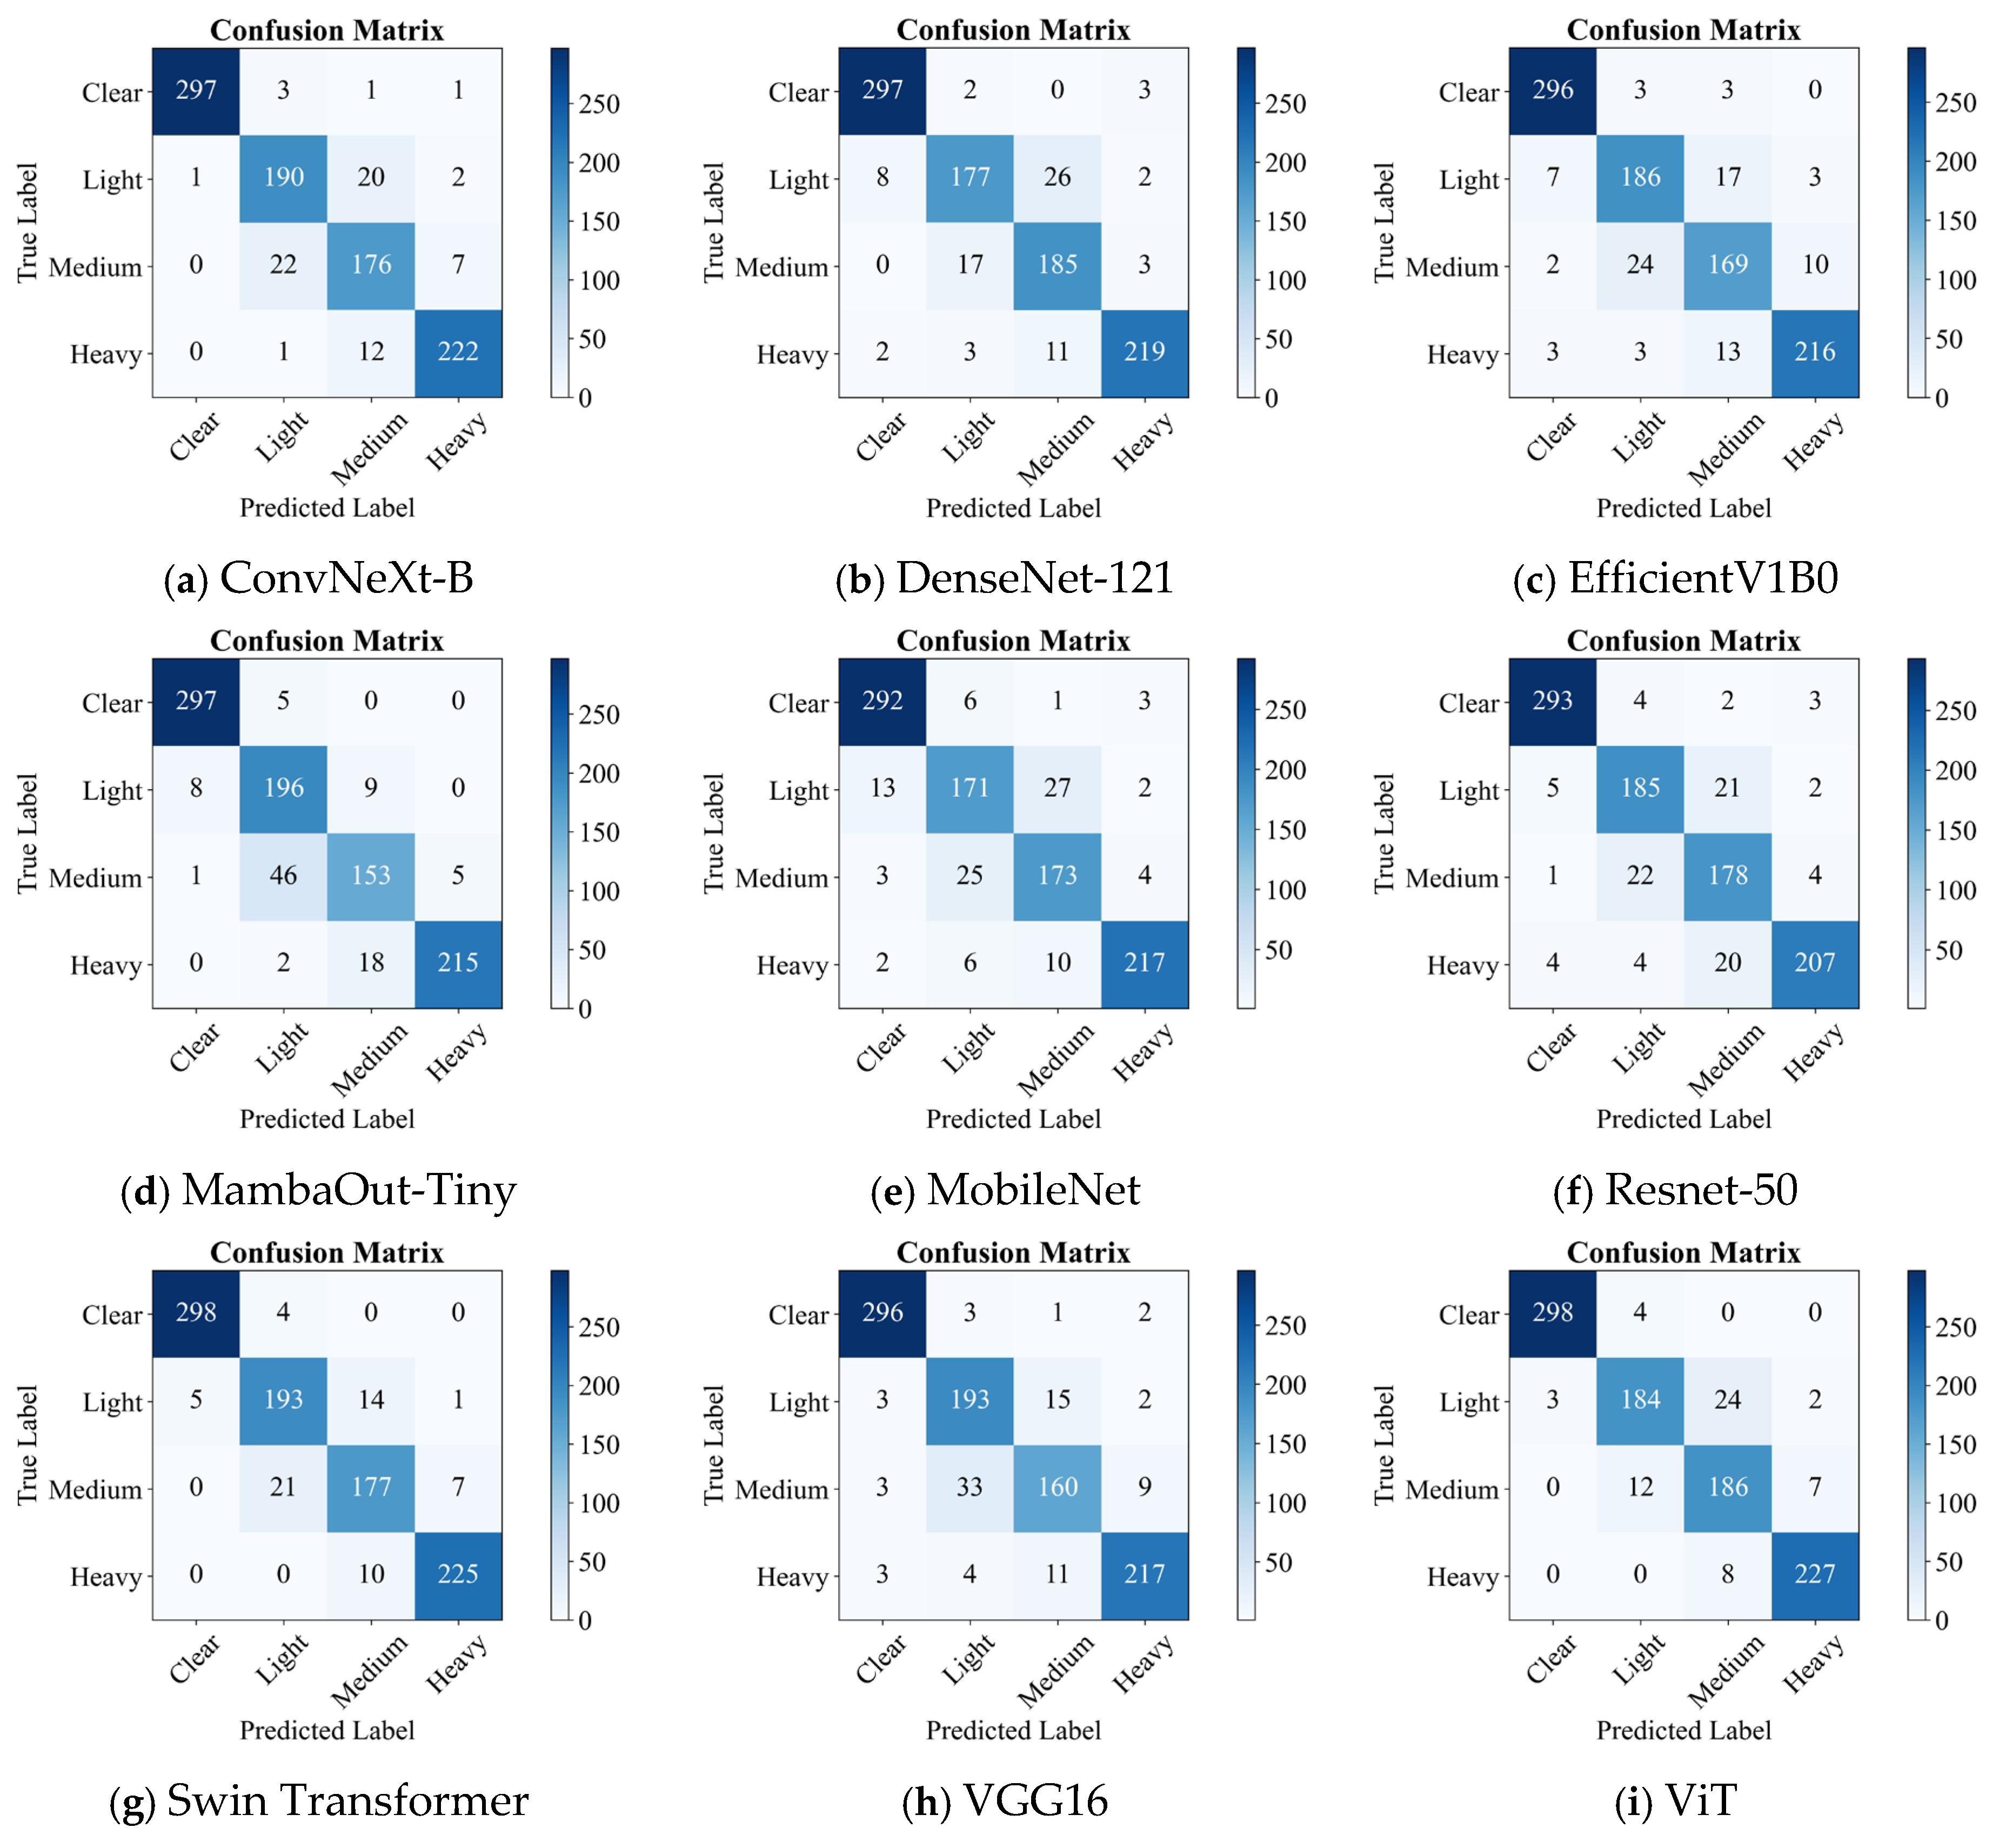
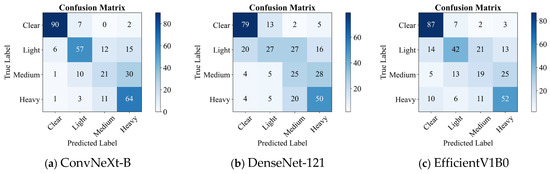
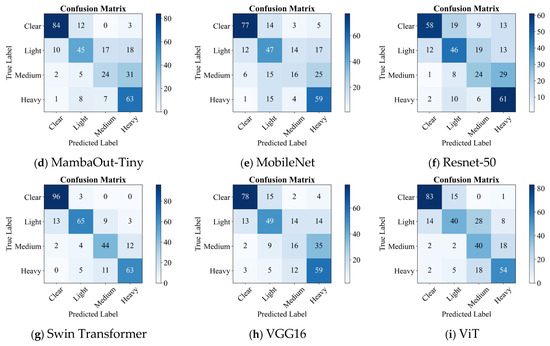
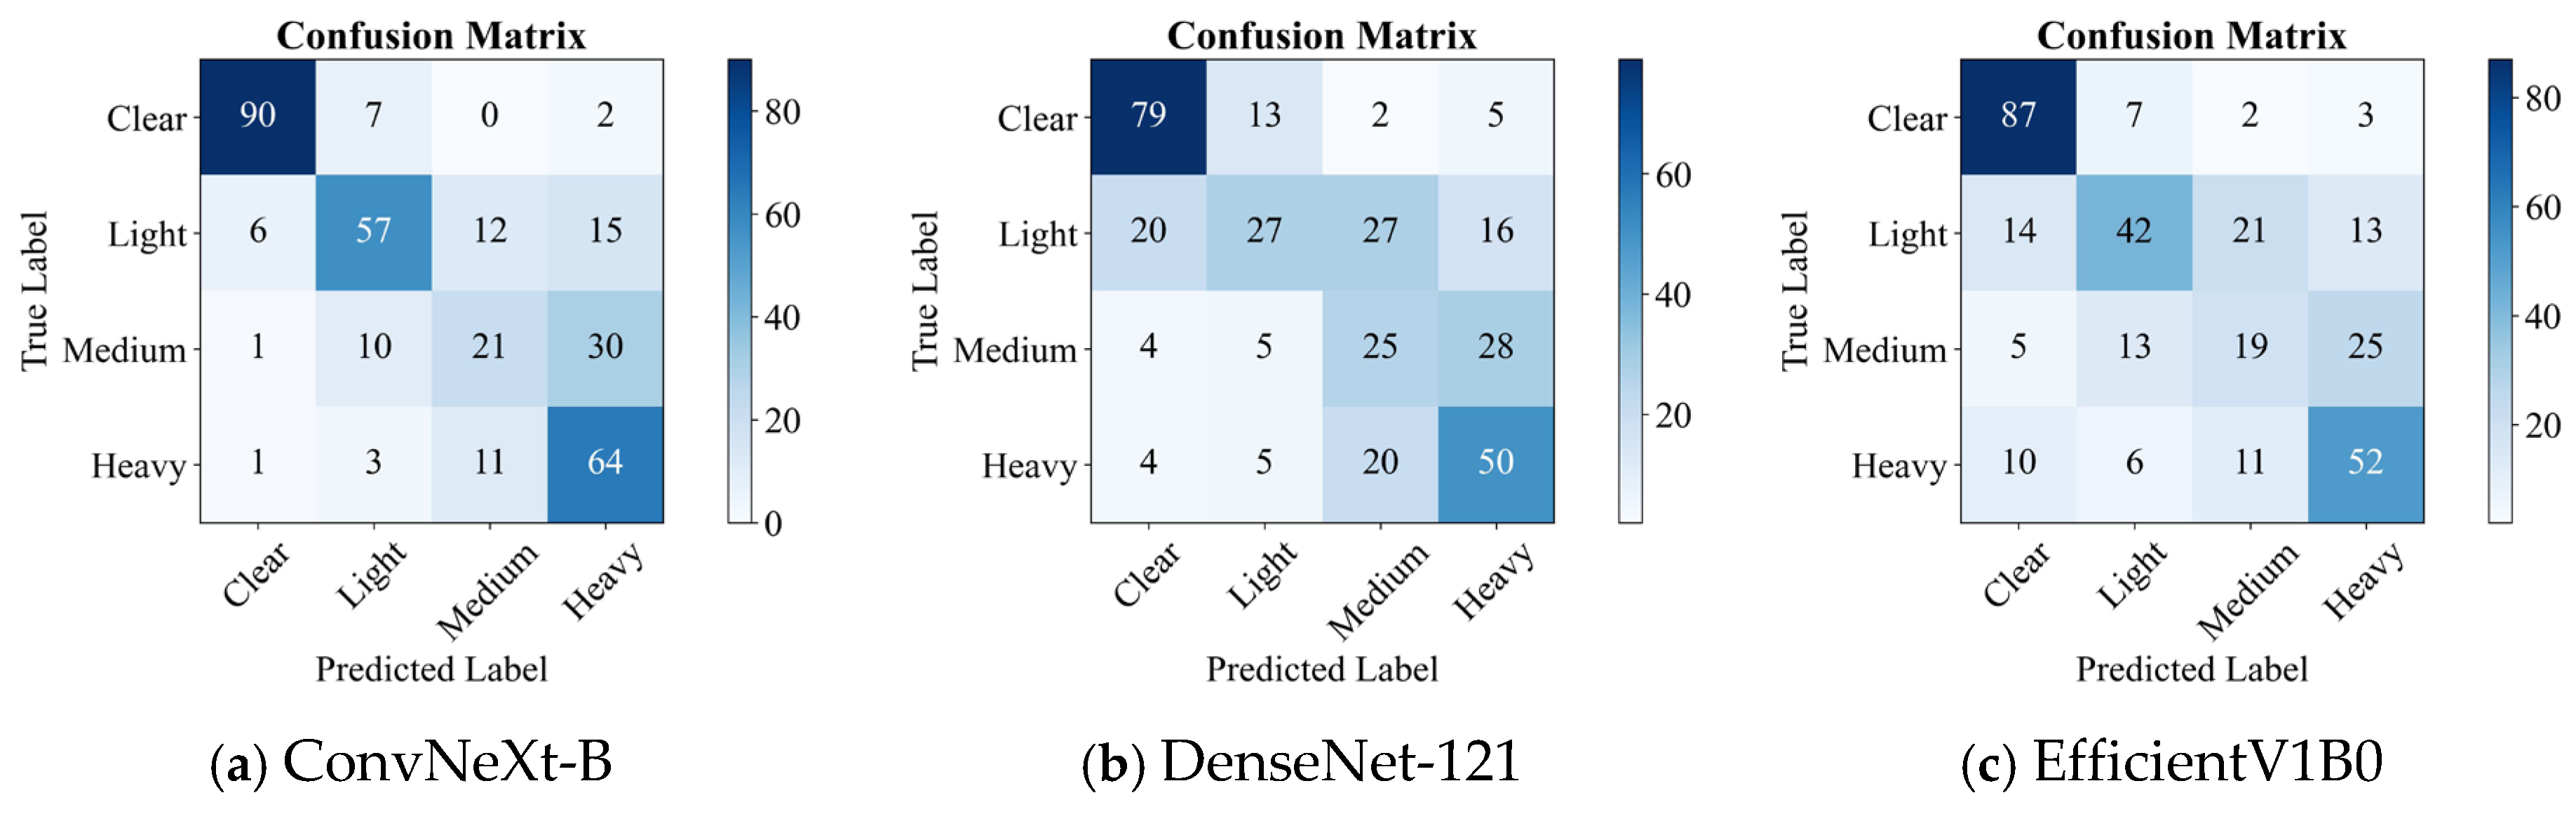
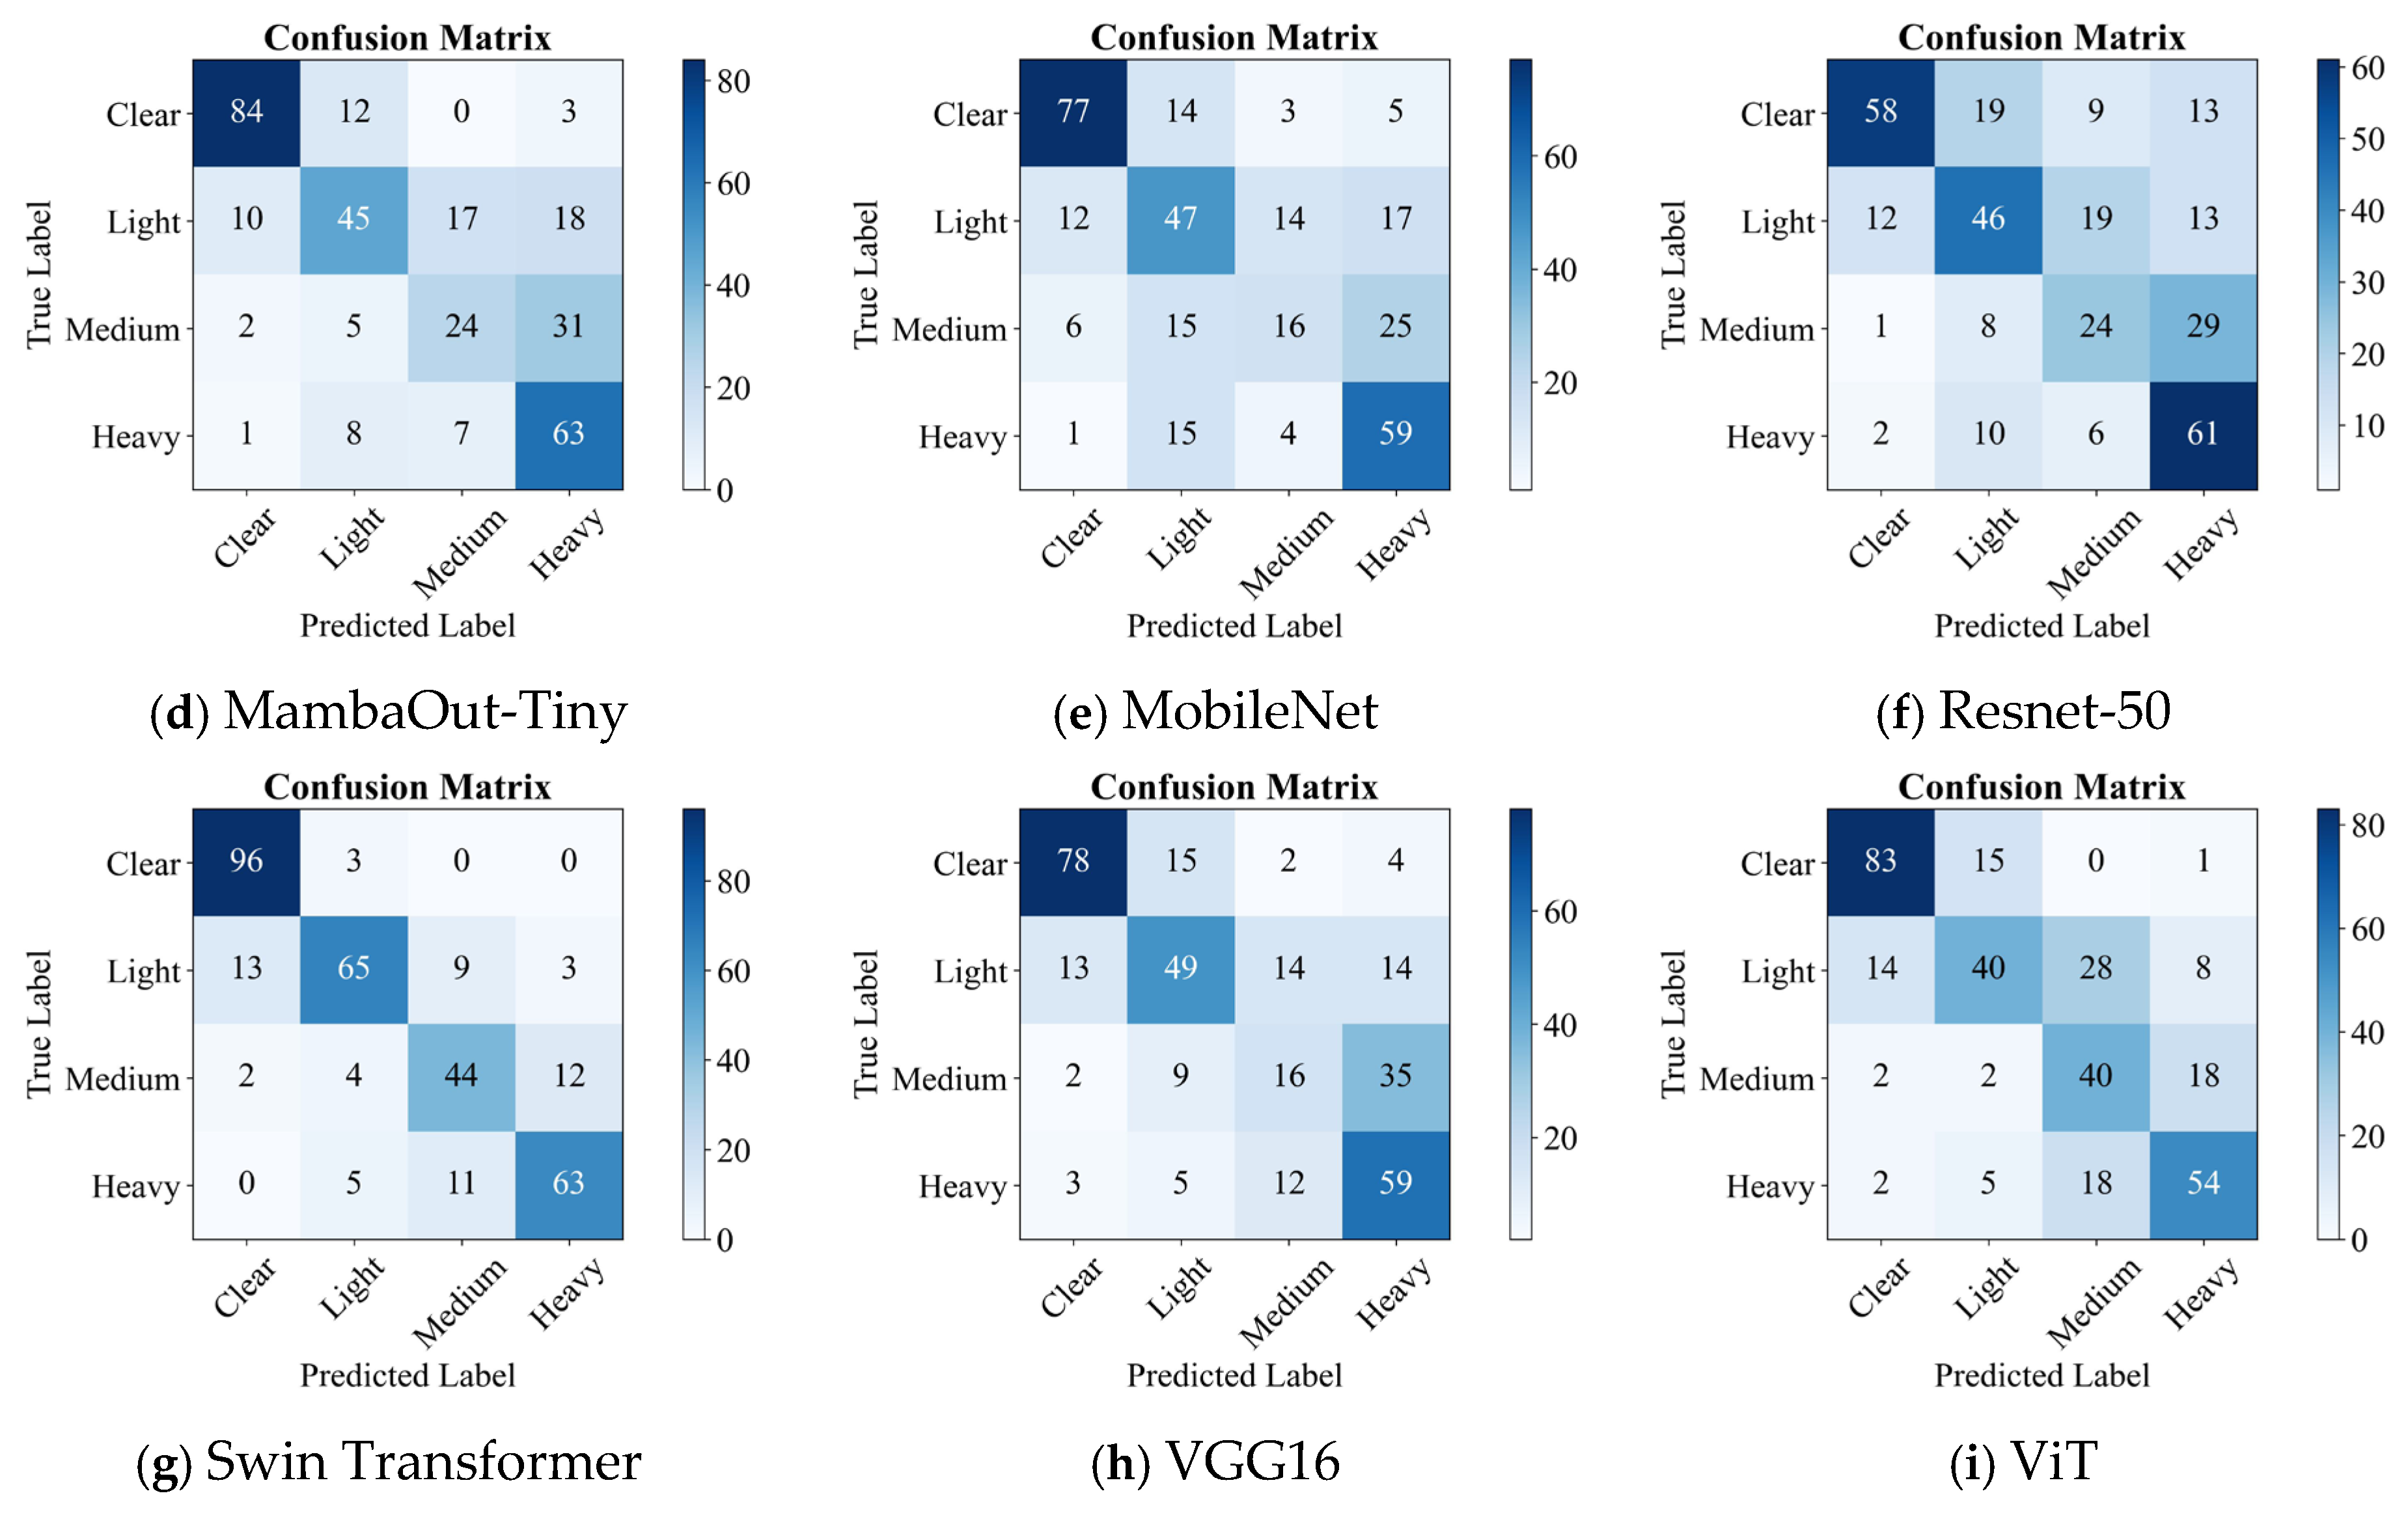
After analyzing overall separability, confusion matrices were employed to further investigate the specific sources of misclassification. A confusion matrix presents the true labels along the rows and predicted labels along the columns, where diagonal elements indicate correctly classified samples and off-diagonal elements represent misclassifications. This tool provides a detailed view of which categories are most frequently confused and reveals the inherent challenges of the classification task. The confusion matrices of all models are shown in Figure 5.
Figure 5.
Confusion matrices of deep learning models on the Cam-SNOW test set.
From Figure 5, it can be observed that the “Clear” category achieves the highest recognition accuracy across all models, with minimal misclassification. This indicates that snow-free road conditions possess distinct visual characteristics that are easily distinguishable. In contrast, the most significant confusion occurs between the Light and “Medium” categories, a pattern consistently observed across ViT, Swin Transformer, and various CNN-based models. This phenomenon suggests that light and moderate snow conditions exhibit gradual transitions in snow coverage ratio, texture density, and surface visibility, leading to relatively ambiguous decision boundaries. Meanwhile, the “Heavy” category demonstrates relatively stable classification performance across models, as heavy snow conditions typically present more prominent visual features such as extensive coverage and reduced surface contrast, making them easier to detect.
In summary, ROC analysis confirms that all models possess strong discriminative ability, with Transformer-based models (ViT and Swin Transformer) showing slight advantages in overall separability. The confusion matrix analysis further reveals that misclassification primarily arises from adjacent severity levels, particularly between Light and Medium categories. These findings not only highlight the influence of architectural design on classification performance but also provide clear directions for future improvements, such as enhanced modeling of intermediate severity features.
3.4. Experiments on Real-World Application
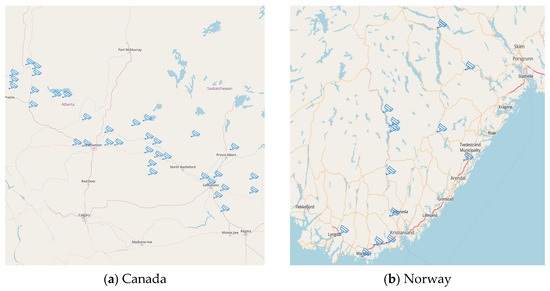
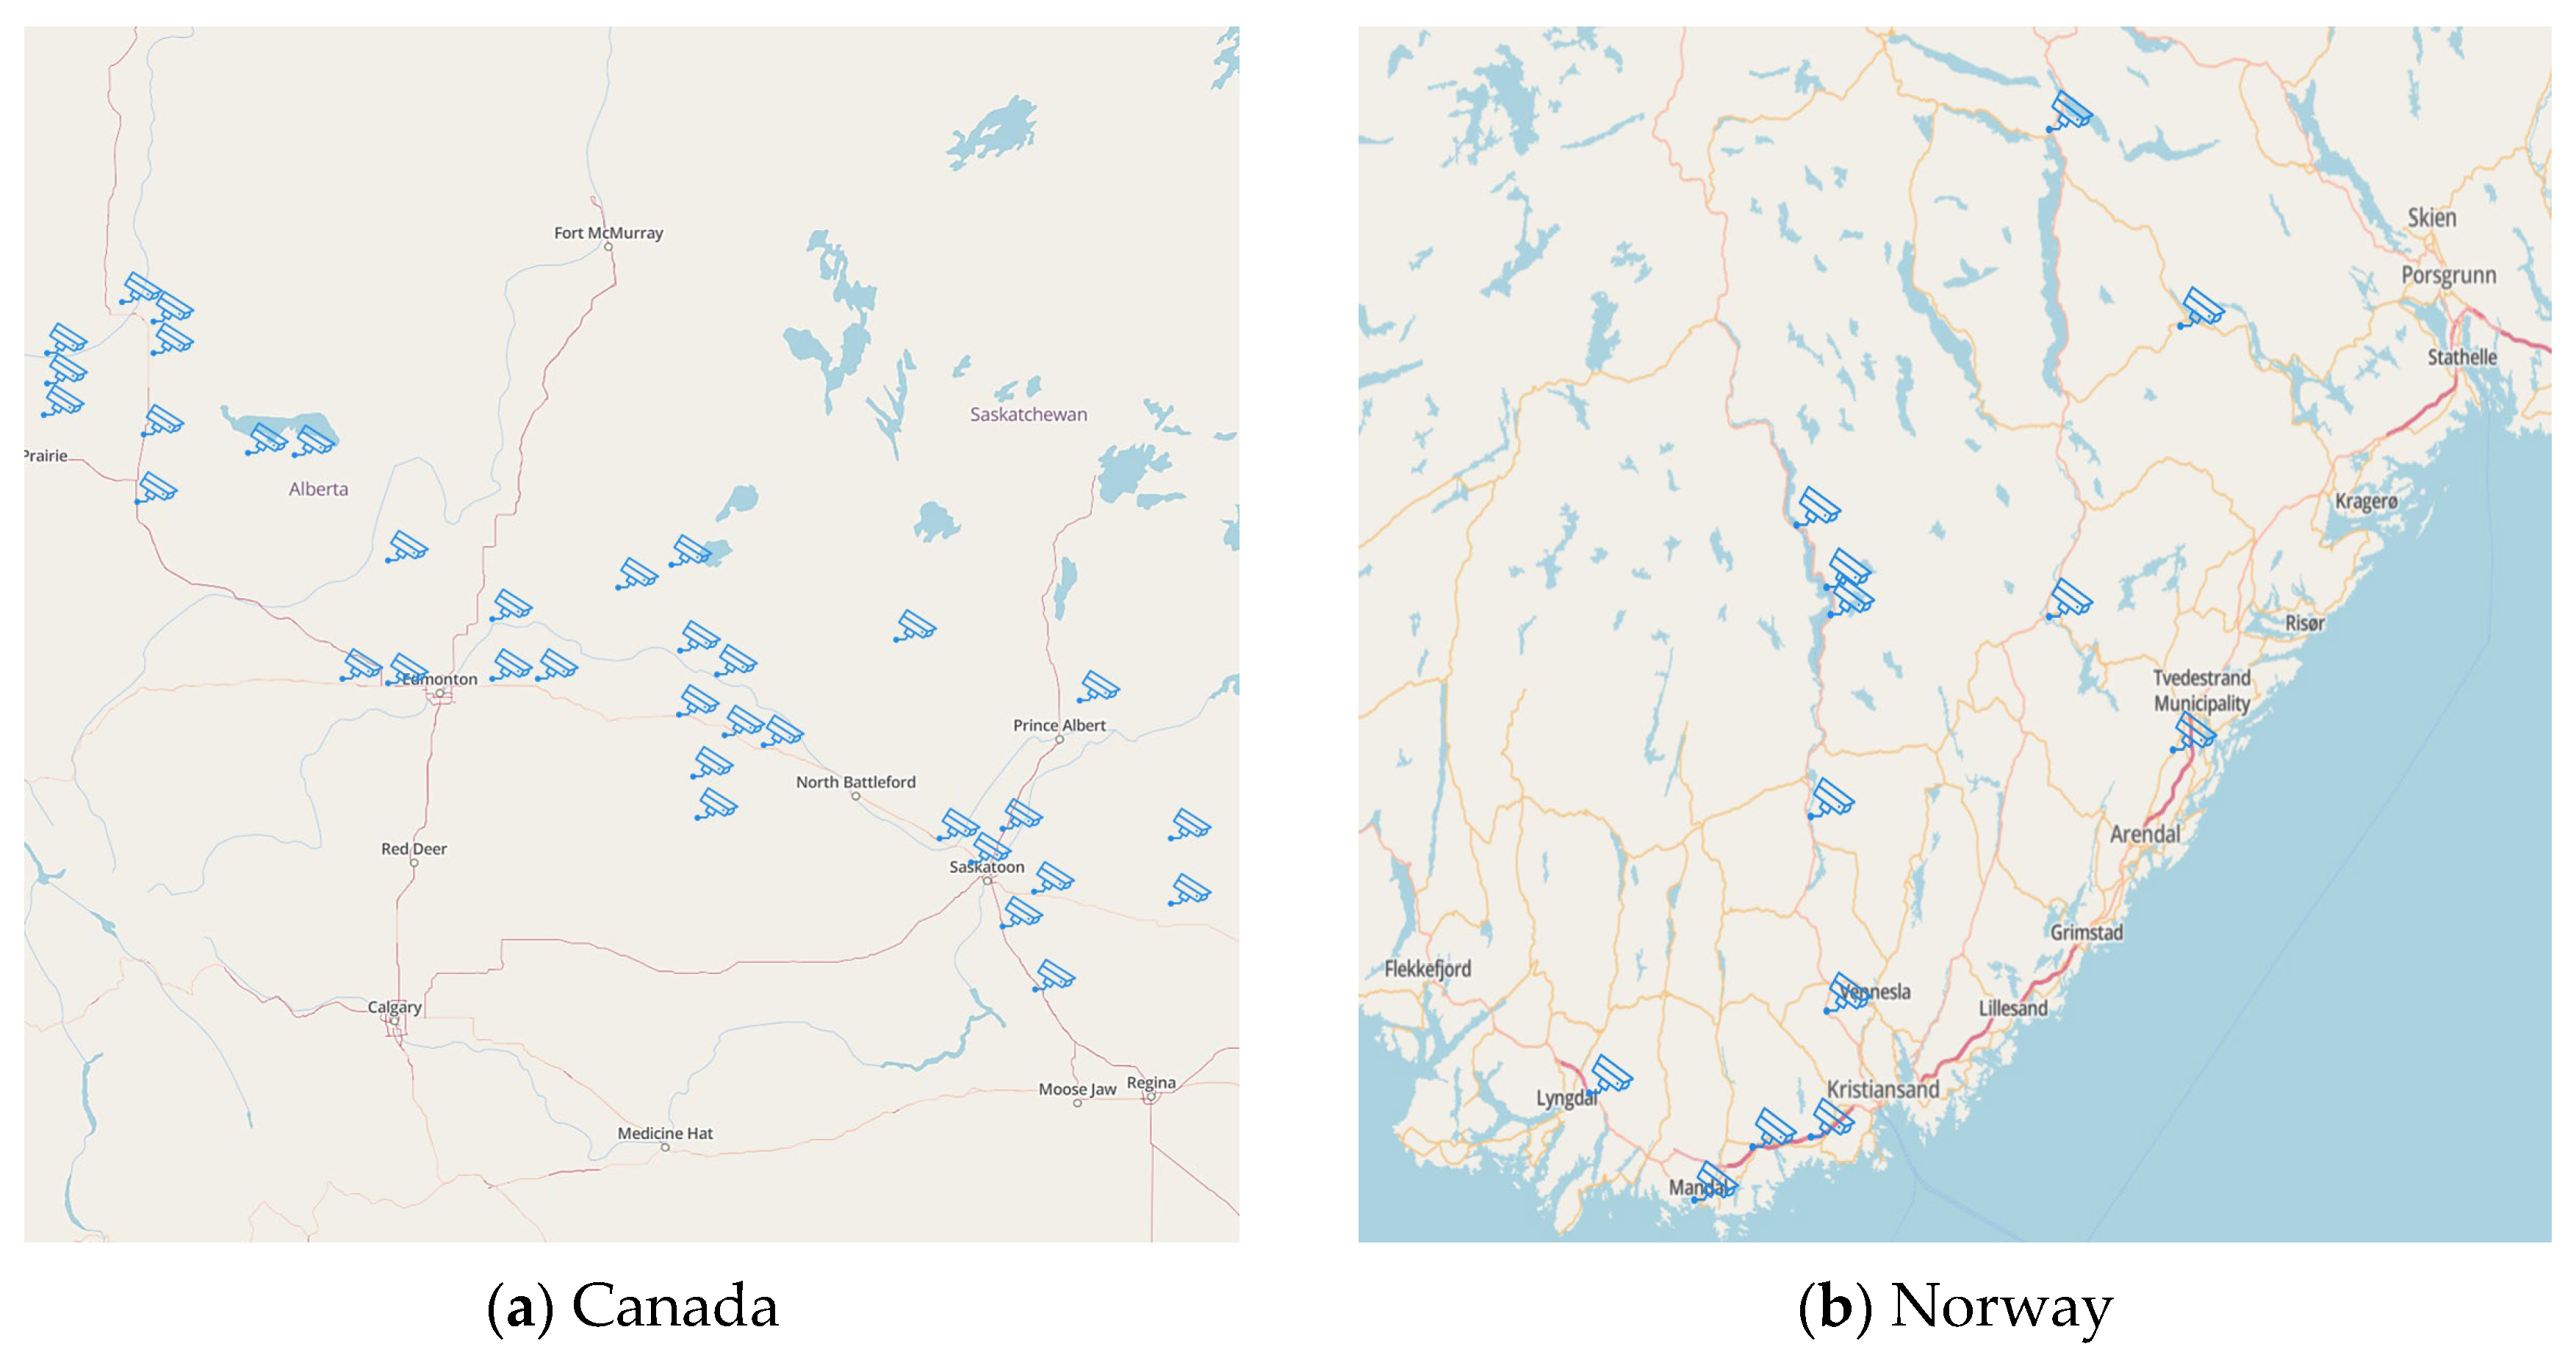
In this section, we selected 48 traffic surveillance cameras from the open-access monitoring platform Windy (https://www.windy.com/) across Norway and Canada to evaluate the real-world performance of different deep learning models trained on the Cam-SNOW dataset. The selected cameras cover both daytime and nighttime conditions and represent diverse traffic environments, including urban roads, highways, and bridges. In Norway, camera locations are distributed across Vest-Agder, Aust-Agder, and Telemark, while in Canada, sites are located in Alberta and Saskatchewan. The spatial distribution of the selected camera locations is shown in Figure 6.
Figure 6.
Spatial distribution of surveillance camera locations for real-world. The base maps were obtained from MapTiler (https://cloud.maptiler.com/maps/openstreetmap/, accessed on 19 April 2026).
The quantitative results, including Accuracy, Precision, Recall, and F1-score, are summarized in Table 4.
Table 4.
Performance comparison of deep learning models in real-world.
As shown in Table 4, compared with the test set (Section 3.3), a noticeable performance degradation is observed across all models in real-world scenarios. This decline can be attributed to environmental complexities such as illumination variation (day/night transitions, backlighting), road surface reflections, vehicle occlusion, camera viewpoint diversity, and image quality fluctuations. The robustness of different architectures varies significantly under real-world conditions. Among all models, Swin Transformer achieves the best overall performance (Accuracy 81.2%, F1-score 81.0%), demonstrating stronger generalization stability. In contrast, several CNN-based architectures, including DenseNet-121, ResNet-50, and MobileNet, exhibit accuracies within the range of 55–61%, indicating higher sensitivity to domain shifts and environmental perturbations. Notably, ConvNeXt-B (Accuracy 70.3%) outperforms most traditional CNN baselines, suggesting that improved feature representation capacity partially mitigates cross-scene performance degradation. Meanwhile, ViT and MambaOut-Tiny (approximately 65%) achieve intermediate performance, implying that architectural advantages in controlled environments do not always directly translate into superior real-world robustness. Generalization performance is therefore influenced not only by model structure but also by the diversity and representativeness of the training data distribution. From the perspective of the bootstrap-based 95% confidence intervals of macro-F1 scores, the Swin Transformer (75.3–84.3) demonstrates a clear and statistically significant performance advantage over all other models, whose confidence intervals do not overlap with that of the Swin Transformer. In contrast, substantial overlap exists among ConvNeXt-B (61.8–71.8), ViT (59.4–69.6), MambaOut-Tiny (57.4–67.9), VGG16 (52.7–62.8), EfficientNet-B0 (51.9–62.2), MobileNet (51.8–62.1), ResNet-50 (51.2–61.6), and DenseNet-121 (47.0–57.4), indicating that the performance differences among these models are relatively limited and not statistically significant. These results suggest that the Swin Transformer provides more robust and reliable classification capability under real-world conditions. Moreover, the relatively narrow confidence interval of the Swin Transformer further indicates improved stability and predictive consistency compared with the other architectures.
To further examine the overall separability under real-world conditions, ROC curves were analyzed, as shown in Figure 7.
Figure 7.
ROC curves of deep learning models in real-world. The diagonal dotted line represents the performance of a random classifier.
Compared with the results on the test set, the macro-average curves of several models exhibit noticeable shifts away from the ideal upper-left region, indicating reduced inter-class separability under environmental interference. Among all evaluated models, Swin Transformer maintains a macro-average curve that remains relatively closer to the upper-left corner, reflecting more stable discriminative capability in complex scenes. In contrast, DenseNet-121 and ResNet-50 demonstrate more pronounced curve degradation, suggesting limited adaptability to illumination changes, occlusion, and background variation. Although ViT shows a decline compared with its performance on the test set, it still outperforms most CNN baselines, indicating that Transformer-based architectures retain certain robustness advantages under domain shifts, albeit still affected by viewpoint and resolution variations. From the perspective of network architecture, the differences in generalization performance under real-world conditions are closely related to the feature modeling strategies of different models. The Swin Transformer captures large-scale spatial structural information through self-attention mechanisms and therefore shows stronger adaptability to environmental disturbances such as illumination variation and viewpoint differences. In contrast, conventional CNN-based models mainly rely on local convolutional features and are more sensitive to reflections, shadows, and partial occlusions, leading to more noticeable performance degradation in complex real-world scenarios. The relatively better performance of ConvNeXt-B suggests that improved convolutional designs can partially enhance feature representation capability, although they still remain less effective than hierarchical Transformer architectures with explicit global context modeling ability. These results indicate that multi-scale spatial structure modeling plays an important role in improving robustness for surveillance-based road snow-cover classification tasks.
To further identify the sources of misclassification in real-world settings, confusion matrices are presented in Figure 8.
Figure 8.
Confusion matrices of deep learning models in real-world.
Overall, misclassifications become more concentrated between adjacent severity levels, and the confusion patterns vary across architectures.
First, the “Clear” category remains relatively stable, although misclassification increases slightly compared with the test set. Some clear-road samples are incorrectly classified as Light. This phenomenon is likely associated with non-snow visual interference, such as wet road reflections, melting snow residues, vehicle tire marks, and shadow variations, which may visually resemble light snow coverage. These interference factors alter the local reflectance and texture characteristics of the road surface, introducing ambiguity into the visual representation and increasing the probability of confusion between adjacent categories.
Second, errors in real-world scenarios are primarily concentrated in the “Medium” category, which is manifested in two aspects: first, confusion between “Light” and “Medium” has significantly increased; second, some models exhibit bidirectional misclassification between “Medium” and “Heavy.” The reasons for these errors can be attributed to the following factors:
- (1)
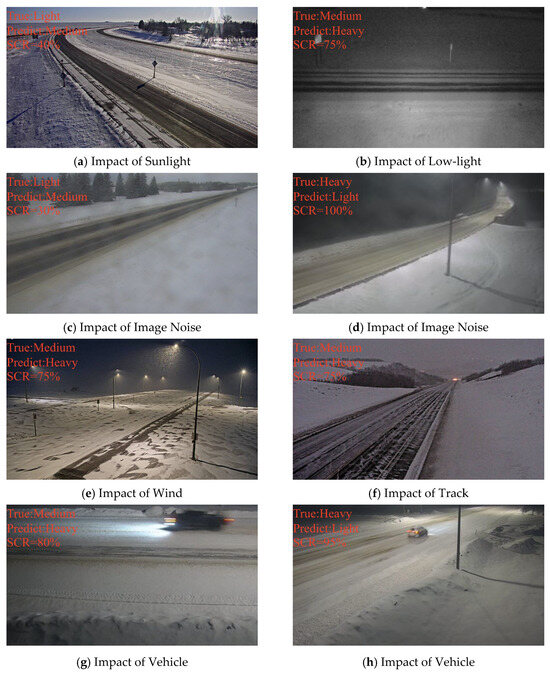
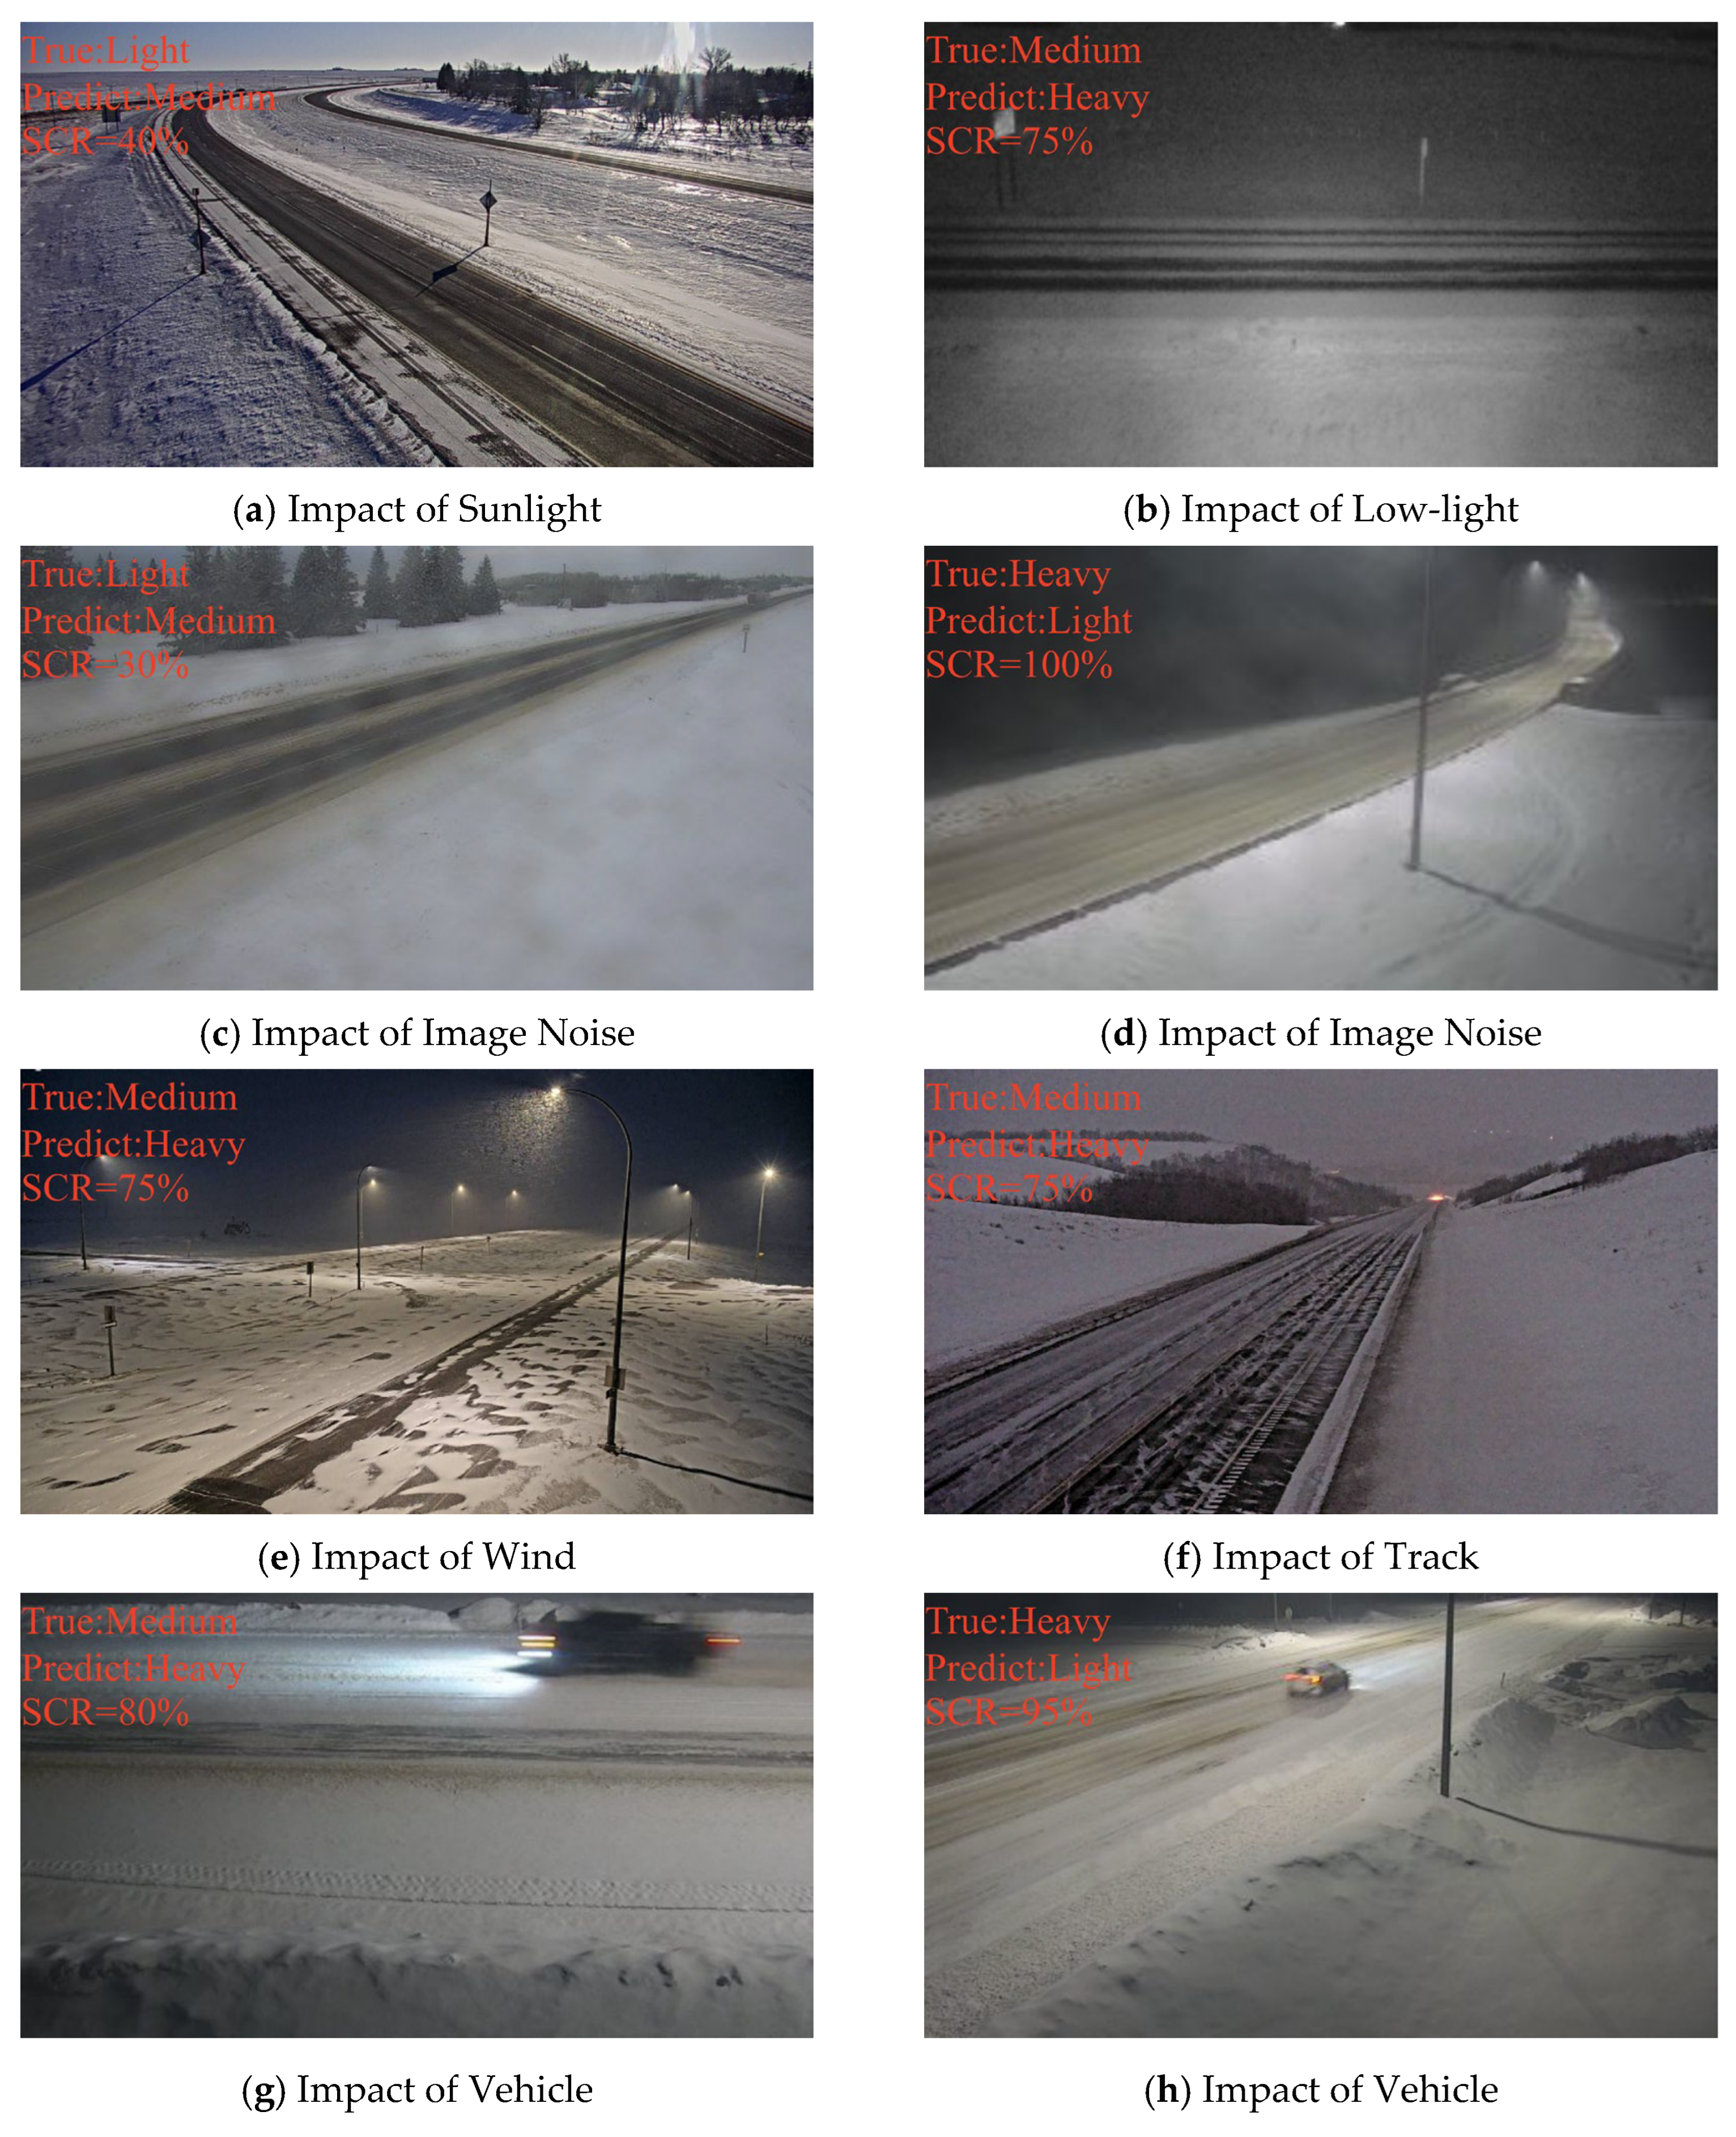
- The spatial non-uniformity of snow coverage on the road surface. In real-world road environments, snow coverage typically exhibits strong spatial non-uniformity. For example, local areas may experience discontinuous coverage, or shoulder snow may coexist with exposed tire tracks, resulting in significant variation in texture density and coverage intensity across different regions. This non-uniformity leads to highly variable visual features of the snow, complicating the classification task. As shown in Figure 9e,f, the effects of wind and passing vehicles cause the snow distribution to become even more uneven, increasing classification complexity and leading to misclassification.Figure 9. Misclassified Samples of Swin Transformer in Real-World Scenarios. The road snow images were obtained from Windy (https://www.windy.com/, accessed on 19 April 2026).
- (2)
- The influence of complex imaging conditions. Complex imaging conditions often interfere with the visibility of snow coverage, increasing the likelihood of misclassification. For example, in Figure 9a, intense sunlight and road surface reflections disrupt the visibility of snow. In Figure 9b, low-light conditions at night reduce the visibility of snow coverage, further increasing the potential for misclassification. Additionally, adverse weather conditions may cause contamination of the camera lens, introducing noise into the image and further elevating the error rate, as shown in Figure 9c,d.
- (3)
- The scale effects introduced by the monitoring viewpoint. In practical applications, the positioning and viewpoint of surveillance cameras significantly affect how snow coverage is represented. As shown in Figure 9a,b, changes in camera pitch angle, focal length, and observation distance affect the projection area and texture of the road surface in the image. This variation leads to differences in snow coverage ratios across different scenes. For instance, in long-distance or low-resolution views, the visual difference between “Medium Snow” and “Heavy Snow” is compressed, shifting the model’s decision boundary and causing classification errors. These scale effects resulting from viewpoint variations are a major source of misclassification.
- (4)
- The influence of vehicles passing by and other dynamic environmental factors. Figure 9g,h demonstrate that when vehicle occlusion, road surface reflections, shadow variations, and image noise overlap, even when their SCR values have already reached the threshold for the heavy category key visual cues such as coverage ratio, texture granularity, and contrast changes are locally disturbed, leading to confusion between adjacent categories. These disturbances not only affect the visual appearance of snow coverage but also increase confusion between adjacent categories like “Light Snow” and “Medium Snow.” Furthermore, vehicles passing by may compress or drag the snow, altering its appearance and further impacting the model’s classification accuracy.
These results suggest that classification uncertainty in surveillance-based road snow monitoring is closely related to several practical factors, including the spatial heterogeneity of snow distribution, variations in illumination and imaging conditions, and geometric scale differences introduced by surveillance viewpoints. These factors jointly influence the visibility and separability of snow-cover features in real-world scenes and therefore affect model performance across different environments. Improving robustness under such conditions requires better representation of spatial structure and scale variability, for example by incorporating temporal information from video sequences, adopting multi-scale feature modeling strategies, and expanding cross-scene data coverage to enhance classification consistency and long-term operational stability, particularly for intermediate snow severity levels in dynamic traffic conditions.
Compared to the daytime, nighttime environments are more complex, and the imaging methods and the resulting image features captured by surveillance cameras differ significantly. At night, surveillance cameras typically switch between different imaging modes depending on the lighting conditions. In low-light environments, the camera may automatically switch to near-infrared imaging mode, causing the road surface features to appear differently compared to the visible light imaging used during the day, especially in terms of snow surface reflectivity. near-infrared imaging is better suited for capturing objects in low-light conditions, but it struggles with detailing the surface features, particularly on smooth snow. In some night scenes with street lighting, the camera may still use visible light imaging, but varying lighting conditions (such as light intensity and light source direction) can interfere with the snow features in the image, causing fluctuations in image quality and affecting classification accuracy.
To address these challenges in nighttime environments, future work will focus on the following aspects. First, a nighttime-specific data augmentation strategy will be developed to handle complex lighting conditions, particularly focusing on the switch between near-infrared and visible light modes, using enhancement algorithms to mitigate the interference caused by lighting changes and improve image stability. Additionally, we plan to collect and supplement datasets from various surveillance scenes, covering different lighting conditions (such as streetlight illumination and completely dark environments) and various weather conditions (such as snowfall and fog), to help the model better adapt to nighttime features and improve classification accuracy. Furthermore, the integration of multimodal data (such as near-infrared and video information) will be explored to compensate for the shortcomings of single-modal imaging at night, further enhancing the stability and accuracy of nighttime snow classification.
Table 5 presents the performance of the Swin Transformer across different categories, including evaluation metrics such as accuracy, precision, recall, and F1-score. For the Clear category, the Swin Transformer achieves a precision of 0.86, which is comparable to that of ConvNeXt-B, while outperforming the lowest-performing model, DenseNet-121, by 0.13. For the Light category, the Swin Transformer achieves a precision of 0.84, outperforming the second-best model ConvNeXt-B by 0.10 and surpassing the lowest-performing model MobileNet by 0.33; for the Medium category, it attains a precision of 0.69, exceeding the second-best model MambaOut-Tiny by 0.19 and outperforming the lowest-performing model DenseNet-121 by 0.35; for the Heavy category, it achieves a precision of 0.81, which is higher than the second-best model ViT by 0.14 and surpasses the lowest-performing model DenseNet-121 by 0.30. It is noteworthy that Swin Transformer exhibits a more balanced diagonal distribution across categories, particularly showing improved discrimination between Light and Medium classes. This further explains its superior overall performance in real-world scenarios.
Table 5.
The performance of the Swin Transformer for each category.
In practical applications, inference speed is another critical factor that should be considered alongside classification accuracy when evaluating model suitability for deployment. Therefore, the computational complexity of different models was evaluated in terms of parameter size and FLOPs, as summarized in Table 6. Lightweight models such as EfficientNet-B0 and MobileNet exhibit significantly lower computational costs, making them suitable for resource-limited deployment scenarios, while transformer-based models (e.g., ViT and Swin Transformer) and ConvNeXt-B provide stronger representation capability at the expense of higher computational overhead.
Table 6.
Model Complexity Comparison (Parameters and FLOPs).
However, it should be noted that road snow monitoring is typically performed at discrete time intervals (e.g., once per minute or longer) rather than in a strict real-time continuous processing mode. Such interval-based observation strategies substantially reduce the computational burden during practical deployment and make it feasible to apply relatively complex models in real-world surveillance systems. Therefore, a balance between model accuracy and computational efficiency can be flexibly achieved according to specific application requirements and hardware conditions.
Regarding regional climatic differences between Norway and Canada, the real-world validation data used in this study were collected from both regions, which exhibit certain differences in winter climatic conditions. For example, Norway is more strongly influenced by a maritime climate, with relatively milder winter temperatures and wetter snowfall, whereas most regions of Canada are characterized by a continental climate, with lower winter temperatures, drier snowfall, and longer snow-cover duration. It should be noted that the primary objective of this study is to evaluate the cross-scene generalization capability of the models under heterogeneous real-world surveillance environments rather than to perform a country-level comparison of classification performance. Since road snow-cover classification mainly relies on local structural characteristics of surface snow coverage observed in surveillance imagery, which primarily reflect road surface conditions and are less dependent on regional-scale climatic variability, performance variations are more likely to be associated with imaging-related factors such as illumination variability, occlusion, and camera viewpoint differences. A more rigorous country-level comparative analysis would require a more regionally balanced dataset with controlled sampling conditions, which will be considered in future work.
4. Conclusions
This study investigates winter road snow-cover classification using traffic surveillance cameras and demonstrates the feasibility of camera-based sensing for segment-level winter road condition monitoring. An open-access road snow-cover dataset containing 10,498 images was constructed, and nine representative deep learning architectures were systematically evaluated under a unified experimental framework. Results show that all models achieved classification accuracies exceeding 89% on the standard test set, confirming the effectiveness of surveillance imagery for snow severity recognition in controlled scenarios. Cross-regional validation experiments further reveal that model performance is strongly influenced by illumination variability, camera viewpoint differences, and spatial heterogeneity of snow distribution in real-world environments. Among the evaluated architectures, the Swin Transformer achieved the highest accuracy (81.2%), demonstrating superior robustness under complex imaging conditions. Confusion matrix analysis indicates that most misclassifications occur between adjacent severity levels, particularly between the Light and Medium categories, reflecting gradual visual transitions in snow-cover morphology across intermediate surface states.
Overall, this study provides a systematic quantitative comparison of representative deep learning architectures for surveillance-based winter road snow classification and highlights the importance of environmental variability and imaging geometry in determining model performance. The findings offer practical guidance for model selection, cross-regional deployment, and performance evaluation of camera-based winter road monitoring systems, and support the development of scalable, cost-effective sensing solutions for intelligent traffic management under winter conditions.
Author Contributions
X.W.: Conceptualization, Methodology, Funding Acquisition, Supervision, Writing—Original Draft; M.W.: Data Curation, Software, Visualization, Validation; Z.W.: Data Curation, Visualization, Supervision; H.L. (Heyueyang Li): Project administration, Formal analysis; M.D.: Resources, Visualization; C.Z. (Cuiyan Zhang): Software, Supervision; C.Y.: Investigation; C.Z. (Chengyu Zhang): Data Curation; H.L. (Huiting Lv): Validation. All authors have read and agreed to the published version of the manuscript.
Funding
This work is Supported by the National Key Research and Development Program of China, China (grant 2023YFC3007501), Heavy Rainfall Research Foundation of China (BYKJ2024Q16), and Open Foundation of the Observation and Research Station of Land-Sea Interaction Field in the Yellow River Estuary, Ministry of Natural Resources (LSIOR202511).
Institutional Review Board Statement
Not applicable.
Informed Consent Statement
Not applicable.
Data Availability Statement
The traffic image data is collected from open access platform: Windy (https://www.windy.com/, accessed on 19 April 2026), Fintraffic (https://www.fintraffic.fi/fi, accessed on 19 April 2026), DriveBC (https://www.drivebc.ca/cameras, accessed on 19 April 2026), and Tirol (https://www.tirol.gv.at/, accessed on 19 April 2026). The ViSnow Dataset can be download from: https://ieee-dataport.org/comment/9074#comment-9074 (accessed on 19 April 2026). The Cam-SNOW dataset can be download from: https://pan.baidu.com/s/1LcdvpddsYTOTUwKik1pXpg?pwd=w912 (accessed on 19 April 2026).
Acknowledgments
The authors would like to thank the Windy platform for granting permission to use the camera image data. The authors also acknowledge the contributions of Liying Wei and Qimeng Zhang from the School of Computer Engineering, Nanjing Institute of Technology, as well as Nwachukwu Chisom Samson, for their assistance with data collection and quality control.
Conflicts of Interest
The authors declare no conflicts of interest.
References
- Datla, S.; Sharma, S. Impact of cold and snow on temporal and spatial variations of highway traffic volumes. J. Transp. Geogr. 2008, 16, 358–372. [Google Scholar] [CrossRef] [Scilit]
- DiLorenzo, T.; Yu, X. Use of ice detection sensors for improving winter road safety. Accid. Anal. Prev. 2023, 191, 107197. [Google Scholar] [CrossRef] [Scilit] [PubMed]
- Ewan, L.; Al-Kaisy, A.; Veneziano, D. Remote Sensing of Weather and Road Surface Conditions: Is Technology Mature for Reliable Intelligent Transportation Systems Applications? Transp. Res. Rec. 2013, 2329, 8–16. [Google Scholar] [CrossRef] [Scilit]
- Dietz, A.J.; Kuenzer, C.; Gessner, U.; Dech, S. Remote sensing of snow—A review of available methods. Int. J. Remote Sens. 2012, 33, 4094–4134. [Google Scholar] [CrossRef] [Scilit]
- Tsai, Y.-L.S.; Dietz, A.; Oppelt, N.; Kuenzer, C. Remote Sensing of Snow Cover Using Spaceborne SAR: A Review. Remote Sens. 2019, 11, 1456. [Google Scholar] [CrossRef] [Scilit]
- Ye, S.; Huang, M.; Chen, Z.; Jiang, W.; Luo, X.; Zhu, J. Monitoring Wet-Snow Avalanche Risk in Southeastern Tibet with a UAV-Based Multi-Sensor Framework. Remote Sens. 2025, 17, 3698. [Google Scholar] [CrossRef] [Scilit]
- Ali, E.; Khan, M.N.; Ahmed, M.M. Real-time snowy weather detection based on machine vision and vehicle kinematics: A non-parametric data fusion analysis protocol. J. Saf. Res. 2022, 83, 163–180. [Google Scholar] [CrossRef] [Scilit] [PubMed]
- He, X.; Wu, Y.; Zhang, K.; Zhu, X.; Yang, X. Roadway Snow Detection Using Dual-Spectrum Camera Images and Computer Vision. Transp. Res. Rec. 2023, 2677, 220–232. [Google Scholar] [CrossRef] [Scilit]
- Cordes, K.; Broszio, H. Camera-Based Road Snow Coverage Estimation. In Proceedings of the IEEE/CVF International Conference on Computer Vision (ICCV) Workshops, 2–3 October 2023; IEEE: New York, NY, USA, 2023; pp. 4011–4019. [Google Scholar]
- Grabowski, D.; Czyżewski, A. System for monitoring road slippery based on CCTV cameras and convolutional neural networks. J. Intell. Inf. Syst. 2020, 55, 521–534. [Google Scholar] [CrossRef] [Scilit]
- Khalil, R.A.; Safelnasr, Z.; Yemane, N.; Kedir, M.; Shafiqurrahman, A.; Saeed, N. Advanced Learning Technologies for Intelligent Transportation Systems: Prospects and Challenges. IEEE Open J. Veh. Technol. 2024, 5, 397–427. [Google Scholar] [CrossRef] [Scilit]
- Wang, X.; Wang, M.; Liu, X.; Glade, T.; Chen, M.; Xie, Y.; Yuan, H.; Chen, Y. Rainfall observation using surveillance audio. Appl. Acoust. 2022, 186, 108478. [Google Scholar] [CrossRef] [Scilit]
- Wang, X.; Wang, M.; Liu, X.; Zhu, L.; Glade, T.; Chen, M.; Zhao, W.; Xie, Y. A novel quality control model of rainfall estimation with videos—A survey based on multi-surveillance cameras. J. Hydrol. 2022, 605, 127312. [Google Scholar] [CrossRef] [Scilit]
- Wang, X.; Wang, M.; Liu, X.; Zhu, L.; Shi, S.; Glade, T.; Chen, M.; Xie, Y.; Wu, Y.; He, Y. Near-infrared surveillance video-based rain gauge. J. Hydrol. 2023, 618, 129173. [Google Scholar] [CrossRef] [Scilit]
- Wang, X.; Zhao, K.; Chen, H.; Zhou, A.; Zhao, J.; Shi, S.; Glade, T. Estimating rainfall intensity from surveillance audio: A hybrid model-data-driven framework. J. Hydrol. 2025, 659, 133295. [Google Scholar] [CrossRef] [Scilit]
- Inigo, R.M. Traffic Monitoring and Control Using Machine Vision: A Survey. IEEE Trans. Ind. Electron. 1985, IE-32, 177–185. [Google Scholar] [CrossRef] [Scilit]
- Kuehnle, A.; Burghout, W. Winter Road Condition Recognition Using Video Image Classification. Transp. Res. Rec. 1998, 1627, 29–33. [Google Scholar] [CrossRef] [Scilit]
- Lagorio, A.; Grosso, E.; Tistarelli, M. Automatic Detection of Adverse Weather Conditions in Traffic Scenes. In Proceedings of the 2008 IEEE Fifth International Conference on Advanced Video and Signal Based Surveillance, 1–3 September 2008; IEEE: New York, NY, USA, 2008; pp. 273–279. [Google Scholar]
- Medina, J.; Chitturi, M.; Benekohal, R. Effects of fog, snow, and rain on video detection systems at intersections. Transp. Lett. 2010, 2, 1–12. [Google Scholar] [CrossRef] [Scilit]
- Khan, M.N.; Ahmed, M.M. Weather and surface condition detection based on road-side webcams: Application of pre-trained Convolutional Neural Network. Int. J. Transp. Sci. Technol. 2022, 11, 468–483. [Google Scholar] [CrossRef] [Scilit]
- Nolte, M.; Kister, N.; Maurer, M. Assessment of Deep Convolutional Neural Networks for Road Surface Classification. In Proceedings of the 2018 21st International Conference on Intelligent Transportation Systems (ITSC), 4–7 November 2018; IEEE: New York, NY, USA, 2018; pp. 381–386. [Google Scholar]
- Moroto, Y.; Maeda, K.; Ogawa, T.; Haseyama, M. Snow- or ice-covered road detection in winter road surface conditions using deep neural networks. Comput.-Aided Civ. Infrastruct. Eng. 2024, 39, 2935–2950. [Google Scholar] [CrossRef] [Scilit]
- Jonsson, P.; Casselgren, J.; Thörnberg, B. Road Surface Status Classification Using Spectral Analysis of NIR Camera Images. IEEE Sens. J. 2015, 15, 1641–1656. [Google Scholar] [CrossRef] [Scilit]
- Zhu, X.; He, X.; Ramezanpourkami, M.; Wu, Y.; Zhang, K.; Yang, X. Roadway Ice/Snow Detection using a Novel Infrared Thermography Technology. 2024. Available online: https://www.intrans.iastate.edu/wp-content/uploads/2024/02/rdway_ice_snow_detection_IR_tech_w_cvr.pdf (accessed on 19 April 2026).
- Zhang, C.; Nateghinia, E.; Miranda-Moreno, L.F.; Sun, L. Winter road surface condition classification using convolutional neural network (CNN): Visible light and thermal image fusion. Can. J. Civ. Eng. 2021, 49, 569–578. [Google Scholar] [CrossRef] [Scilit]
- Carrillo, J.; Crowley, M.; Pan, G.; Fu, L. Design of Efficient Deep Learning models for Determining Road Surface Condition from Roadside Camera Images and Weather Data. arXiv 2020, arXiv:2009.10282. [Google Scholar] [CrossRef] [Scilit]
- Kadav, P.; Goberville, N.A.; Prins, K.; Siems-Anderson, A.; Walker, C.; Motallebiaraghi, F.; Carow, K.; Fanas Rojas, J.; Hong, G.Y.; Asher, Z. Road Snow Coverage Estimation Using Camera and Weather Infrastructure Sensor Inputs. In Proceedings of the WCX SAE World Congress Experience, 18–20 April 2023; SAE: Warrendale, PA, USA, 2023. [Google Scholar]
- Yang, S.; Lei, C. Research on the Classification Method of Complex Snow and Ice Cover on Highway Pavement Based on Image-Meteorology-Temperature Fusion. IEEE Sens. J. 2024, 24, 1784–1791. [Google Scholar] [CrossRef] [Scilit]
- Pan, G.; Fu, L.; Yu, R.; Muresan, M. Evaluation of Alternative Pre-trained Convolutional Neural Networks for Winter Road Surface Condition Monitoring. In Proceedings of the 2019 5th International Conference on Transportation Information and Safety (ICTIS), 14–17 July 2019; ICTIS: Gujarat, India, 2019; pp. 614–620. [Google Scholar]
- Landry, F.G.; Akhloufi, M.A. Deep Learning and Computer Vision Techniques for Estimating Snow Coverage on Roads using Surveillance Cameras. In Proceedings of the 2022 18th IEEE International Conference on Advanced Video and Signal Based Surveillance (AVSS), 29 November–2 December 2022; IEEE: New York, NY, USA, 2022; pp. 1–8. [Google Scholar]
- Takeuchi, K.; Kawai, S.; Shibata, K.; Horita, Y. Distinction of winter road surface conditions using road surveillance camera. In Proceedings of the 2012 12th International Conference on ITS Telecommunications, 5–8 November 2012; ITS: Tokyo, Japan, 2012; pp. 663–667. [Google Scholar]
- Qian, Y.; Almazan, E.J.; Elder, J.H. Evaluating features and classifiers for road weather condition analysis. In Proceedings of the 2016 IEEE International Conference on Image Processing (ICIP), 25–28 September 2016; IEEE: New York, NY, USA, 2016; pp. 4403–4407. [Google Scholar]
- Kawai, S.; Takeuchi, K.; Shibata, K.; Horita, Y. A Smart Method to Distinguish Road Surface Conditions at Night-time using a Car-Mounted Camera. IEEJ Trans. Electron. Inf. Syst. 2014, 134, 878–884. [Google Scholar] [CrossRef] [Scilit]
- Ozcan, K.; Sharma, A.; Knickerbocker, S.; Merickel, J.; Hawkins, N.; Rizzo, M. Road Weather Condition Estimation Using Fixed and Mobile Based Cameras. In Proceedings of the Advances in Computer Vision; Springer: Cham, Switzerland, 2020; pp. 192–204. [Google Scholar]
- Takase, T.; Takahashi, S.; Hagiwara, T.; Ohiro, T.; Iwasaki, Y.; Mori, T.; Hanatsuka, Y. An Estimation Method of Road Surface Condition on Winter Expressway via Mobile Nets using In-vehicle Camera Images. In Proceedings of the 2021 IEEE 10th Global Conference on Consumer Electronics (GCCE), 12–15 October 2021; IEEE: New York, NY, USA, 2021; pp. 109–110. [Google Scholar]
- Ishizuki, M.; Takahashi, S.; Hagiwara, T.; Ishii, K.; Iwasaki, Y.; Mori, T.; Hanatsuka, Y. Image and CAIS Features-Based Estimation of Road Surface Condition on Winter Local Road. In Proceedings of the 2022 IEEE 11th Global Conference on Consumer Electronics (GCCE), 18–21 October 2022; IEEE: New York, NY, USA, 2022; pp. 79–80. [Google Scholar]
- Omer, R.; Fu, L. An automatic image recognition system for winter road surface condition classification. In Proceedings of the 13th International IEEE Conference on Intelligent Transportation Systems, 19–22 September 2010; IEEE: New York, NY, USA, 2010; pp. 1375–1379. [Google Scholar]
- Karaa, M.; Ghazzai, H.; Sboui, L. ViSnow: Snow-Covered Urban Roads Dataset for Computer Vision Applications. IEEE Open J. Syst. Eng. 2024, 2, 62–70. [Google Scholar] [CrossRef] [Scilit]
- Pei, Y.; Lu, J.; Xiao, H.; Chen, Z.; Li, W. A classification model of road accumulated snow severity based on the fusion of DeepLabV3 + and U-Net. Road Mater. Pavement Des. 2025, 26, 1315–1336. [Google Scholar] [CrossRef] [Scilit]
- Sakaino, H. PanopticRoad: Integrated Panoptic Road Segmentation Under Adversarial Conditions. In Proceedings of the IEEE/CVF Conference on Computer Vision and Pattern Recognition (CVPR) Workshops, June 2023; IEEE: New York, NY, USA, 2023; pp. 3591–3603. [Google Scholar]
- Simonyan, K.; Zisserman, A. Very Deep Convolutional Networks for Large-Scale Image Recognition. arXiv 2014, arXiv:1409.1556. [Google Scholar] [CrossRef] [Scilit]
- He, K.; Zhang, X.; Ren, S.; Sun, J. Deep Residual Learning for Image Recognition. In Proceedings of the IEEE Conference on Computer Vision and Pattern Recognition (CVPR), June 2016; IEEE: New York, NY, USA, 2016. [Google Scholar]
- Huang, G.; Liu, Z.; van der Maaten, L.; Weinberger, K.Q. Densely Connected Convolutional Networks. In Proceedings of the IEEE Conference on Computer Vision and Computer Vision (CVPR), 18–24 July 2017; IEEE: New York, NY, USA, 2017. [Google Scholar]
- Howard, A.G.; Zhu, M.; Chen, B.; Kalenichenko, D.; Wang, W.; Weyand, T.; Andreetto, M.; Adam, H. MobileNets: Efficient Convolutional Neural Networks for Mobile Vision Applications. arXiv 2017, arXiv:1704.04861. [Google Scholar] [CrossRef] [Scilit]
- Tan, M.; Le, Q. EfficientNet: Rethinking Model Scaling for Convolutional Neural Networks. In Proceedings of the 36th International Conference on Machine Learning, Virtual, 9–15 June 2019; pp. 6105–6114. [Google Scholar]
- Liu, Z.; Mao, H.; Wu, C.-Y.; Feichtenhofer, C.; Darrell, T.; Xie, S. A ConvNet for the 2020s. In Proceedings of the IEEE/CVF Conference on Computer Vision and Pattern Recognition (CVPR), June 2022; IEEE: New York, NY, USA, 2022; pp. 11976–11986. [Google Scholar]
- Dosovitskiy, A.; Beyer, L.; Kolesnikov, A.; Weissenborn, D.; Zhai, X.; Unterthiner, T.; Dehghani, M.; Minderer, M.; Heigold, G.; Gelly, S.; et al. An image is worth 16x16 words: Transformers for image recognition at scale. arXiv 2020, arXiv:2010.11929. [Google Scholar]
- Liu, Z.; Lin, Y.; Cao, Y.; Hu, H.; Wei, Y.; Zhang, Z.; Lin, S.; Guo, B. Swin transformer: Hierarchical vision transformer using shifted windows. In Proceedings of the IEEE/CVF International Conference on Computer Vision; IEEE: New York, NY, USA, 2021; pp. 10012–10022. [Google Scholar]
- Yu, W.; Wang, X. Mambaout: Do we really need mamba for vision? In Proceedings of the IEEE/CVF Conference on Computer Vision and Pattern Recognition; IEEE: New York, NY, USA, 2025; pp. 4484–4496. [Google Scholar]
- Cohen, J. A coefficient of agreement for nominal scales. Educ. Psychol. Meas. 1960, 20, 37–46. [Google Scholar] [CrossRef] [Scilit]
- Fawcett, T. An introduction to ROC analysis. Pattern Recognit. Lett. 2006, 27, 861–874. [Google Scholar] [CrossRef] [Scilit]

Disclaimer/Publisher’s Note: The statements, opinions and data contained in all publications are solely those of the individual author(s) and contributor(s) and not of MDPI and/or the editor(s). MDPI and/or the editor(s) disclaim responsibility for any injury to people or property resulting from any ideas, methods, instructions or products referred to in the content. |
© 2026 by the authors. Licensee MDPI, Basel, Switzerland. This article is an open access article distributed under the terms and conditions of the Creative Commons Attribution (CC BY) license.