


Abstract
China’s rapid economic growth is partly due to the productivity gains from agglomeration, whereby firms and workers in larger and denser cities benefit from proximity through knowledge spillovers, thicker labor markets, and shared infrastructure. This study examines the changing nature and location of agglomeration economies in China using resident-based measures of urban scale from the 2000, 2010, and 2020 population censuses. Chinese “cities” are administrative jurisdictions that contain both dense urban districts and lower-density counties, so the agglomeration elasticities are estimated separately for districts and counties for a balanced panel of 298 prefectural jurisdictions. Agglomeration economies occur only in urban districts, while coefficients on urban scale for counties and county-level cities are close to zero or significantly negative. Moreover, district-level elasticities decline over time, from 0.24 in 2000 to 0.15 in 2020, assuming no feedback from productivity to urban scale. Allowing for such feedback, the temporal decline is even greater, from 0.24 in 2000 to 0.08 in 2020. However, urban growth is shifting increasingly toward counties rather than districts, foregoing the potential agglomeration effects. Changes in location of construction workers also shows this dispersed urban growth. Hence, recent urban growth is increasingly in locations without agglomeration benefits.
1. Introduction
Urbanization has been a central component of China’s economic transformation over the past four decades. A key mechanism linking urbanization to economic growth is structural transformation, whereby labor moves from low-productivity agriculture into higher-productivity industrial and service activities, consistent with the dual-sector framework originally proposed by Lewis [1]. In China, the large-scale migration of rural workers into urban employment has been associated with increases in labor productivity and national income, with urbanization widely viewed as closely linked to economic development [2]. Beyond this structural shift, urbanization is also associated with additional productivity gains through agglomeration economies. When firms and workers are located in larger and denser cities, they benefit from proximity through mechanisms such as knowledge spillovers, improved labor-market matching, and shared infrastructure [3,4]. Related research in urban science and complex systems has documented systematic scaling relationships between city size and economic activity, innovation, and infrastructure [5,6]. Understanding where these agglomeration benefits arise within China’s urban system is therefore important for assessing the economic consequences of continuing urban development.
Urbanization can generate particularly large productivity gains when population growth is concentrated in larger cities, where agglomeration forces are strongest. Empirical research has consistently found that productivity (usually measured in terms of either GDP per resident or per worker, or by wages) tends to increase with city size, reflecting both agglomeration economies and urban scaling relationships documented across countries and sectors [3,4,5,6,7]. In the Chinese context, this relationship has attracted considerable attention because many cities historically remained smaller than the size predicted to maximize productivity. Au and Henderson showed that institutional constraints, including migration restrictions and land-use policies, limited the expansion of large cities and reduced the potential gains from agglomeration [8]. More broadly, China’s urban system differs from those in many countries because official “cities” are administrative jurisdictions rather than functional metropolitan areas, often encompassing extensive rural territory alongside dense urban cores [9]. These institutional features complicate the measurement of urban scale and the identification of agglomeration effects, particularly when economic activity is distributed unevenly between urban districts and surrounding counties.
The spatial scale of Chinese administrative “cities” can be extremely large, making it difficult to interpret city-level statistics as measures of functional urban areas. For example, the municipality of Chongqing covers a territory roughly comparable in size to the country of Austria and includes both extremely dense urban districts and sparsely populated rural counties. Population density in Chongqing ranges from over 25,000 people per km2 in the urban core to under 100 per km2 in counties in the mountainous northeast. More generally, most of China is organized into second subnational units of prefectural-level cities (dijishi) that encompass several types of third-level administrative units, including urban districts (shiqu), county-level cities (xianji shi), and counties (xian). Four large municipalities—Beijing, Tianjin, Shanghai, and Chongqing—are formally first-level provincial units but are treated here as equivalent to prefectural-level cities because they contain the same internal administrative hierarchy. In other words, even though these prefectural jurisdictions include the word ‘city’ in their name, they often extend far beyond the built-up urban area and therefore combine dense urban centers with much lower density hinterland [9]. These components differ greatly in both population density and economic structure. For example, the mean population density of urban districts is approximately five times higher than for county-level cities and almost ten times higher than for counties, reflecting their role as the urban core of prefectural jurisdictions [10]. Consequently, using prefectural cities as units for studying agglomeration effects may obscure important variation in economic activity within these jurisdictions [11], and instead it is more appropriate to distinguish between districts and counties when identifying where agglomeration economies arise within China’s urban system. Note also that references below to growth shifting toward “lower-density areas” are descriptive of the administrative units where population growth and building activity is occurring, rather than a statement about the preferred scale variable in the agglomeration regressions.
A further complication in measuring urban scale in China arises from the way population and employment statistics are reported in many official statistical sources. Annual statistical yearbooks frequently report population based on the household registration (hukou) system rather than the number of people actually living in a location. Because large numbers of migrants live and work outside their place of registration, particularly in major urban centers, hukou-based statistics can substantially misrepresent the size of urban labor markets. Similar measurement issues arise for employment statistics. In some statistical yearbooks, employment counts are derived largely from administrative records for state-owned or formally registered enterprises, meaning that large segments of the private and informal sectors may be only partially captured. These features of China’s statistical system complicate attempts to measure both the scale of cities and the size of their labor forces using annual administrative data sources [12]. To avoid these problems, this study relies on resident population counts and employment statistics from the national population censuses conducted in 2000, 2010, and 2020. Census data record the de facto population living in each locality and therefore provide a more reliable measure of urban scale for evaluating agglomeration effects.
To examine where agglomeration economies arise within China’s urban system, this study constructs a balanced panel covering three census years—2000, 2010, and 2020—for 298 prefectural-level jurisdictions. The administrative structure described above is used to distinguish between dense urban cores and the surrounding lower-density areas. All urban districts within a prefectural jurisdiction are combined to form a single “district” observation, reflecting the fact that the China City Statistical Yearbook reports economic data for districts only in aggregated form at the prefectural level. Counties and county-level cities are combined into a second category representing non-core urban areas. This aggregation yields 298 district observations and 278 county or county-level city observations in each census year, reflecting that a few prefectures contain only districts. Measures of urban scale are based on resident population from the population censuses, while economic activity is measured using data on the secondary and tertiary sectors from the China City Statistical Yearbook. Agglomeration economies are estimated using the standard elasticity specification relating the logarithm of productivity—measured either as GDP per urban resident or GDP per worker in the secondary and tertiary sectors—to the logarithm of urban population. Estimating these relationships separately for districts and counties allows the analysis to identify whether agglomeration effects arise primarily in dense urban cores or also in the lower-density areas contained within prefectural jurisdictions.
The results reveal two striking patterns in the geography of agglomeration economies in China. First, statistically significant agglomeration effects are observed only in urban districts, which correspond to the dense cores of prefectural jurisdictions. In contrast, coefficients on urban scale for counties and county-level cities are generally not statistically different from zero, or are even negative, indicating that productivity in these lower-density areas does not systematically increase with urban population size. Second, the magnitude of agglomeration effects within districts declines over time. Estimates based on ordinary least squares suggest that the elasticity of productivity with respect to urban scale falls from approximately 0.24 in 2000 to about 0.15 by 2020. When potential feedback from productivity to population size is addressed using instrumental variables, the decline is even larger, with elasticities falling from around 0.24 in 2000 to roughly 0.08 in 2020. These patterns suggest that agglomeration benefits remain concentrated in dense urban cores but have weakened over the past two decades.
These findings raise an important question about the recent geography of urban development in China. While agglomeration economies remain concentrated in dense urban districts, population growth and construction activity have increasingly shifted toward counties and smaller cities within prefectural jurisdictions. Evidence from census occupation data shows that the spatial distribution of construction workers has moved in the same direction: whereas the majority of construction employment was located in urban districts in 2000, by 2020 a larger share was located in counties. This shift suggests that a growing share of new urban development is occurring outside the dense urban cores where agglomeration benefits are strongest (and the link with changes in construction employment is validated with satellite observations on two decades of change in built-up area and nighttime lights). Consequently, recent patterns of urban growth appear increasingly consistent with a dispersed form of urbanization in which population and construction expand in lower-density areas, potentially limiting the productivity gains typically associated with agglomeration economies.
2. Materials and Methods
The analysis covers the parts of China organized as prefectural-level jurisdictions, including the four provincial-level municipalities of Beijing, Tianjin, Shanghai, and Chongqing, which are treated here as equivalent to prefectural-level cities because they contain the same internal administrative hierarchy discussed above [9]. In the 2020 census, these jurisdictions accounted for 96.7% of China’s resident population [13]. The dataset is constructed as a spatially balanced panel for three census years—2000, 2010, and 2020—covering 298 prefectural jurisdictions. To maintain consistent spatial units over time, administrative splits that occurred after 2000 are reversed so that newly created districts, counties, or county-level cities are reaggregated to their earlier boundary definition. Within each prefectural jurisdiction, districts are merged to represent the urban core or city proper, following the standard approach in the China urban literature [14]. This merged-district definition is widely used in empirical work on Chinese cities and corresponds closely to the core urban areas identified in recent spatial analyses of Chinese metropolitan regions [15]. Counties and county-level cities are combined into a second category representing non-core urban areas. This yields 298 district observations and 278 county or county-level city observations in each census year, reflecting the fact that a few prefectural jurisdictions contain only districts.
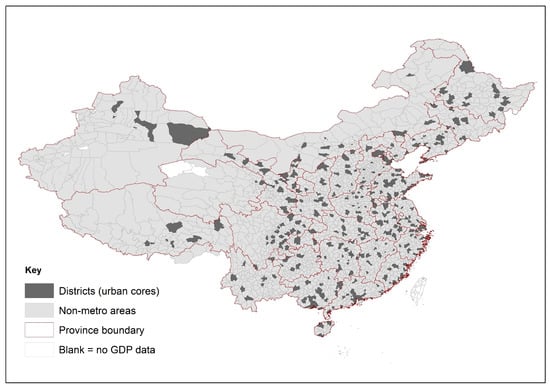
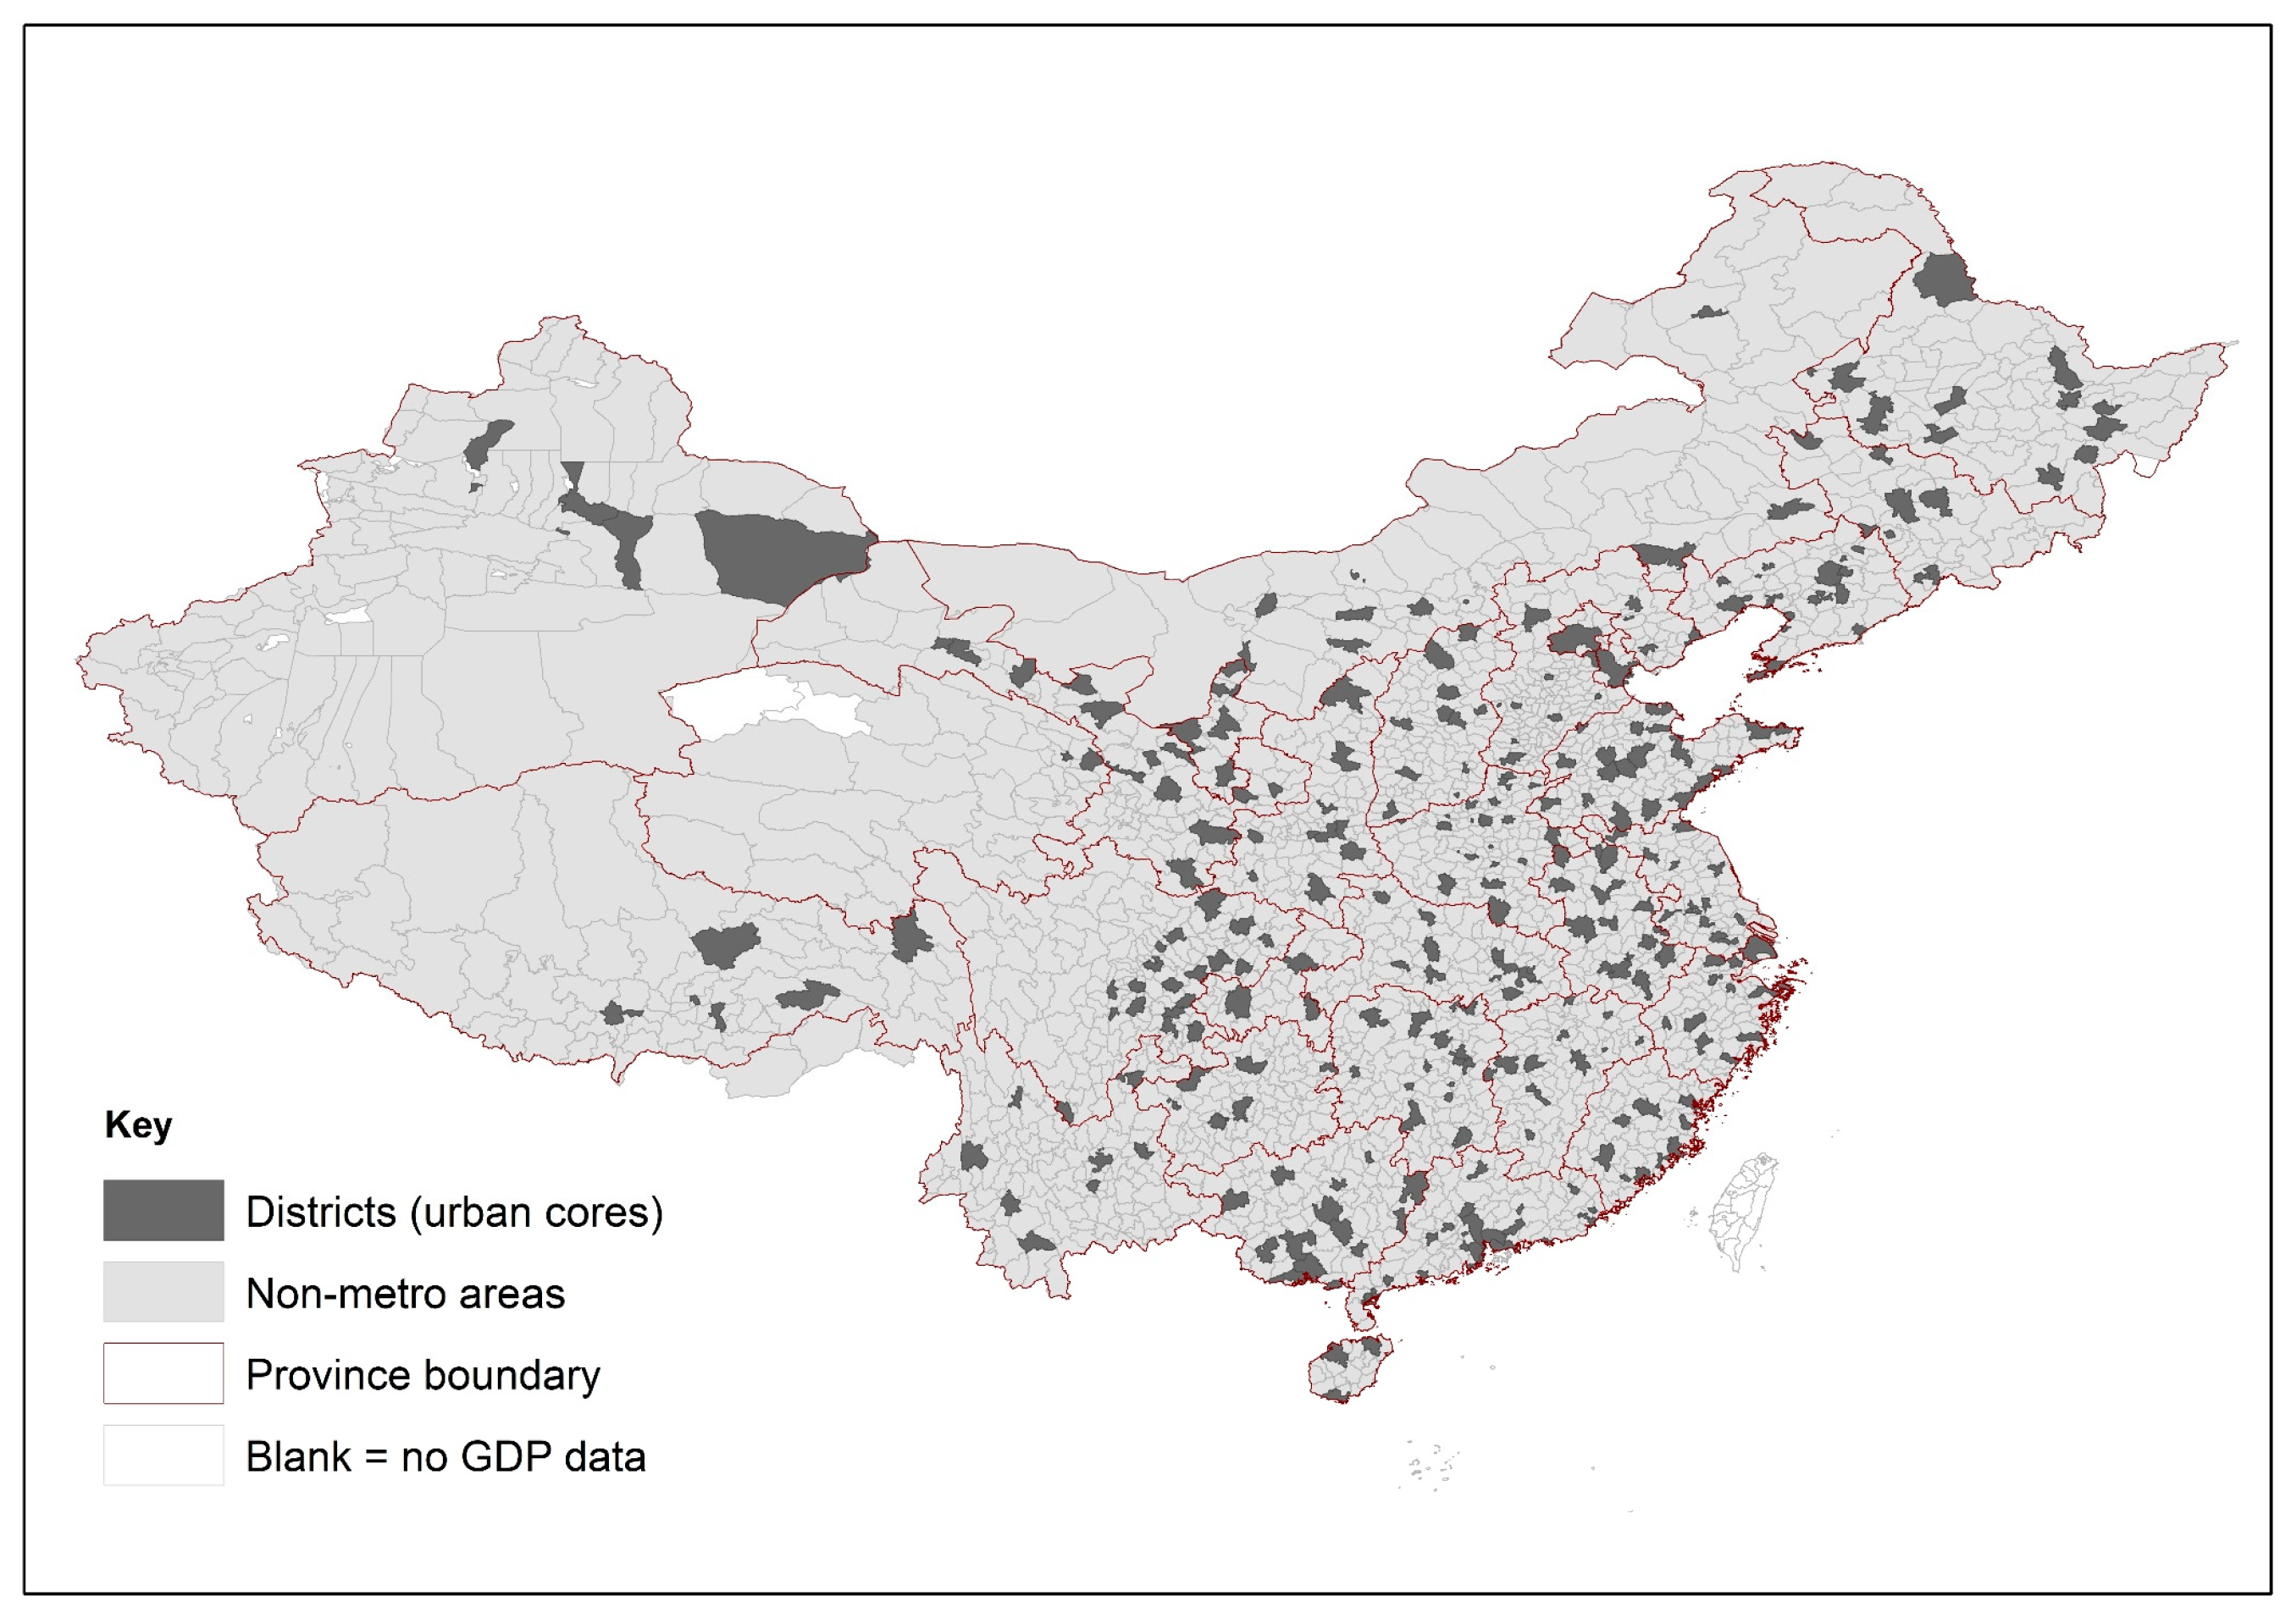
Figure 1 provides a spatial overview of the units used in the analysis, distinguishing between the district-based urban cores and the surrounding non-core areas within each prefectural jurisdiction. The urban cores are defined as the merged districts, while the non-core areas consist of the merged counties and county-level cities. For ease of exposition, the merged counties and county-level cities (MCCC) are also referred to as “non-metro areas” in the cartographic representation, to distinguish them from the district-based urban cores. The figure illustrates the nationwide coverage of the 298 prefectural jurisdictions and highlights the spatial distribution of these two components of China’s administrative urban system.
Figure 1.
Spatial distribution of urban cores and non-metro areas across China’s prefectural jurisdictions. Urban cores are defined as merged districts within each prefecture, while non-metro areas correspond to merged counties and county-level cities.
Although districts are commonly treated as representing the urban core of a prefectural jurisdiction, China’s administrative upgrading process means that some counties recently reclassified as districts retain predominantly non-urban characteristics. To avoid overstating the extent of the urban core, the merged-district definition used here generally includes only those districts that existed prior to 2000, rather than counties that were subsequently upgraded to district status. In contrast, for prefectures that were themselves established more recently, the urban core typically corresponds to the county or county-level city that served as the administrative center before being upgraded to district status. This approach reflects the institutional evolution of China’s urban administrative system and helps ensure that the district category corresponds to areas with established urban functions rather than administrative reclassification alone [16].
Population and employment data are drawn from the national population censuses conducted in 2000, 2010, and 2020 by the National Bureau of Statistics (NBS) [17,18,19]. These censuses provide detailed tabulations for counties, county-level cities, and districts, including resident population, urban and rural population, household characteristics, and sectoral employment. The resident population measure follows the census definition based on a six-month residency rule, whereby individuals are counted in the locality where they have lived for at least six months, regardless of their household registration (hukou) status. This definition captures the de facto spatial distribution of the population and is particularly important in China given the large scale of internal migration. Employment data come from the long-form census tables (10% sample), which report employment by major industry groups such as agriculture, mining, manufacturing, construction, transport, wholesale and retail trade, finance, and public services. These tabulations allow consistent measurement of employment structure across administrative units and census years. Because the census employment tables report employment by place of residence rather than workplace, the resulting measures reflect the spatial distribution of the labor force across districts and counties within each prefectural jurisdiction.
Gross domestic product (GDP) data for districts, counties, and county-level cities are compiled from several statistical publications issued by the National Bureau of Statistics (NBS). Three main sources are used: annual editions of the China Statistical Yearbook (County-Level) (in Chinese, Zhongguo Xianyu Tongji Nianjian (Xianshi Juan)), annual editions of the China City Statistical Yearbook (Zhongguo Chengshi Tongji Nianjian), and statistical yearbooks published by individual provinces or cities (for example, the Beijing Statistical Yearbook) [20,21,22]. These different publications are required because GDP statistics for different types of administrative units are reported in separate statistical sources; for example, the annual GDP of districts typically appears in city statistical yearbooks, whereas GDP of counties and county-level cities appears in the county-level yearbooks. Each yearbook edition reports GDP for the previous year, so the 2001, 2011, and 2021 editions are used to obtain GDP data corresponding to the 2000, 2010, and 2020 census years.
In addition to the census measures of sectoral employment described above, satellite-based indicators are used to provide independent measures of urban expansion and economic activity. Specifically, changes in construction employment recorded in the census long-form tables are compared with remotely sensed indicators of the physical expansion of built-up land and of nighttime lights (which reflect vertical and horizontal urban growth) so as to verify that the location of changes in construction employment is also where building activity is greatest. Due to the changing vintages of nighttime light sensors, two datasets are employed. For the earlier period, we use the radiance-calibrated DMSP-OLS (Defense Meteorological Satellite Program–Operational Linescan System), designed to overcome saturation effects in brightly-lit urban cores [23]. For the later period, we use the Black Marble nighttime lights data derived from the VIIRS sensor, which offer improved spatial resolution and radiometric calibration and have been shown to track local economic activity in China at the county/district level [24]. To complement the NTL measures, we also use satellite-based land-cover data to measure the physical expansion of built-up areas, aggregated to the same county and county-level city units used for the census construction employment data. These data come from the European Space Agency Climate Change Initiative (ESA CCI) global land-cover dataset, which provides a temporally consistent global product with 30 m spatial resolution [25]. The ESA CCI dataset classifies 37 land-cover categories; in this study, we aggregate the categories associated with urban or built-up land uses to measure the expansion of built-up area in the non-core portions of each prefectural jurisdiction, corresponding to the counties and county-level cities surrounding the core urban districts. Previous validation studies show that ESA CCI provides an improved representation of land-cover distribution relative to several alternative global datasets [25]. Together, these satellite datasets allow the spatial distribution of construction activity recorded in the census to be compared with independent measures of urban expansion and nighttime economic activity.
Agglomeration elasticities are first estimated using ordinary least squares (OLS), relating the logarithm of productivity—measured either as GDP per urban resident or GDP per worker in the secondary and tertiary sectors—to the logarithm of resident urban population. However, the observed correlation between city size and productivity need not be causal, because of potential feedback between productivity and population size, as more productive places may attract workers and residents. In econometric terms, this feedback creates an endogeneity problem, while omitted characteristics such as historical advantages or infrastructure may also affect both urban scale and output [26]. To address this endogeneity problem, the analysis also uses an instrumental variables (IV) approach. The IV method in this context isolates variation in urban scale that is plausibly unrelated to contemporaneous productivity shocks. The IV method is widely used in empirical research to identify causal effects when explanatory variables are endogenous [27]. The instrument used here is the pre-2000 non-agricultural hukou population, which reflects the planned-era allocation of urban scale and continues to predict subsequent resident population because of the persistence of settlement patterns, transport networks, inherited registration status, and established urban infrastructure. In the district–county framework, the instrument is constructed separately for the two components of each prefectural jurisdiction. The first stage is strong throughout, with very high Kleibergen–Paap rk Wald F statistics in all specifications, indicating that historical non-agricultural hukou population remains a powerful predictor of current urban scale [28]. The IV estimates are reported separately for districts (representing the urban core) and for the surrounding counties and county-level cities, allowing the strength of agglomeration effects to be compared between the established urban core and the expanding non-core areas.
The empirical approach follows a structured sequence designed to link agglomeration patterns to the spatial evolution of urban growth. The analysis begins by estimating agglomeration elasticities separately for urban cores (merged districts) and non-core areas (merged counties and county-level cities). It then evaluates the robustness of these contrasts across alternative specifications and productivity measures. The next step examines sectoral differences between industry and services to assess whether agglomeration effects vary by type of economic activity. Finally, the analysis relates these patterns to the geography of recent urban expansion by combining census-based measures of population and construction employment with satellite indicators of built-up area and nighttime lights.
3. Results
3.1. Agglomeration Elasticities for GDP per Urban Resident
Table 1 reports OLS estimates of agglomeration elasticities for non-agricultural GDP per urban resident, where non-agricultural GDP refers to the combined output of the secondary and tertiary sectors. Separate regressions are estimated for the merged districts in prefecture-level cities and for the merged counties and county-level cities, in each of 2000, 2010, and 2020. The seemingly unrelated regression (SUR) estimator is used to test for the equality of coefficients across these regression equations.
Table 1.
OLS estimates of agglomeration elasticity of GDP per urban resident with respect to urban scale.
The results reveal a clear contrast between the two types of administrative units. In central districts, the elasticity of GDP per urban resident with respect to urban population is positive and statistically significant in all three years, though it declines from 0.243 in 2000 to 0.154 in 2020. This implies that larger urban districts exhibit higher productivity, consistent with agglomeration economies, but that the strength of this relationship has weakened over time. In contrast, the estimated elasticities for counties and county-level cities are small and mostly statistically insignificant. The cross-sectional tests reported in Panel C confirm that district elasticities are significantly larger than those for counties in each census year. The temporal tests further indicate a significant decline in the district elasticity between 2000 and 2020, while no comparable change is detected for counties.
The declining elasticity observed for districts suggests that the productivity advantages associated with larger urban populations have weakened over the past two decades. One possible explanation is that the spatial expansion of urban activity in prefecture-level cities has shifted from the urban core toward surrounding counties and county-level cities, reducing the concentration of industrial and services production within central districts. In large metropolitan regions such as Beijing, this decentralization may also have been reinforced by successive city master plans that promote the relocation of population and economic functions from the historic core to suburban sub-centers such as Tongzhou and to satellite cities within the wider Beijing–Tianjin–Hebei region. These patterns are consistent with the broader evolution of China’s urban system, where metropolitan growth increasingly involves the expansion of economic activity beyond the traditional urban cores.
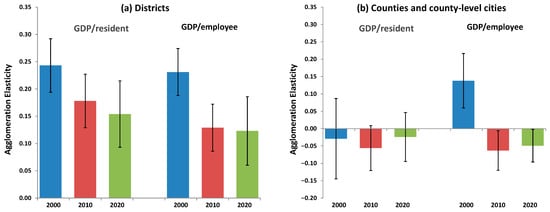
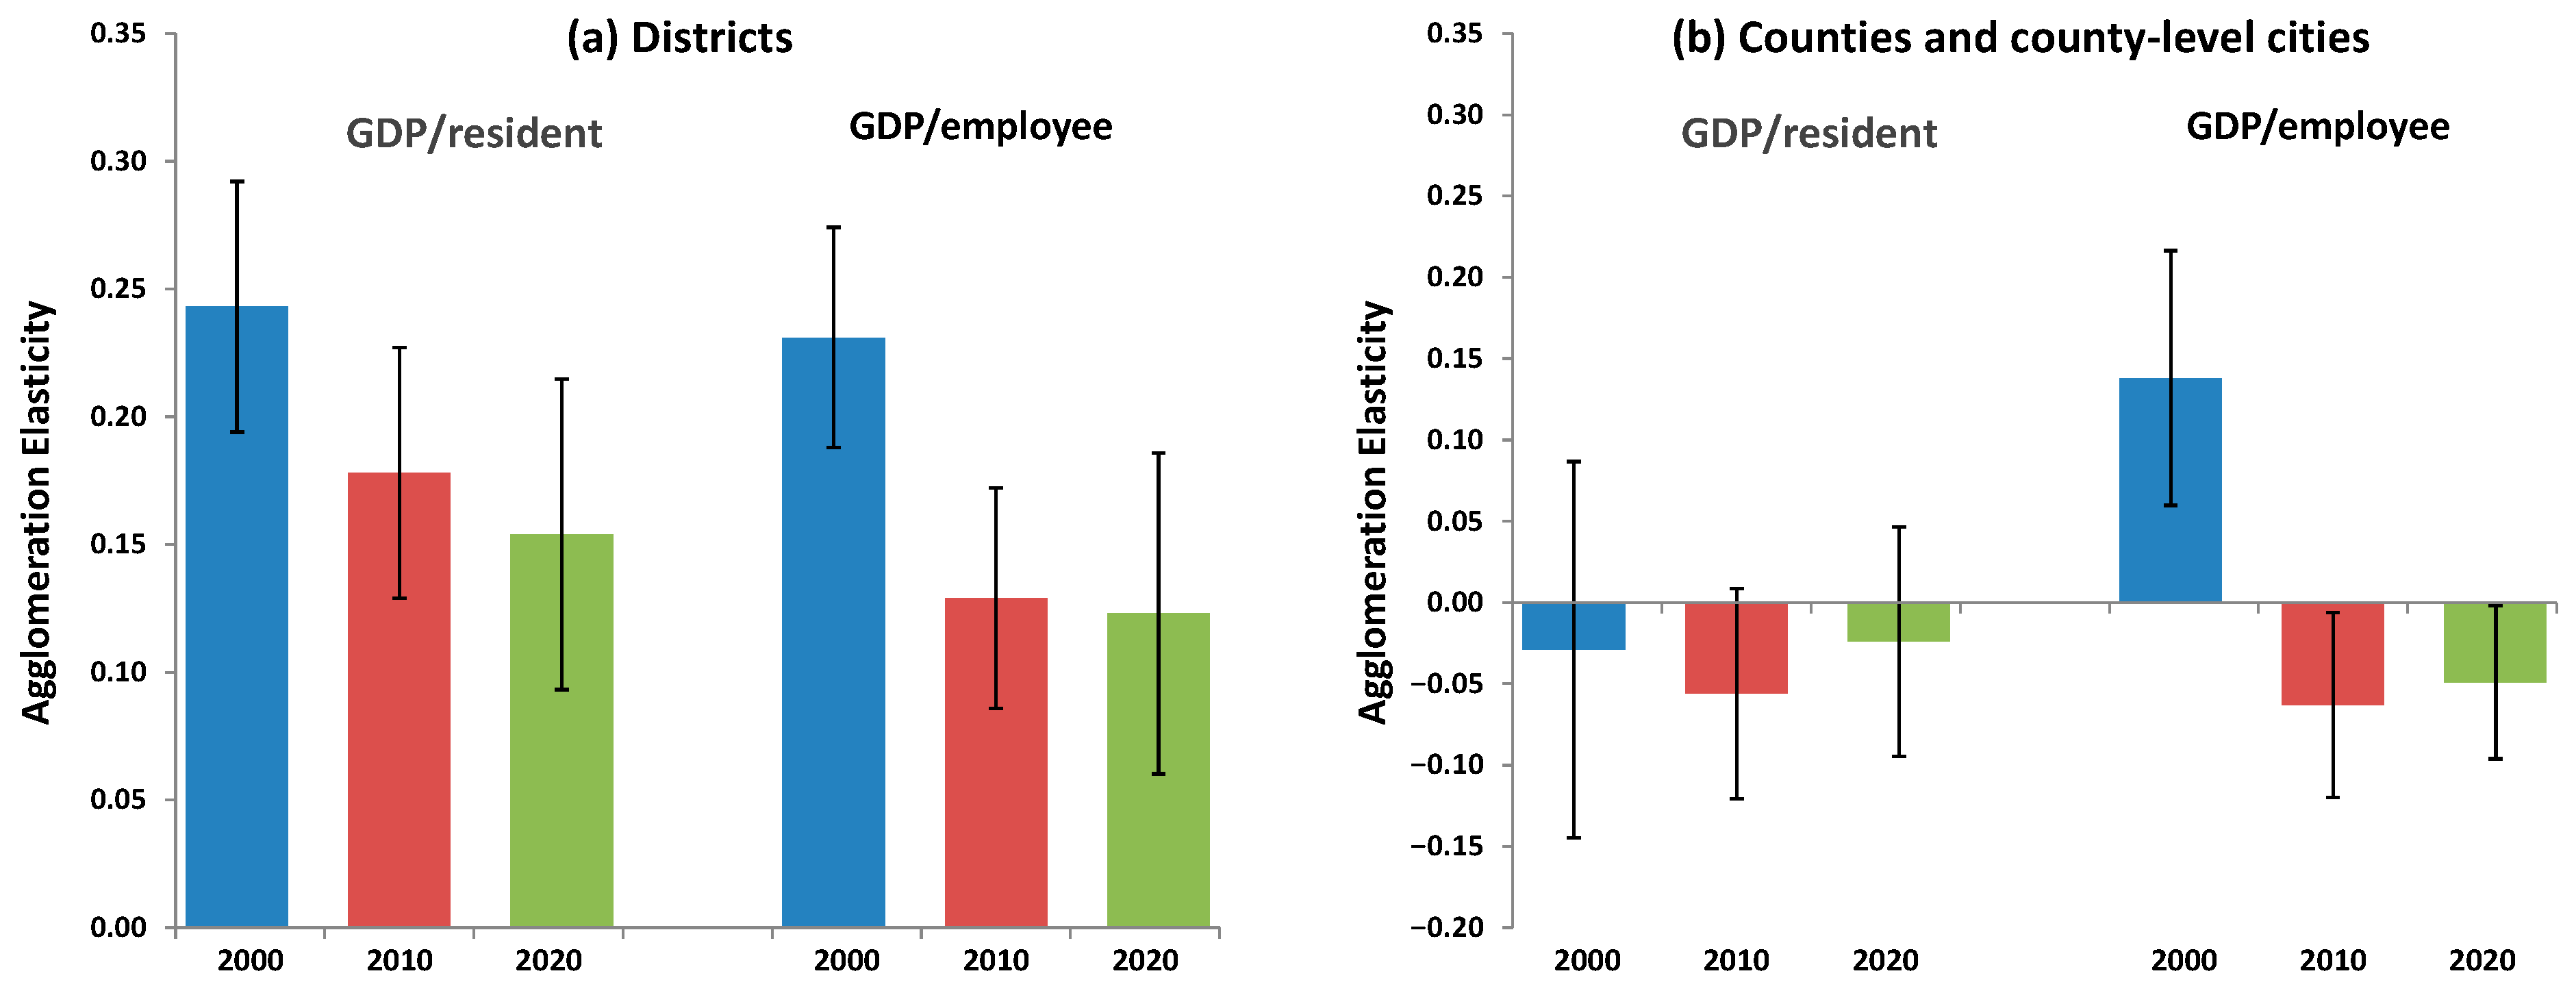
Figure 2 provides robustness checks for the OLS estimates using an alternative measure of productivity. Panel (a) reports results for merged districts and Panel (b) for merged counties and county-level cities, with elasticities estimated using both non-agricultural GDP per urban resident and GDP per employee in the secondary and tertiary sectors. For districts, the elasticity estimates are very similar under the two measures, although the series based on GDP per worker shows a sharper decline between 2000 and 2010. With the exception of GDP per worker estimates for counties and county-level cities in 2000, the other elasticities for the non-core areas remain close to zero under both specifications. These results indicate that the much lower elasticity in counties and county-level cities, as well as the declining agglomeration elasticity in districts, is not sensitive to whether output is normalized by urban population or by employment in the non-agricultural sectors.
Figure 2.
Robustness of OLS estimates of agglomeration elasticities using alternative measures of economic output. (a) Agglomeration elasticities for merged districts estimated using non-agricultural GDP per urban resident and GDP per employee in the secondary and tertiary sectors, for 2000, 2010, and 2020; (b) Corresponding estimates for merged counties and county-level cities. Error bars show 95% confidence intervals.
3.2. Instrumental Variables Estimates of Agglomeration Elasticities
The OLS estimates in Table 1 and Figure 2 may be affected by feedback from productivity to urban population, if more productive locations attract workers and firms and thereby increase city size. To address this endogeneity concern, Table 2 reports instrumental variable (IV) estimates of the agglomeration elasticity using the same specification as in Table 1. The logarithm of urban resident population in each of the census years is instrumented using the number of non-agricultural hukou holders for the same place but recorded prior to the 2000 census. This variable reflects historically determined administrative allocations of urban residence status that influenced the spatial distribution of population in the planned economy era but are plausibly exogenous to contemporary productivity shocks. The IV specification is estimated separately for districts and for counties and county-level cities in each census year, and the resulting coefficients are compared using the same SUR-based tests of coefficient equality described earlier.
Table 2.
Instrumental variable estimates of the agglomeration elasticity of GDP per urban resident with respect to urban scale.
The instrumental variable estimates reinforce the contrast between districts and county areas but indicate an even sharper decline in agglomeration elasticities over time. For districts, the estimated elasticity is similar to the OLS benchmark in 2000 but falls substantially in subsequent years, reaching around 0.08 by 2020. This pattern suggests that part of the positive association between city size and productivity in the OLS results reflects feedback from productivity to population growth. Once this feedback is addressed using the historical hukou-based instrument, the estimated agglomeration effects in later years are considerably smaller. In contrast, the IV estimates for counties and county-level cities remain close to zero in 2000 and statistically negative in 2010 and 2020. The cross-sectional tests again confirm that elasticities in districts are significantly larger than those in counties, while the temporal tests indicate a significant decline in the agglomeration elasticity for districts between 2000 and 2020.
3.3. Robustness of Instrumental Variables Estimates
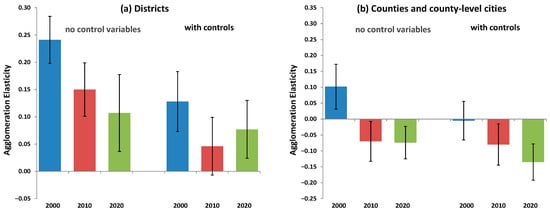
The instrumental variable estimates reported in Table 2 are subject to two additional robustness checks. First, productivity is alternatively measured using GDP per employee in the secondary and tertiary sectors rather than GDP per urban resident, mirroring the comparison shown earlier for the OLS estimates. Second, the IV regressions are re-estimated with additional control variables for schooling, employment rates, industrial structure, initial income levels, market access, and province fixed effects, where market access is proxied by distance to major ports and to other districts and counties. Figure 3 summarizes how the estimated agglomeration elasticities change across these alternative specifications for districts and for counties and county-level cities (using GDP per employee). Table 3 then reports the corresponding IV estimates with control variables using GDP per urban resident, allowing comparison with the parallel (no controls) results in Table 2.
Figure 3.
Robustness of instrumental variables estimates of agglomeration elasticities across alternative productivity measures and with and without control variables. (a) Results for merged districts; (b) results for merged counties and county-level cities. Elasticities are estimated using GDP per worker in the secondary and tertiary sectors, with and without additional controls for schooling, employment rates, industrial structure, initial income, market access, and province-fixed effects. Error bars show 95% confidence intervals.
Table 3.
Instrumental variable estimates of the agglomeration elasticity of GDP per urban resident with respect to urban population, including control variables.
Figure 3 shows that the main IV results are robust to both alternative productivity measures and the inclusion of controls. In districts, the estimated agglomeration elasticity remains positive under all specifications and continues to decline over time, from about 0.24 in 2000 to 0.11 in 2020, when productivity is measured as GDP per worker in the secondary and tertiary sectors. Adding controls for schooling, employment rates, industrial structure, initial income, market access, and province-fixed effects lowers the district elasticities further, to about 0.13 in 2000, 0.05 in 2010, and 0.08 in 2020, but it does not alter the overall downward pattern. In contrast, the corresponding estimates for counties and county-level cities are much smaller and become negative once worker-based productivity or controls are introduced. Thus, the robustness checks confirm both the weakening of agglomeration economies in urban districts and the continued absence of comparable positive scale effects in the surrounding county areas.
The IV estimates in Table 3 show that including the control variables reduces the magnitude of the estimated agglomeration elasticities but does not alter the main patterns observed in Table 2. For districts, the coefficients remain positive in all three census years, although the elasticities are smaller once differences in schooling, employment structure, initial income levels, market access, and provincial characteristics are taken into account. The declining pattern over time also broadly holds, suggesting the weakening relationship between urban scale and productivity is not driven by omitted observable characteristics of prefectural jurisdictions. In contrast, the coefficients for counties and county-level cities remain negative and statistically significant across all years. Thus, even after controlling for a wide range of regional characteristics, agglomeration economies continue to appear concentrated in dense urban districts rather than in the surrounding county areas.
3.4. Agglomeration Effects in Industry and Services
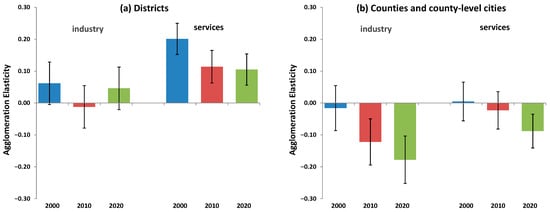
The robustness results reported above show that the estimated agglomeration elasticities follow a very similar pattern whether productivity is measured using GDP per urban resident or GDP per worker in the secondary and tertiary sectors. This equivalence is important because it allows the analysis to focus on worker-based productivity measures when examining sectoral differences in agglomeration effects. While resident population cannot be meaningfully divided into sector-specific groups, employment from the long-form census tables can be measured separately for industrial and service activities. Using employment-based productivity therefore makes it possible to compare how agglomeration economies differ between the secondary (industrial) and tertiary (service) sectors. Figure 4 presents instrumental variable estimates of agglomeration elasticities calculated separately for these two sectors in 2000, 2010 and 2020. A clear difference emerges: agglomeration elasticities are consistently larger for services than for industry. This pattern is consistent with the spatial characteristics of service activities, which often require close proximity between buyers and sellers, whereas many industrial activities can separate production from consumption through transport and supply chains.
Figure 4.
Agglomeration elasticities in industrial and service sectors, based on instrumental variables regressions of sectoral GDP per worker. Panel (a) reports results for merged districts and Panel (b) for merged counties and county-level cities. The figure compares agglomeration elasticities for the secondary (industrial) and tertiary (service) sectors across the 2000, 2010, and 2020 census years. Regressions include the Table 3 control variables. Error bars show 95% confidence intervals.
Figure 4 shows that agglomeration elasticities differ substantially between the industrial and service sectors. In districts, the elasticity for services consistently exceeds that for industry. The estimated agglomeration elasticity for services declines from about 0.20 in 2000 to roughly 0.11 in both 2010 and 2020; the corresponding estimates for industry are much smaller, ranging from −0.01 to 0.06. This contrast is consistent with the spatial characteristics of service activities, many of which require close proximity between producers and consumers and therefore benefit from dense urban environments. Industrial production, by contrast, more easily separates production from consumption through transport networks and supply chains, reducing the importance of local scale. In counties, the elasticities are small or negative for both sectors and become more negative over time, with industrial elasticities declining from −0.02 in 2000 to −0.18 in 2020 and service elasticities from 0.01 to −0.09. These results reinforce the earlier finding that positive agglomeration effects concentrate in dense urban districts rather than in the surrounding non-core areas.
3.5. Spatial Shift in Urban Growth Toward Smaller Urban Cores and County Areas
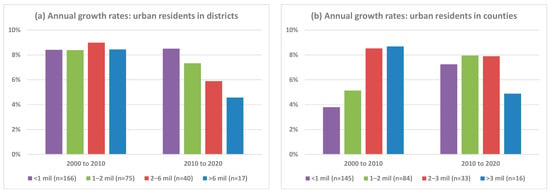
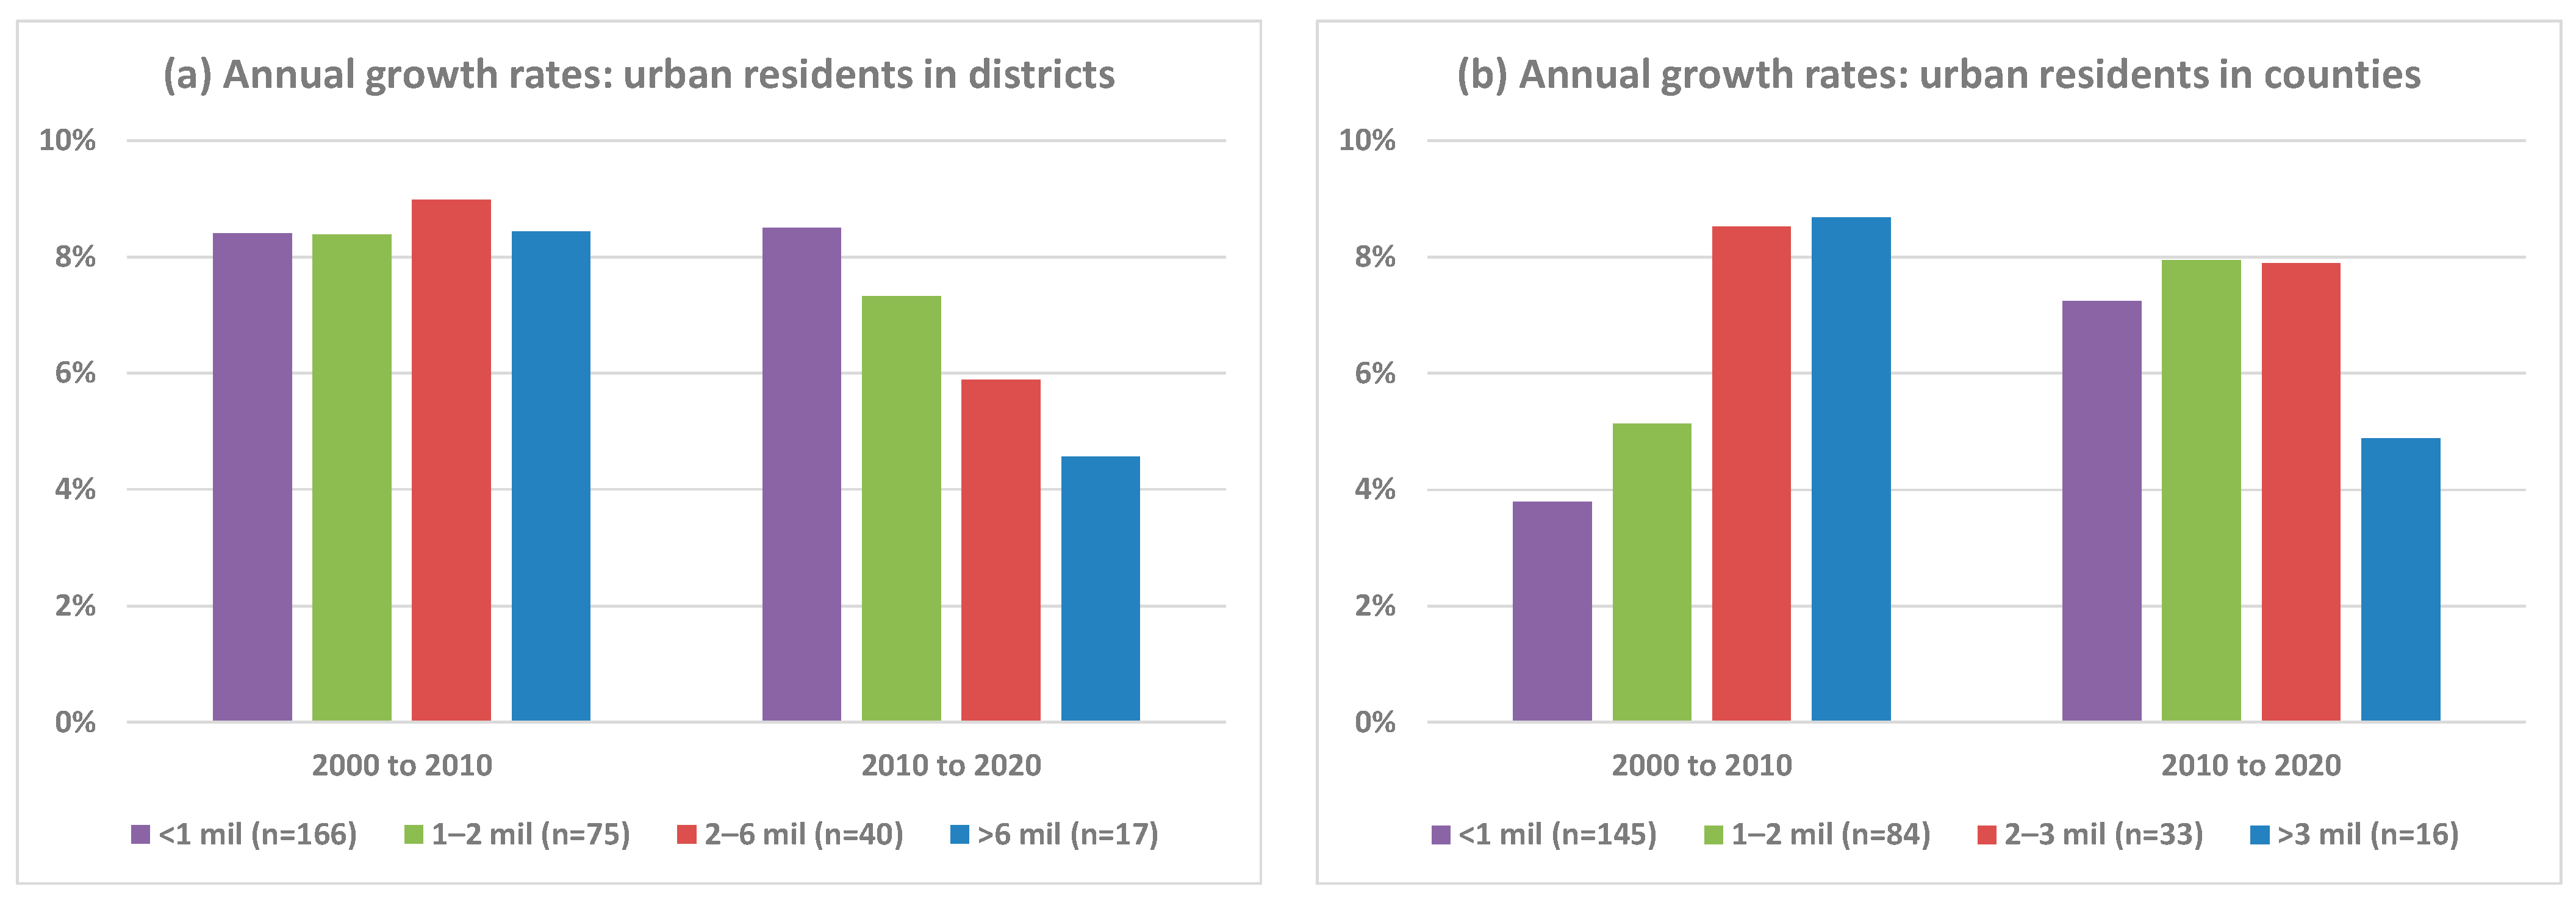
The agglomeration results above indicate that productivity benefits from urban scale are concentrated in dense urban districts and are much weaker in the surrounding counties and county-level cities. At the same time, however, the spatial pattern of urban growth in China has been evolving. Rather than concentrating population growth in the largest urban cores, the most recent (inter-censual) decade has seen relatively faster expansion in smaller urban cores and in county areas within prefectural jurisdictions. Figure 5 illustrates this pattern by comparing population growth rates across size classes for merged districts and for merged counties and county-level cities between the 2000–2010 and the 2010–2020 census intervals. The size classes are defined based on the 2020 census counts of urban residents and the thresholds are set in such a way that the number of spatial units within a size class approximately doubles with each step down from a more populated to a less populated size class. The thresholds are also set so that there are broadly comparable sample sizes per class for the two different types of third-level administrative units (districts compared with counties/county-level cities). Using the 2020 population for the categories ensures consistent grouping of spatial units across both intercensal periods and avoids changes in class composition that would otherwise arise from the re-ranking of places under base- or mid-period classifications.
Figure 5.
Population growth rates by size class of merged districts and merged counties/county-level cities. Panel (a) reports annual population growth rates calculated between census years for two periods, 2000–2010 and 2010–2020, for urban residents in merged districts (urban cores) and panel (b) for urban residents in merged counties/county-level cities within prefectural jurisdictions.
Figure 5 shows that population growth has shifted toward smaller urban cores and county areas. Among merged districts, growth during 2000–2010 was broadly similar across size classes, with annual rates around 8–9 percent. These high growth rates largely reflect internal migration rather than natural population increase: by 2020 some 376 million people were living outside their prefecture of household registration, and the stock of internal migrants has been growing far faster than the national rate of natural population increase [29]. By contrast, from 2010 to 2020, growth becomes inversely related to size: combined adjacent districts (the urban core of the prefecture) with fewer than one million residents grow at about 8.5 percent per year, compared with only 4.6 percent per annum for the largest urban cores with resident populations above six million.
A similar pattern appears for merged counties and county-level cities: the smallest size class of merged counties and county-level cities (those with under one million urban residents) grew the slowest from 2000 to 2010, with each step up in terms of the next most populous size class having a higher growth rate, with the merged counties and county-level cities with more than three million urban residents growing by 8.7 percent per year. For the period from 2010 to 2020, the most populated merged counties, with over three million urban residents, had a population growth rate of only 4.8 percent per year, which is almost halved from the previous decade. In contrast, the two least populated size classes, with below one million and from one million to two million had sharply higher growth rates from 2010 to 2020, compared to the prior decade. Because each prefecture contains on average about five counties or county-level cities, merged county populations with urban populations below one million typically correspond to individual counties with urban populations under about 200,000 each. These results indicate that an increasing share of recent urban population growth is occurring outside the largest urban cores, consistent with a spatial shift toward smaller urban centers and surrounding county areas.
3.6. Spatial Shift in Construction Activity Toward Counties and the Urban Fringe
The shift in the location of recent urban growth shown in Figure 5 raises a natural question: whether this pattern reflects only changes in where people live or whether it also corresponds to where new urban construction is occurring. To investigate this issue, we use data from the long-form census sample (10% of the population) to track the changing location of employment in the construction sector. Construction employment provides a direct indicator of where new building activity is taking place, because workers in this sector are typically located close to the sites where residential, commercial, and infrastructure projects are undertaken (sometimes even living in dormitories on-site). It is notable in this regard that the census measures the de facto resident population based on those living in a particular location for at least six months, irrespective of where they have their hukou registration, and so these data are very suitable for this exercise.
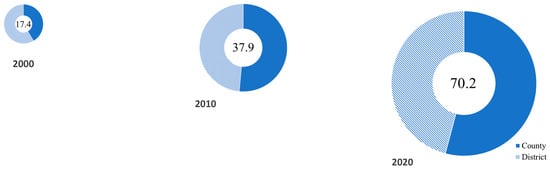
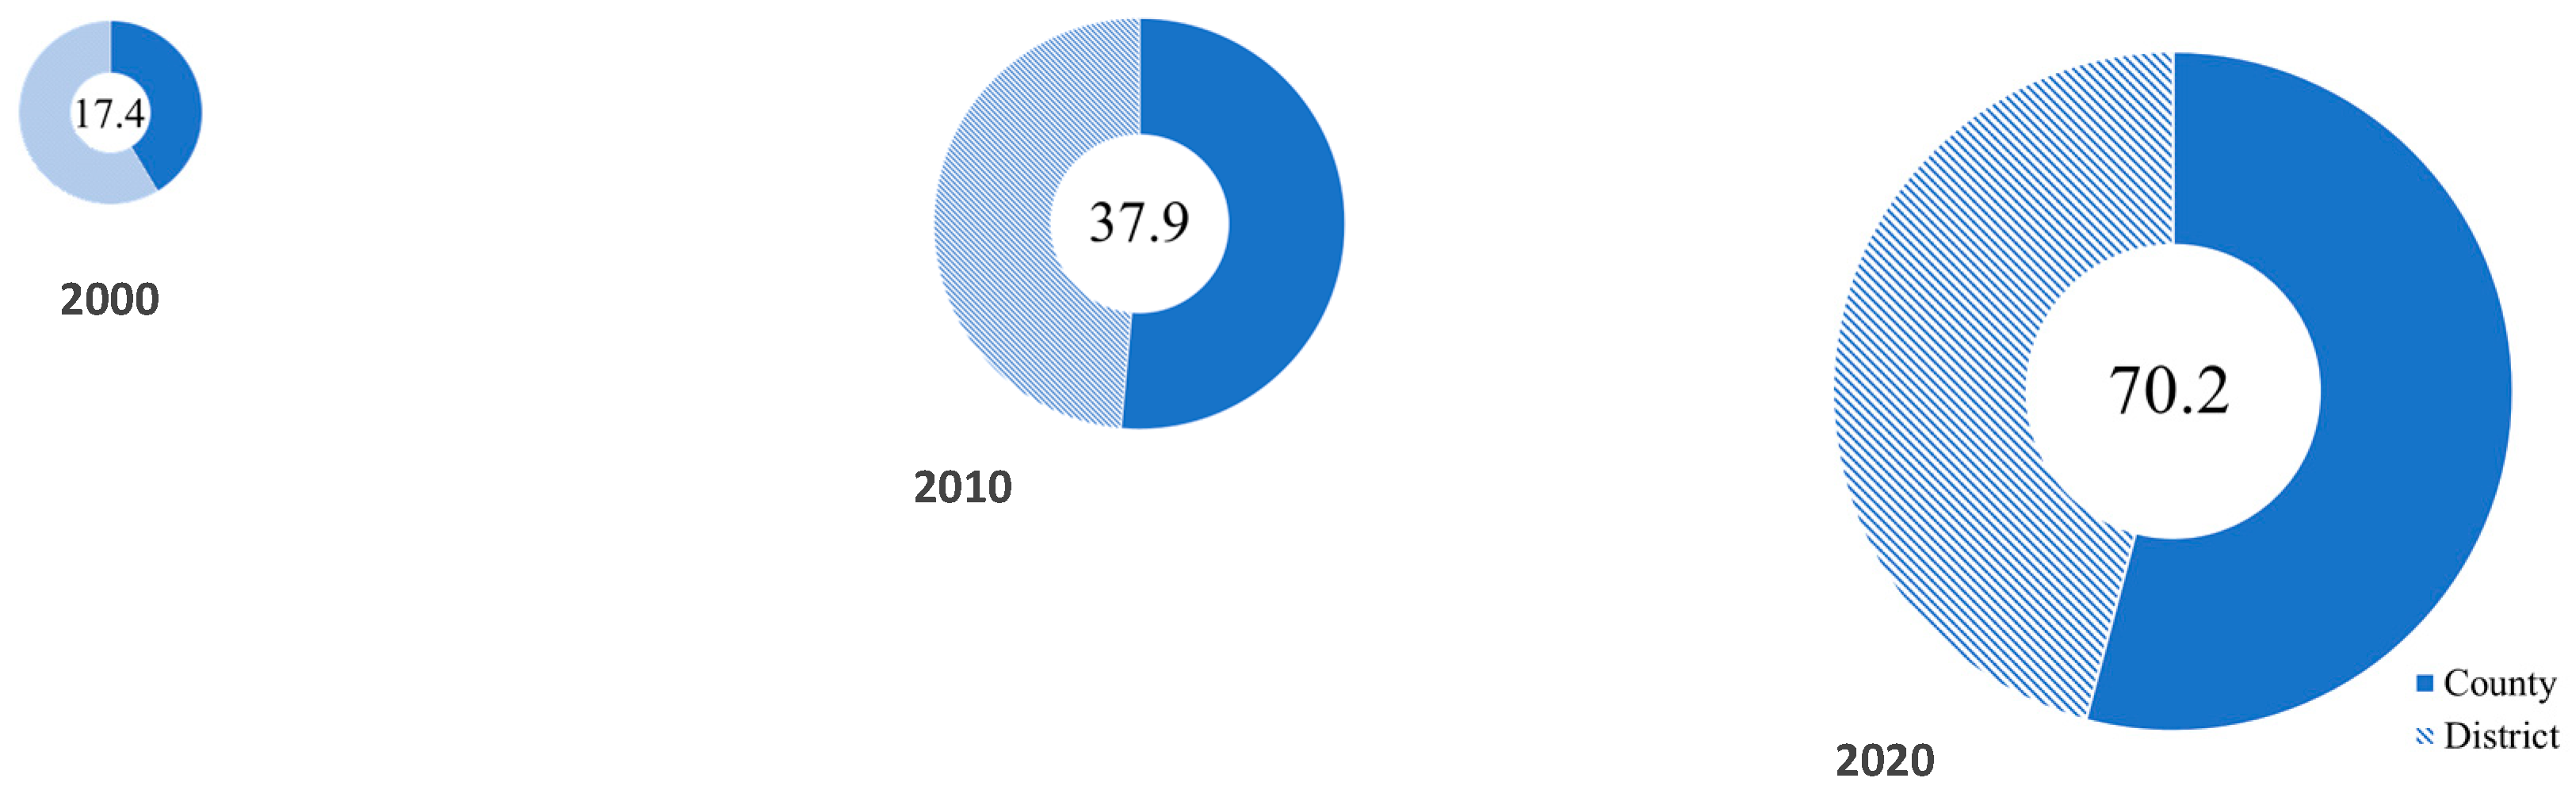
Figure 6 summarizes the changing spatial distribution of construction workers from 2000 to 2020 using scaled donut charts. The segments of each donut show the share of construction workers residing in districts versus counties, while the overall size of the donut is proportional to the total number of construction workers observed in the ten percent long-form sample in each census year. Two features stand out. First, the construction workforce expanded dramatically over the two decades covered by the census data. In the 2000 census there were about 17.4 million construction workers, rising to 37.9 million by 2010 and to over 70 million by 2020. This rapid increase reflects the extraordinary scale of China’s building boom during this period.
Figure 6.
Growth and spatial shift of construction workforce, 2000–2020. Donut segments show district versus county residence; donut size proportional to millions employed (number in center).
Second, the balance of this workforce moved away from districts and toward counties and county-level cities. In the 2000 census, 10.2 million construction workers were located in districts, so a majority (59 percent) of construction workers resided in the urban cores of prefectural-level cities. By 2020, although the number of district-based construction workers had grown to 32.2 million, the number located in counties and county-level cities had increased even more rapidly; the majority (54 percent) of construction workers by then resided outside of the district-based urban cores. Assuming that construction workers live near the buildings that they are working on (see below), this change indicates that the center of gravity of construction activity has moved outward from dense urban districts toward lower-density jurisdictions on the urban fringe and in smaller cities. Thus, the spatial redistribution of urban growth documented in Figure 5 reflects more than a reclassification of population between administrative units. Instead, it is consistent with a genuine shift in where the built environment is expanding. The scale of the construction workforce itself illustrates the magnitude of the transformation in China’s urban landscape. The construction boom has been historically unprecedented; for example, China used more cement between 2011 and 2013 than the United States used during the entire twentieth century, highlighting the scale of recent building activity.
An important remaining question is whether the locations where construction workers reside correspond to the places where new urban construction is actually occurring. If workers living in counties were commuting into districts to build high-rise developments in dense urban cores, the observed shift in residential location would not necessarily indicate a relocation of construction activity itself. To examine this possibility, we combine the construction workforce data for counties and county-level cities with satellite-based measures of urban expansion for the same areas.
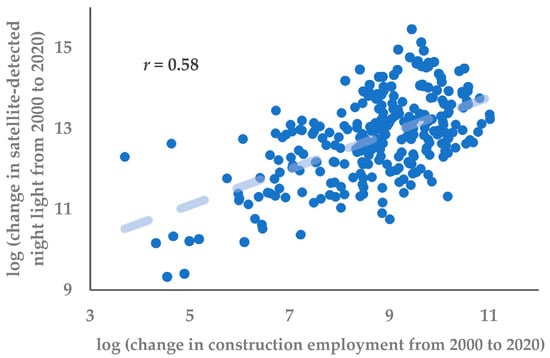
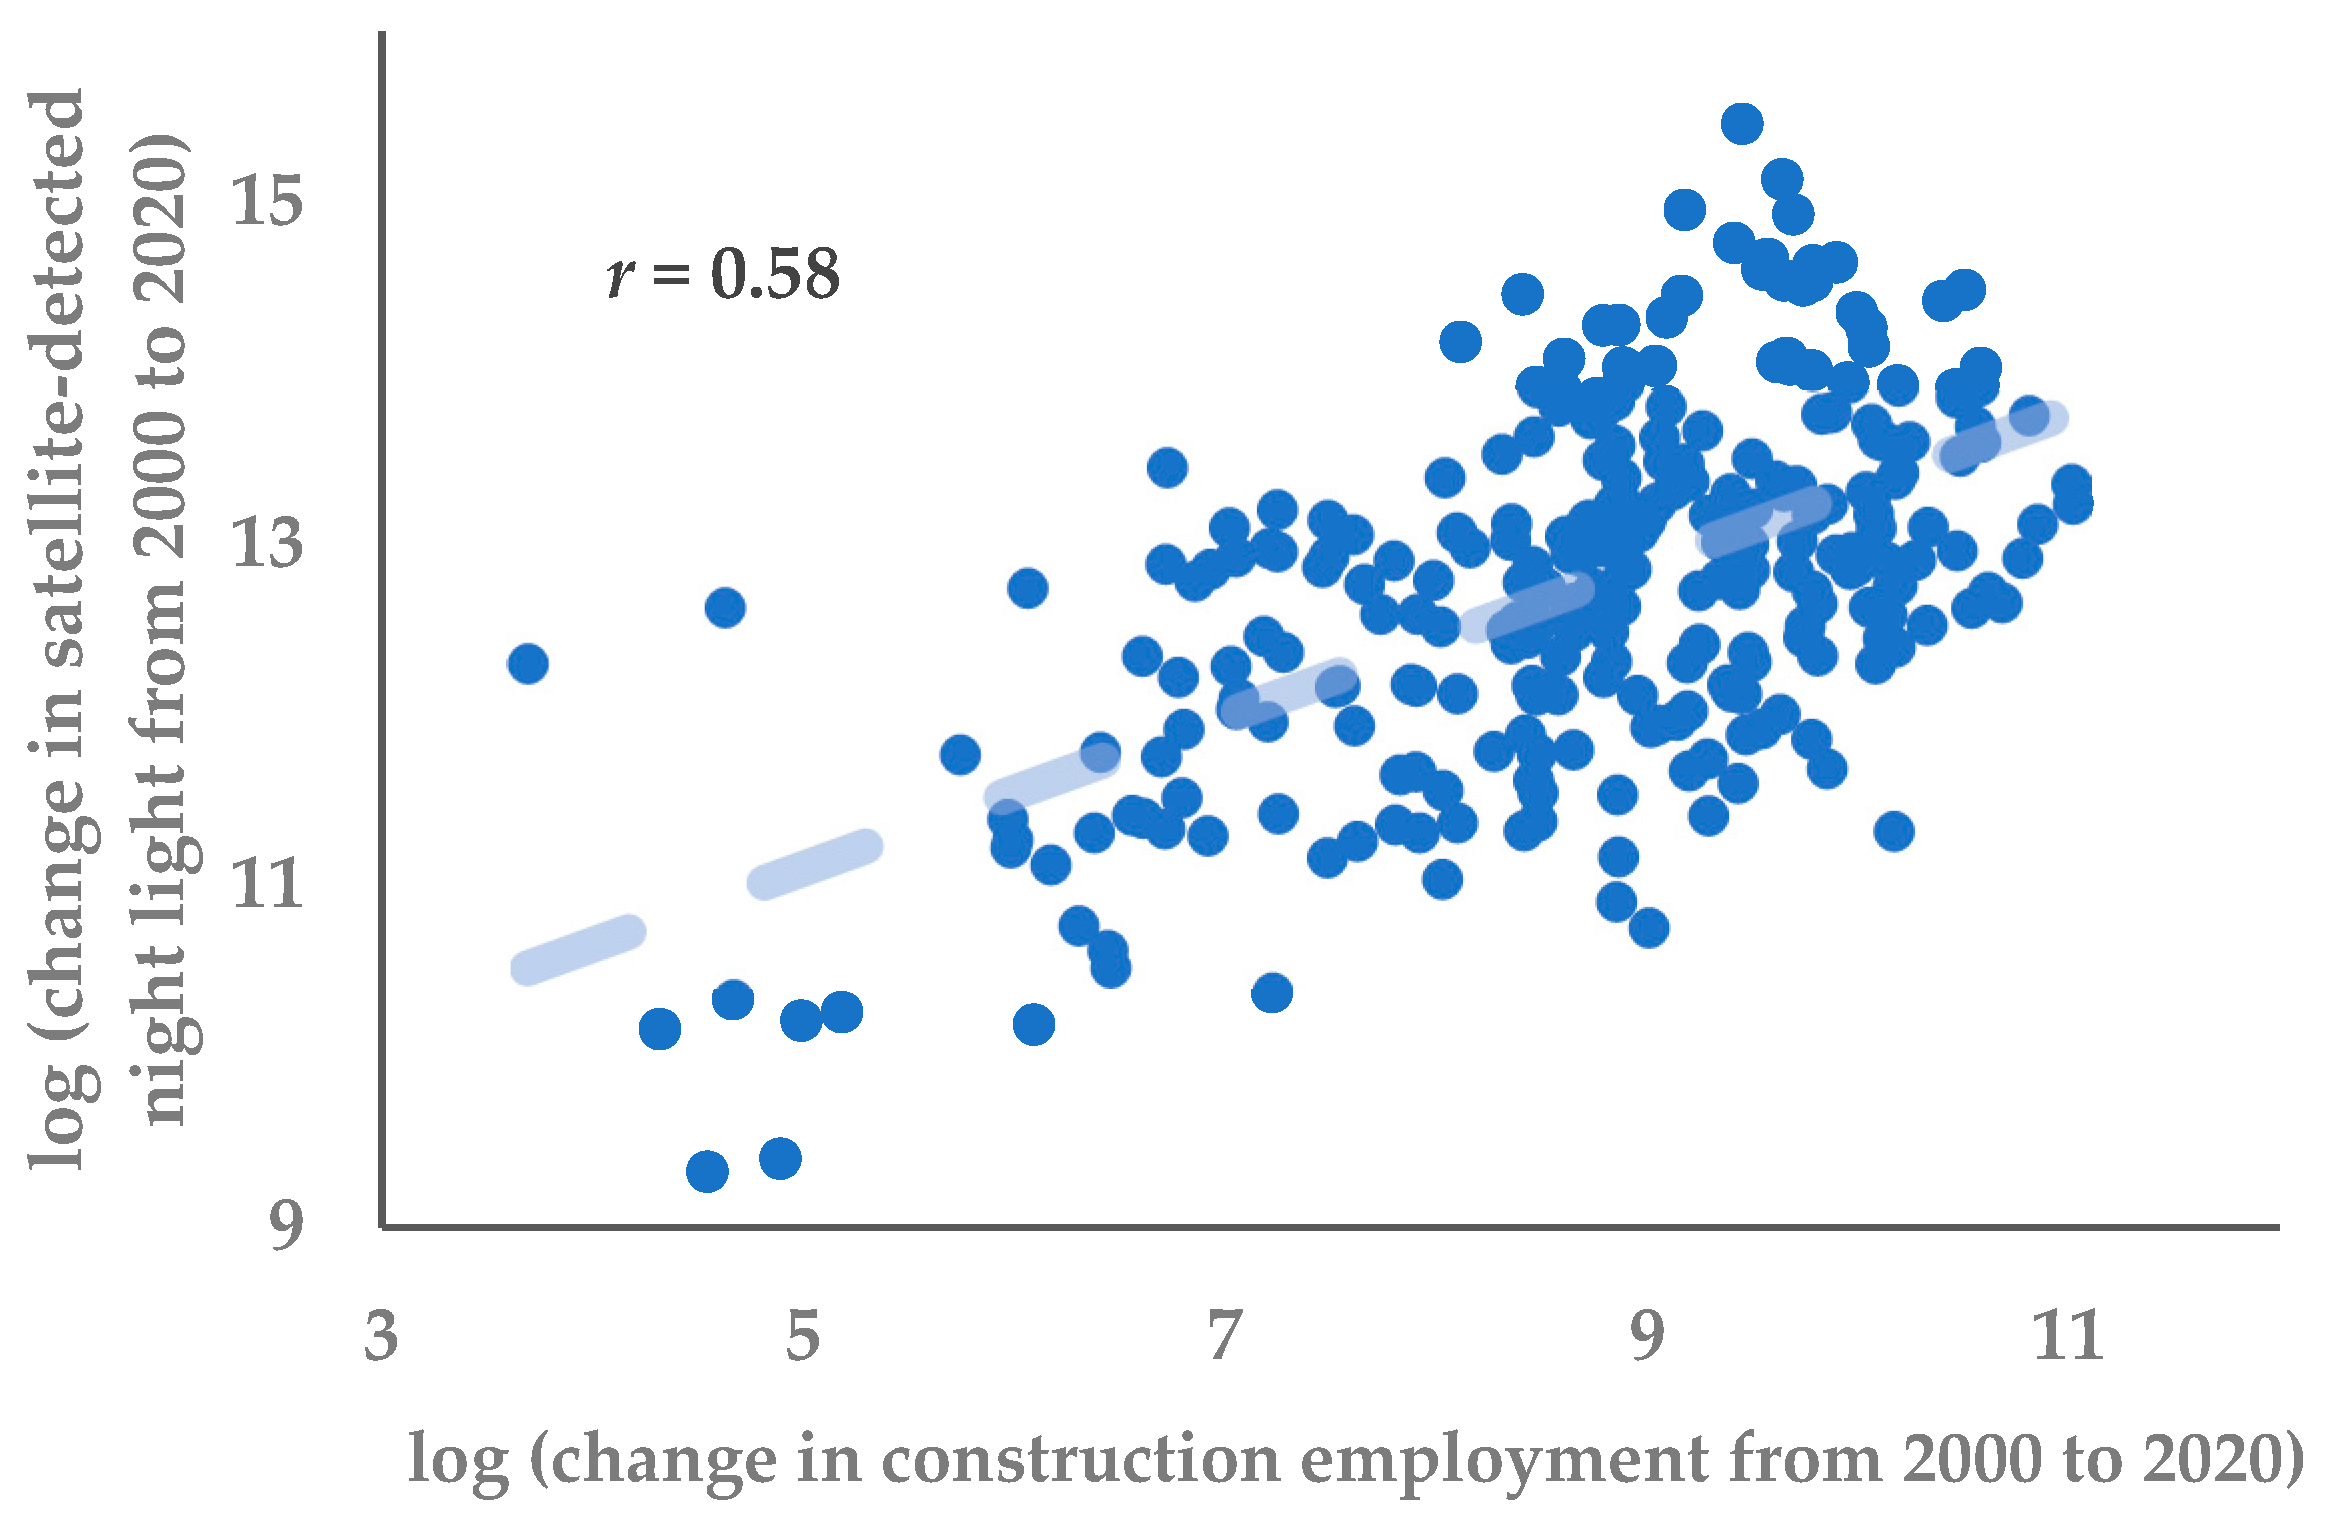
Figure 7 relates long differences in the size of the construction workforce between 2000 and 2020 to changes in nighttime lights (to reflect growth of the built-up area and growth in density; that is, building upward and outward) over the same period. Where merged counties and county-level cities experienced the largest increases in construction employment, they also had the largest increases in nighttime lights (with a correlation coefficient of 0.6). Likewise, satellite-detected urban land cover to reflect just the outward expansion of built-up area shows the same positive relationship with the growth in the construction workforce in those county areas. While this correlation does not establish causality, it provides supporting evidence that the spatial distribution of construction employment aligns with independent indicators of where urban expansion is occurring. In particular, the increases in construction employment at the county level are systematically associated with increases in both nighttime lights and built-up land area, suggesting that the observed redistribution of the construction workforce reflects underlying changes in the location of building activity rather than purely administrative reclassification.
Figure 7.
Construction workforce growth and satellite indicators of county development. Each point represents long differences for the merged counties and county-level cities in each prefecture.
This interpretation is consistent with institutional features of China’s construction sector. Studies of migrant construction workers document that they are typically housed in temporary, employer-provided dormitories located on or adjacent to construction sites, often in prefabricated compounds [30,31]. Such arrangements are widely used by construction firms to facilitate on-site labor deployment, given that workers are routinely accommodated in prefabricated shelters located in situ or nearby [32]. Consequently, there is limited scope for long-distance commuting of construction workers, as might happen if they were living in counties but working on building sites in central urban districts. The spatial shifts in the recorded location of construction employment are therefore likely to correspond closely to shifts in where construction activity is actually taking place, rather than reflecting large-scale commuting across administrative boundaries.
The patterns in Figure 6 and Figure 7 therefore reinforce the evidence from Figure 5 that a growing share of China’s recent urban construction has occurred outside the traditional district-based urban cores. The expansion of the construction workforce reflects the scale of the national building boom, while its spatial redistribution toward counties is consistent with a broader shift toward more dispersed patterns of urban expansion. This does not preclude continued vertical development within dense urban districts but indicates that an increasing share of urban growth is occurring beyond those cores.
4. Discussion
The results point to a growing disconnect between the locations where agglomeration effects are strongest and the locations where recent urban growth is occurring. The estimates in Table 1, Table 2 and Table 3 and Figure 2, Figure 3 and Figure 4 show that positive agglomeration elasticities remain concentrated in the dense urban districts that form the cores of Chinese cities, which is consistent with the broader literature on agglomeration economies and urban scaling [3,4,5,6,7]. However, Figure 5 shows that the geography of population growth has shifted over time. In the earlier decade, population growth across district size classes was more even, but, by 2010–2020, it had become increasingly concentrated in smaller urban cores and in county areas rather than in the largest district-based cores. Figure 6 and Figure 7 then show that construction activity has shifted in the same direction: the construction workforce has become increasingly concentrated in counties and county-level cities, and the places with the largest increases in construction employment are also the places with the largest increases in nighttime lights and built-up area. The weakening of district-level agglomeration elasticities over time is therefore consistent with a broader spatial reorientation of population and construction away from the dense urban cores where agglomeration benefits are most evident.
One explanation for this outward shift in both population and construction activity lies in the institutional structure of urban development in China. Local governments rely heavily on revenues from land development, through the sale or lease of land-use rights after agricultural land has been converted to urban construction land. This land-based financing system creates strong incentives for local governments to expand the supply of developable land, often at the urban fringe or in county jurisdictions where land conversion is less constrained by existing density or land-use conflicts [33]. As a result, urban expansion can occur even where population growth is relatively modest. The fiscal importance of land transactions for local governments has been widely documented in the literature, which shows that land leasing revenues have become a central component of local public finance and a major driver of urban construction activity [33]. Evidence from studies of land development rights and redevelopment financing further suggests that this model of land-based urban development can encourage rapid expansion of built-up areas in smaller cities and county-level jurisdictions where development projects help balance short-term fiscal pressures faced by local governments [34].
These patterns are also consistent with recent evidence on how population growth translates into changes in urban density across China’s regions. For example, increases in the resident population of urban cores (the merged districts of prefectural-level cities) raises average density in China’s eastern region but, in the interior, the population increase is accommodated by increasing the built-up area without a concomitant increase in the average population density [11]. When urban population growth occurs mainly through land expansion rather than densification, the conditions that support agglomeration economies—such as proximity between firms, workers, and suppliers—are less likely to develop. The outward shift in population and construction activity documented in Figure 5, Figure 6 and Figure 7 is therefore consistent with a broader pattern in which urban growth in interior regions occurs through spatial expansion rather than through increases in density.
The interpretation that follows from these results is not simply that agglomeration effects differ across regions, but that the geography of recent urban growth is increasingly moving away from the parts of the urban system where those effects are strongest. Evidence on administrative upgrading shows that positive spillovers are largest in the denser and more economically integrated parts of the eastern region [10]. The results in [11] thus show why this matters for the present study: in the eastern region, increases in urban population are accommodated partly through rising density, whereas in the central and western regions population growth is accommodated mainly through expansion of the urban footprint, with little increase in average density. Evidence from satellite-based measures of economic activity points in the same direction, with stronger spatial clustering of development and stronger agglomeration effects in coastal areas than in the interior [35]. Read alongside Figure 5, Figure 6 and Figure 7, these results suggest that the decline in district-level agglomeration elasticities documented in this paper is not an isolated statistical pattern. Rather, it is consistent with a broader shift in urban growth toward smaller urban cores and county areas where population and construction increase without much corresponding rise in density, so the conditions that support agglomeration economies are weaker.
Evidence from other countries suggests that these patterns are not unique to China. Recent meta-analysis shows that agglomeration elasticities, particularly in manufacturing, have declined over time in many settings, consistent with falling transport costs and greater spatial fragmentation of production reducing the benefits of proximity [36]. Evidence from Japan provides a useful comparison from a mature urban economy: manufacturing activity has become more geographically dispersed, while service and other non-manufacturing sectors remain concentrated in the largest metropolitan areas, especially Greater Tokyo [37]. Earlier work on Japan similarly finds that agglomeration economies are weak or absent in manufacturing but remain significant in sectors such as finance and services, reinforcing the distinction between production activities that can disperse spatially and those that depend on dense urban environments [38]. In this broader context, the Chinese case appears to combine a general weakening of agglomeration forces in some sectors with a spatial shift of population and construction toward lower-density areas where such forces are inherently limited. This combination suggests a potential transition toward a more spatially differentiated urban system, in which high-order service activities remain concentrated in dense cores while population growth and construction expand into lower-density areas with weaker agglomeration benefits.
These results also have broader implications for how China’s urban transition is unfolding. The evidence presented in this paper shows that positive agglomeration elasticities are concentrated in the dense district-based urban cores, yet recent population growth and construction activity are increasingly occurring outside those cores in counties and county-level cities. If new urban development occurs mainly in locations where density remains relatively low, the productivity advantages associated with large and dense metropolitan clusters are unlikely to be fully realized. This concern is consistent with wider analyses of China’s urbanization, which argue that dispersed patterns of development forego many of the productivity gains that arise when economic activity and population are concentrated in major metropolitan regions. In this sense, the shift in urban growth documented here may help explain why agglomeration effects appear weak or absent in the places where much of China’s recent urban expansion is now occurring.
This study has several limitations. First, the analysis is based on administrative units rather than functional urban areas, which may not fully capture commuting-based economic linkages and the spatial extent of local labor markets. Second, while the combination of census employment data and satellite indicators provides consistent evidence on the spatial distribution of construction activity, these measures are not designed to establish causal relationships. Third, the analysis identifies where agglomeration effects are strongest in terms of productivity (measured by GDP per worker or per resident) but does not fully isolate the mechanisms underlying their decline over time. In particular, the results relate to production rather than welfare: locations with stronger agglomeration effects may also be associated with negative amenities such as congestion or air pollution, which are not captured in the output-based measures used here. There is growing evidence that such disamenities can influence migration and location choices in China, for example where pollution exposure reduces the attractiveness of otherwise productive cities [39]. More generally, spatial equilibrium models emphasize that wages and productivity must be interpreted alongside local amenities and costs of living when assessing welfare differences across cities [40]. Future research could extend this work using finer spatial data, alternative definitions of metropolitan areas, and more direct measures of firm-level productivity, environmental quality, and spatial interactions.
5. Conclusions
This study examines how the geography of recent urban growth in China relates to the spatial conditions under which agglomeration economies are most likely to arise. Using census data, remote sensing measures of urban expansion, and employment patterns in the construction sector, the results show that positive agglomeration elasticities are concentrated in the dense district-based cores of Chinese cities. Over time, however, both population growth and construction activity have shifted increasingly toward smaller urban cores and toward counties and county-level cities. Evidence from construction employment, nighttime lights, and built-up land indicates that much of the recent expansion of urban activity has occurred in the same locations where density increases are limited and where agglomeration effects appear weak or absent. When urban population growth is accommodated primarily through spatial expansion rather than through rising density, the proximity between firms, workers, and suppliers that underpins agglomeration economies is less likely to develop. The results therefore suggest that a growing share of China’s recent urban expansion is occurring in parts of the urban system where the density conditions needed for strong agglomeration economies are unlikely to emerge.
Author Contributions
Conceptualization, J.G.; methodology, J.G. and C.L.; data curation and statistical analysis, C.L.; writing—original draft preparation and editing, J.G.; review, J.G. and C.L. All authors have read and agreed to the published version of the manuscript.
Funding
This research received no external funding.
Institutional Review Board Statement
Not applicable.
Informed Consent Statement
Not applicable.
Data Availability Statement
Restrictions apply to the availability of these data. The census data used in this study were obtained from the National Bureau of Statistics of China and cannot be redistributed by the authors. Researchers may obtain the data directly from the National Bureau of Statistics subject to their licensing conditions.
Acknowledgments
We are grateful to Geua Boe-Gibson, Xiaoxuan Zhang and Bonggeun Kim for helpful discussions related to this research; we are grateful for the comments from two anonymous reviewers.
Conflicts of Interest
The authors declare no conflicts of interest.
Abbreviations
The following abbreviations are used in this manuscript:
| GDP | Gross Domestic Product |
| OLS | Ordinary least squares |
| IV | Instrumental variables |
| SUR | Seemingly unrelated regression |
| GMM | Generalized method of moments |
| NBS | National Bureau of Statistics |
| DMSP-OLS | Defense Meteorological Satellite Program–Operational Linescan System |
| VIIRS | Visible Infrared Imaging Radiometer Suite |
| ESA CCI | European Space Agency Climate Change Initiative |
References
- Lewis, W.A. Economic development with unlimited supplies of labour. Manch. Sch. 1954, 22, 139–191. [Google Scholar] [CrossRef] [Scilit]
- Wang, X. Empirical analysis of the rationality of China’s urbanization level on national and regional levels. J. Urban Plan. Dev. 2017, 143, 04016035. [Google Scholar] [CrossRef] [Scilit]
- Duranton, G.; Puga, D. Micro-foundations of urban agglomeration economies. In Handbook of Regional and Urban Economics; Henderson, J.V., Thisse, J.F., Eds.; Elsevier: Amsterdam, The Netherlands, 2004; Volume 4, pp. 2063–2117. [Google Scholar]
- Rosenthal, S.S.; Strange, W.C. Evidence on the nature and sources of agglomeration economies. In Handbook of Regional and Urban Economics; Henderson, J.V., Thisse, J.F., Eds.; Elsevier: Amsterdam, The Netherlands, 2004; Volume 4, pp. 2119–2171. [Google Scholar]
- Bettencourt, L.M.A.; Lobo, J.; Helbing, D.; Kühnert, C.; West, G.B. Growth, innovation, scaling, and the pace of life in cities. Proc. Natl. Acad. Sci. USA 2007, 104, 7301–7306. [Google Scholar] [CrossRef] [Scilit]
- Bettencourt, L.M.A. The origins of scaling in cities. Science 2013, 340, 1438–1441. [Google Scholar] [CrossRef] [Scilit]
- Melo, P.C.; Graham, D.J.; Noland, R.B. A meta-analysis of estimates of urban agglomeration economies. Reg. Sci. Urban Econ. 2009, 39, 332–342. [Google Scholar] [CrossRef] [Scilit]
- Au, C.C.; Henderson, J.V. Are Chinese cities too small? Rev. Econ. Stud. 2006, 73, 549–576. [Google Scholar] [CrossRef] [Scilit]
- Cai, F.; Wan, G.; Wang, M. Urbanization with Chinese Characteristics: The Hukou System and Migration; Chan, K.W., Ed.; Edward Elgar Publishing: Cheltenham, UK; Northampton, MA, USA, 2023. [Google Scholar]
- Zhang, X.; Li, C.; Gibson, J. The role of spillovers when evaluating regional development interventions: Evidence from administrative upgrading in China. Lett. Spat. Resour. Sci. 2024, 17, 9. [Google Scholar] [CrossRef] [Scilit]
- Zhang, X.; Li, C.; Gibson, J. China’s city size distribution: Diverging in terms of people and converging in terms of urbanized area. Lett. Spat. Resour. Sci. 2025, 18, 6. [Google Scholar] [CrossRef] [Scilit]
- Holz, C.A. Chinese statistics: Classification systems and data sources. Eurasian Geogr. Econ. 2014, 54, 532–571. [Google Scholar] [CrossRef] [Scilit]
- National Bureau of Statistics [NBS]. Communiqué of the Seventh National Population Census (No. 1); National Bureau of Statistics: Beijing, China, 2021. Available online: https://www.stats.gov.cn/english/PressRelease/202105/t20210510_1817186.html (accessed on 13 May 2024).
- Roberts, M.; Deichmann, U.; Fingleton, B.; Shi, T. Evaluating China’s road to prosperity: A new economic geography approach. Reg. Sci. Urban Econ. 2012, 42, 580–594. [Google Scholar] [CrossRef] [Scilit]
- Huo, H.; Li, L.; Lian, Y.; Du, P.; Cui, L. Research on high-resolution urban regional carbon emission estimation method from the perspective of functional areas: A case study of Beijing. Urban Sci. 2026, 10, 119. [Google Scholar] [CrossRef] [Scilit]
- Fan, S.; Li, L.; Zhang, X. Challenges of creating cities in China: Lessons from a short-lived county-to-city upgrading policy. J. Comp. Econ. 2012, 40, 476–491. [Google Scholar] [CrossRef] [Scilit]
- National Bureau of Statistics [NBS]. Tabulation on the 2000 Population Census of the People’s Republic of China; China Statistics Press: Beijing, China, 2002. [Google Scholar]
- National Bureau of Statistics [NBS]. Tabulation on the 2010 Population Census of the People’s Republic of China; China Statistics Press: Beijing, China, 2012. [Google Scholar]
- National Bureau of Statistics [NBS]. Tabulation on the 2020 Population Census of the People’s Republic of China; China Statistics Press: Beijing, China, 2022. [Google Scholar]
- National Bureau of Statistics [NBS]. China Statistical Yearbook (County-Level) (Zhongguo Xianyu Tongji Nianjian); China Statistics Press: Beijing, China, 2001. [Google Scholar]
- National Bureau of Statistics [NBS]. China City Statistical Yearbook (Zhongguo Chengshi Tongji Nianjian); China Statistics Press: Beijing, China, 2011. [Google Scholar]
- National Bureau of Statistics [NBS]. Provincial and City Statistical Yearbooks (e.g., Beijing Statistical Yearbook); China Statistics Press: Beijing, China, 2021. [Google Scholar]
- Hsu, F.-C.; Baugh, K.E.; Ghosh, T.; Zhizhin, M.; Elvidge, C.D. DMSP-OLS radiance calibrated nighttime lights time series with intercalibration. Remote Sens. 2015, 7, 1855–1876. [Google Scholar] [CrossRef] [Scilit]
- Zhang, X.; Gibson, J. Using multi-source nighttime lights data to proxy for county-level economic activity in China from 2012 to 2019. Remote Sens. 2022, 14, 1282. [Google Scholar] [CrossRef] [Scilit]
- Sun, W.; Ding, X.; Su, J.; Mu, X.; Zhang, Y.; Gao, P.; Zhao, G. Land use and cover changes on the Loess Plateau: A comparison of six global or national land use and cover datasets. Land Use Policy 2022, 119, 106165. [Google Scholar] [CrossRef] [Scilit]
- Combes, P.-P.; Duranton, G.; Gobillon, L. The identification of agglomeration economies. J. Econ. Geogr. 2011, 11, 253–266. [Google Scholar] [CrossRef] [Scilit]
- The Royal Swedish Academy of Sciences. Natural Experiments Help Answer Important Questions: Scientific Background on the Sveriges Riksbank Prize in Economic Sciences in Memory of Alfred Nobel 2021; Royal Swedish Academy of Sciences: Stockholm, Sweden, 2021; Available online: https://www.nobelprize.org/uploads/2021/10/advanced-economicsciencesprize2021.pdf (accessed on 13 May 2024).
- Kleibergen, F.; Paap, R. Generalized reduced rank tests using the singular value decomposition. J. Econom. 2006, 133, 97–126. [Google Scholar] [CrossRef] [Scilit]
- Zhang, X.; Gibson, J. How well do gridded population estimates proxy for actual population changes? Evidence from China. Popul. Dev. Rev. 2025, 51, 1402–1434. [Google Scholar] [CrossRef] [Scilit]
- He, S.; Liu, Y.; Webster, C.; Wu, F. Property rights redistribution, entitlement failure and the impoverishment of landless farmers in China. Urban Stud. 2009, 46, 1925–1949. [Google Scholar] [CrossRef] [Scilit]
- Swider, S. Building China: Precarious employment among migrant construction workers. Work. Employ. Soc. 2015, 29, 41–59. [Google Scholar] [CrossRef] [Scilit]
- Lam, T. Portable and precarious: Life and spectacle in China’s construction camps. Radic. Hist. Rev. 2018, 132, 173–179. [Google Scholar]
- Ding, C. Policy and praxis of land acquisition in China. Land Use Policy 2007, 24, 1–13. [Google Scholar] [CrossRef] [Scilit]
- Zhu, H.; Wei, M.; Gao, X.; Chen, Y. Balancing short-term gains and long-term sustainability: Managing land development rights for fiscal balance in China’s urban redevelopment. Urban Sci. 2026, 10, 71. [Google Scholar] [CrossRef] [Scilit]
- Chen, Y. Geographically heterogeneous spatial inequality in China: A luminosity-based analysis of prefectural cities and counties. Asian Dev. Rev. 2025, 42, 55–81. [Google Scholar] [CrossRef] [Scilit]
- Donovan, S.; de Graaff, T.; de Groot, H.L.F.; Koopmans, C.C. Unraveling urban advantages—A meta-analysis of agglomeration economies. J. Econ. Surv. 2024, 38, 168–200. [Google Scholar] [CrossRef] [Scilit]
- Otsuka, A. A new perspective on agglomeration economies in Japan. In New Frontiers in Regional Science: Asian Perspectives; Springer: Singapore, 2017; p. 196. [Google Scholar]
- Dekle, R. Industrial concentration and regional growth: Evidence from the prefectures. Rev. Econ. Stat. 2002, 84, 310–315. [Google Scholar] [CrossRef] [Scilit]
- Wang, M.; Ding, Z. Pollution, information, and migration. Asian Dev. Rev. 2025, 42, 31–56. [Google Scholar] [CrossRef] [Scilit]
- Roback, J. Wages, rents, and the quality of life. J. Polit. Econ. 1982, 90, 1257–1278. [Google Scholar] [CrossRef] [Scilit]

Disclaimer/Publisher’s Note: The statements, opinions and data contained in all publications are solely those of the individual author(s) and contributor(s) and not of MDPI and/or the editor(s). MDPI and/or the editor(s) disclaim responsibility for any injury to people or property resulting from any ideas, methods, instructions or products referred to in the content. |
© 2026 by the authors. Licensee MDPI, Basel, Switzerland. This article is an open access article distributed under the terms and conditions of the Creative Commons Attribution (CC BY) license.