


Abstract
Emerging mid-sized cities in the Global South face growing challenges in aligning transport infrastructure with equity and safety objectives under conditions of rapid urban expansion. While accessibility metrics are widely used in transport planning, their ability to capture functional inequalities and safety-related dynamics remains limited, particularly in corridor-level assessments. This study examines structural and functional accessibility patterns along two planned BRT corridors in Querétaro, Mexico, an emerging mid-sized Latin American city. The analysis integrates spatial accessibility indicators, selected urban process proxies related to inequality and road safety, and AI-based modeling to explore non-linear spatial associations across fine-grained corridor segments. Structural accessibility is evaluated using network-based indicators, while functional accessibility reflects observed service dynamics and operational conditions. Spatial correlations and artificial neural networks are employed as exploratory tools to identify co-occurring patterns rather than causal relationships. Results reveal pronounced spatial mismatches between structural and functional accessibility, socio-spatial marginalization, and crash concentration, highlighting corridor segments where future BRT implementation may either reinforce or mitigate existing inequalities. By framing BRT corridors as test cases, the study contributes a transferable diagnostic framework for assessing accessibility–equity–safety tensions in emerging mid-sized cities.
1. Introduction
Urban transport systems play a central role in shaping accessibility, socio-spatial equity, and road safety outcomes in contemporary cities. In rapidly urbanizing contexts, transport infrastructure often expands faster than institutional capacity, leading to spatial mismatches between planned connectivity, lived mobility conditions, and exposure to traffic risk. These mismatches are particularly evident in cities of the Global South, where fragmented urban growth, socio-economic polarization, and uneven service provision contribute to persistent accessibility and safety inequalities.
Although accessibility metrics are widely used in transport and urban planning, most applications emphasize structural or potential accessibility derived from network configuration, land-use patterns, and service coverage. While these approaches are valuable for strategic evaluation and scenario testing, they often provide limited insight into how accessibility is experienced in practice. Previous research has highlighted a persistent disjunction between physically defined accessibility and actual travel behavior, where improvements in network connectivity do not necessarily translate into effective access or equitable mobility outcomes [1,2]. As a result, high levels of planned accessibility may coexist with constrained functional access, particularly in rapidly growing urban contexts characterized by uneven service provision and socio-spatial inequality.
Within this context, emerging mid-sized cities represent a particularly critical but understudied urban condition. These cities—typically characterized by populations between approximately 200,000 and 1,500,000 inhabitants [3,4]—have experienced accelerated spatial expansion over recent decades, often driven by rapid economic restructuring, suburbanization, and motorization. In Latin America, such cities frequently combine elements of formal planning with informal growth processes, producing hybrid urban forms where transport infrastructure, land use, and socio-spatial inequality evolve unevenly [5,6]. This dynamic makes emerging cities such as Querétaro especially relevant for examining accessibility and safety tensions during periods of rapid transformation [6,7,8].
Bus Rapid Transit (BRT) systems have become a widely adopted policy instrument in emerging cities, promoted for their cost-effectiveness, scalability, and potential to improve accessibility. However, BRT planning often relies on structurally defined corridor alignments and station spacing that may not fully reflect existing travel patterns, informal stop practices, or localized demand pressures [9,10,11]. When implemented without sufficient consideration of functional accessibility and safety dynamics, BRT corridors may inadvertently reinforce pre-existing inequalities or concentrate traffic risk, particularly in areas where service frequency, boarding behavior, and pedestrian exposure interact in complex ways.
This study addresses these challenges by examining the spatial relationships between structural and functional accessibility, socio-spatial marginalization, and road safety along two planned BRT corridors in Querétaro, Mexico, an emerging mid-sized Latin American city. By integrating fine-grained spatial indicators with AI-based modeling techniques, the paper adopts a diagnostic approach aimed at identifying non-linear and co-occurring spatial patterns rather than establishing causal relationships. The contribution of this research lies in advancing a transferable framework for assessing accessibility–equity–safety tensions in emerging cities, supporting more informed corridor-level planning and evaluation.
Despite growing evidence on the individual roles of accessibility, inequality, and road safety [1,12,13], their combined spatial interaction within emerging mid-sized cities remains insufficiently understood. Previous studies often examine these dimensions separately—focusing either on infrastructure provision, operational, or safety outcomes—without addressing how they interact spatially to shape corridor performance and urban outcomes [2,14]. This gap is particularly relevant for planned mid-tier transit corridors, where high-capacity infrastructure is expected to reorganize fragmented transport systems but frequently operates within complex and unequal urban environments [10,11,15]. For that instance, the research questions are:
- RQ1: To what extent does structural accessibility (SAI) align with observed functional accessibility along planned BRT corridors in an emerging metropolitan context?
- RQ2: How are structural and functional accessibility conditions associated with selected urban processes, including socio-spatial marginalization, housing vacancy, and road crash incidence?
- RQ3: Can exploratory AI-based modeling reveal non-linear interaction patterns between accessibility conditions and urban processes beyond linear associations?
And these hypothesis:
- H1: Functional accessibility exhibits stronger associations with road crash incidence than structural accessibility, reflecting the role of operational intensity and exposure.
- H2: Structural accessibility does not necessarily translate into functional accessibility under fragmented operational conditions, producing measurable mismatches along corridor segments.
- H3: Associations between accessibility conditions and broader urban processes (e.g., marginalization, housing vacancy) are weaker and more heterogeneous than those related to mobility outcomes.
Within the spectrum of mid-tier transit systems—including conventional BRT, light rail, and emerging trackless tram solutions—cities in the Global South often operate in transitional conditions characterized by fragmented service patterns and informal operational practices.
This paper is structured as follows. Section 2 develops the theoretical framework linking accessibility, urban inequality, and road safety, with particular emphasis on the structural–functional accessibility gap in emerging mid-sized cities. Section 3 presents the study design, data sources, spatial units, and analytical methods, including statistical association analysis and exploratory artificial neural network modeling. Section 4 reports the empirical results, describing spatial patterns, bivariate associations, and selected graphical evidence. Section 5 discusses these findings in relation to existing literature, highlighting planning implications, methodological limitations, and the role of mid-tier transit systems. Finally, Section 6 summarizes the main conclusions and outlines directions for future research.
2. Accessibility and Urban Dynamics: Theoretical Framework
City systems, such as the urban public transport, represent both reflections and organisers of socio-spatial societies. Their performance depends not only on the efficiency of transport networks but also on how infrastructure interacts with urban form, land-use dynamics, and social behavior. In emerging Latin American cities—where the expansion of built infrastructure often outpaces the development of integrated governance frameworks—this interaction becomes especially critical.
2.1. Structural and Functional Accessibility
Accessibility is a central concept in transport and urban planning, commonly defined as the ease with which activities and opportunities can be reached from a given location. It operates as a key interface between transport systems, urban form, land-use dynamics, and social behavior, particularly in emerging urban contexts where infrastructure expansion often outpaces integrated governance frameworks [16].
Traditional accessibility approaches have primarily focused on structural or potential accessibility, derived from the physical configuration of transport networks, land-use distribution, and service coverage. The conceptual foundations of this perspective can be traced to Central Place Theory [17] and gravity-based models of spatial interaction [18], later refined through notions of relative accessibility [19] and spatial equilibrium [20]. With the operationalization of these principles through GIS, structural accessibility has been widely applied to evaluate network connectivity and spatial opportunity distribution in urban systems [21,22,23,24].
However, research has increasingly emphasized the distinction between structural accessibility and functional accessibility, which reflects how access is actually experienced by users through service operation, travel behavior, temporal constraints, and perceived safety [2]. Functional accessibility draws on spatial interaction theory [25] and socio-spatial critiques highlighting that access is shaped not only by infrastructure, but also by economic capacity, time availability, and institutional context [26]. Empirical studies using mobility data have shown that accessibility is dynamic and continuously reshaped by behavioral adaptation [7,27,28,29].
This distinction is particularly relevant for mid-tier transit corridors, such as BRT and LRT systems, which rely on corridor design, operational priority, and governance arrangements to translate infrastructure into effective use [15,30,31]. In such systems, high levels of planned connectivity may coexist with functional exclusion, revealing discrepancies between designed potential and lived mobility experience [1,2].
2.2. Urban Processes, Inequality, and Safety in Emerging Cities
In emerging cities of the Global South, accessibility outcomes are embedded within broader urban processes associated with rapid spatial growth, socio-economic fragmentation, and institutional asymmetry. Unlike cities with consolidated planning systems, Latin American cities often evolve through overlapping cycles of expansion and obsolescence, in which new infrastructure coexists with underutilised or socially excluded spaces. Accessibility thus reflects not only spatial configuration, but also ongoing processes of urban transformation [32].
Four interrelated processes are particularly relevant for understanding distortions in accessibility. Socio-spatial marginalization limits effective access when populations remain excluded despite physical proximity to urban opportunities, a condition reinforced by fragmented governance and informal transport markets [12,14,33]. Tertiary land-use transformation concentrates economic activity while displacing residential and daily-life functions, producing corridors with high connectivity but low habitability [34,35,36,37]. Housing vacancy and peripheral expansion generate infrastructure-rich but socially absent urban fabrics, increasing travel distances and undermining accessibility efficiency [29,38,39,40]. Finally, road crash concentration reflects unsafe mobility configurations where demand and infrastructure density intersect, signaling structural risk embedded in corridor design [41,42].
These processes interact spatially rather than operating independently, shaping where mobility demand concentrates and where accessibility and safety challenges emerge. As a result, accessibility and road safety patterns frequently co-occur with broader dynamics of urban inequality, complicating their interpretation through single-variable or purely linear approaches. Within this context, the concept of the structuring corridor frames transport infrastructure—particularly BRT—not merely as a mobility solution, but as a spatial intervention capable of reorganizing land-use relationships and counteracting socio-spatial inequities.
Analytical Limitations and Exploratory Approaches
The analysis of accessibility, inequality, and safety in complex urban environments faces important methodological limitations. Cross-sectional analyses and correlation-based methods are effective for identifying spatial associations, but they do not establish causal or directional relationships between urban processes, accessibility outcomes, and crash patterns. Observed statistical relationships may therefore reflect co-occurring spatial configurations rather than direct cause–effect mechanisms.
These limitations are amplified by spatial heterogeneity, aggregation effects, and context dependency, which complicate the interpretation of accessibility indicators in rapidly transforming cities. Under such conditions, linear and reductionist models may fail to capture non-linear interactions between infrastructure, behavior, and inequality that characterize urban mobility systems.
For this reason, exploratory and diagnostic analytical approaches have gained relevance in urban and transport research. Techniques such as artificial neural networks are not intended to infer causality, but to reveal latent patterns and complex relationships embedded in spatial data. When applied alongside conventional accessibility measures, these methods support hypothesis generation and corridor-level diagnosis, providing a complementary perspective for planning interventions in contexts marked by uncertainty and structural fragmentation.
3. Methodology and Procedures
3.1. Study Design and Analytical Framework
This study adopts an empirical, cross-sectional, and exploratory research design aimed at diagnosing spatial mismatches between planned accessibility, realized mobility conditions, socio-spatial inequality, and road safety outcomes in an emerging Latin American city. Rather than testing causal hypotheses, the methodological framework is designed to identify spatial associations and latent patterns that characterize the interaction between transport infrastructure, urban processes, and mobility-related risk.
This study adopts an empirical, cross-sectional, and exploratory research design aimed at diagnosing spatial mismatches between structural accessibility, functional accessibility, socio-spatial inequality, and road safety along BRT corridors. The analysis does not seek to establish causal relationships or temporal predictions, but rather to identify patterns of association that can inform corridor-level planning and policy discussions.
The analytical approach integrates three complementary components: (i) the construction of structural and functional accessibility indicators, (ii) spatial association analysis between accessibility, marginalization, and crash concentration, and (iii) exploratory artificial neural network (ANN) modeling to capture non-linear relationships that may not be evident through conventional linear methods.
Given the cross-sectional nature of the available data, the study does not seek to infer causality or directionality between variables. Instead, correlation metrics and machine learning outputs are interpreted as diagnostic tools supporting corridor-level assessment and hypothesis generation for future longitudinal or policy-oriented research. This design is particularly appropriate in rapidly transforming urban contexts, where accessibility outcomes are shaped by overlapping structural, behavioral, and institutional dynamics.
3.2. Study Area and Corridor Selection
The empirical analysis focuses on the Metropolitan Area of Querétaro, Mexico, a rapidly growing intermediate city that exemplifies the spatial and institutional conditions characteristic of emerging urban systems in the Global South. Querétaro has experienced accelerated demographic and economic growth over recent decades, accompanied by increasing socio-spatial polarization, peripheral expansion, and rising transport demand.
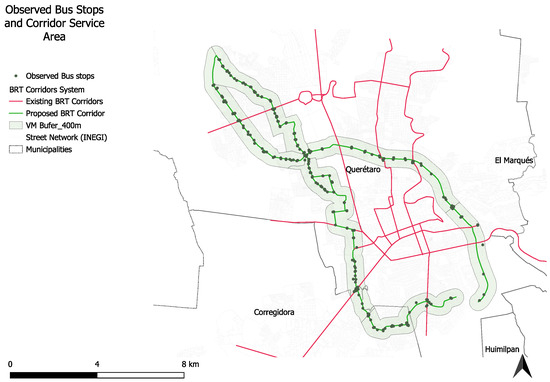
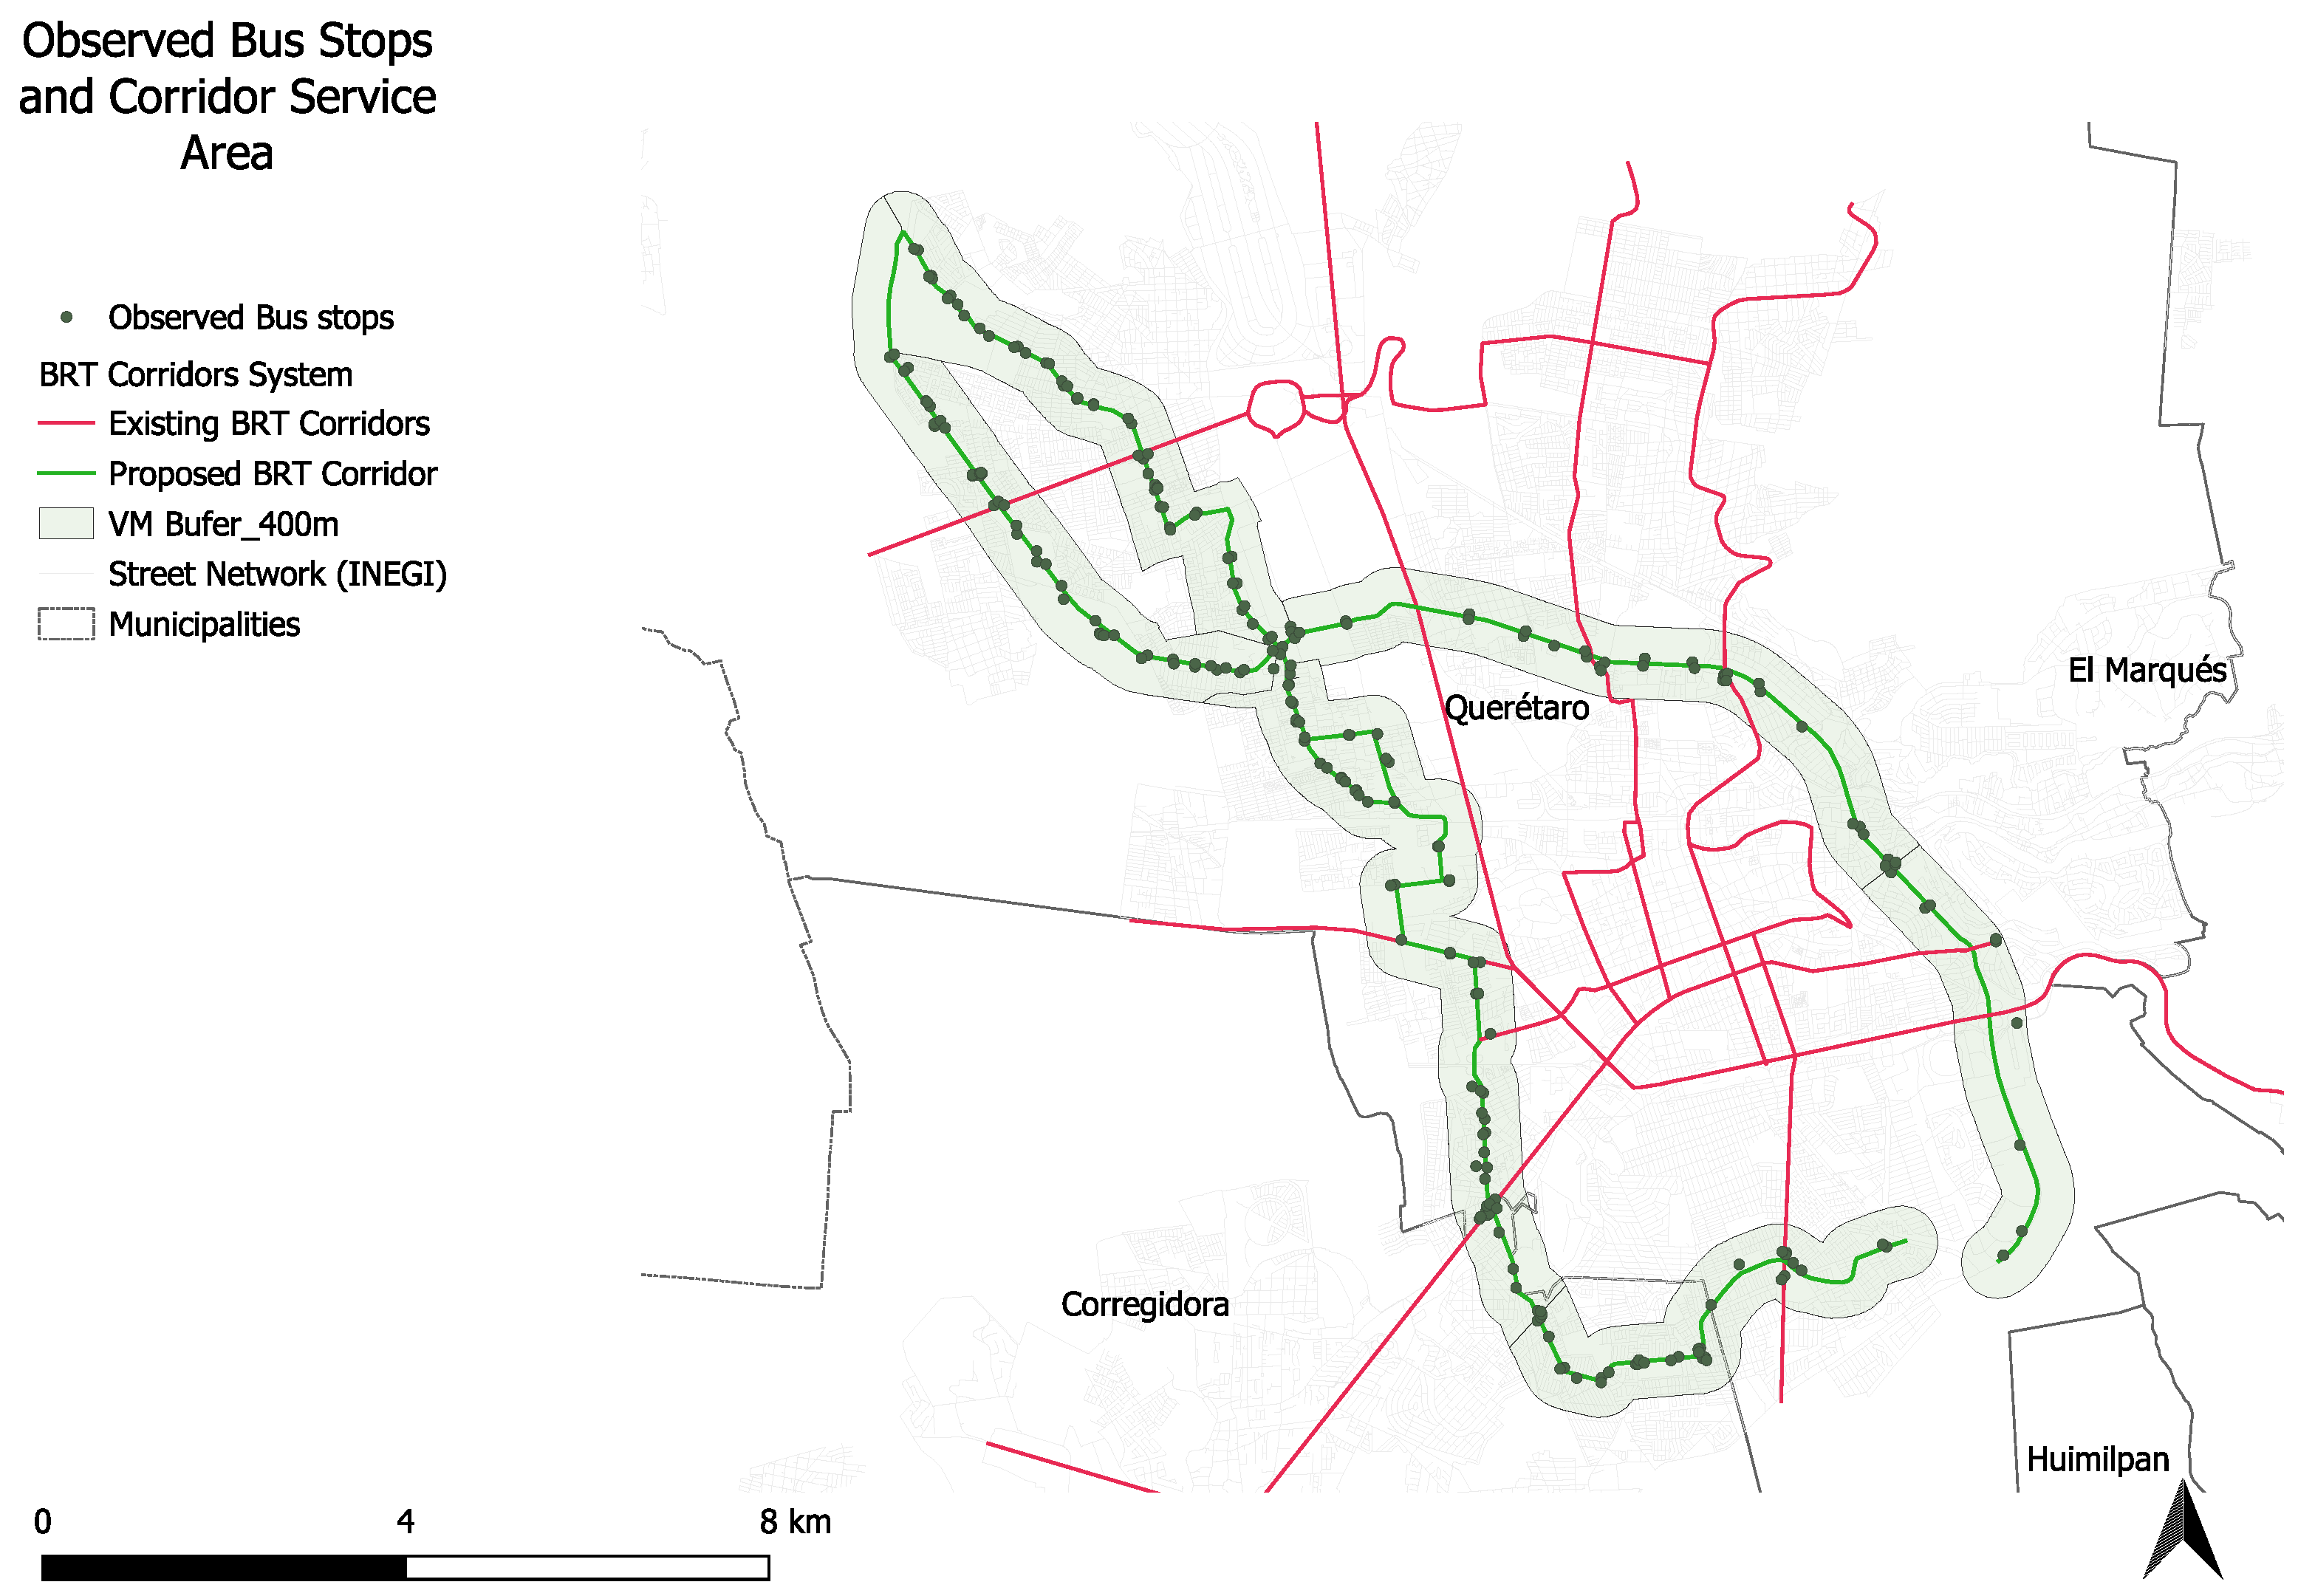
Two future Bus Rapid Transit (BRT) corridors identified in official planning instruments were selected as the primary units of analysis (Figure 1). These corridors are representative of mid-tier transit interventions commonly proposed in Latin American cities to address congestion, accessibility deficits, and environmental concerns. Their selection allows for the evaluation of how planned high-capacity transit infrastructure may interact with existing urban processes, accessibility conditions, and safety patterns prior to implementation. Observed bus stops were used to anchor functional accessibility (boarding/alighting and stop-level demand). The corridor service area was defined as a 400 m walk-access buffer around the corridor alignment and observed stops.
Figure 1.
Observed bus stops and 400 m walk-access buffer along the proposed BRT corridors in the Querétaro Metropolitan Area.
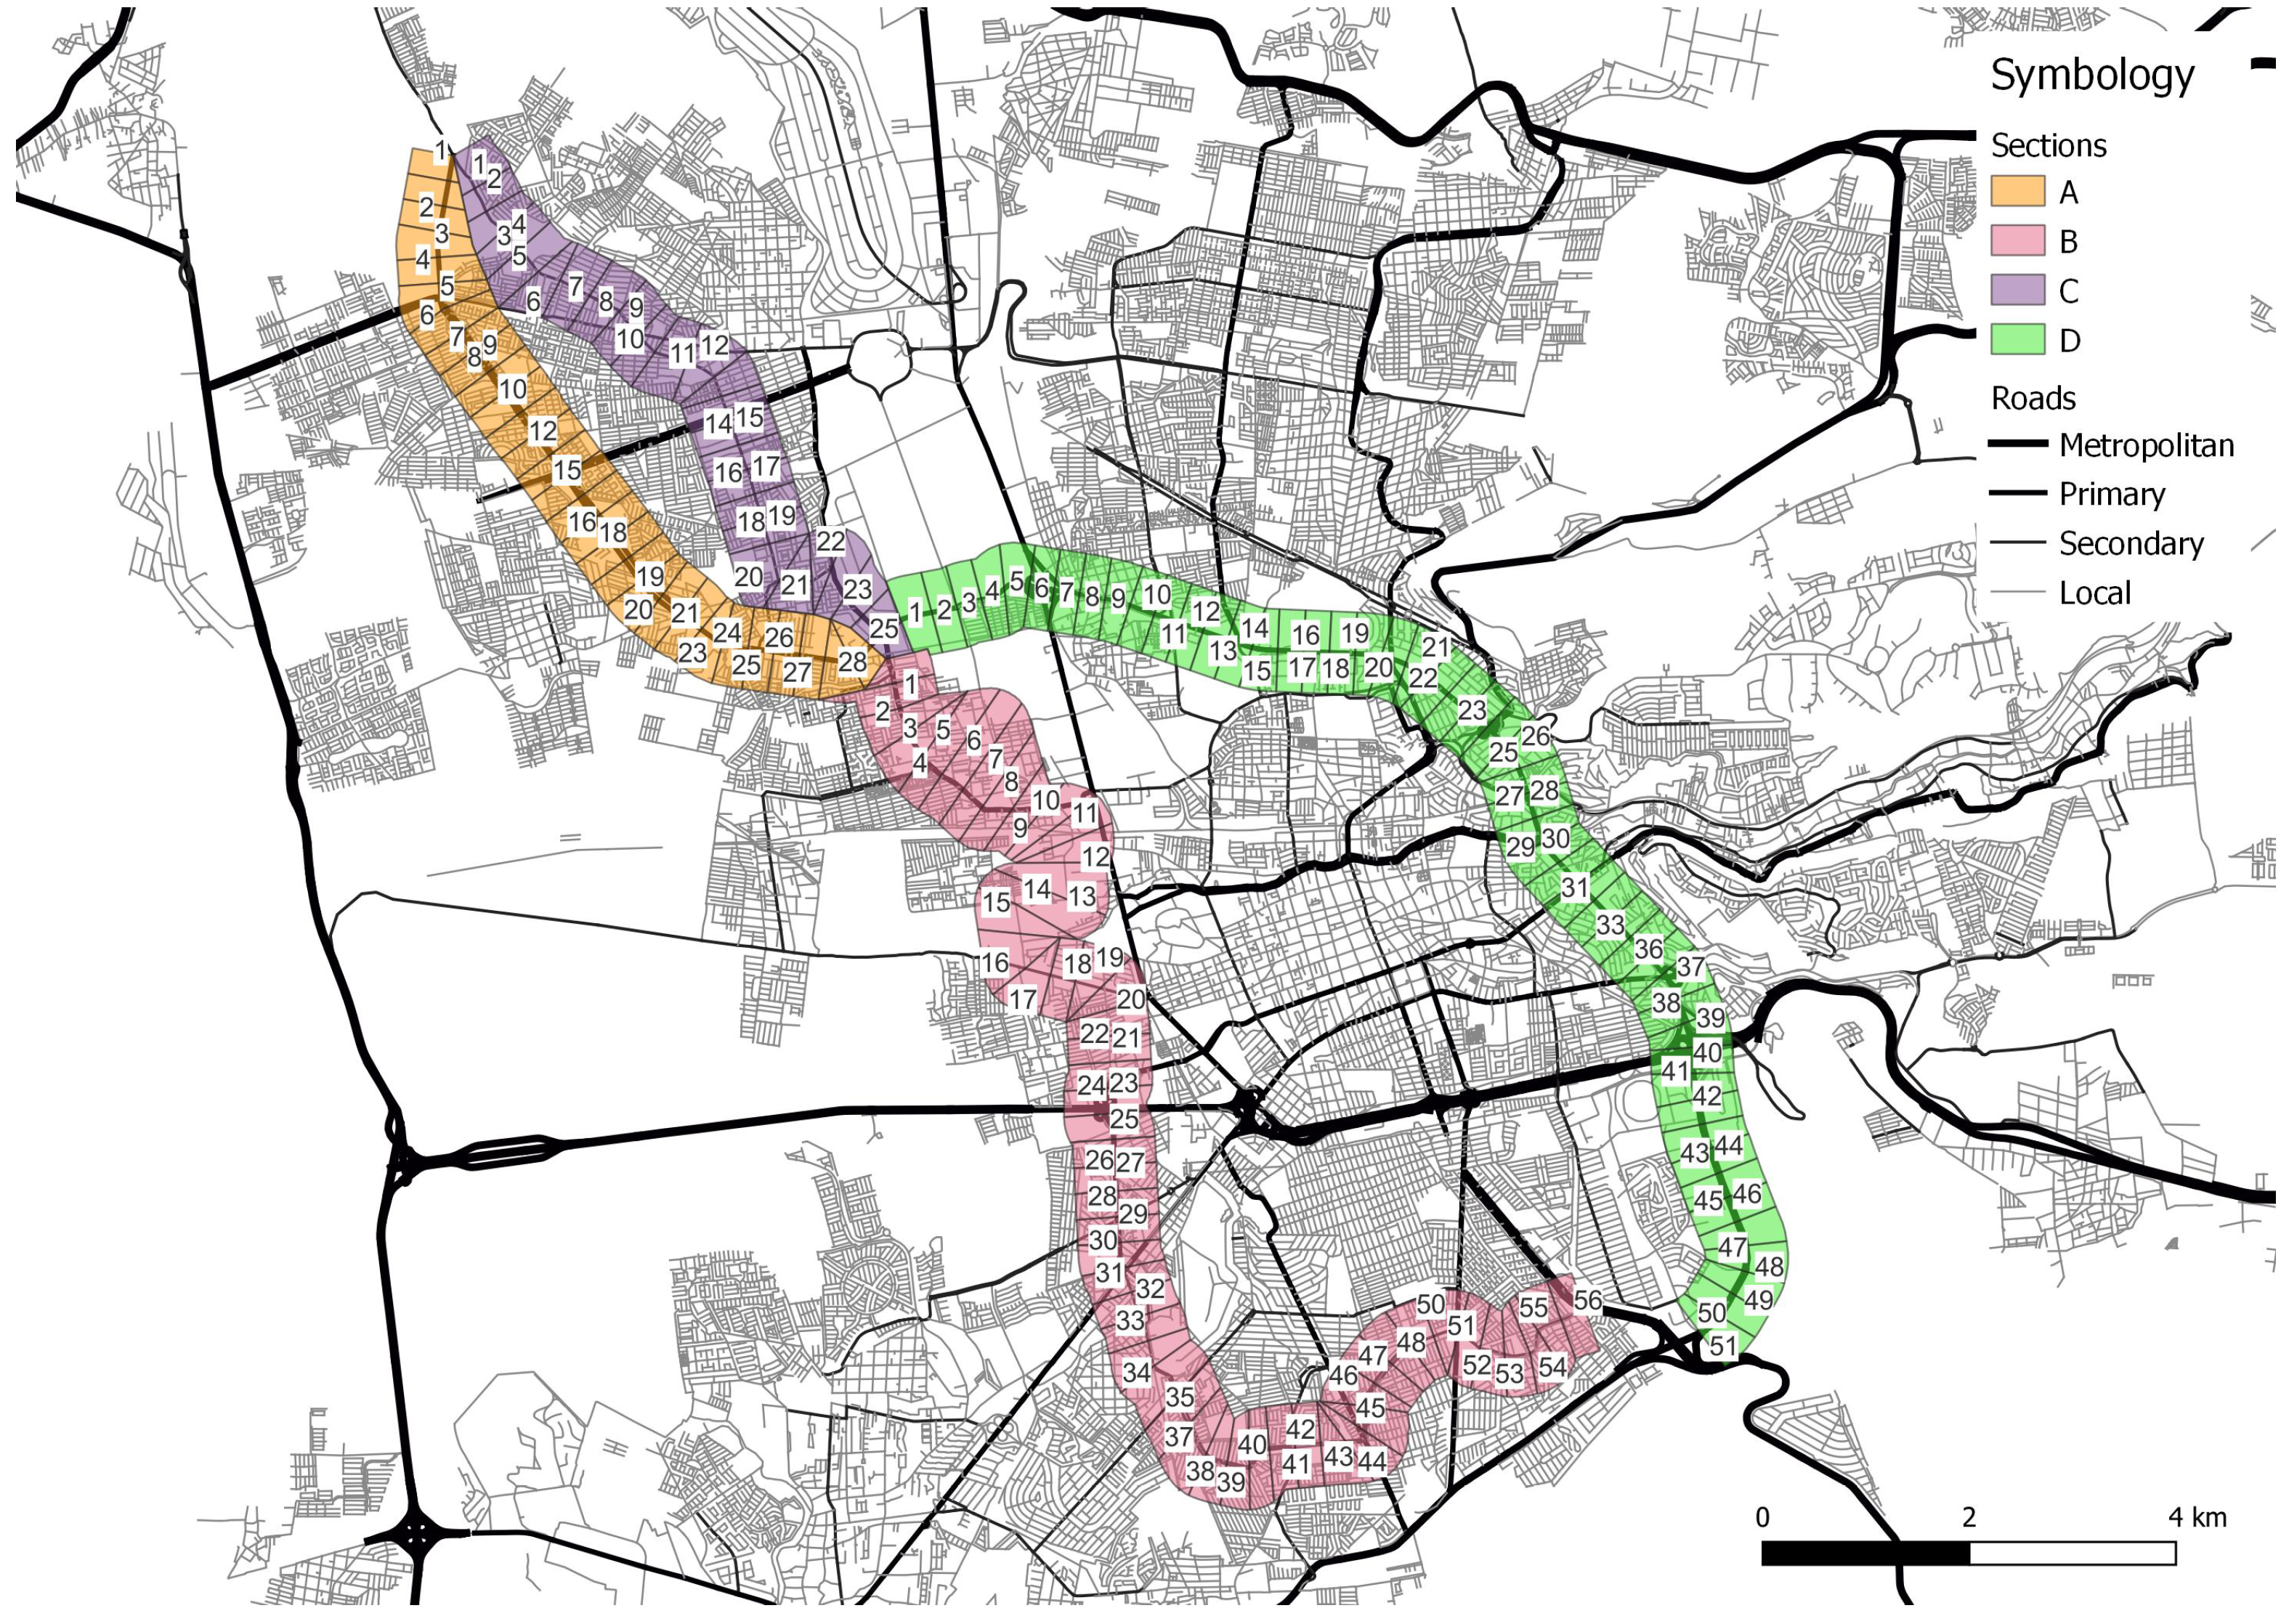
Segments do not represent individual bus stops, but spatial aggregation units defined along the corridor. Multiple observed stops—belonging to different routes, directions, and service patterns—may fall within the same segment. This approach captures cumulative service intensity and functional demand rather than stop-level geometry, reducing spatial noise and improving suitability for corridor-level analysis and neural network modeling.
By focusing on corridor-level analysis within a metropolitan context, the study captures both localized spatial effects and broader systemic interactions, while maintaining analytical relevance for cities with similar demographic size, growth trajectories, and governance constraints.
3.3. Data Sources and Spatial Units
The analysis integrates multiple secondary and primary data sources capturing structural conditions, functional mobility patterns, socio-spatial inequality, land-use transformation, housing dynamics, and road safety outcomes. Data were compiled from national statistical agencies, planning institutions, and field observations, covering the period between 2018 and 2022, depending on data availability for each indicator.
A summary of indicators, variables, spatial units, temporal coverage, and data sources is provided in Table 1, which serves as the methodological reference for the subsequent analytical steps. This explicit documentation ensures transparency and supports the reproducibility of the analytical framework.
Table 1.
Indicators, variables, spatial units, and data sources used in the analysis.
To ensure spatial comparability across heterogeneous datasets, all variables were harmonized using a fine-grained spatial grid of 100 m × 400 m cells, which serves as the primary unit of analysis, resulting in 107 segments. No data points were excluded as outliers. This increases the effective sample size while preserving corridor logic, improving ANN stability without implying stop-level precision. This resolution allows for the detection of intra-corridor variability and localized mismatches between infrastructure provision, service use, and risk exposure that would be obscured at coarser spatial scales. In addition, point-based data—such as public transport stops and crash locations—were spatially aggregated to the grid level following standardized geocoding procedures.
Structural accessibility indicators were derived from transport options, land-use distribution, and infrastructure characteristics, using a weighted composite score. Functional accessibility indicators were constructed using direct passenger observations and boarding–alighting counts conducted during peak-demand periods on weekdays. Observations were carried out at the corridor segments and station locations, covering the morning and afternoon peak hours, when public transport demand is highest. Data collection was conducted over two consecutive academic semesters, with repeated observations across multiple weekdays to reduce temporal bias. The fieldwork was supported by trained undergraduate and graduate students following a standardized manual counting protocol. Observations were subsequently aggregated at the corridor-segment level to ensure consistency with the spatial analytical units used throughout the study. Similar student-assisted, peak-hour observational approaches have been widely used in transport accessibility and transit demand studies and are considered appropriate for capturing operational conditions in contexts with limited automated data availability. Socio-spatial marginalization, land-use transformation, housing vacancy, and traffic crash data were compiled from official census records, administrative datasets, and georeferenced accident registries.
All variables used in the analysis were aggregated at the corridor-segment level, which constitutes the analytical unit of observation throughout the statistical association analysis and the artificial neural network modeling.
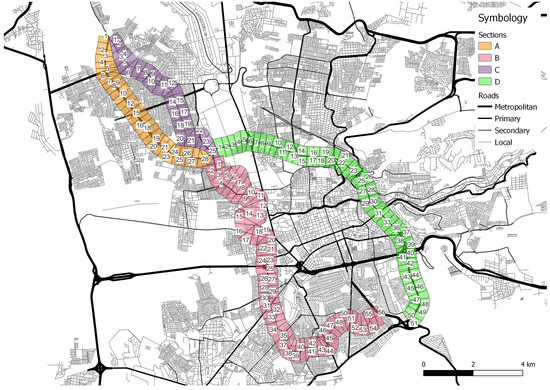
To standardize spatial comparison, each corridor was delimited by a service area buffer of 400 m—approximately a five-minute walking distance—around the corridor alignment and observed bus stops (Figure 2). This buffer defines the spatial extent for accessibility, socio-spatial, and safety indicators and constitutes the basis for subsequent statistical and ANN analyses.
Figure 2.
Buffer for the service area of both BRT corridors (). The figure provides spatial context for the corridor segmentation used in the analysis rather than a complete representation of surrounding urban areas.
These spatial units constitute the basic analytical elements for accessibility indicators, urban process variables, and ANN modeling.
3.4. Statistical Association Analysis
To provide an initial quantitative assessment of the relationships between accessibility conditions and urban processes along the selected BRT corridors, a statistical association analysis was conducted at the corridor-segment level. This step serves as a descriptive and diagnostic complement to the accessibility indices and precedes the application of non-linear modeling techniques.
Pairwise relationships between key variables were examined using scatter plots and simple linear regressions. The analysis focused on associations between structural accessibility, functional accessibility, socio-spatial marginalization, housing vacancy, land-use transformation, and traffic crash concentration. All variables were standardized prior to analysis to ensure comparability across indicators with different units and scales.
The coefficient of determination () was used as a summary measure of the strength of association between pairs of variables. Importantly, values are reported exclusively as descriptive indicators of statistical association and do not imply causality, directionality, or temporal dependence. The purpose of this analysis is to identify spatial co-variation patterns that may signal structural mismatches or reinforcing dynamics along the corridor, rather than to establish explanatory or predictive models.
This association analysis provides a transparent baseline against which the results of the artificial neural network modeling can be interpreted. By contrasting linear associations with non-linear patterns identified through ANN, the study distinguishes between simple correlations and more complex interaction structures within the corridor system.
3.5. Artificial Neural Network (ANN) Modeling
To complement the statistical association analysis and explore potential non-linear interaction patterns among accessibility conditions and urban processes, an artificial neural network (ANN) was implemented as an exploratory analytical tool. The ANN was not designed for predictive forecasting or causal inference, but rather to support pattern recognition and system-level diagnostics within the corridor context.
The model was implemented and trained using the Neural Network Toolbox [46], and a feedforward neural network architecture with a single hidden layer. Tangent sigmoid activation functions were employed in the hidden layer, while a linear activation function was used in the output layer to preserve the continuous nature of the dependent variables. Input variables included structural accessibility, functional accessibility, and selected urban process indicators, whereas output variables focused on traffic crash concentration and socio-spatial marginalization at the corridor-segment level.
All input variables were normalized prior to model training to ensure numerical stability and comparability. The dataset was randomly partitioned into training (70%), validation (15%), and testing (15%) subsets to mitigate overfitting and assess model robustness. Model performance was evaluated using Mean Squared Error (MSE) and the coefficient of determination (), which are reported as diagnostic indicators of model fit rather than measures of predictive accuracy.
The ANN outputs are interpreted qualitatively, emphasizing the identification of interaction patterns and sensitivity relationships rather than exact numerical predictions. In this sense, the ANN serves as a complementary lens to the linear association analysis, enabling the exploration of complex relationships between infrastructure provision, observed mobility behavior, and urban risk that may not be captured through conventional statistical techniques. This exploratory use of ANN supports strategic reflection on BRT corridor planning without implying deterministic or causal conclusions.
3.6. Methodological Limitations
This study is subject to several methodological limitations that should be considered when interpreting the results. First, the analysis is cross-sectional, relying on data aggregated over defined time periods rather than continuous temporal observations. As such, the findings reflect spatial co-variation patterns rather than dynamic processes or temporal causality.
Second, the spatial unit of analysis—corridor-aligned segments defined by a 100 m longitudinal resolution and a 400 m walk-access buffer—represents an analytical abstraction intended to support comparative assessment across heterogeneous datasets. While this aggregation improves analytical coherence and model stability, it may mask fine-grained stop-level or individual behavioral variations.
Third, the use of correlation analysis and artificial neural network modeling is explicitly exploratory. Statistical associations and ANN outputs are interpreted as diagnostic indicators of interaction patterns rather than as evidence of causal mechanisms or predictive performance. Consequently, the results should be understood as supporting strategic reflection on accessibility, equity, and safety trade-offs in BRT corridor planning, rather than providing operational or deterministic recommendations.
Despite these limitations, the methodological framework offers a robust and transferable approach for diagnosing structural mismatches in mid-sized, rapidly growing cities, where data constraints and fragmented transport systems often limit the applicability of fully predictive models.
4. Results
4.1. Functional Accessibility Patterns Along the BRT Corridors
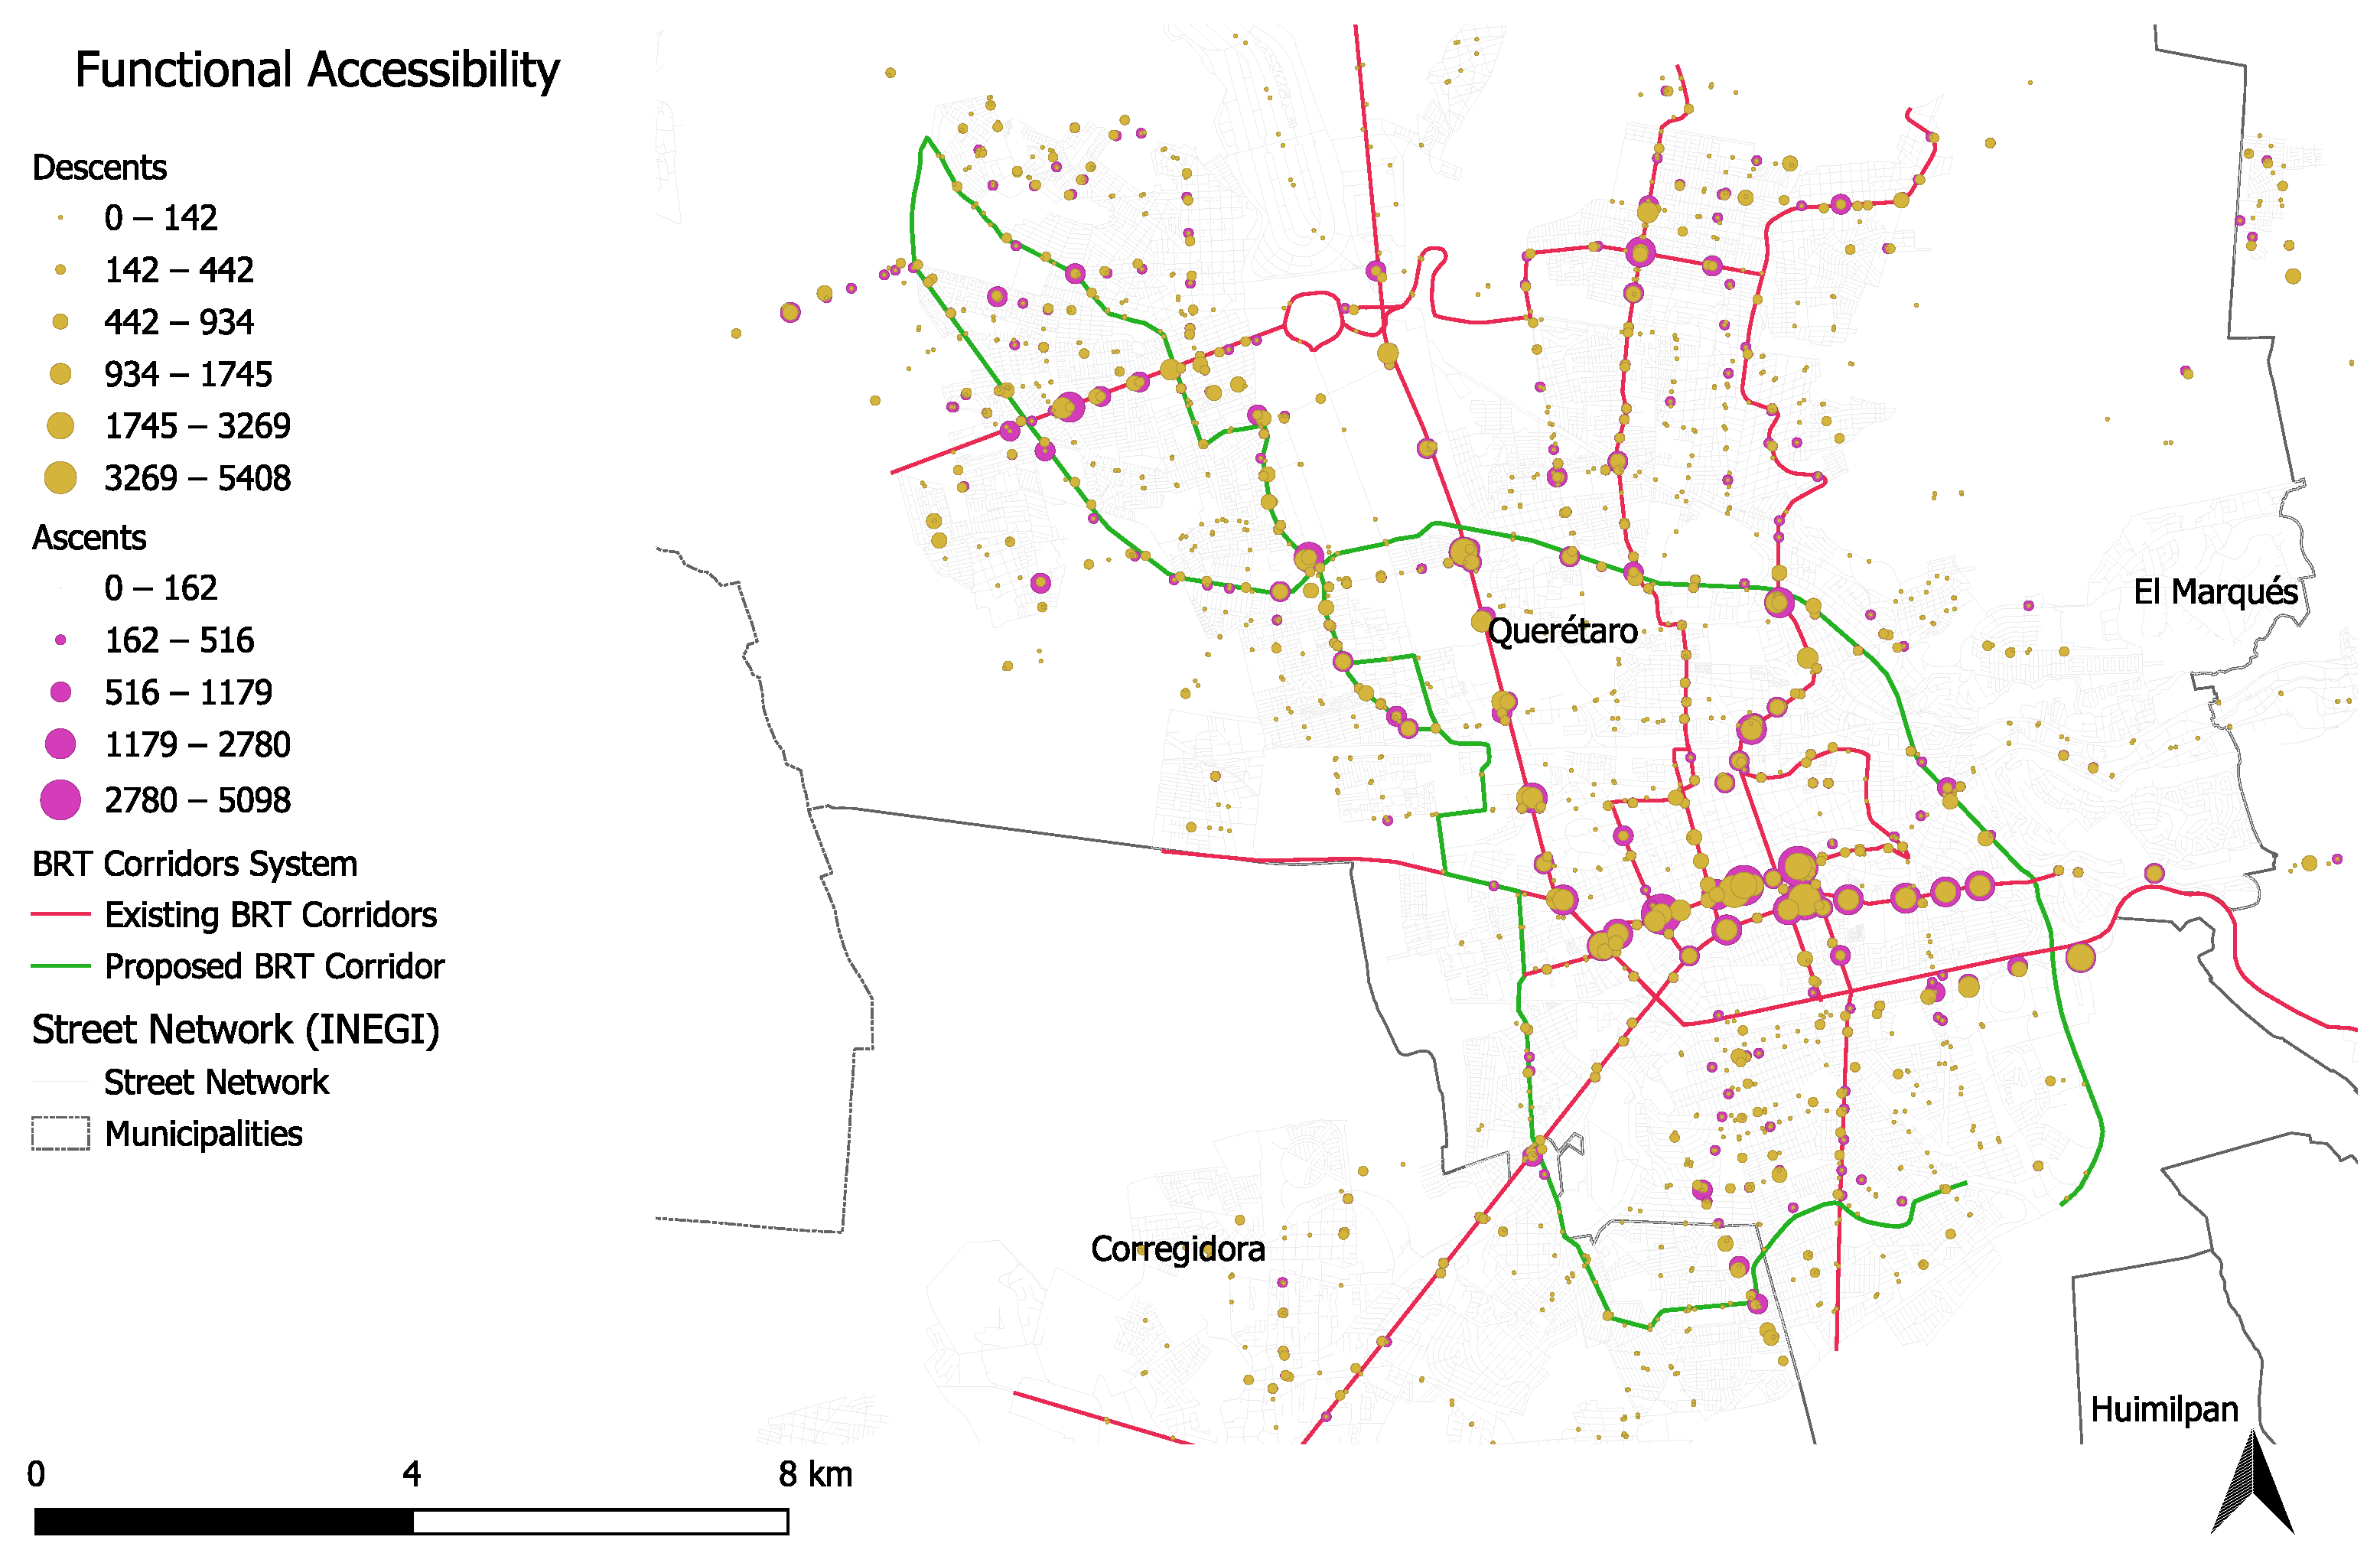
Functional accessibility patterns reveal a highly uneven distribution of effective public transport service along the analyzed corridors. The Functional Accessibility Index (FAI), derived from observed boarding and alighting activity, service frequency, and stop-level demand, captures the lived performance of the existing transit system rather than its planned or infrastructural potential.
As illustrated in Figure 3, high functional accessibility values are spatially concentrated around a limited number of nodes, typically associated with consolidated urban centers, transfer points, and historically established transit corridors. In contrast, extended corridor segments exhibit low to moderate functional accessibility despite being located within the nominal service area of public transport routes. This pattern reflects a mismatch between route coverage and actual service effectiveness, highlighting areas where nominal access does not translate into meaningful mobility opportunities.
Figure 3.
Functional Accessibility Index (FAI). Note: Higher values indicate greater accessibility. The figure provides spatial context for the distribution of functional accessibility along the proposed BRT corridors. See Table 1 for variable composition.
Notably, functional accessibility does not follow a continuous linear pattern along the corridor axis. Instead, it displays pronounced discontinuities driven by operational factors such as stop spacing, service frequency, route overlap, and passenger demand concentration. These discontinuities suggest that accessibility experienced by users is shaped more by operational decisions and network integration than by geometric proximity alone.
From an urban perspective, areas with low functional accessibility frequently coincide with peripheral neighborhoods, fragmented land-use patterns, and limited multimodal integration. These findings reinforce the notion that functional accessibility is sensitive to socio-spatial structure and service quality, making it a critical diagnostic indicator for identifying priority intervention zones prior to BRT implementation.
Importantly, the spatial distribution of functional accessibility serves a descriptive and diagnostic role in this study. The observed patterns are not interpreted as causal determinants of urban outcomes but rather as spatial expressions of current transit system performance. These patterns provide the empirical basis for subsequent association analysis and exploratory artificial neural network modeling.
While structural accessibility provides a strong proxy for potential public transport demand, its relationship with broader urban processes—such as socio-spatial marginalization or housing dynamics—remains non-linear and context-dependent. This reinforces the exploratory nature of the analysis and highlights the role of operational design in translating structural potential into functional performance.
4.2. Structural Accessibility Patterns
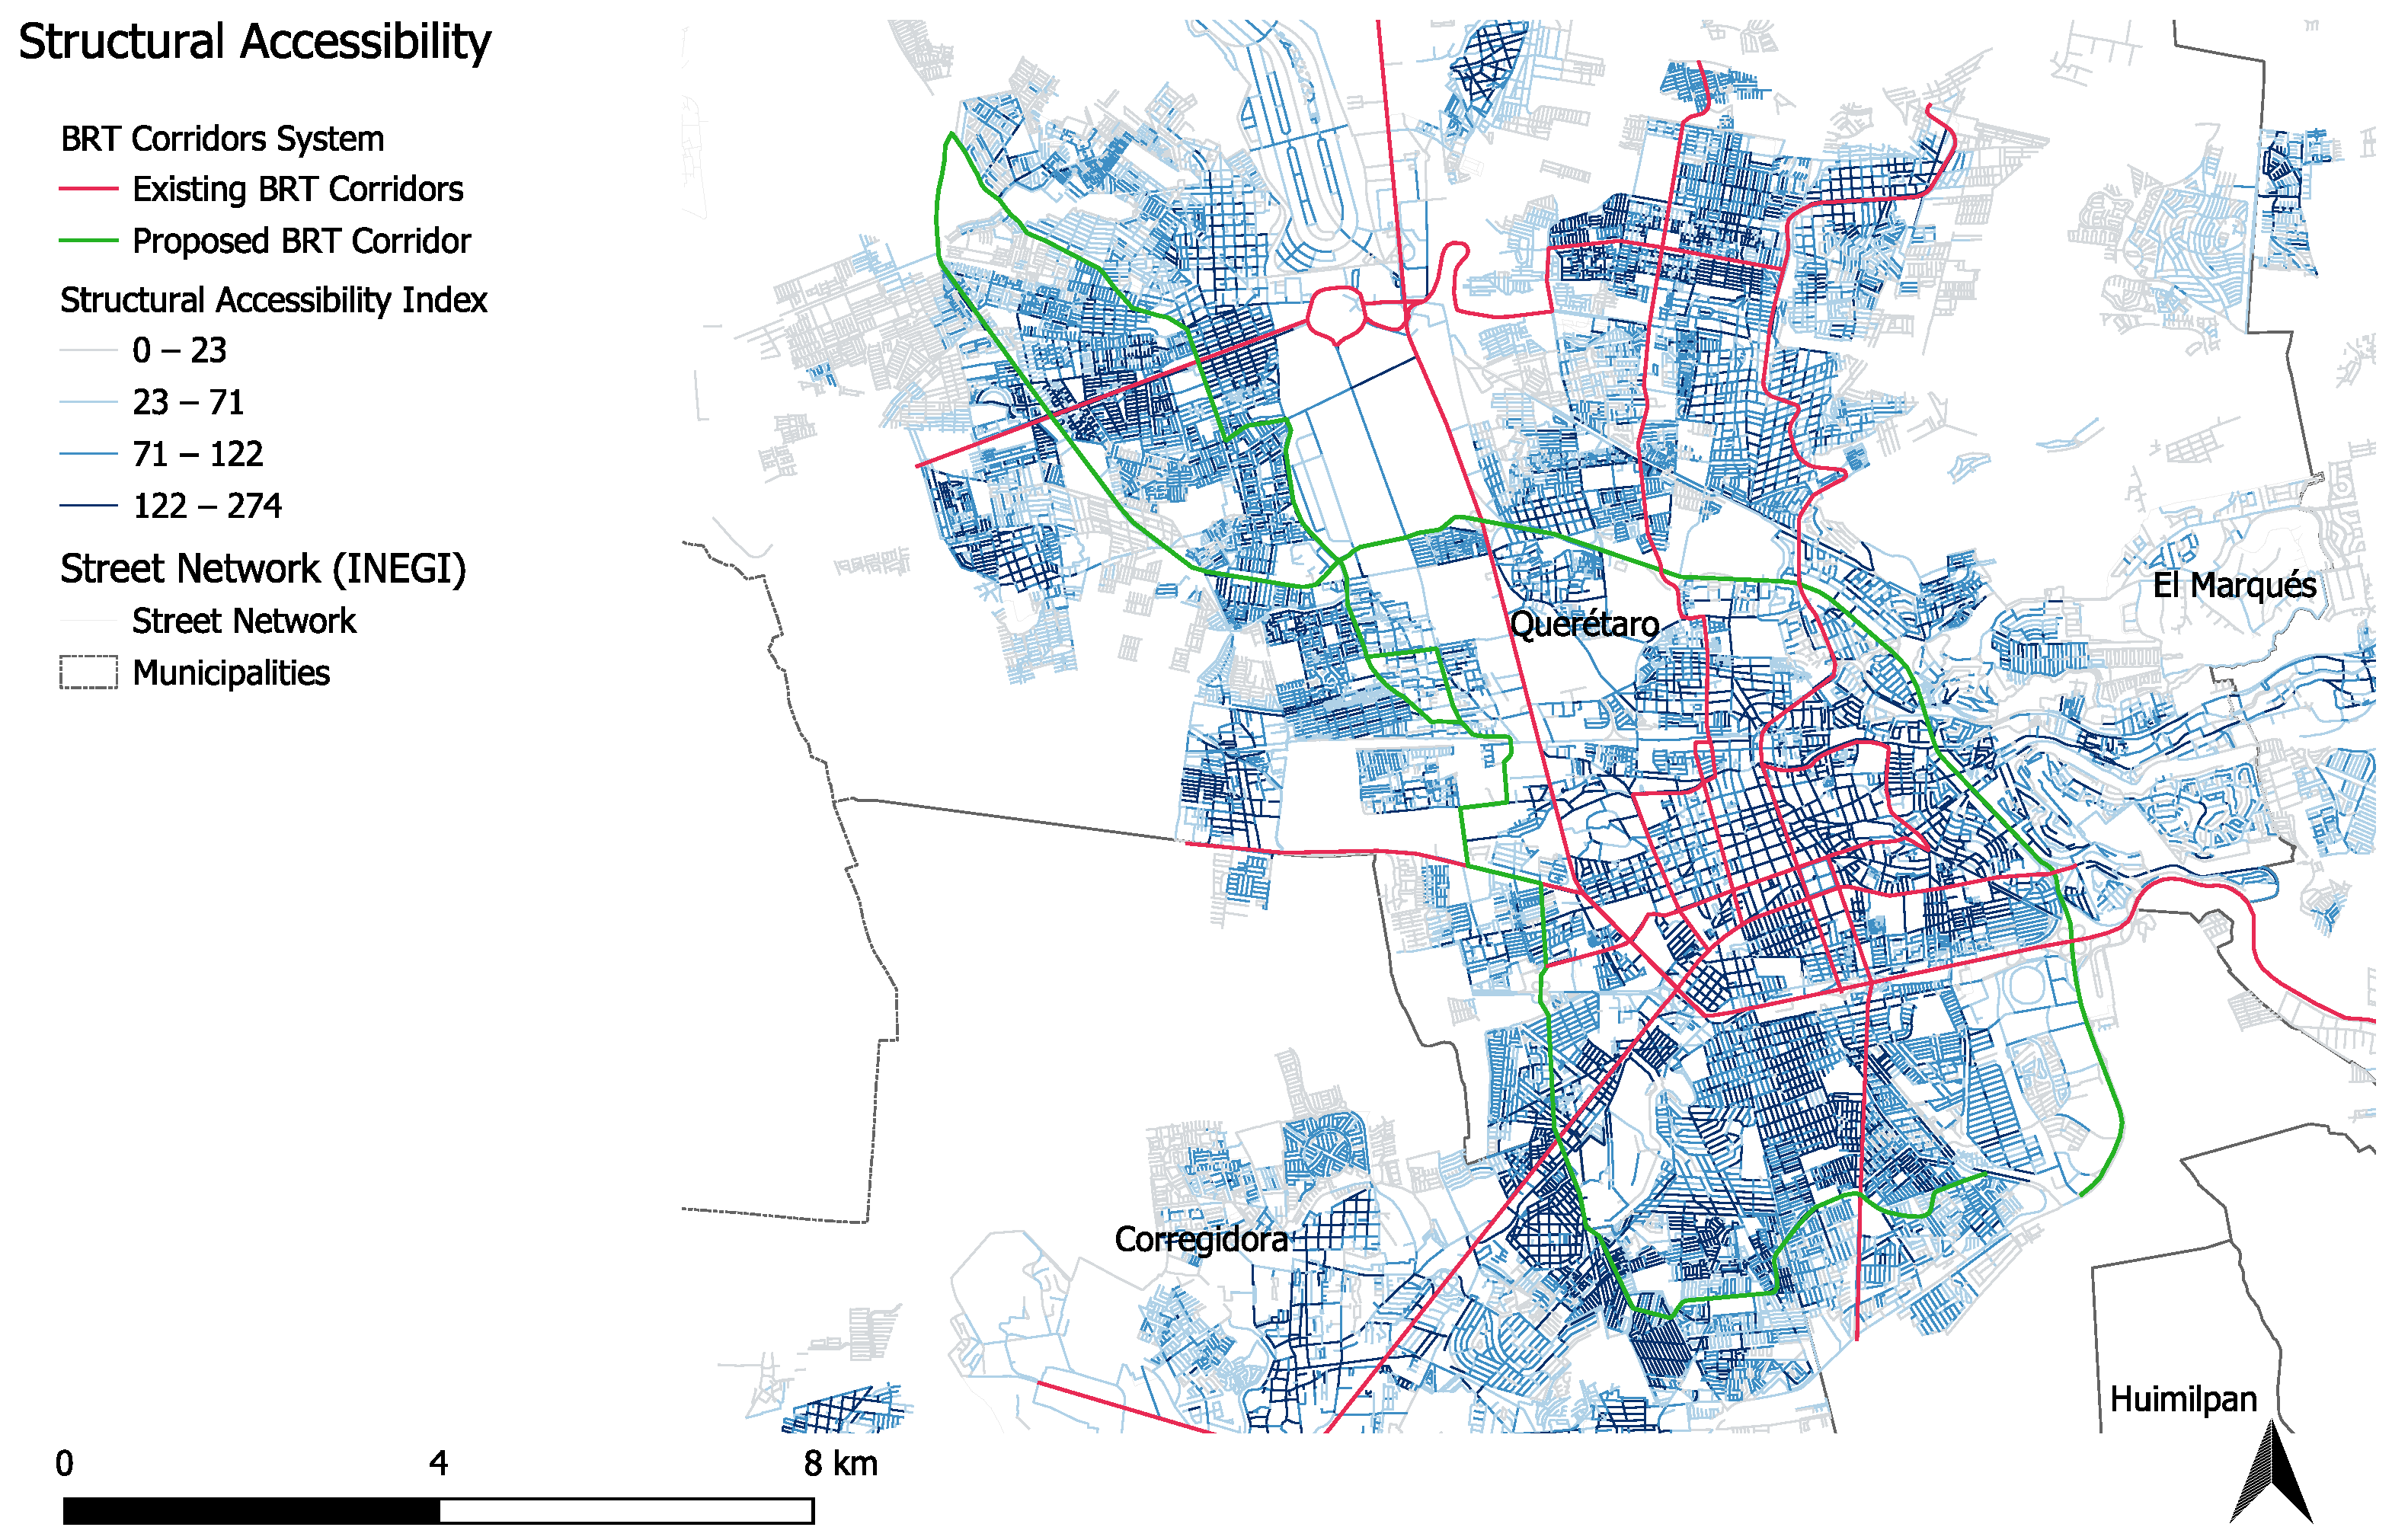
Structural accessibility patterns reflect the spatial distribution of potential access embedded in the urban form and transport infrastructure, independent of actual service operation or observed demand. The Structural Accessibility Index (SAI) captures the cumulative opportunities generated by the street network configuration, land-use distribution, and proximity to key activities within the 400 m corridor service areas.
Figure 4 shows the spatial distribution of structural accessibility along the two analyzed corridors. Higher SAI values are concentrated in central and consolidated urban areas characterized by denser street networks, mixed land uses, and higher concentrations of employment and services. These segments exhibit strong theoretical connectivity and spatial opportunity, even in locations where current public transport performance remains limited.
Figure 4.
Structural Accessibility Index (SAI). Note: Higher values indicate greater accessibility. The figure provides spatial context for the distribution of structural accessibility along the proposed BRT corridors. See Table 1 for variable composition.
Conversely, lower structural accessibility values are observed in peripheral segments and recently urbanized areas, where fragmented street layouts, mono-functional land use, and lower infrastructure provision constrain potential accessibility. In these areas, the spatial structure itself limits the capacity of future high-capacity transit investments to generate equitable access without complementary land-use and network interventions.
Importantly, the spatial pattern of structural accessibility does not uniformly align with observed functional accessibility or traffic safety outcomes. Several segments display relatively high structural accessibility but low functional performance, indicating unrealized accessibility potential. Other segments exhibit low structural accessibility despite current service presence, reflecting infrastructural and urban form constraints that may hinder long-term system efficiency.
These results highlight that structural accessibility represents a necessary but insufficient condition for effective and equitable transit performance. The identified spatial heterogeneity underscores the importance of distinguishing between potential accessibility embedded in urban structure and accessibility actually experienced by users.
4.3. Spatial Mismatches Between Structural and Functional Accessibility
The comparison between structural and functional accessibility reveals systematic discrepancies along the analyzed BRT corridors. While structural accessibility reflects the potential connectivity embedded in urban form and infrastructure, functional accessibility captures the realized performance of public transport services. Examining both dimensions simultaneously highlights corridor segments where planned or potential access does not translate into effective mobility conditions.
Across the corridors, segments with high structural accessibility do not consistently exhibit high functional accessibility. These cases typically correspond to areas with favorable spatial configurations—such as dense street networks and proximity to employment or services—where operational constraints, service frequency, or network integration limit the effective use of public transport. Conversely, some segments display relatively higher functional accessibility despite lower structural accessibility, suggesting localized service concentration or route overlap in areas with weaker underlying urban structure.
Rather than forming a uniform pattern, these discrepancies vary along the corridor axis and across different urban contexts. This spatial heterogeneity indicates that accessibility outcomes emerge from the interaction between infrastructure provision, service operation, and demand concentration, rather than from any single factor in isolation.
Importantly, the identification of structural–functional mismatches serves a diagnostic purpose within this study. The observed discrepancies are not interpreted as evidence of causal relationships or directional effects between accessibility dimensions. Instead, they motivate further examination through statistical association analysis and exploratory neural network modeling, which are used to assess whether these discrepancies systematically co-vary with broader urban processes and road safety conditions.
4.4. Accessibility, Urban Processes, and Road Safety
To further examine how accessibility conditions relate to broader urban dynamics, this section explores descriptive associations between accessibility indicators and selected urban processes, including socio-spatial marginalization, housing vacancy, land-use transformation, and road crash concentration. These relationships are analyzed at the corridor-segment level using scatter plots and simple linear regressions, with the objective of identifying patterns of spatial co-variation rather than causal mechanisms.
Scatter plots comparing structural accessibility with socio-spatial marginalization and road crash concentration reveal weak to moderate associations characterized by substantial dispersion. In several cases, segments with relatively high structural accessibility exhibit a wide range of marginalization levels and crash frequencies, suggesting that potential connectivity alone does not consistently translate into improved social or safety outcomes. These results indicate that structural accessibility captures an important but incomplete dimension of urban performance.
In contrast, functional accessibility shows more pronounced associations with both socio-spatial marginalization and road crash concentration. Scatter plots display clearer clustering patterns, particularly in segments where high functional accessibility coincides with elevated crash intensity and higher levels of urban vulnerability. While these associations remain heterogeneous and non-linear, they suggest that realized mobility intensity and service concentration may be more closely aligned with observed urban risks than infrastructural potential alone.
Across all scatter plots, reported values are interpreted strictly as descriptive measures of association. They are used to assess the degree of spatial co-variation between accessibility indicators and urban processes, without implying directionality, causation, or predictive capacity. The observed dispersion and non-linearity across relationships further indicate that linear models capture only a limited portion of the underlying interactions.
Taken together, these results highlight that accessibility-related urban risks emerge from complex interactions between infrastructure, service operation, and socio-spatial context. The limited explanatory capacity of linear associations motivates the use of exploratory artificial neural network modeling in the following section, where non-linear and multivariate interaction patterns are examined without assuming predefined functional relationships.
4.5. Exploratory Artificial Neural Network Analysis
To complement the descriptive and linear association analysis presented in the previous section, an exploratory artificial neural network (ANN) was employed to examine potential non-linear interaction patterns between accessibility indicators, urban processes, and road safety conditions. The objective of this analysis is not prediction or causal inference, but rather the identification of multivariate patterns that may remain obscured under linear modeling assumptions.
The ANN was trained using corridor-segment-level observations incorporating structural and functional accessibility indicators alongside variables representing socio-spatial marginalization, housing vacancy, land-use transformation, and road crash concentration. Input variables were standardized prior to training to ensure numerical stability and comparability across dimensions. Model performance was evaluated using standard goodness-of-fit metrics, while residual analysis was used to assess model consistency and identify segments exhibiting atypical behavior.
ANN outputs reveal interaction patterns that differ from those suggested by simple bivariate associations. In particular, segments characterized by moderate levels of both structural and functional accessibility display a wide range of safety and socio-spatial outcomes, indicating that accessibility effects are contingent on the simultaneous configuration of multiple urban processes. These results suggest the presence of threshold effects and non-linear responses that cannot be adequately captured through linear regression alone.
The statistical association analysis was conducted at the corridor-segment level to explore relationships between accessibility indicators and selected urban processes. Table 2 reports the coefficient of determination () for each bivariate relationship, disaggregated by corridor segment (A–D), highlighting the spatial heterogeneity of associations across the study area.
Table 2.
Coefficient of determination () for bivariate associations between accessibility indicators and selected urban processes, by corridor segment.
The reported values are interpreted as descriptive measures of association rather than evidence of causality or directionality. Higher values indicate stronger spatial co-variation between variables within specific corridor segments, providing a diagnostic basis for subsequent non-linear exploration through artificial neural network modeling.
Importantly, ANN results are interpreted strictly as exploratory diagnostics. Model outputs do not establish causal directionality, nor are they used to generate forecasts or evaluate intervention scenarios. Instead, they serve to highlight complex interaction spaces where accessibility, inequality, and urban risk co-occur in non-linear ways. These findings reinforce the need for integrated planning approaches that address infrastructural, operational, and socio-spatial dimensions simultaneously.
Overall, the ANN analysis supports the central argument of this study: That accessibility-related urban outcomes in emerging cities are shaped by interacting structural and functional conditions rather than by isolated variables. By revealing patterns beyond linear association, the ANN provides complementary evidence that informs the subsequent discussion on planning implications for BRT corridor development.
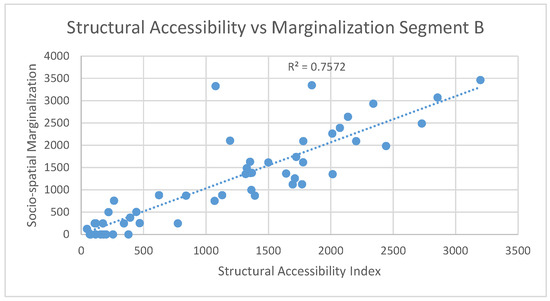
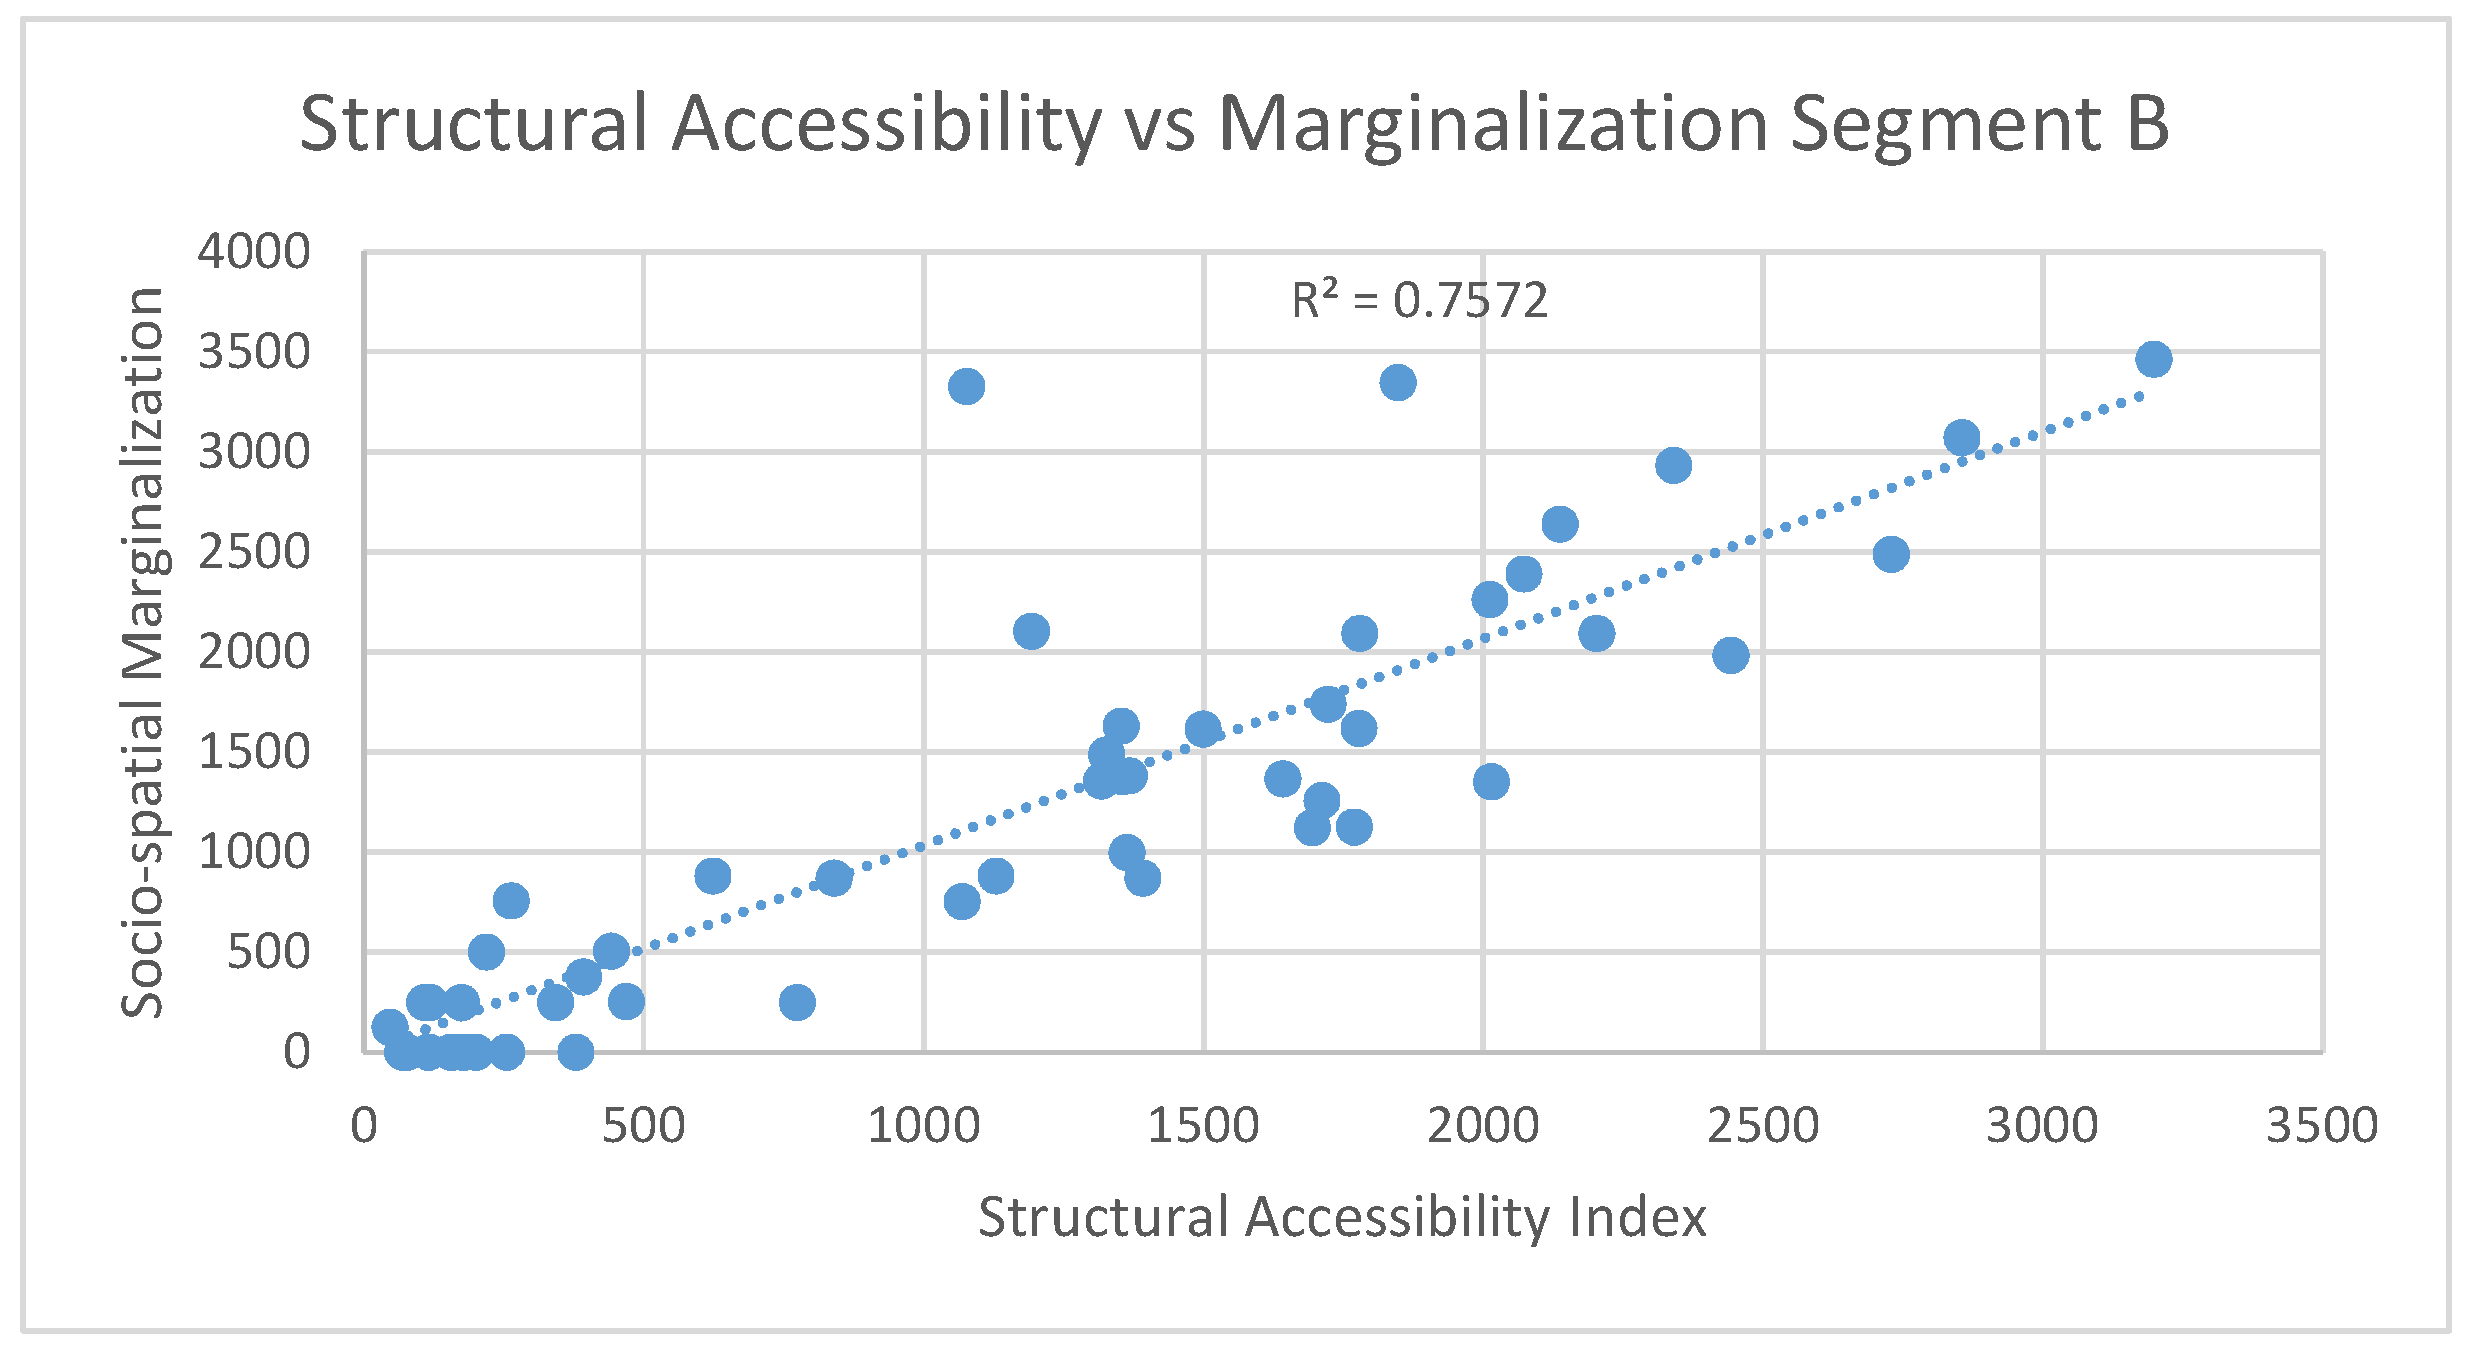
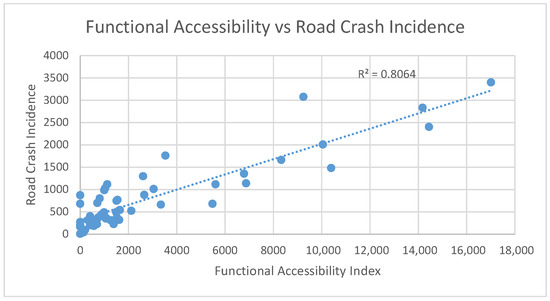
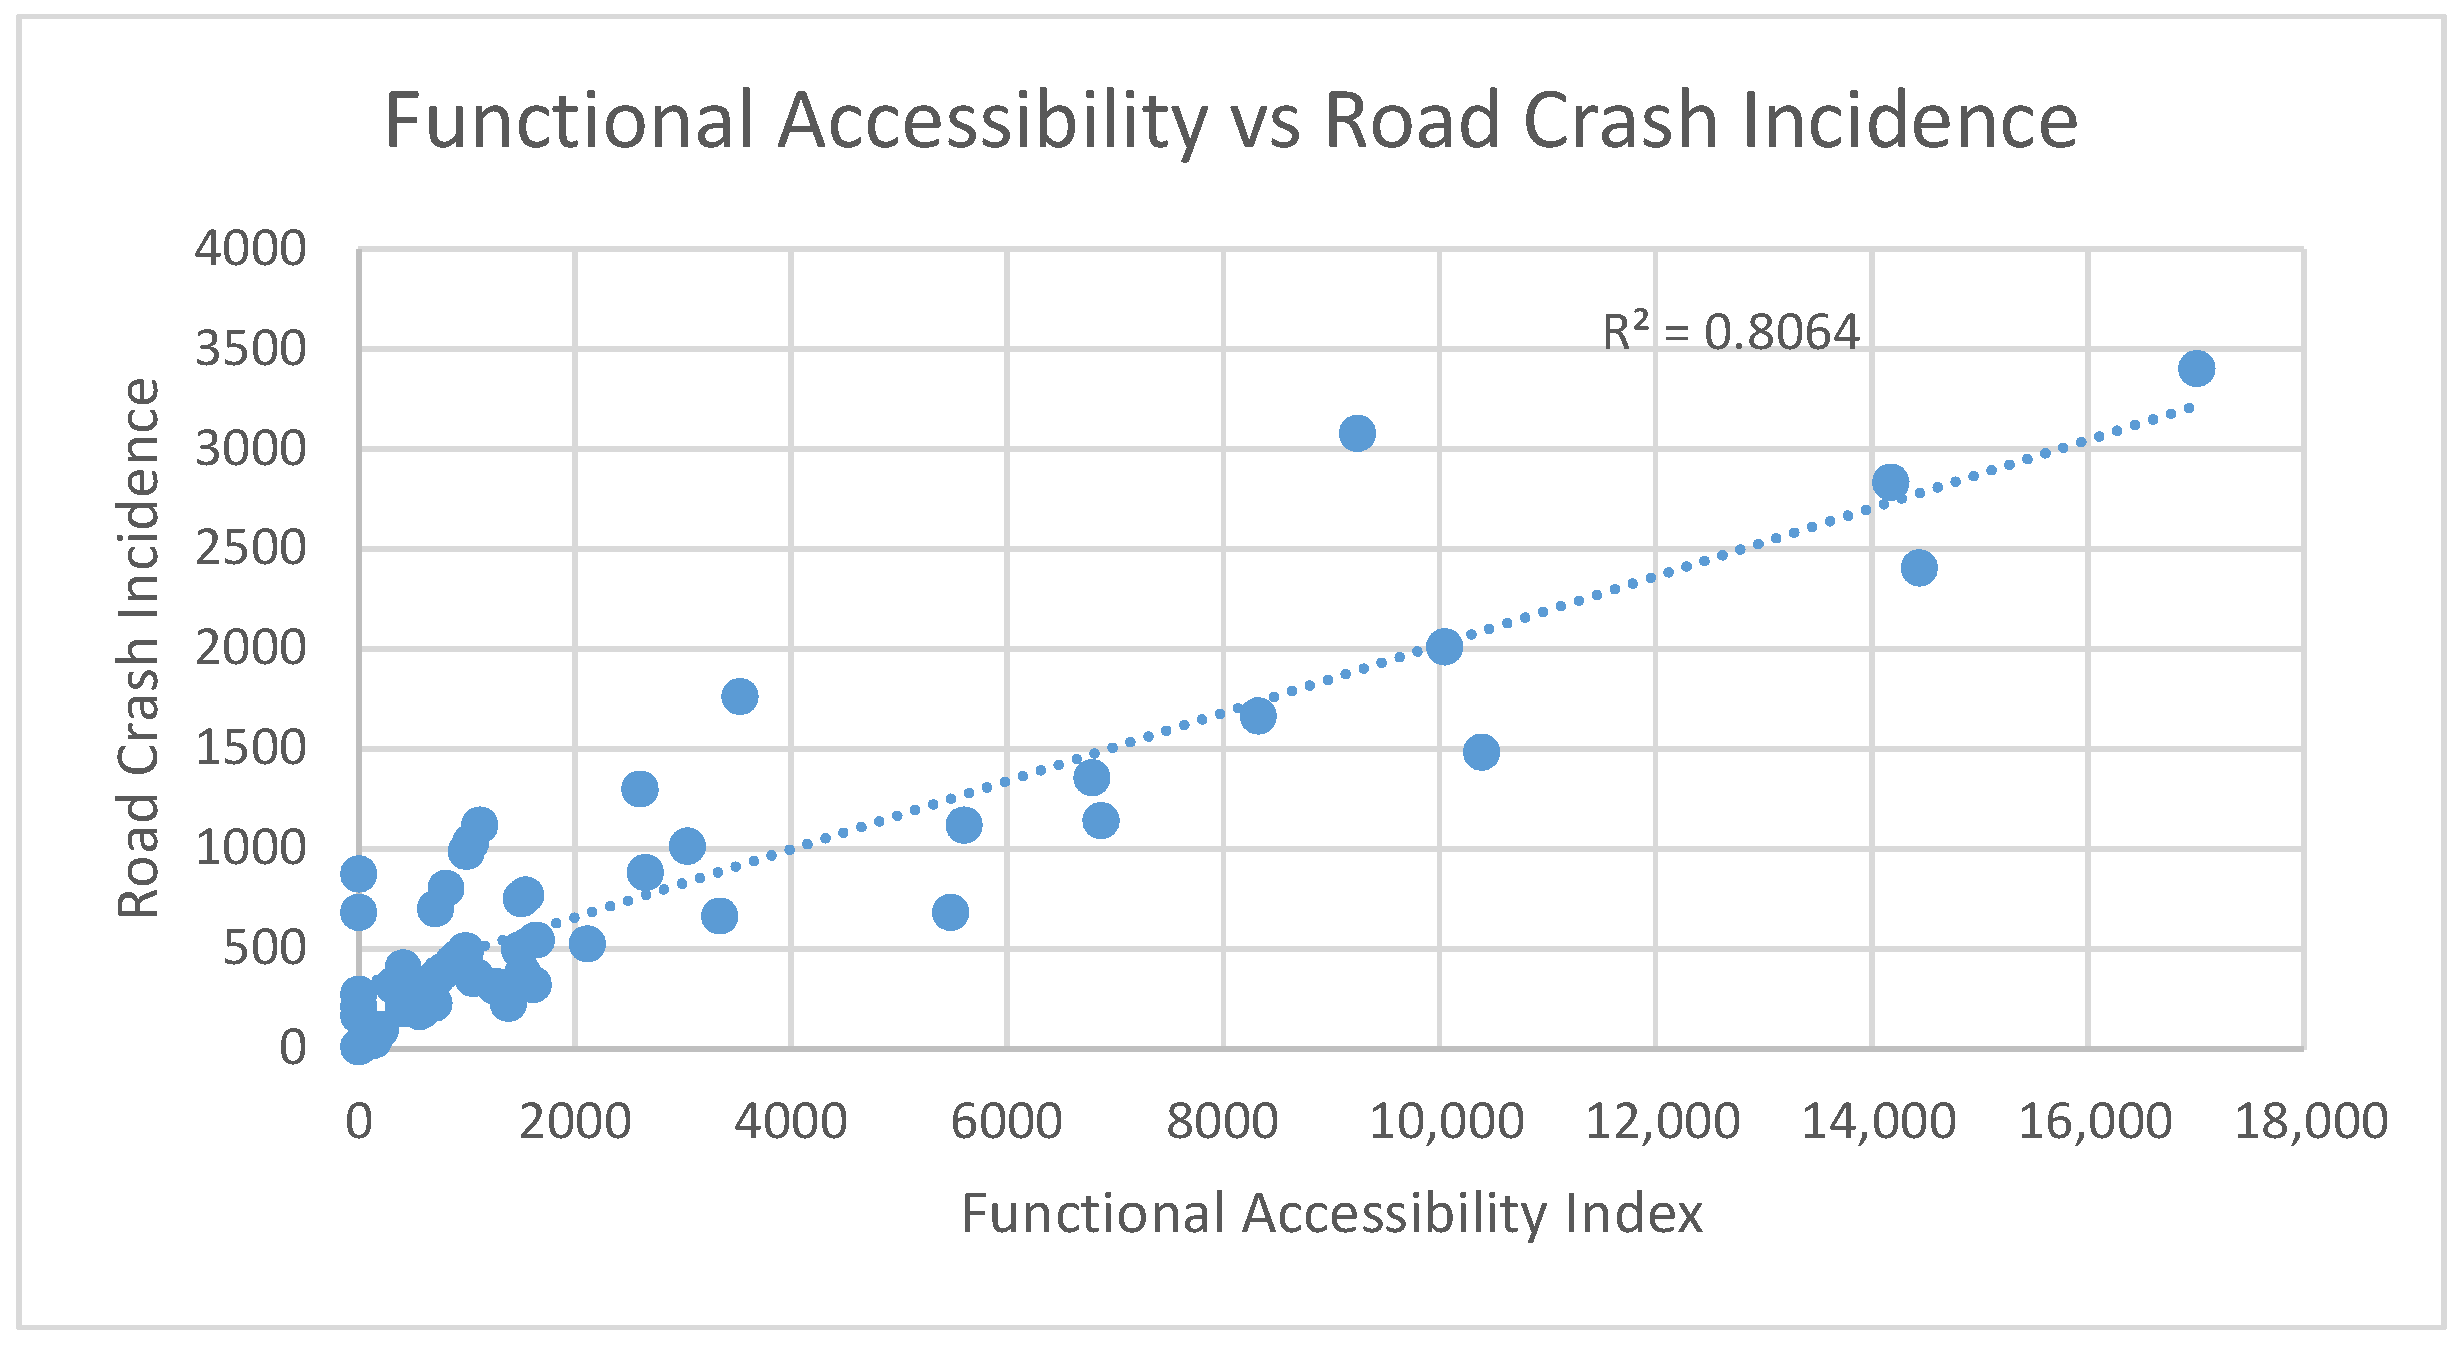
For clarity and conciseness, only the two strongest and most consistent associations are presented graphically. Figure 5 illustrates the relationship between structural accessibility and socio-spatial marginalization, while Figure 6 shows the association between functional accessibility and road crash incidence for Segment B.
Figure 5.
Structural Accessibility vs. Socio-spatial Marginalization in Segment B. Each point represents a corridor segment unit (). The dashed line indicates the linear regression trend (). Note: The Structural Accessibility Index (SAI, x-axis) is a composite score (theoretical max = 294) derived from 14 weighted urban-form variables. The Socio-spatial Marginalization Index (y-axis) is a standardized CONEVAL metric.
Figure 6.
Functional Accessibility vs. Road Crash Incidence in Segment B. Each point represents a corridor segment unit (). The dashed line indicates the linear regression trend (). Note: The Functional Accessibility Index (FAI, x-axis) represents aggregated passenger counts and service frequency (observed max = 5408). Road Crash Incidence (y-axis) shows total crashes per corridor segment.
5. Discussion
The results reveal a systematic misalignment between structural and functional accessibility across the analyzed BRT corridors, supporting H2 and [1,2]. While structural accessibility captures the spatial potential derived from infrastructure provision, land-use configuration, and service proximity, functional accessibility reflects the lived performance of the transport system, shaped by operational practices, service frequency, and passenger behavior. The weak association between both indicators indicates that infrastructural readiness alone is insufficient to guarantee effective public transport accessibility.
This structural–functional gap is particularly evident in corridors characterized by fragmented routes and informal stopping practices. Although many observed bus stops respond to localized user demand, their cumulative effect disperses boarding activity and weakens corridor-level consolidation. As a result, areas that are structurally prepared to support high-capacity transit fail to translate this potential into coherent and functional performance.
It is important to recall that the structural accessibility index reflects the spatial distribution of infrastructure, land use, and service proximity, whereas functional accessibility captures observed public transport performance. The mismatch between both indices underscores the role of stop spacing and operational fragmentation in shaping real accessibility outcomes.
The observed weak linear association between structural and functional accessibility does not indicate a failure of accessibility planning, but rather reveals the limitations of stop-by-stop operational decisions driven by localized demand. This supports the need for BRT systems with strategically spaced stations capable of converting structural accessibility potential into coherent functional performance.
The contrasting behavior of accessibility indicators in relation to road crash incidence further clarifies this distinction. Structural accessibility shows limited association, suggesting that infrastructure configuration and land-use proximity do not inherently generate traffic risk. In contrast, functional accessibility exhibits a strong positive relationship with crash incidence, reflecting exposure effects linked to boarding intensity and pedestrian–vehicle congestion. This aligns with [42], which indicates that road safety outcomes are primarily driven by functional conditions rather than by structural accessibility alone. And with the concept of “structural violence” embedded in infrastructure [34].
Beyond mobility performance, structural accessibility also behaves as a proxy for broader urban habitability. Its stronger associations with socio-spatial marginalization and housing dynamics resonate with the concepts of spatial justice [32] and persistent segregation [12]. In this sense, structural accessibility captures systemic urban conditions, whereas functional accessibility responds to short-term operational dynamics.
The artificial neural network analysis complements these findings by identifying non-linear interaction patterns. Following the exploratory tradition of [26], our ANN functions as a diagnostic tool rather than a predictive model. This aligns with computational urban science methods [18], reinforcing the interpretation of accessibility-related urban outcomes as emergent properties of interacting structural and functional processes.
These results hold important implications for mid-tier transit systems, such as BRT, LRT, and emerging trackless tram models, which rely on fixed stations, operational regularity, and demand consolidation. Without strategic station placement and service rationalization, such systems risk reproducing the observed structural–functional mismatch, limiting their capacity to improve accessibility, safety, and equity outcomes.
Policy and Planning Implications
In the short term, the findings suggest the need for operational adjustments along existing and planned BRT corridors, particularly regarding stop spacing, boarding and alighting management, and service regularity. Improving functional accessibility through more coherent station design and controlled stopping patterns may reduce safety risks associated with dispersed passenger movements and informal operational practices.
A metropolitan mobility authority is the non-negotiable first step—not only to regulate routes and frequencies but to orchestrate the corridor as a unified structuring entity. This must be accompanied by:
- Fiscal instruments to activate unoccupied housing in high-accessibility zones.
- Public-space redesigns that prioritise safety over vehicular flow.
- Affordable-housing programs to preempt displacement along upgraded corridors.
This is already in march with the Agencia de Movilidad del Estado de Queretaro.
In the medium term, planning authorities should integrate structural and functional accessibility indicators into corridor design and evaluation processes. This includes aligning land-use planning, pedestrian infrastructure, and station locations to ensure that areas with high structural accessibility effectively translate into functional accessibility and safer mobility outcomes.
In the long term, the results point to broader institutional and governance challenges. Addressing socio-spatial inequality and transport safety requires coordinated policies across transport, housing, and urban development sectors. Structural accessibility alone is insufficient if institutional fragmentation and uncoordinated decision-making continue to undermine functional system performance.
This research provides not just a diagnostic method, but a blueprint for turning transport corridors into engines of equitable urban form.
6. Conclusions and Future Research Lines
This study examined the relationships between structural accessibility, functional accessibility, and selected urban processes along two planned BRT corridors in an emerging mid-sized city. By combining spatial accessibility indicators with statistical association analysis and exploratory artificial neural network modeling, the research addressed how planned connectivity, realized mobility conditions, and urban risk co-exist in rapidly transforming urban contexts.
Regarding RQ1, the results show that structural accessibility does not consistently align with functional accessibility. While the Structural Accessibility Index (SAI) captures substantial potential embedded in urban form and infrastructure, this potential frequently remains unrealized under fragmented operational conditions. This finding supports H2 and confirms that infrastructural readiness alone is insufficient to guarantee effective public transport performance. It also aligns with [1,2], who caution that potential accessibility derived from land-use configurations may not translate into realized mobility benefits, particularly in fragmented transit systems like those described by [5] for suburban contexts.
In relation to RQ2, functional accessibility exhibits a stronger association with road crash incidence than structural accessibility, supporting H1. Areas with high functional accessibility—characterized by concentrated boarding activity and service intensity—also display higher exposure to traffic risk. In contrast, structural accessibility shows weaker and more heterogeneous relationships with crash concentration, indicating that road safety outcomes are more closely linked to operational and behavioral dynamics than to spatial potential alone.
Associations between accessibility indicators and broader urban processes, such as socio-spatial marginalization and housing vacancy, are comparatively weaker and spatially heterogeneous. These results support H3 and suggest that accessibility interacts with long-term urban inequalities in complex and context-dependent ways, rather than through direct or uniform relationships.
The exploratory ANN analysis reinforces these conclusions by revealing non-linear interaction patterns that are not captured by linear regression alone. Rather than serving as a predictive model, the ANN functions as a diagnostic tool, highlighting corridor segments where accessibility, inequality, and safety co-occur in complex configurations. This supports the interpretation of accessibility-related urban outcomes as emergent properties of interacting structural and functional conditions.
Overall, the findings highlight a critical tension in BRT corridor planning for emerging cities: Infrastructure provision alone may not resolve accessibility–safety trade-offs without attention to operational integration and safety-sensitive design. By framing accessibility as both a mobility and habitability indicator, this study contributes a transferable diagnostic framework for identifying priority intervention zones and informing future mid-tier transit investments.
Interpreted within the diagnostic scope of this study, the results suggest that successful BRT implementation in contexts like Querétaro would need to address existing operational fragmentation and safety exposure. The findings point to the potential value of aligning station spacing, operational design, land use, and safety considerations, rather than treating them as separate planning domains. Future research should test whether strategic station spacing and service consolidation can mitigate the mismatches identified here.
This study is limited by its cross-sectional design, which does not establish causal directionality between accessibility indicators and urban outcomes. Future research should extend this framework through longitudinal analysis, expanded spatial coverage, and the integration of additional behavioral and institutional variables. Such efforts would further strengthen the capacity of accessibility-based diagnostics to support equitable and safety-oriented urban transport planning.
Author Contributions
Conceptualization, A.A.B.-L. and S.M.-T.; Geospatial methods and structural accessibility modeling, A.A.B.-L.; Artificial intelligence modeling and computational analysis, O.R.-A. and B.S.D.-B.; Theoretical framework and literature foundation, S.M.-T.; Writing—original draft preparation, A.A.B.-L.; Writing—review, manuscript structure and editing, J.R.-R.; Supervision, A.A.B.-L. and J.R.-R. All authors have read and agreed to the published version of the manuscript.
Funding
This research received no external funding.
Data Availability Statement
The secondary data from official sources (INEGI, CONEVAL) used in this study are publicly available as referenced. The processed spatial datasets (Structural and Functional Accessibility Indices, corridor segment variables) generated during this study are available from the corresponding author upon reasonable request. The raw passenger boarding/alighting count data are not publicly available due to institutional data-sharing agreements but aggregated results are presented in the manuscript.
Acknowledgments
The authors gratefully acknowledge the support of the Secretaría de Ciencia, Humanidades, Tecnología e Innovación (SECIHTI) through the national postdoctoral research program, which made this work possible. The resources, academic guidance, and institutional infrastructure provided under this program were essential for the development of the methodological framework, data compilation, and analytical processes presented in this study. The authors also thank the participating institutions and individuals who contributed with data access and technical insights throughout the research. The authors used AI tools (DeepSeek 2025 and ChatGPT GPT–5.2., OpenAI, Grammarly) exclusively for language editing and translation support. All scientific content, analyses, interpretations, and conclusions are entirely the authors’ own. After using these tools, the authors thoroughly reviewed and edited the manuscript to ensure the accuracy and integrity of the work. The authors assume full responsibility for the final content.
Conflicts of Interest
The authors declare no conflict of interest. The funders had no role in the design of the study; in the collection, analysis, or interpretation of data; in the writing of the manuscript; or in the decision to publish the results.
References
- Geurs, K.T.; Van Wee, B. Accessibility evaluation of land-use and transport strategies: Review and research directions. J. Transp. Geogr. 2004, 12, 127–140. [Google Scholar] [CrossRef] [Scilit]
- Handy, S. Smart growth and the transportation–land use connection: What does the research tell us? Int. Reg. Sci. Rev. 2005, 28, 146–167. [Google Scholar] [CrossRef] [Scilit]
- Fuentes, A.; Pipkin, S. Can partial growth coalitions build pathways out of the middle-income trap? The case of Querétaro, México. Stud. Comp. Int. Dev. 2024, 59, 433–463. [Google Scholar] [CrossRef] [Scilit]
- OECD. OECD Regions and Cities at a Glance 2024: Mexico; OECD Publishing: Paris, France, 2024. [Google Scholar]
- Cervero, R.; Beutler, J. Adaptive Transit: Enhancing Suburban Transit Services; University of California Transportation Center: Berkeley, CA, USA, 1999. [Google Scholar]
- Baisotti, P. The Rise of Chongqing and Querétaro: The Territorial Dimension of the Divergent Trajectories of Two Emerging Urban Economies in China and Mexico. In New Global Cities in Latin America and Asia: Welcome to the Twenty-First Century; University of Michigan Press: Ann Arbor, MI, USA, 2022; pp. 66–92. [Google Scholar]
- Obregón-Biosca, S.A.; Betanzo-Quezada, E. Análisis de la movilidad urbana de una ciudad media mexicana, caso de estudio: Santiago de Querétaro. Econ. Soc. Territ. 2015, 15, 61–98. [Google Scholar] [CrossRef] [Scilit]
- Barreda-Luna, A.A.; Rodríguez-Reséndiz, J.; Rodríguez-Abreo, O.; Álvarez-Alvarado, J.M. Spatial Models and Neural Network for Identifying Sustainable Transportation Projects with Study Case in Querétaro, an Intermediate Mexican City. Sustainability 2022, 14, 7796. [Google Scholar] [CrossRef] [Scilit]
- Romero-Torres, J.; García-Gutiérrez, J.; Cruz, D.G. Measurement of the quality of service of the informal transportation mode mototaxi in Mexico. Transp. Res. Interdiscip. Perspect. 2023, 18, 100764. [Google Scholar] [CrossRef] [Scilit]
- Institute for Transportation and Development Policy (ITDP). The BRT Standard; ITDP: New York, NY, USA, 2016. [Google Scholar]
- CAF. Development Bank of Latin America. In Bus Rapid Transit Systems in Latin America; CAF: Caracas, Venezuela, 2020. [Google Scholar]
- Sabatini, F. La Segregación Social del Espacio en las Ciudades de América Latina. 2006. Available online: https://webimages.iadb.org/publications/spanish/document/La-segregación-social-del-espacio-en-las-ciudades-de-América-Latina.pdf (accessed on 27 December 2025).
- Barreda-Luna, A.A.; Rodríguez-Reséndiz, J.; Flores Rangel, A.; Rodríguez-Abreo, O. Neural Network and Spatial Model to Estimate Sustainable Transport Demand in an Extensive Metropolitan Area. Sustainability 2022, 14, 4872. [Google Scholar] [CrossRef] [Scilit]
- Janoschka, M.; Sequera, J. Gentrification in Latin America: Addressing the politics and geographies of displacement. Urban Geogr. 2016, 37, 1175–1194. [Google Scholar] [CrossRef] [Scilit]
- Wood, J.; Verschuer, M.; Economou, D.; Newman, P. The Potential Emergence of Mid-Tier Transit. J. Infrastruct. Policy Dev. 2023, 7, 1659. [Google Scholar] [CrossRef] [Scilit]
- Bertolini, L.; Le Clercq, F.; Kapoen, L. Sustainable accessibility: A conceptual framework to integrate transport and land use plan-making. Two test applications in the Netherlands and a reflection on the way forward. Transp. Policy 2005, 12, 207–220. [Google Scholar] [CrossRef] [Scilit]
- Van Meeteren, M.; Poorthuis, A. Christaller and “big data”: Recalibrating central place theory via the geoweb. Urban Geogr. 2018, 39, 122–148. [Google Scholar] [CrossRef] [Scilit]
- Hansen, W.G. How accessibility shapes land use. J. Am. Inst. Planners 1959, 25, 73–76. [Google Scholar] [CrossRef] [Scilit]
- Ingram, D.R. The concept of accessibility: A search for an operational form. Reg. Stud. 1971, 5, 101–107. [Google Scholar] [CrossRef] [Scilit]
- Weibull, J.W. An axiomatic approach to the measurement of accessibility. Reg. Sci. Urban Econ. 1976, 6, 357–379. [Google Scholar] [CrossRef]
- Krambeck, H.V. The Global Walkability Index. Doctoral Dissertation, Massachusetts Institute of Technology, Cambridge, MA, USA, 2006. [Google Scholar]
- Rueda, S.; De Cáceres, R.; Cuchí, A.; Brau, L. El Urbanismo Ecológico; Agencia de Ecología Urbana de Barcelona: Barcelona, Spain, 2012; pp. 18–20.
- Obregón Biosca, S.A.; Ángeles Espinosa, M.A. Diseño metodológico para estimar indicadores de accesibilidad en entornos periféricos de una zona metropolitana. Estud. Demográficos Urbanos 2018, 33, 111–147. [Google Scholar] [CrossRef] [Scilit]
- Barreda Luna, A.A.; Kuri, G.H.; Rodríguez-Reséndiz, J.; Zamora Antuñano, M.A.; Altamirano Corro, J.A.; Paredes-Garcia, W.J. Public space accessibility and machine learning tools for street vending spatial categorisation. J. Maps 2022, 18, 43–52. [Google Scholar] [CrossRef] [Scilit]
- Wilson, A.G. A family of spatial interaction models, and associated developments. Environ. Plan. A 1971, 3, 1–32. [Google Scholar] [CrossRef] [Scilit]
- Pirie, G.H. Measuring accessibility: A review and proposal. Environ. Plan. A 1979, 11, 299–312. [Google Scholar] [CrossRef] [Scilit]
- El-Geneidy, A.; Levinson, D. Place rank: Valuing spatial interactions. Netw. Spat. Econ. 2011, 11, 643–659. [Google Scholar] [CrossRef] [Scilit]
- Tao, Z.; Zhou, J.; Lin, X.; Chao, H.; Li, G. Investigating the impacts of public transport on job accessibility in Shenzhen, China: A multi-modal approach. Land Use Policy 2020, 99, 105025. [Google Scholar] [CrossRef] [Scilit]
- Delgado, J. Querétaro: Hacia la ciudad-región. Estud. Demográficos Urbanos 1993, 8, 655–699. [Google Scholar] [CrossRef] [Scilit]
- Micheli Thirión, J. Desarrollo regional y terciarización: Los casos de Guanajuato y Querétaro, México. In Estudios Regionales en Economía, Población y Desarrollo; Universidad Autónoma de Ciudad Juárez: Ciudad Juárez, Mexico, 2016; Volume 36. [Google Scholar]
- Curtis, C. Integrating Land Use with Public Transport: The Use of a Discursive Accessibility Tool to Inform Metropolitan Spatial Planning in Perth. In Transport Models in Urban Planning Practices; Routledge: London, UK, 2016; pp. 41–60. [Google Scholar]
- Soja, E. Spatializing the urban, Part I. City 2010, 14, 629–635. [Google Scholar] [CrossRef] [Scilit]
- Consejo Nacional de Evaluación de la Política de Desarrollo Social (CONEVAL). Metodología para la Medición Multidimensional de la Pobreza en México; CONEVAL: Mexico City, Mexico, 2009. [Google Scholar]
- Harvey, D. Flexible accumulation through urbanisation. Antipode 1987, 19, 260–286. [Google Scholar] [CrossRef] [Scilit]
- Morse, R.M. Trends and issues in Latin American urban research, 1965–1970. Lat. Am. Res. Rev. 1971, 6, 19–75. [Google Scholar] [CrossRef] [Scilit]
- González, J.A.; Morales, J.I.M.; Soler, S.R. Capitalidad autonómica y proceso de terciarización: El caso de Barcelona. Estud. Geográficos 2014, 75, 7–46. [Google Scholar] [CrossRef] [Scilit]
- Pradilla Cobos, E. Estado subsidiario, capital inmobiliario financiero y ciudad neoliberal. En: Camargo Sierra, A. (Comp.). Políticas urbanas y dinámicas socioespaciales. Vivienda, renovación urbana y patrimonio (Serie Investigación). Editorial Universidad de Bogotá Jorge Tadeo Lozano; Universidad Pontificia Bolivariana; ACIUR, 2020. Available online: https://www.researchgate.net/publication/353909711_Pradilla_Cobos_Emilio_2020_Estado_subsidiario_capital_inmobiliario-financierp_y_ciudad_neoliberal_en_Angelica_Camargo_Sierra_Comp_POLITICAS_URBANAS_Y_DINAMICAS_SOCIOESPACIALES_VIVIENDA_RENOVACION_URBA (accessed on 25 October 2025).
- Instituto Nacional de Estadística y Geografía. Censo de Población y Vivienda 2020: Síntesis Metodológica y Conceptual; Inegi: Aguascalientes, Mexico, 2020. [Google Scholar]
- Melgarejo-Ochoa, E.; Cuevas-Rodríguez, J. El Fenomeno del Abandono de la Vivienda de Interés Social en México y su Impacto en el Desarrollo Urbano; RINDERESU: Tlaxcala, Mexico, 2022; Volume 6. [Google Scholar]
- Camacho, M.R.; Maturano, R.G. Capítulo 18. Movilidad cotidiana en la periferia de la ZMVM y su relación con la vivienda abandonada. In Después de la Pandemia: Consecuencias y Desafíos Sociales en México; ASMIIA: Salitrería, Mexico, 2023; p. 262. [Google Scholar]
- INEGI. Estadística de Accidentes de Tránsito Terrestre en Zonas Urbanas y Suburbanas, (Número de Identificación del Proyecto Estadístico: MEX-INEGI.EEC6.03-ATUS-2020); INEGI: Aguascalientes, Mexico, 2020. [Google Scholar]
- Montejano Escamilla, J.; Perez Lopez, R. Methodological proposal for generating a Pedestrian Crosswalk Safety Index (PCSI). In Proceedings of the 18th International Conference Road Safety on Five Continents (RS5C 2018), Jeju Island, Republic of Korea, 16–18 May 2018; Statens Väg-Och Transportforskningsinstitut: Linköping, Sweden, 2018. [Google Scholar]
- Luna, A.A.B. Accesibilidad Sostenible de las Calles y Redes Viales y su Relación con Indicadores, Caso Querétaro y Monterrey. Doctoral Dissertation, Universidad Autónoma de Querétaro, Santiago de Querétaro, Mexico, 2024. [Google Scholar]
- Consejo Nacional de Población (CONAPO). Índices de Marginación por Entidad Federativa y Municipio 2015; Consejo Nacional de Población (CONAPO): Ciudad de México, Mexico, 2015.
- INEGI. Directorio Estadístico Nacional de Unidades Económicas (DENUE); Instituto Nacional de Estadística y Geografía: Aguascalientes, Mexico, 2024. Available online: https://www.inegi.org.mx/app/mapa/denue/ (accessed on 15 November 2025).
- The MathWorks, Inc. MATLAB Neural Network Toolbox; The MathWorks: Natick, MA, USA, 2023; Available online: https://www.mathworks.com/products/deep-learning.html (accessed on 5 October 2025).

Disclaimer/Publisher’s Note: The statements, opinions and data contained in all publications are solely those of the individual author(s) and contributor(s) and not of MDPI and/or the editor(s). MDPI and/or the editor(s) disclaim responsibility for any injury to people or property resulting from any ideas, methods, instructions or products referred to in the content. |
© 2026 by the authors. Licensee MDPI, Basel, Switzerland. This article is an open access article distributed under the terms and conditions of the Creative Commons Attribution (CC BY) license.