


Abstract
Streamflow estimates are necessary for devising effective flood management strategies in urban areas. However, rating curves (RC), which formally summarize stage-discharge relationships, are rarely available, mainly because of difficulties in measuring flow velocities in such environments. As a result, in the absence of gaugings, researchers and practitioners frequently resort to simplified hydraulic approaches for computing flood discharges, which renders validation and uncertainty assessment in flood-related studies unfeasible. In this paper, we explore a Bayesian framework that combines empirical information on stages and expert prior hydraulic knowledge for indirectly estimating rating curves from rainfall-runoff (RR) simulations. We investigate advantages and drawbacks of the proposed rainfall-stage model in a Brazilian urban catchment, in which 25 gaugings, which were not utilized in inference, are available for model scrutiny. Our results demonstrate that, although deriving a synthetic RC was feasible, uncertainty in stage predictions was too large. However, the explicit treatment of RC and RR errors allowed estimating true discharges, which is useful for flood routing along the river reach. Overall, the synthetic RC provided physical realism to the stage-discharge relationship. Yet, the rainfall-stage model was strongly affected by the lack of gaugings, which suggests actual monitoring should be highly beneficial for decision making.
1. Introduction
Floods are one of the most damaging phenomena worldwide [1,2,3]. In effect, floods have been associated with almost half of the reported global disasters, accounting for about 32% of the economic losses and 16% of deaths [2,4]. The impacts of flooding events are particularly critical in urban environments, in which the highly modified hydrological systems, the proximity to streams, and the inadequate urban planning that leads to the occupation of flood-prone areas may greatly amplify flood-related damage and loss of life (e.g., [5]). From this perspective, the devastating consequences of high-magnitude floods in urban areas have been demonstrated by recent events in Europe [6], Africa [7], the Arabian Peninsula [8] and South America [9,10]. Properly understanding flooding regimes, particularly under anthropogenic climate change (e.g., [11]), is thus necessary for mitigating short- and long-term adverse impacts on cities’ infrastructure and the population [12].
Frequently, strategies for flood management in urban catchments rely on (deterministic) outputs from hydrological and hydrodynamic models (e.g., [13,14,15]). However, actual hydrometric rating curves, which should provide streamflow estimates for simulating such models, are rarely available. In fact, the high flow velocities and the short response times of small urban catchments usually render appropriate field discharge measurements unfeasible [13,16]. As a result, practitioners and researchers mostly utilize synthetic stage-discharge relationships, often derived under overly simplified assumptions, for flood modeling in such locations—throughout this paper, a site is referred to as “ungauged” whenever the rating curves are not formally established, irrespective of other variables being measured.
The simplest approach for estimating synthetic rating curves in urban streams is assuming that theoretical reference regimes, such as uniform flow, deterministically summarize the stage-discharge dynamics (e.g., [13] and references therein)—implicitly, the deviations from the prescribed hydraulic conditions are taken as negligible. While this might be an acceptable approximation for steep and nearly prismatic channels, the resulting rating curve model would require precise knowledge on parameters such as the Manning roughness coefficient, which, in practical applications, is impossible, even for artificial channels [17]. In more general terms, this rationale should be highly ineffective in natural channels, in which changes in geometry, bed slopes or other hydraulic properties would certainly be verified along the river reach of interest.
More realistic synthetic stage-discharge relationships, particularly in natural, mild-slope channels, may be obtained by leveraging high-resolution digital elevation models (DEMs) and hydrologic terrain analysis [18]. In this context, simple models, such as the Height Above the Nearest Drainage (HAND), can be used for describing river reach-averaged properties, as, for instance, cross-sectional areas and wetted perimeters, at different stages; when coupled with steady uniform flow equations, with known values of channel slopes and roughness coefficients, HAND outputs allow trivially estimating flow rates [18,19,20,21]. The main advantage of this framework is that detailed topo-bathymetric information is not required for estimating the synthetic rating curve [20]. On the other hand, the resulting models are unable to deal with complex hydraulic conditions typically found in urban streams, such as cross-section contractions or backwater effects [20,22]—this may render their utilization unfeasible in more intricate drainage networks [23].
Hydrodynamic models have also been explored for establishing synthetic rating curves at ungauged locations [22,24,25,26,27], but their use is frequently constrained by the requirements of extensive topo-bathymetric information and precise knowledge of model parameters, along with high computational costs. Alternatively, empirical models, which mostly rely on catchments’ characteristics and channel morphology for defining stage-discharge relationships, have been discussed in the literature (e.g., [28,29]). However, despite the high structural complexity, their predictive abilities are still notably limited for transferring information on rating curve parameters.
The outlined discussion demonstrates that, despite recent advances in computational modeling, deriving physically meaningful stage-discharge relationships at ungauged sites is still a challenging task. In fact, benchmarking against observed gaugings (i.e., stage-discharge simultaneous measurements) has suggested that a purely hydraulic perspective may be insufficient for establishing rating curves [30]. Furthermore, as actual stage or discharges measurements are often unavailable, most models do not formally address uncertainty quantification (e.g., [31]), albeit rating curve-related random or systematic errors may be too large and, accordingly, entail biased decision-making when the corresponding discharge estimates are utilized for simulating hydrological [32] or hydrodynamic models [33]. Hence, one might benefit from available empirical evidence, whenever it exists, for improving the synthetic rating curve estimation. For instance, in some Brazilian cities, water levels are (quasi) continuously monitored for flood alert issuing. In these cases, one may formally combine prior hydraulic knowledge on the stage-discharge relationship with a rainfall-stage model (an adaptation of traditional rainfall-runoff models; see [34]) for deriving the rating curve parameters.
Expert prior hydraulic knowledge can be established by accounting for potential deviations from theoretical reference regimes—note this prior knowledge must be data-independent. A common approach for summarizing prior knowledge in practical applications is the BaRatin framework [35], which accommodates the uncertainty on geometric and hydraulic characteristics of the cross-section and the river reach through subjective prior distributions and explicitly describes rating curve structural errors. This would provide the physical basis for estimating a time-averaged stage-discharge relationship at an ungauged location with no strong assumptions on the parameters’ estimates (e.g., precise, deterministic knowledge). However, as no gaugings should be available, we preclude the inference step of the original BaRatin formulation. Instead, we obtain streamflow estimates from a lumped rainfall-runoff model that is formally linked to the synthetic rating curve by using observed stages as a calibration paradigm [34].
This comprises a strikingly different approach than the typical hydraulic analyses employed in the estimation of synthetic rating curves at urban catchments. In fact, our rationale is leveraging the stage process to indirectly summarize the water budget at the catchment scale using the prior rating curve as a constraint. As such, our framework attempts to reconcile the inherently uncertain nature of the rating curve and physical realism on streamflow estimation. Furthermore, as the rainfall-stage model allows explicitly describing structural uncertainty from both the rating curve and the rainfall-runoff model, one may trivially retrieve the true (unknown) discharges, which exclude the rating curve errors and might provide less uncertain inputs for hydrodynamic modeling at urban streams, with potential improvements in flood mapping and forecasting, and alert issuing.
On the other hand, the extent to which the stage observations alone are able to update knowledge on rating curve parameters under physical consistency, as well as the potential inference issues related to the highly uncertain discharge estimates obtained from prior rating curves, still call for investigation. The present study addresses these specific questions. For this, we extend the calibration framework proposed by [34] into a novel design in which the available information for deriving stage-discharge relationships stems strictly from hydraulic expert knowledge—this is a common situation in urban catchments. This alternative design should provide clearer indications on the role of prior assumptions in the estimation of synthetic rating curves and on how uncertainty on the actual stage-discharge relationship (i.e., the absence of gaugings) would affect the prediction of both stages and discharges. As a proof-of-concept, we apply the proposed framework for estimating the synthetic rating curve at the Monjolinho River catchment, a small urban basin in the Brazilian state of São Paulo. This catchment was selected for the study because of the availability of 25 gaugings [36], which would allow the independent validation of the stage-discharge model—note those gaugings are not utilized for estimating the parameters of the synthetic rating curve and, as a result, the site is treated as ungauged. Also, hourly stage monitoring encompasses almost a year of data collection, which, although being a relatively short period-of-record, enables the appropriate calibration of the parameters of the rainfall-stage model. Besides discussing the rating curve estimation, we also address the effects of rating curve errors in stage and streamflow prediction, which might provide insights on potential developments of the rainfall-stage model for practical applications. The remainder of the paper is organized as follows. In Section 2, we describe the study area and utilized datasets and discuss the statistical formalism of the rating curve and the rainfall-stage models. In Section 3, the main results and a comprehensive discussion on model adequacy and limitations, as well as potential implications for flood management in urban areas, are presented. Finally, we address the concluding remarks and envisaged research developments in Section 4.
2. Material and Methods
2.1. The Monjolinho River Catchment
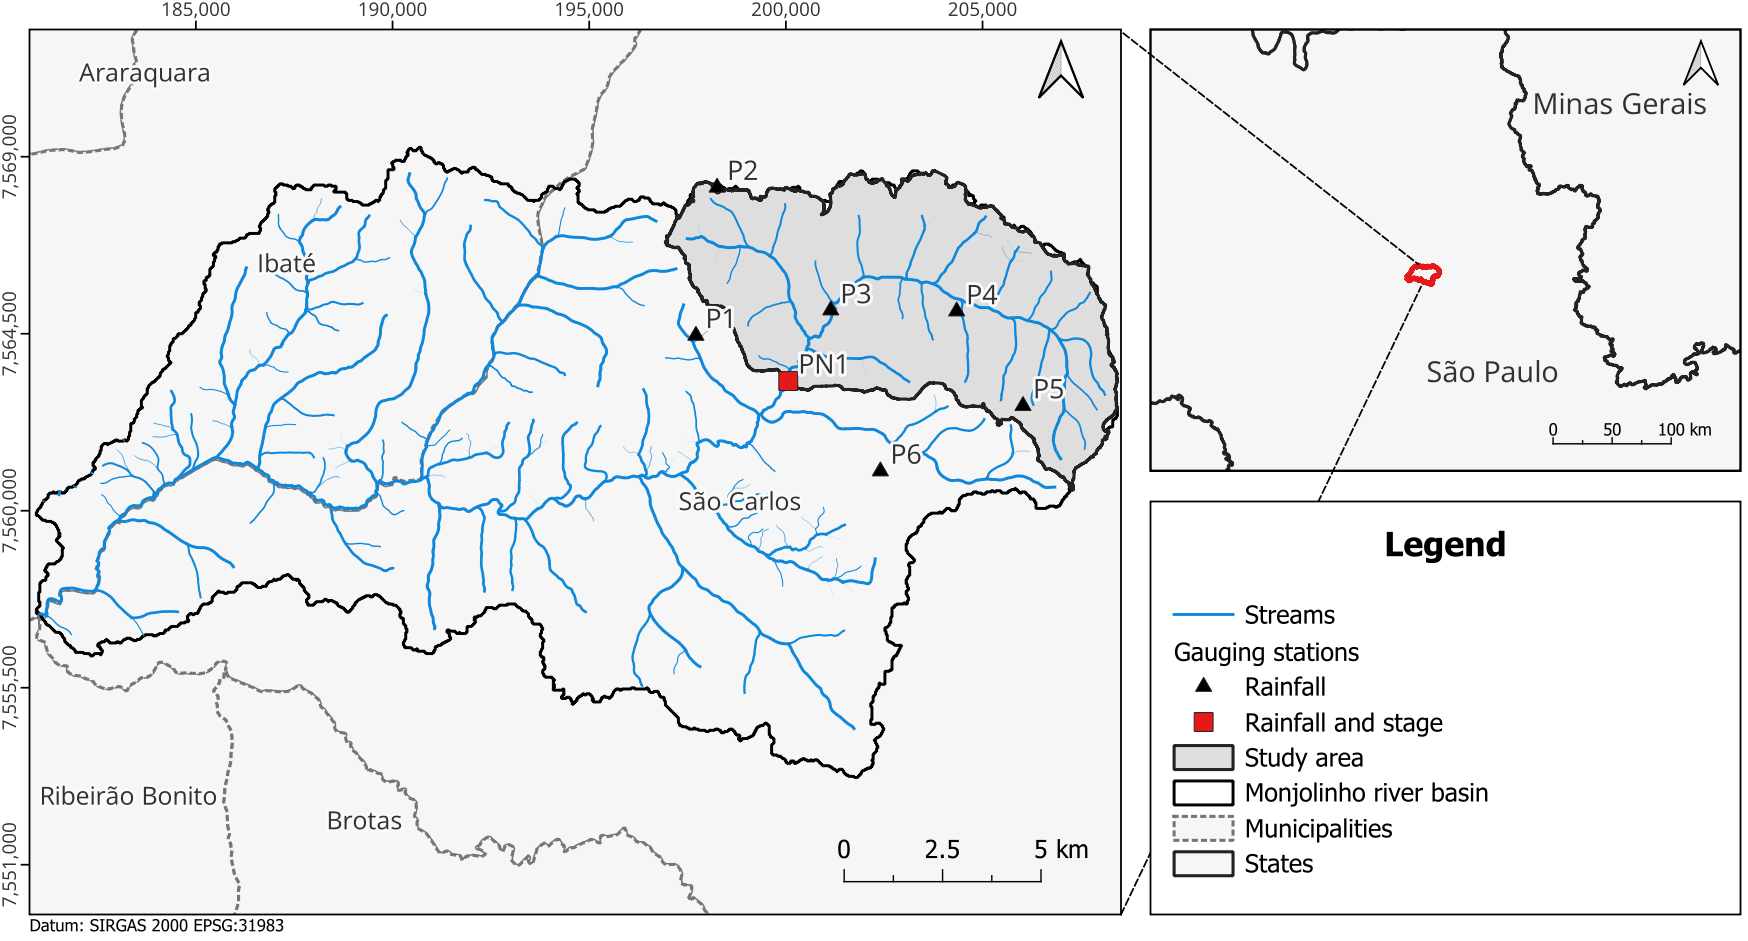
The Monjolinho River basin, whose drainage area amounts to approximately 275 km2, is located in the northern-central region of the Brazilian state of São Paulo. The climate is subtropical, with a wet summer and a dry winter (Köppen classifications Cwa and Cwb), and mean annual precipitation ranging between 1200 and 1500 mm [36,37]. Here, we focused on the urban portion of the Monjolinho River catchment, as depicted in Figure 1. The Monjolinho River and its tributaries have their headwaters within the municipality of São Carlos. Although small agricultural and natural areas occur upstream, particularly in the vicinity of the headwaters, most of the study area, which amounts to 52 km2, is urbanized. The river system crosses the urban area before reaching the study outlet, which is termed PN1 and corresponds to a constrained rectangular cross section in which a bridge is placed.
Figure 1.
The Monjolinho River catchment and gauging stations utilized in the study.
The catchment’s most concerning environmental problems are verified in its urban portion: removal of riparian vegetation, channel siltation, wastewater discharge, and recurrent urban flooding [36,38]. Despite these frequent events, however, the municipality still lacks a systematic flood monitoring database and an operational early-warning system, while hydrological monitoring remains limited [38]. This historical context, together with the scarcity of hydrological observations, emphasizes the importance of improving monitoring and modeling capabilities for the characterization of flood dynamics in the catchment.
A 1 m × 1 m digital elevation model (DEM) and detailed topo-bathymetric information on several cross sections along the river reach, including that of the bridge section, were made available by the Federal University of São Carlos (UFSCar) through the Project “Advances in nowcasting tools applied to urban floods”, funded by the National Council for Scientific and Technological Development (CNPq n. 446043/2023-0). Such information, mostly summarized in field reports, should support the elicitation of subjective prior uncertainty distributions for the prior rating curve parameters (see Section 2.2).
Hourly precipitation was obtained from six rainfall gauging stations operated by UFSCar (PN1, P1–P5 in Figure 1)—spatial averaging was performed with the method of Thiessen polygons, with weights 0.054 (PN1), 0.045 (P1), 0.106 (P2), 0.246 (P3), 0.332 (P4), 0.209 (P5) and 0.007 (P6). For estimating evapotranspiration, the Penman–Monteith method [39] was applied to hourly meteorologic data from station A711, operated by the National Institute of Meteorology (INMET; https://bdmep.inmet.gov.br/ (accessed on 23 March 2026)). Finally, instantaneous hourly stage realizations were collected, with a piezometric level sensor installed at the bridge section (PN1 in Figure 1), in the period spanning from 31 October 2024, to 4 March 2026. However, a shorter period, from 1 January 2025, to 30 November 2025, was utilized for rainfall-runoff simulations, as this was the longest interval with no missing data. We should note that, as the mean bed elevation (0.0 m) and the staff gauge reference level (0.09 m below the mean bed elevation) do not coincide in the available field reports (project CNPq n. 446043/2023-0), all stage measurements were properly corrected to a common reference (0.0 m) prior to the calibration of the rainfall-stage model parameters.
Besides the stages, a set of 25 gaugings, which are not used for inferring the rating curve parameters, was collected in 1995 [36], under a simplified procedure that relates water depths to the ratios between mean and surface flow velocities, at different verticals in the river cross section, through linear models (see [36] for a detailed description of the procedure). We note that, despite the long time elapsed, the bridge section has been well-preserved since these measurements [36] and the “time-averaged” structure of BaRatin accommodates potential changes in the hydraulic characteristics of the river reach, thus allowing benchmarking the synthetic rating curve against the existing gaugings. On the other hand, due to the simplified gauging procedure, errors in discharge estimates should be much larger than those stemming from conventional equipment for velocity measurement (e.g., current meters). Hence, for validating the proposed approach, we have assumed that the standard deviations of measurement errors comprise 10% of the gauging discharge [35].
2.2. The Prior Rating Curve
For deriving the prior rating curve model, we partially rely on the BaRatin framework, originally proposed by [35] and further utilized in many subsequent studies for addressing uncertainty in stage-discharge relationships (e.g., [40,41,42,43,44]). In short, BaRatin’s rationale is employing hydraulic knowledge on the river reach and the river cross-section for eliciting subjective prior uncertainty distributions for the rating curve parameters, under a particular reference regime (e.g., uniform flow or critical flow). Such prior knowledge is typically obtained from field surveys, DEMs, or (data-independent) steady-state simulations from hydrodynamic models. Once gaugings (and the correspondent measurement uncertainty) are available, the rating curve parameters may be updated according to Bayes’ theorem—obviously, an appropriate conditional likelihood function is required for inference.
In our approach, however, no gaugings are available—since they are reserved for the independent validation of the stage-discharge model—and, as a result, only the prior rating curve may be obtained by independently sampling from the parameters’ prior distributions. For this, let us assume that, at a given time t, the predicted discharge , as obtained from the prior rating curve, may be expressed as
in which fRC(ht|θRC) is the rating curve (RC) model, typically a power law intended to preserve physical realism under common reference flow regimes; ht is the (assumed error-free) measured stage at time t; and θRC is the RC parameter vector.
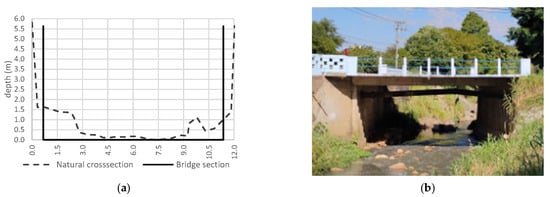
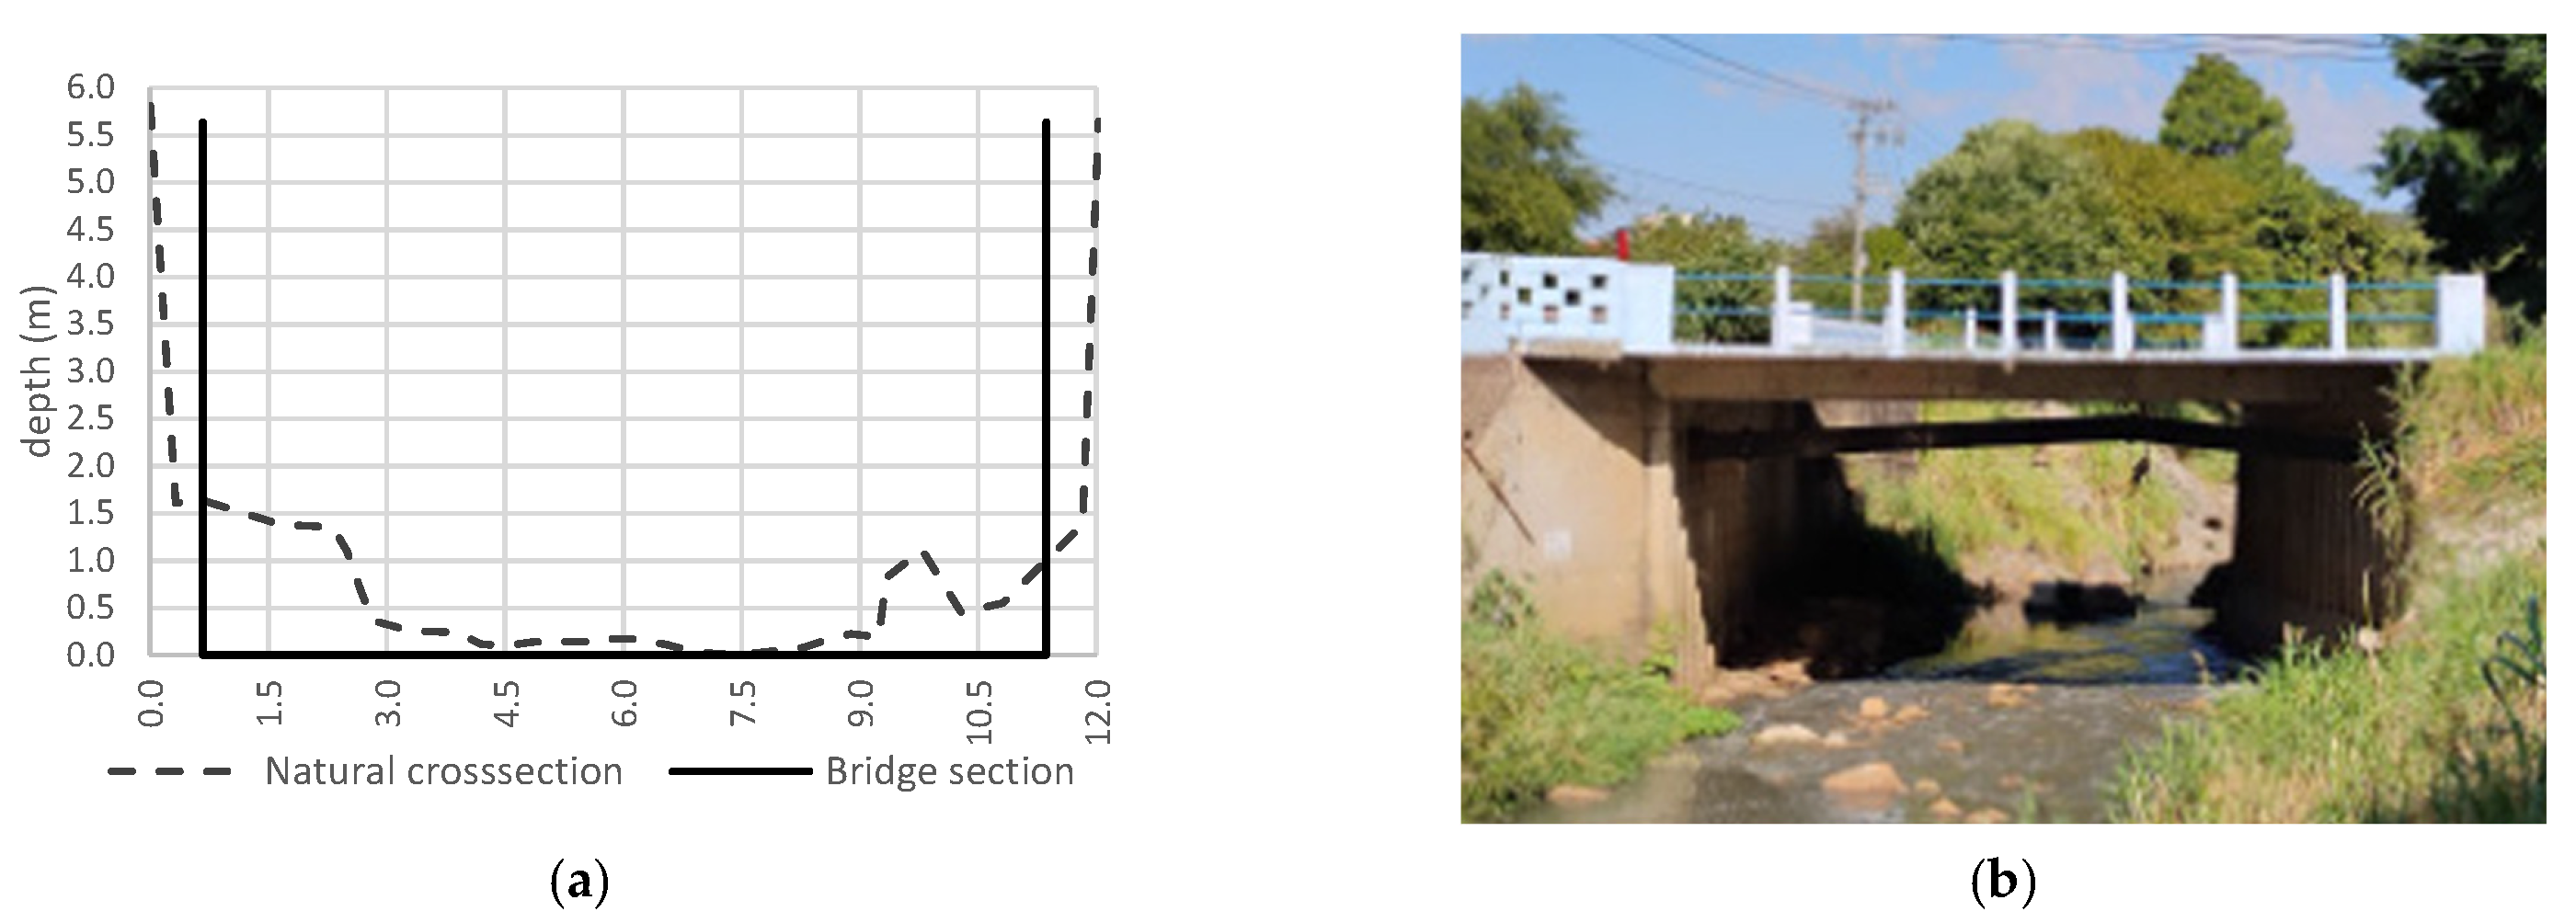
At our gauging section (Figure 2a), the reference regime is prescribed as steady uniform flow, albeit the flow may, to some extent, be affected by the smooth width contraction from the trapezoidal channel upstream (Figure 2b) to the rectangular section under the bridge (see [17])—as a matter of fact, we have simulated steady flows for a variety of stages and critical control would only replace the channel counterpart above 5.0 m, which is well beyond the recorded stages (less than 2.0 m). Hence, we believe the proposed approximation for the reference regime is reasonable for deriving the prior rating curve and potential inconsistencies in prior distribution specification may be properly corrected during the calibration of the parameters of the rainfall-stage model.
Figure 2.
Setup of the stage gauging station (PN1). (a) cross sections; (b) front view of the channel transition. Source: Adapted from [36].
Based on these arguments, the prior rating curve at our gauging section may be expressed as
in which , n (s/m1/3) denotes the Manning roughness coefficient, B (m) is the surface width, S (m/m) comprises the channel slope, b (m) is the average level of the channel bed at the gauging section (which acts as an activation stage for the rating curve model), and c (dimensionless) is the rating curve exponent with a theoretical value of 5⁄3—note we have implicitly assumed a wide rectangular section, although this assumption may be questionable in our case study, at least for higher stages; the implications of this choice, particularly in the posterior distributions of the rating curve parameters, will be addressed in the results section.
For prescribing prior ranges for hyperparameters B and S, we have resorted to DEMs and field surveys made available by UFSCar. Due to the fixed channel walls under the bridge, B can be known very precisely. Hence, we have assumed B = (10.7 ± 0.2) m. S, on the other hand, cannot be prescribed with such accuracy. As a result, we have considered a 20% error with respect to the DEM estimate, which led to S = (0.011 ± 0.002) m/m. As for the Manning roughness coefficient, we have assumed n = (0.030 ± 0.010) s/m1/3, following the indications in [45] for small natural channels. We note that the relatively large ranges specified for both S and n are intended to formally accommodate the stage-discharge relationship temporal evolution into a time-averaged model, which would then allow validation against the available gaugings.
The point estimates of n, B, and S were then utilized for computing the theoretical value of parameter a in Equation (2), while the corresponding variance was estimated under a first-order Taylor expansion, as suggested by [46]—this approach was preferred over Monte Carlo simulations [40] as it provides an explicit account of the contributions of variables B, n and S to the variance of the rating curve parameter. Then, the prior distribution of a is given by
in which N(μ,σ2) denotes a Gaussian distribution with mean μ and variance σ2.
a~N(37.4075,7.52692)
Field surveys also provided information for eliciting the prior distribution of the cease-to-flow level b, which comprises the single activation stage of the prior rating curve. Figure 2 suggests that null flows would occur at a stage of approximately 0.0 m—this was then assumed as the mean bed elevation. On the other hand, because of irregularities in the channel bed, the actual mean elevation should deviate from this estimate, albeit not to a great extent. As a result, we have considered, as a working hypothesis, that the 95% prior credible interval of b would be constrained to (−0.10; 0.10) m. Then, the following prior uncertainty distribution was prescribed
b~N(0,0.052)
Finally, following the original formulation of BaRatin [35], the prior distribution of the rating curve exponent c is given by
c~N(1.67,0.0252)
This concludes the specification of prior distributions for the prior rating curve parameters. For coupling the rating curve and the rainfall-stage model, however, it is necessary to put the predicted discharges as functions of the true (unknown) streamflows qt [34]. This can be formulated as
in which denotes a structural error term, which accounts for the imperfect nature of the RC model. Such errors may be modeled as zero-mean independent Gaussian variates, with standard deviation linearly related to the predicted streamflow [35]. Formally
in which γ1 and γ2 are hyperparameters. Based on the discussion in [40], we have assumed the following “order of magnitude” distributions for the hyperparameters of the structural error model
in which LN(μln,σln) denotes a Lognormal distribution with location parameter μln and scale parameter σln. Note these distributions provide weak constraints on RC structural errors [40] and thus are intended to reconcile identifiability and physical realism in true discharge estimates.
γ1~LN(0,0.5)
γ2~LN(−0.5,0.5)
Under this RC model, parametric and structural uncertainty components are explicitly quantified. Next, we discuss the mathematical formalism of the rainfall-stage model, which will provide the basis for updating the prior rating curve parameters using continuous stage measurements.
2.3. The Rainfall-Stage Model
The rationale for deriving synthetic rating curves is using a rainfall-runoff model for continuously estimating the water budget at the catchment scale, which should provide physical realism for updating stage-discharge relationships, as compared to hydraulic simulations alone. The discharge predicted by a rainfall-runoff (RR) model, at time t, may be expressed as
in which x1,…,t is a matrix of inputs of the RR model (typically, precipitation and potential evapotranspiration), and θRR is the RR parameter vector. Similarly to the RC model, the true streamflow can be linked to the RR predicted discharge by
The error terms are typically serially correlated, skewed, and heavy-tailed variates [47,48,49,50], for which inference is usually cumbersome, even when very large samples are available [51]. For avoiding estimation issues and allowing the analytical derivation of the distribution of variables (see [34]), we transform Equation (11) as follows
in which ψ(.) is a transformation function (for simplicity, we assume ψ(.) = ln(.)), and Bt denotes a zero-mean Ornstein–Uhlenbeck process [34], whose covariance matrix is given by
In Equation (13), is the (lag-0) variance of the process and ϕ2 is a characteristic correlation time [34].
After algebraic manipulations, the (true) stage at a given time t can be expressed as
in which the argument of the function comprises the sum of two independent stochastic variables. In principle, the distribution of this sum is unknown (or cannot be derived analytically), but it can be approximated by a Gaussian distribution by linearizing the inverse transform ψ−1(.) under a first-order Taylor expansion (the complete demonstration is available in [34]). Based on this reasoning, the stages ht may be approximated as
in which ψ′(.) is the derivative of the transformation function. We acknowledge the proposed linearization may introduce systematic bias to true discharge estimates, but, under our modeling assumptions, it is necessary for the analytical derivation of the likelihood function of the stages. Under this simplification, discharges follow a multivariate Gaussian distribution, denoted by fMG(.|μ(θRR),Σ(θRR; γ, ϕ)), with mean vector
and covariance matrix
in which γ = {γ1,γ2}, ϕ = {ϕ1,ϕ2}, and
Σ(θRR;γ,ϕ) = DψΣRRDψ + ΣRC
Equations (15)–(20) provide the link between the rating curve and the rainfall-runoff model, which allows explicitly modeling the corresponding parametric and structural uncertainty components.
For calibrating the parameters of the rainfall-stage model, however, it is necessary to derive the joint distribution (i.e., the likelihood function) of stages ht. By utilizing a change of variables, one obtains [34]
in which the last term on the right-hand side of Equation (21) is the Jacobian. Then, the posterior distribution of all model parameters is given by
in which the last term on the right-hand side of the equation denotes the joint prior distribution of the parameters of the rainfall-stage model. Under our approach, all parameters are considered, a priori, mutually independent variables. Hence p(θRR,θRC,γ,ϕ) is expressed as the product of all prior densities.
p(θRR,θRC,γ,ϕ| h,x)∝p(h| θRR,θRC,γ,ϕ,x)p(θRR,θRC,γ,ϕ)
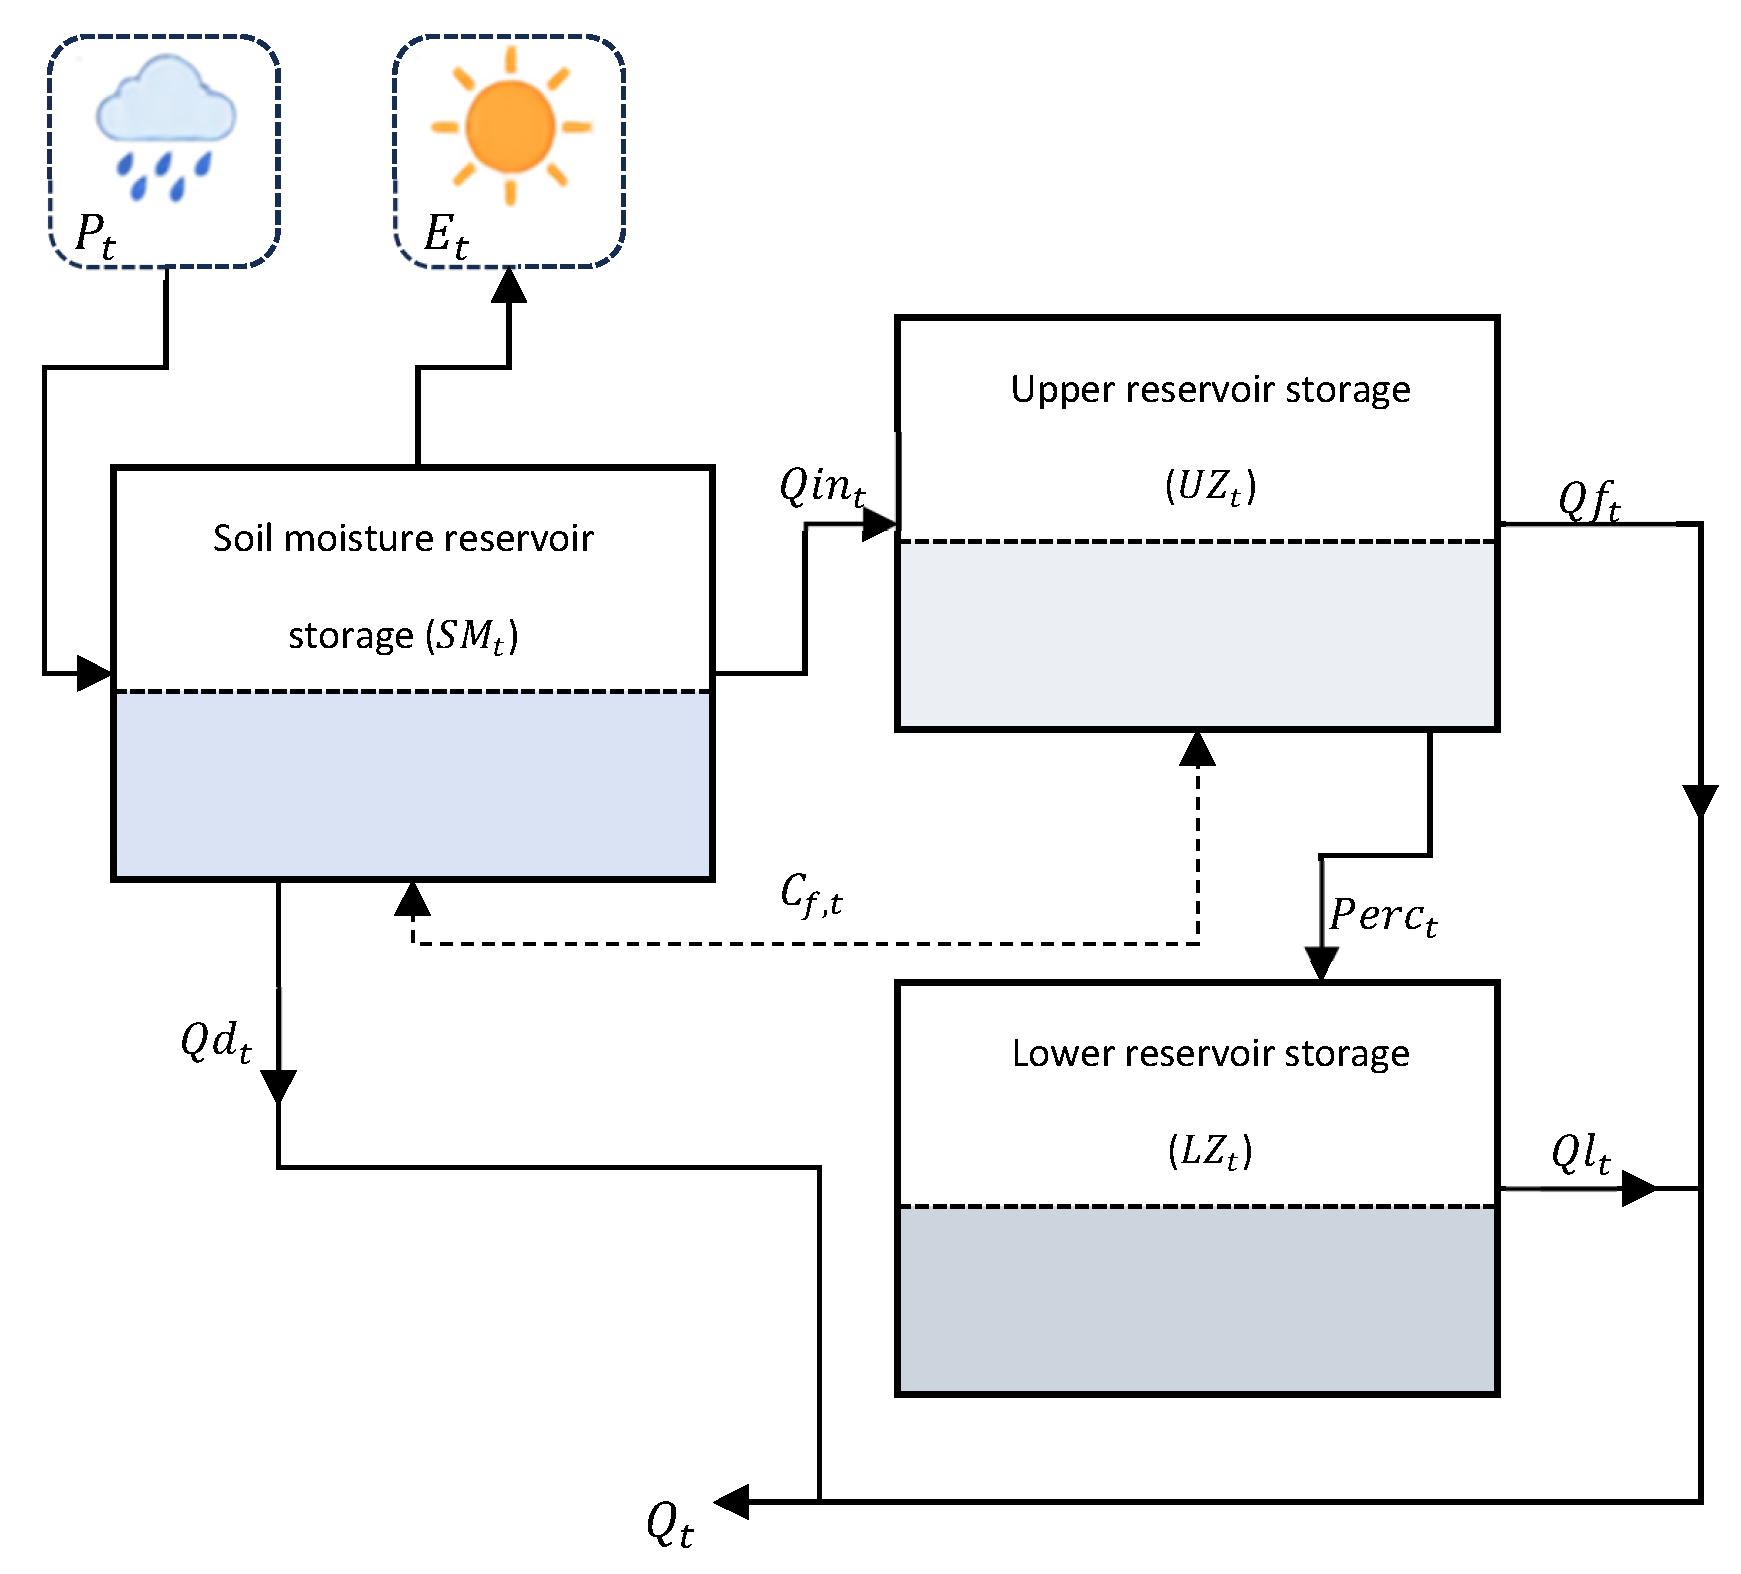
For rainfall-runoff simulations, we have utilized a simplified lumped version of the Hydrologiska Byråns Vattenbalansavdelning (HBV) model [52,53], which precludes the snow routine and runoff routing [54], for rainfall-runoff simulation (details are presented in Appendix A). In short, the simplified HBV model comprises three reservoirs that simulate the temporal dynamics of surface runoff, interflow and baseflow by taking mean average precipitation and evaporation as inputs. In this implementation, five parameters, whose description and prior ranges are provided in Table 1, require calibration—note they are assumed uniform variates [55]. The remaining parameters (α, LP, and CFLUX; see Appendix A) are kept fixed. Here, the HBV model is run at hourly time steps due to the high computational costs for simulation at finer temporal resolutions. Also, the hourly time steps are consistent with the response time of the Monjolinho River catchment (approximately 0.7 h, as per Carter’s equation [56], which applies to urban catchments).
Table 1.
Parameters and prior ranges of the hourly HBV rainfall-runoff model.
At last, we specify the following prior distributions for parameters of the RR error model (note that the errors are in log-scale)
in which U(p,q) denotes a uniform distribution with lower bound p and upper bound q, and N(0,∞)(μ,σ2) denotes a Gaussian distribution truncated at zero.
ϕ1~U(0,0.65)
ϕ2~N(0,∞)(40,302)
Bayesian inference was performed with the R package “cmdstanr” [57] to access the Stan programming language [58]. 3 parallel chains were run, with 15,000 iterations each; the first 5000 iterations of the MCMC samples in each chain were then discarded as warm-up. We also adopted a thinning of 10 for reducing the autocorrelation of the MCMC samples. Convergence to the joint posterior distribution was assessed through the Brooks–Gelman–Rubin statistic (), which should be lower than 1.01, and the effective sample (ESS), which should be larger than 400, for all model parameters [59].
We note that, following the indications in [34], we have truncated the distributions of the prior rating curve parameters at the 95% credible limits. Although we cannot justify this strong assumption on strict physical grounds, it proved necessary for properly identifying the rainfall-stage model parameters during Markov Chain Monte Carlo (MCMC) simulations. In effect, the more “extreme” (and less probable) realizations of the RC parameters strongly disrupted the water budget computations, causing streamflow estimates to become inconsistent with model inputs. In other words, conditioned on the observed rainfall amounts and stages, model outputs can be unrealistically large (or small) for a particular RC model, thus not complying with mass conservation laws under the given RR model structure. This fact apparently prevented the convergence to the joint posterior distribution of the rainfall-stage model parameters when the full RC parameter range is considered. On the other hand, although we did not perform formal analyses for identifying potential cutoffs (e.g., 96–99%), we believe that the proposed truncation does not entail a considerable loss of information and hence does not invalidate the feasibility assessment.
3. Results and Discussion
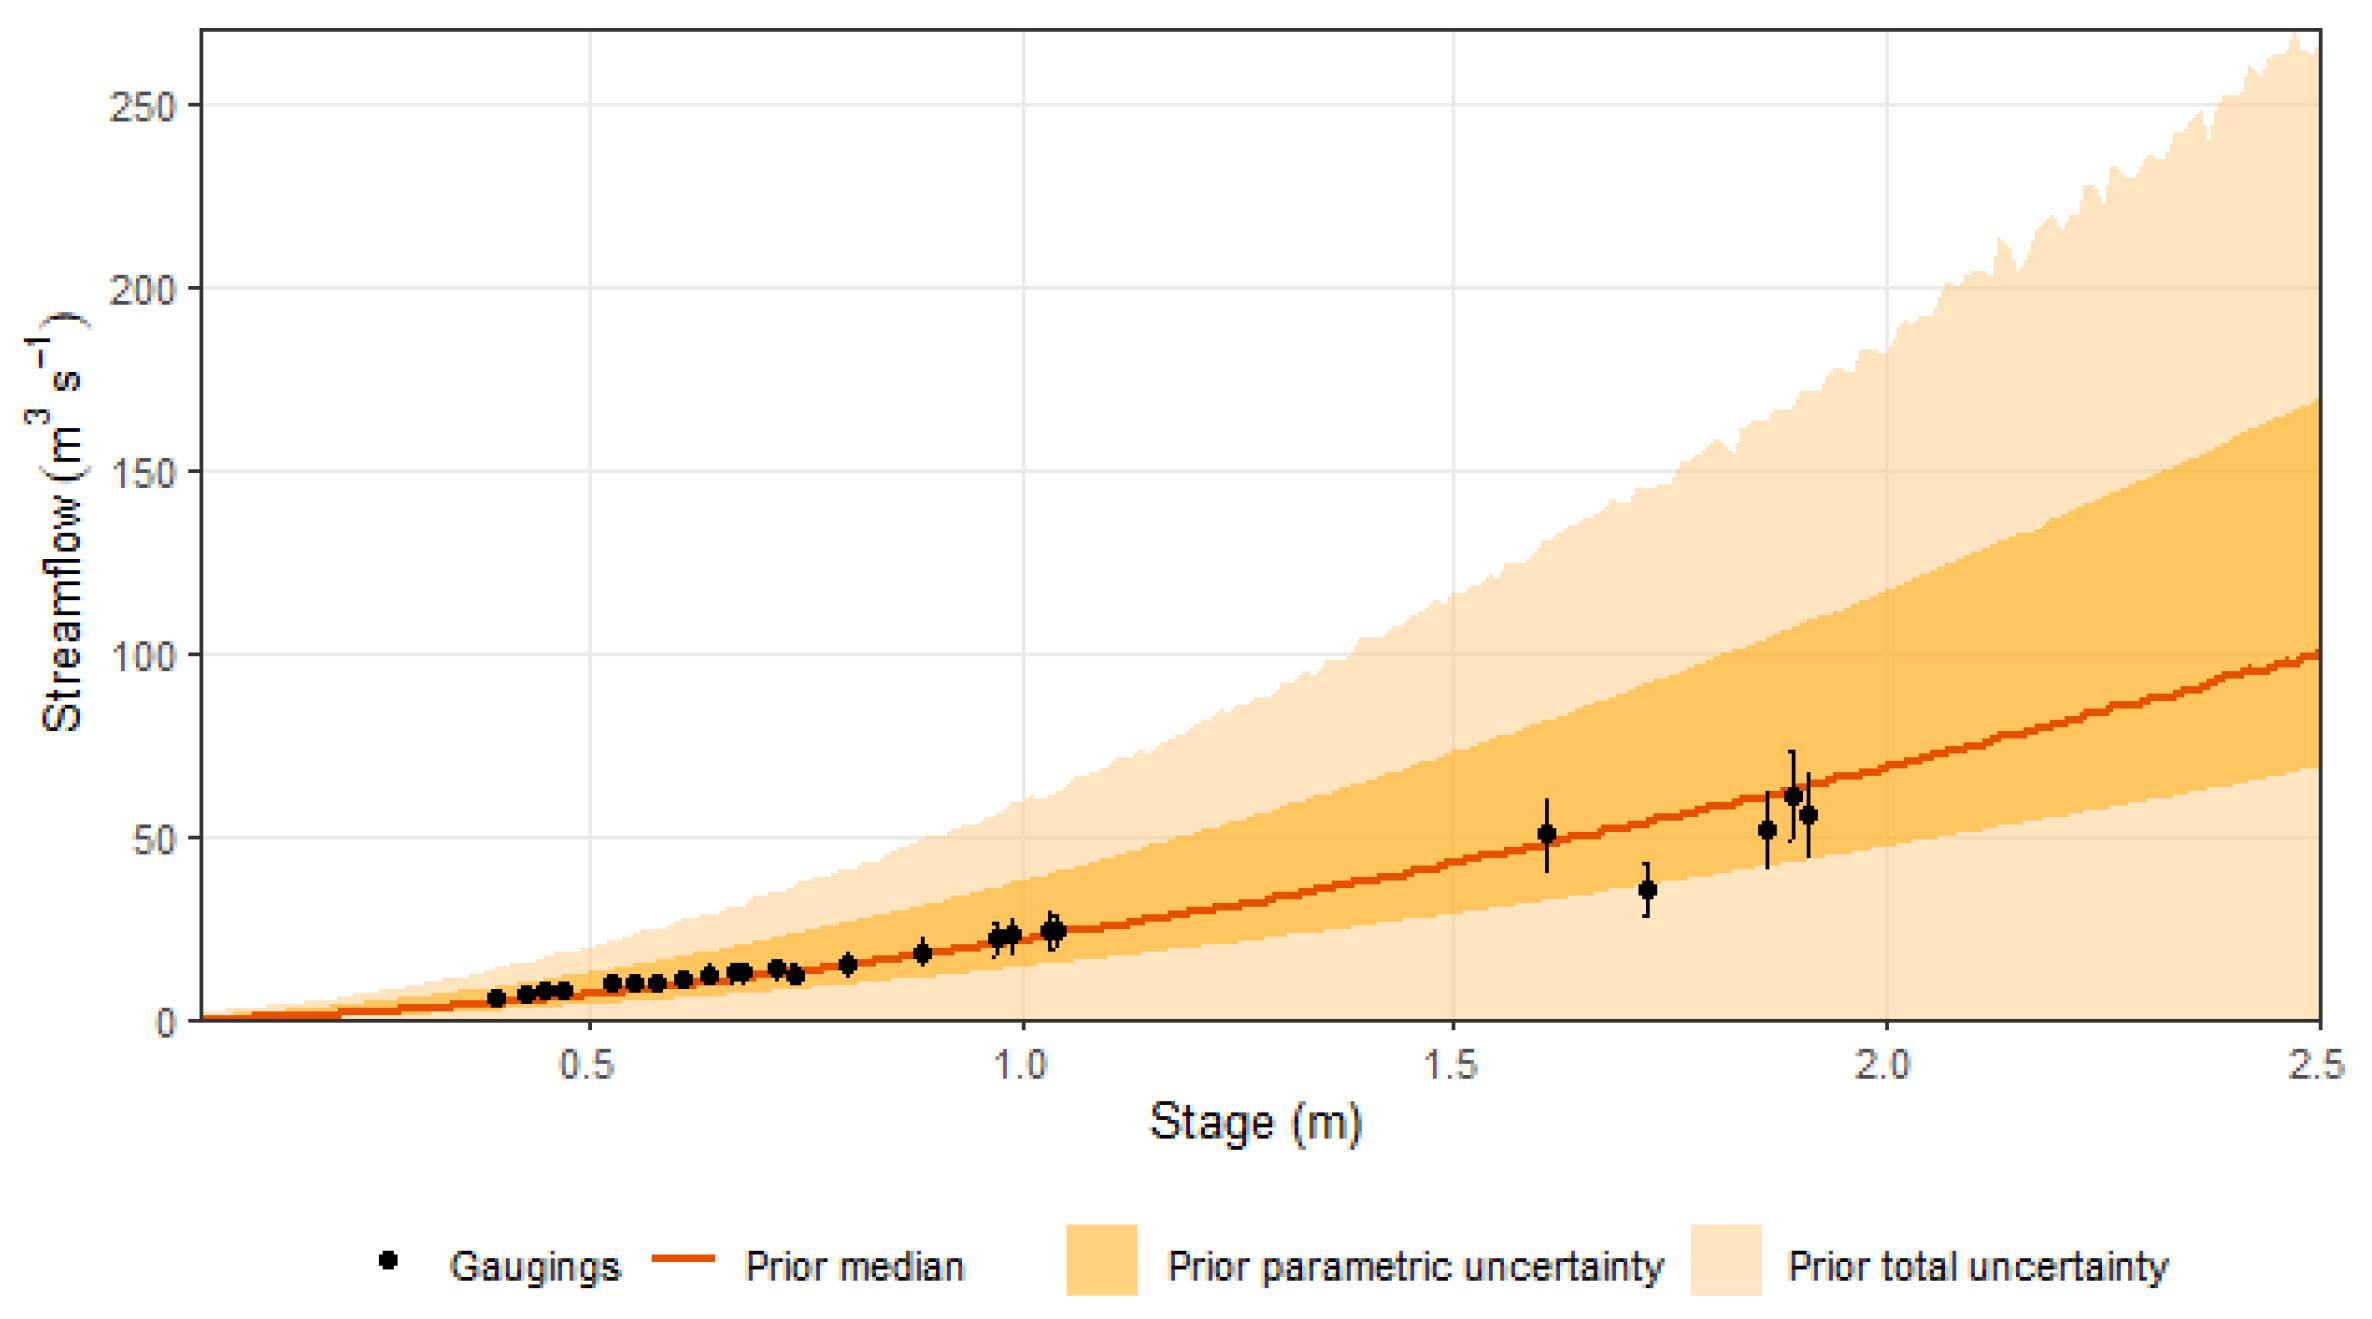
We first estimated the prior rating curve at the bridge section, by independently simulating from the prior distributions discussed in Section 2.2. Results are summarized in Figure 3 (median and 95% credible limits), along with the observed gaugings for comparison—as previously noted, the relatively stable hydraulic characteristics of the cross-section and the river reach make this benchmarking feasible. One may notice that, while the median rating curve closely agrees with the empirical sample points, the credible intervals are too wide. Particularly, parametric uncertainty accounted, on average, for 42% of the overall modeling uncertainty. This fact clearly indicates that, even when detailed information on the river cross section and the river reach is available, a purely deterministic view on the stage-discharge relationship, as suggested in simpler estimation methods, is untenable. In fact, in view of the presented results, merely propagating rating curve parametric uncertainty through a hydrodynamic model could entail exceptionally large errors in stage and streamflow predictions, particularly for higher-magnitude events, as the conditional predictive distributions become more and more skewed-to-the-right as the stages increase.
Figure 3.
Prior rating curve.
It is also worth noting that, despite eliciting “order of magnitude” prior uncertainty distributions for the hyperparameters of the structural error model [40], the prior rating curve is by no means constrained to physically plausible estimates—true discharges vary by more than two orders of magnitude for higher stages and most of the presented conditional 95% predictive intervals are bounded at zero. This reinforces our conjecture that a hydraulic perspective alone (i.e., prior specification) is insufficient for modeling stage-discharge relationships. In effect, although the prior rating curve summarizes our current beliefs on potential deviations from the reference regime, the variances of the conditional distributions do not materialize realistic conditions with respect to the hydrological processes at play at the catchment scale. Overall, the prior rating curve is too uncertain for providing meaningful boundary conditions for flood routing models. As a result, despite the difficulties in measuring flow velocities in urban streams [16], obtaining a few gaugings could greatly improve reliability in statistical estimation and uncertainty propagation (this will be further discussed later).
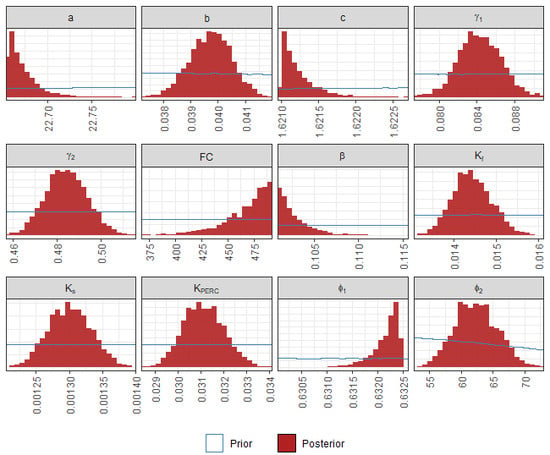
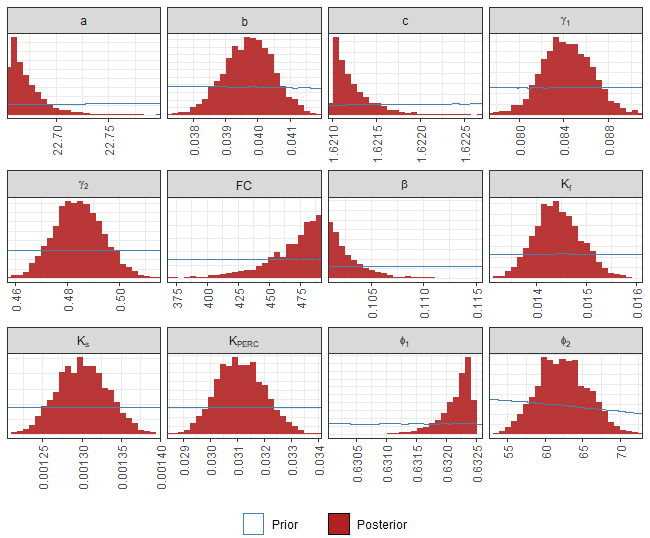
After deriving the prior rating curve, we proceeded to the calibration of the parameters of the rainfall-stage model. A comparison between prior and posterior distributions, for both the RR and the RC model, is provided in Figure 4 (we have restrained the x-axis supports to the parameters’ posterior ranges for improving visualization). As for the RR parameters, one may notice that Ks, Kf, KPERC and ϕ2 were well-identified—the marginal posterior distributions are unimodal and approximately symmetric, and highly concentrated around the corresponding posterior means. For parameters FC, β and ϕ1, however, the posterior distributions were strongly skewed, with most posterior mass placed in the vicinities of the prior bounds. This fact could suggest ill-posed prior specification, but changing the prior limits of the uniform variates, under physically plausible values for the parameters [53], did not solve the identifiability issues—the outlined behavior for the posterior distributions persisted. We hypothesize this may be a result of the limitations of the RR model in simulating runoff formation in impervious urban areas, as the HBV model strongly focuses on water transfers in the soil. Our implementation may thus disrupt the estimation of those parameters with clearer physical interpretation, such as the field capacity, as a means of reproducing surface runoff. Moreover, the interplay between RC and RR parameters during inference may artificially introduce (posterior) correlation, which, at least to some extent, could explain the “range insensitive” behavior of some marginal posterior distributions. Based on these arguments, we believe the adopted prior ranges for the parameters of the HBV model are acceptable for the proposed feasibility assessment and further increases in prior ranges would mostly enhance the loss of physical realism. We should note, however, that formally describing runoff formation in impervious areas could shed some light on the described identifiability issues.
Figure 4.
Prior and posterior distributions of the parameters of the rainfall-stage model.
Regarding the rating curve parameters, conditioning on the observed stages entailed a noticeable change in the mean value of a, with a reduction of approximately 40% with respect to the prior (theoretical) counterpart. As less than 1% of the observed stages would surpass the threshold y = B/20, which is typically adopted for defining wide rectangular sections, this reduction is probably unrelated to the prior specification of the rating curve. It more likely reflects errors stemming from RR model structure and the posterior parameter estimates, as well as the systematic bias introduced by the first-order approximation in the inverse rating curve equation. The mean value of c has also decreased by approximately 3% with respect to the prior point estimate; of course, this much lower percent reduction can be ascribed to the very precise prior distribution elicited for this parameter, which imposes stronger constraints.
We also note that the posterior distributions of a and c were strongly concentrated at the correspondent prior lower bounds—remember the prior distributions of the rating curve parameters were truncated at the 95% credible limits, which should preserve the “hydraulic interpretation” of the stage-discharge relationship through the prior constraints [34]; had the prior distributions been unbounded, a and c could lose their theoretical meanings after the information aggregated by the measured stages is accounted for. This fact clearly demonstrates the huge influence of the prior constraints, on a and c, on the posterior rating curve. In effect, although not strictly devised for this purpose, the truncation has strongly modulated the identification of such parameters, preventing the RC from departing, a posteriori, from the assumed reference regime, irrespective of the unbalance between low and high stages during calibration or the overall performance of the RR model. Nonetheless, the extent to which other truncation thresholds could affect the posterior distributions, in terms of skewness, variances and credible intervals, is unclear, mainly because the prior constraints lack a physical basis. Parameter b, on the other hand, is apparently less affected by prior specification and was properly identified irrespective of the prior bounds.
The structural errors of the rating curve, as summarized by hyperparameters γ1 and γ2, are large, and apparently “compensate” for the lower posterior estimates of a and c. In a more general sense, as noted by [34], the posterior rating curve accounts for the limitations of the RR model in simulating the water budget, which may then justify the deviations from the theoretical values of the RC parameters and the large contribution of the structural error terms in the estimation of the true discharges. Overall, the complex interactions between RC and RR parameters during the calibration procedure may hinder the interpretability of both RC and RR models, despite the potential goodness-of-fit of the rainfall-stage counterpart. In fact, under the current model setup, in which RC and RR parameters are jointly estimated, under constraints imposed by truncation thresholds, it is not possible to fully preserve physical realism in parameter estimates, albeit this could be partially circumvented if a more suitable RR model was utilized in inference.
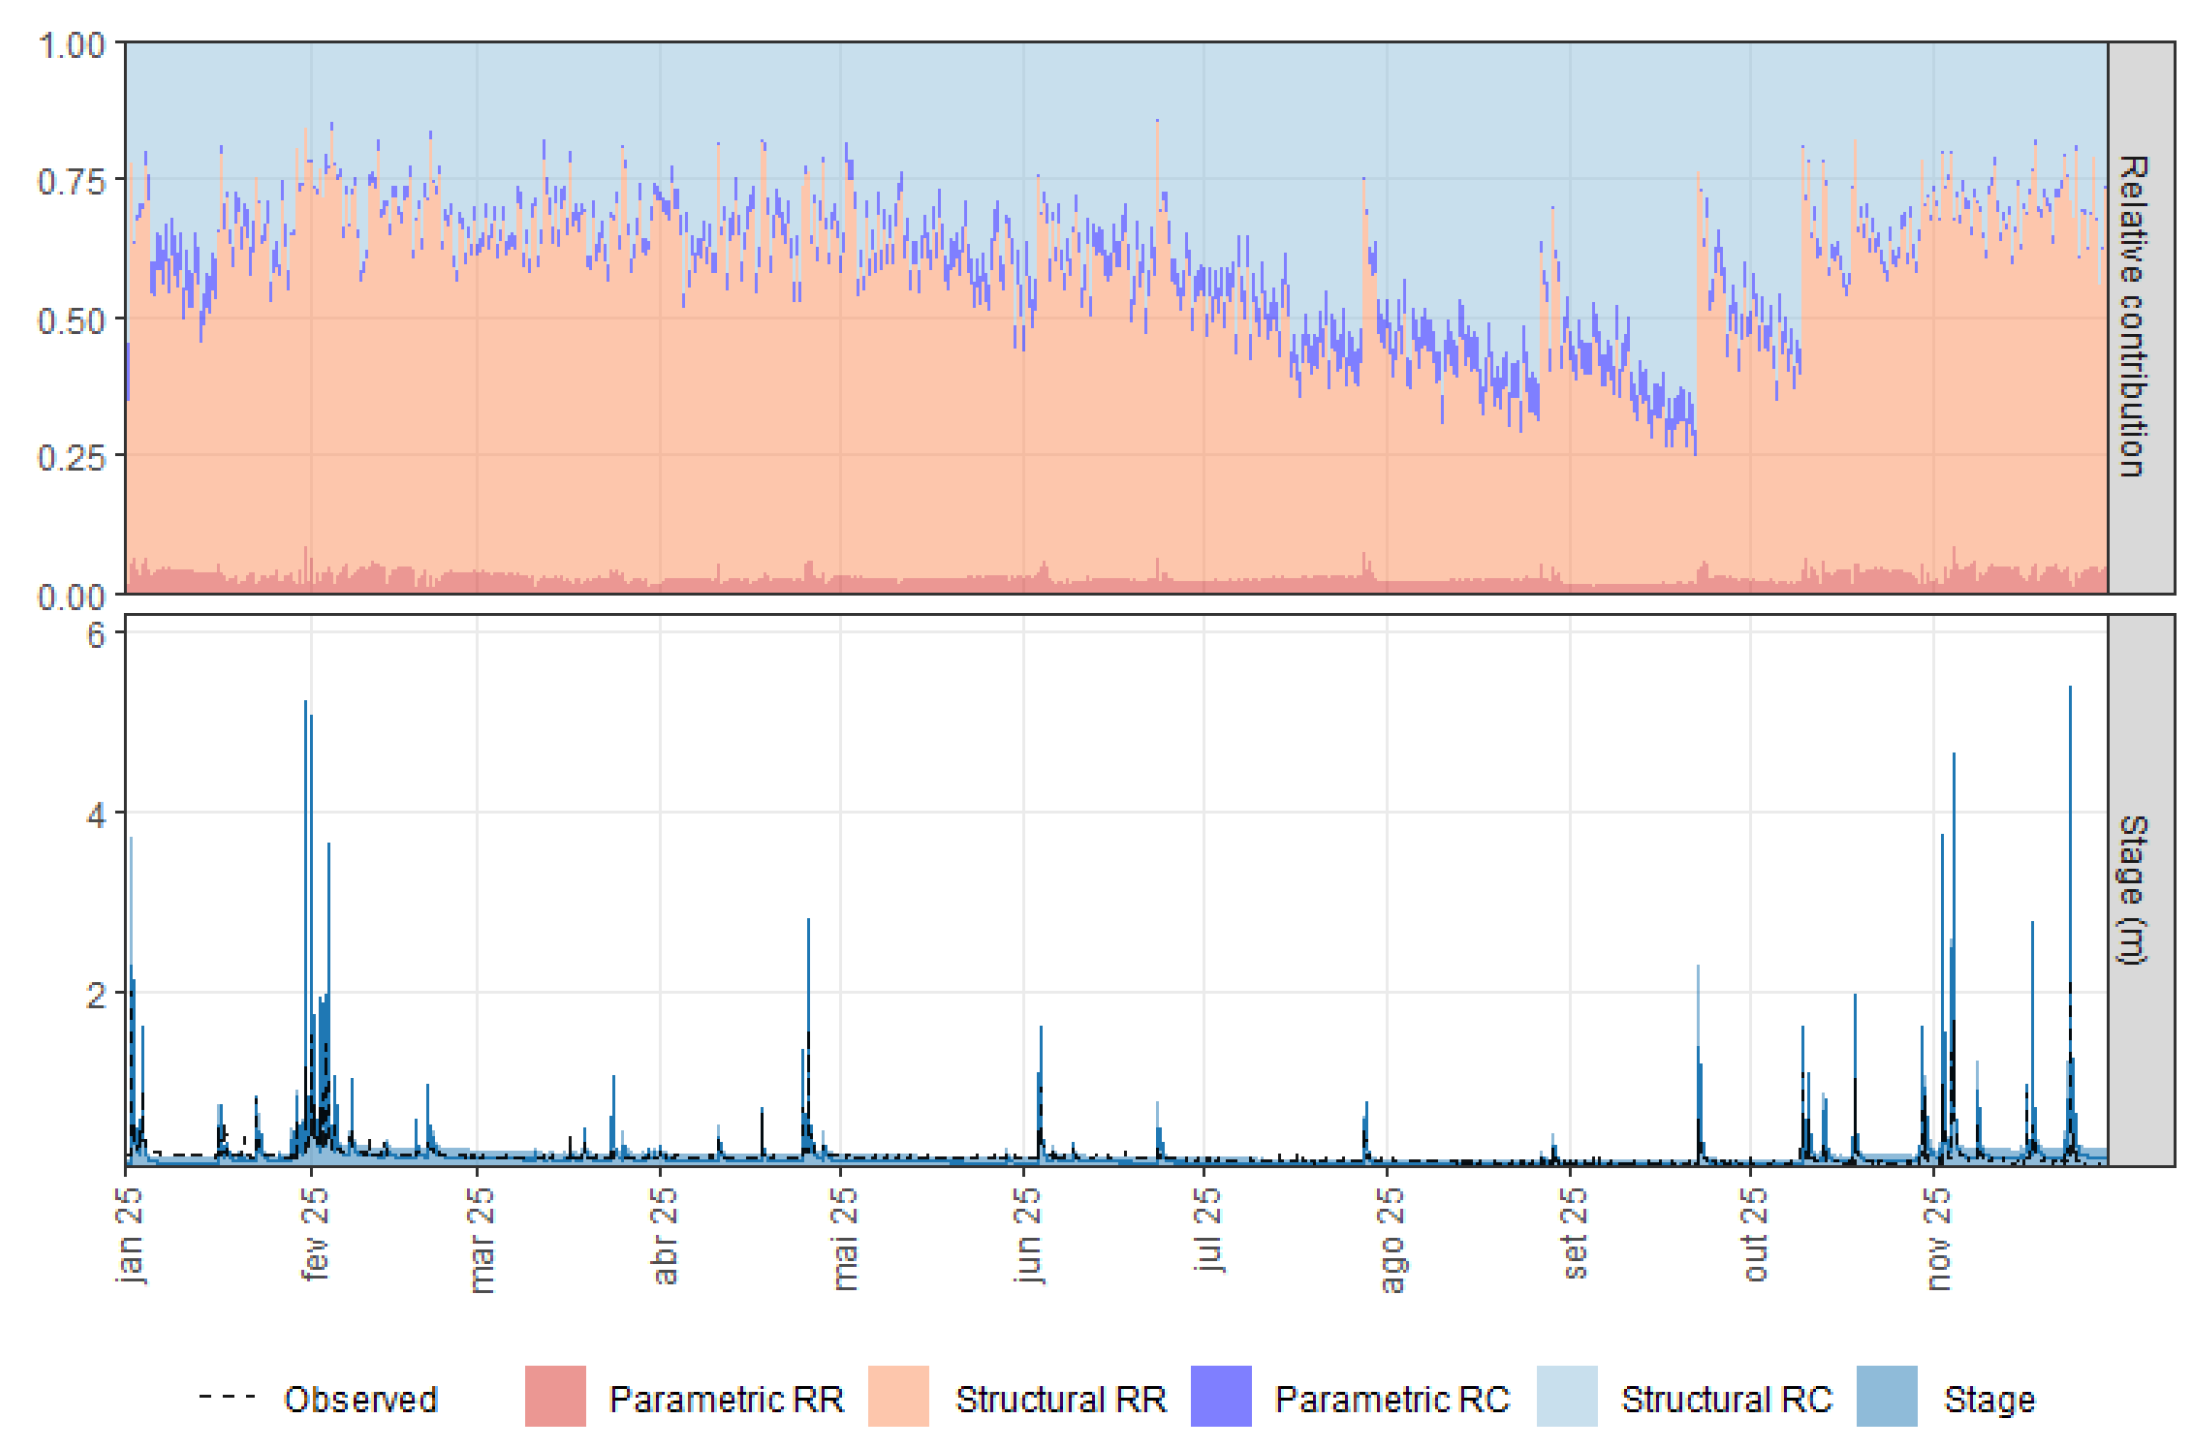
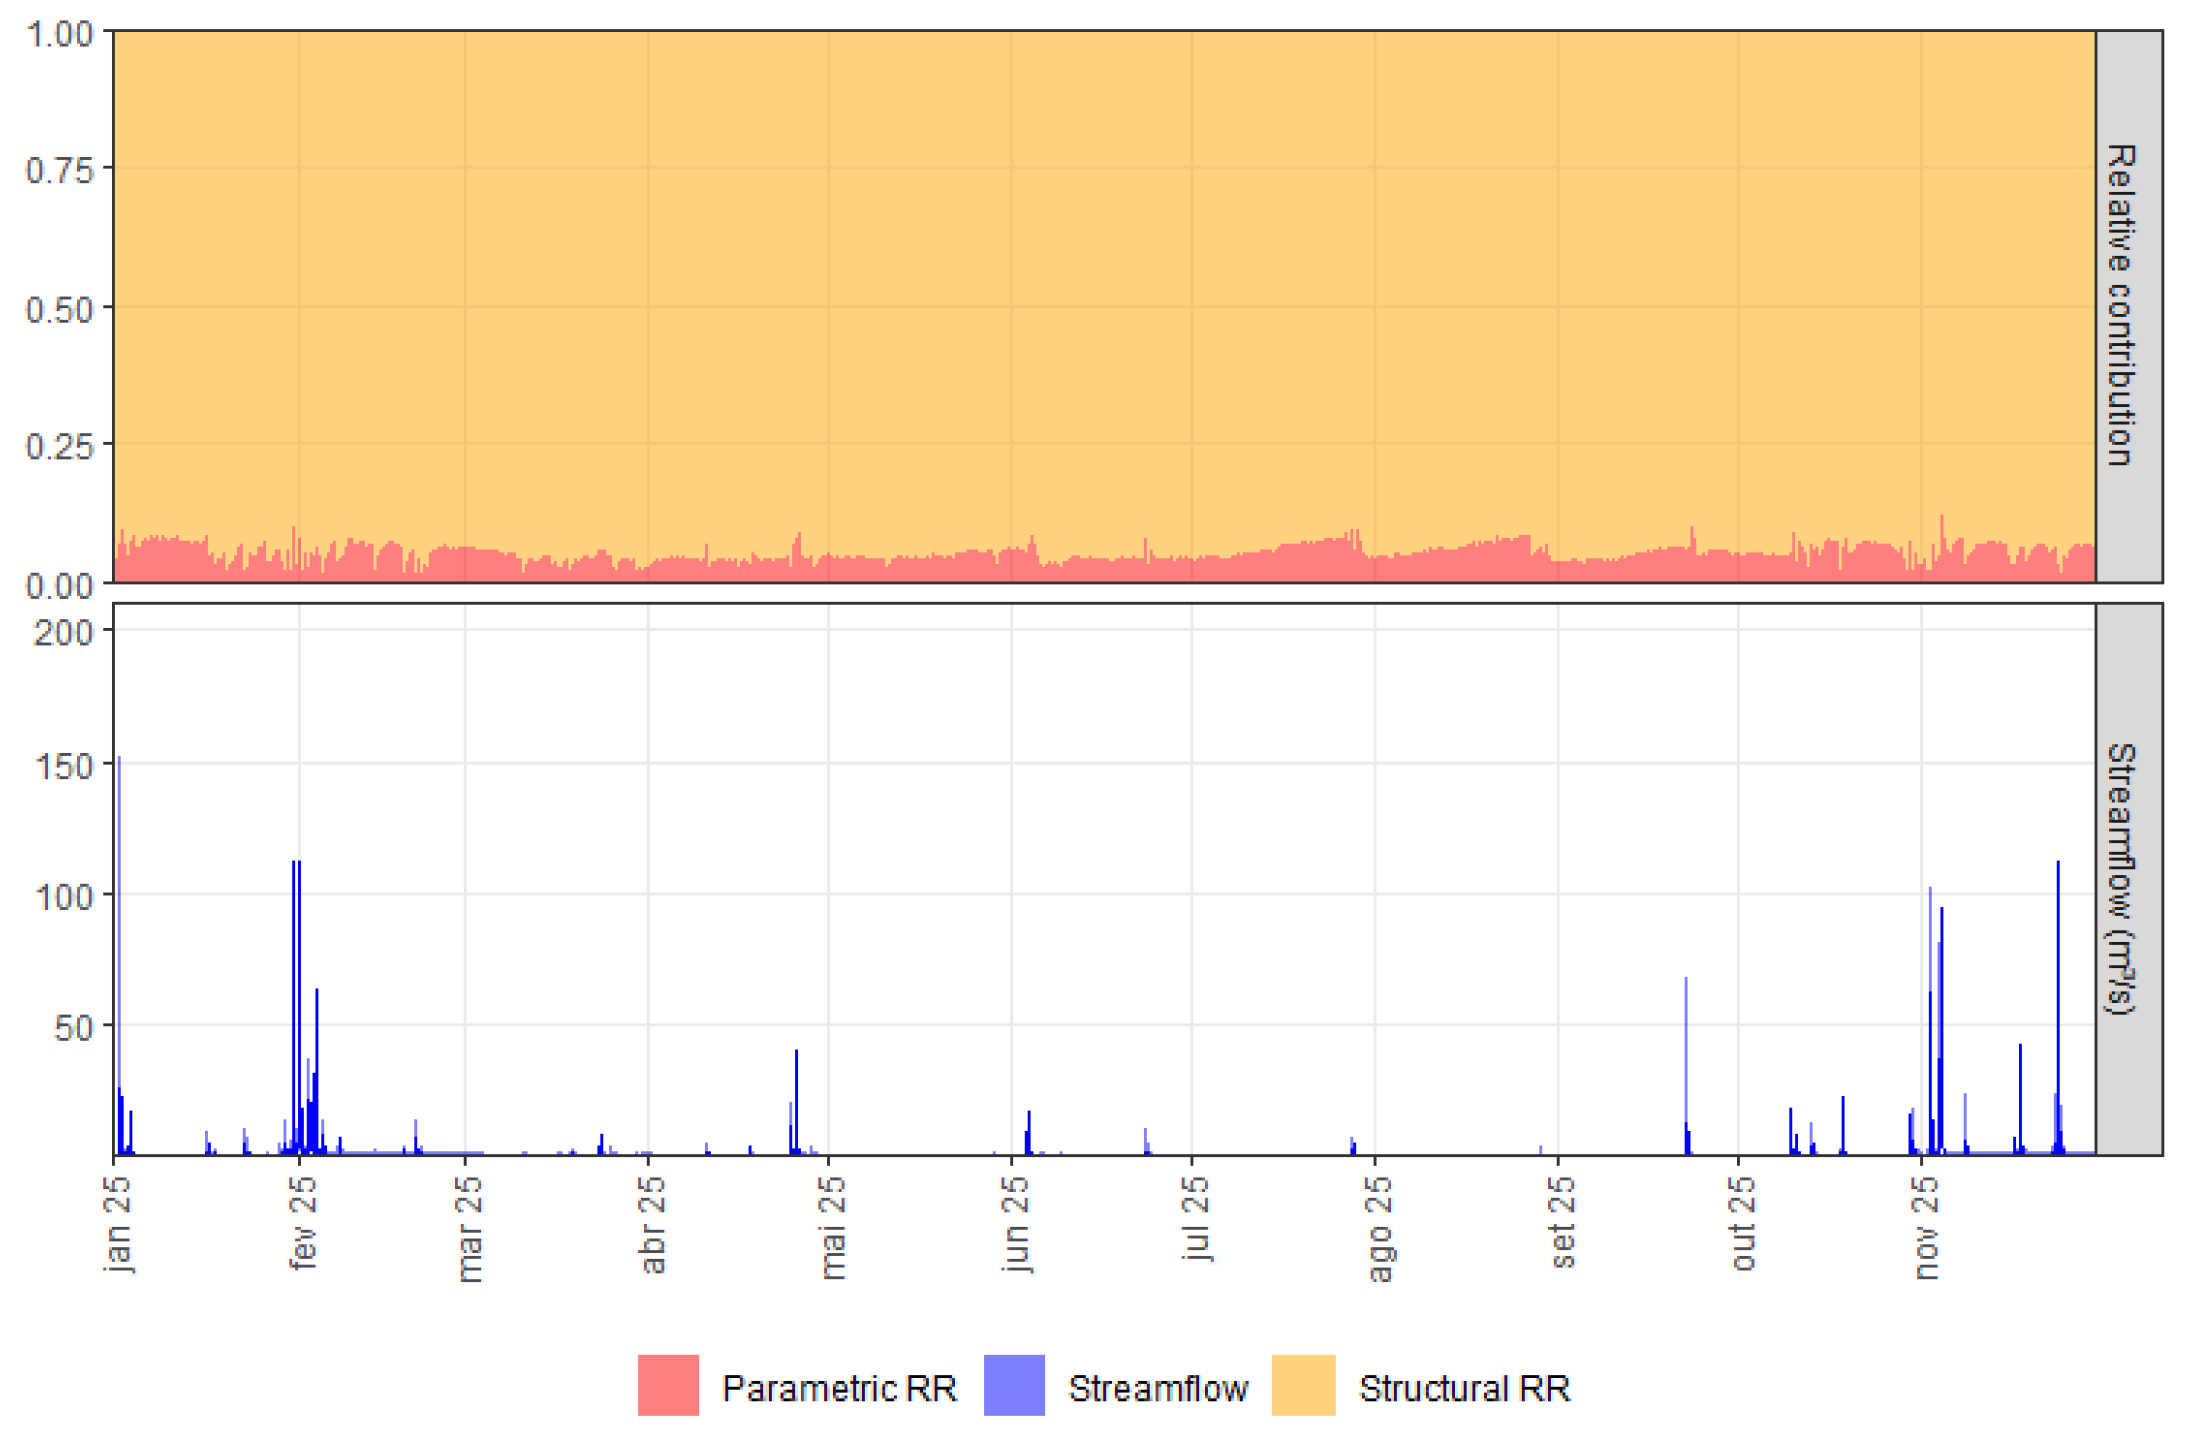
We then computed the (time-averaged) contributions of parametric and structural uncertainty from both the rating curve and the rainfall-runoff model to the stage predictive counterpart (Figure 5, upper panel), which is possible because of the explicit treatment of RC and RR errors in the statistical model (Equations (6), (11) and (15))—note that, for uncertainty decomposition, we have excluded the first 1600 h of the simulation (20%) as the burn-in period for the rainfall-runoff model. The rating curve alone accounts for 58% of the predictive uncertainty (3% for parametric and 55% for structural uncertainty). This finding highlights the main drawback of our approach—as no empirical information is available for updating the rating curve prior to the calibration of the rainfall-stage model parameters, true discharges qt and predicted discharges may greatly differ from each other during inference, which might imply large errors and very wide credible intervals when the inverse RC function is utilized for estimating stages (Figure 5, lower panel). For instance, [34] reported an average structural uncertainty contribution of 8% and much narrower predictive credible intervals for a well-identified rating curve (41 gaugings) in France. Obviously, the RR model still plays a significant role in the prediction errors—4% for parametric and 38% for structural uncertainty. However, as previously mentioned, measuring a few gaugings could strongly reduce the deviations between qt and , leading to more precise predictions of stages at each time step.
Figure 5.
Stage prediction. Upper panel: relative contributions of RC and RR uncertainty, and bottom panel: stages with 95% credible intervals.
In this sense, although we were able to indirectly identify physically meaningful rating curve parameters from the rainfall-stage model, mostly because of the prior constraints, the absence of gaugings has profound implications for flood forecasting and alert issuing at the catchment outlet—the larger the rating curve-related errors, the larger the probabilities of making wrong calls during less critical events. This problem might be exacerbated for more complex stage-discharge relationships, in which a higher number of hydraulic controls should be established. In effect, the difficulties in summarizing prior uncertainty on the rating curve activation stages [34,60] may entail much larger errors in stage predictions and much more pronounced deviations of the RC parameters with respect to the correspondent theoretical values (see [34]). This fact would certainly limit the generalization abilities of our approach, particularly in locations in which urban streams have been restored for improving environmental and ecological conditions [61]; in these cases, besides physically unrealistic predictive intervals stemming from the more uncertain stage-discharge relationships, the parameters of the rainfall-stage model might not be identifiable without stronger (and possibly unjustified) prior constraints.
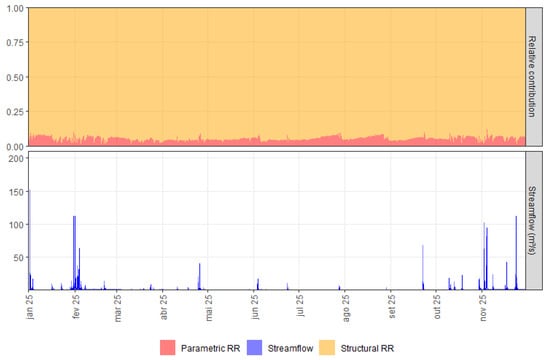
Figure 6 (upper panel) summarizes the true streamflow uncertainty decomposition—note the RC uncertainty is precluded here due to the separate treatment of modeling errors. Similarly to [34], RR structural errors represent, on average, 95% of the predictive uncertainty, which clearly demonstrates how the conceptualization of the utilized RR model affected discharge estimates. Of course, utilizing a more parametrized RR model could reduce structural errors, at the cost of much larger computational costs and potential loss of interpretability due to spurious interactions with the RC model. Alternatively, using a hydrological model better suited for simulating runoff formation in urban areas (e.g., [62]) could shed some light on the actual role of model structure in the streamflow predictive uncertainty. We should note, however, that RR predictive uncertainty also accommodates unaccounted errors (e.g., model inputs, such as rainfall), which may be misinterpreted as structural limitations of the hydrological model and introduce bias to true discharge estimates; to some extent, this may also explain the noticeable predominance of structural errors in the correspondent predictive uncertainty. In other words, attributing prediction errors almost fully to model structure may be misleading and a more reliable streamflow uncertainty decomposition would certainly require the formal quantification of input errors.
Figure 6.
Streamflow prediction. Upper panel: relative contributions of RR uncertainty, and bottom panel: true discharges with 95% credible intervals.
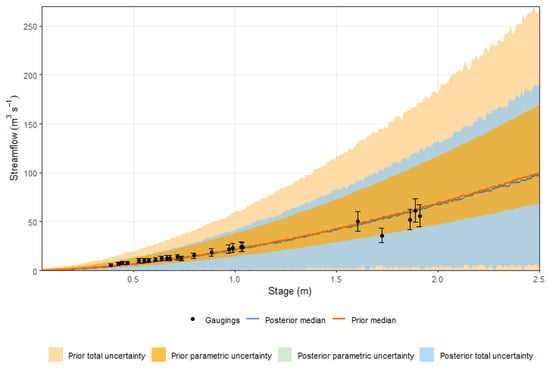
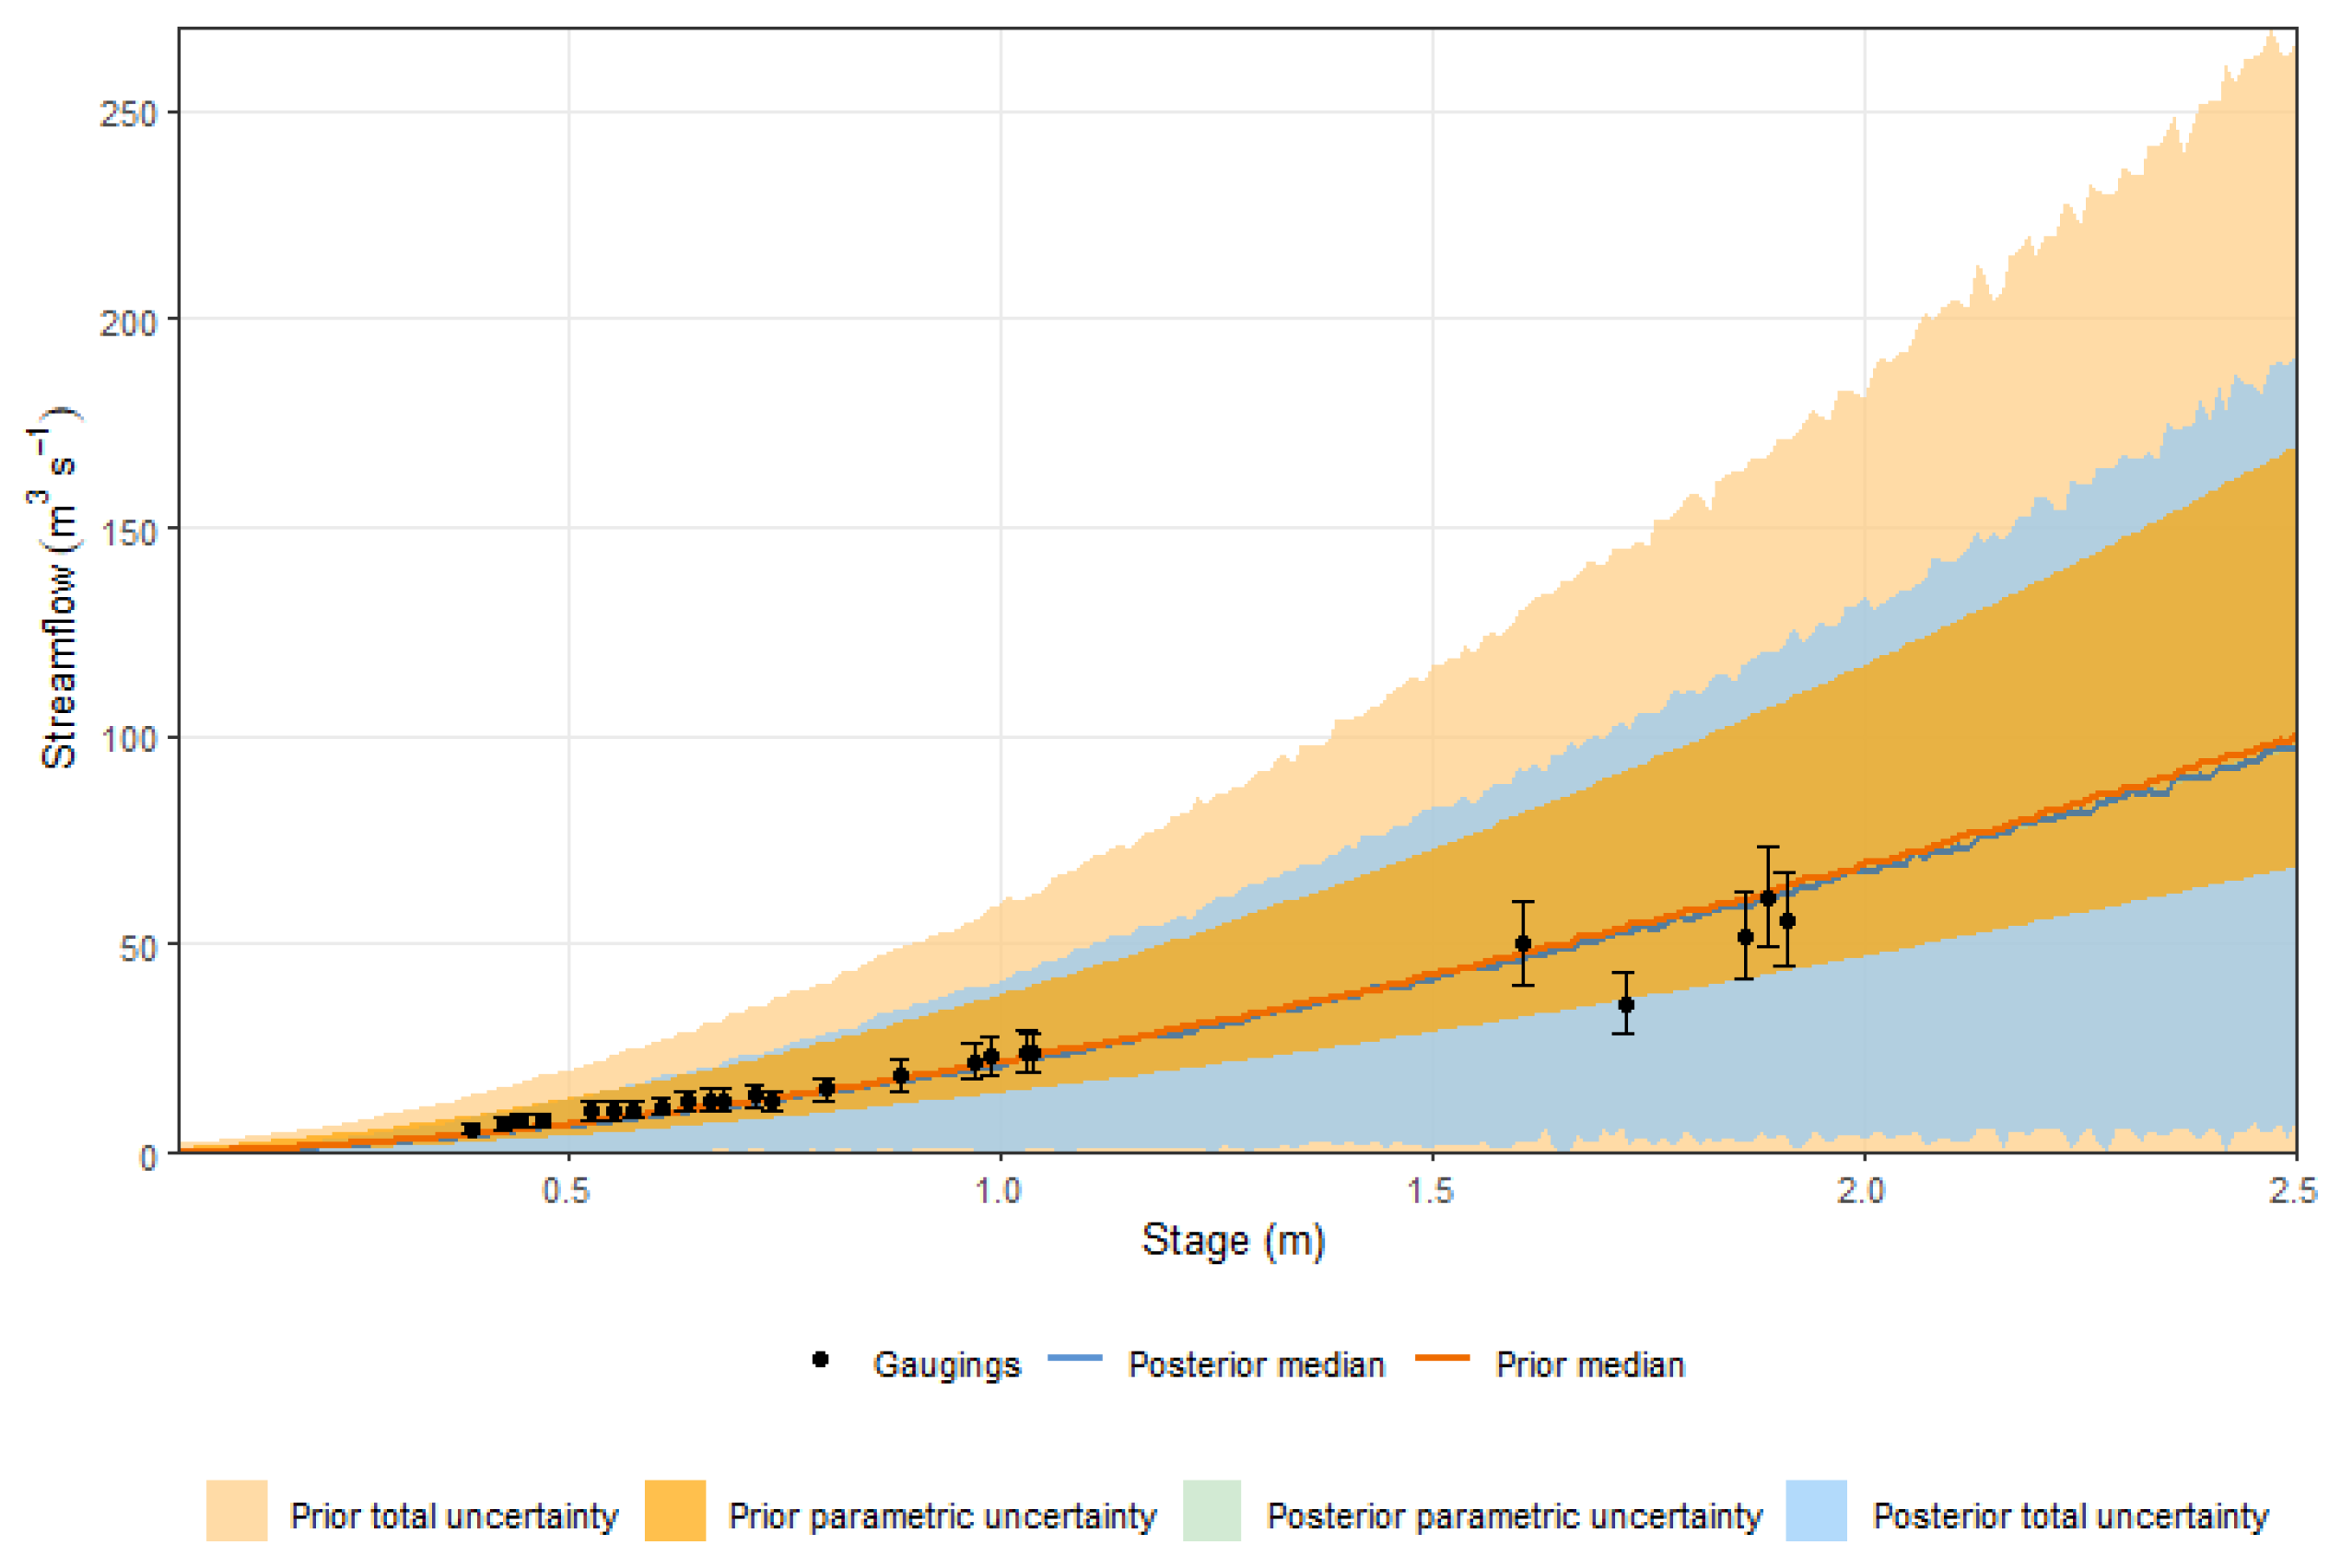
Finally, we estimated the posterior rating curve, which is depicted in Figure 7 along with the gaugings for model scrutiny. One may notice that, despite the changes in RC parameters, the median rating curve still agrees well with the gaugings, albeit, in median terms, the posterior discharge estimates are slightly lower than those stemming from the prior rating curve for most stages. This finding sharply contrasts with those reported in [34], in which the information aggregated by stage observations caused the median rating curve to strongly deviate from that estimated with BaRatin. In addition, the 95% conditional credible intervals are, on average, 40% narrower than the prior counterparts, for stages ranging from 0.25 to 2.50 m—more noticeable reductions were verified for lower stages, for which a higher number of observations is available. This is, however, a somewhat unexpected result, as approximately 8000 stage realizations were utilized for inference, and the RC structural error process is independent, which, at least in theory, should much more strongly reduce uncertainty (see [34])—this was actually verified for the parametric counterpart, which, alone, does not meet the theoretical coverage probability, as 9 out of 25 gaugings, including the error bars, are not encompassed by the 95% parametric credible limits. Yet, the posterior rating curve provided a considerable improvement to discharge predictions, as compared to expert hydraulic knowledge alone, since all gaugings (including the error bars) remain enclosed by the credible limits defined by the conditional predictive distributions of true discharges, even for the lowest stages.
Figure 7.
Prior and posterior rating curves.
From an applied perspective, the much less uncertain posterior RC can provide a sound basis for flood management in urban catchments, notwithstanding the simplified assumptions and limitations of our approach. For instance, the posterior RC should provide more realistic inputs for hydrodynamic models and probabilistic flood mapping—note such maps may be readily updated by recalibrating the parameters of the rainfall-stage model as more stage observations become available. Furthermore, as the true discharges, which exclude rating curve uncertainty, comprise an output of the rainfall-stage model, flood forecasting and nowcasting may also be more precise, with potentially more effective alert issuing. While these developments were not formally addressed and validated here, future research might delve deeper into such applications, thus providing a more detailed assessment of the potential gains associated with the proposed prediction framework.
4. Conclusions and Research Developments
In this paper, we investigated advantages and drawbacks of combining hydraulic knowledge, derived from simple physical laws, and a rainfall-stage model, as proposed by [34], for estimating synthetic rating curves (RC) in small urban streams. Built upon a fully probabilistic rationale, designed to explicitly handle parametric uncertainty and structural errors from both the stage-discharge relationship and the hydrological model (RR), the proposed approach leverages continuous stage observations, which indirectly integrate rainfall and losses over time at the catchment scale, for providing physical realism to the inferred rating curve. As a proof-of-concept, we utilized the proposed framework for estimating the synthetic rating curve at a section in the Monjolinho River catchment, a small urban basin located in São Carlos, in the Brazilian state of São Paulo, in which 25 gaugings [36]—only employed for model scrutiny and validation—are available.
As a first step, we estimated the prior rating curve under the BaRatin framework [35], which summarizes prior expert knowledge on the stage-discharge relationship for a given hydraulic reference regime. Although detailed field information for eliciting prior distributions was available at the Monjolinho River catchment, the prior rating curve proved too uncertain for informing decision making—despite being underpinned by sound hydraulic considerations, it could not provide physically meaningful constraints for hydrologic processes at play at the catchment scale. In addition, prior parametric uncertainty alone has placed the usual deterministic view on stage-discharge relationships into perspective—in our case study, the variability of RC parameters amounted to almost half of the overall prior uncertainty, which arguably demonstrates the underlying assumptions of simpler estimation models (e.g., precise knowledge of hydraulic parameters) are too stringent to be met in practical applications. Overall, the prior rating curve highlighted the difficulties in devising effective strategies for flood management when empirical evidence on the target process (i.e., gaugings) is not available.
Calibrating the parameters of the rainfall-stage model also proved a challenging task. In effect, parameter identification was only feasible when constraints were imposed on the prior distributions of the RC parameters, which could not be fully justified under theoretical reasoning, but strongly impacted the posterior results—the truncation prevented the posterior rating curve from departing from the prescribed reference regime. Moreover, the complex interactions between RC and RR parameters have, to some extent, hindered their physical interpretability—some RR posterior distributions were highly concentrated at the prior bounds, but this could not be resolved by increasing the variables’ ranges. This fact suggests that, during inference, the rating curve “compensates” for the limitations of the rainfall-runoff model, particularly through increased structural errors, which might explain the identifiability issues. Future work could thus investigate whether utilizing a rainfall-runoff model better suited for urban environments comprises an effective approach for addressing this problem.
When decomposing the predictive uncertainty of stages, the rating curve was the most prominent factor, accounting for approximately 58% of the errors. This fact clearly demonstrates how the absence of gaugings affects model predictions—physically unrealistic credible intervals were obtained, particularly for flood peaks, which is certainly troubling for flood forecasting and alert issuing at the catchment outlet. On the other hand, it does not seem straightforward to further constrain the prior rating curve (i.e., structural errors) for reducing its influence on prediction errors, as not many assumptions for relating the hyperparameters of the RC error model to data-independent information can be put in the formulation of prior distributions. On the basis of these arguments, obtaining a few gaugings, even under simplified approaches (e.g., [36]), would be beneficial for reducing uncertainty on the rating curve parameters and enhancing the rainfall-stage predictive abilities.
Streamflow uncertainty decomposition mostly highlighted the predominance of structural errors in the estimation of true discharges. One should note, however, that RR structural uncertainty inherently accommodates other error sources, such as those related to rainfall, which should play a major role in rainfall-runoff simulations [63]. Nonetheless, integrating input errors into the rainfall-stage model (or rainfall-runoff models in general) is still a challenging, unresolved task. In this sense, developing sound alternatives for formal input uncertainty quantification, as well as more broadly assessing its effects in RR errors, might guide future research efforts in conceptual hydrological modeling; the explicit treatment of input (rainfall), output (RC) and structural (RR) errors may be highly beneficial for real-time flood forecasting and alert issuing.
Finally, the synthetic rating curve closely agreed with the available gaugings, in median terms, and entailed an average decrease of 40% in the 95% conditional credible intervals, which is deemed a considerable gain with respect to prior knowledge alone. In this context, practitioners and decision makers might greatly benefit from our approach for probabilistic flood mapping and alert issuing in urban areas. Of course, the proposed framework may not be advantageous when multiple activation stages would control the stage-discharge relationships, as the uncertainty associated with such variables may be too large (e.g., [34]). Hence, other case studies, under more complex hydraulic conditions, could provide additional insights on the generalization potential of the method.
Based on the obtained results, our approach for deriving synthetic rating curves in urban streams seems feasible, at least for simpler stage-discharge relationships. However, our findings also highlighted the potential improvements in stage and streamflow prediction that should stem from actual monitoring. In this sense, despite the usefulness of the rainfall-stage model for discharge estimation, it is our strong belief that empirical information is necessary for enhancing flood management in urban environments.
Author Contributions
Conceptualization, V.A.F.C.; Methodology, A.d.G.B., C.D.N., F.E.O.e.S., P.M.M. and V.A.F.C.; Software, A.d.G.B., C.D.N. and L.S.A.; Formal analysis, A.d.G.B., V.B.P.R., F.E.O.e.S., N.d.O.N., E.M.M., P.M.M. and V.A.F.C.; Data curation, M.C.F. and A.F.V.; Writing—original draft preparation, V.A.F.C.; Writing—review and editing, A.d.G.B., C.D.N., L.S.A., V.B.P.R., F.E.O.e.S., M.C.F., A.F.V., N.d.O.N., E.M.M. and P.M.M.; Supervision, V.A.F.C.; Project administration, P.M.M. All authors have read and agreed to the published version of the manuscript.
Funding
This research was funded by the National Council for Scientific and Technological Development (CNPq), grant number 446043/2023-0 (PMM) and 311184/2025-1 (VAFC), and the Brazilian Federal Agency for Support and Evaluation of Graduate Education (CAPES), grant number 88887.122586/2025-00.
Data Availability Statement
The data presented in this study are openly available in Rede Hidrometeorológica at https://deciv.ufscar.br/ghidro/ (accessed on 26 May 2026).
Acknowledgments
This manuscript is a joint effort from researchers of the Technical Committee of Statistical Hydrology from the Brazilian Association of Water Resources (ABRHidro) and the research group Hydrology and Statistics Applied to the Modeling of Water Resources Systems (hydro_stat) in their ongoing work for strengthening the interactions among scholars and the technical community for improving water resources management in Brazil. The authors would like to acknowledge the support and scientific contributions of all members of these organizations. The authors also acknowledge the support by Conselho Nacional de Desenvolvimento Científico e Tecnológico (CNPq) and Ministério da Ciência Tecnologia e Inovação (MCTI) for funding the Project “Advances in nowcasting tools applied to urban floods” (Processo 446043/2023-0). The authors also gratefully acknowledge the support provided by the Coordenação de Aperfeiçoamento de Pessoal de Nível Superior (CAPES), and Fundação de Amparo à Pesquisa do Estado de Minas Gerais (FAPEMIG). We also acknowledge the editors and four anonymous reviewers for the valuable comments and suggestions, which helped improve the paper.
Conflicts of Interest
The authors declare no conflicts of interest.
Abbreviations
The following abbreviations are used in this manuscript:
| CNPq | National Council for Scientific and Technological Development |
| DEM | Digital Elevation Model |
| HAND | Height Above the Nearest Drainage |
| INMET | National Institute of Meteorology |
| JCGM | Joint Committee for Guides in Metrology |
| RC | Rating Curves |
| RR | Rainfall-Runoff |
| UFSCar | Federal University of São Carlos |
Appendix A. A Simplified HBV Model
Appendix A.1. Introduction
The transformation of precipitation into streamflow is represented by a lumped conceptual model that follows the structure of the HBV model, originally developed for operational runoff forecasting [52]. The formulation adopted here retains the two core routines of the model: (i) a soil moisture accounting routine, which partitions precipitation into recharge, evapotranspiration, and a saturation-excess direct runoff component; and (ii) a response routine, consisting of an upper and a lower groundwater storage that generate the interflow and slow runoff components, respectively. In the equations below, all storages are expressed in mm and all fluxes as depths (mm) per time step Δt (here, Δt = 1 h). Rainfall Pt and potential evapotranspiration Et are accumulated over the interval (t − 1, t], storage refers to the end of the interval, and the observed stage is the instantaneous measurement at the end of the interval.
Appendix A.2. Soil Moisture Routine
At each time step t, the precipitation volume P (mm) that exceeds the soil’s ability to store water—i.e., the excess beyond the field capacity FC—is assumed to leave the catchment within the same step as saturation-excess direct runoff Qd (Equation (A1)):
in which SMt denotes the soil moisture reservoir storage (mm).
Qdt = max(Pt + SMt − FC, 0)
The infiltrating portion of precipitation, (Pt − Qdt), is then split between refilling of the soil moisture store and the contribution Qint (recharge) to the response routine, according to the characteristic nonlinear partitioning function of the HBV model (Equation (A2)):
The term may be interpreted as the contributing area of the catchment: the runoff-generating fraction of the infiltrating rainfall increases nonlinearly with catchment soil saturation, approaching unity as the soil approaches field capacity. Additionally, parameter β controls the shape of this relationship and thus reflects the (unknown) spatial variability of soil moisture storage capacity within the catchment [52,64].
Actual evapotranspiration Ea (mm) is abstracted from the soil store at the potential rate when the soil is sufficiently wet and is reduced linearly with relative soil moisture below the threshold LP⋅FC and is limited by the available soil moisture SMt (Equation (A3)). With the fixed value LP = 1 adopted here, the reduction starts as soon as SMt drops below FC:
A capillary flux, denoted by Cf (mm) from the upper zone storage into the soil, introduced in the HBV-96 version of the model [65], returns water to the soil zone at a rate proportional to its moisture deficit, with maximum rate CFLUX (here fixed at 0.01 mm per time step), and is limited by the water available in the upper zone storage and by the remaining storage capacity of the soil (see Equation (A4)), where denotes the soil moisture storage before the capillary contribution:
in which .
Finally, the soil moisture storage is updated by the water balance. As Qdt, Eat and Cft are limited by construction (Equations (A1), (A3) and (A4)), the updated storage remains within [0, FC] without any truncation:
Appendix A.3. Response Routine
The recharge Qint (mm) released by the soil routine, minus the capillary flux Cft returned to the soil, enters the upper reservoir storage UZ (Equation (A6)), which represents the fast runoff dynamics of the catchment:
Quick runoff Qft (mm) is released from this storage reservoir through a nonlinear storage–discharge relationship (Equation (A7)). In this simplified model, we consider the exponent α = 1, then, the fast response is a quadratic function of storage:
Drainage from the upper to the lower storage reservoir (percolation) follows a linear relationship with coefficient KPERC, here adopted as constant (Equation (A8)):
The combined outflow from the upper reservoir is not allowed to exceed the available storage. Whenever , both fluxes are rescaled proportionally (Equation (A9)), which preserves their relative partitioning:
ωt⋅Qft → Qft
ωt⋅Perct → Perct,
Then, the upper reservoir storage is updated as:
The lower reservoir storage LZ (mm) represents the deep groundwater storage that sustains baseflow. It behaves as a linear reservoir with recession coefficient Ks, releasing the slow runoff component Ql (Equation (A11)), and is replenished by percolation (Equation (A12)):
Qlt = min(Ks⋅Δt⋅LZt,LZt)
LZt+1 = LZt + Perct − Qlt
Then, the total simulated discharge at time step t (mm per time step) is the sum of three components—saturation-excess direct runoff, the quick response of the upper reservoir, and baseflow from the lower reservoir:
Qt = Qdt + Qft + Qlt
So, the estimation of the total simulated discharge in m3.s−1 is given by Equation (A14)
Qt(m3s−1) = Qt(mm)⋅A (km2)(3.6·Δt)−1
Appendix A.4. Initial Conditions and Numerical Safeguards
The soil moisture store is initialized at half of its capacity, i.e., SMt=0 = 0.5⋅FC, representing an intermediate wetness condition, and both groundwater storages are initialized with small, fixed depths, UZt=0 = LZt=0 = 1 mm. The sensitivity of the results to these initial states is removed by discarding an initial warm-up period of the simulation (here, we assume the warm-up comprises 20% of the simulation period). All transfers are limited by the water available in the source reservoir and by the capacity of the receiving one (Equations (A3), (A4), (A9) and (A11)); hence, storage remains non-negative and SM remains within [0, FC] without truncation, and the water-balance residual is zero to rounding error.
Appendix A.5. Schematic Representation of Model
Figure A1.
Schematic representation of the simplified HBV model.
References
- Zhang, Z.; Li, Q.; Liu, C.; Ding, L.; Ma, Q.; Chen, Y. Driving Effects and Spatial-Temporal Variations in Economic Losses Due to Flood Disasters in China. Water 2022, 14, 2266. [Google Scholar] [CrossRef] [Scilit]
- WMO Floods. Available online: https://wmo.int/themes/floods (accessed on 31 August 2026).
- Nooni, I.K.; Sarpong, L.; Kumi, N.; Prempeh, N.A.; Fianko, S.K.; Jin, Z. Human Impacts of Flood Disasters: A Global Systematic Review (1980–2025). H2Open J. 2026, 9, 100019. [Google Scholar] [CrossRef] [Scilit]
- Escobar-Silva, E.V.; Marques-Carvalho, R.; De Almeida, C.M.; Santos, L.B.L.; Bourscheidt, V.; Mikosz, L.; De Lima, G.R.T.; Marchezini, V.; Zeri, M.; Camarinha, P.I.M.; et al. Water-Related Disasters in Brazil: An Assessment from 1991 to 2024. Environ. Res. Lett. 2026, 21, 074015. [Google Scholar] [CrossRef] [Scilit]
- Oliveira, A.K.B.; Carneiro Alves, L.M.; Carvalho, C.L.; Haddad, A.N.; De Magalhães, P.C.; Miguez, M.G. A Framework for Assessing Flood Risk Responses of a Densely Urbanized Watershed, to Support Urban Planning Decisions. Sustain. Resilient Infrastruct. 2023, 8, 400–418. [Google Scholar] [CrossRef] [Scilit]
- Mohr, S.; Ehret, U.; Kunz, M.; Ludwig, P.; Caldas-Alvarez, A.; Daniell, J.E.; Ehmele, F.; Feldmann, H.; Franca, M.J.; Gattke, C.; et al. A Multi-Disciplinary Analysis of the Exceptional Flood Event of July 2021 in Central Europe–Part 1: Event Description and Analysis. Nat. Hazards Earth Syst. Sci. 2023, 23, 525–551. [Google Scholar] [CrossRef] [Scilit]
- Nemnem, A.M.; Tanim, A.H.; Nahian, A.; Khan, S.; Goharian, E.; Imran, J. How Extreme Rainfall and Failing Dams Unleashed the Derna Flood Disaster. Nat. Commun. 2025, 16, 4191. [Google Scholar] [CrossRef] [Scilit] [PubMed]
- Hussein, K.; Alhosani, N.; Al-Areeq, A.M.; Al Aghbari, A.A.; Elkamali, M.; Alsumaiti, T.; Sharif, H.O.; Almurshidi, A.M.G.; Abdalati, W. Unprecedented Rainfall in the United Arab Emirates: Hydrologic and Flood Impact Analysis of the April 2024 Event. Nat. Hazards 2025, 121, 9363–9385. [Google Scholar] [CrossRef] [Scilit]
- Collischonn, W.; Fan, F.M.; Possantti, I.; Dornelles, F.; Paiva, R.; Medeiros, M.S.; Michel, G.P.; Magalhães Filho, F.J.C.; Moraes, S.R.; Marcuzzo, F.F.N.; et al. The Exceptional Hydrological Disaster of April-May 2024 in Southern Brazil. RBRH 2025, 30, e1. [Google Scholar] [CrossRef] [Scilit]
- Laipelt, L.; Mainardi Fan, F.; Dias De Paiva, R.C.; Sampaio Medeiros, M.; Collischonn, W.; Ruhoff, A. Mechanisms and Scenarios of the Unprecedent Flooding Event in South Brazil 2024. Hydrol. Earth Syst. Sci. 2026, 30, 573–590. [Google Scholar] [CrossRef] [Scilit]
- Pullan, N.; Bokhove, O. Creating Story Lines on Floods: Relating Climate-Change Uplift to (Extreme) Experienced and Future Flooding Events. EGUsphere 2026, 2026, 1–48. [Google Scholar] [CrossRef] [Scilit]
- Guimarães, L.F.; Battemarco, B.P.; Oliveira, A.K.B.; Miguez, M.G. A New Approach to Assess Cascading Effects of Urban Floods. Energy Rep. 2021, 7, 8357–8367. [Google Scholar] [CrossRef] [Scilit]
- Lima, F.N.; Fernandes, W.; Nascimento, N. Joint Calibration of a Hydrological Model and Rating Curve Parameters for Simulation of Flash Flood in Urban Areas. RBRH 2019, 24, e24. [Google Scholar] [CrossRef] [Scilit]
- Kilicarslan, B.M.; Temimi, M. Simulating Block-Scale Flood Inundation and Streamflow Using the WRF-Hydro Model in the New York City Metropolitan Area. Nat. Hazards 2024, 120, 10043–10066. [Google Scholar] [CrossRef] [Scilit] [PubMed]
- Pati, A.; Sahoo, B.; Kale, R.V. A Coupled Modeling Approach for Urban Flood Inundation Mapping under Data-Limited Conditions. J. Hydrol. 2025, 661, 133573. [Google Scholar] [CrossRef] [Scilit]
- Luo, P.; Zha, X.; Qi, X.; Zhu, W.; Wang, S.; Nover, D. Water-Level and Flood-Depth Monitoring Technologies: In Situ Sensors, Satellite Observations, Image-Based Methods, and Future Directions. Meas. Sci. Technol. 2026. [Google Scholar] [CrossRef] [Scilit]
- Qin, J.; Lei, X.; Wu, T.; Xia, L. Discussion of “Development of Synthetic Rating Curves: Case Study in Iowa” by Felipe Quintero, Marcela Rojas, Marian Muste, Witold F. Krajewski, Gabriel Perez, Shirley Johnson, Amanda Anderson, Toby Hunemuller, Bill Cappuccio, and Jeffrey Zogg. J. Hydrol. Eng. 2022, 27, 07021008. [Google Scholar] [CrossRef] [Scilit]
- Zheng, X.; Tarboton, D.G.; Maidment, D.R.; Liu, Y.Y.; Passalacqua, P. River Channel Geometry and Rating Curve Estimation Using Height above the Nearest Drainage. J. Am. Water Resour. Assoc. 2018, 54, 785–806. [Google Scholar] [CrossRef] [Scilit]
- Scriven, B.W.G.; McGrath, H.; Stefanakis, E. GIS Derived Synthetic Rating Curves and HAND Model to Support On-the-Fly Flood Mapping. Nat. Hazards 2021, 109, 1629–1653. [Google Scholar] [CrossRef] [Scilit]
- Gordon, C.A.; Foulon, E.; Rousseau, A.N. Deriving Synthetic Rating Curves from a Digital Elevation Model to Delineate the Inundated Areas of Small Watersheds. J. Hydrol. Reg. Stud. 2023, 50, 101580. [Google Scholar] [CrossRef] [Scilit]
- Thalakkottukara, N.T.; Thomas, J.; Watkins, M.K.; Holland, B.C.; Oommen, T.; Grover, H. Suitability of the Height above Nearest Drainage (HAND) Model for Flood Inundation Mapping in Data-Scarce Regions: A Comparative Analysis with Hydrodynamic Models. Earth Sci. Inf. 2024, 17, 1907–1921. [Google Scholar] [CrossRef] [Scilit]
- Yu, C.; Yang, W.; Feng, D. Assessing the Role of Hydrodynamics in Enhancing Height-Above-the-Nearest-Drainage Derived Synthetic Rating Curves: A Comparative Study in the Wu River Basin, Taiwan. J. Flood Risk Manag. 2025, 18, e70057. [Google Scholar] [CrossRef] [Scilit]
- Ghanghas, A.; Dey, S.; Merwade, V. Evaluating the Reliability of Synthetic Rating Curves for Continental Scale Flood Mapping. J. Hydrol. 2022, 606, 127470. [Google Scholar] [CrossRef] [Scilit]
- Lindner, G.A.; Miller, A.J. Numerical Modeling of Stage-Discharge Relationships in Urban Streams. J. Hydrol. Eng. 2012, 17, 590–596. [Google Scholar] [CrossRef] [Scilit]
- Shao, Q.; Dutta, D.; Karim, F.; Petheram, C. A Method for Extending Stage-Discharge Relationships Using a Hydrodynamic Model and Quantifying the Associated Uncertainty. J. Hydrol. 2018, 556, 154–172. [Google Scholar] [CrossRef] [Scilit]
- Quintero, F.; Rojas, M.; Muste, M.; Krajewski, W.F.; Perez, G.; Johnson, S.; Anderson, A.; Hunemuller, T.; Cappuccio, B.; Zogg, J. Development of Synthetic Rating Curves: Case Study in Iowa. J. Hydrol. Eng. 2021, 26, 05020046. [Google Scholar] [CrossRef] [Scilit]
- Dhote, P.R.; Bansal, J.K.; Garg, V.; Thakur, P.K.; Agarwal, A. A Framework for Generating Rating Curves in Mahanadi River Using Hydrodynamic Model and Radar Altimetry Data. Hydrol. Sci. J. 2025, 70, 390–405. [Google Scholar] [CrossRef] [Scilit]
- Baruah, A.; Spies, R.; Devi, D.; Cohen, S.; Aristizabal, F.; Nikrou, P.; Tian, D.; Pruitt, C. Predicting Synthetic Rating Curve Adjustment Factors with Explainable Machine Learning for Enhancing the United States Operational Flood Inundation Mapping Framework. J. Hydrol. 2025, 662, 134086. [Google Scholar] [CrossRef] [Scilit]
- Baruah, A.; Zarrabi, R.; Cohen, S.; Johnson, J.M.; McDermott, R. Interpretable Machine Learning for Predicting Rating Curve Parameters Using Channel Geometry and Hydrological Attributes across the United States. Sci. Rep. 2025, 15, 44164. [Google Scholar] [CrossRef] [Scilit] [PubMed]
- Gutenson, J.L.; Follum, M.L.; Staebell, K.A.; Ondich, E.S.; Wahl, M.D. Analyzing Synthetic Stage-Discharge Rating Curves and Riverine Flood Inundation Maps Derived From Global-Scale Hydrologic and Hydraulic Modeling. J. Flood Risk Manag. 2025, 18, e70135. [Google Scholar] [CrossRef] [Scilit]
- Ocio, D.; Le Vine, N.; Westerberg, I.; Pappenberger, F.; Buytaert, W. The Role of Rating Curve Uncertainty in Real-time Flood Forecasting. Water Resour. Res. 2017, 53, 4197–4213. [Google Scholar] [CrossRef] [Scilit]
- Westerberg, I.K.; Sikorska-Senoner, A.E.; Viviroli, D.; Vis, M.; Seibert, J. Hydrological Model Calibration with Uncertain Discharge Data. Hydrol. Sci. J. 2022, 67, 2441–2456. [Google Scholar] [CrossRef] [Scilit]
- Domeneghetti, A.; Castellarin, A.; Brath, A. Assessing Rating-Curve Uncertainty and Its Effects on Hydraulic Model Calibration. Hydrol. Earth Syst. Sci. 2012, 16, 1191–1202. [Google Scholar] [CrossRef] [Scilit]
- Sikorska, A.E.; Renard, B. Calibrating a Hydrological Model in Stage Space to Account for Rating Curve Uncertainties: General Framework and Key Challenges. Adv. Water Resour. 2017, 105, 51–66. [Google Scholar] [CrossRef] [Scilit]
- Le Coz, J.; Renard, B.; Bonnifait, L.; Branger, F.; Le Boursicaud, R. Combining Hydraulic Knowledge and Uncertain Gaugings in the Estimation of Hydrometric Rating Curves: A Bayesian Approach. J. Hydrol. 2014, 509, 573–587. [Google Scholar] [CrossRef] [Scilit]
- Barbassa, A.P. Monitoramento Pluviométrico e de Escoamento Superficial Em Áreas Urbanas. Eng. Urbana Debate 2024, 5. [Google Scholar] [CrossRef] [Scilit]
- Campanelli, L.C.; Lorandi, R.; de Lollo, J.A. Cartografia geoambiental da bacia do rio do monjolinho (São Paulo). In Métodos e Técnicas de Pesquisa em Bacias Hidrográficas; Moraes, M.E.B., Lorandi, R., Eds.; Editus: Ilhéus, BA, Brazil, 2017; ISBN 978-85-7455-443-3. [Google Scholar]
- Fava, M.C.; Mazzoleni, M.; Abe, N.; Mendiondo, E.M.; Solomatine, D.P. Improving Flood Forecasting Using an Input Correction Method in Urban Models in Poorly Gauged Areas. Hydrol. Sci. J. 2020, 65, 1096–1111. [Google Scholar] [CrossRef] [Scilit]
- FAO. Evapotranspiración del Cultivo: Guías Para la Determinación de los Requerimientos de Agua de los Cultivos; FAO Irrigation and Drainage Paper; Food and Agriculture Organization of the United Nations: Rome, Italy, 2006. [Google Scholar]
- Mansanarez, V.; Renard, B.; Coz, J.L.; Lang, M.; Darienzo, M. Shift Happens! Adjusting Stage-Discharge Rating Curves to Morphological Changes at Known Times. Water Resour. Res. 2019, 55, 2876–2899. [Google Scholar] [CrossRef] [Scilit]
- Garcia, R.; Costa, V.; Silva, F. Bayesian Rating Curve Modeling: Alternative Error Model to Improve Low-Flow Uncertainty Estimation. J. Hydrol. Eng. 2020, 25, 04020012. [Google Scholar] [CrossRef] [Scilit]
- Qiu, J.; Liu, B.; Yu, X.; Yang, Z. Combining a Segmentation Procedure and the BaRatin Stationary Model to Estimate Nonstationary Rating Curves and the Associated Uncertainties. J. Hydrol. 2021, 597, 126168. [Google Scholar] [CrossRef] [Scilit]
- Louis, R.; Zech, Y.; Joseph, A.; Gonomy, N.; Soares-Frazao, S. Flood Modeling of the June 2023 Flooding of Léogâne City by the Overflow of the Rouyonne River in Haiti. Water 2024, 16, 2594. [Google Scholar] [CrossRef] [Scilit]
- Das, T.; Das, S. An Integrated Bayesian Hydrodynamic Framework for Quantifying Rating Curve Uncertainty in Design Flood Estimation and Flood Hazard Mapping in a Data-Scarce Urban Area. Water Res. 2026, 288, 124610. [Google Scholar] [CrossRef] [Scilit] [PubMed]
- Baptista, M.; Lara, M. Fundamentos de Engenharia Hidráulica, 4th ed.; Editora UFMG: Belo Horizonte, Brazil, 2014; ISBN 978-85-7041-828-9. [Google Scholar]
- BIPM; IEC; IFCC; ILAC; ISO; IUPAC; IUPAP; OIML. Evaluation of Measurement Data—Guide to the Expression of Uncertainty in Measurement; Joint Committee for Guides in Metrology: Sèvres, France, 2008. [Google Scholar]
- Costa, V.; Fernandes, W. Bayesian Estimation of Extreme Flood Quantiles Using a Rainfall-Runoff Model and a Stochastic Daily Rainfall Generator. J. Hydrol. 2017, 554, 137–154. [Google Scholar] [CrossRef] [Scilit]
- Shabestanipour, G.; Brodeur, Z.; Manoli, B.; Birnbaum, A.; Steinschneider, S.; Lamontagne, J.R. Risk-Based Hydrologic Design under Climate Change Using Stochastic Weather and Watershed Modeling. Front. Water 2024, 6, 1310590. [Google Scholar] [CrossRef] [Scilit]
- Shabestanipour, G.; Brodeur, Z.; Farmer, W.H.; Steinschneider, S.; Vogel, R.M.; Lamontagne, J.R. Stochastic Watershed Model Ensembles for Long-Range Planning: Verification and Validation. Water Resour. Res. 2023, 59, e2022WR032201. [Google Scholar] [CrossRef] [Scilit]
- Vogel, R.M. Stochastic Watershed Models for Hydrologic Risk Management. Water Secur. 2017, 1, 28–35. [Google Scholar] [CrossRef] [Scilit]
- Vogel, R.M.; Papalexiou, S.M.; Lamontagne, J.R.; Dolan, F.C. When Heavy Tails Disrupt Statistical Inference. Am. Stat. 2025, 79, 221–235. [Google Scholar] [CrossRef] [Scilit]
- Bergström, S.; Forsman, A. Development of a Conceptual Deterministic Rainfall-Runoff Model. Hydrol. Res. 1973, 4, 147–170. [Google Scholar] [CrossRef] [Scilit]
- Seibert, J.; Vis, M.J.P. Teaching Hydrological Modeling with a User-Friendly Catchment-Runoff-Model Software Package. Hydrol. Earth Syst. Sci. 2012, 16, 3315–3325. [Google Scholar] [CrossRef] [Scilit]
- Dhakal, S. Development of HBV Water Balance Model in R. Available online: https://rpubs.com/sdhakal/848236 (accessed on 1 September 2026).
- Seibert, J. Estimation of Parameter Uncertainty in the HBV Model. Hydrol. Res. 1997, 28, 247–262. [Google Scholar] [CrossRef] [Scilit]
- Leopold, L.B. Lag Times for Small Drainage Basins. Catena 1991, 18, 157–171. [Google Scholar] [CrossRef] [Scilit]
- Gabry, J.; Češnovar, R.; Johnson, A.; Bronder, S. Cmdstanr: R Interface to ‘CmdStan’. R package version 0.9.0. 2025. Available online: https://mc-stan.org/cmdstanr/ (accessed on 1 September 2026).
- Carpenter, B.; Gelman, A.; Hoffman, M.D.; Lee, D.; Goodrich, B.; Betancourt, M.; Brubaker, M.; Guo, J.; Li, P.; Riddell, A. Stan: A Probabilistic Programming Language. J. Stat. Soft. 2017, 76. [Google Scholar] [CrossRef] [Scilit] [PubMed]
- Vehtari, A.; Gelman, A.; Simpson, D.; Carpenter, B.; Bürkner, P.-C. Rank-Normalization, Folding, and Localization: An Improved Rˆ for Assessing Convergence of MCMC (with Discussion). Bayesian Anal. 2021, 16, 667–718. [Google Scholar] [CrossRef] [Scilit]
- Vieira, L.M.D.S.; Sampaio, J.C.L.; Costa, V.A.F.; Eleutério, J.C. Assessing the Effects of Rating Curve Uncertainty in Flood Frequency Analysis. RBRH 2022, 27, e11. [Google Scholar] [CrossRef] [Scilit]
- Anim, D.O.; Fletcher, T.D.; Vietz, G.J.; Pasternack, G.B.; Burns, M.J. Restoring In-stream Habitat in Urban Catchments: Modify Flow or the Channel? Ecohydrology 2019, 12, e2050. [Google Scholar] [CrossRef] [Scilit]
- Andrade, J.L.V.; Coutinho, A.P.; Da Silva Filho, J.A.; De Aguiar Costa, I.R.; Neto, S.M.; Antonino, A.C.D. Urban Flood Response and Hydrological Model Performance in a Tropical Watershed of Northeastern Brazil. J. South. Am. Earth Sci. 2026, 182, 106220. [Google Scholar] [CrossRef] [Scilit]
- Costabile, P.; Lombardo, M.; Chiaravalloti, F.; Caloiero, T.; Costanzo, C. Predicting Pluvial Flood Impacts in Data-Scarce Urban Environments: Uncertainty and Interplay between Rainfall Inputs and Conceptual Drainage Loss Models. Urban. Clim. 2026, 65, 102724. [Google Scholar] [CrossRef] [Scilit]
- Bergström, S. The HBV Model–Its Structure and Applications; SMHI Reports Hydrology; Swedish Meteorological and Hydrological Institute: Norrköping, Sweden, 1992. [Google Scholar]
- Lindström, G.; Johansson, B.; Persson, M.; Gardelin, M.; Bergström, S. Development and Test of the Distributed HBV-96 Hydrological Model. J. Hydrol. 1997, 201, 272–288. [Google Scholar] [CrossRef] [Scilit]

Disclaimer/Publisher’s Note: The statements, opinions and data contained in all publications are solely those of the individual author(s) and contributor(s) and not of MDPI and/or the editor(s). MDPI and/or the editor(s) disclaim responsibility for any injury to people or property resulting from any ideas, methods, instructions or products referred to in the content. |
© 2026 by the authors. Licensee MDPI, Basel, Switzerland. This article is an open access article distributed under the terms and conditions of the Creative Commons Attribution (CC BY) license.