


Abstract
Stroke is the leading cause of long-term disability in young adults aged 18–49 years, yet automated TOAST subtype classification from clinical data remains understudied, particularly in Jordan. Six machine learning algorithms (Random Forest, Gradient Boosting, Logistic Regression, SVM-RBF, XGBoost, LightGBM) were evaluated for five-class TOAST classification in 91 young adult ischemic stroke patients from Jordan University Hospital (2019–2023). Twelve binary clinical and imaging variables recorded by the neurology team were integrated with structured clinical data. A strict no-leakage nested cross-validation framework was applied, with all preprocessing within each training fold. XGBoost achieved the highest macro F1-score (0.575 ± 0.078) as the pre-specified primary metric; SVM (RBF) achieved the highest AUC-ROC (0.795 ± 0.071). Arterial stenosis and lacunar infarct were selected in all five cross-validation folds. SHAP analysis demonstrated pathophysiologically coherent class-specific feature contributions. All models outperformed a structured-variables-only baseline (F1 = 0.352). Integrating clinical and imaging variables substantially improves TOAST classification, with the primary value lying in process standardization and automation rather than novel etiologic discovery. External validation on larger multicenter cohorts is required before clinical deployment.
1. Introduction
Stroke is a leading cause of morbidity and mortality worldwide, with a rising and disproportionate burden in young adults aged 18–49 years [1,2,3,4,5]. Strokes in this age group affect the most productive years of life, increasing their clinical and public health significance [6,7,8,9]. In Jordan, where specific risk factors including high smoking prevalence, rising rates of diabetes, and limited stroke rehabilitation services may influence stroke etiology differently than in Western cohorts, this population remains insufficiently studied [10].
The TOAST (Trial of Org 10172 in Acute Stroke Treatment) classification system categorizes ischemic stroke into five mechanistic subtypes: Large-Artery Atherosclerosis (LAA), Cardioembolism (CE), Small-Vessel Occlusion (SVO), Other Determined Etiology, and Stroke of Undetermined Etiology [11,12]. Each subtype carries distinct therapeutic implications: LAA typically requires antiplatelet therapy and lipid-lowering treatment, CE mandates anticoagulation, and SVO is addressed through risk factor control, making correct classification clinically consequential. The Modified Rankin Scale (mRS) evaluates functional outcomes post-stroke, and the correlation between TOAST subtype and mRS provides insight into which stroke mechanisms carry the greatest long-term disability burden [13]. Diagnostic errors involving acute cerebrovascular events remain clinically important and can delay appropriate management [14].
Machine learning (ML) has been applied to several stroke-related tasks, including outcome prediction and subtype classification [15,16,17]. Related work has also shown that modern machine learning can support diagnostic differentiation in other acute neurologic disorders [18]. However, most published models rely exclusively on structured pre-coded clinical variables. In contrast, imaging variables such as infarct pattern, arterial stenosis, and lesion distribution, which are directly referenced in TOAST classification criteria, are rarely incorporated in a structured manner [19]. A critical methodological weakness in the existing literature is data leakage: many studies apply imputation and feature selection to the full dataset before cross-validation, inflating reported performance estimates [20]. Additionally, the black-box nature of many ML models limits clinical adoption; SHAP (SHapley Additive exPlanations) can bridge this gap by quantifying each feature contribution to individual predictions [21].
Machine-learning methods have also been explored at Jordan University Hospital for cardiovascular risk prediction, providing local precedent for data-driven clinical modeling [22]. This study evaluates six ML algorithms for TOAST subtype classification in 91 young adult stroke patients from Jordan University Hospital, integrating clinical and imaging variables recorded under neurological supervision with standard structured clinical data, under a strict no-leakage nested cross-validation framework with SHAP explainability. To our knowledge, this is one of the first ML studies of TOAST classification in a Jordanian young adult cohort that integrates structured clinical and imaging variables with patient-level explainability.
2. Materials and Methods
2.1. Study Design and Dataset
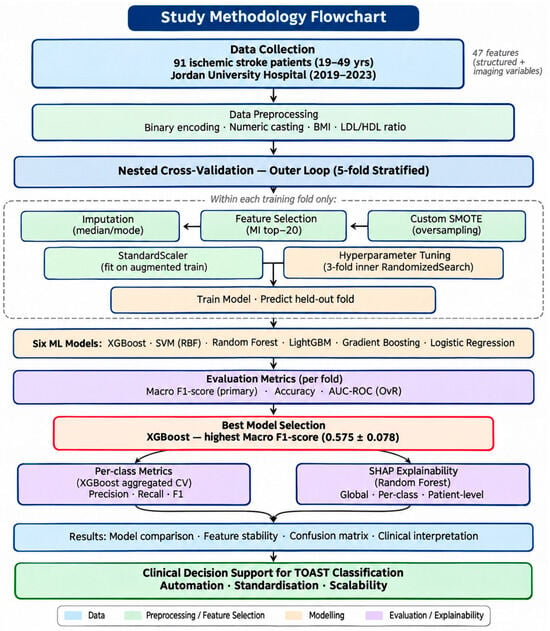
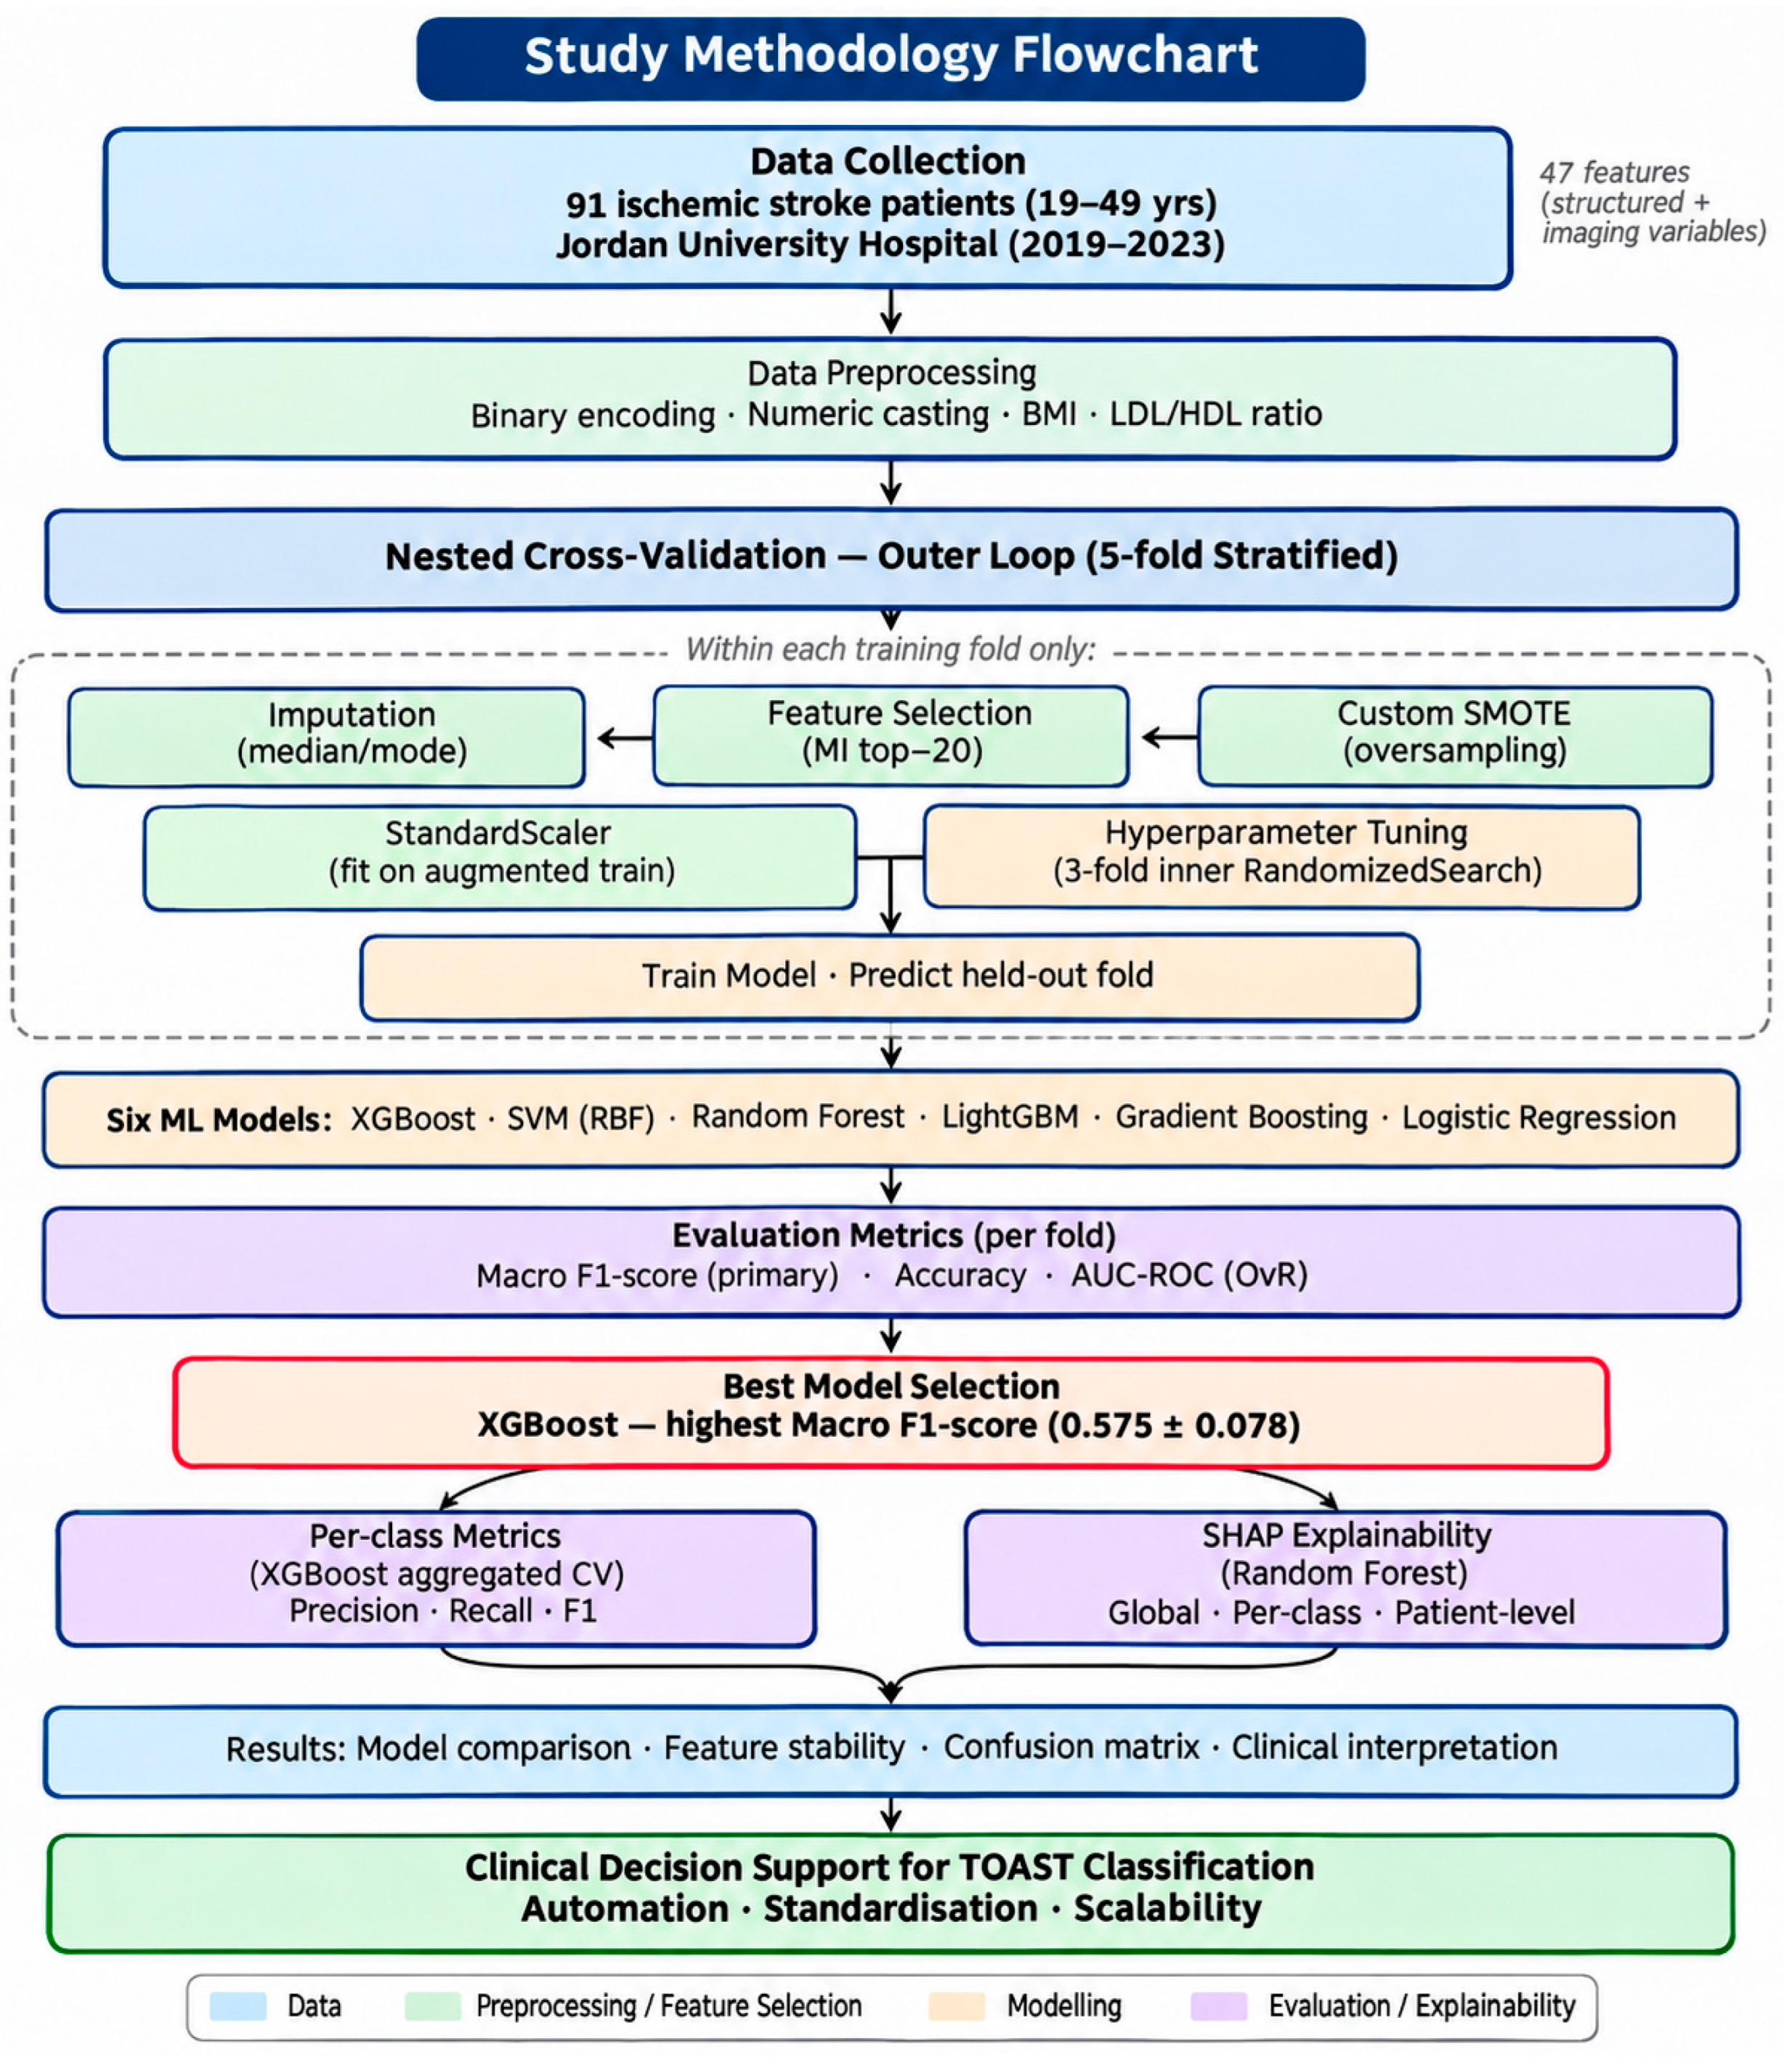
This retrospective cohort study analyzed clinical data from 91 ischemic stroke patients aged 19–49 years, admitted to Jordan University Hospital between 2019 and 2023. Eligible patients had a confirmed diagnosis of ischemic stroke based on clinical presentation and neuroimaging. Patients with hemorrhagic stroke, missing TOAST classification, or insufficient clinical documentation were excluded. The University of Jordan Institutional Review Board approved the study before data collection. The cohort comprised 62 males (68.1%) and 29 females (31.9%). TOAST classification yielded five categories: Stroke of Undetermined Etiology (n = 41, 45.1%), Other Determined Etiology (n = 15, 16.5%), Cardioembolism (n = 13, 14.3%), SVO (n = 13, 14.3%), and LAA (n = 9, 9.9%). The neurology team collected data from electronic medical records, imaging reports, and discharge summaries under the attending neurosurgeon’s supervision (T.K.). Figure 1 summarizes the overall study pipeline.
Figure 1.
Study methodology flowchart illustrating the complete pipeline from data collection through nested cross-validation preprocessing, model training, evaluation, and SHAP explainability analysis. All preprocessing steps (imputation, feature selection, oversampling, scaling) are performed exclusively within each training fold to prevent data leakage. Subsequent figures are numbered from 2 onwards.
2.2. Data Collection and Variables
2.2.1. Structured Clinical Variables
Standard clinical risk factors were recorded as binary variables: hypertension, type 1 and 2 diabetes mellitus, smoking status, anticoagulant use, family history of stroke, valvular and non-valvular heart disease, myocardial infarction, dialysis, oral contraceptive use, pregnancy and postpartum status, migraine with aura, and miscarriage. Autoimmune conditions (SLE, Antiphospholipid syndrome, Sjögren syndrome, Behcet disease, Rheumatoid arthritis) were recorded individually and combined into a composite Autoimmune Burden score. Continuous variables (HbA1c, triglycerides, LDL, HDL, height, weight) were recorded in standard clinical units. BMI was calculated from height and weight, and an LDL/HDL ratio was computed as a marker of atherogenic dyslipidemia.
2.2.2. Imaging and Clinical Variables
In addition to structured variables, the neurology team recorded twelve binary clinical and imaging variables under the supervision of the attending neurosurgeon (T.K.). Each variable was defined according to predefined criteria aligned with TOAST classification definitions, covering imaging findings (infarct pattern, arterial stenosis, territory) and clinical characteristics (cardiac findings, thrombophilia, TIA history) that are directly referenced in the TOAST system but not consistently available in structured form within the hospital information system. Formal inter-rater agreement metrics were not computed; this represents a limitation of the data collection process. Table 1 presents full variable definitions.
Table 1.
Baseline characteristics of the study cohort stratified by TOAST subtype (n = 91).
2.3. Data Preprocessing
Binary variables were standardized to a 0/1 encoding scheme. Continuous variables were cast to numeric types, with non-numeric entries coerced to missing values. To prevent data leakage, all preprocessing steps were performed exclusively within each cross-validation training fold and applied to the corresponding held-out fold. Within each training fold, missing values were imputed using the column median for continuous variables and column mode for categorical variables. BMI values were clipped to the physiologically plausible range of 10–60 kg/m2.
2.4. Feature Selection
Feature selection was performed using mutual information (MI) between each candidate feature and the TOAST classification target, computed within each training fold independently and applied to select feature indices in the held-out fold. The top 20 features by MI were retained per fold. Feature stability was assessed by recording selection frequency across folds; features selected in four or more of five folds were considered stable predictors.
Mutual information was selected as the feature selection criterion for three reasons. First, MI captures nonlinear statistical dependencies between features and the outcome, which is important given the heterogeneous mix of binary, continuous, and composite variables. Second, MI is model-agnostic and does not assume linear relationships or specific distributional forms, making it appropriate for our diverse feature types. Third, MI handles multiclass outcomes natively without requiring one-versus-rest decomposition. Alternative criteria such as ANOVA F-test and chi-squared were considered but rejected because they assume parametric distributions or are limited to categorical features, respectively. The initial feature pool of 47 candidates was assembled based on two principles: (1) established vascular risk factors consistently associated with stroke in the literature, and (2) imaging and clinical characteristics directly referenced in the TOAST classification criteria [11]. No features were included solely for their availability in the dataset without a prior clinical rationale.
2.5. Handling Class Imbalance
A custom oversampling strategy inspired by SMOTE [23] was implemented: synthetic samples were generated through pairwise interpolation between randomly selected instances from the same class, with interpolation coefficient alpha drawn from U(0.2, 0.8) and Gaussian noise proportional to each feature standard deviation (sigma × 0.05) added to improve sample diversity. Binary and categorical features were rounded to the nearest integer (0 or 1) after synthesis; continuous features received no rounding. This known limitation of SMOTE-based methods in mixed-type settings should be acknowledged [24]. Oversampling was applied within each training fold after feature selection, combined with class-weight balancing.
2.6. Machine Learning Models
Six machine learning algorithms were trained and compared: Random Forest (RF), Gradient Boosting (GB), Logistic Regression (LR), Support Vector Machine with RBF kernel (SVM-RBF), XGBoost [25], and LightGBM. RF, LR, SVM (RBF), and LightGBM were configured with class_weight = ‘balanced’; XGBoost used per-class scale_pos_weight; Gradient Boosting relied on oversampling alone for imbalance handling. Applying both custom oversampling and class-weight balancing is intentional: oversampling augments minority-class training examples within each fold, while class weights additionally penalise minority errors during model fitting, providing complementary imbalance correction at the data and algorithm levels. LR and SVM received features standardized using StandardScaler fitted on training data within each fold. All analyses were implemented in Python v3.12 using scikit-learn (v1.8), XGBoost (v2.1), LightGBM (v4.5), and SHAP (v0.46) libraries.
2.7. Model Evaluation: Nested Cross-Validation
A nested cross-validation framework was adopted to obtain unbiased performance estimates. The outer loop used 5-fold stratified cross-validation; within each outer training fold, a 3-fold RandomizedSearchCV searched over model-specific hyperparameter distributions (n_iter = 50 per model (random_state = 42); full search spaces in Supplementary Table S1). The complete preprocessing pipeline (imputation, feature selection, oversampling, scaling) was applied within each outer training fold and independently applied to each held-out fold. We note that the extremely small sizes of some classes (LAA: n = 9) may introduce high variance in MI-based feature selection and hyperparameter tuning within individual folds, even under nested cross-validation; fold-wise distributions (mean ± SD) are reported to convey this uncertainty [26].
2.8. Evaluation Metrics
Model performance was assessed using three metrics. Macro-averaged F1-score (F1-macro) was the pre-specified primary metric, selected a priori because of class imbalance and because it treats each class equally regardless of size. Overall accuracy was reported for comparability. Macro-averaged AUC-ROC (one-versus-rest) was used as a class-imbalance-insensitive discriminative measure. Stratified 5-fold outer cross-validation ensured that each class appeared in every test fold, supporting stable per-fold AUC estimation. All metrics are reported as mean ± SD across five outer folds. Per-class precision, recall, and F1-score are reported from aggregated predictions.
2.9. Explainability Analysis
SHAP [27] was computed using TreeExplainer for the Random Forest model. Although XGBoost achieved the highest F1-macro, Random Forest was selected for SHAP analysis as an interpretable tree-based model with robust cross-validation performance and full TreeExplainer compatibility [28]. SVM (RBF) is kernel-based and incompatible with TreeExplainer. Three visualization types were generated: per-class feature importance plots, a global beeswarm plot, and patient-level waterfall plots for one representative correctly classified patient per TOAST class, presented as illustrative examples.
3. Results
3.1. Baseline Characteristics
Table 1 presents baseline characteristics stratified by TOAST subtype. The cohort was predominantly male (62/91, 68.1%) with a median age of 42.0 years (IQR 37–46). Stroke of Undetermined Etiology was the largest subtype (45.1%). Valvular heart disease was strongly concentrated in CE (38.5% vs. 6.7% or less in all other subtypes). SLE was almost exclusively observed in Other Determined Etiology (40.0%). Among imaging variables, arterial stenosis was documented in 77.8% of LAA cases and lacunar/small-vessel infarct in 76.9% of SVO cases.
3.2. Feature Importance and Stability
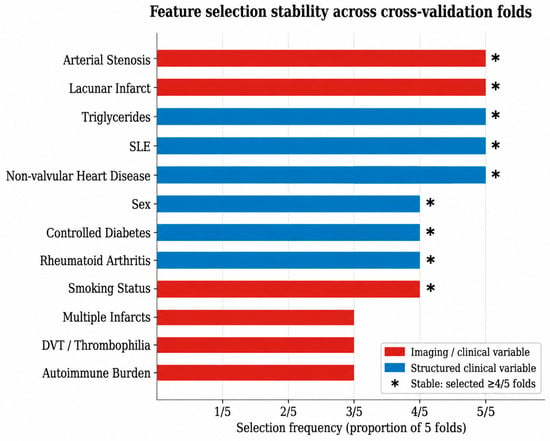
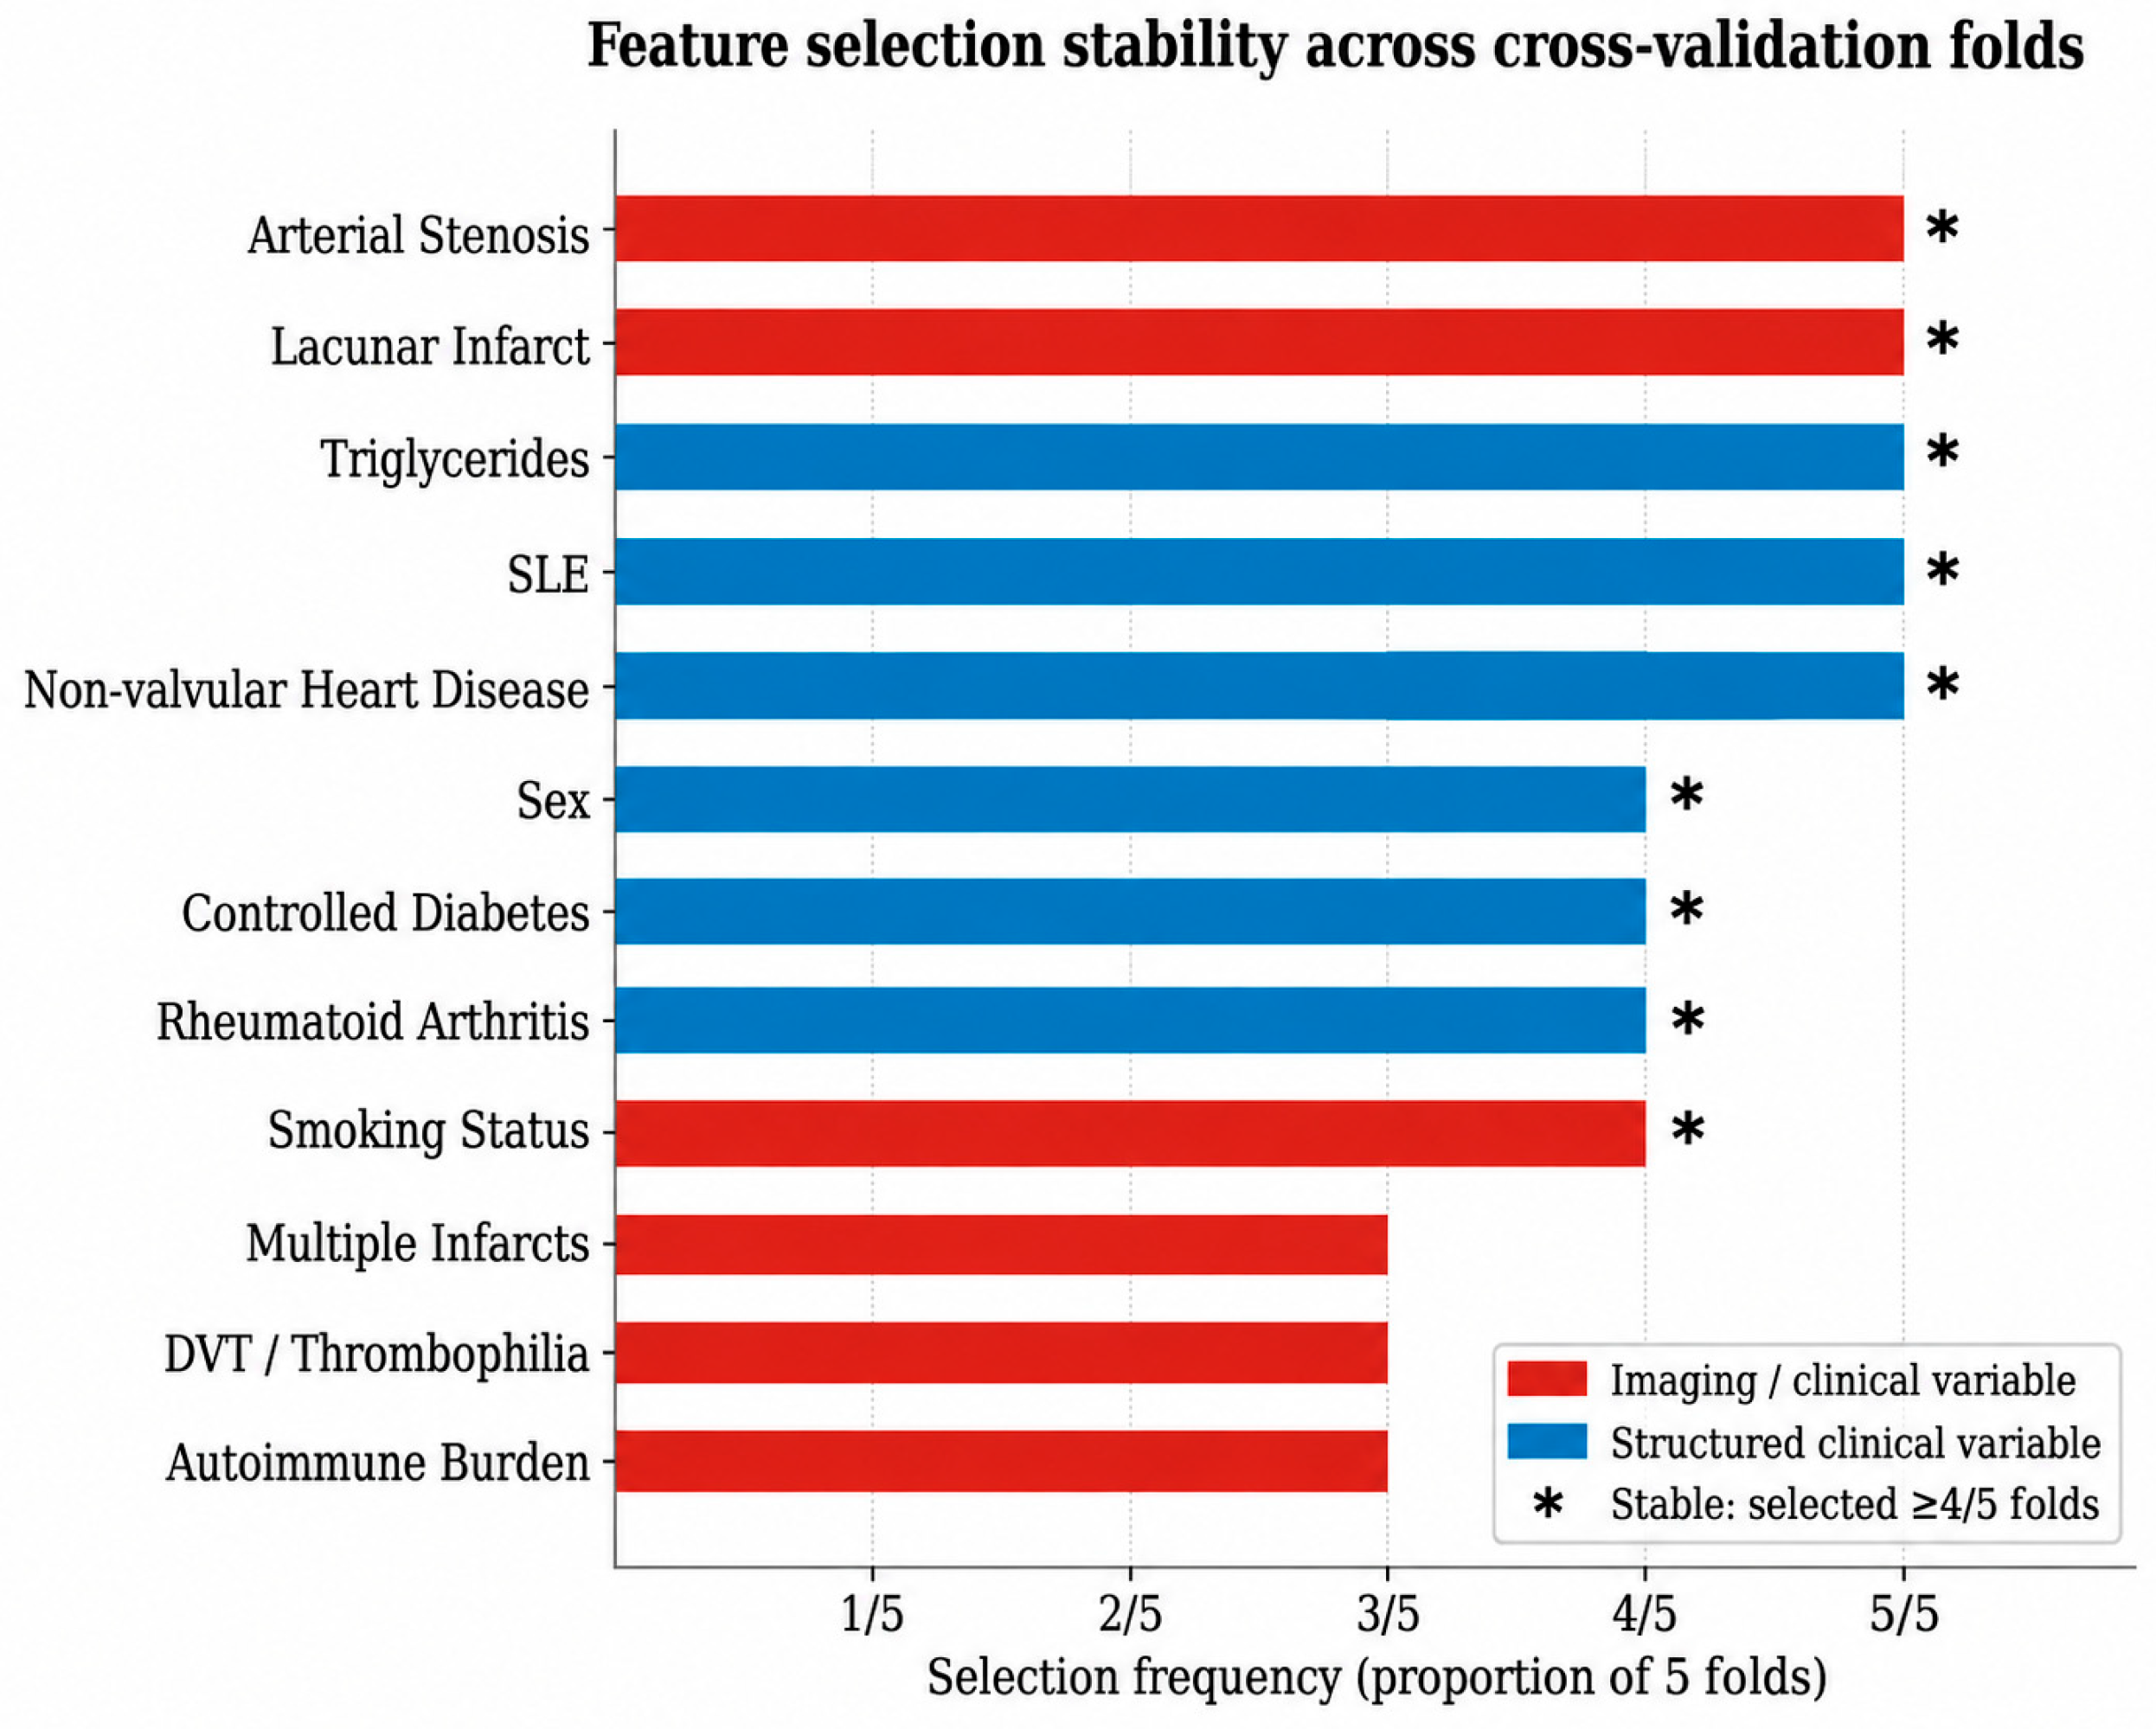
Mutual information analysis identified arterial stenosis, lacunar infarct, triglycerides, SLE, and non-valvular heart diseases as features selected in all five training folds, indicating robust discriminative value. Sex, controlled diabetes, rheumatoid arthritis, and smoking status were selected in four of five folds. More than half of the most stably selected features were imaging/clinical or engineered composite variables, suggesting that these variables contributed meaningful discriminative information beyond standard structured clinical variables alone (Figure 2). An important caveat is that several imaging variables are partial proxies for TOAST criteria; the performance gain therefore partly reflects re-encoding existing diagnostic rules in a standardized, automatable form rather than entirely novel etiologic inference.
Figure 2.
Feature stability across 5 training folds (mutual information selection). Bar length indicates selection frequency; asterisks mark features selected in 4 or more folds. Red = imaging/clinical or engineered composite variable; blue = structured clinical variable.
3.3. Model Performance Comparison
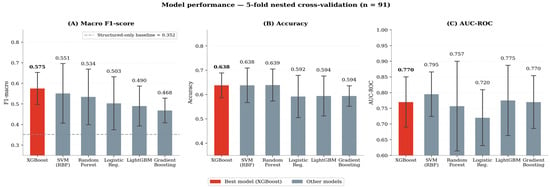
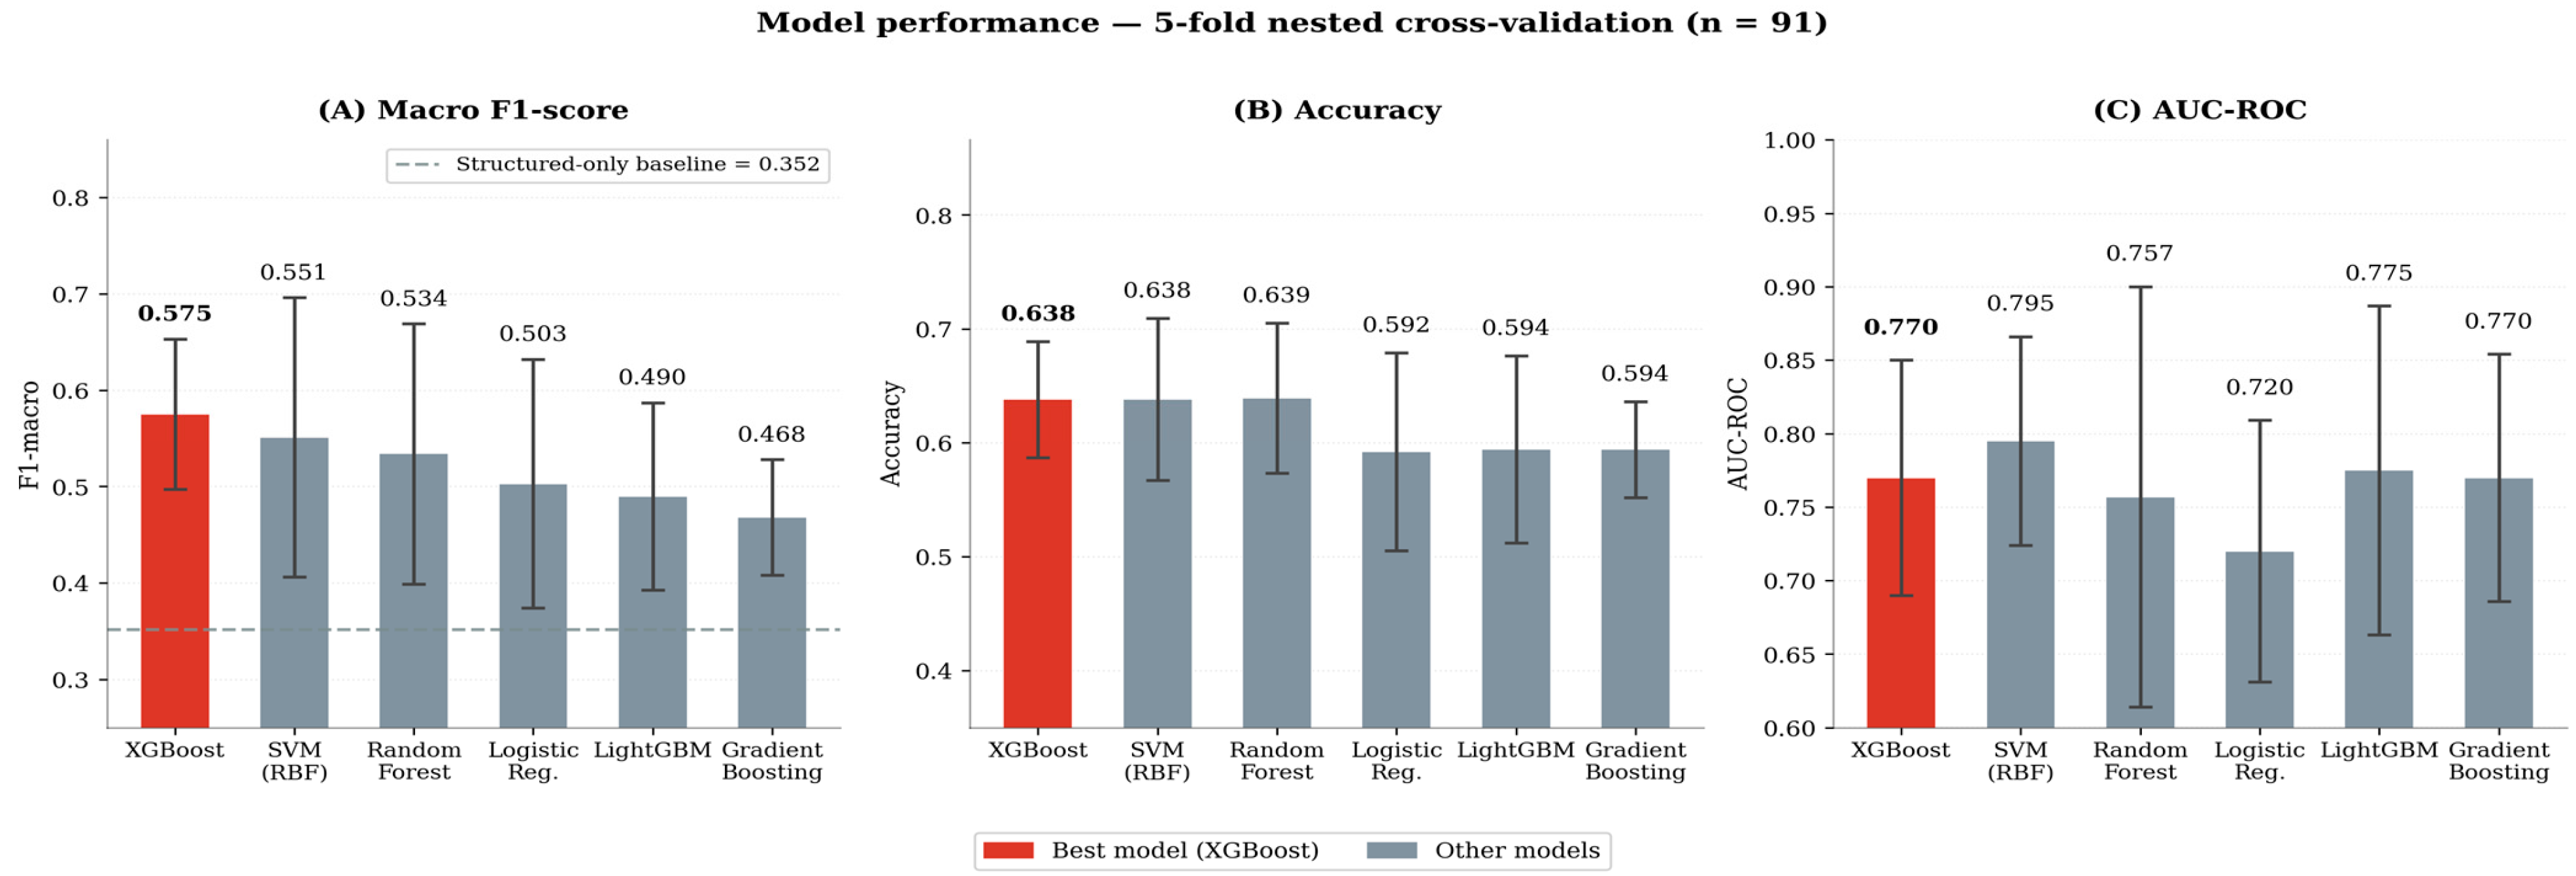
XGBoost achieved the highest macro F1-score (0.575 ± 0.078), the pre-specified primary metric. Random Forest achieved the marginally highest accuracy (0.639 ± 0.066), and SVM (RBF) achieved the highest AUC-ROC (0.795 ± 0.071). XGBoost is considered the best-performing model based on the pre-specified primary metric. All models outperformed the baseline F1-macro of 0.352, confirming the contribution of imaging and clinical variables (Table 2, Figure 3 and Figure 4). Hyperparameter tuning via nested RandomizedSearchCV did not consistently improve upon default configurations, suggesting that limited sample size may have constrained further gains.
Table 2.
Model performance under 5-fold nested cross-validation.
Figure 3.
Model comparison across three evaluation metrics (6 algorithms, 5-fold nested cross-validation). Error bars represent ± 1 SD. Dashed line = baseline. XGBoost (highlighted) achieved the highest F1-macro.
Figure 4.
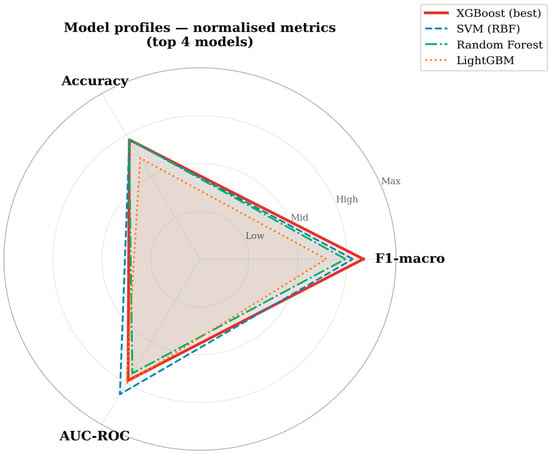
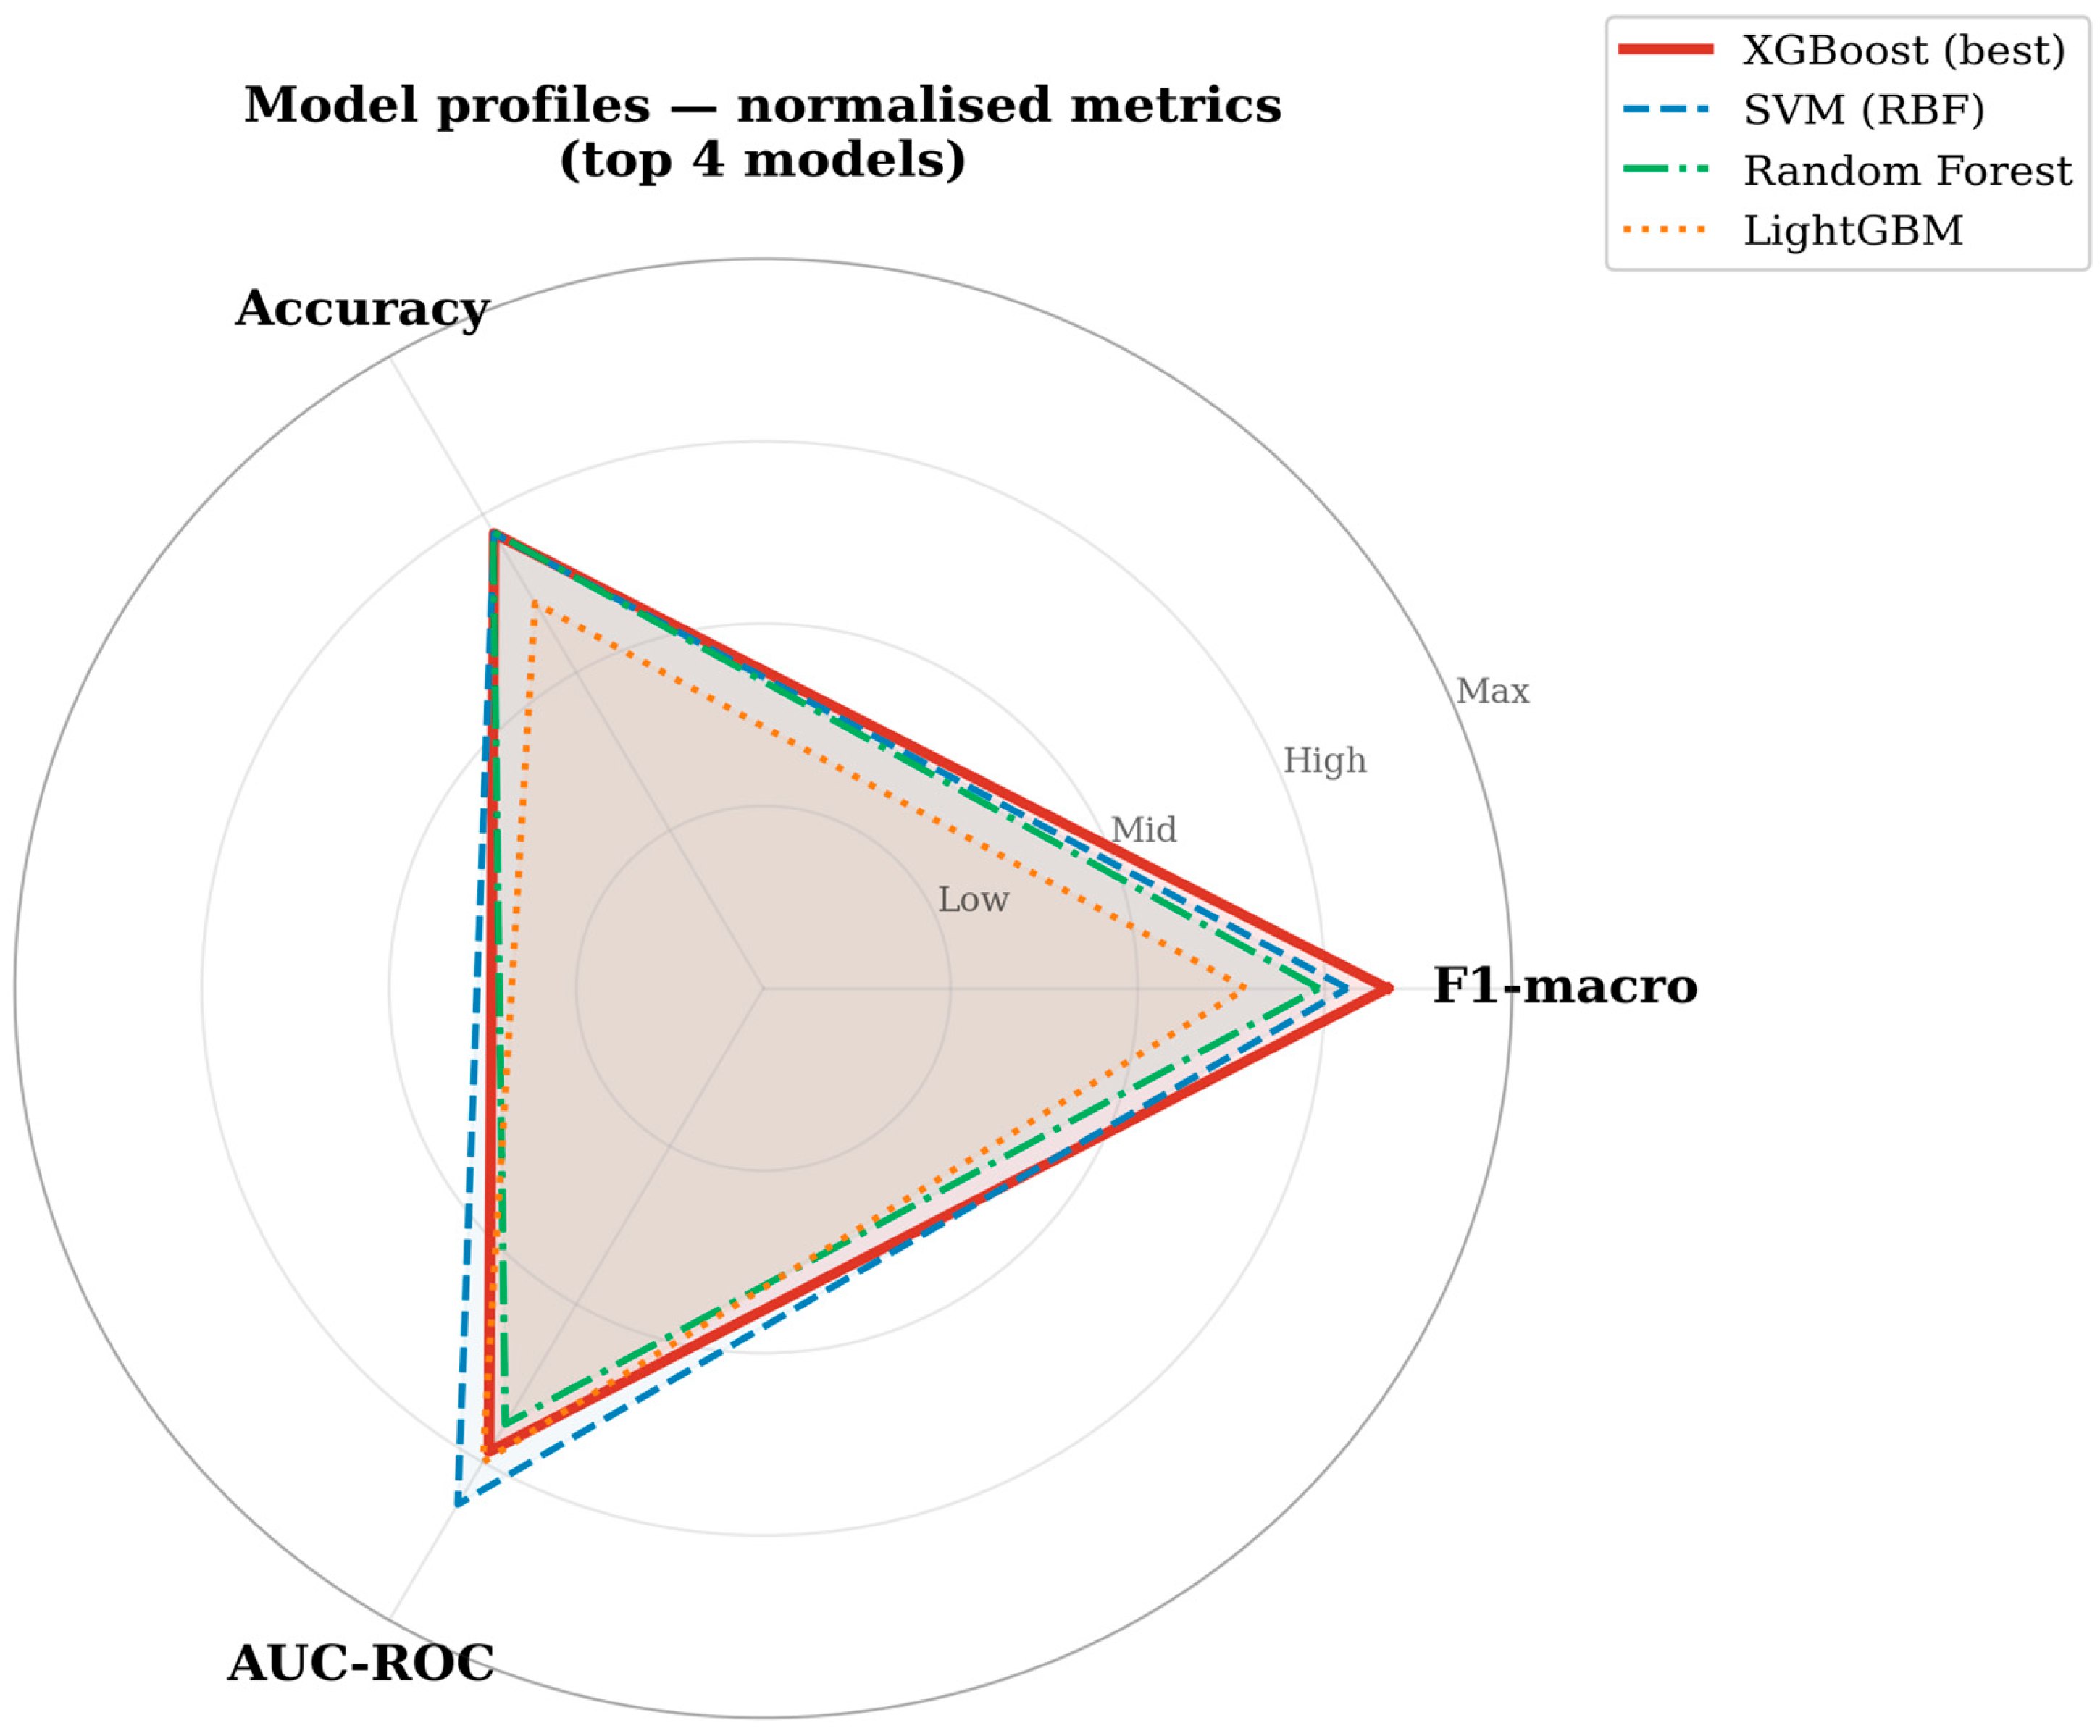
Radar profile comparing all six models across three normalized evaluation metrics. XGBoost leads on F1-macro; SVM (RBF) leads on AUC-ROC.
3.4. Classification Performance by TOAST Subtype
Table 3 presents per-class metrics for XGBoost. Figure 5 presents the corresponding aggregated confusion matrix. SVO achieved the highest F1-score (0.833), driven by high precision (0.909), reflecting the strong imaging signature of lacunar infarction. LAA achieved moderate F1 (0.632) despite only nine cases, suggesting that arterial stenosis documentation provided sufficient discriminative signal. Stroke of Undetermined Etiology showed the highest recall (0.780), consistent with its dominance in the training distribution. CE demonstrated moderate performance (F1 = 0.435) with limited recall (0.385), reflecting diagnostic dependence on cardiac investigations not uniformly available for all patients. Other Determined Etiology showed low recall (0.333), consistent with its heterogeneous etiology spanning vasculitis, coagulopathy, and other rare mechanisms [29].
Table 3.
Per-class classification metrics for XGBoost, aggregated across 5 outer cross-validation folds.
Figure 5.
Aggregated cross-validation confusion matrix for XGBoost (5 outer folds). Left: raw prediction counts. Right: row-normalized recall percentages. Note: SHAP analysis (Figure 6, Figure 7 and Figure 8) was conducted on the Random Forest model; this matrix reflects XGBoost predictions only. CE = Cardioembolism; LAA = Large-Artery Atherosclerosis; SVO = Small-Vessel Occlusion.
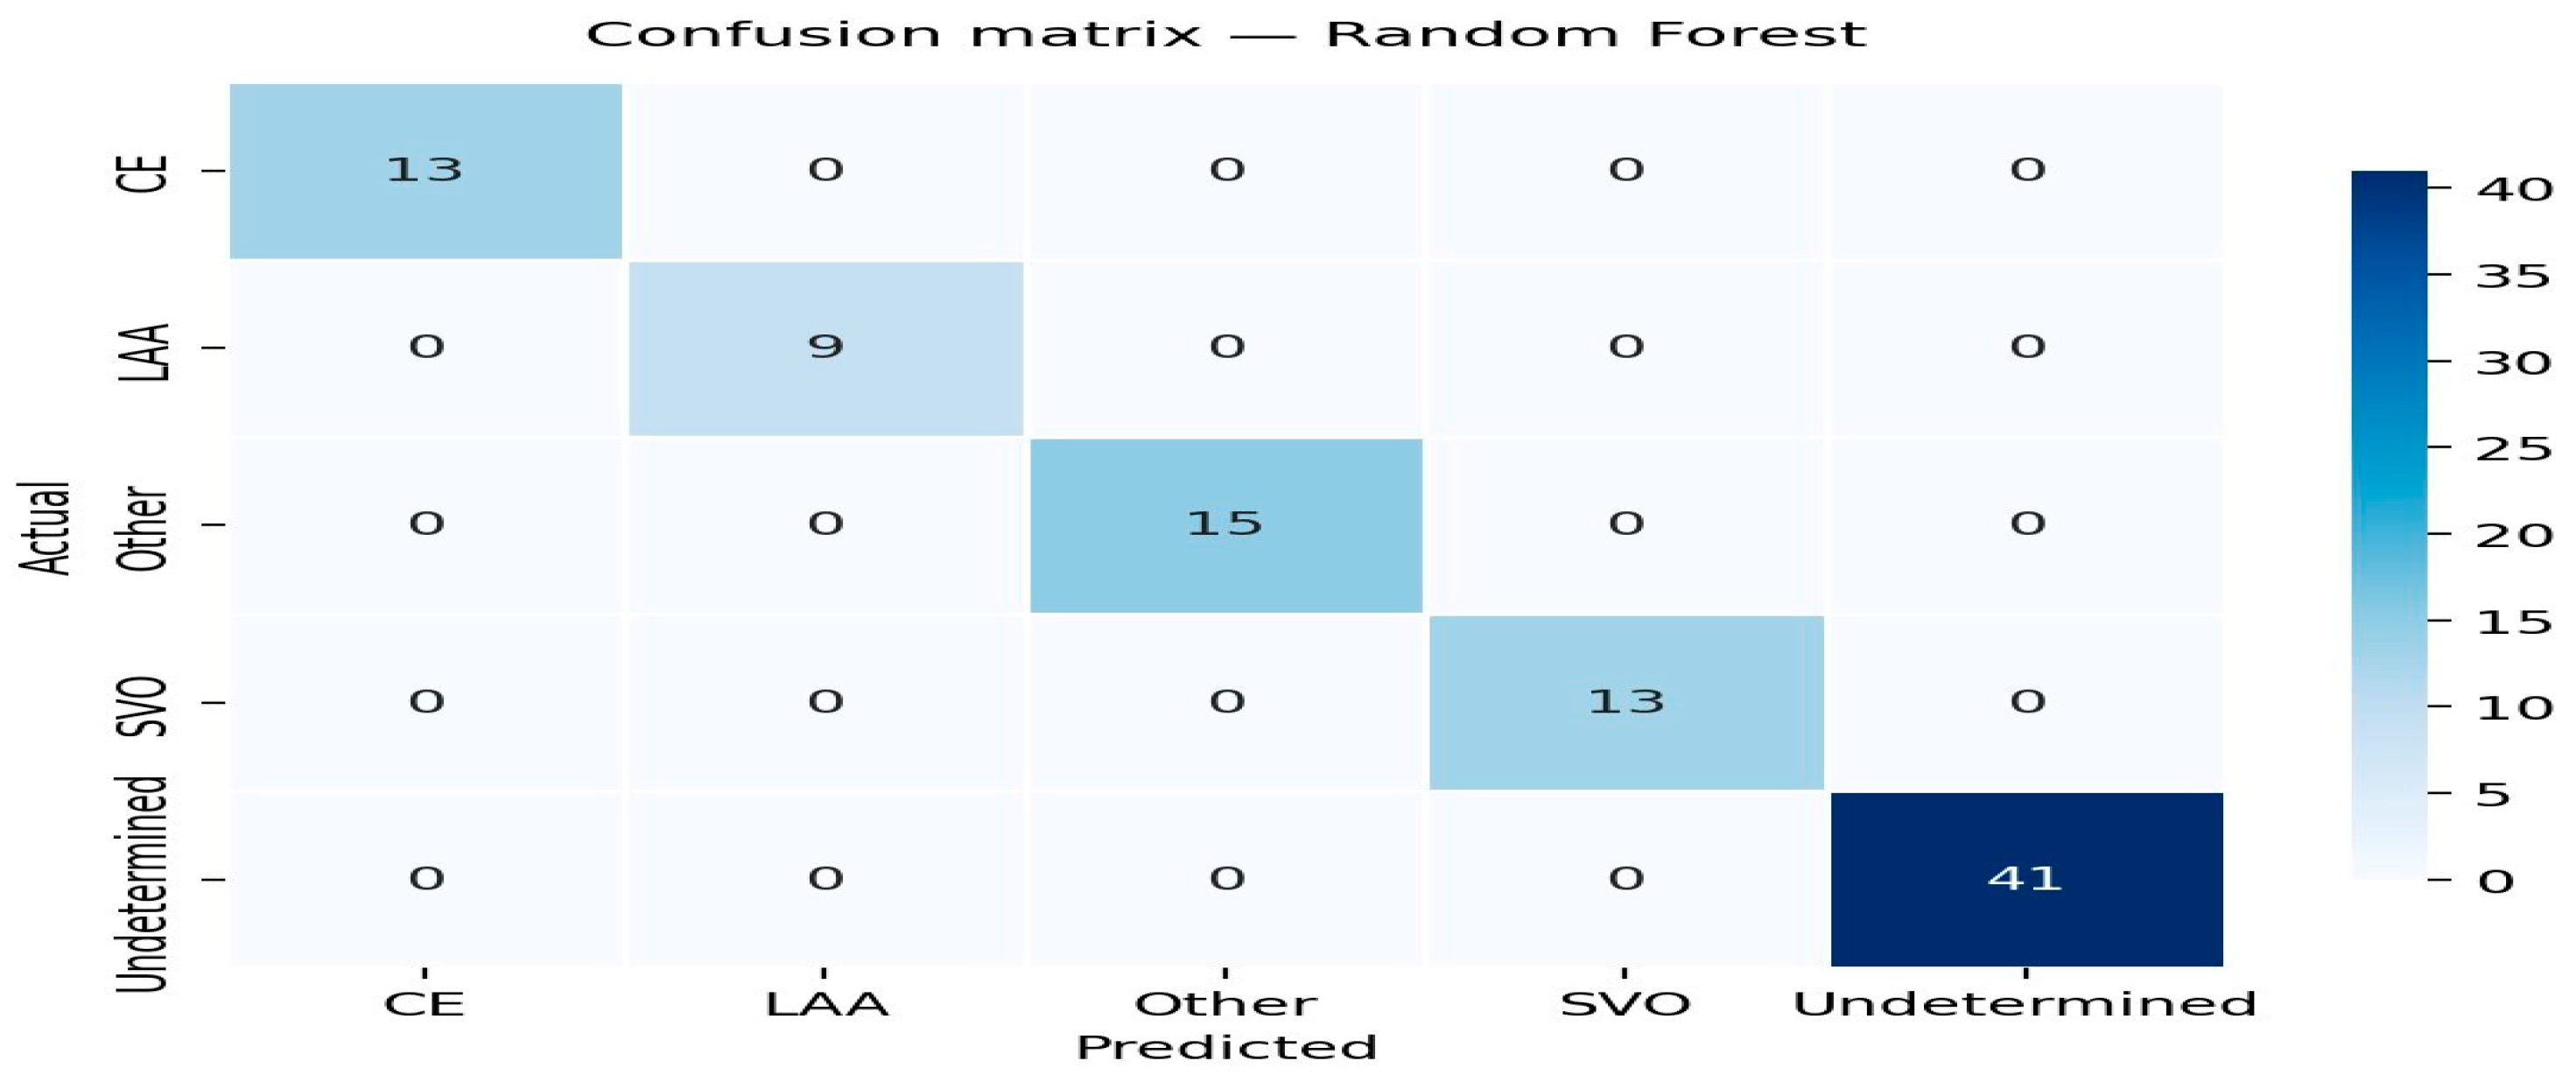
Figure 6.
SHAP feature importance per TOAST subtype (top 10 features, mean |SHAP|). Results from the Random Forest model.
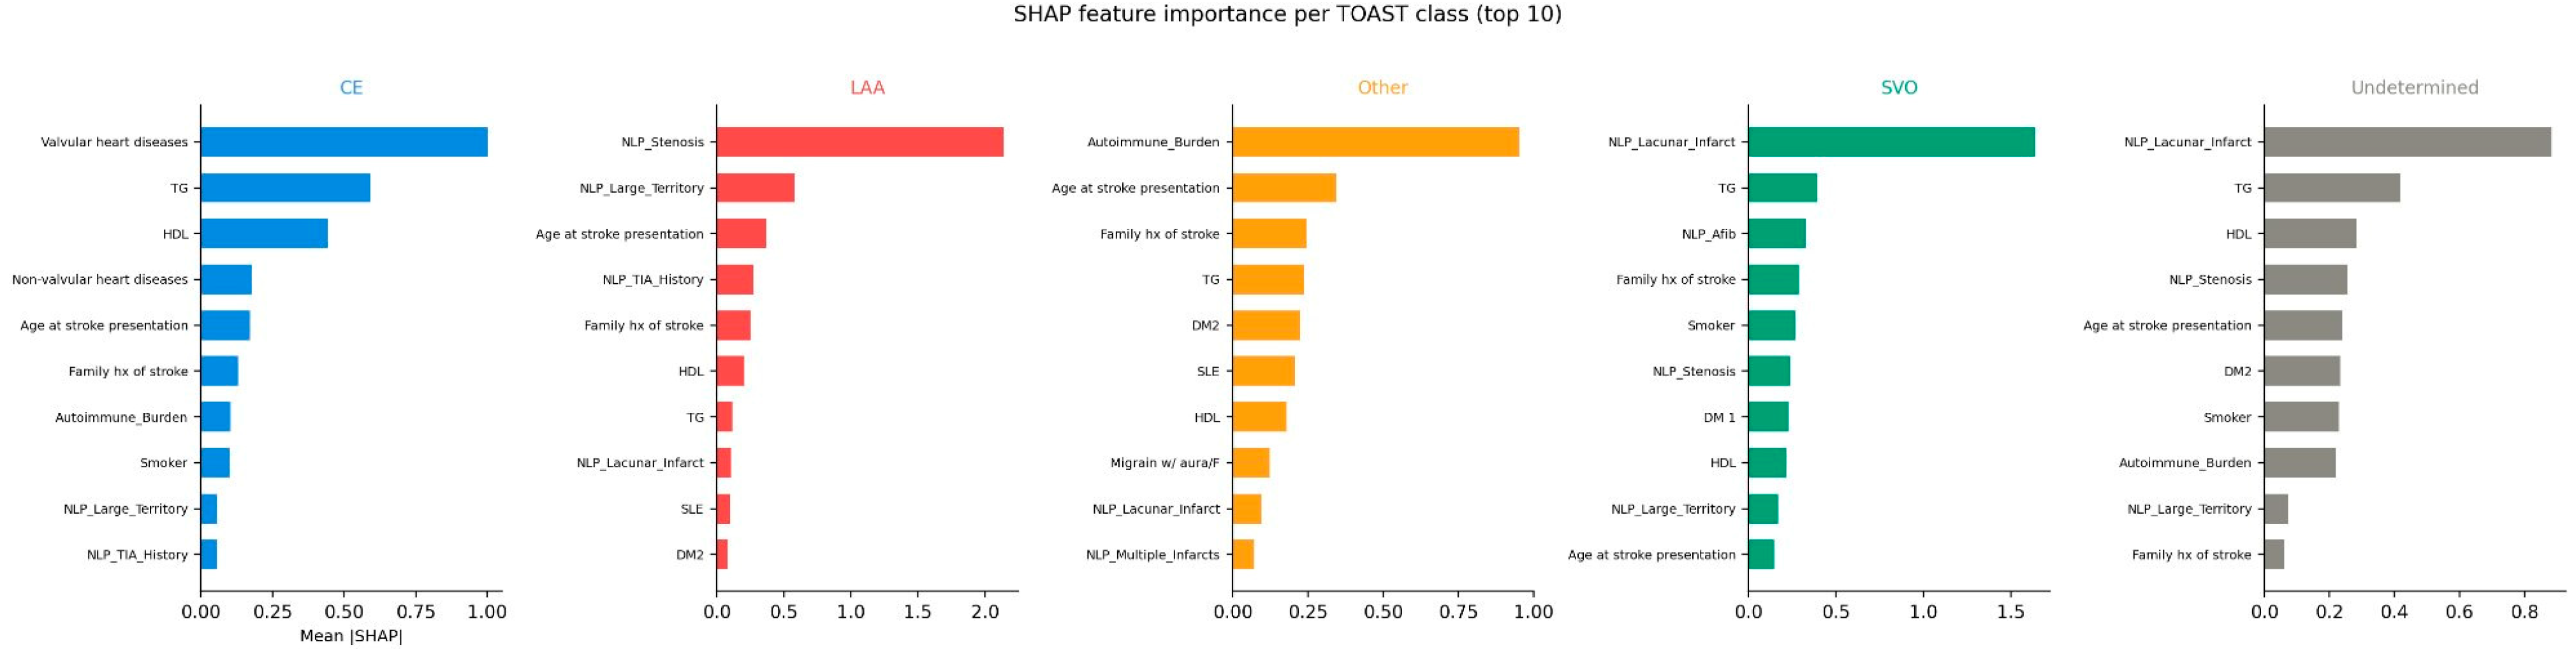
Figure 7.
Global SHAP beeswarm plot (top 10 features, all classes). Each dot represents one patient.
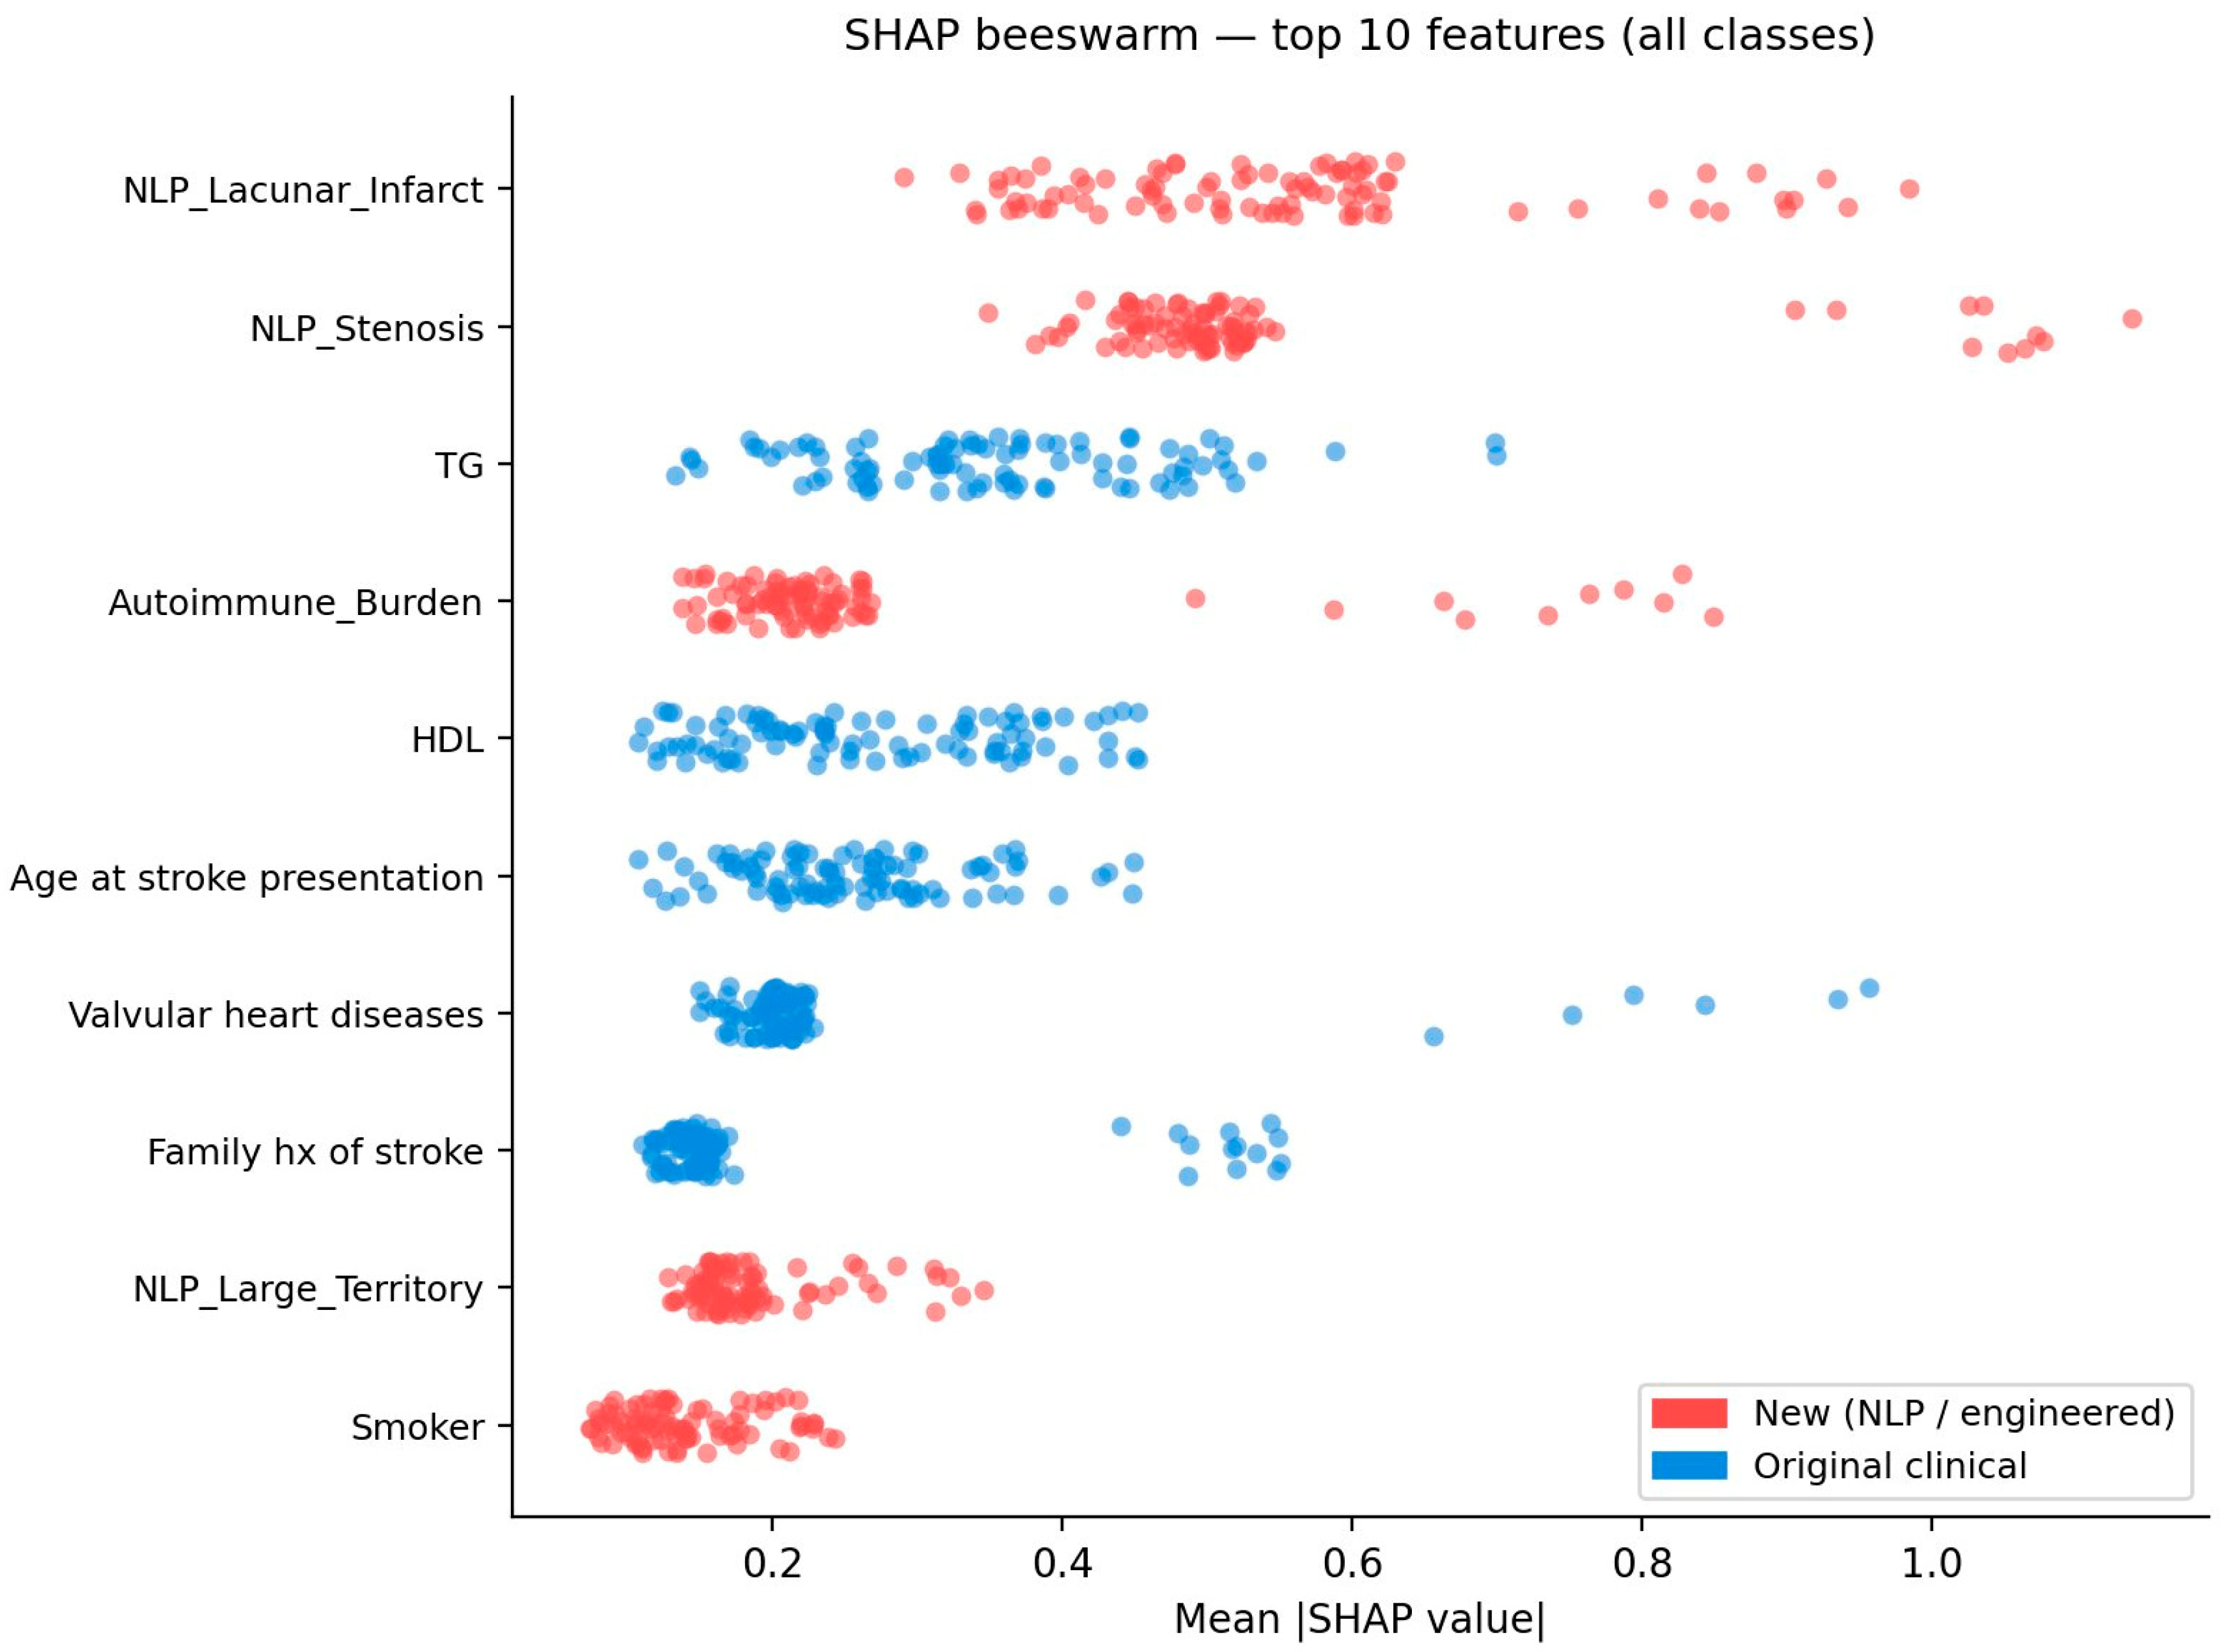
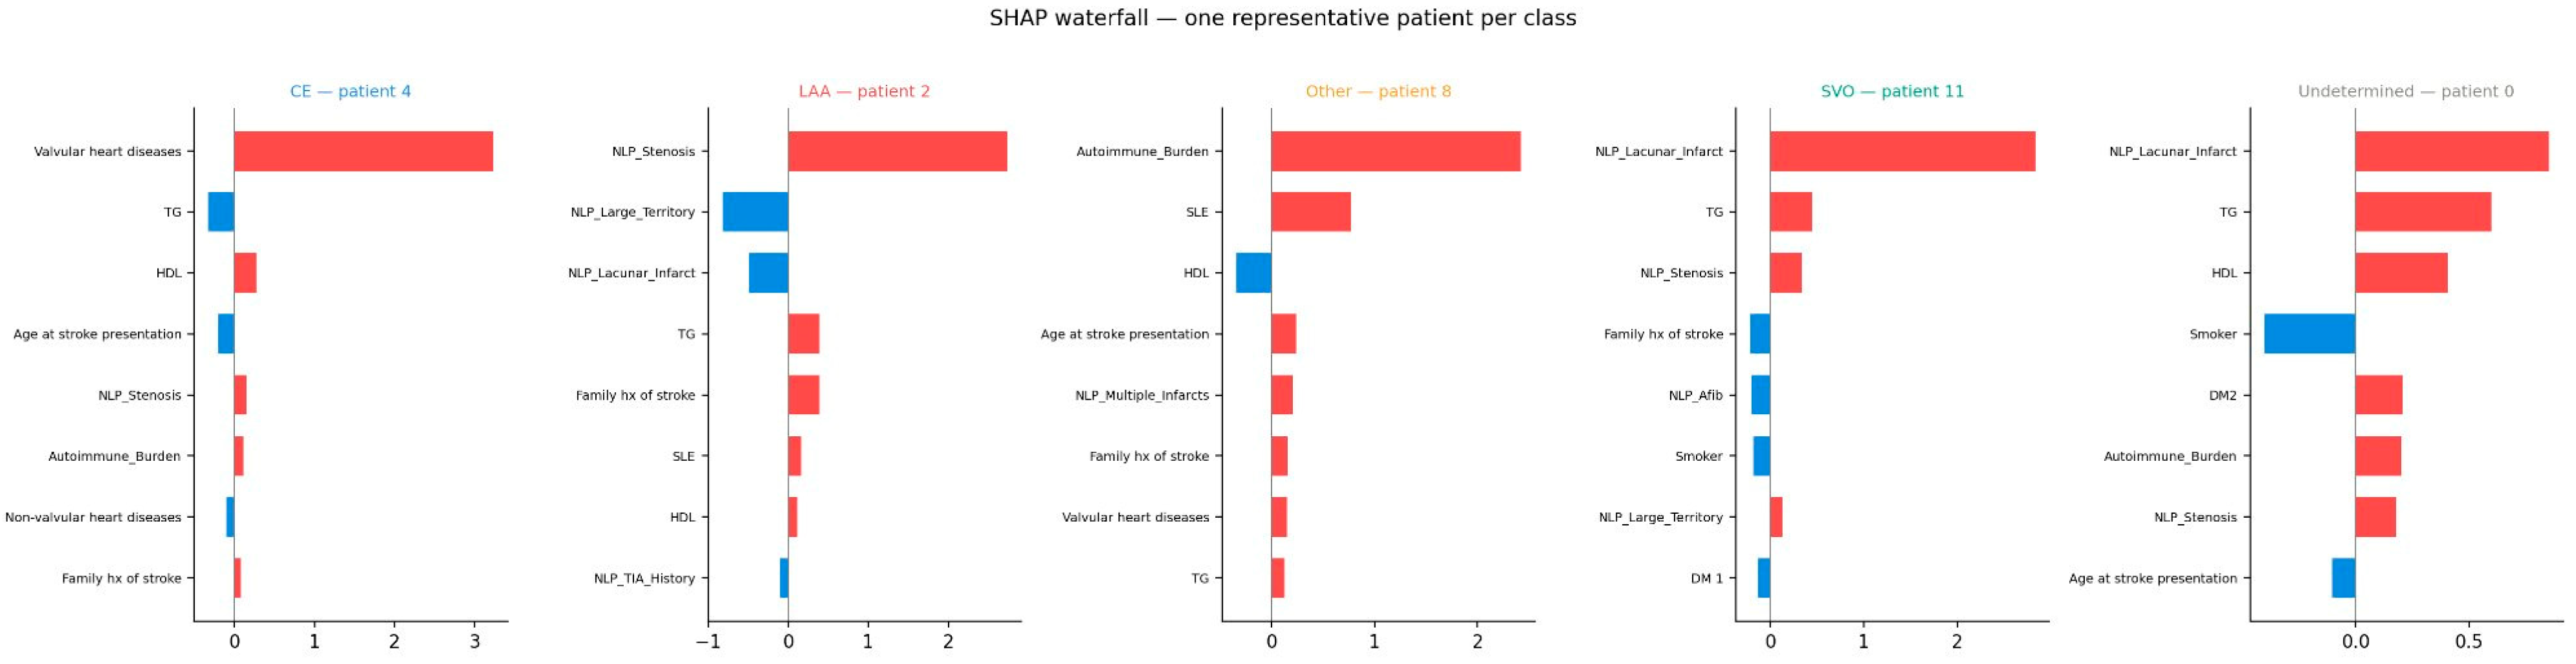
Figure 8.
Patient-level SHAP waterfall plots for one representative correctly classified patient per TOAST class (illustrative examples). Red = features increasing class probability; blue = opposing contributions.
Mechanistically, CE misclassifications predominantly reflect cases in which cardiac investigation variables (atrial fibrillation, valvular heart disease, reduced ejection fraction) were absent or incomplete in the clinical documentation, depriving the model of the features it relies on most heavily for CE prediction (SHAP analysis, Figure 6). This aligns with the known challenge of retrospective CE classification when a full cardiac workup was not completed during the index admission. LAA misclassified as Undetermined Etiology occurred almost exclusively in patients without documented arterial stenosis—the dominant LAA predictor (SHAP value = 2.18)—suggesting that when the definitive imaging criterion is absent from the record, the model defaults to the majority class. SVO misclassifications were rare (recall = 0.769), and the few errors involved cases without documented lacunar infarction on imaging, the primary SVO discriminator.
3.5. SHAP Explainability Analysis
SHAP analysis used the Random Forest model as an interpretable tree-based model with robust cross-validation performance and full TreeExplainer compatibility [28]. SHAP values from Random Forest reflect that model’s decision logic, which may differ from XGBoost’s, while remaining consistent with the overall feature importance patterns identified across models. The following results are illustrative examples of model reasoning and should be interpreted as hypothesis-generating rather than definitive clinical inference.
Per-class SHAP analysis (Figure 6) revealed patterns consistent with established pathophysiology. Arterial stenosis was the dominant predictor for LAA, reflecting the TOAST criterion of large-artery stenosis [11]. Lacunar infarct was the leading feature for SVO, consistent with the imaging definition of small-vessel occlusion [30,31]. Valvular heart disease was the strongest predictor for CE, reflecting the role of structural cardiac pathology [32]. Autoimmune Burden was the primary driver for Other Determined Etiology, reflecting the prevalence of immune-mediated mechanisms [29].
4. Discussion
This study evaluated six machine learning models for automated TOAST subtype classification in 91 young adult ischemic stroke patients from Jordan University Hospital. Integrating imaging and clinical variables with structured data improved macro F1-score from 0.352 to 0.575. XGBoost achieved the highest macro F1-score [25], while SVM (RBF) led in AUC-ROC. An important interpretive caveat is that several imaging variables are partial proxies for TOAST criteria; the performance gain therefore partly reflects re-encoding existing diagnostic rules in a standardized, automatable form rather than entirely novel etiologic inference. The primary value of this pipeline lies in the process consistency and scalability of TOAST labeling.
Arterial stenosis and lacunar infarct were the most stably selected predictors, consistent with their direct roles as TOAST classification criteria for LAA and SVO, respectively [11,31]. Triglycerides were also stably selected, consistent with evidence linking hypertriglyceridemia to small-vessel endothelial dysfunction [33]. SLE concentration in the Other Determined Etiology subtype reflects immune-mediated vasculopathy in young adults [29].
SHAP analysis [28] showed pathophysiologically coherent, class-specific feature attributions aligned with established TOAST criteria, supporting the model’s face validity. At the individual patient level, predictions were driven by clinically coherent feature combinations, supporting their potential use as a decision-support tool for TOAST labeling in settings where complete cardiac and vascular workup may be incomplete or delayed [34].
SVO achieved the highest per-class F1-score (0.833), reflecting the strong and specific imaging signature of lacunar infarction. CE demonstrated the lowest recall (0.385), reflecting diagnostic dependence on cardiac investigations including echocardiography and Holter monitoring, which are not uniformly available for all patients [32]. This is a recognized challenge in retrospective TOAST classification.
Three methodological contributions merit emphasis. First, the strict no-leakage nested cross-validation pipeline provides honest, reproducible performance estimates that prevent the data leakage identified as a pervasive problem in published clinical ML studies [20,26]. Second, the custom oversampling strategy addresses class imbalance in a manner appropriate for the highly imbalanced five-class setting with very small minority classes (LAA: n = 9), complementing class-weight balancing [24]. Third, SHAP at both population and patient levels provides clinical transparency [21,27].
This study has several important limitations. The sample size of 91 patients is small for a five-class classification task, particularly for LAA (n = 9) and CE (n = 13); findings should be considered exploratory. This single-center retrospective study limits generalizability. Formal inter-rater agreement metrics were not computed. SHAP was conducted on Random Forest rather than XGBoost. No external validation cohort was available. Model calibration was not formally assessed; calibration curves and decision-curve analysis are important for clinical decision-support applications and should be addressed in future validation studies. Direct comparisons with imaging-based deep learning studies (e.g., lesion segmentation on DWI/CT perfusion) are not applicable, as those studies address different tasks [35].
A natural forward path is to automate extraction of imaging-derived features via natural language processing of radiology reports or image-based radiomics and deep learning, which would reduce manual coding bias and improve scalability in line with multimodal fusion approaches in stroke imaging research [15,35]. Prospective validation as a clinical decision-support tool is the critical next step toward translation.
4.1. Sample Size Adequacy
The adequacy of the study sample warrants explicit discussion. Single-center retrospective ML studies on TOAST subtype classification have employed cohorts of 60–200 patients [36,37], placing our dataset of 91 patients within the established range for pilot studies of this design. The nested cross-validation framework was selected because it provides bias-corrected performance estimates from small samples by preventing the leakage that inflates metrics in standard pipelines [26]. Fold-wise F1 distributions (XGBoost: range 0.497–0.672 across five outer folds) demonstrate relative consistency despite the small sample size, supporting the stability of observed performance patterns. Nonetheless, the high standard deviation in some models (SVM F1-std = 0.145) is a direct quantitative indicator of sample size limitation. The sample is sufficient to demonstrate proof of concept and to identify which variable classes provide discriminative value, but it is insufficient to support definitive performance benchmarks or clinical deployment. A prospective multicenter registry targeting n ≥ 500 patients would be required to provide statistically stable five-class TOAST classification performance estimates.
4.2. Clinical Implications of Misclassifications
Not all misclassification errors carry equal clinical consequence. Misclassification of CE as Undetermined Etiology, the most common error for this subtype in our model, carries the highest clinical risk: CE is the only TOAST subtype for which anticoagulation is the standard of care [11]. A missed CE diagnosis may lead to antiplatelet monotherapy being prescribed instead, increasing the risk of recurrent cardioembolic stroke, which is associated with worse neurological outcomes and higher mortality than index events [32]. Conversely, misclassifying a non-CE subtype as CE could lead to inappropriate anticoagulation with its associated bleeding risk. The misclassification of LAA as Undetermined Etiology may result in suboptimal secondary prevention, as LAA-specific interventions (high-intensity statins, consideration of carotid endarterectomy) might be omitted. Misclassifying SVO as another subtype carries lower immediate treatment risk because risk-factor management overlaps across subtypes. These considerations reinforce that the model requires clinician oversight before any treatment decision, and that future iterations should incorporate asymmetric cost-sensitive learning to penalize clinically dangerous misclassifications more heavily.
It is instructive to compare the model performance against published estimates of human TOAST classification reliability. Inter-rater agreement among experienced neurologists for TOAST classification has been reported at kappa = 0.52–0.74, corresponding to overall agreement of approximately 68–82% [36]. Our best model (XGBoost) achieved 63.8% accuracy under strict no-leakage cross-validation, comparable in order of magnitude to human inter-rater agreement, though at the lower end of this range. The model performs competitively for SVO (recall = 0.769) and LAA (recall = 0.667), subtypes with relatively objective imaging signatures. CE represents the clearest area of ML underperformance relative to human clinicians (recall = 0.385): clinicians can integrate real-time cardiac investigations, clinical gestalt, and temporal disease course that our structured dataset does not capture. This gap highlights that ML models at this stage are best positioned as decision-support tools that augment rather than replace clinical TOAST classification.
5. Conclusions
Machine learning models integrating imaging and clinical variables alongside standard structured data can achieve meaningful TOAST subtype classification in young adult ischemic stroke patients, outperforming structured-variables-only models (macro F1: 0.575 vs. 0.352). The primary value of this pipeline lies in standardizing and automating TOAST labeling rather than discovering novel etiologies, given that several imaging variables are partial proxies for TOAST criteria. XGBoost achieved the highest macro F1-score on the pre-specified primary metric, and SHAP analysis of the Random Forest model revealed pathophysiologically coherent feature attributions. SVO was the most accurately classified subtype (F1 = 0.833). The strict no-leakage nested cross-validation pipeline provides honest, reproducible estimates. External validation on larger multicenter cohorts is required before clinical deployment.
Supplementary Materials
The following supporting information can be downloaded at https://www.mdpi.com/article/10.3390/sci8110346/s1: Table S1: Hyperparameter search spaces for all six machine learning models.
Author Contributions
Conceptualization, T.K., T.N.A. and A.A.; Methodology, T.N.A. and M.I.S.; Software, T.N.A.; Validation, T.K., A.A., A.Q., H.A. and S.K.E.; Formal Analysis, T.N.A. and M.I.S.; Investigation, T.K., A.A., O.M.A.A., A.S.S., D.Q.A., N.M.A., A.K., H.A. and S.M.H.; Resources, T.K.; Data Curation, T.K., A.A., O.M.A.A., A.S.S., D.Q.A., N.M.A., A.K. and S.M.H.; Writing—Original Draft Preparation, T.N.A. and M.I.S.; Writing—Review and Editing, T.K., T.N.A., A.A., M.I.S., O.M.A.A., A.S.S., D.Q.A., N.M.A., A.K., S.M.H., H.A., A.Q. and S.K.E.; Visualization, T.N.A.; Supervision, T.K.; Project Administration, T.K. All authors have read and agreed to the published version of the manuscript.
Funding
This research received no external funding.
Institutional Review Board Statement
The study was conducted according to the guidelines of the Declaration of Helsinki, and approved by the Ethics Committee of the Scientific Research Committee, School of Medicine, The University of Jordan (Protocol code: 4261/2024/67; date of approval: 18 August 2024).
Informed Consent Statement
Patient consent was waived due to the retrospective nature of the study. The study used anonymized data and presented no identifiable patient information.
Data Availability Statement
The data presented in this study are available upon request from the corresponding author. The data are not publicly available because of privacy and ethical restrictions on patient health information, in accordance with institutional guidelines.
Acknowledgments
The authors thank the clinical staff of the Department of Neurology and Neurosurgery at Jordan University Hospital for their support.
Conflicts of Interest
The authors declare no conflicts of interest.
References
- Kyu, H.H.; Abate, D.; Abate, K.H.; Abay, S.M.; Abbafati, C.; Abbasi, N.; Abbastabar, H.; Abd-Allah, F.; Abdela, J.; Abdelalim, A.; et al. Global, regional, and national disability-adjusted life-years (DALYs) for 359 diseases and injuries and healthy life expectancy (HALE) for 195 countries and territories, 1990–2017. Lancet 2018, 392, 1859–1922, Erratum in Lancet 2019, 393, e44. [Google Scholar] [CrossRef] [Scilit]
- Xu, J.; Murphy, S.L.; Kockanek, K.D.; Arias, E. Mortality in the United States, 2018. NCHS Data Brief 2020, 355, 1–8. [Google Scholar] [PubMed]
- Virani, S.S.; Alonso, A.; Benjamin, E.J.; Bittencourt, M.S.; Callaway, C.W.; Carson, A.P.; Chamberlain, A.M.; Chang, A.R.; Cheng, S.; Delling, F.N.; et al. Heart disease and stroke statistics—2020 update: A report from the American Heart Association. Circulation 2020, 141, e139–e596. [Google Scholar] [CrossRef] [Scilit]
- Feigin, V.L.; Krishnamurthi, R.V.; Parmar, P.; Norrving, B.; Mensah, G.A.; Bennett, D.A.; Barker-Collo, S.; Moran, A.E.; Sacco, R.L.; Truelsen, T.; et al. Update on the global burden of ischemic and hemorrhagic stroke in 1990–2013: The GBD 2013 Study. Neuroepidemiology 2015, 45, 161–176. [Google Scholar] [CrossRef] [Scilit]
- Yahya, T.; Jilani, M.H.; Khan, S.U.; Mszar, R.; Hassan, S.Z.; Blaha, M.J.; Virani, S.S.; Blankstein, R.; Blumenthal, R.S.; Cainzos-Achirica, M. Stroke in young adults. Am. J. Prev. Cardiol. 2020, 3, 100085. [Google Scholar] [CrossRef] [Scilit]
- Krishnamurthi, R.V.; Feigin, V.L.; Forouzanfar, M.H.; Mensah, G.A.; Connor, M.; Bennett, D.A.; Moran, A.E.; Sacco, R.L.; Anderson, L.M.; Truelsen, T.; et al. Global and regional burden of first-ever ischaemic and haemorrhagic stroke during 1990–2010: Findings from the Global Burden of Disease Study 2010. Lancet Glob. Health 2013, 1, e259–e281. [Google Scholar] [CrossRef] [Scilit]
- Rajsic, S.; Gothe, H.; Borba, H.H.; Sroczynski, G.; Vujicic, J.; Toell, T.; Siebert, U. Economic burden of stroke. Eur. J. Health Econ. 2019, 20, 107–134. [Google Scholar] [CrossRef] [Scilit]
- Rutten-Jacobs, L.C.A.; Arntz, R.M.; Maaijwee, N.A.M.; Schoonderwaldt, H.C.; Dorresteijn, L.D.; van Dijk, E.J.; de Leeuw, F.-E. Long-term mortality after stroke among adults aged 18 to 50 years. JAMA 2013, 309, 1136–1144. [Google Scholar] [CrossRef] [Scilit]
- Schaapsmeerders, P.; Maaijwee, N.A.M.; van Dijk, E.J.; Rutten-Jacobs, L.C.; Arntz, R.M.; Schoonderwaldt, H.C.; Dorresteijn, L.D.; Kessels, R.P.; de Leeuw, F.-E. Long-term cognitive impairment after first-ever ischemic stroke in young adults. Stroke 2013, 44, 1621–1628, Correction in Stroke 2013, 44, e81. https://doi.org/10.1161/STR.0b013e31829f610. [Google Scholar] [CrossRef] [Scilit]
- Bahou, Y.; Hamid, H.; Hadidi, A. Ischaemic stroke in Jordan: A 2-year hospital-based study. East. Mediterr. Health J. 2004, 10, 138–146. [Google Scholar] [CrossRef] [Scilit]
- Adams, H.P.; Bendixen, B.H.; Kappelle, L.J.; Biller, J.; Love, B.B.; Gordon, D.L.; Marsh, E.E. Classification of subtype of acute ischemic stroke. Stroke 1993, 24, 35–41. [Google Scholar] [CrossRef] [Scilit]
- Kolominsky-Rabas, P.L.; Weber, M.; Gefeller, O.; Neundoerfer, B.; Heuschmann, P.U. Epidemiology of ischemic stroke subtypes according to TOAST criteria: Incidence, recurrence, and long-term survival in ischemic stroke subtypes: A population-based study. Stroke 2001, 32, 2735–2740. [Google Scholar] [CrossRef] [Scilit]
- Banks, J.L.; Marotta, C.A. Outcomes validity and reliability of the modified Rankin scale: Implications for stroke clinical trials: A literature review and synthesis. Stroke 2007, 38, 1091–1096. [Google Scholar] [CrossRef] [Scilit]
- Tarnutzer, A.A.; Lee, S.H.; Robinson, K.A.; Wang, Z.; Edlow, J.A.; Newman-Toker, D.E. ED misdiagnosis of cerebrovascular events. Neurology 2017, 88, 1468–1477. [Google Scholar] [CrossRef] [Scilit]
- Issaiy, M.; Zarei, D.; Kolahi, S.; Liebeskind, D.S. Machine learning and deep learning algorithms in stroke medicine. J. Neurol. 2024, 272, 37. [Google Scholar] [CrossRef] [Scilit]
- Chakraborty, P.; Bandyopadhyay, A.; Sahu, P.P.; Gupta, A.; Bhakat, P.; Chakraborty, M. Predicting stroke occurrences: A stacked machine learning approach. BMC Bioinform. 2024, 25, 329. [Google Scholar] [CrossRef] [Scilit]
- Zhi, S.; Hu, X.; Ding, Y.; Sun, S.; Shao, G. An exploration on the machine-learning-based stroke prediction model. Front. Neurol. 2024, 15, 1372431. [Google Scholar] [CrossRef] [Scilit]
- Ahmadi, S.A.; Vivar, G.; Navab, N.; Agrawal, Y.; Eulenburg, P.Z.; Dietrich, O.; Brandt, T.; Dieterich, M.; Strupp, M.; Karch, C.M. Modern machine-learning can support diagnostic differentiation of central and peripheral acute vestibular disorders. J. Neurol. 2020, 267, 143–152. [Google Scholar] [CrossRef] [Scilit]
- Sheth, S.A.; Giancardo, L.; Colasurdo, M.; Bhatt, N.; Zomorodi, A.; Yoo, A.J. Machine learning and acute stroke imaging. J. Neurointerv. Surg. 2023, 15, 195–199. [Google Scholar] [CrossRef] [Scilit]
- Kapoor, S.; Cantrell, E.; Peng, K.; Kroshniy, T.; Larson, J.; Lavallee, V.A.; Murray, S.G.; Kim, J.K.; Lolas, G.; Ghassemi, M.; et al. Leakage and the reproducibility crisis in machine-learning-based science. Patterns 2023, 4, 100804. [Google Scholar] [CrossRef] [Scilit]
- Mainali, S.; Darsie, M.E.; Smetana, K.S. Machine learning in action: Stroke diagnosis and outcome prediction. Front. Neurol. 2021, 12, 734345. [Google Scholar] [CrossRef] [Scilit]
- Alshraideh, H.A.; Al-Zu’bi, M.Y.; Abu-Shareha, A.A. Predicting heart attacks using machine learning: A retrospective study at Jordan University Hospital. Appl. Comput. Intell. Soft Comput. 2024, 2024, 5080332. [Google Scholar] [CrossRef] [Scilit]
- Chawla, N.V.; Bowyer, K.W.; Hall, L.O.; Kegelmeyer, W.P. SMOTE: Synthetic minority over-sampling technique. J. Artif. Intell. Res. 2002, 16, 321–357. [Google Scholar] [CrossRef] [Scilit]
- He, H.; Garcia, E.A. Learning from imbalanced data. IEEE Trans. Knowl. Data Eng. 2009, 21, 1263–1284. [Google Scholar] [CrossRef] [Scilit]
- Chen, T.; Guestrin, C. XGBoost: A scalable tree boosting system. In Proceedings of the 22nd ACM SIGKDD International Conference on Knowledge Discovery and Data Mining, San Francisco, CA, USA, 13–17 August 2016; pp. 785–794. [Google Scholar] [CrossRef] [Scilit]
- Cawley, G.C.; Talbot, N.L.C. On over-fitting in model selection and subsequent selection bias in performance evaluation. J. Mach. Learn. Res. 2010, 11, 2079–2107. [Google Scholar]
- Lundberg, S.; Lee, S. A unified approach to interpreting model predictions. arXiv 2017, arXiv:1705.07874. [Google Scholar]
- Lundberg, S.M.; Erion, G.; Chen, H.; DeGrave, A.; Prutkin, J.M.; Nair, B.; Katz, R.; Himmelfarb, J.; Bansal, N.; Lee, S.I. From local explanations to global understanding with explainable AI for trees. Nat. Mach. Intell. 2020, 2, 56–67. [Google Scholar] [CrossRef] [Scilit]
- Pezzini, A.; Del Zotto, E.; Magoni, M.; Costa, A.; Archetti, S.; Grassi, M.; Akkawi, N.M.; Albertini, A.; Assanelli, D.; Vignolo, L.A.; et al. Inherited thrombophilic disorders in young adults with ischemic stroke and patent foramen ovale. Stroke 2003, 34, 28–33. [Google Scholar] [CrossRef] [Scilit]
- Pantoni, L. Cerebral small vessel disease: From pathogenesis and clinical characteristics to therapeutic challenges. Lancet Neurol. 2010, 9, 689–701. [Google Scholar] [CrossRef] [Scilit]
- Wardlaw, J.M.; Smith, E.E.; Biessels, G.J.; Cordonnier, C.; Fazekas, F.; Frayne, R.; Lindley, R.I.; O’Brien, J.T.; Barkhof, F.; Benavente, O.R.; et al. Neuroimaging standards for research into small vessel disease. Lancet Neurol. 2013, 12, 822–838. [Google Scholar] [CrossRef] [Scilit]
- Ferro, J.M.; Canhao, P.; Stam, J.; Bousser, M.G.; Barinagarrementeria, F. Prognosis of cerebral vein and dural sinus thrombosis. Stroke 2004, 35, 664–670. [Google Scholar] [CrossRef] [Scilit]
- Tirschwell, D.L.; Smith, N.L.; Heckbert, S.R.; Lemaitre, R.N.; Longstreth, W.T.; Psaty, B.M. Association of cholesterol with stroke risk. Neurology 2004, 63, 1868–1875. [Google Scholar] [CrossRef] [Scilit]
- Singhal, A.B.; Biller, J.; Elkind, M.S.; Ovbiagele, B.; Pace, J.W.; Dafer, R.M.; Torner, J.C. Recognition and management of stroke in young adults. Neurology 2013, 81, 1089–1097. [Google Scholar] [CrossRef] [Scilit]
- Soun, J.E.; Chow, D.S.; Nagamine, M.; Takhtawala, R.S.; Filippi, C.G.; Yu, W. Artificial intelligence and acute stroke imaging. AJNR Am. J. Neuroradiol. 2021, 42, 2–11. [Google Scholar] [CrossRef] [Scilit]
- Goldstein, L.B.; Jones, M.R.; Matchar, D.B.; Edwards, L.J.; Hoff, J.; Chilukuri, V.; Armstrong, S.B.; Horner, R.D. Improving the reliability of stroke subgroup classification. Stroke 2001, 32, 1091–1097. [Google Scholar] [CrossRef] [Scilit]
- Putaala, J.; Metso, A.J.; Metso, T.M.; Konkola, N.; Kraemer, Y.; Haapaniemi, E.; Kaste, M.; Tatlisumak, T. Analysis of 1008 consecutive patients aged 15 to 49. Stroke 2009, 40, 1195–1203. [Google Scholar] [CrossRef] [Scilit]

Disclaimer/Publisher’s Note: The statements, opinions and data contained in all publications are solely those of the individual author(s) and contributor(s) and not of MDPI and/or the editor(s). MDPI and/or the editor(s) disclaim responsibility for any injury to people or property resulting from any ideas, methods, instructions or products referred to in the content. |
© 2026 by the authors. Licensee MDPI, Basel, Switzerland. This article is an open access article distributed under the terms and conditions of the Creative Commons Attribution (CC BY) license.