


Abstract
Triple-negative breast cancer (TNBC) presents significant therapeutic challenges due to its aggressive nature, limited molecular targets, and frequent development of resistance to treatment. This study aimed to develop chitosan nanoparticles co-loaded with rosuvastatin and quercetin (Ro–Qu@CSNPs) and evaluate their in vitro anticancer activity, selectivity, and potential modulation of the HMGCR–RhoA signaling pathway. Ro–Qu@CSNPs were prepared and characterized. Their cytotoxicity was assessed against MDA-MB-231 TNBC cells and non-tumorigenic MCF-10A mammary epithelial cells. Additionally, we examined cell cycle distribution, types of cell death, HMGCR mRNA expression, and RhoA activation. Ro–Qu@CSNPs showed the lowest IC50 in MDA-MB-231 cells (7.791 ± 0.26 µg/mL) and the highest selectivity index (4.74) among the treatments tested. Treatment with Ro–Qu@CSNPs resulted in G0/G1 cell cycle arrest, with the percentage of apoptotic cells increasing from 0.77% in untreated cells to 22.46%. Furthermore, HMGCR mRNA expression and RhoA-GTP activity decreased to 0.155-fold and 0.353-fold of their respective control values. In conclusion, Ro–Qu@CSNPs exhibited preferential cytotoxicity toward MDA-MB-231 cells, leading to cell cycle arrest and apoptotic cell death, and were associated with reduced HMGCR–RhoA expression and RhoA-GTP activity. These in vitro investigations support further study of this nanoformulation as a hopeful approach for TNBC.
1. Introduction
Breast cancer is the most frequently diagnosed malignancy among women and remains a leading cause of cancer-related mortality worldwide, with approximately 2.43 million new cases and 670,000 deaths estimated in 2024 [1]. Among its molecular subtypes, triple-negative breast cancer (TNBC) represents a particularly aggressive form of the disease and is defined by the absence of estrogen receptor, progesterone receptor, and human epidermal growth factor receptor 2 expression [2]. The lack of these established therapeutic targets limits the use of endocrine and HER2-directed therapies, while the high metastatic potential, frequent recurrence, and development of treatment resistance continue to compromise clinical outcomes [3]. Although conventional chemotherapy remains a major therapeutic approach for TNBC, its clinical efficacy may be limited by systemic toxicity, non-selective drug distribution, and the development of resistance [4]. These challenges underscore the need for novel therapeutic strategies that can effectively suppress TNBC progression while minimizing toxicity toward non-malignant mammary cells [5].
Combination therapy has emerged as a promising approach for targeting the complex signaling and metabolic networks involved in TNBC progression. Combining agents with complementary mechanisms of action may improve anticancer efficacy, overcome resistance to single-agent treatment, and potentially reduce the required concentrations and associated toxicity of individual compounds [6]. Natural bioactive molecules have therefore attracted increasing attention as potential partners for repurposed pharmacological agents in anticancer combination strategies [7].
Quercetin (Qu) is a naturally occurring flavonoid with reported antiproliferative, pro-apoptotic, and cell-cycle-modulatory effects in different cancer models. Its anticancer activity has been associated with the regulation of multiple signaling pathways involved in cell survival, apoptosis, cellular stress, and tumor progression [8]. However, the therapeutic application of quercetin is restricted by poor aqueous solubility, chemical instability, rapid metabolism, and limited bioavailability. These pharmaceutical limitations may reduce its effective intracellular concentration and weaken its biological activity [9]. Consequently, nanoparticle-based delivery systems have been investigated as a means of improving quercetin solubility, stability, cellular delivery, and anticancer efficacy [10].
Statins are clinically used lipid-lowering agents that competitively inhibit 3-hydroxy-3-methylglutaryl-coenzyme A reductase (HMGCR), the rate-limiting enzyme of the mevalonate pathway [11]. In addition to cholesterol, the mevalonate pathway generates non-sterol isoprenoid intermediates, including farnesyl pyrophosphate and geranylgeranyl pyrophosphate, which are required for the post-translational prenylation and membrane localization of several small GTPases [12]. Among these proteins, RhoA regulates cytoskeletal organization, cell proliferation, cell-cycle progression, and cellular motility. Inhibition of the mevalonate pathway may decrease the availability of isoprenoid intermediates and consequently interfere with RhoA membrane localization and downstream signaling pathways that support malignant-cell survival and progression [13].
Rosuvastatin (Ro) is a relatively hydrophilic statin that has demonstrated antiproliferative activity in experimental breast cancer models. Previous studies have reported that rosuvastatin reduces the viability of MDA-MB-231 cells, although the sensitivity of breast cancer cells to statins varies among different cell lines [14,15]. Recent studies have confirmed the role of Ro in inducing pro-apoptotic effects in lung cancer cell lines [16], with decreased cell proliferation and efficacy comparable to doxorubicin, the standard chemotherapeutic drug. Furthermore, Ro has been incorporated into self-nanoemulsifying drug delivery systems to enhance its anticancer effects, aiming to improve solubility and cellular uptake [17]. Cellular adaptation to statin-mediated pathway inhibition may involve compensatory regulation of HMGCR expression, which could influence treatment responsiveness [18]. Moreover, mevalonate-derived isoprenoid intermediates contribute to the functional regulation of RhoA. Consequently, inhibition of the mevalonate pathway may disrupt RhoA-dependent signaling processes involved in cancer-cell proliferation, cytoskeletal organization, and motility. These mechanistic links suggest that alterations in HMGCR–RhoA signaling may contribute to the potential anticancer activity of rosuvastatin-based treatments [19].
Based on the available evidence, the combination of rosuvastatin and quercetin warrants further investigation as a potential strategy for simultaneously modulating metabolic, proliferative, and cell-cycle-related mechanisms involved in cancer progression. However, formulation-related challenges, particularly the poor aqueous solubility, limited stability, and low bioavailability of quercetin, may restrict the therapeutic potential of this combination [20]. These limitations highlight the need for an appropriate co-delivery system capable of improving drug stability, release, and cellular availability.
Chitosan is a biodegradable, biocompatible, and cationic polymer with considerable potential as a nanocarrier for anticancer drug delivery. Chitosan nanoparticles (CSNPs) can act as nanocarriers for several compounds, provide controlled drug release, and potentially enhance cellular uptake through interactions with negatively charged cellular membranes [21]. The simultaneous incorporation of rosuvastatin and quercetin into a chitosan-based delivery system may therefore improve their cellular availability and promote complementary anticancer effects. Nevertheless, the biological performance of these formulations depends on their physicochemical properties, including particle size, size distribution, and surface charge [22].
Separate studies on free statin and nanoparticle-mediated delivery of quercetin have been conducted previously. However, to the best of our knowledge, this is the first report of loading rosuvastatin and quercetin within a single chitosan nanocarrier for assessment in TNBC. This study stands out from earlier work in three primary aspects: it creates a dual-drug chitosan nanoparticle capable of delivering both agents simultaneously, connects cytotoxic outcomes to changes in the HMGCR–RhoA pathway, and evaluates the co-loaded formulation in comparison to Ro-loaded nanoparticles, the free drugs, and a free Ro:Qu combination, in both MDA-MB-231 and non-tumorigenic MCF-10A cells. This strategy facilitates a more precise differentiation between efficacy and selectivity. Thus, we hypothesize that loading both rosuvastatin and quercetin into chitosan nanoparticles will produce more selective and potent cytotoxicity toward MDA-MB-231 cells than either free compounds or the rosuvastatin-loaded CSNP nanoformulation, and we explored whether this is associated with changes in HMGCR–RhoA signaling. Therefore, this study aimed to prepare and characterize rosuvastatin- and quercetin-co-loaded chitosan nanoparticles and evaluate their antiproliferative activity and selectivity in MDA-MB-231 TNBC cells relative to non-tumorigenic MCF-10A mammary epithelial cells. The potential involvement of the mevalonate pathway was further explored by assessing HMGCR mRNA expression and RhoA activation.
2. Materials and Methods
2.1. Materials
Rosuvastatin calcium (purity ≥99%, CAS Number 147098-20-2) was obtained from Cayman Chemical (Michigan, USA, www.caymanchem.com). Quercetin, low-molecular-weight chitosan, and sodium tripolyphosphate (TPP) were purchased from Sigma-Aldrich. Dulbecco’s modified Eagle’s medium (DMEM), fetal bovine serum (FBS), penicillin–streptomycin, phosphate-buffered saline (PBS), trypsin–EDTA, and other cell-culture reagents were purchased from GIBCO, Thermo Fisher Scientific, https://www.thermofisher.com, UK. The MTT-based In Vitro Toxicology Assay Kit was purchased from Sigma-Aldrich (St. Louis, MO, USA; Stock No. TOX-1). The COULTER DNA PREP Reagents Kit used for flow-cytometric cell-cycle analysis was obtained from Beckman Coulter, Inc. (Brea, CA, USA; Cat. No. 6607055). The RNeasy Mini Kit used for total RNA extraction was purchased from QIAGEN (Hilden, Germany; Cat. No. 74106). The iScript™ One-Step RT-PCR Kit with SYBR® Green was obtained from Bio-Rad Laboratories, Inc. (Hercules, CA, USA; Cat. No. 170-8892). Gene-specific primers targeting HMGCR and GAPDH were tested using the iScriptTM One-Step RT-PCR Kit with SYBR® Green. The absorbance-based G-LISA® RhoA Activation Assay Biochem Kit™ was obtained from Cytoskeleton, Inc. (Denver, CO, USA; Cat. No. BK124-S). All other chemicals and reagents were of analytical grade and were used without further purification.
2.2. Preparation of Rosuvastatin–Quercetin Co-Loaded Chitosan Nanoparticles
Rosuvastatin and/or quercetin co-loaded chitosan nanoparticles (Ro@CSNPs and Ro–Qu@CSNPs) were prepared using the ionic gelation method [23]. Briefly, 120 mg of chitosan was dissolved in 60 mL of 1% aqueous acetic acid and stirred overnight at room temperature until a clear and homogeneous solution was obtained. Accordingly, 50 mg of rosuvastatin was dissolved in a mixture of 2 mL dimethyl sulfoxide (DMSO) and 6 mL ethanol. The mixture was then added dropwise to 60 mL of the chitosan solution under continuous magnetic stirring to prepare Ro@CSNPs. Another solution of nano-chitosan and Ro was prepared, and 50 mg of quercetin was separately dissolved in 8 mL ethanol and subsequently added dropwise to the rosuvastatin-containing chitosan solution. The resulting mixtures were continuously stirred for 1–2 h to ensure uniform drug distribution. A 1% TPP solution was separately prepared by dissolving 0.1 g of sodium tripolyphosphate in 10 mL of distilled water. Six milliliters of the prepared TPP solution were then added dropwise to the drug-containing chitosan solution under continuous stirring, followed by an additional 20 min of stirring to induce nanoparticle formation. The resulting suspensions were separately centrifuged at 10,000–15,000 r.p.m for 20 min. The supernatant was retained for the determination of unencapsulated rosuvastatin and quercetin, while the nanoparticle pellet was washed three times with distilled water and redispersed in deionized water. Finally, the purified nanoparticles were freeze-dried until a dry powder was obtained and stored in airtight, light-resistant containers until further use.
2.3. Physicochemical Characterization of Nanoformulations
The prepared Ro@CSNP and Ro–Qu@CSNP nanoformulations were characterized for particle size, polydispersity index, zeta potential, and morphology.
2.3.1. FTIR, Particle Size, Polydispersity Index, and Zeta Potential
Fourier transform infrared spectroscopy (FTIR) was used to assess the potential molecular interactions among chitosan, rosuvastatin, and quercetin. The FTIR spectra of chitosan nanoparticles, pure rosuvastatin, pure quercetin, and prepared nanoformulations were recorded and analyzed (JASCO, Tokyo, Japan, model number AUP1200343). The mean hydrodynamic diameter and polydispersity index (PDI) of the prepared nanoparticles were determined by dynamic light scattering (DLS), and zeta potential was measured using a Brookhaven Zetasizer Nano (Holtsville, U.S.A.) and a He–Ne laser at 633 nm. Particle size, PDI, and zeta potential were measured in triplicate, and results are expressed as the mean ± standard deviation. The UV–Vis absorption spectra of plain CSNPs, free Ro, free Qu, Ro@CSNPs, and Ro–Qu@CSNPs, dissolved in ethanol, were recorded using a Jasco V-770 spectrophotometer from JASCO Inc., Tokyo, Japan, model number AUP1200343, in the wavelength range 200–600 nm.
2.3.2. Morphological Examination
The morphology and approximate particle dimensions of the optimized nanoparticles were examined using scanning electron microscopy (SEM) (JEOL model JSM-IT100, Tokyo, Japan) and transmission electron microscopy (TEM) (JEOL, 100CX II).
2.3.3. Determination of Drug Loading and Encapsulation Efficiency
To assess the drug loading efficiency of both Ro and Qu within the CSNPs, the drug loading efficiency (DL%) and encapsulation efficiency (EE%) were determined. In summary, the final lyophilized nanoformulation (7 mg) was mixed with 10 mL of absolute ethanol and sonicated for 10 min to ensure complete disruption of the nanocomposite matrix and thorough drug extraction. The resulting suspension was then placed in a shaker incubator and agitated at 37 °C for 12 h to guarantee the complete release of the encapsulated materials. Following the incubation, the suspensions were centrifuged at 1000 rpm for 40 min to allow the CSNPs to settle, and the supernatant was carefully removed before being further diluted for spectrophotometric analysis. The concentrations of both Ro and Qu were measured separately using UV spectroscopy (Jasco V-770) (JASCO Corporation, Tokyo, Japan) at wavelengths of 241–245 nm for Ro and 370–380 nm for Qu, respectively [24,25], using a standard curve for each compound. The DL% and EE% were calculated from the following equations:
2.3.4. Drug Release Study
The in vitro drug release assessment was performed to check the ideal release of Ro and Qu from Ro–Qu@CSNPs. This study was conducted at tumor-environment pH to confirm the effectiveness of the nanocomposite. The PBS (phosphate-buffered saline) was adjusted to pH 6.5 (tumor pH), and 20 mg of the nanocomposite was dispersed in 3 mL PBS with slight mixing. Next, the suspended nanocomposite was transferred into a dialysis bag with a molecular weight cut-off of 12,000–14,000 Da and immersed in 40 mL PBS at 37 °C under continuous stirring at 100 rpm. At 0, 15, 30, 45, and 60 min, 1 mL aliquots were removed from the beaker to quantify Ro and Qu release. After each sampling, the removed volume was replaced with an equal amount of fresh PBS at the same pH. The absorbance of Ro and Qu was measured at 242 nm and 370 nm, respectively, using a UV spectrophotometer, with three replicate measurements performed. Apparent drug release was then plotted as a function of time [24]. Because the measured peaks reflect the soluble drug concentration in the released media—which may be affected by reabsorption, spectral interference, or precipitation of the released compound—release levels are expressed as a percentage of the maximum net absorbance increase of each compound after 600 nm base correction, rather than as a true cumulative mass release. Drug release was investigated only at the tumor-environment pH of 6.5.
2.4. Cell Culture
Human MDA-MB-231 triple-negative breast cancer cells and MCF-10A non-tumorigenic mammary epithelial cells were obtained via ATCC (the Holding Company for Biological Products and Vaccines [VACSERA], Cairo, Egypt). MDA-MB-231 cells were maintained in high-glucose Dulbecco’s modified Eagle’s medium supplemented with 10% fetal bovine serum and 1% penicillin–streptomycin. MCF-10A cells were cultured in Dulbecco’s modified Eagle’s medium supplemented with 5% horse serum, 20 ng/mL epidermal growth factor, 0.5 µg/mL hydrocortisone, 10 µg/mL insulin, 100 ng/mL cholera toxin, and 1% penicillin–streptomycin. The cells were maintained at 37 °C in a humidified atmosphere containing 5% CO2. Cultures were routinely examined for morphological changes and microbial contamination.
2.5. Experimental Design
MDA-MB-231 triple-negative breast cancer cells and MCF-10A non-tumorigenic mammary epithelial cells were used to evaluate the cytotoxicity and selectivity of the tested treatments. The experimental groups comprised untreated control cells, vehicle-treated control cells, free rosuvastatin (Ro), free quercetin (Qu), free Ro:Qu (50:50, w/w), plain chitosan nanoparticles (CSNPs), rosuvastatin-loaded chitosan nanoparticles (Ro@CSNPs), and rosuvastatin–quercetin co-loaded chitosan nanoparticles (Ro–Qu@CSNPs). Free compounds were dosed according to the mass of the compound, whereas nanoformulations were dosed according to the total mass of the lyophilized formulation. Accordingly, concentrations are expressed as µg/mL of free compound or total formulation, respectively, without adjustment for drug content. For the initial cytotoxicity assessment, MDA-MB-231 and MCF-10A cells were exposed to increasing concentrations of Ro, Qu, free Ro:Qu (50:50, w/w), Ro@CSNPs, and Ro–Qu@CSNPs. Cell viability was evaluated using the MTT assay, and the half-maximal inhibitory concentration (IC50) was determined for each treatment. Treatment selectivity was assessed by calculating the selectivity index (SI), defined as the ratio of the IC50 value in MCF-10A cells to the corresponding IC50 value in MDA-MB-231 cells. Based on the cytotoxicity findings, Ro–Qu@CSNPs were selected for subsequent biological and mechanistic analyses in MDA-MB-231 cells. The effects of Ro–Qu@CSNPs on cell-cycle distribution and apoptotic and necrotic cell death were evaluated by flow cytometry. Potential modulation of mevalonate-related signaling was further investigated by assessing HMGCR mRNA expression and RhoA activation. Vehicle-treated MDA-MB-231 cells were used as the reference control in these analyses.
2.6. Cell-Viability Assay
The cytotoxic effects of Ro, Qu, Ro:Qu (50:50, w/w), Ro@CSNPs, and Ro–Qu@CSNPs were evaluated in MDA-MB-231 and MCF-10A cells. CSNPs were evaluated against MDA-MB-231 using the MTT-based In Vitro Toxicology Assay Kit (Sigma-Aldrich, St. Louis, MO, USA; Stock No. TOX-1). Following cellular attachment, the cells were treated with Ro, Qu, Ro:Qu (50:50), Ro@CSNPs, or Ro–Qu@CSNPs at concentrations of 0.4, 1.6, 6.3, 25, and 100 µg/mL. Ro:Qu (50:50, w/w) concentration was tested over 3.125– 200 µg/mL (two-fold dilutions), and the free Qu in MCF-10A cells was additionally tested up to 200 µg/mL. Concentrations of free Ro, Qu, and Ro:Qu refer to the mass of free compound(s) per mL, whereas those of Ro@CSNPs and Ro–Qu@CSNPs refer to the total mass of formulation per mL; accordingly, IC50 values of the nanoformulations are expressed as total formulation mass and not as drug-equivalent concentrations. However, CSNPs were tested against MDA-MB-231 at concentrations of 3.125, 12.5, 50, 75, 150, 300, 600, and 1200 µg/mL to evaluate cytotoxicity at higher concentrations. Untreated and vehicle-treated cells were included as controls. After treatment, the MTT reagent was reconstituted in serum-free, phenol-red-free culture medium and added at a volume equivalent to 10% of the culture-medium volume. The plates were incubated at 37 °C for 2–4 h, after which the resulting formazan crystals were dissolved using the kit-supplied solubilization solution. Absorbance was measured at 570 nm using a ROBONIK P2000 microplate reader, with background correction at 630 nm. Treatment-containing wells without cells were included to correct for potential optical interference from Qu and the nanoparticle formulations. Cells were seeded at 104 cells per well, and the treated cells were incubated for 24 h. Cell viability was expressed as a percentage relative to the vehicle-treated control. Half-maximal inhibitory concentration (IC50) values were estimated by nonlinear regression analysis of the concentration-response curves. Treatment selectivity was assessed using the selectivity index (SI), calculated as the ratio of the IC50 value in MCF-10A cells to that in MDA-MB-231 cells.
To evaluate interaction between free Ro, Qu, Ro:Qu (50:50 w/w), Ro@CSNPs, and to compare the nanoformulations with the free compounds, the Chou–Talalay median effect (combination index, CI) method was used [26]. The CI method indicated synergy if CI values were less than 1; additivity was indicated when CI was equal to 1, and antagonism when CI was greater than 1. Fraction affected (Fa) was determined as 1 − (percent viability)/100. For the nanoformulations, CI was calculated against free Ro + free Qu, with the Ro:Qu combination as the reference; for the free combination, it was calculated by the median-effect method at defined Fa levels and by CompuSyn software (CompuSyn Version 1.0.1). CI values for the nanoformulations, compared with the free drugs, are presented as formulation-dependent potentiation indices rather than pharmacological drug–drug synergy. The terms synergy and antagonism apply exclusively to the free Ro:Qu combination.
2.7. Flow-Cytometric Analysis
2.7.1. Cell Cycle Arrest Assessment
Cell-cycle distribution in MDA-MB-231 cells was analyzed using the COULTER DNA PREP Reagents Kit (Beckman Coulter, Inc., Brea, CA, USA; Cat. No. 6607055) according to the manufacturer’s instructions. MDA-MB-231 cells were seeded and subsequently treated with the IC50 concentration of Ro–Qu@CSNPs for 24 h. Vehicle-treated cells exposed to the corresponding final concentration of DMSO were used as the control group. Following treatment, both adherent and detached cells were collected to avoid excluding treatment-affected cell populations. The harvested cells were washed twice with cold phosphate-buffered saline and resuspended in PBS. The cells were stained with Propidium Iodide, and cellular DNA content was analyzed using a BD FACSCalibur flow cytometer equipped with a 488 nm excitation laser. Cell-cycle distributions in Ro–Qu@CSNP-treated cells were compared with those of the vehicle-treated control group as listed in the previous study [27]. Doublets were removed using PI-area versus PI-width or FSC-A versus FSC-H plots.
2.7.2. Apoptosis/Necrosis Detection
The MDA-MB-231 cells were seeded in six wells: three wells were treated with the IC50 of Ro–Qu@CSNPs and incubated for 24 h; the other three wells (untreated) were exposed to vehicle (DMSO) and used as control wells. After incubation, all cells were harvested and washed twice with cold phosphate-buffered saline and resuspended in PBS. The cells were stained with the Annexin V kit (cat. No. 556547 BD Pharmingen FITC apoptosis kit), Becton, Dickinson, and analyzed using a BD FACSCalibur flow cytometer. All treated/untreated wells were read and recorded [27]. For each sample, 10,000 events were collected. Debris was excluded according to forward-scatter (FSC) and side-scatter (SSC) characteristics. Quadrant gates were established with unstained, untreated, and single-stained controls, and compensation was applied when required.
2.8. HMGCR mRNA Expression Analysis by One-Step RT-qPCR
HMGCR mRNA expression in MDA-MB-231 cells was quantified using the iScript™ One-Step RT-PCR Kit with SYBR® Green (Bio-Rad Laboratories, Inc., Hercules, CA, USA; Cat. No. 170-8892). Following treatment with the designated formulations for 24 h, total RNA was extracted using the RNeasy Mini Kit (QIAGEN, Hilden, Germany; Cat. No. 74106) according to the manufacturer’s instructions. Relative HMGCR mRNA expression was normalized to GAPDH and calculated using the 2−ΔΔCt method, with the vehicle-treated control assigned a relative expression value of 1. The primer sequences were as follows: HMGCR forward, 5′-GACGTGAACCTATGCTGGTCAG-3′; HMGCR reverse, 5′-GGTATCTGTTTCAGCCACTAAGG-3′; GAPDH forward, 5′-GTCTCCTCTGACTTCAACAGCG-3′; GAPDH reverse, 5′-ACCACCCTGTTGCTGTAGCCAA-3′.
2.9. RhoA Activation Assay
RhoA activation in MDA-MB-231 cells was quantified using the absorbance-based G-LISA® RhoA Activation Assay Biochem Kit™ (Cytoskeleton, Inc., Denver, CO, USA; Cat. No. BK124-S) according to the manufacturer’s instructions. After treatment with Ro–Qu@CSNPs at the IC50 for 24 h, cells were immediately placed on ice, washed with ice-cold phosphate-buffered saline, and lysed in kit-supplied lysis buffer supplemented with protease inhibitors. The cell lysates were clarified by centrifugation at 10,000× g for 1 min at 4 °C. Protein concentrations were determined using the Precision Red™ Advanced Protein Assay Reagent and equalized before analysis. Equalized lysates were mixed with an equal volume of ice-cold binding buffer, and 50 µL of each sample was transferred to the Rho-GTP-binding wells. Buffer blanks and the kit-supplied constitutively active RhoA control were included in the assay. The plate was incubated at 4 °C for 30 min with orbital shaking, after which the wells were washed and sequentially incubated with the supplied anti-RhoA primary antibody and horseradish peroxidase-conjugated secondary antibody. After adding the HRP detection reagents and stop solution, absorbance was measured at 490 nm using a microplate reader. Background-corrected values were expressed relative to the control group, which was set to 1.0.
2.10. Statistical Analysis
Data are presented as the mean ± standard deviation (SD) using the Minitab 18 software. Concentration–response curves were generated from the MTT assay data, and half-maximal inhibitory concentration (IC50) values were estimated by plotting the data in Microsoft Excel and fitting a regression to the concentration–response curve, then solving the fitted equation for 50% viability. Selectivity indices were calculated by dividing the IC50 value obtained in MCF-10A cells by the corresponding IC50 value in MDA-MB-231 cells. Differences among multiple treatment groups were evaluated using one-way analysis of variance (ANOVA), followed by Tukey’s multiple-comparison test. Two-way ANOVA was used to evaluate the effects of two independent variables, including treatment and cell line or treatment and concentration; Tukey’s post hoc test was used after two-way ANOVA. Statistical significance was defined as p < 0.05. All tests were repeated in triplicate with independent biological replicates (n = 3). Untreated group versus Ro–Qu@CSNP-treated cells were compared (flow cytometry, RT-qPCR, and RhoA assays). Accordingly, p-values were considered significant if p < 0.05. SI was calculated as the IC50 value for normal cells divided by the IC50 value for cancer cells.
3. Results
3.1. Nanocomposite Characterization
3.1.1. UV–Visible Absorption Spectroscopy
The spectrum of free rosuvastatin exhibits two characteristic absorption features, a dominant peak at approximately 243 nm and a weaker shoulder near 290–300 nm, corresponding to the intrinsic π–π* and n–π* electronic transitions of the rosuvastatin chromophore in its unbound, native state (Figure 1a, blue curve). These bands remained at fixed positions and intensities across the free-drug measurements, confirming their reliability as a reference fingerprint for identifying rosuvastatin in subsequent formulations [28].
Figure 1.
Characterization techniques of Ro@CSNPs and Ro–Qu@CSNPs. (a) UV spectra for CSNPs, Qu, Ro, Ro@CSNPs, and Ro–Qu@CSNPs. (b) Size distribution and (c) zeta potential of Ro@CSNPs and Ro–Qu@CSNPs. (d) SEM images of (1) Ro@CSNPs and (2) Ro–Qu@CSNPs. (e) TEM images of (1) Ro@CSNPs and (2) Ro–Qu@CSNPs. (f) FTIR of the two nanoformulations.
Free quercetin (Figure 1a, red curve) displays a weak, broad absorption band in the 300–370 nm region, consistent with its Band I cinnamoyl-system transition, in addition to a dominant far-UV absorption below 250 nm arising from its benzoyl chromophore system. This band serves as the corresponding fingerprint for identifying quercetin in the loaded formulations.
In the CSNP spectrum (Figure 1a, black curve), neither the 245 nm rosuvastatin peak nor the 300–370 nm quercetin band is present; the curve instead displays a smooth, exponential decay typical of the polymeric chitosan matrix, which does not contain strong chromophoric groups in this wavelength range. This confirms that the baseline nanocarrier itself does not interfere with or produce absorbance features in the regions where the drug and quercetin are expected to absorb.
In the Ro@CSNP spectrum (Figure 1a, green curve), the characteristic 245 nm rosuvastatin peak is markedly attenuated and broadened relative to free rosuvastatin, with the curve decaying toward a profile resembling the plain CSNPs rather than retaining a sharp, distinct peak. The attenuation and broadening of the 245 nm band relative to free rosuvastatin may suggest an altered chromophore environment, which could reflect interaction with, or entrapment within, the chitosan matrix. However, UV–Vis alone cannot distinguish specific interaction types, and nanoparticle light scattering may also contribute [28].
When rosuvastatin and quercetin are co-loaded onto the CSNPs (Ro–Qu@CSNPs, Figure 1a, purple curve), the spectrum reveals two significant changes relative to the plain CSNP spectrum. First, the region between 230 and 260 nm displays a broadened, intermediate-intensity absorption feature, reflecting the modified rosuvastatin chromophore environment described above for Ro@CSNPs. Second, a new, broadened peak appears around 375–380 nm, attributed to the characteristic absorption of quercetin, a flavonoid known for its distinct absorbance band in this wavelength range due to its cinnamoyl chromophore system [29]. The presence of this peak in the Ro–Qu@CSNP composite, absent from the plain CSNP spectrum, confirms that quercetin has been successfully incorporated into the nanoparticle structure alongside rosuvastatin.
Additionally, the absorbance intensity of the Ro–Qu@CSNP formulation in the 230–260 nm region is lower than that of free rosuvastatin at its corresponding 245 nm peak. This decrease is consistent with partial shielding of the rosuvastatin chromophore following entrapment within the CSNP matrix, which reduces its effective absorbance relative to the free drug at the same nominal concentration. So, the disappearance of the sharp free-drug fingerprint peaks upon loading, combined with the emergence of the quercetin-specific band at 375–380 nm in the dual-loaded formulation, provides consistent spectroscopic evidence that both rosuvastatin and quercetin were successfully incorporated into the CSNPs, individually in Ro@CSNPs and jointly in Ro–Qu@CSNPs.
3.1.2. Morphology, Particle Size, and Zeta Potential
Chitosan is a nanocarrier polymer for loading polyphenolic compounds due to its numerous amino groups (–NH2) that can become protonated (–NH3+) at acidic pH when dissolved. The cationic nature of chitosan allows it to enhance the capacity for loading polyphenolic compounds [30]. Also, the carboxylic group of rosuvastatin at pH 5.6 is mostly anionic, as it is deprotonated –COO−, and this gives it the ability to bind the protonated amino group of the CSNPs. Figure 1b demonstrates the particle sizes of both Ro@CSNPs and Ro–Qu@CSNPs (hydrodynamic diameter of 308 nm and 247 nm, respectively) with zeta potentials of +35.88 mV and +53.98 mV, respectively (Figure 1c; the original zetasizer reports were attached as a Supplementary File). The consistency and homogeneity of the particle size distribution for each formulation were assessed using the polydispersity index (PDI). A PDI value below 0.7 implies that the particles are homogeneous and stable [31]. The PDI values for Ro@CSNPs and Ro–Qu@CSNPs were measured at 0.326 and 0.242, respectively, which suggests a uniform, narrow distribution for both formulations, although the PDI of Ro@CSNPs is above 0.3. These values of the Ro@CSNPs may be due to the bond formation between the Ro anionic carboxyl group and the amino group in the chitosan, which gives a partially neutralizing surface charge in the nanocomposite. However, the Ro@CSNP charge remains cationic because the amount of chitosan present is much higher than the added Ro. In contrast, Ro–Qu@CSNPs are smaller and more monodisperse than Ro@CSNPs, with a lower PDI. This may be because of the incorporation of quercetin, which is neutral and does not compete for chitosan’s ionic binding sites. However, quercetin’s phenolic groups may form several hydrogen bonds with the chitosan structure or with Ro’s aromatic rings. A possible explanation is that hydrogen bonding between quercetin’s phenolic groups and chitosan or Ro may promote a more compact, uniform structure. This interpretation is tentative and was not directly tested.
The zeta potential distributions of Ro@CSNPs and Ro–Qu@CSNPs are presented in Figure 1c. The single-loaded Ro@CSNP formulation exhibited a zeta potential of +35.88 mV. This positive value reflects the cationic character of the chitosan backbone conferred by its protonated amine groups (–NH3+), although the magnitude is moderate. This is likely because the anionic carboxylate groups of rosuvastatin (–COO−) interact electrostatically with some of the surface –NH3+ groups, partially neutralizing the surface charge [32]. A zeta potential of this magnitude lies only slightly above the generally accepted ±30 mV threshold, suggesting a limited electrostatic stabilization margin for this formulation.
Upon co-loading with quercetin, the zeta potential of Ro–Qu@CSNPs increased to +53.98 mV, an increase of approximately 50% relative to the single-loaded formulation. Quercetin is neutral at the working pH and is not expected to compete with rosuvastatin for the ionic binding sites of chitosan, so it should not further neutralize the amine groups. A possible explanation is that quercetin incorporation, through hydrogen bonding with the chitosan chains, produces a more compact particle (247 nm vs. 308 nm) with a lower PDI (0.242 vs. 0.326). Such a structure may present a higher density of protonated amine groups at the particle surface, but this interpretation is tentative because zeta potential alone cannot establish specific molecular interactions. The higher value of Ro–Qu@CSNPs is well above the ±30 mV threshold, which is consistent with strong electrostatic repulsion between particles and good colloidal stability in suspension.
The SEM images of both Ro@CSNPs and Ro–Qu@CSNPs revealed an observed morphological change upon quercetin incorporation (Figure 1d). The Ro@CSNP surface reveals an irregular, heterogeneous surface composed of fused, plate-like aggregates with relatively smooth, compact regions interspersed with shallow depressions and ridges (Figure 1d-1). The particles appear to form a continuous, coalesced matrix rather than discrete, well-separated units, suggesting that rosuvastatin loading promotes partial fusion or agglomeration of the chitosan network during nanoparticle formation/drying. Some sharper, angular flake-like fragments are visible on the surface, which may correspond to drug crystallites partially embedded within or adsorbed onto the polymeric matrix, alongside smoother chitosan-rich domains. These data suggest Ro adsorption on the CSNP surface, with a large unbound surface area that appeared as several pores and would be suitable for quercetin attachment. In contrast, the dual-loaded Ro–Qu@CSNP formulation (Figure 1d-2) displays a markedly rougher, more porous, and distinctly laminar/flaky morphology, characterized by densely stacked, irregular plate-like layers with pronounced surface roughness and greater textural heterogeneity compared to the Ro@CSNP sample. This transition from a relatively smoother, fused surface to a highly textured, layered architecture is consistent with the incorporation of a second bioactive compound into the nanocarrier matrix, reflecting additional intermolecular interactions that drive a more complex, multi-component assembly during nanoparticle formation and lyophilization/drying—e.g., hydrogen bonding or π-stacking between quercetin’s phenolic/flavonoid rings and the chitosan amine groups, superimposed on the rosuvastatin–chitosan interactions already present in Ro@CSNPs. The change from a smoother, fused surface to a rougher, layered morphology after quercetin addition may reflect altered assembly or drying behavior. Hydrogen bonding or π-stacking between quercetin and chitosan is one possible explanation, but SEM provides morphological information only and cannot identify molecular interactions. At the magnification used (×3300–3500; 5 µm scale bar), SEM shows the micron-scale organization of the lyophilized powder rather than individual nanoparticles, which are resolved by TEM (Figure 1e). In addition, drying and lyophilization may contribute to the observed morphology.
3.1.3. FTIR Analysis
The FTIR spectra of Ro@CSNPs support successful loading of Ro onto the CSNPs and the formation of Ro–Qu@CSNPs (Figure 1f). Ro@CSNPs show a major broad band at 3434 cm−1, arising from the overlap of O–H and N–H groups in the chitosan structure, along with a weak stretching band at 2928 cm−1. Additional bands related to the amide I C=O group at 1640 cm−1 and the amide II N–H at 1538 cm−1 appear in the CSNP spectra, along with bands of the chitosan saccharide backbone, including the skeletal C–O stretching band at 1075 cm−1 and the saccharide-correlated band at 899 cm−1 (Figure S1).
Figure 1f illustrates the spectra of Ro–Qu@CSNPs; the CSNP bands shifted toward lower transmission values, indicating a crowded hydrogen-bonding network and the loading of both Ro and Qu onto the CSNP structure. The shifts of the O–H/N–H band (3434 → 3411 cm−1) and the C–O band (1075 → 1015 cm−1) are consistent with possible hydrogen bonding or altered polymer organization after loading, although overlapping O–H/N–H bands limit the specificity of this assignment. Moreover, another band shift was observed (1075 to 1015 cm−1) that correlated with the chitosan skeletal C–O stretching band, representing a reformed polymer structure or interaction following Ro and Qu loading.
A broad region from 1000 to 1700 cm−1 had obviously appeared in the Ro–Qu@CSNP chart, with a new band peak at 1611 cm−1 representing the aromatic C=C ring stretching, along with amide I band overlap that shifted to 1662 cm−1 (Figure 1f). However, the appearance of new bands at 1522, 1383, 1322, 1263, 1169, and 1131 cm−1, which were missing in the Ro@CSNPs, represents the aromatic ring vibrations from loading both Ro and Qu.
A group of aromatic C–H bending vibrations appeared in the Ro–Qu@CSNPs at 843, 824, and 795 cm−1, which are not found in Ro@CSNPs, providing further evidence for the existence of the extra quercetin aromatic ring structure in the Ro–Qu@CSNPs.
3.1.4. TEM Analysis of Ro@CSNPs and Ro–Qu@CSNPs
The morphological characteristics and the architecture of the nanocomposite for determining the particle size were analyzed by transmission electron microscopy. Figure 1e illustrates isolated spherical particles with limited aggregation in both Ro@CSNP and Ro–Qu@CSNP samples. The Ro@CSNP image showed inconsistent particle distribution, with a mean diameter of 29.6 ± 6.7 nm. The semi-spherical particles formed roughly connected clusters, indicating particle–particle interaction between the Ro and CSNP moieties (Figure 1e-1). In the Ro–Qu@CSNP image, unaggregated spherical bundles with a dense architecture were uniformly distributed. The mean particle diameter was 23.0 ± 9.8 nm, indicating a smaller core size but a larger size distribution compared to Ro@CSNPs (Figure 1e-2). The observed semi-spherical, discrete particle shape in both nanoformulations, along with the lack of visible drug crystals outside the particle edges, indicates effective and consistent loading of Ro onto the CSNPs and successful loading of Ro and Qu within the CSNP moiety. In this study, the TEM core diameters of the dry-state nanoformulation were 23–30 nm, which were much smaller than their DLS hydrodynamic diameters of 247–308 nm. This variation is expected because DLS accounts for the intensity-weighted hydrodynamic size of swollen, hydrated CSNPs, which is controlled by the high fraction and some aggregation. In contrast, TEM measures the dehydrated core of a limited number of particles, which makes this variation reasonable.
3.1.5. Drug Loading, EE%, and Drug Release
The amount of Ro and Qu loaded onto CSNPs (DL%) was calculated using both Ro and Qu standard curves (Figure S2b,c). Ro had a loading efficiency onto the Ro–Qu@CSNPs of about 21.4%, and for Qu, it was 50.8%. By comparing the percentages of Ro and Qu successfully contained within the nanocomposite (Ro–Qu@CSNPs) to the total concentration that was initially used, the EE% of Ro was 85.6%, and that of Qu was 76.2%. Moreover, the yield of Ro–Qu@CSNPs (recovered powder relative to the total mass of chitosan, TPP, and drugs used) was about 55%.
In our study, the apparent Ro release (Figure 2a) shows a gradual increase in the soluble Ro signal from Ro–Qu@CSNPs at tumor-environment pH (6.5). The UV–Vis spectra of the release were observed by fluorescent detection of suspensions of Ro–Qu@CSNPs in PBS at different time intervals (Figure S2f). As a result of the in vitro investigation, Ro is released from the nanoformulation at different time intervals depending on the amount of Ro loaded and the strength of binding between Ro and CSNPs. As shown in Figure 2a, the apparent release of Ro at pH 6.5 (percentage of the maximum net absorbance increase) was 33.3%, 56.7%, 97.5%, and 100% at the tested sampling intervals. At the same pH, Qu release was evaluated over the same time intervals. As presented in Figure 2b, the Qu apparent release values were 50.5%, 73.5%, 100%, and 70.6%, respectively. The apparent Qu signal reached its maximum release of 100% after 45 min and then decreased to 70.6% at 60 min. Because these values possibly represent relative soluble drug signals rather than true cumulative mass release, such a decrease can result from Qu re-adsorption, precipitation, or experimental variation and does not indicate loss of released Qu. The apparent release of both Ro and Qu was essentially complete within 45–60 min; because release was assessed only at pH 6.5, the effect of acidity, such as destabilization of the nanoparticle structure, was not assessed in this work. At pH 6.5, protonation of functional groups on the CSNPs may weaken the interactions between the nanoparticles and the loaded compounds, facilitating their release. Furthermore, these findings indicate that Ro and Qu may be released from the CSNP structure in a tumor-like extracellular environment. This supports our hypothesis that Ro–Qu@CSNPs may exhibit biological efficacy in the tumor microenvironment.
Figure 2.
Apparent release (% of the maximum net absorbance increase) of (a) Ro and (b) Qu from the Ro–Qu@CSNP nanocomposite at 0, 15, 30, 45, and 60 min at pH 6.5 (n = 3).
3.2. Effects of the Tested Formulations on Cell Viability and Selectivity Index in MDA-MB-231 and MCF-10A Cells
The cytotoxic effects of Ro, Qu, Ro:Qu (50:50, w/w), Ro@CSNPs, and Ro–Qu@CSNPs were evaluated in MDA-MB-231 and MCF-10A cells using the MTT assay. Table 1 summarizes the IC50 and selectivity index (SI) values of the tested compounds. All treatments produced concentration-dependent reductions in cell viability over the investigated concentration range of 0.4–100 µg/mL (Figure 3a,b)—the concentration range was extended to 200 µg/mL for free Qu in MCF-10A cells and for Ro:Qu, which was tested at 3.125–200 µg/mL—except for CSNPs, which had no effect against MDA-MB-231 cells (Figure S2a). In MDA-MB-231 cells, Ro–Qu@CSNPs showed significantly increased cytotoxicity, with an IC50 of 7.791 ± 0.26 µg/mL, compared with Qu, Ro, and Ro@CSNPs (p = 0.0001 for all). Accordingly, Ro–Qu@CSNPs displayed approximately 4.68-fold, 1.60-fold, and 2.43-fold greater cytotoxic potency than Qu, Ro, and Ro@CSNPs, respectively, based on their relative IC50 values. In contrast, Ro:Qu (50:50, w/w) exhibited an IC50 value of 31.17 ± 3.55 µg/mL against MDA-MB-231 cells and 97.132 ± 4.32 µg/mL against MCF-10A (Figure 3a,b), with no significant difference compared with Qu IC50. This finding suggested an antagonistic relationship between free Ro and Qu (CI > 1; Tables S1 and S2); combining free Ro with free Qu was less potent than free Ro alone. A less pronounced cytotoxic response was observed in non-tumorigenic MCF-10A cells. Thus, all treatments exhibited higher IC50 values in MCF-10A cells than in MDA-MB-231 cells, indicating greater cytotoxic activity against MDA-MB-231 cells under the investigated conditions. Ro–Qu@CSNPs exhibited the highest selectivity index among the tested treatments, followed by Ro, Qu, Ro:Qu (50:50, w/w), and Ro@CSNPs. The difference in SI values between Ro@CSNPs and free Ro was small. The IC50 value of Ro–Qu@CSNPs against MCF-10A cells was lower than those of free Ro and free Qu (Table 1), indicating that loading Ro onto CSNPs increased its toxicity toward non-tumorigenic cells. However, co-loading Ro and Qu onto CSNPs did not further affect toxicity toward non-tumorigenic cells, which remained comparable to that of Ro@CSNPs. In contrast, co-loading markedly enhanced cytotoxicity toward cancer cells, thereby increasing selectivity for MDA-MB-231 cells.
Table 1.
IC50 values (mean ± SD) and selectivity indices of the tested formulations in MDA-MB-231 and MCF-10A cells.
Figure 3.
Concentration-dependent cytotoxicity and selectivity of the tested formulations in MDA-MB-231 and MCF-10A cells (n = 3). (a) Concentration-dependent effects of the tested treatments on MDA-MB-231 cell viability. (b) Corresponding effects on non-tumorigenic MCF-10A mammary epithelial cells. The dashed horizontal line indicates 50% cell viability. Ro:Qu (50:50) is the free combination (w/w). Concentrations were expressed as µg/mL of free compounds or total nanoformulation mass.
Combination Index
The interaction between Ro and Qu, the Ro:Qu (50:50) combination, and Ro–Qu@CSNPs was evaluated using the Chou–Talalay combination index (Tables S1 and S2, Supplementary Data). At the tested concentrations, the free Ro:Qu combination showed combination index (CI) values between 1.36 and 2.06 across the range of 6.3–100 µg/mL (Table S1), indicating antagonistic interactions (Figure S2d,e); the elevated CI values at 1.6 and 0.4 µg/mL came from the Fa values that were higher than 0.05. In contrast, encapsulating the two compounds onto CSNPs significantly enhanced the activity of the Ro:Qu combination. At 100 µg/mL, Ro–Qu@CSNPs decreased cell viability to 24.68%, compared with 36.2% for the free Ro:Qu (50:50) combination, and produced an IC50 value four times lower than that of the free formulation (Table 1). The enhancement was even greater at intermediate and lower concentrations. At 25, 6.3, 1.6, and 0.4 µg/mL, Ro–Qu@CSNPs reduced cell viability by 12–35 percentage points more than the free Ro:Qu (50:50, w/w) combination. At the highest concentration, Ro@CSNPs and Ro–Qu@CSNPs produced similar dose-equivalent effects. The carrier alone, CSNPs, showed no detectable toxicity, as cell viability remained close to 100%. These findings indicate that Ro–Qu@CSNPs enhanced the efficacy of the Ro:Qu combination. When comparing Ro–Qu@CSNPs with the free drugs (Table S1), the resulting CI values (0.19–0.88, Fa 0.17–0.75) are stated as formulation-dependent potentiation indices. Because the reference is the free compounds, they indicate formulation-dependent potentiation (distribution, uptake, release) rather than pharmacological drug–drug synergy. The median-effect analysis (Table S2) for the free Ro:Qu combination revealed CI = 3.94 and 1.76 at Fa = 0.25 and 0.50 (antagonism) and 0.89 and 0.53 at Fa = 0.75 and 0.90 (seeming synergy); however, the maximum observed Fa of the free Ro:Qu combination was 0.638 (Table S1), so the CI at Fa = 0.75 and 0.90 are observed to be outside the investigational range.
3.3. Effect of Ro–Qu@CSNPs on Cell-Cycle Distribution in MDA-MB-231 Cells
Flow cytometric analysis demonstrated a marked shift in the cell-cycle distribution of MDA-MB-231 cells following treatment with Ro–Qu@CSNPs (Figure 4b,e). The proportion of cells in the G0/G1 phase significantly increased from 51.94% in the control group (Figure 4a) to 77.03% in the treated group (Figure 4e). This increase was accompanied by a reduction in the S-phase population from 34.16% to 18.15% and a decrease in the G2/M-phase population from 13.90% to 4.82%. Collectively, the accumulation of cells in the G0/G1 phase, together with the reduced proportions of cells in the S and G2/M phases, indicates that Ro–Qu@CSNP treatment induced G0/G1 cell-cycle arrest in MDA-MB-231 cells.
Figure 4.
Effects of Ro–Qu@CSNPs on cell-cycle distribution and apoptosis percentages in MDA-MB-231 cells (n = 3). Representative flow-cytometric DNA-content histograms of (a) control cells and (b) Ro–Qu@CSNP-treated cells. Representative Annexin V-FITC/PI flow cytometry plots of (c) control cells and (d) Ro–Qu@CSNP-treated cells. The lower-left quadrant represents viable cells, the lower-right quadrant represents early apoptotic cells, the upper-right quadrant represents late apoptotic cells, and the upper-left quadrant represents necrotic cells. (e) Bar plot showing the cell cycle phase distribution of Ro–Qu@CSNP-treated cells and untreated cells. (f) Bar plot showing the apoptotic percentage of Ro–Qu@CSNP-treated cells and untreated cells.
3.4. Effect of Ro–Qu@CSNPs on Apoptotic and Necrotic Cell Death in MDA-MB-231 Cells
Annexin V-FITC/PI flow cytometric analysis showed a marked increase in apoptotic cell death in MDA-MB-231 cells (p = 0.0001) following treatment with Ro–Qu@CSNPs (Figure 4d). The early apoptotic population increased by 13.4-fold in the Ro–Qu@CSNP-treated group compared to control (Figure 4c), while the late apoptotic population increased by about 100-fold. Consequently, the total apoptotic fraction, calculated as the sum of early and late apoptosis, increased by approximately 29.2-fold following Ro–Qu@CSNP treatment, with no significant change in the necrotic percentage (Figure 4f). These findings indicated that Ro–Qu@CSNPs induced cell death was predominantly associated with apoptosis, with late apoptosis representing the largest component of the apoptotic response.
3.5. Ro–Qu@CSNPs in Association with Reduced HMGCR mRNA Expression in MDA-MB-231 Cells
Treatment with Ro–Qu@CSNPs was associated with reduced HMGCR mRNA expression in MDA-MB-231 cells (Figure 5a). Relative HMGCR expression in Ro–Qu@CSNP-treated cells (0.155 ± 0.05) decreased to 0.155-fold compared with the untreated control (1.006 ± 0.021), which was assigned a value of 1.0. This change corresponded to an approximately 84.5% reduction in HMGCR mRNA expression under the experimental conditions investigated.
Figure 5.
(a) Effects of Ro–Qu@CSNPs on HMGCR mRNA expression in MDA-MB-231 cells (n = 3). HMGCR mRNA expression was quantified using one-step RT-qPCR and normalized to GAPDH. (b) Effects of Ro–Qu@CSNPs on RhoA-GTP activation in MDA-MB-231 cells (n = 3).
3.6. Effect of Ro–Qu@CSNPs on RhoA Activation in MDA-MB-231 Cells
Treatment with Ro–Qu@CSNPs markedly reduced RhoA in MDA-MB-231 cells (Figure 5b). The mean RhoA-GTP-associated absorbance decreased from 2.085 ± 0.066 in the control group to 0.737 ± 0.023 following treatment with Ro–Qu@CSNPs. Moreover, RhoA in the treated cells was reduced to 0.353-fold, corresponding to an approximate reduction of 64.7%. Collectively, these results demonstrate markedly reduced RhoA-GTP levels after Ro–Qu@CSNP treatment under the investigated experimental conditions measured at the IC50 concentration, where reduced cell viability may contribute.
4. Discussion
The aggressive phenotype of triple-negative breast cancer, together with its limited therapeutic targets and frequent development of treatment resistance, has prompted increasing interest in multi-mechanistic therapeutic strategies [33]. In this context, the co-delivery of rosuvastatin and quercetin using chitosan nanoparticles as a drug carrier provides a probable approach for integrating mevalonate-pathway inhibition with the broader anticancer activities of quercetin [34,35]. Chitosan-based nanoencapsulation may additionally protect the incorporated compounds and facilitate their simultaneous delivery to cancer cells, although these potential advantages depend strongly on the physicochemical and release characteristics of the resulting formulation [36].
In this study, both Ro@CSNPs and Ro–Qu@CSNPs were prepared and characterized. UV spectroscopy analysis supports Ro loading onto CSNPs through the attenuation and peak broadening of the 245 nm band. The shift and broadening suggest that Ro interacts with the CSNPs carrier and is entrapped within the chitosan matrix. Such spectral changes are often seen as evidence of encapsulation or surface adsorption in nanocarrier studies [28]. Upon loading Ro and Qu onto CSNPs, the appearance of the peak at 375–380 nm supported the successful loading of Qu onto CSNPs. The presence of this peak in the Ro–Qu@CSNP composite, which is absent from the plain CSNP spectrum, is consistent with quercetin being successfully incorporated into the nanoparticle structure, which is confirmed by EE% and DL% data. Furthermore, the moderate increase in zeta potential from +35.88 mV to +53.98 mV is consistent with the electrostatic interactions between the deprotonated carboxyl groups of rosuvastatin and the protonated amine groups of chitosan. This was accompanied by a smaller hydrodynamic size for Ro–Qu@CSNPs (247 nm) than for Ro@CSNPs (308 nm). The decreased PDI value (0.242) after the addition of quercetin confirms smaller, more uniform nanocomposite formation, which likely happened from the hydrogen-bonding interactions with phenolic compounds that compact the matrix and encourage denser chain arrangement. SEM analysis supported these molecular interactions, showing a shift from an irregular, partially fused structure in Ro@CSNPs to a distinctly textured, layered morphology in Ro–Qu@CSNPs. Additionally, the zeta potential increased by approximately 50%, from +35.88 mV for Ro@CSNPs to +53.98 mV for Ro–Qu@CSNPs, indicating a higher net positive surface charge after quercetin incorporation. This increase may reflect greater exposure to the protonated chitosan amine groups at the particle surface. Since both values exceed the ±30 mV threshold, the dual-loaded nanocarrier is expected to exhibit good colloidal stability owing to strong electrostatic repulsion between particles.
The cytotoxicity study showed that Ro–Qu@CSNPs displayed higher cytotoxic activity compared to Ro@CSNPs. This suggests that Qu may enhance the cytotoxic effects of Ro. However, it is important to note that the current design cannot differentiate between an additive interaction and genuine pharmacological synergy. By contrast, Ro–Qu@CSNPs also displayed the highest selectivity index compared to Ro@CSNPs, indicating a mild improvement in selectivity after loading Qu into the nanoformulation. This enhanced cytotoxic response may reflect the combined biological activities of rosuvastatin and quercetin, their coordinated cellular delivery, formulation-dependent drug release, or an interaction among these factors. Rosuvastatin and quercetin may concurrently influence distinct but interconnected mechanisms involved in cancer-cell proliferation and survival [37]. However, the lower IC50 value of Ro–Qu@CSNPs does not, by itself, establish pharmacological synergy. These possibilities can be distinguished by comparing the concentration-matched free Ro:Qu (50:50) combination, the blank CSNPs, and the Chou–Talalay analysis. The free combination was antagonistic (CI > 1) and less potent than free Ro, and the blank CSNPs had no effect on viability up to 1200 µg/mL. Therefore, the gain obtained with Ro–Qu@CSNPs is more consistent with a formulation-dependent effect rather than an additive or synergistic drug–drug interaction. The relationship between Ro and Ro@CSNPs also warrants careful consideration. Free Ro exhibited a lower IC50 value in MDA-MB-231 cells than Ro@CSNPs, indicating that rosuvastatin loading alone did not enhance its short-term cytotoxic activity. This observation may reflect delayed or incomplete release of encapsulated rosuvastatin during the treatment period, or differences between the nominal formulation concentration and the bioavailable drug concentration. Nanoparticle encapsulation does not necessarily produce greater immediate cytotoxicity, particularly when the carrier provides sustained or controlled drug release.
A notable finding of the present study was the preferential cytotoxic activity of the tested treatments toward MDA-MB-231 cells relative to non-tumorigenic MCF-10A cells. All treatments exhibited higher IC50 values in MCF-10A cells, indicating that MDA-MB-231 cells were more responsive under the investigated conditions. Among the evaluated treatments, Ro–Qu@CSNPs showed the highest selectivity index (4.74), followed by Ro (4.35), Qu (3.70), and Ro@CSNPs (2.17). Thus, the IC50 of Ro–Qu@CSNPs in MCF-10A cells was approximately 4.7-fold higher than that observed in MDA-MB-231 cells, supporting preferential cytotoxicity toward the TNBC cell line. This differential response may be associated with cell-type-specific differences in proliferative activity, metabolic dependence, nanoparticle internalization, mevalonate-pathway signaling, and susceptibility to apoptosis [38]. Nevertheless, the selectivity index represents an in vitro comparative measure and should not be interpreted as direct evidence of systemic safety or tumor-specific therapeutic activity in vivo [39].
The enhanced cytotoxic activity and high SI encourage us to evaluate the cell cycle of MDA-MB-231 cells treated with the Ro–Qu@CSNPs at the IC50. Ro–Qu@CSNPs were accompanied by a pronounced alteration in cell-cycle progression, with G0/G1 cell-cycle arrest, suggesting that Ro–Qu@CSNPs restricted the transition of treated cells into DNA synthesis and subsequent mitotic progression. Quercetin has previously been reported to interfere with cell-cycle regulation through the modulation of cyclins, cyclin-dependent kinases, and their endogenous inhibitors [40]. Rosuvastatin may further contribute to this response by suppressing mevalonate-dependent signaling and reducing the availability of isoprenoid intermediates required for the prenylation and functional activity of small GTPases involved in proliferative signaling [41,42,43]. The pronounced accumulation of treated cells in the G0/G1 phase may reflect the combined influence of Qu on cell-cycle regulatory mechanisms and Ro on mevalonate-dependent proliferative signaling. By restricting progression through the G1/S transition, this cell-cycle arrest may contribute to the reduced viability of MDA-MB-231 cells and increase their susceptibility to apoptosis.
In parallel with the observed G0/G1 cell-cycle arrest, treatment with Ro–Qu@CSNPs markedly increased apoptotic cell death in MDA-MB-231 cells. The proportion of apoptotic cells increased from 0.77% in the control group to 22.46% in the treated group, indicating that Ro–Qu@CSNP-induced cell death occurred primarily through apoptosis rather than nonspecific necrotic damage. The observed response is consistent with the established pro-apoptotic activity of Qu, which has been linked to mitochondrial dysfunction and modulation of pro- and anti-apoptotic signaling pathways [44,45]. Ro may further promote apoptotic susceptibility by disrupting mevalonate-dependent survival signaling and reducing the availability of isoprenoid intermediates required for the prenylation and functional activity of key signaling proteins [14]. Accordingly, the concurrent induction of G0/G1 cell-cycle arrest and apoptotic cell death provides a plausible explanation for the pronounced reduction in MDA-MB-231 cell viability following treatment with Ro–Qu@CSNPs. These complementary effects suggest that the co-loaded formulation simultaneously restricts cell-cycle progression and compromises survival signaling, thereby promoting apoptotic elimination of TNBC cells.
In our study, the marked downregulation of HMGCR mRNA is associated with Ro–Qu@CSNP treatment. However, it does not, by itself, establish modulation of the mevalonate pathway, as it was measured at a cytotoxic concentration and may be secondary to reduced cell viability. Treatment reduced relative HMGCR expression to 0.155-fold of the control value, corresponding to an approximately 84.5% decrease. As HMGCR catalyzes the rate-limiting step of the mevalonate pathway, reduced transcription of this enzyme may complement the pharmacological action of rosuvastatin by limiting the cellular capacity for mevalonate synthesis [46]. In turn, reduced mevalonate availability may limit the generation of downstream isoprenoid intermediates required for the functional activity of prenylated proteins involved in cancer-cell proliferation and survival [47]. Qu may further contribute to this response through its broader regulatory effects on cellular metabolism and survival-related signaling [48]. The observed reduction in HMGCR mRNA may be regarded as an associated finding, and its contribution to the antiproliferative and pro-apoptotic activity of Ro–Qu@CSNPs in MDA-MB-231 cells requires further conformational studies.
Alongside the reduction in HMGCR mRNA, treatment with Ro–Qu@CSNPs markedly reduced RhoA activation. The RhoA-GTP-associated absorbance decreased to 0.353-fold of the control value, representing an approximate reduction of 64.7%. RhoA is a small GTPase that regulates cytoskeletal organization, cell-cycle progression, survival, and migration, thereby contributing to several processes associated with malignant-cell behavior [49]. Its functional activity partly depends on geranylgeranylation, which facilitates membrane association and enables interactions with upstream regulators and downstream effectors [50]. Inhibition of HMGCR may reduce the availability of geranylgeranyl pyrophosphate and consequently disrupt RhoA-dependent signaling [51]. Therefore, the concomitant reduction in HMGCR mRNA and active RhoA-GTP levels are consistent with, but not proof of, the suppression of mevalonate-dependent RhoA signaling by Ro–Qu@CSNPs. Reduced RhoA activation may also be mechanistically associated with the cell-cycle and apoptotic responses observed in the present study. RhoA-dependent signaling contributes to cytoskeletal dynamics, growth-factor-mediated signaling, and progression through the G1 phase of the cell cycle [52]. Its suppression may therefore impair G1/S transition and weaken pro-survival signaling, providing a reasonable link between reduced RhoA activity, G0/G1 cell-cycle arrest, and increased apoptotic susceptibility. Accordingly, the coordinated reduction in HMGCR expression and RhoA activation may contribute to the pronounced loss of MDA-MB-231 cell viability following Ro–Qu@CSNP treatment.
The chitosan-based delivery system may have contributed to the enhanced biological activity observed with Ro–Qu@CSNPs. Owing to their cationic surface properties, chitosan nanoparticles can protect encapsulated compounds, modulate their release, and promote interactions with negatively charged cellular membranes [53]. Furthermore, the chitosan moiety, which contains multiple sugar units, is natural and biocompatible and is safely used as a drug carrier in breast cancer treatment [54]. These characteristics may be particularly beneficial for quercetin, whose pharmaceutical application is limited by poor solubility and bioavailability [55]. Accordingly, the biological activity observed with Ro–Qu@CSNPs may reflect the combined influence of the two agents, nanoparticle-mediated delivery, and formulation-dependent release.
In this work, the apparent release behavior of Ro–Qu@CSNPs at pH 6.5 was slightly rapid, as the Ro signal reached 100% at 60 min, while the Qu signal reached the maximum release at 45 min. However, the subsequent decrease in the Qu apparent release at 60 min may reflect the relative rather than cumulative nature of the measurements and may be due to re-adsorption or precipitation of released Qu. This behavior reflects marked Qu release, likely because Qu was loaded near the CSNP surface, as indicated by the high DL% of Qu (50.8%) and CSNP swelling, rather than sustained release.
The encapsulation efficiency values for Ro and Qu (85.6% and 76.2%, respectively) show that most of the added compounds were entrapped within the CSNP network structure, while the DL% values, that is, 21.4% for Ro and 50.8% for Qu, indicate that the dried nanoformulation carries a large drug fraction.
The correlation between the CI and IC50 appeared when comparing their values of the free Ro:Qu (50:50), which was antagonistic in the range of 6.3–100 µg/mL, and the free Ro was more potent than the Ro:Qu combination, which may indicate their competition for the active target or the decreased dose that did not give the same effect. In contrast, compared with the free combination, Ro–Qu@CSNPs produced CI values of 0.19–0.88 and reduced the IC50 by approximately fourfold. This CI shows potentiation by the carrier (enhanced solubility and stability of Qu, chitosan-mediated membrane contact, endocytosis) rather than actual pharmacological synergy because it uses the free medicines as a reference. Furthermore, a Qu-loaded nanoformulation was not included in the preparation or assessment groups, the single contribution of Qu delivery cannot be evaluated. Ro@CSNPs was less potent than free Ro (18.9 vs. 12.5 µg/mL).
The Ro–Qu@CSNPs SI was 4.74, higher than that of free Ro, with an IC50 lower than that of free Ro or Qu, reflecting selectivity but remaining moderate and safe for normal cells. This high selectivity against MDA-MB-231 cells may correlate with the mevalonate pathway and RhoA signaling and may reflect its strong antiproliferative activity.
Statin-induced HMGCR inhibition typically results in a compensatory SREBP-2-dependent rise in HMGCR expression, which has been connected to statin resistance in breast cancer cells [15,18]. Therefore, the 84.5% decrease in HMGCR mRNA reported here in the Ro–Qu@CSNP-treated cells may be due to the nanoformulation-induced loss of viable or proliferating cells at the IC50 concentration, or a transcriptional effect of quercetin. Also, the G0/G1 accumulation and the elevated total apoptosis of the Ro–Qu@CSNP-treated MDA-MB-231 cells may be correlated with decreased HMGCR mRNA expression that prevents cell proliferation.
Some limitations should be considered. First, the study was conducted using a single TNBC cell line and one non-tumorigenic mammary epithelial cell line. Validation in additional TNBC models representing different molecular characteristics is required to establish the broader applicability of the findings. Second, drug release was examined at an acidic pH of 6.5 for only 60 min and was reported as relative release, and cellular uptake and intracellular release were not evaluated. Third, HMGCR was measured at the mRNA level only, and RhoA activation was assessed by a single G-LISA, without its protein level. HMGCR mRNA and RhoA-GTP were investigated at the IC50 concentration, so the secondary effects of cell loss cannot be excluded, and the mevalonate/GGPP ratio was not investigated. Additionally, Qu-loaded nanoformulation was not included, and the free Ro:Qu combination was assessed at a 50:50 (w/w) rather than an equimolar ratio. Moreover, the nanoformulations were investigated based on their total formulation mass rather than drug-equivalent concentration. Therefore, comparisons of potency with the free drugs should not be based on drug equivalent. Ro–Qu@CSNPs contained approximately 21% Ro and 51% Qu by weight, corresponding to a Ro ratio of about 30:70, whereas the free-drug combination had a 50:50 w/w ratio. Further studies on in vivo models are required to confirm the proposed mechanism and evaluate the therapeutic potential of this formulation.
5. Conclusions
In conclusion, Ro–Qu@CSNPs demonstrated an enhanced cytotoxic effect against MDA-MB-231 cells and a high selectivity index. The Ro–Qu@CSNP nanoformulation also induced G0/G1 cell-cycle arrest, promoted apoptotic cell death, reduced HMGCR mRNA expression, and reduced RhoA-GTP levels. These findings support the in vitro potential of Ro–Qu@CSNPs as a multi-mechanistic TNBC-targeting formulation. However, validation using additional TNBC models, a Qu-loaded nanoformulation as a control, protein-level mevalonate/GGPP rescue experiments, and in vivo studies are required before therapeutic translation can be considered.
Supplementary Materials
The following supporting information can be downloaded at https://www.mdpi.com/article/10.3390/sci8110347/s1. Figure S1. FTIR spectra of plain chitosan nanoparticles; Figure S2. Viability (%) of (a) CSNPs against the MDA-MB-231 cell line. (b) Ro calibration curve, (c) Qu calibration curve, (d) the Fa and CI of Ro:Qu (50:50, w/w) vs. free Ro and Qu and Ro-Qu@CSNPs vs. free Ro and Qu. (e) Fa of the potency gain of Ro-Qu@CSNPs over free Ro and Qu. (f) Apparent release spectra of Ro and Qu from Ro-Qu@CSNPs nanocomposite; Table S1. CI at different concentrations of Ro, Qu, Ro + Qu, Ro:Qu (50:50, w/w) vs. Ro-Qu@CSNPs; Table S2. CI of Free Ro + free Qu vs. Ro:Qu (50:50, w/w).
Author Contributions
Conceptualization, H.A.S. and R.M.S.S.; methodology, K.A.; software, R.M.S.S.; validation, R.M.S.S., H.A.K., and H.A.S.; formal analysis, R.M.S.S.; data curation, R.M.S.S.; writing—original draft preparation, H.A.S., H.A.K., and R.M.S.S.; writing—review and editing, H.A.S., H.A.K., and R.M.S.S.; visualization, H.A.K. and R.M.S.S.; supervision, H.A.S. All authors have read and agreed to the published version of the manuscript.
Funding
This research received no external funding.
Data Availability Statement
Data are available from the corresponding author upon reasonable request.
Conflicts of Interest
The authors declare no conflicts of interest.
Abbreviations
The following abbreviations are used in this manuscript:
| ANOVA | Analysis of variance |
| CSNPs | Chitosan nanoparticles |
| DMEM | Dulbecco’s modified Eagle’s medium |
| DMSO | Dimethyl sulfoxide |
| DNA | Deoxyribonucleic acid |
| FBS | Fetal bovine serum |
| G-LISA | GTPase-linked immunosorbent assay |
| GAPDH | Glyceraldehyde-3-phosphate dehydrogenase |
| GTP | Guanosine triphosphate |
| HMGCR | 3-Hydroxy-3-methylglutaryl-coenzyme A reductase |
| HRP | Horseradish peroxidase |
| IC50 | Half-maximal inhibitory concentration |
| MTT | 3-(4,5-Dimethylthiazol-2-yl)-2,5-diphenyltetrazolium bromide |
| PDI | Polydispersity index |
| PBS | Phosphate-buffered saline |
| PI | Propidium iodide |
| Qu | Free quercetin |
| RNA | Ribonucleic acid |
| Ro | Free rosuvastatin |
| Ro@CSNPs | Rosuvastatin-loaded chitosan nanoparticles |
| Ro-Qu@CSNPs | Rosuvastatin–quercetin co-loaded chitosan nanoparticles |
| RhoA | Ras homolog family member A |
| RT-qPCR | Reverse-transcription quantitative polymerase chain reaction |
| SD | Standard deviation |
| SEM | Scanning electron microscopy |
| SI | Selectivity index |
| TEM | Transmission electron microscopy |
| TNBC | Triple-negative breast cancer |
| TPP | Sodium tripolyphosphate |
| UV–Vis | Ultraviolet–visible spectroscopy |
References
- Sung, H.; Filho, A.M.; Laversanne, M.; Ferlay, J.; Siegel, R.L.; Soerjomataram, I.; Jemal, A.; Bray, F. Global cancer statistics 2024: GLOBOCAN estimates of incidence and mortality worldwide for 34 cancers in 186 countries. CA Cancer J. Clin. 2026, 76, e70090. [Google Scholar] [CrossRef] [Scilit]
- Hon, J.D.; Singh, B.; Sahin, A.; Du, G.; Wang, J.; Wang, V.Y.; Deng, F.M.; Zhang, D.Y.; Monaco, M.E.; Lee, P. Breast cancer molecular subtypes: From TNBC to QNBC. Am. J. Cancer Res. 2016, 6, 1864–1872. [Google Scholar]
- Obidiro, O.; Battogtokh, G.; Akala, E.O. Triple Negative Breast Cancer Treatment Options and Limitations: Future Outlook. Pharmaceutics 2023, 15, 1796. [Google Scholar] [CrossRef] [Scilit]
- Lee, C.H.; Minh Nguyen, T.; Lee, Y.; Choi, S.G.; Nguyen, P.N.; Park, J.H.; Park, M.K. Overcoming Therapeutic Resistance in Triple-Negative Breast Cancer: Targeting the Undrugged Kinome. Int. J. Mol. Sci. 2026, 27, 450. [Google Scholar] [CrossRef] [Scilit]
- Oualla, K.; El-Zawahry, H.M.; Arun, B.; Reuben, J.M.; Woodward, W.A.; Gamal El-Din, H.; Lim, B.; Mellas, N.; Ueno, N.T.; Fouad, T.M. Novel therapeutic strategies in the treatment of triple-negative breast cancer. Ther. Adv. Med. Oncol. 2017, 9, 493–511. [Google Scholar] [CrossRef] [Scilit]
- Jha, A.; Venkatesh, S.K.S.; Singh, A.; Lakkaniga, N.R. Synergistic Combinations for Improved Therapeutic Outcomes in Triple Negative Breast Cancer. Cell Biol. Int. 2026, 50, e70157. [Google Scholar] [CrossRef] [Scilit]
- Mir, M.A.; Banik, B.K. Sustainable healing: Natural compounds facilitating the future cancer treatment. World Dev. Sustain. 2025, 6, 100215. [Google Scholar] [CrossRef] [Scilit]
- Srivastava, S.; Somasagara, R.R.; Hegde, M.; Nishana, M.; Tadi, S.K.; Srivastava, M.; Choudhary, B.; Raghavan, S.C. Quercetin, a Natural Flavonoid Interacts with DNA, Arrests Cell Cycle and Causes Tumor Regression by Activating Mitochondrial Pathway of Apoptosis. Sci. Rep. 2016, 6, 24049. [Google Scholar] [CrossRef] [Scilit]
- Mirza, M.A.; Mahmood, S.; Hilles, A.R.; Ali, A.; Khan, M.Z.; Zaidi, S.A.A.; Iqbal, Z.; Ge, Y. Quercetin as a Therapeutic Product: Evaluation of Its Pharmacological Action and Clinical Applications-A Review. Pharmaceuticals 2023, 16, 1631. [Google Scholar] [CrossRef] [Scilit]
- Li, X.R.; Qi, L.; Zhang, X.W.; Wei, C.; Yu, B.; Pei, T.L. Quercetin and Nano-Derivatives: Potential and Challenges in Cancer Therapy. Int. J. Nanomed. 2025, 20, 6701–6720. [Google Scholar] [CrossRef] [Scilit]
- Liao, J.K. Effects of statins on 3-hydroxy-3-methylglutaryl coenzyme a reductase inhibition beyond low-density lipoprotein cholesterol. Am. J. Cardiol. 2005, 96, 24f–33f. [Google Scholar] [CrossRef] [Scilit]
- Jeong, A.; Suazo, K.F.; Wood, W.G.; Distefano, M.D.; Li, L. Isoprenoids and protein prenylation: Implications in the pathogenesis and therapeutic intervention of Alzheimer’s disease. Crit. Rev. Biochem. Mol. Biol. 2018, 53, 279–310. [Google Scholar] [CrossRef] [Scilit]
- Ulu, A.; Frost, J.A. Regulation of RhoA activation and cytoskeletal organization by acetylation. Small GTPases 2016, 7, 76–81. [Google Scholar] [CrossRef] [Scilit]
- Alim, R.; Akalanka, H.M.K. Statins in Breast Cancer Therapy: Mechanistic Insights and Emerging Evidence. Cancer Innov. 2026, 5, e70040. [Google Scholar] [CrossRef] [Scilit]
- Göbel, A.; Breining, D.; Rauner, M.; Hofbauer, L.C.; Rachner, T.D. Induction of 3-hydroxy-3-methylglutaryl-CoA reductase mediates statin resistance in breast cancer cells. Cell Death Dis. 2019, 10, 91. [Google Scholar] [CrossRef] [Scilit]
- Marcianò, G.; Palleria, C.; Casarella, A.; Rania, V.; Basile, E.; Catarisano, L.; Vocca, C.; Bianco, L.; Pelaia, C.; Cione, E.; et al. Effect of Statins on Lung Cancer Molecular Pathways: A Possible Therapeutic Role. Pharmaceuticals 2022, 15, 589. [Google Scholar] [CrossRef] [Scilit]
- Sweed, N.M.; Fayez, A.M.; El-Emam, S.Z.; Dawoud, M.H.S. Response surface optimization of self nano-emulsifying drug delivery system of rosuvastatin calcium for hepatocellular carcinoma. J. Pharm. Investig. 2020, 51, 85–101. [Google Scholar] [CrossRef] [Scilit]
- Dorsch, M.; Kowalczyk, M.; Planque, M.; Heilmann, G.; Urban, S.; Dujardin, P.; Forster, J.; Ueffing, K.; Nothdurft, S.; Oeck, S.; et al. Statins affect cancer cell plasticity with distinct consequences for tumor progression and metastasis. Cell Rep. 2021, 37, 110056. [Google Scholar] [CrossRef] [Scilit]
- Kennewick, K.T.; Bensinger, S.J. Decoding the crosstalk between mevalonate metabolism and T cell function. Immunol. Rev. 2023, 317, 71–94. [Google Scholar] [CrossRef] [Scilit]
- Gan, M.; Lin, Z.; Ma, J.; Li, N.; Wu, B. A Network Pharmacology-Based Investigation into the Mechanism of Quercetin Combined with Rosuvastatin in Delaying Diabetic Nephropathy via Inhibiting NRK-52E Cell Ferroptosis. Diabetes Metab. Syndr. Obes. 2025, 18, 2681–2694. [Google Scholar] [CrossRef] [Scilit]
- Bashir, S.M.; Ahmed Rather, G.; Patrício, A.; Haq, Z.; Sheikh, A.A.; Shah, M.; Singh, H.; Khan, A.A.; Imtiyaz, S.; Ahmad, S.B.; et al. Chitosan Nanoparticles: A Versatile Platform for Biomedical Applications. Materials 2022, 15, 6521. [Google Scholar] [CrossRef] [Scilit]
- Rezazadeh, M.; Parandeh, M.; Akbari, V.; Ebrahimi, Z.; Taheri, A. Incorporation of rosuvastatin-loaded chitosan/chondroitin sulfate nanoparticles into a thermosensitive hydrogel for bone tissue engineering: Preparation, characterization, and cellular behavior. Pharm. Dev. Technol. 2019, 24, 357–367. [Google Scholar] [CrossRef] [Scilit]
- Bhokare, S.G.; Marathe, R.P. Rosuvastatin calcium loaded chitosan nanoparticles: Preparation evaluation and in vitro release studies. Int. J. Appl. Pharm. 2020, 12, 95–102. [Google Scholar] [CrossRef] [Scilit]
- Ibrahim, A.I.; Sahyon, H.A.; Attia, A.M.; El-Shehawy, A.A. Novel protocatechuic acid encapsulated bovine serum albumin functionalized folic acid nanoparticles for targeted therapy in urethane-induced lung cancer model. Sci. Rep. 2025, 15, 25793. [Google Scholar] [CrossRef] [Scilit]
- Ibrahim, A.I.; Attia, A.M.; Sahyon, H.A.; El-Shehawy, A.A. Bovine Serum Albumin Nanoparticles as Versatile Carriers for Enhancing the Multifunctional Efficacy of Protocatechuic Acid. ChemistrySelect 2025, 10, e202405320. [Google Scholar] [CrossRef] [Scilit]
- Chou, T.-C.; Talalay, P. Quantitative Analysis of Dose-Effect Relationships: The Combined Effects of Multiple Drugs or Enzyme Inhibitors. Adv. Enzym. Regul. 1984, 22, 27–55. [Google Scholar] [CrossRef] [Scilit]
- Ramadan, A.E.-M.M.; Ibrahim, M.M.; Sahyon, H.A.; Abd El-hay, E.M.; Al-Juaid, S.S.; Alhadhrami, A.; Fathy, A.M. Synthesis, spectroscopic characterization, and anti-melanoma activity of a novel nickel(II) complex containing barbital/tetra methyl ethylene diamine mixed ligand system. Inorg. Chem. Commun. 2026, 183, 115824. [Google Scholar] [CrossRef] [Scilit]
- Guo, T.; Wang, Y.; Hayat, M.A.; Si, Y.; Ni, Y.; Zhang, J.; Qiu, Y.; Zeng, Y.; Cao, Y.; Hong, Y.; et al. Recombinant human heavy-chain ferritin nanoparticles loaded with rosuvastatin attenuates secondary brain injury in intracerebral hemorrhage. Int. J. Biol. Macromol. 2025, 302, 140542. [Google Scholar] [CrossRef] [Scilit]
- Verdoliva, V.; Traboni, S.; De Luca, S. Quercetin conjugated to hyaluronic acid: Synthesis, UV–Vis and antioxidant activity characterization by reaction on Fe(III). J. Photochem. Photobiol. A Chem. 2026, 481, 117420. [Google Scholar] [CrossRef] [Scilit]
- Alqahtani, L.S. Dual-functional Green Tea Polyphenol loaded Chitosan Nanoparticles for Eradication of Uropathogenic Biofilm and Induction of Apoptotic Pathways in Prostate Cancer Cells. Appl. Biochem. Biotechnol. 2026, 198, 6750–6784. [Google Scholar] [CrossRef] [Scilit]
- Rahimnejad, M.; Najafpour, G.; Bakeri, G. Investigation and modeling effective parameters influencing the size of BSA protein nanoparticles as colloidal carrier. Colloids Surf. A Physicochem. Eng. Asp. 2012, 412, 96–100. [Google Scholar] [CrossRef] [Scilit]
- Agarwal, M.; Agarwal, M.K.; Shrivastav, N.; Pandey, S.; Das, R.; Gaur, P. Preparation of Chitosan Nanoparticles and their In-vitro Characterization. Int. J. Life-Sci. Sci. Res. 2018, 4, 1713–1720. [Google Scholar] [CrossRef] [Scilit]
- Raman, R.; Debata, S.; Govindarajan, T.; Kumar, P. Targeting Triple-Negative Breast Cancer: Resistance Mechanisms and Therapeutic Advancements. Cancer Med. 2025, 14, e70803. [Google Scholar] [CrossRef] [Scilit]
- Modiri, A.; Abdolmaleki, Z.; Paryani, M.R. The effect of rosuvastatin coated by nano-chitosan on developing hippocampus: Association with hippocampal neurogenesis and memory in an Alzheimer’s induced model of rats. Anat. Cell Biol. 2025, 58, 61–75. [Google Scholar] [CrossRef] [Scilit]
- Bakr, A.F.; El-Shiekh, R.A.; Mahmoud, M.Y.; Khalil, H.M.A.; Alyami, M.H.; Alyami, H.S.; Galal, O.; Mansour, D.F. Efficacy of Quercetin and Quercetin Loaded Chitosan Nanoparticles Against Cisplatin-Induced Renal and Testicular Toxicity via Attenuation of Oxidative Stress, Inflammation, and Apoptosis. Pharmaceuticals 2024, 17, 1384, Correction in Pharmaceuticals 2025, 18, 348. https://doi.org/10.3390/ph18030348. [Google Scholar] [CrossRef] [Scilit]
- Grewal, A.K.; Salar, R.K. Chitosan nanoparticle delivery systems: An effective approach to enhancing efficacy and safety of anticancer drugs. Nano TransMed 2024, 3, 100040. [Google Scholar] [CrossRef] [Scilit]
- Taha, Y.A.; Ibrahim, A.I.; Mohammed, N.A.; Mahgoub, J.M.; El-Wahsh, H.M.; El-Naggar, S.A.; Sadek, K.M. Enhanced cytotoxic activity and pH-responsive drug delivery of quinalizarin-conjugated gold nanoparticles in non-small cell lung cancer. Sci. Rep. 2026, 16, 23346. [Google Scholar] [CrossRef] [Scilit]
- Cameron, S.J.; Sheng, J.; Hosseinian, F.; Willmore, W.G. Nanoparticle Effects on Stress Response Pathways and Nanoparticle-Protein Interactions. Int. J. Mol. Sci. 2022, 23, 7962. [Google Scholar] [CrossRef] [Scilit]
- Grabowska, K.; Galanty, A.; Pecio, Ł.; Stojakowska, A.; Malarz, J.; Żmudzki, P.; Zagrodzki, P.; Podolak, I. Selectivity Screening and Structure-Cytotoxic Activity Observations of Selected Oleanolic Acid (OA)-Type Saponins from the Amaranthaceae Family on a Wiade Panel of Human Cancer Cell Lines. Molecules 2024, 29, 3794. [Google Scholar] [CrossRef] [Scilit]
- Lotfi, N.; Yousefi, Z.; Golabi, M.; Khalilian, P.; Ghezelbash, B.; Montazeri, M.; Shams, M.H.; Baghbadorani, P.Z.; Eskandari, N. The potential anti-cancer effects of quercetin on blood, prostate and lung cancers: An update. Front. Immunol. 2023, 14, 1077531. [Google Scholar] [CrossRef] [Scilit]
- Amiri, L.; Patnaik, R.; Varghese, R.L.; Huda, B.; Banerjee, Y. Pharmacologic Modulation of the PAR-2-ERK Axis by Statins Converts Inflammatory Survival Signalling into Apoptosis in Colorectal Cancer Cells. Int. J. Mol. Sci. 2026, 27, 916. [Google Scholar] [CrossRef] [Scilit]
- Chiarella, E.; Nisticò, C.; Di Vito, A.; Morrone, H.L.; Mesuraca, M. Targeting of Mevalonate-Isoprenoid Pathway in Acute Myeloid Leukemia Cells by Bisphosphonate Drugs. Biomedicines 2022, 10, 1146. [Google Scholar] [CrossRef] [Scilit]
- Gbelcová, H.; Rimpelová, S.; Knejzlík, Z.; Šáchová, J.; Kolář, M.; Strnad, H.; Repiská, V.; D’Acunto, W.C.; Ruml, T.; Vítek, L. Isoprenoids responsible for protein prenylation modulate the biological effects of statins on pancreatic cancer cells. Lipids Health Dis. 2017, 16, 250. [Google Scholar] [CrossRef] [Scilit]
- Li, X.; Wang, H.; Gao, Y.; Li, L.; Tang, C.; Wen, G.; Zhou, Y.; Zhou, M.; Mao, L.; Fan, Y. Protective Effects of Quercetin on Mitochondrial Biogenesis in Experimental Traumatic Brain Injury via the Nrf2 Signaling Pathway. PLoS ONE 2016, 11, e0164237. [Google Scholar] [CrossRef] [Scilit]
- Cho, M.-K.; Lee, S.-H.; Nam, H.-S.; Lee, Y.-J. Quercetin–Arctigenin Co-Treatment Induces Mitochondrial Dysfunction and Apoptotic Cell Death Through Metabolic Stress in Malignant Mesothelioma Cells. Life 2026, 16, 774. [Google Scholar] [CrossRef] [Scilit]
- Teng, Y.-N. The Potential Therapeutic Applications of Natural Products in the Oxidative Stress-Related MVA Pathway: Focus on HMGCR. Antioxidants 2025, 14, 1001. [Google Scholar] [CrossRef] [Scilit]
- Mo, H.; Jeter, R.; Bachmann, A.; Yount, S.T.; Shen, C.L.; Yeganehjoo, H. The Potential of Isoprenoids in Adjuvant Cancer Therapy to Reduce Adverse Effects of Statins. Front. Pharmacol. 2018, 9, 1515. [Google Scholar] [CrossRef] [Scilit]
- Grumăzescu, F.; Anghel, A.-M.; Lupu, A.; Enachi, E.; Lisă, E.-L.; Diaconu, C. Quercetin as a Multifunctional Flavonol: Molecular Insights and Therapeutic Applications. Molecules 2026, 31, 2914. [Google Scholar] [CrossRef] [Scilit]
- Cheng, C.; Seen, D.; Zheng, C.; Zeng, R.; Li, E. Role of Small GTPase RhoA in DNA Damage Response. Biomolecules 2021, 11, 212. [Google Scholar] [CrossRef] [Scilit]
- Agabiti, S.S.; Liang, Y.; Wiemer, A.J. Molecular mechanisms linking geranylgeranyl diphosphate synthase to cell survival and proliferation. Mol. Membr. Biol. 2016, 33, 1–11. [Google Scholar] [CrossRef] [Scilit]
- Rattan, S. 3-Hydroxymethyl coenzyme A reductase inhibition attenuates spontaneous smooth muscle tone via RhoA/ROCK pathway regulated by RhoA prenylation. Am. J. Physiol. Gastrointest. Liver Physiol. 2010, 298, G962–G969. [Google Scholar] [CrossRef] [Scilit]
- Ning, Y.; Zheng, M.; Zhang, Y.; Jiao, Y.; Wang, J.; Zhang, S. RhoA-ROCK2 signaling possesses complex pathophysiological functions in cancer progression and shows promising therapeutic potential. Cancer Cell Int. 2024, 24, 339. [Google Scholar] [CrossRef] [Scilit]
- El-Saadony, M.T.; Saad, A.M.; Sitohy, M.; Alkafaas, S.S.; Dladla, M.; Ghosh, S.; Mohammed, D.M.; Soliman, T.N.; Ibrahim, E.H.; Fahmy, M.A.; et al. Chitosan nanoparticles: Green synthesis, biological activities, and sustainable frontiers in targeted drug delivery and cancer nanomedicine—A comprehensive review. Mater. Today Bio 2025, 35, 102358. [Google Scholar] [CrossRef] [Scilit]
- De, A.; Wadhwani, A.; Sauraj Roychowdhury, P.; Kang, J.H.; Ko, Y.T.; Kuppusamy, G. WZB117 Decorated Metformin-Carboxymethyl Chitosan Nanoparticles for Targeting Breast Cancer Metabolism. Polymers 2023, 15, 976. [Google Scholar] [CrossRef] [Scilit]
- Kandemir, K.; Tomas, M.; McClements, D.J.; Capanoglu, E. Recent advances on the improvement of quercetin bioavailability. Trends Food Sci. Technol. 2022, 119, 192–200. [Google Scholar] [CrossRef] [Scilit]
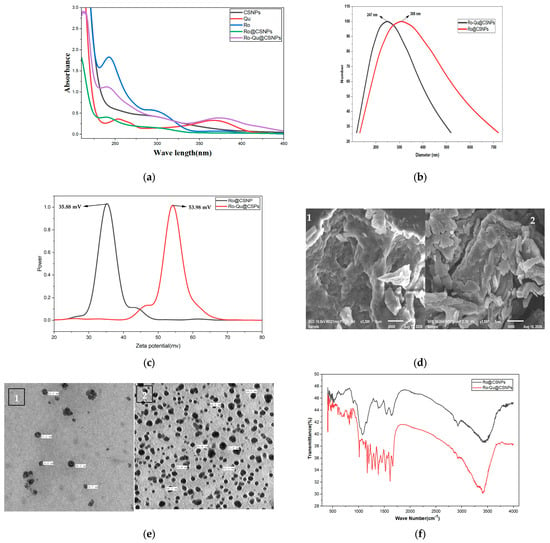
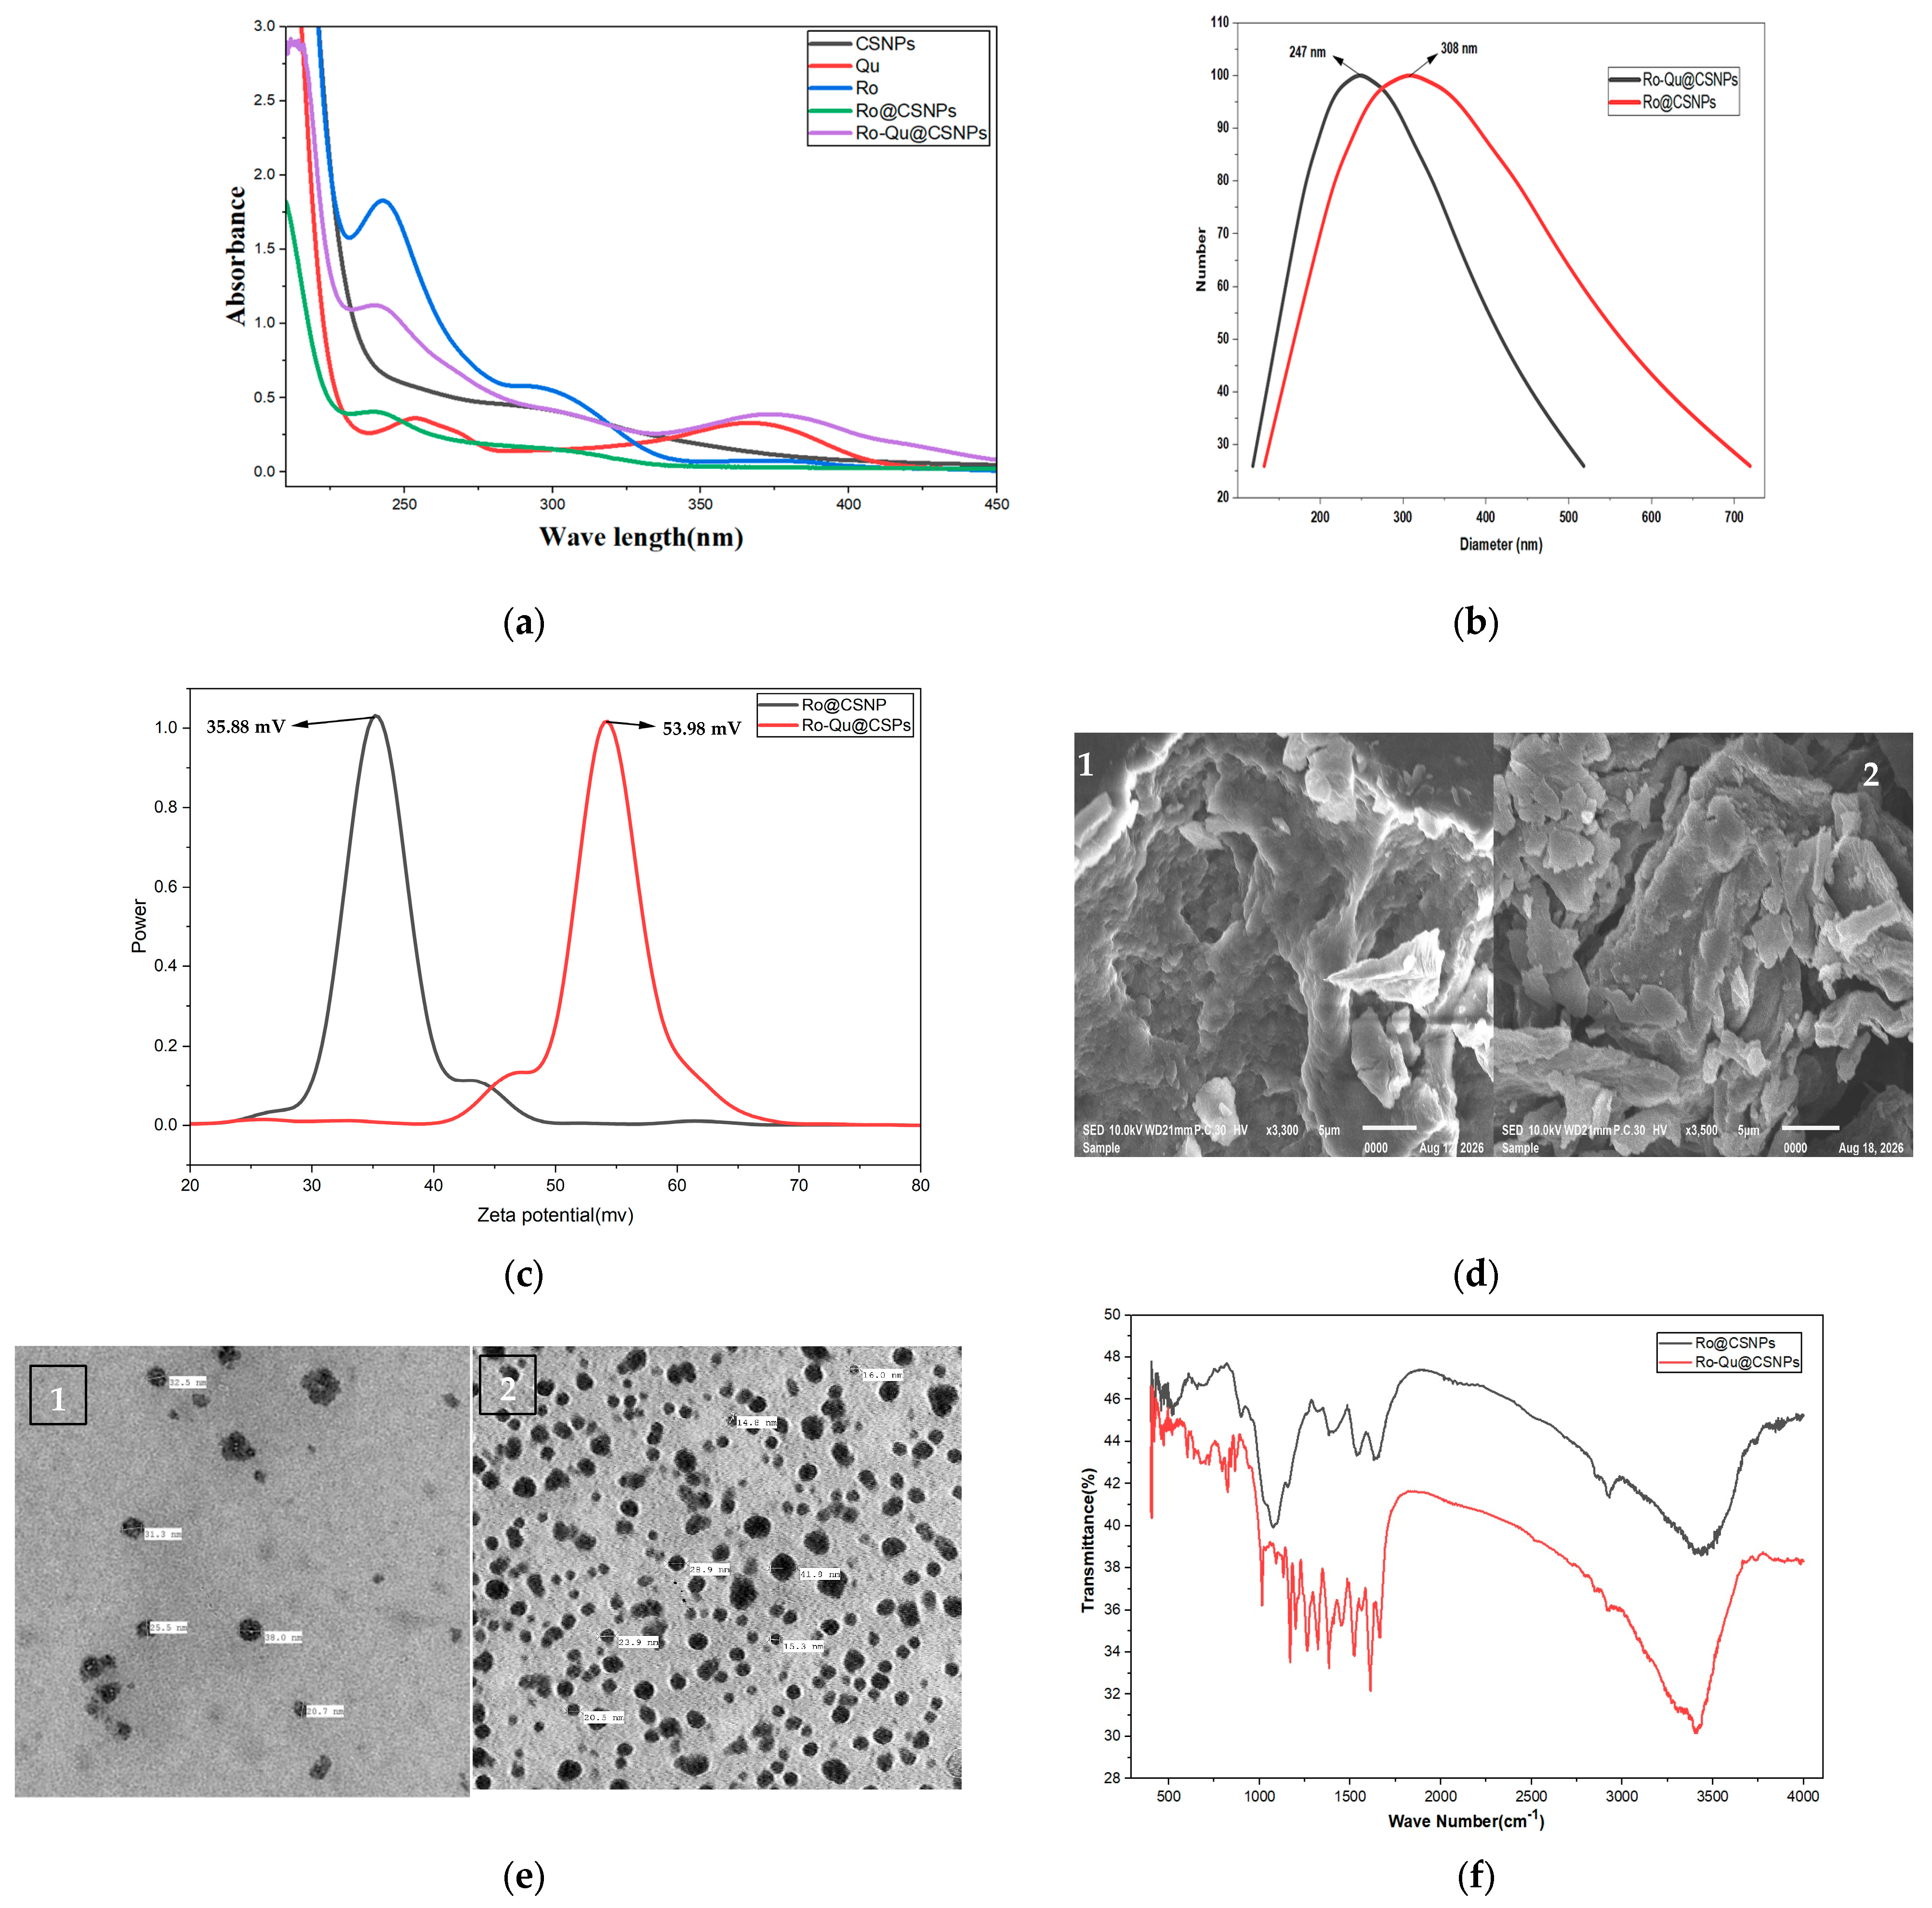
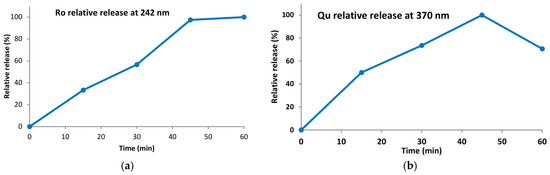
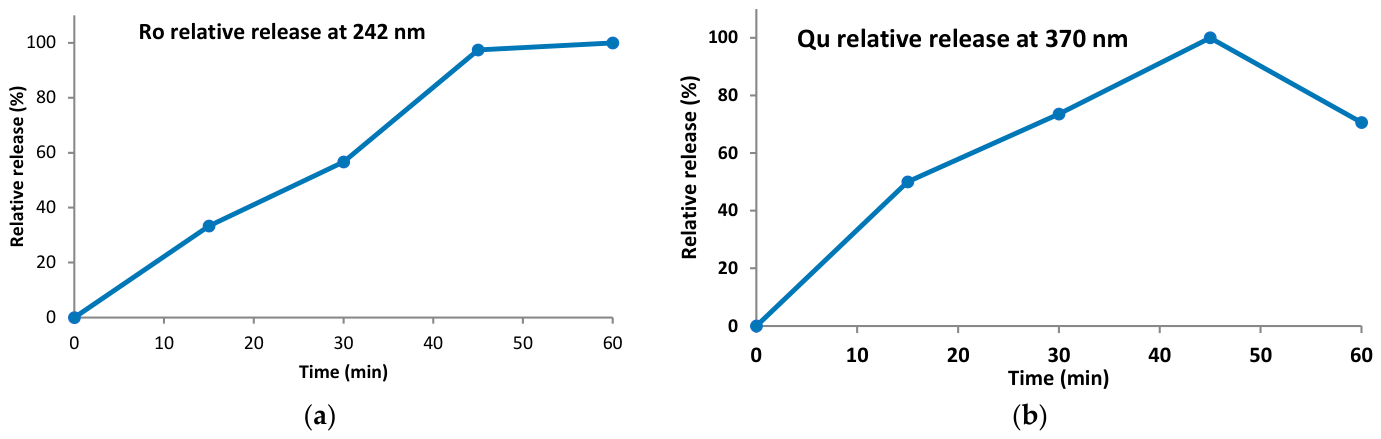
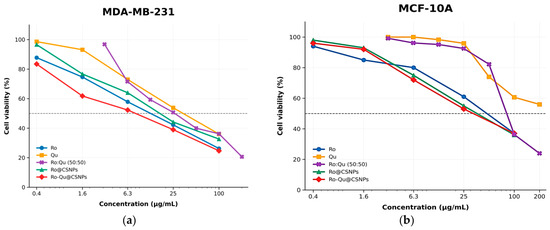
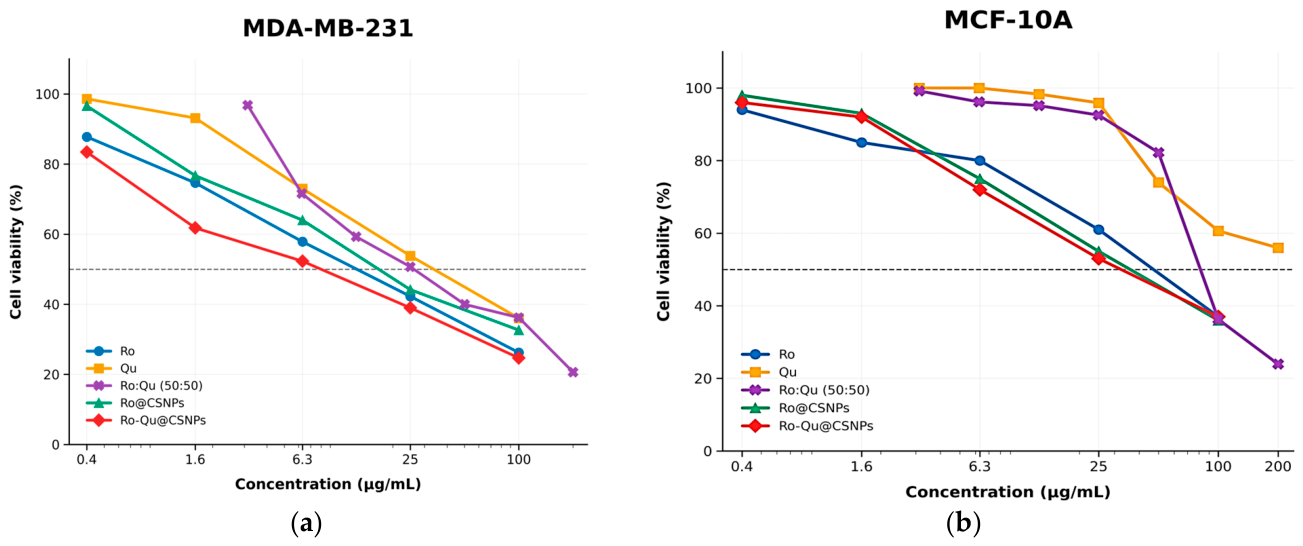
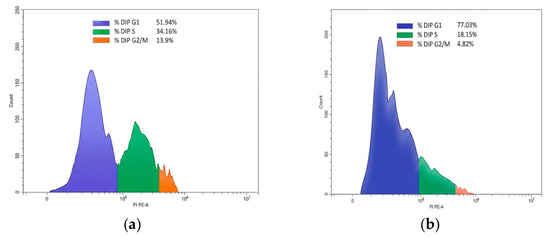
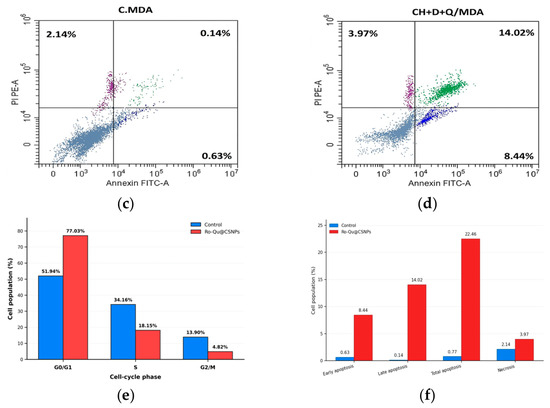
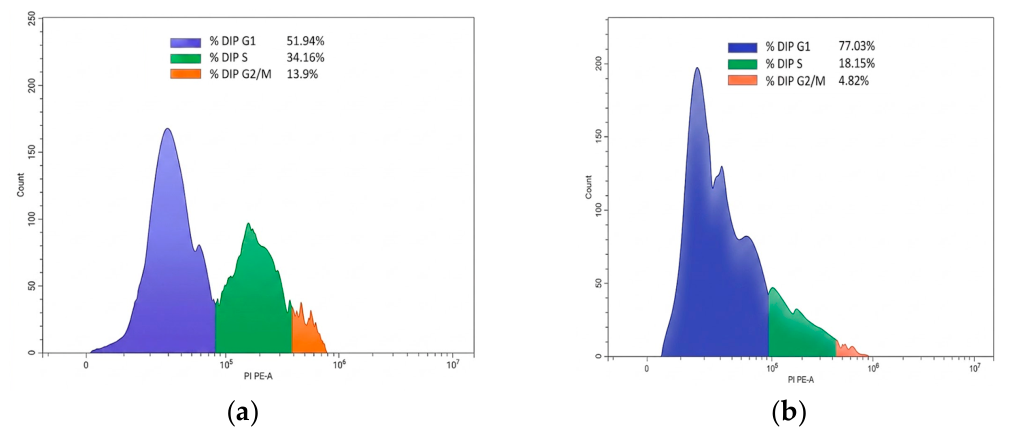
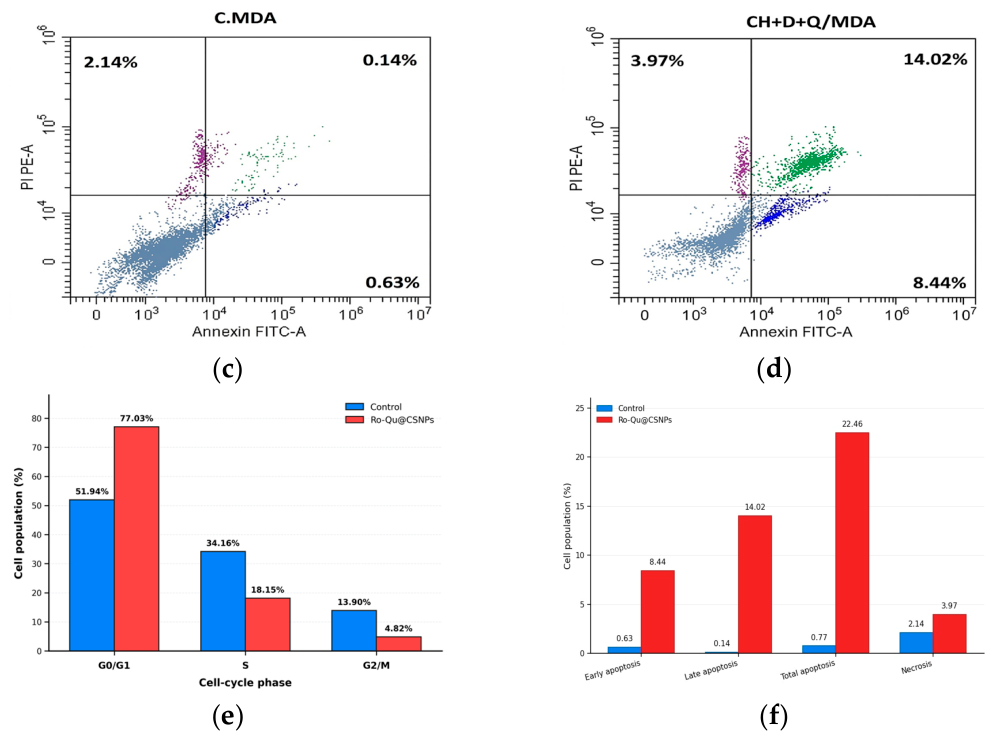
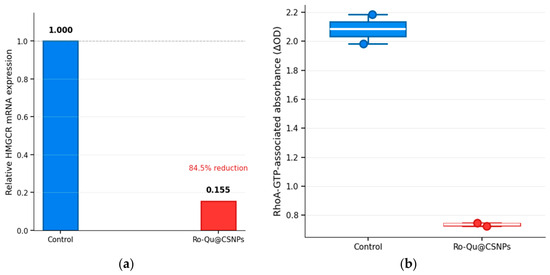
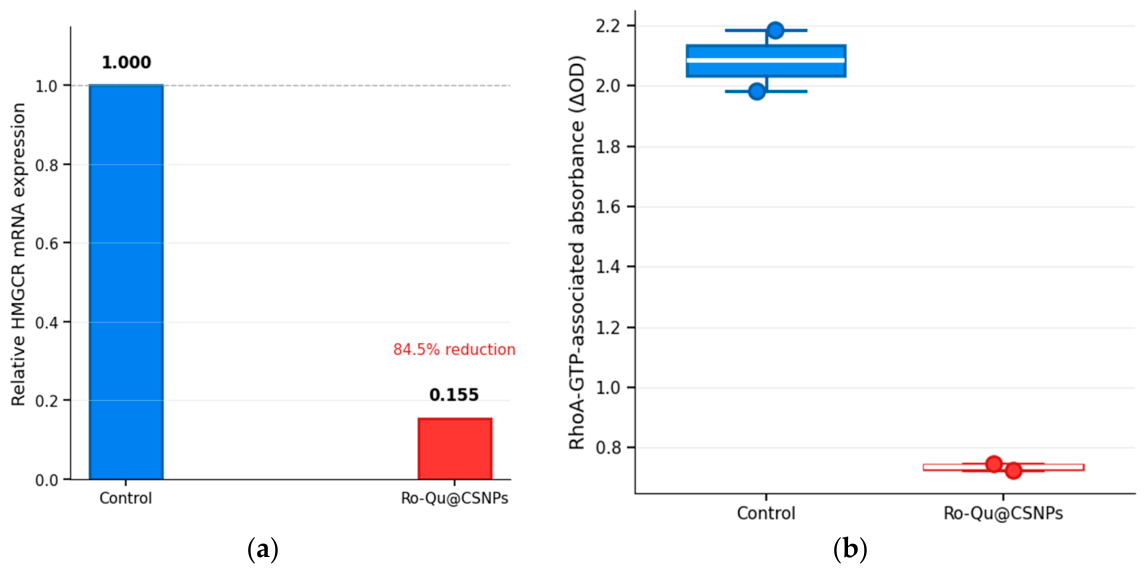

Disclaimer/Publisher’s Note: The statements, opinions and data contained in all publications are solely those of the individual author(s) and contributor(s) and not of MDPI and/or the editor(s). MDPI and/or the editor(s) disclaim responsibility for any injury to people or property resulting from any ideas, methods, instructions or products referred to in the content. |
© 2026 by the authors. Licensee MDPI, Basel, Switzerland. This article is an open access article distributed under the terms and conditions of the Creative Commons Attribution (CC BY) license.