


Abstract
Although surface electromyography (SEMG) is widely used in research, it remains unclear whether systematic differences in SEMG amplitudes are sensitive to sex, age, or individual force capacity. To address this issue, the present study conducted a re-evaluation of SEMG amplitude values of back muscles in a total of 239 healthy participants (115 women) aged 18–52 years. SEMG data were obtained during static submaximal and maximal (MVC) tasks. Across the subgroups defined by sex, age, BMI, and force capacity, no relevant differences in amplitude were identified, with the following exceptions M. iliocostalis: young > older and all muscles low BMI > high BMI. In contrast, during MVC, amplitude differences were consistently detected: men > women, young > older, low BMI > high BMI, and strong > weaker. Analysis of the amplitude-force relationship using values normalized to MVC revealed nearly perfectly linear relation-ships across all subgroups. Although the data points were in different positions along the range of origin, the slopes were nearly identical. These findings suggest that, within the submaximal range, SEMG amplitudes of the back muscles may be analyzed jointly without adjustment for sex, age, or force capacity. By contrast, SEMG data obtained during MVC should be evaluated separately for the respective subgroups.
1. Introduction
Surface electromyography (SEMG) is widely used in research, including ergonomics [1,2], exercise physiology [3], sports science [4], intervention studies [5,6], and motor unit analysis [7,8,9].
Despite its broad use, the analysis and interpretation of SEMG data remain challenging, partly because muscle activation is inherently stochastic [10,11]. Additional sources of variability include electrode placement [12] and anthropometric characteristics [13,14]. To reduce interindividual variation, SEMG data are commonly normalized [15], allowing amplitudes to be interpreted relative to a reference rather than as absolute values. Maximal voluntary contraction force (MVC), together with the corresponding SEMG amplitude, is generally regarded as the gold standard for normalization [16,17,18]. However, this approach emerged from performance research [19,20] and is therefore used mainly in athletes. In such populations, participants are typically familiar with the task, willing to exert maximal effort, and sufficiently motivated, all of which are critical for valid MVC assessment. In untrained individuals, by contrast, MVC-based normalization is more uncertain. Performance may be affected by task unfamiliarity [21], fear of injury [22], pain or fear of pain [23,24], and low motivation [25]. To address these limitations, especially in ergonomics and occupational medicine, normalization is often based on a submaximal reference level obtained during standardized, task-specific exercises, which is largely independent of these factors [26,27,28].
Another limitation of SEMG is that it does not measure force directly but reflects the level of muscle activation required to perform a given task [10,29]. Thus, activation depends not on the external load alone, but on the current level of exertion. Moreover, this relationship is context-dependent. Fatigue, for example, alters the amplitude-force relationship because progressively increasing activation is required to maintain a constant load [30].
Independent of fatigue, a weaker muscle must be activated more strongly than a stronger or better-trained muscle to generate the same external load [31,32]. This is readily explained by differences in force-generating capacity, which depends on the number of contractile filaments and thus on the intracellular content of contractile proteins [33]. Less clear, however, is how differences in force capacity affect measurable SEMG amplitudes. Training studies provide some insight. Pre–post comparisons show that increases in maximal force are accompanied by higher SEMG amplitudes during maximal effort [34]. In the submaximal range, by contrast, the differences are much smaller, although still detectable [35]. These effects are attributed to both increased muscle mass and improved neuromuscular activation strategies [35,36]. When force levels are normalized to MVC, however, these differences disappear, and in some cases amplitudes are even lower after training [35,37].
The preceding considerations concern training-related changes over short to medium time spans. A different question is whether SEMG amplitudes differ systematically between individuals with different force capacities. A prominent example is the well-established sex difference in force-generating capacity [38]. In such studies, data from women and men are usually analyzed separately. Whether this is also necessary for SEMG data remains unclear. More generally, it has not been systematically examined whether differences in force capacity alone are associated with systematic differences in SEMG amplitude in the absence of training effects.
The present study therefore examined whether SEMG amplitudes differ systematically between women and men, younger and older participants, subjects with low and high body mass index (BMI), and individuals with different force capacities in both the submaximal and maximal force ranges. Such differences would have direct implications for the acquisition, analysis, and interpretation of SEMG data. To address this question, previously collected SEMG data from the back muscles were re-evaluated.
2. Methods
The present analysis used data from previous studies in which the same back muscles were examined under both submaximal and maximal force conditions. All studies included volunteers of both sexes and were approved by the Ethics Committee of Friedrich Schiller University Jena (4348-02/15, 2021-2373-BO, 2021-2373_1-BO, 2024-3462-BO, 2024-3634-BO-A). Written informed consent was obtained from all participants.
The final sample comprised 239 healthy participants aged 18–52 years, including 115 women and 124 men. All participants reported no acute back pain and no back pain within the previous 3 months and were physically inactive or only moderately active. Individuals who exercised regularly more than twice per week and those with a body mass index (BMI) > 32 kg/m2 were excluded. The anthropometric characteristics of the cohort are presented in Table 1.
Table 1.
Anthropometric characteristics of the participants.
2.1. Investigation
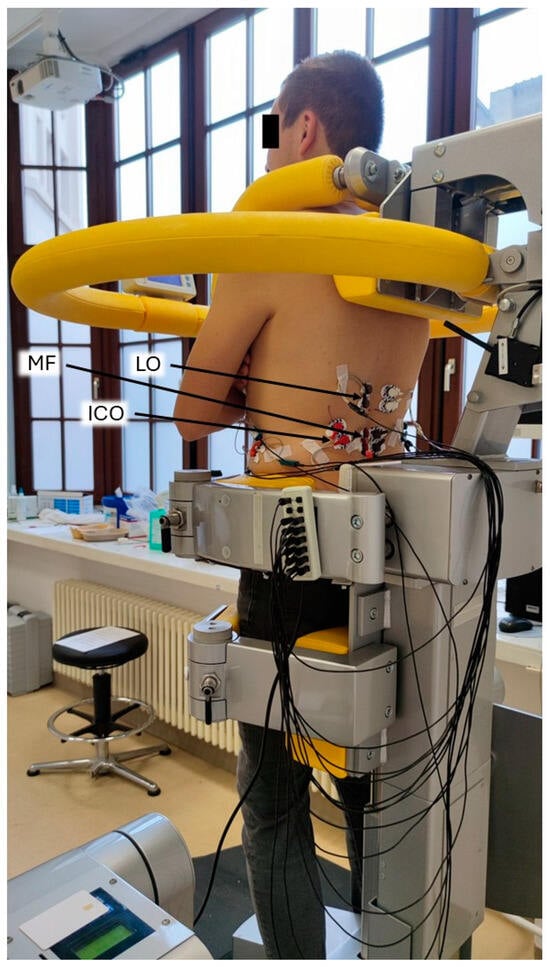
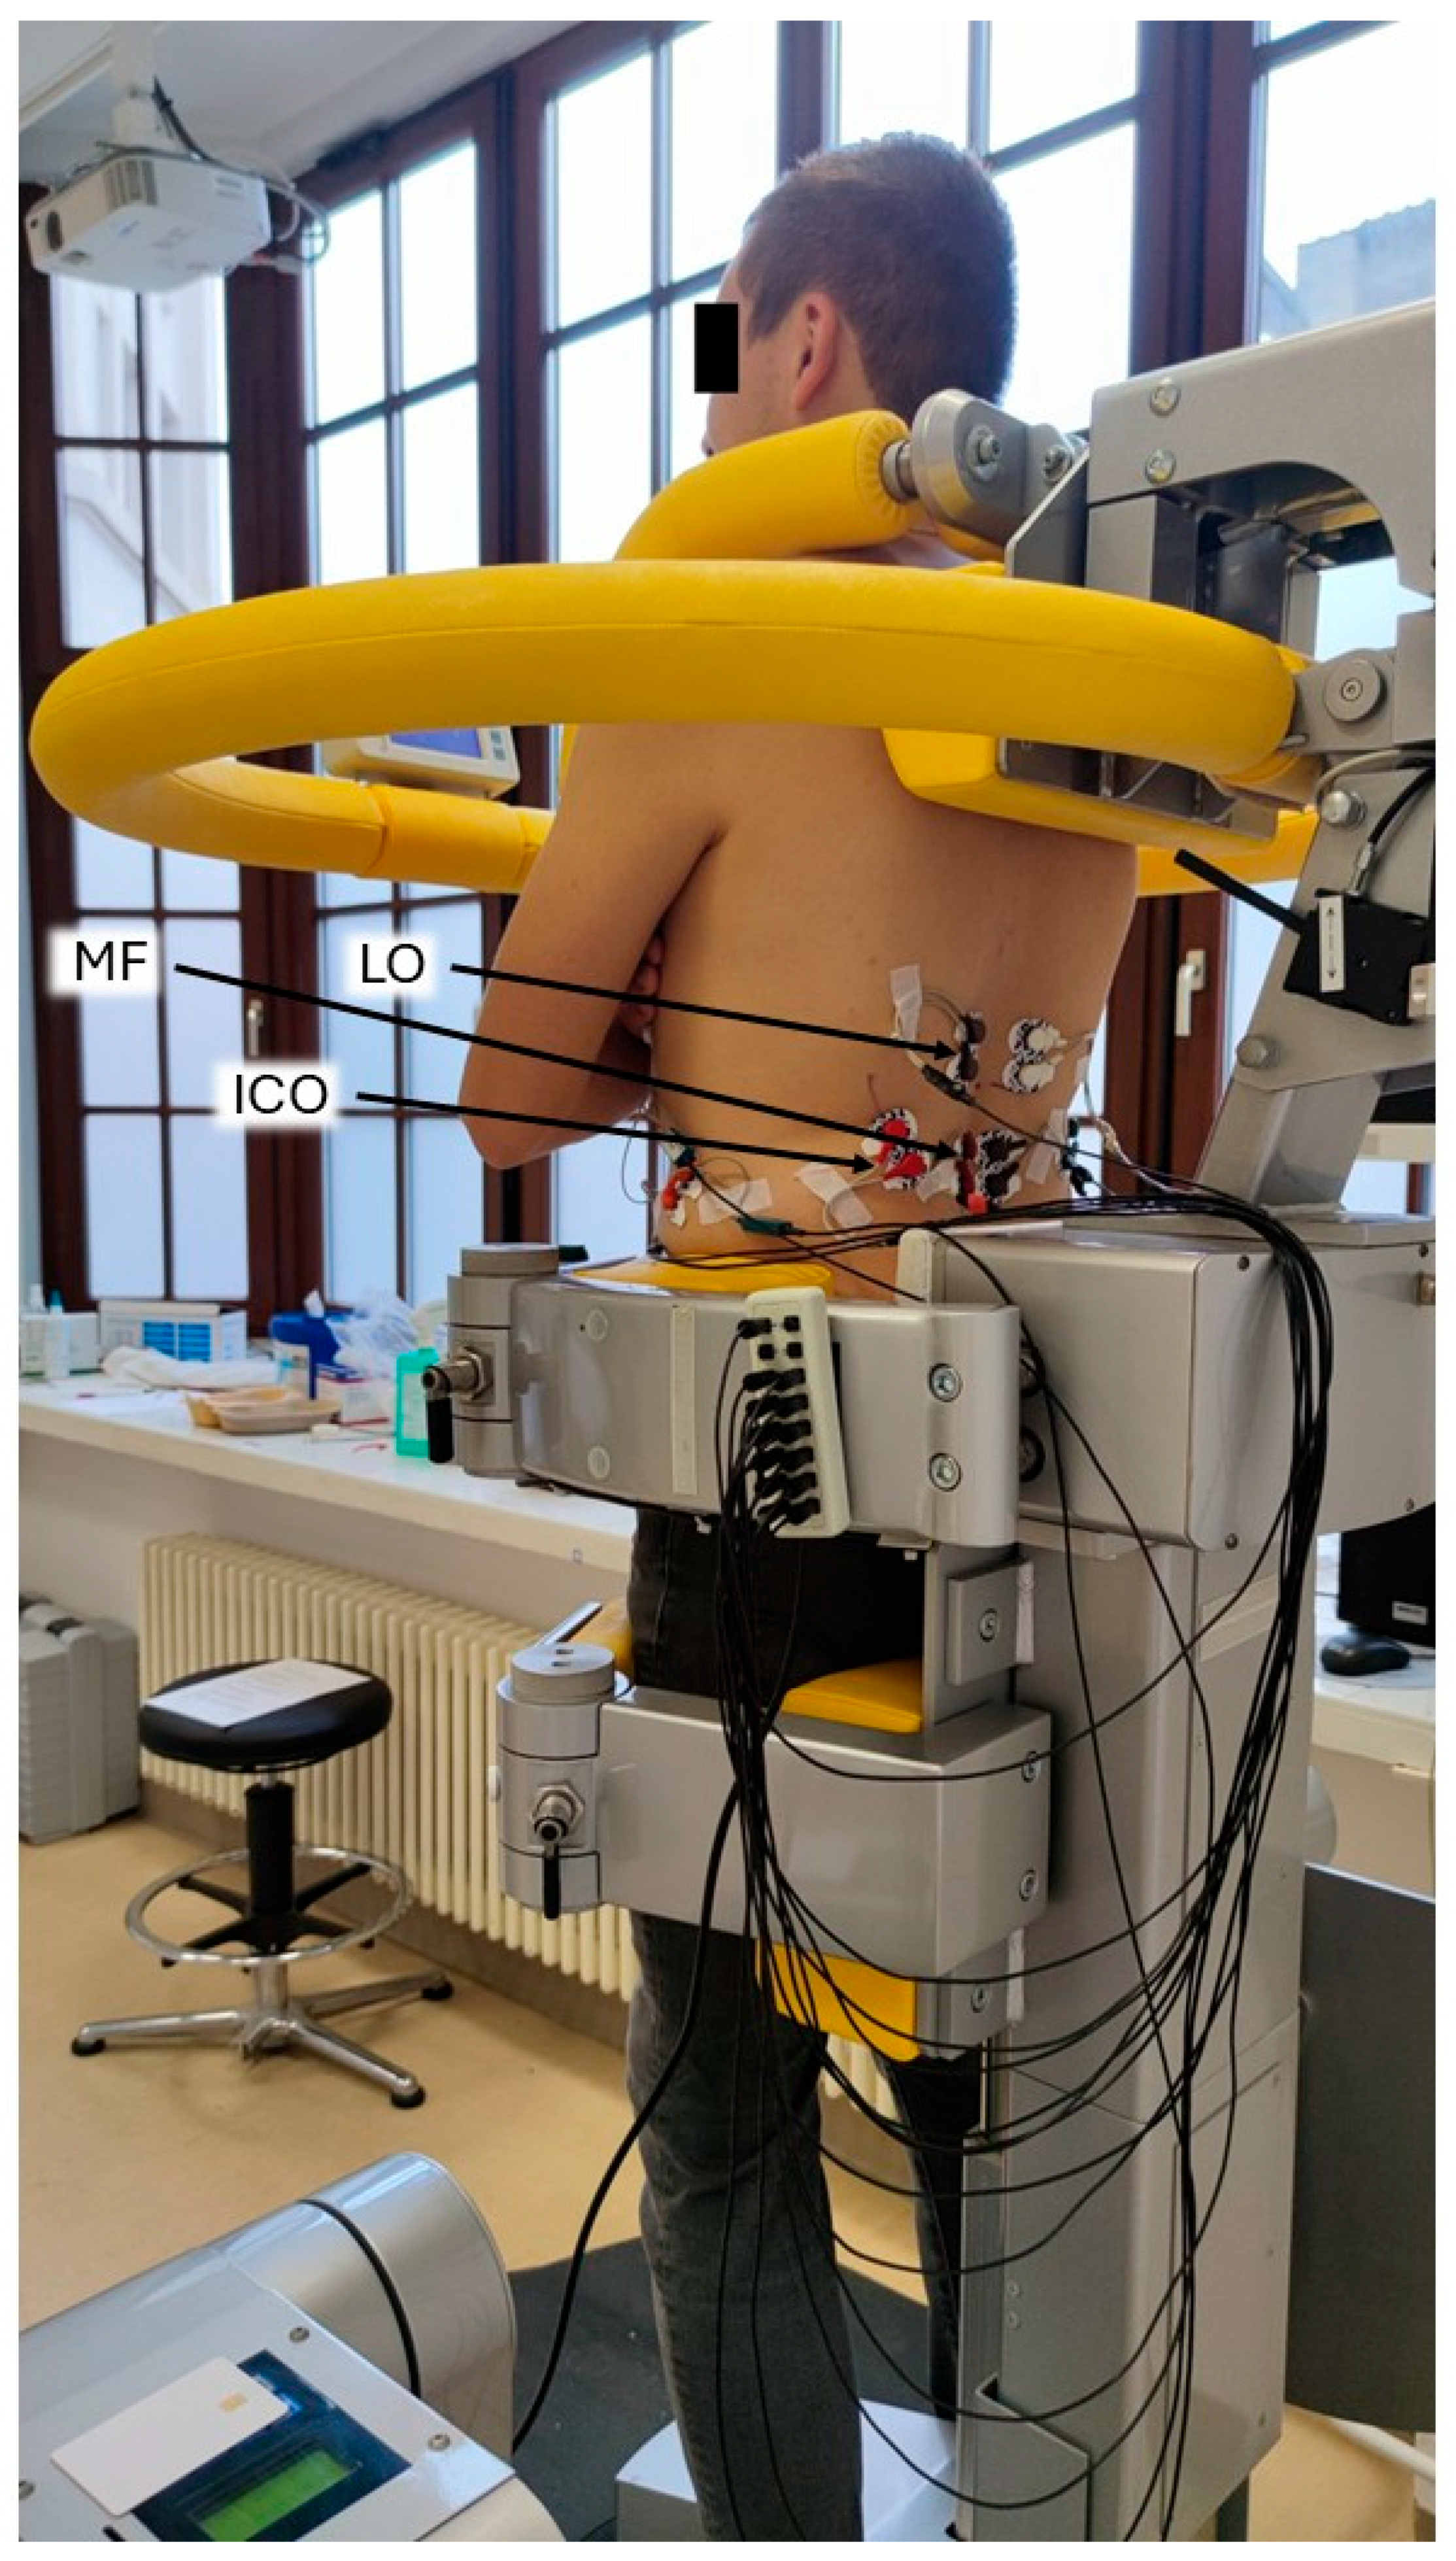
All measurements were performed using a computer-assisted test and training device (CTT Centaur, BfmC, Leipzig, Germany). Participants stood upright in the device with the lower body fixed and the upper body remaining mobile to a limited extent. A shoulder harness was placed on the shoulders which contained force sensors for measurements in the sagittal and frontal planes (Figure 1). During all measurements, participants kept their arms crossed in front of the chest.
Figure 1.
Aspect of participant in the device from left behind with arms crossed in front of chest in an untilted (home) position. Note the shoulder harness. This harness contains force sensors measuring in both the x- and y-directions. The left-sided muscles are labeled: ICO: iliocostalis muscle, MF: multifidus muscle, LO: longissimus muscle.
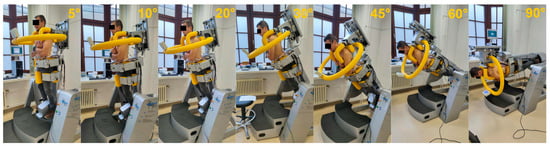
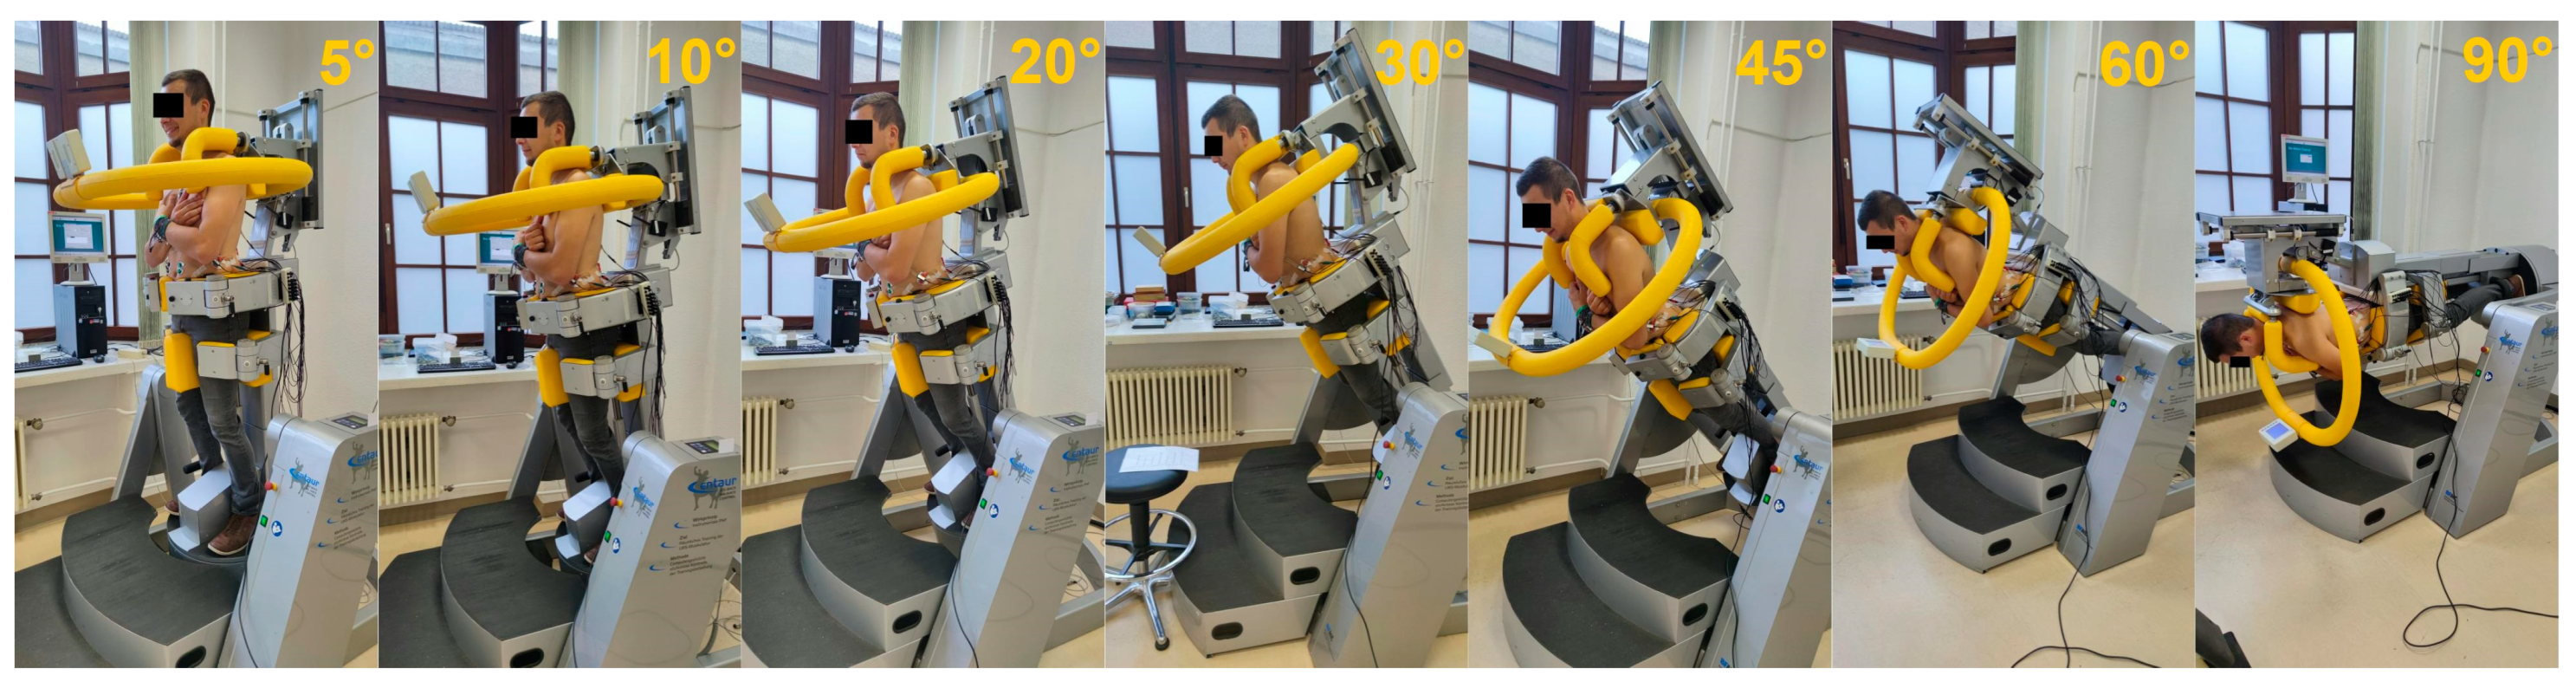
The device allows controlled inclinations up to 90°. In the present study, tilt angles of 5°, 10°, 20°, 30°, 45°, 60°, and 90° were applied, corresponding to 9%, 17%, 34%, 50%, 71%, 87%, and 100% of upper-body weight, respectively (Figure 2). Because the device tilts the whole body, participants remained fully aligned in an upright posture throughout, with the arms crossed in front of the chest (Figure 2).
Figure 2.
Applied tilt angles. Participants had to compensate for increasing gravitational forces with tilt angle by extending their upper body along body axis. Tilt angles are indicated in every subfigure.
Maximal trunk extension force was assessed after the submaximal loading tasks. MVC was measured in three consecutive five-second trials separated by five-second rest intervals. Participants were instructed to reach maximal force within approximately one second, maintain it for two to three seconds, and then relax. Verbal encouragement was provided during each trial [39,40,41]. To familiarize participants with the procedure, the first trial was performed as a practice trial at approximately 50% of maximal effort [42].
Upper-body weight (UBW) was assessed by tilting the CTT Centaur forward to 90°, placing participants in a horizontal position while they rested passively in the shoulder harness with the arms and head hanging freely. In this relaxed posture, UBW was recorded. At this stage, SEMG electrodes were already attached, allowing signal monitoring to detect residual muscle activity. Any remaining contractions were announced to the participants and considered to ensure full relaxation. The procedure was repeated three times, and the highest plausible value was used for further analysis. According to this procedure, UBW included the torso, arms, and head.
All measured force values (MVC and UBW) were converted to torque values to account for differences in body proportions and to allow direct comparison across participants.
2.2. SEMG Measurement and Analysis
SEMG was recorded in a standard bipolar configuration. Measurements were obtained using either a wired system (DeMeTec, Langgöns, Germany; sampling rate 2000 Hz, 24-bit resolution, ±5 V; sub-studies 4348-02/15 and 2021-2373-BO) or a wireless system (Cometa Srl., Bareggio, Italy; sampling rate 2000 Hz, 12-bit resolution, ±2.5 V; sub-studies 2021-2373_1, 2024-3462-BO, and 2024-3634-BO-A).
Skin preparation followed international recommendations [43,44] and included shaving the measurement sites and abrading the skin with abrasive paste (Nihon Kohden Europe GmbH, Rosbach, Germany). Electrode placement was based on international guidelines [43,44,45] and was performed consistently by the same experienced investigator. For the present analysis, bilateral recordings were obtained from the iliocostalis (ICO), multifidus (MF), and longissimus (LO) muscles (Figure 1). Disposable Ag/AgCl electrodes (H93SG, Arbo, Germany) with a circular conductive area (diameter 1.6 cm) and an interelectrode distance of 2.5 cm were used.
Raw SEMG signals were band-pass filtered (20–350 Hz), centered, and processed with a 50 Hz notch filter to reduce power-line interference.
Only steady-state segments were analyzed. To minimize contamination by cardiac activity, QRS complexes were identified and marked. SEMG amplitude was then quantified in 0.3 s segments starting 0.1 s after each marked event. For each muscle and condition, the root mean square (RMS) was calculated across all valid segments and used for further analysis.
2.3. Analyzed Parameters
SEMG amplitudes from both the submaximal tasks and the MVC trials were analyzed. In addition, MVC-normalized SEMG amplitudes were related to MVC-normalized force levels across the applied tilt angles to examine the amplitude-force relationship.
For group comparisons, subgroups were defined by sex (women: n = 115; men: n = 124), age (youngest and oldest 10% edge groups; n = 24 each), force capacity (highest vs. lowest MVC values), upper-body torque ratio (UBTR), and BMI (low vs. high groups). UBTR was defined as the ratio of MVC torque to UBW torque. For the MVC and UBTR comparisons, the good end and bad end groups represented participants with the highest and lowest values, respectively.
2.4. Statistical Analysis
Between-group comparisons were performed using independent-samples t-tests, and effect sizes (ES) were calculated throughout [46].
To reduce the risk of Type I errors due to the large sample size, the minimal important difference (MID) was also calculated as SD/2. Observed differences were considered meaningful only if the mean difference exceeded the MID. In addition, differences were regarded as relevant only if the effect size exceeded 0.5.
Accordingly, sex-related differences were reported as significant and relevant only if all three criteria were met: p < 0.05, ES > 0.5, and mean difference > MID. For the 10% edge-group comparisons, relevance was defined by a significant p-value (p < 0.05) combined with an effect size > 0.5.
To account for multiple testing, significance levels were adjusted using the Benjamini-Hochberg procedure to control the false discovery rate [47].
3. Results
Values and group differences for age, MVC, upper-body torque (UBT), and UBTR across all defined subgroups are presented in Table 2.
Table 2.
Subgroup data for age, MVC, UBT and UBTR.
In the following, SEMG amplitudes are presented and compared according to the subgroup classifications described above. Because the applied load did not include lateral force vectors and no systematic side differences were observed, only representative data from the left side are reported.
3.1. SEMG Values per Tilt Angle
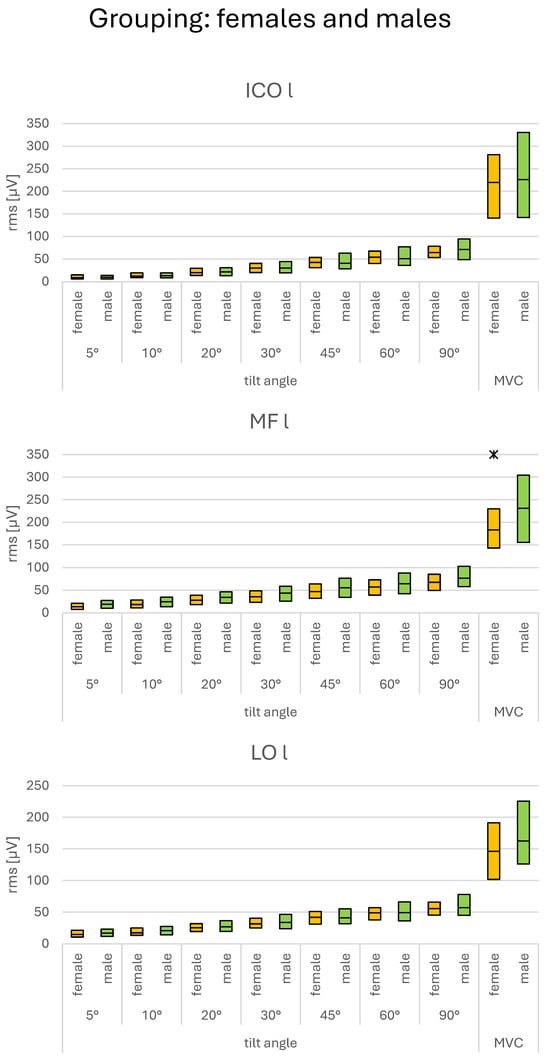
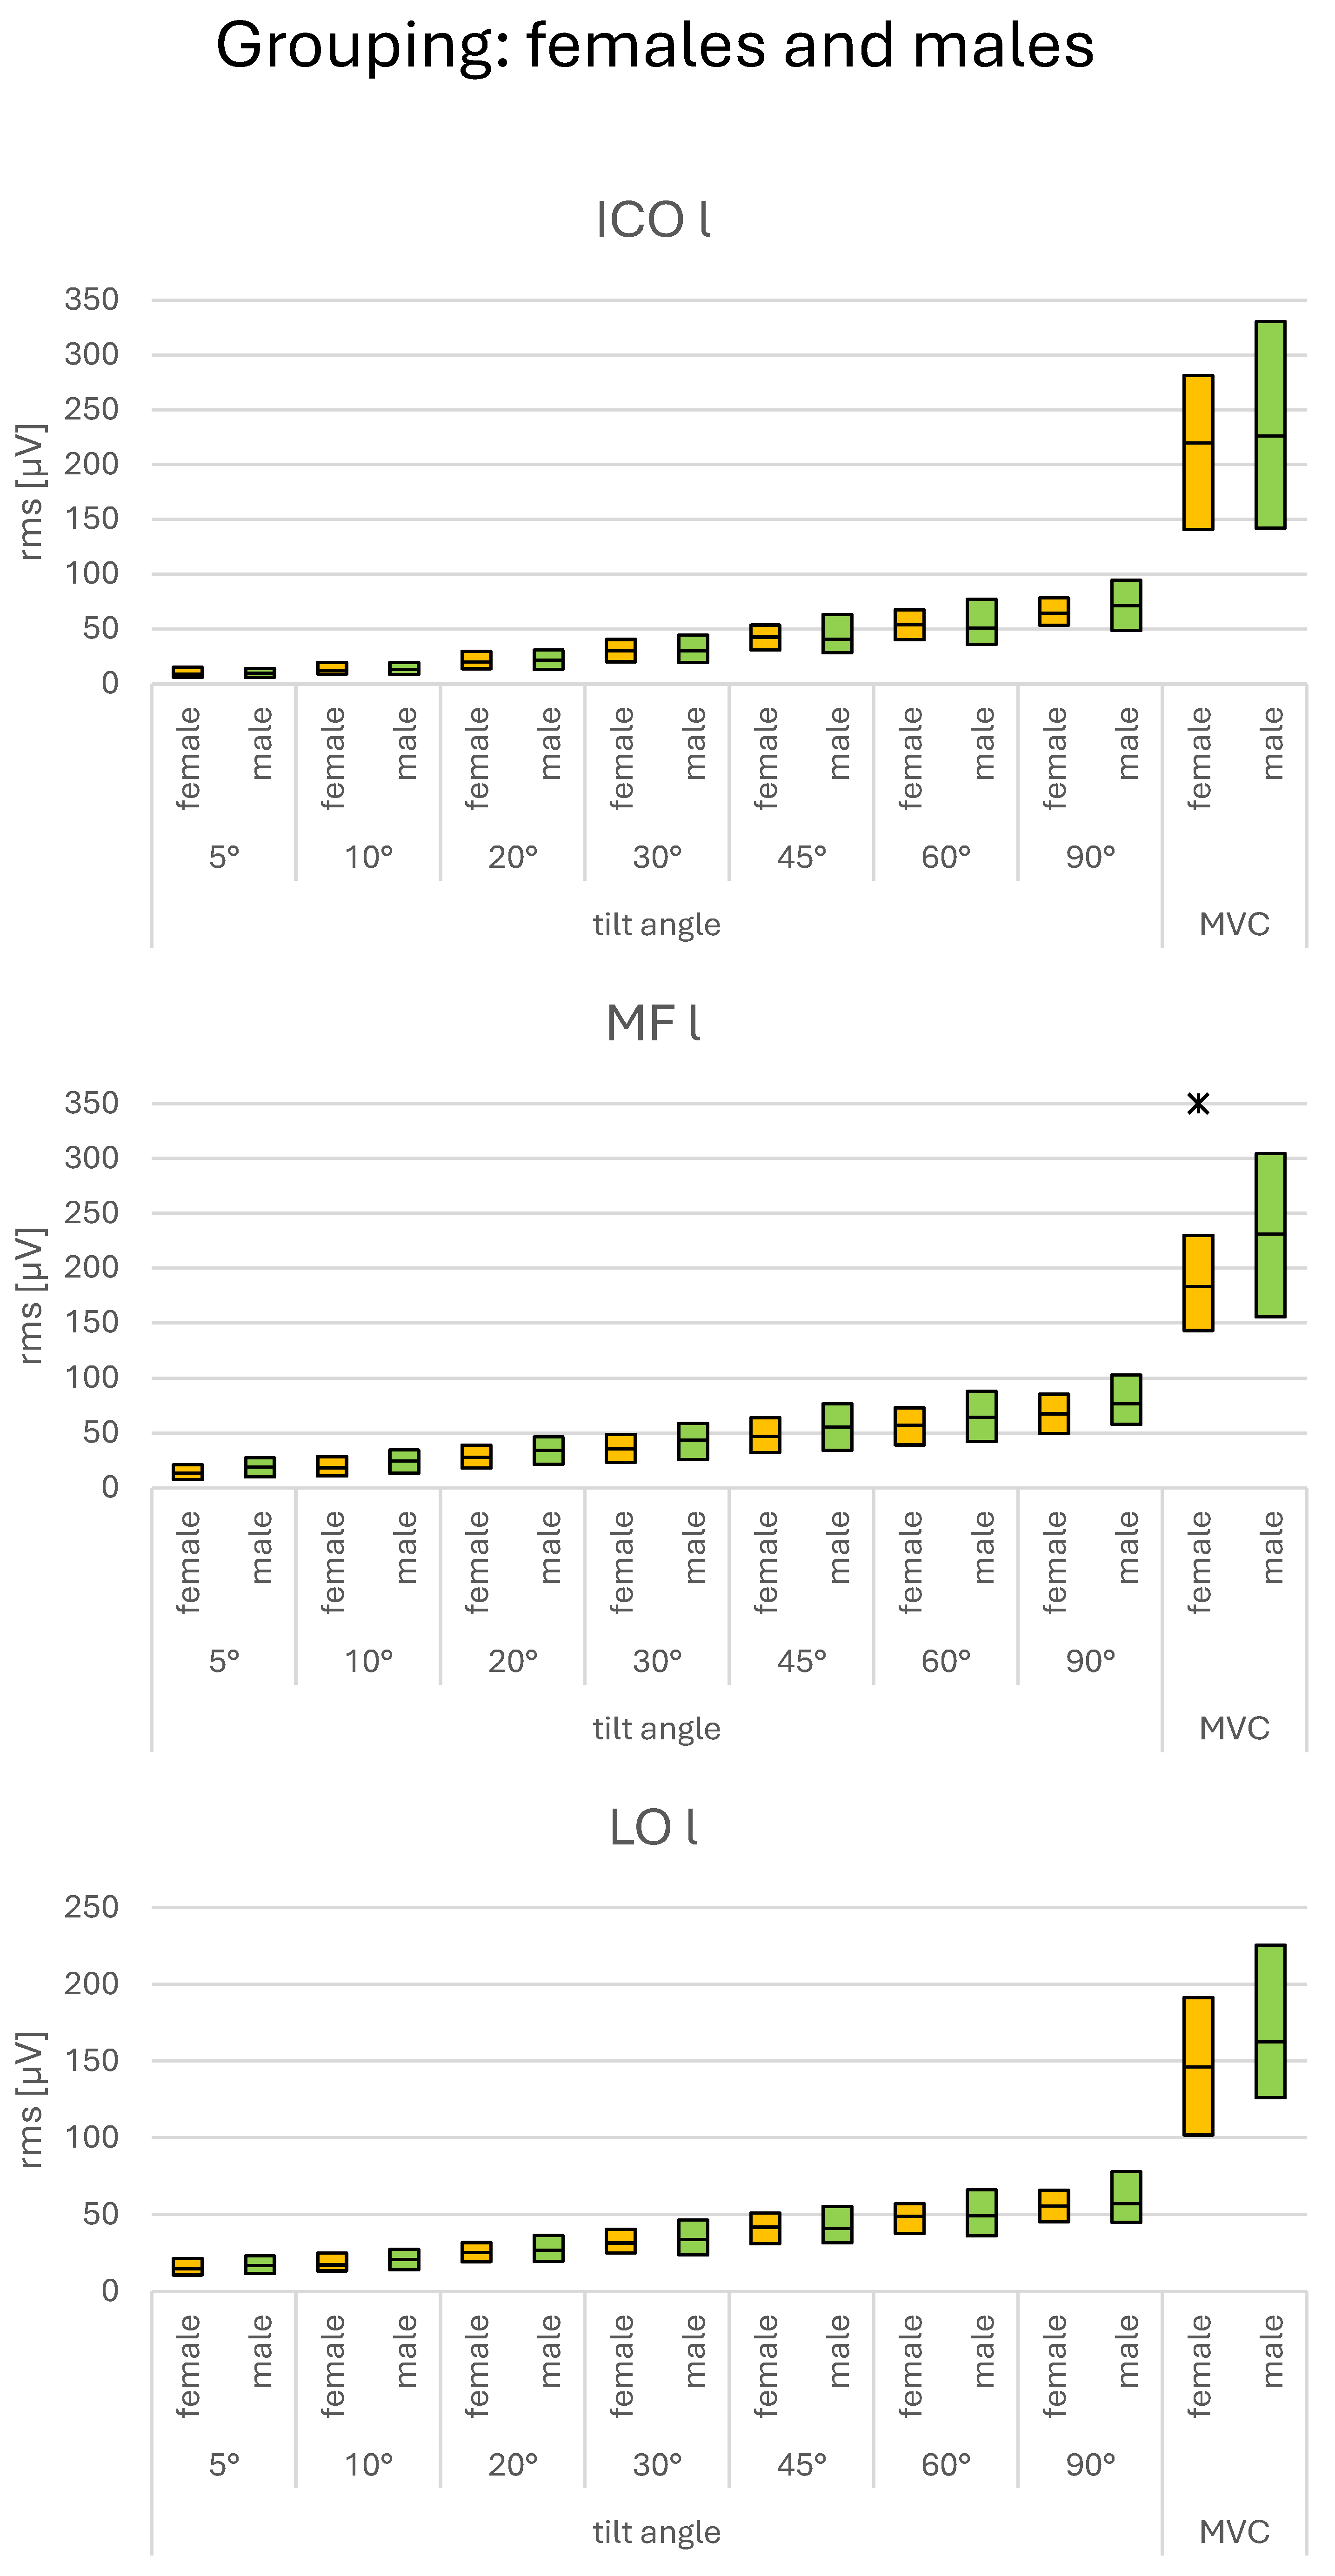
No systematic sex differences were found in SEMG amplitudes during the submaximal load conditions. The only consistent difference appeared during MVC, where men showed higher amplitudes than women (Figure 3).
Figure 3.
SEMG amplitudes during submaximal and MVC load levels. Subgroups: females and males. Relevant differences between sexes are indicated by asterisks. For definition of “relevant differences” please refer to Section 2.4.
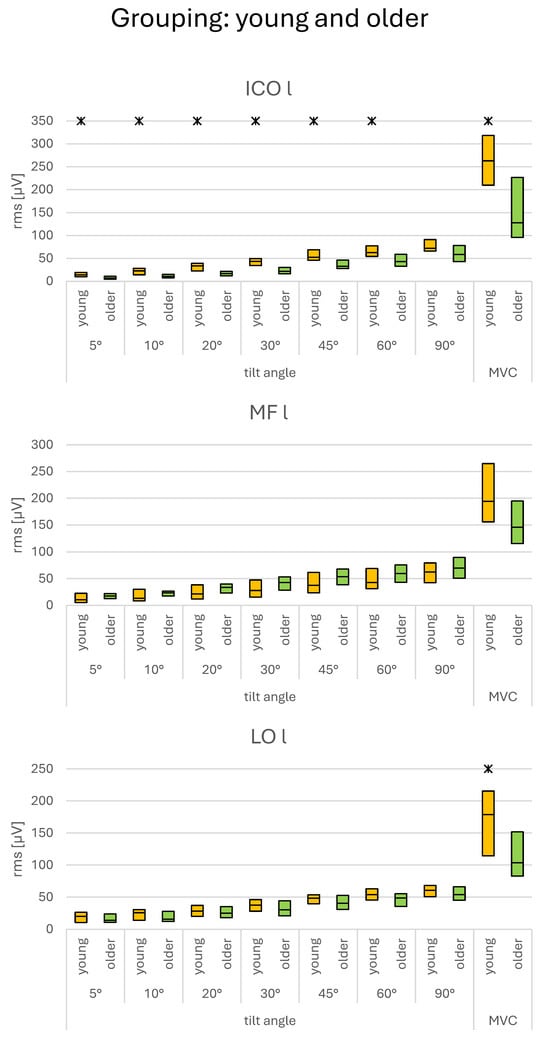
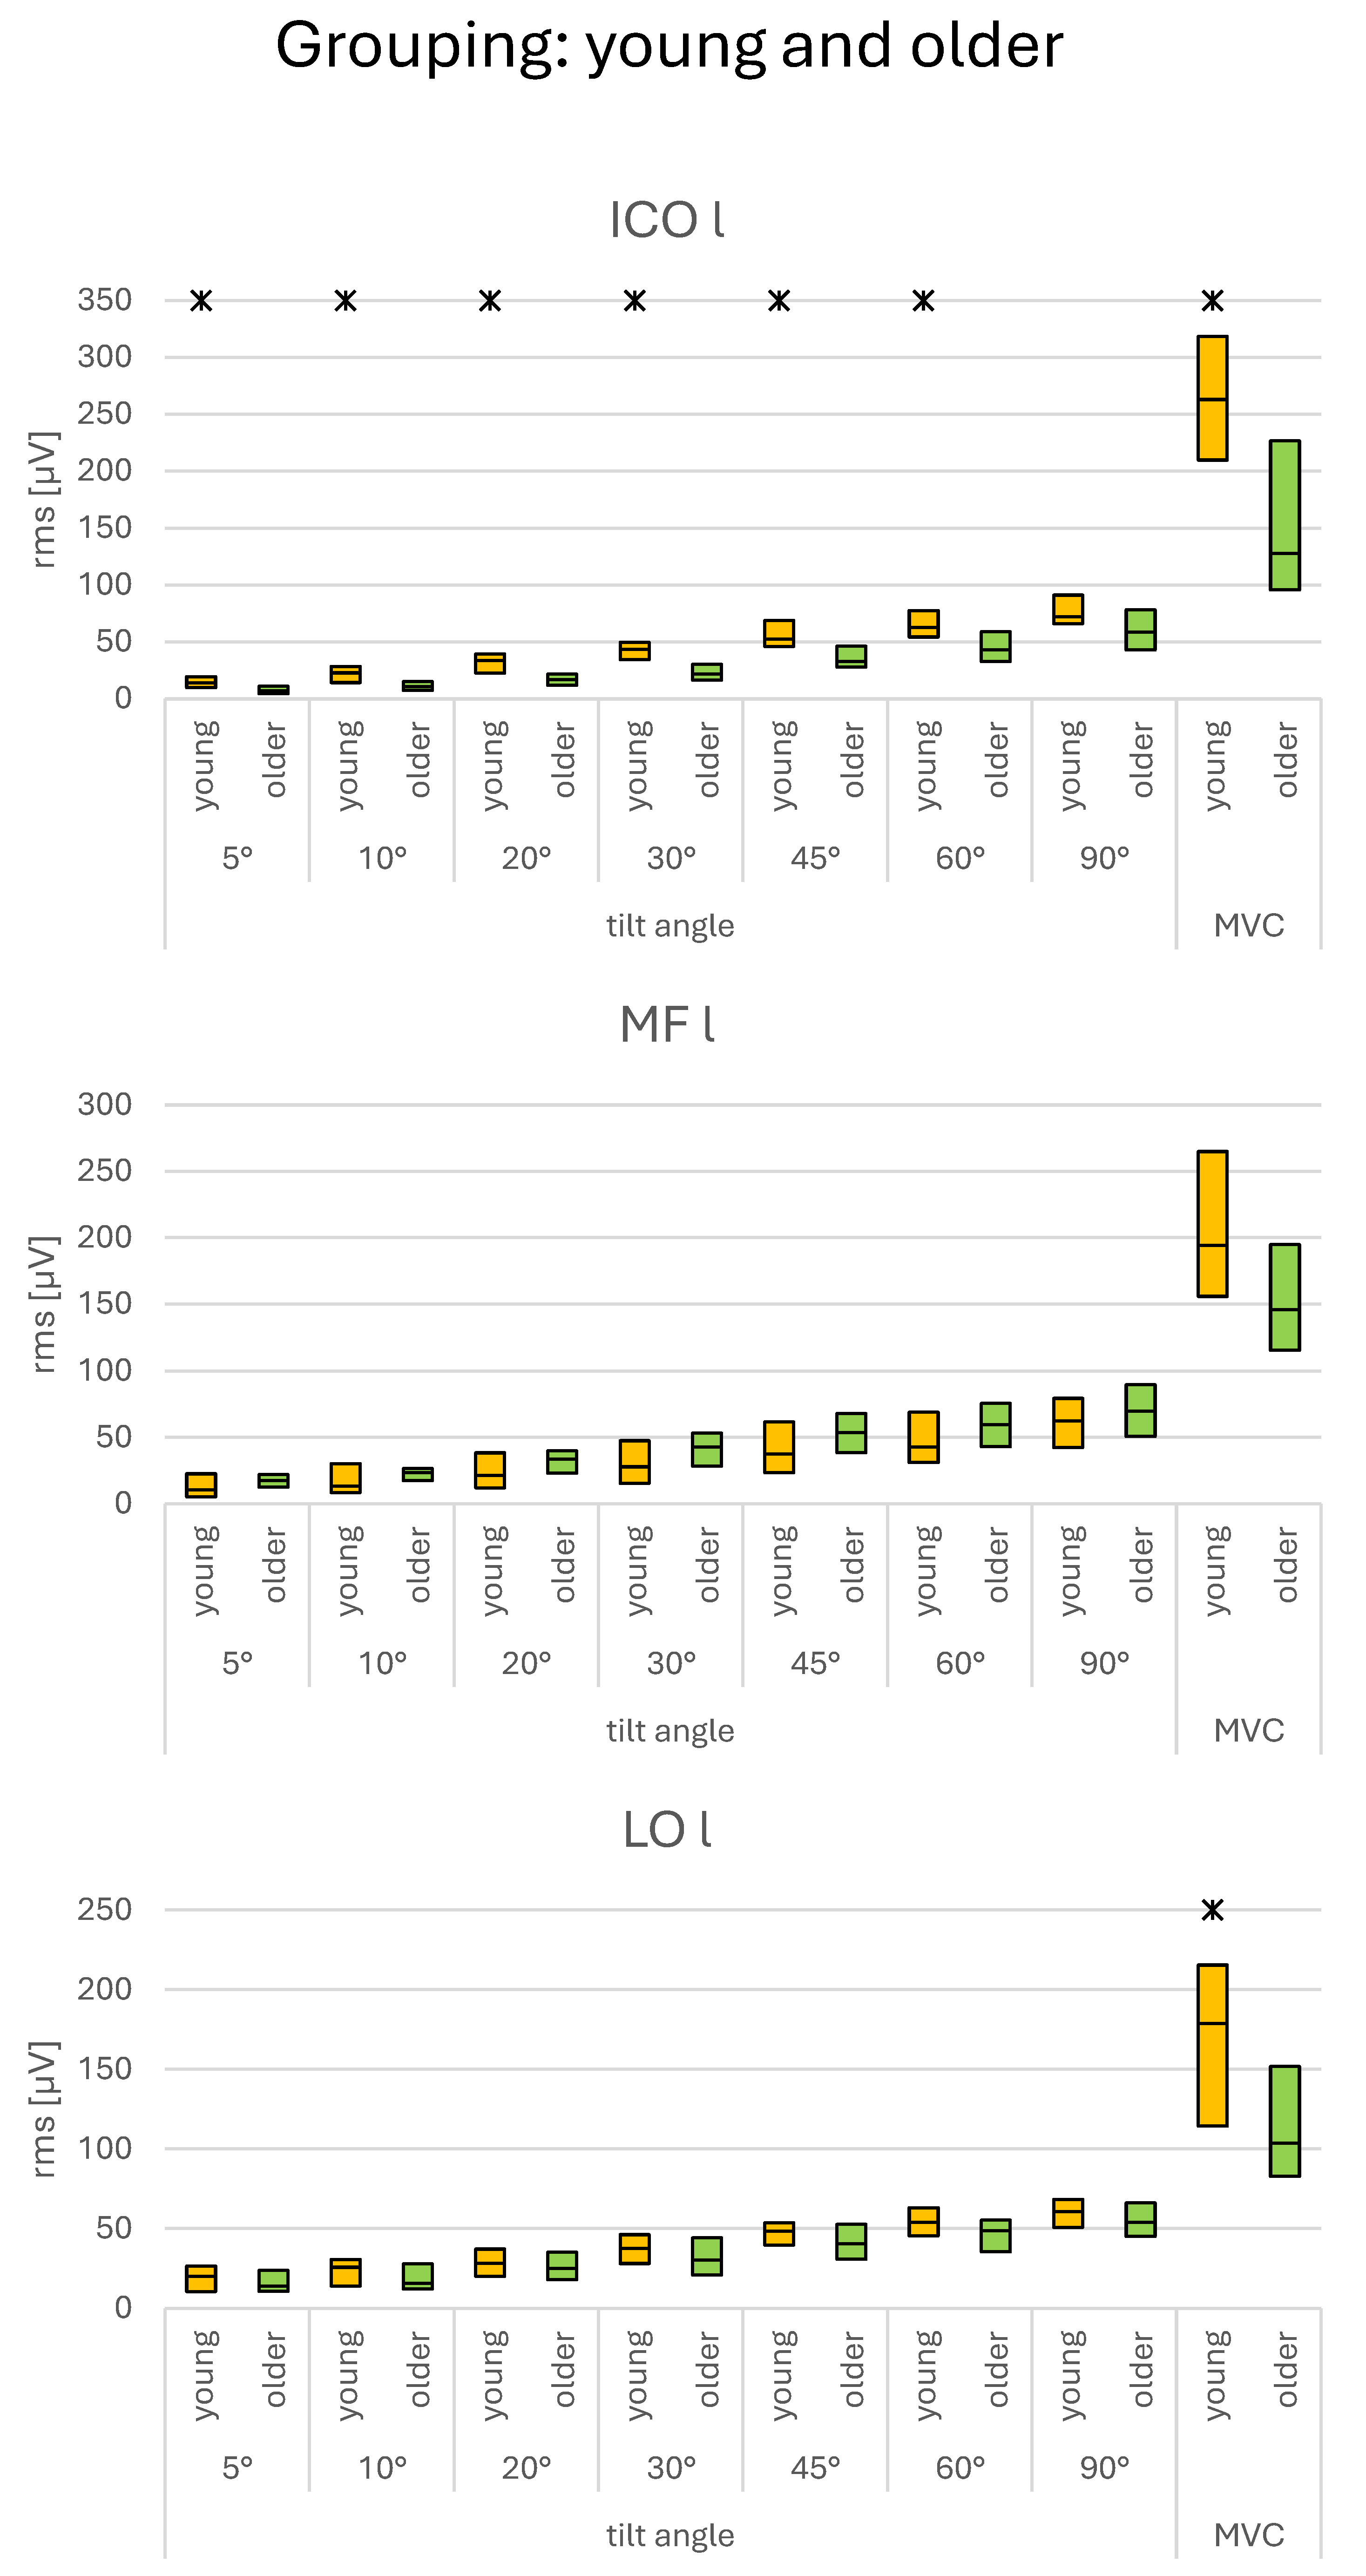
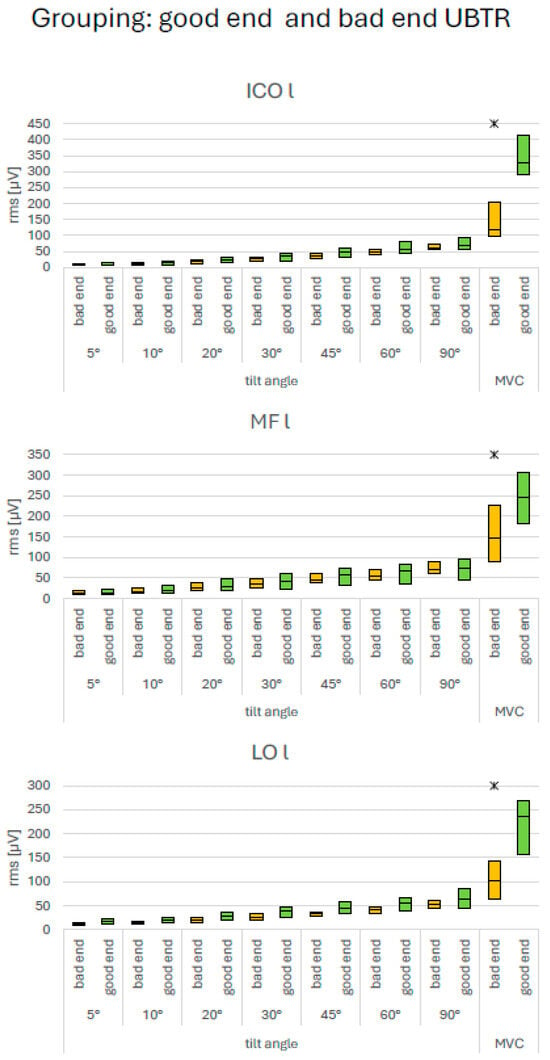
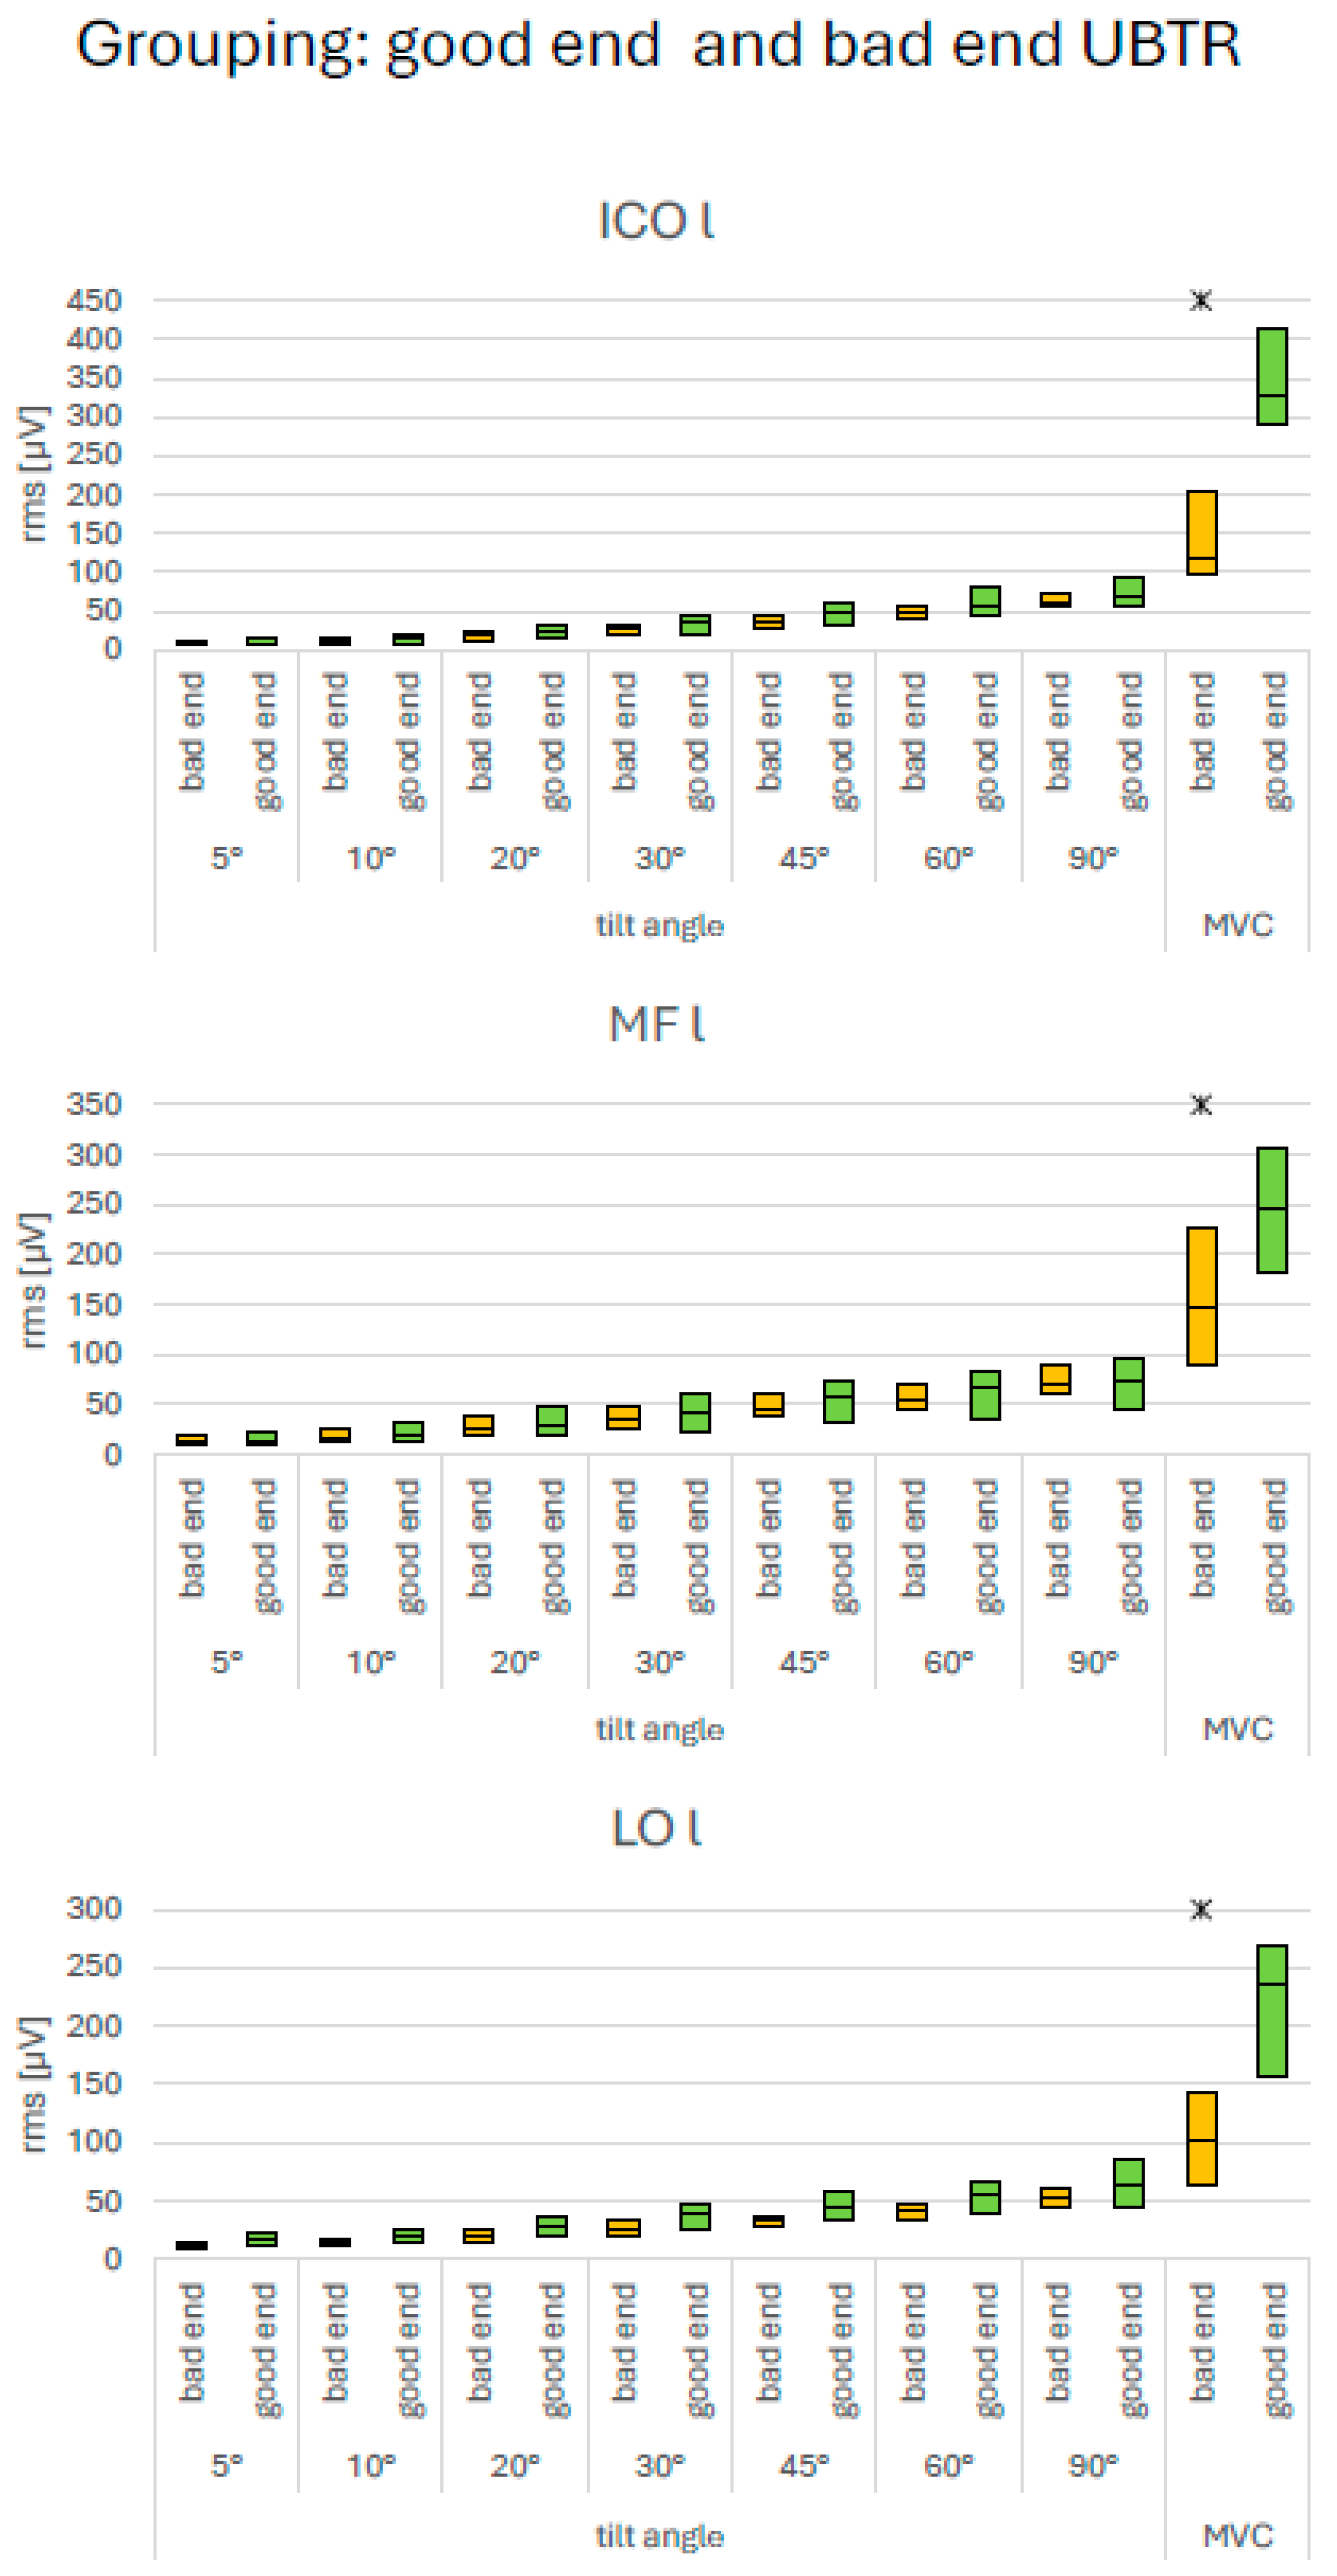
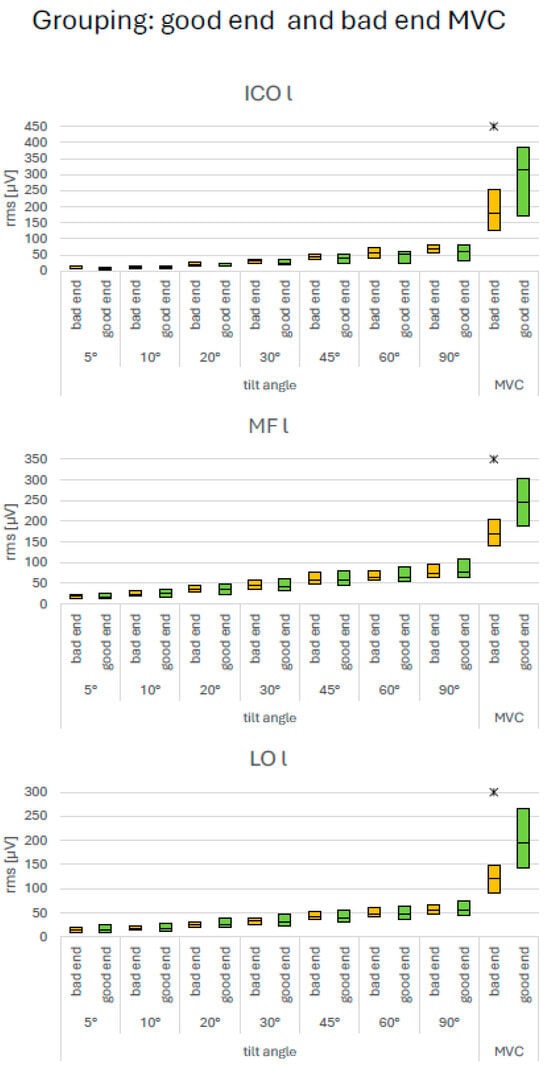
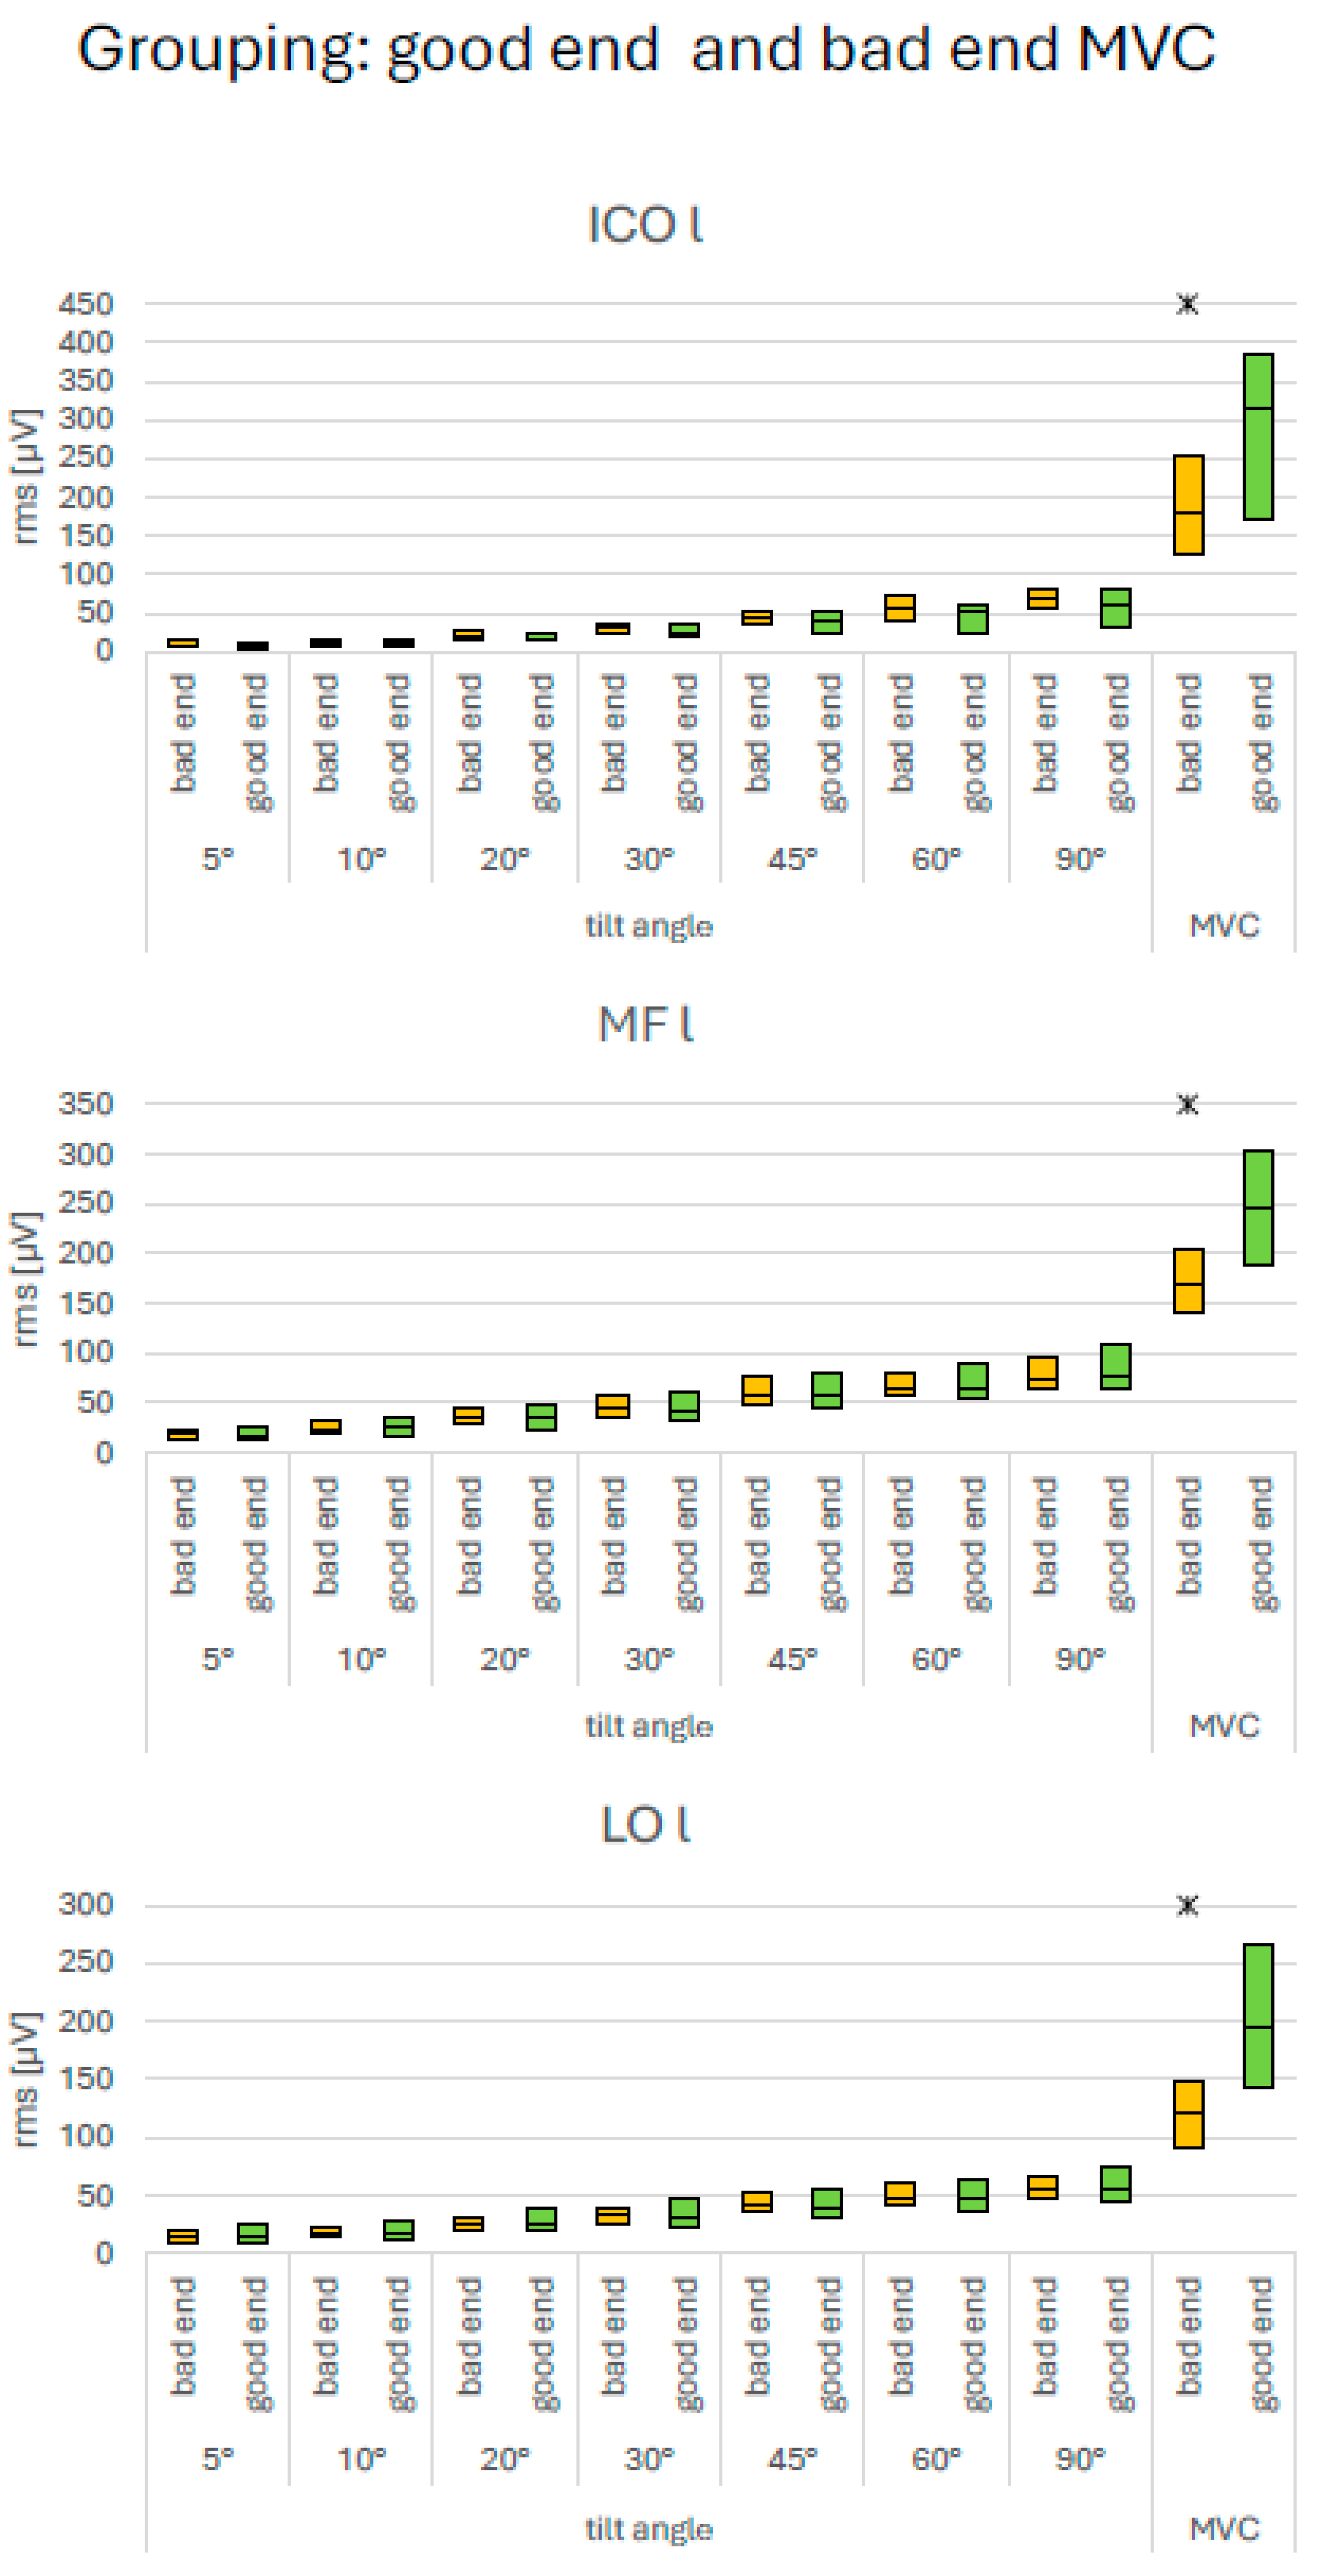
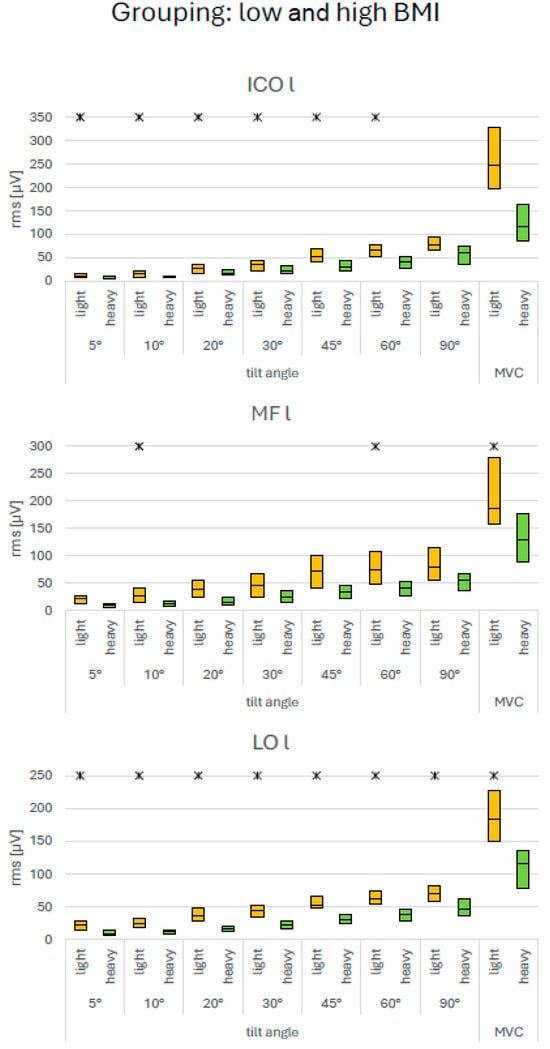
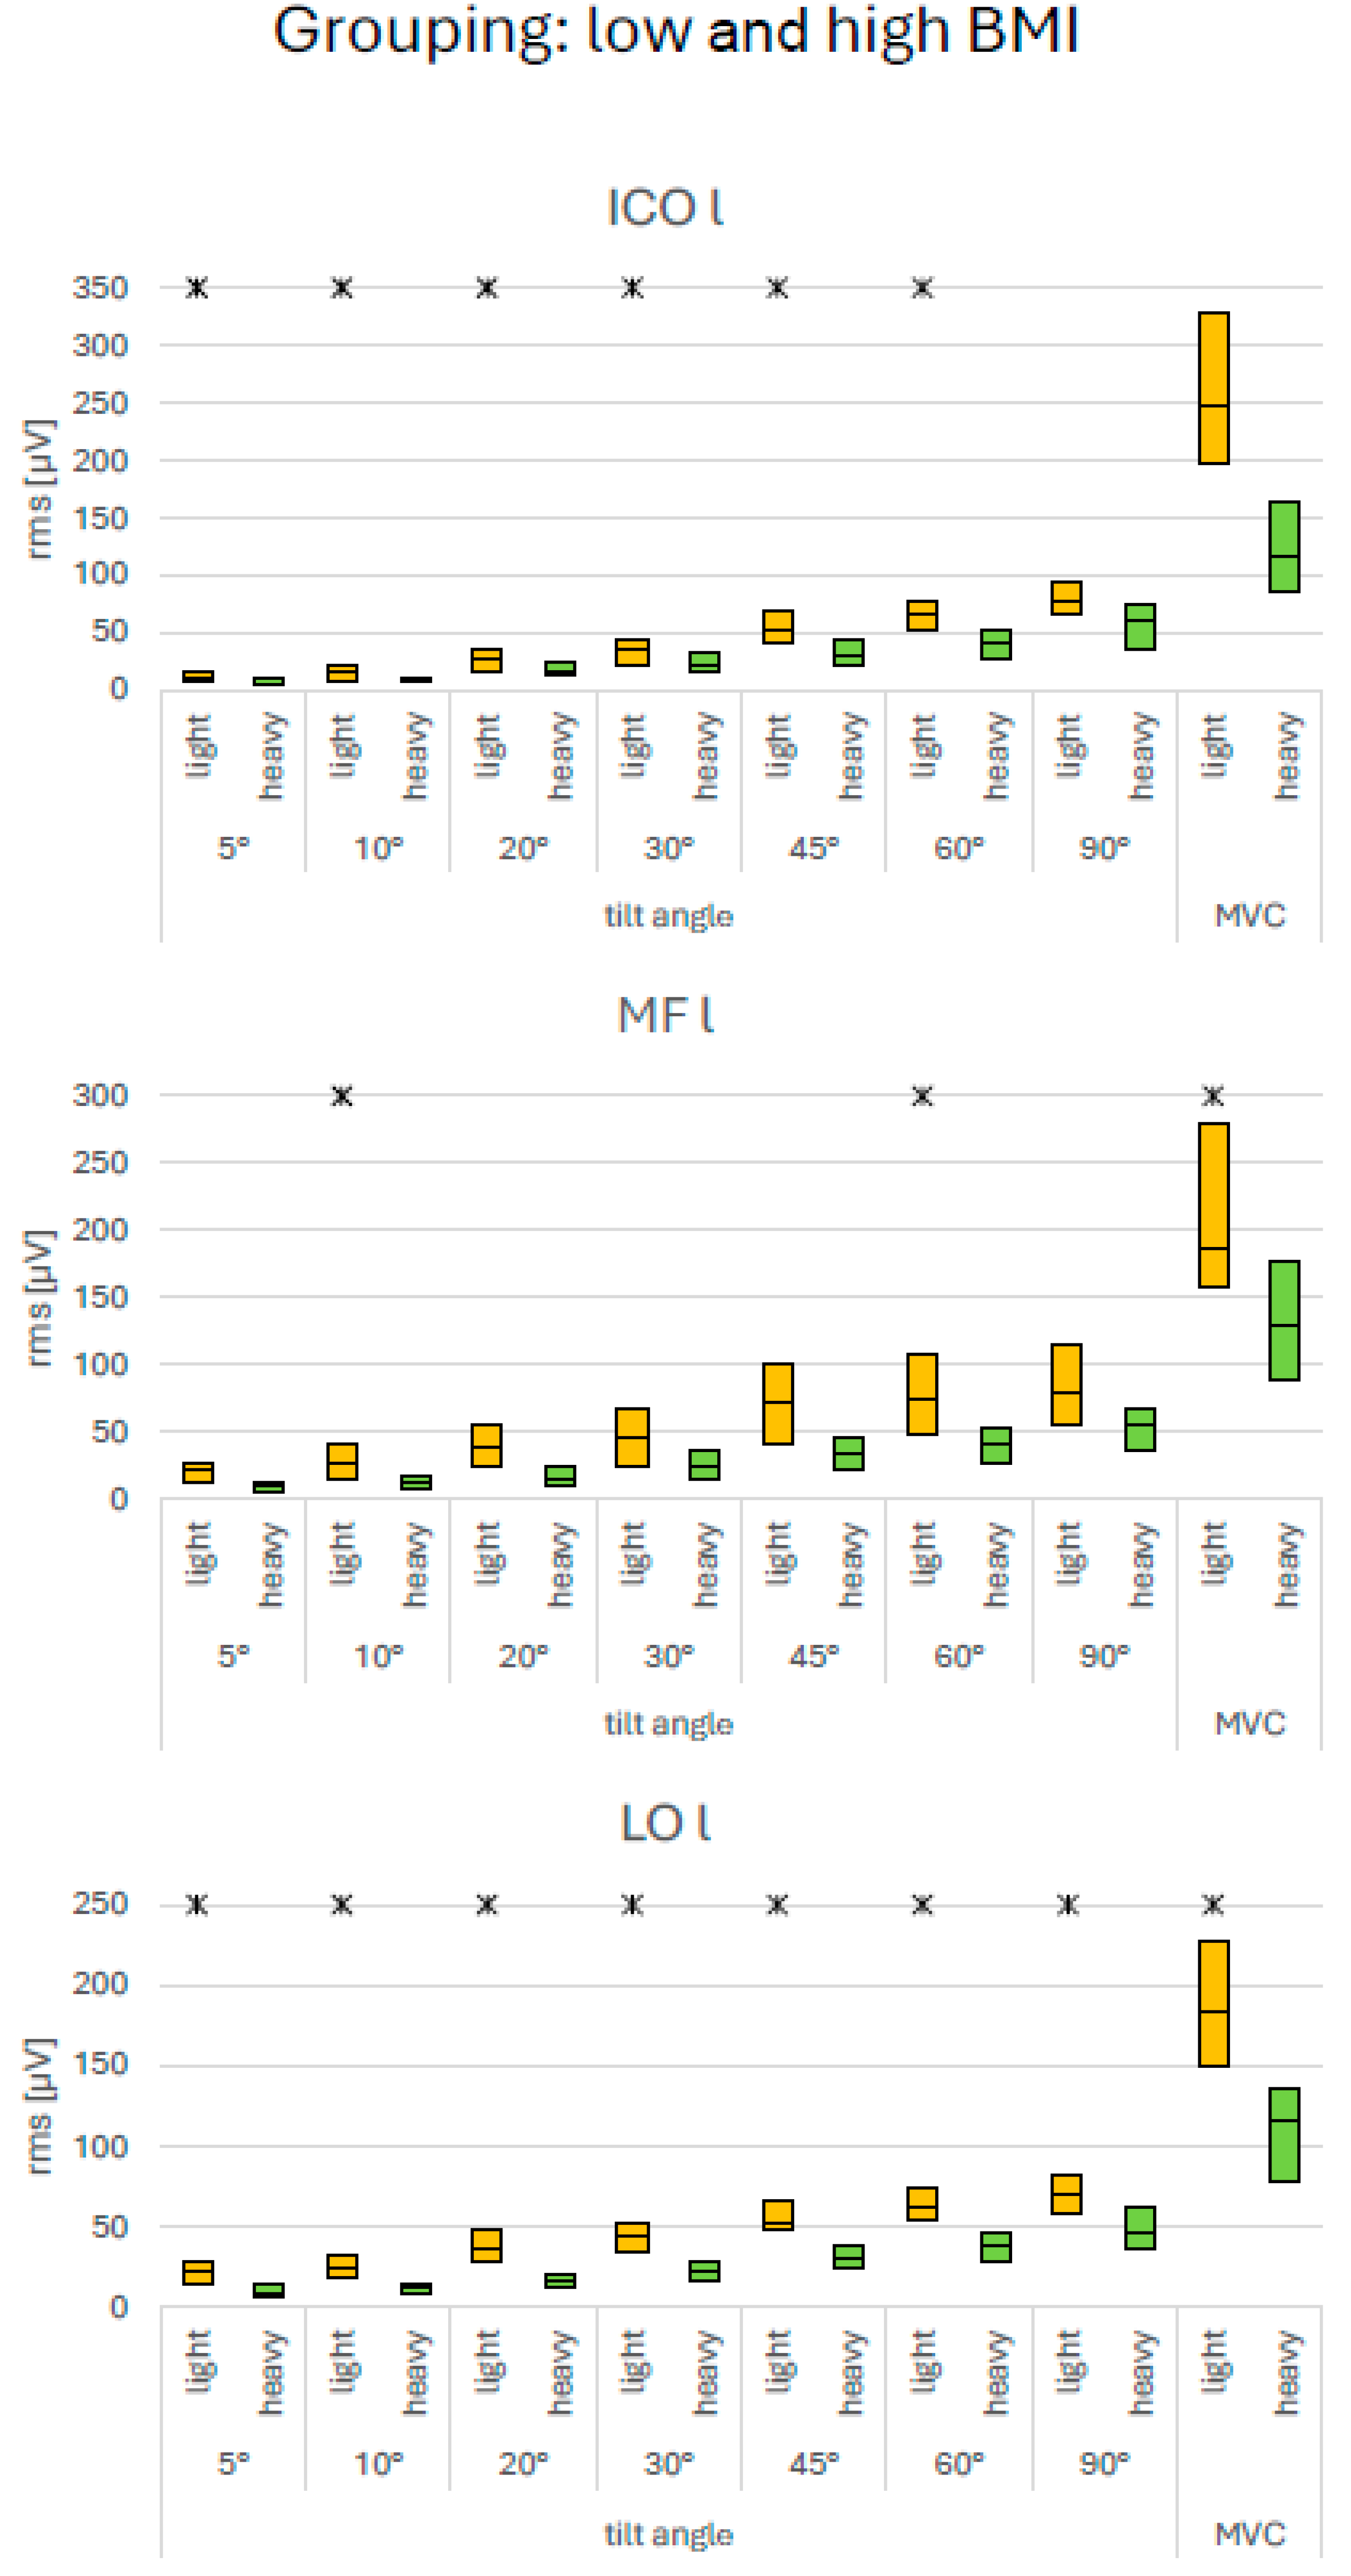
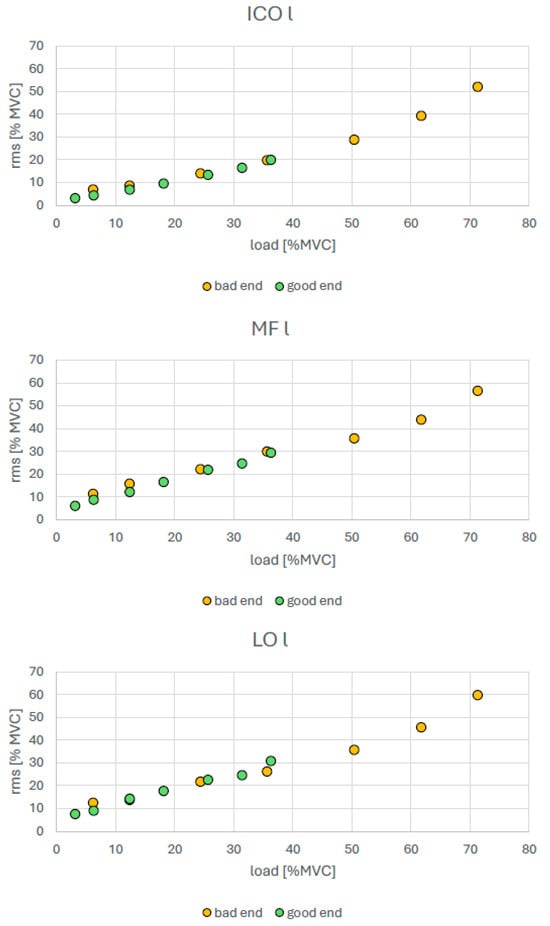
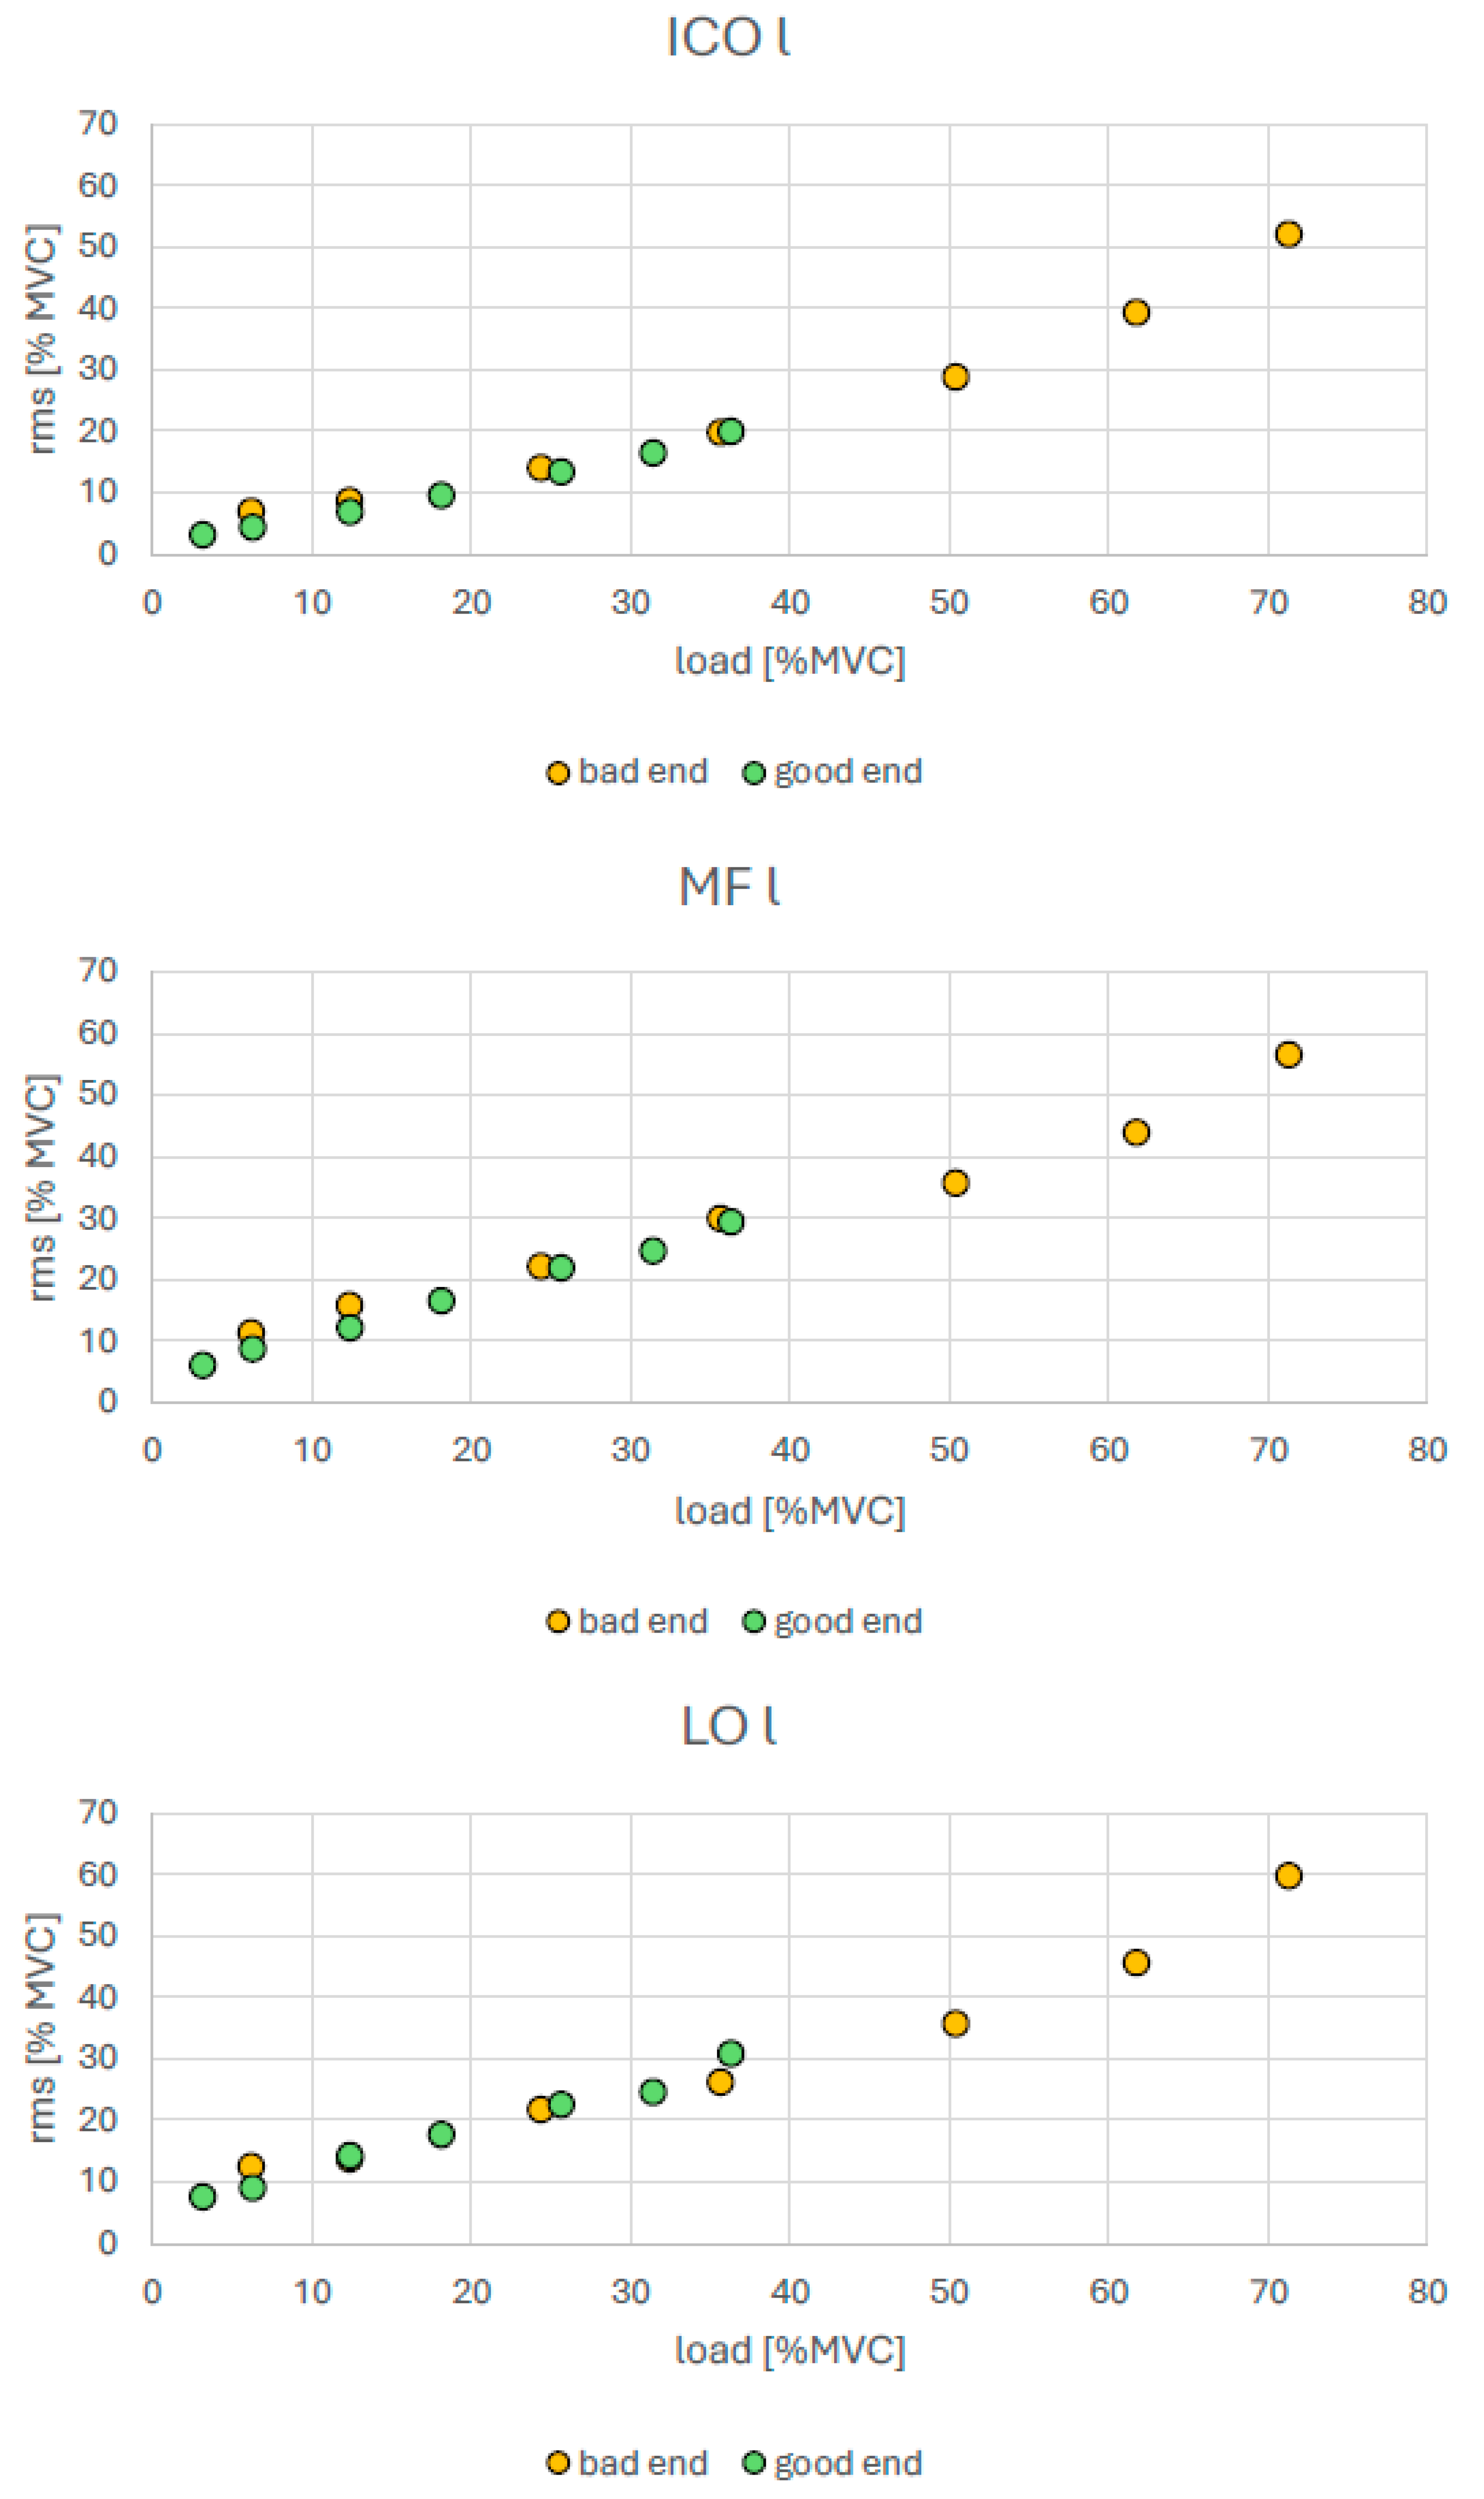
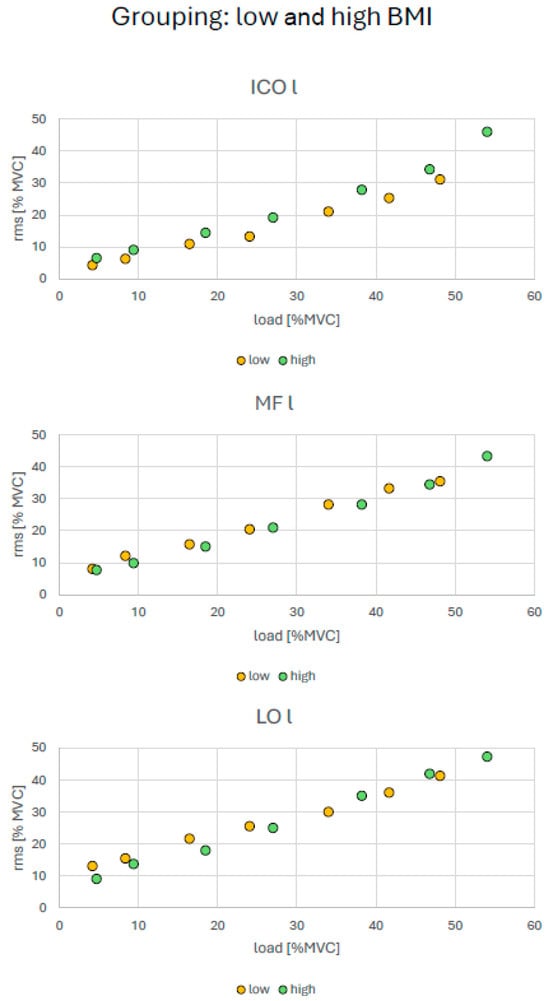
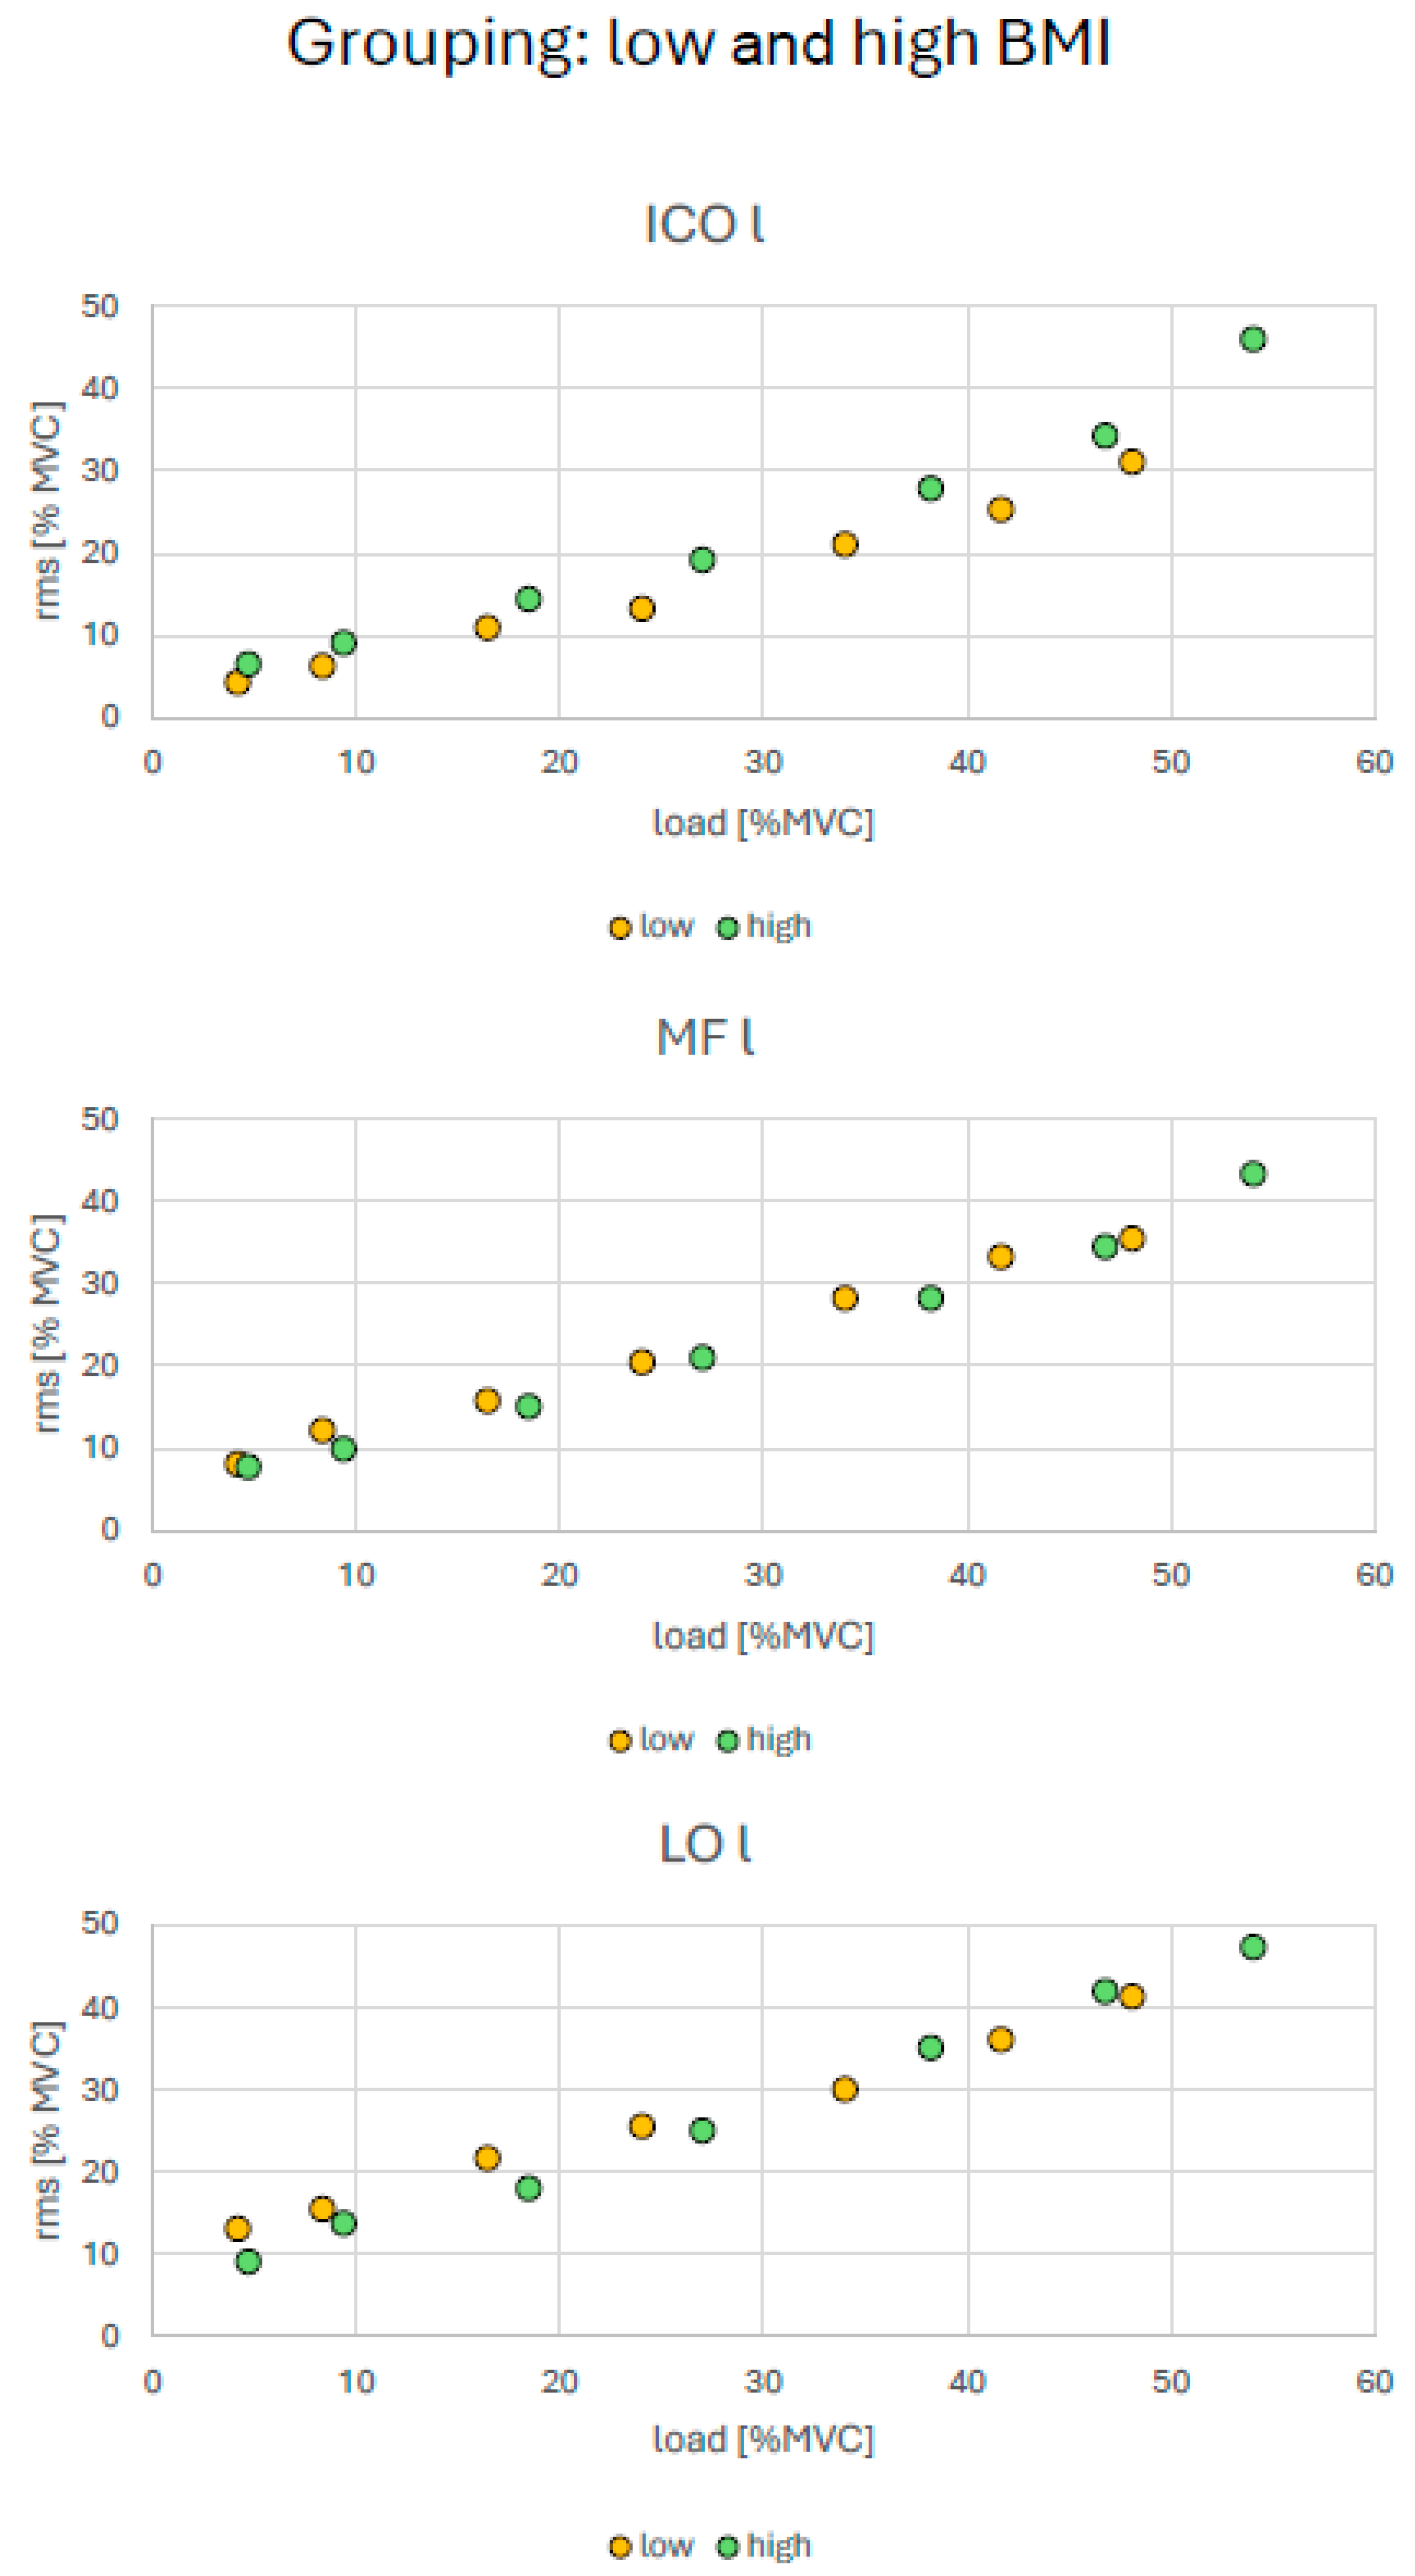
For the age-based extreme groups, iliocostalis (ICO) showed consistently higher amplitudes in the younger group across the tested conditions (Figure 4). During MVC, the younger group also exhibited relevantly higher amplitudes in both ICO and longissimus (LO). For the MVC- and UBTR-based performance groups, no relevant differences in SEMG amplitude were found in the submaximal range. In contrast, during MVC, the high-performance groups showed relevantly higher SEMG amplitudes in all three back muscles (Figure 5 and Figure 6). The low- and high-BMI groups showed relevantly larger SEMG amplitudes in the low-BMI group for ICO and LO under submaximal loading and for MF and LO during MVC (Figure 7).
Figure 4.
SEMG amplitudes during submaximal and MVC load levels. Subgroups: young and older participants. Relevant differences between age subgroups are indicated by asterisks. For definition of “relevant differences” please refer to Section 2.4.
Figure 5.
SEMG amplitudes during submaximal and MVC load levels. Subgroups: good and bad end of upper body torque ratio (UBTR). Relevant differences between both UBTR subgroups are indicated by asterisks. For definition of “relevant differences” please refer to Section 2.4.
Figure 6.
SEMG amplitudes during submaximal and MVC load levels. Subgroups: good and bad end of maximum voluntary contraction force (MVC). Relevant differences between both MVC subgroups are indicated by asterisks. For definition of “relevant differences” please refer to Section 2.4.
Figure 7.
SEMG amplitudes during submaximal and MVC load levels. Subgroups: low and high BMI values. Relevant differences between both MVC subgroups are indicated by asterisks. For definition of "relevant differences" please refer to Section 2.4.
3.2. Normalized Values
This normalization accounted, in particular, for individual anthropometric differences affecting muscular strain. Accordingly, both tilt angle and SEMG amplitude were expressed as relative values normalized to MVC.
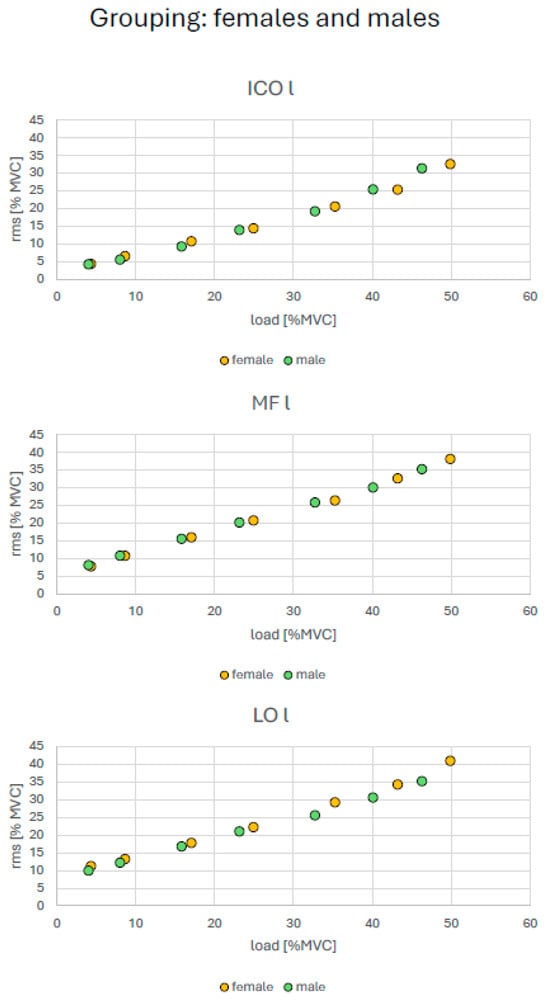
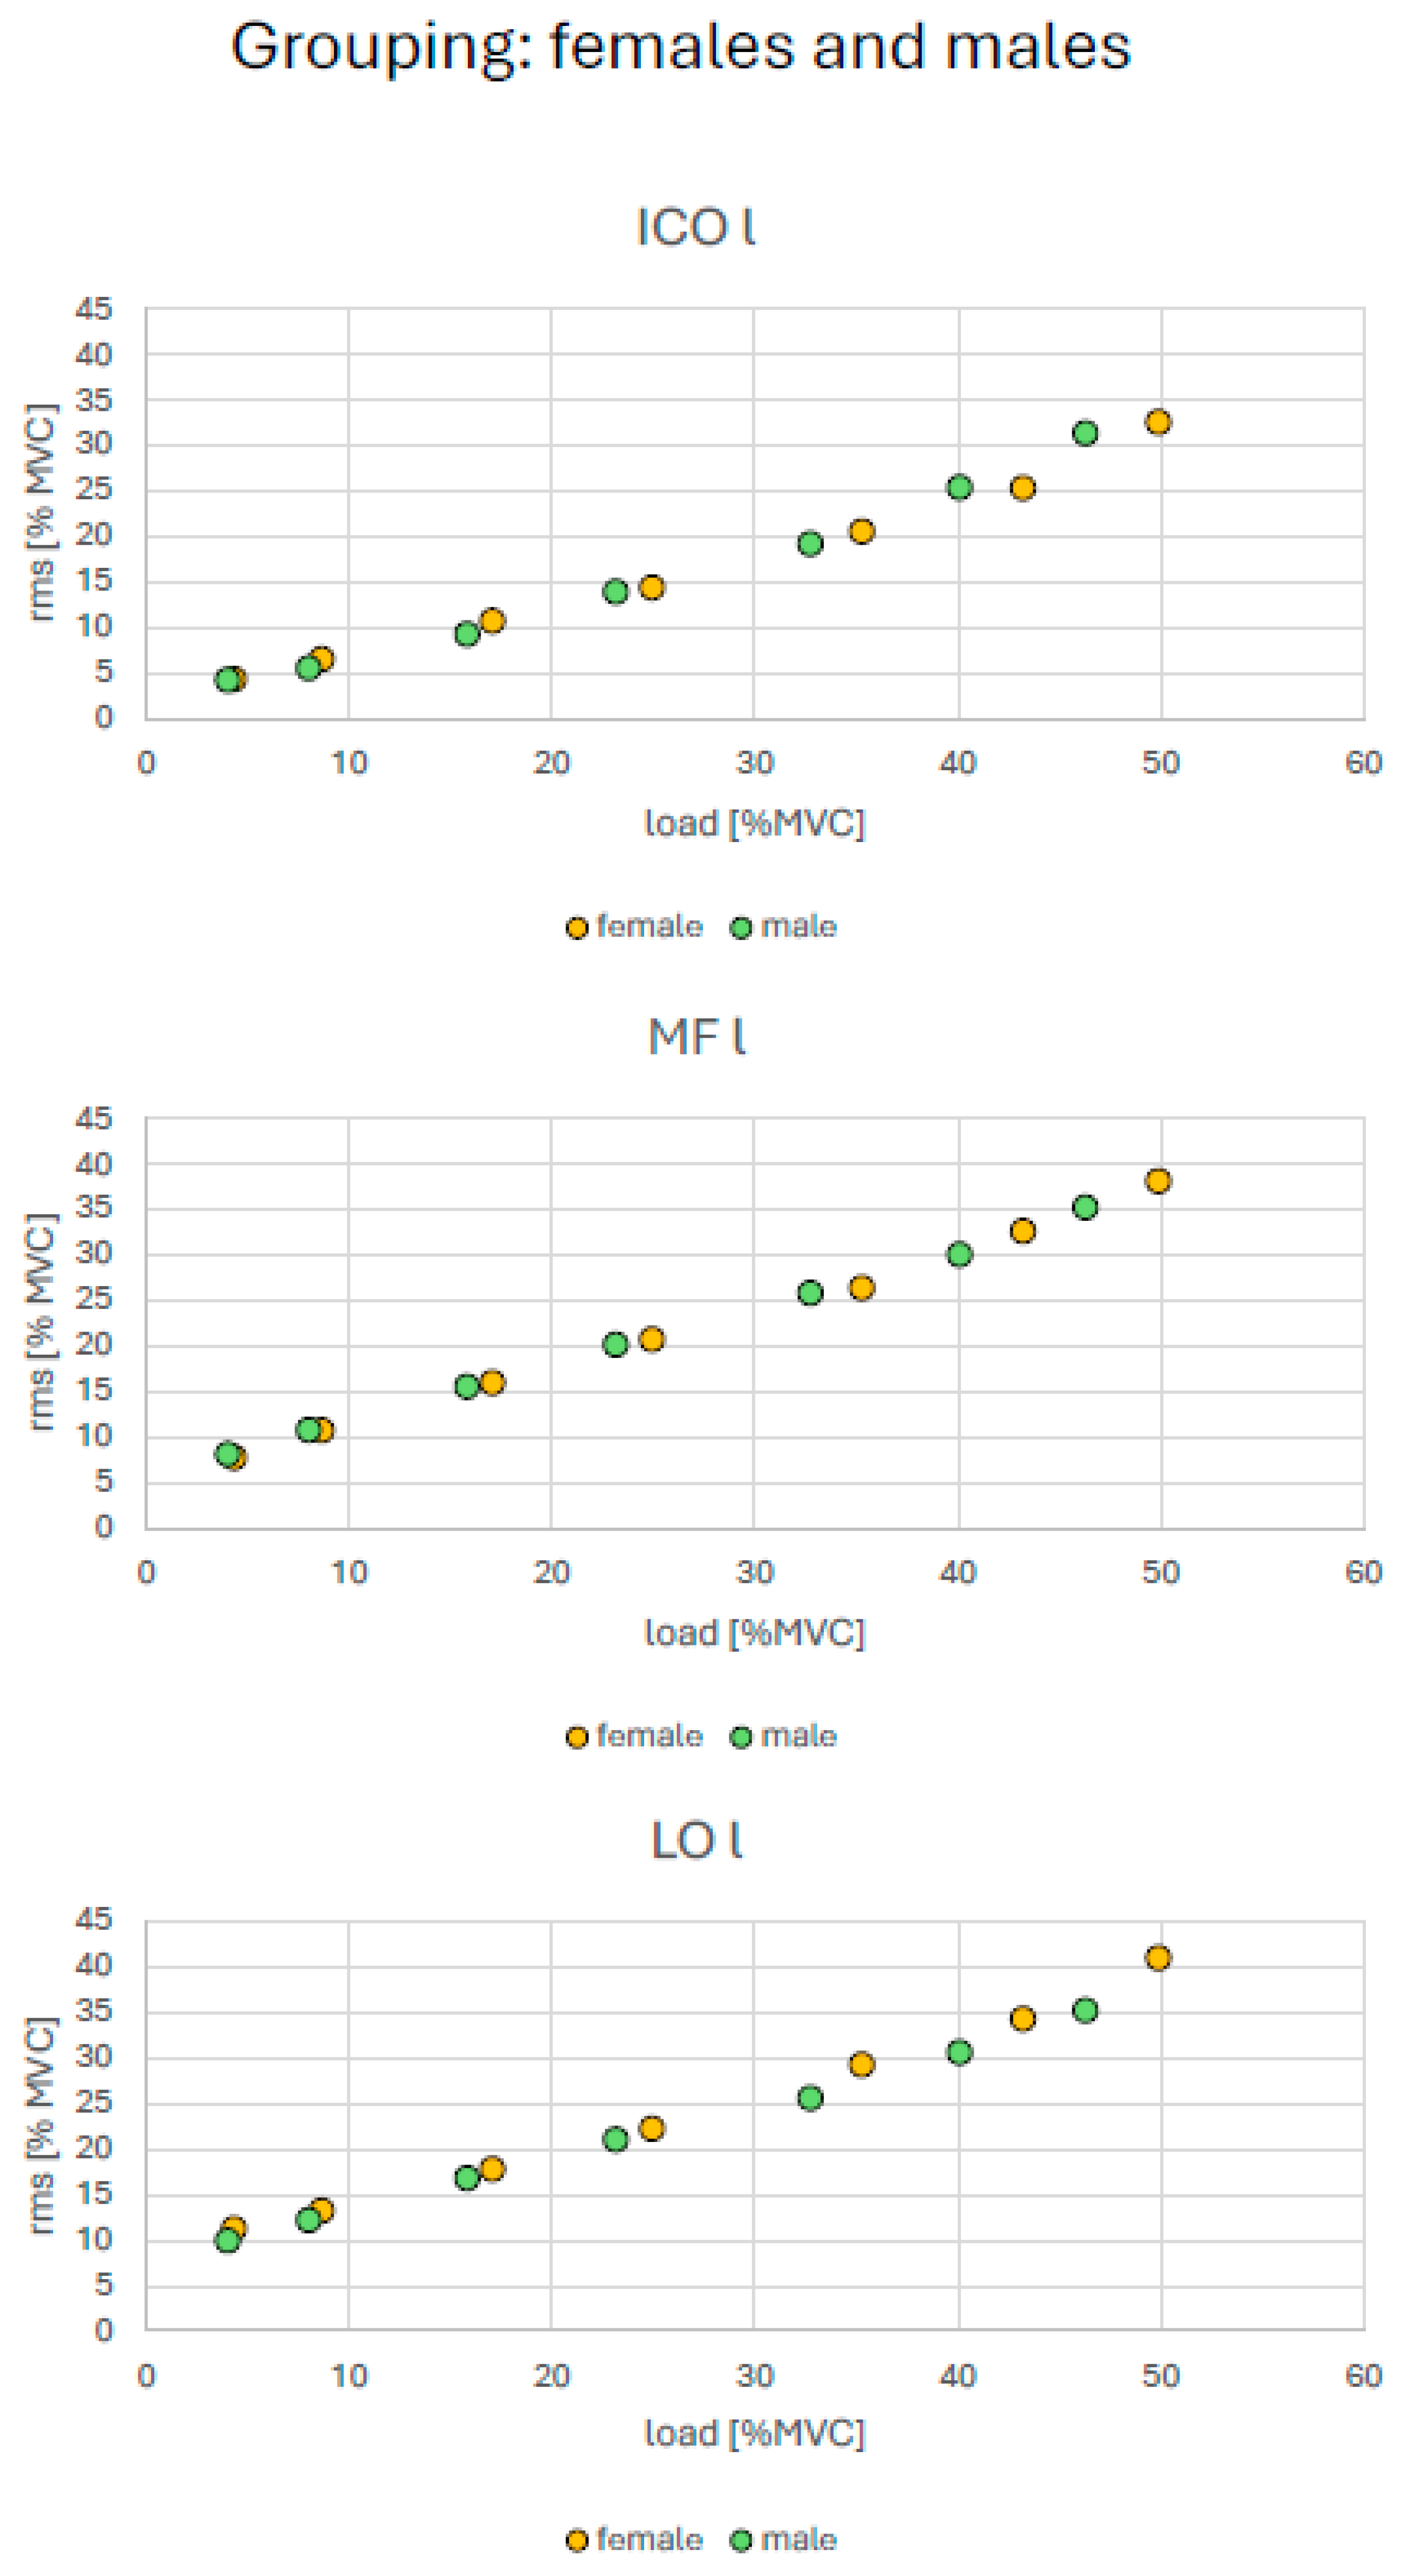
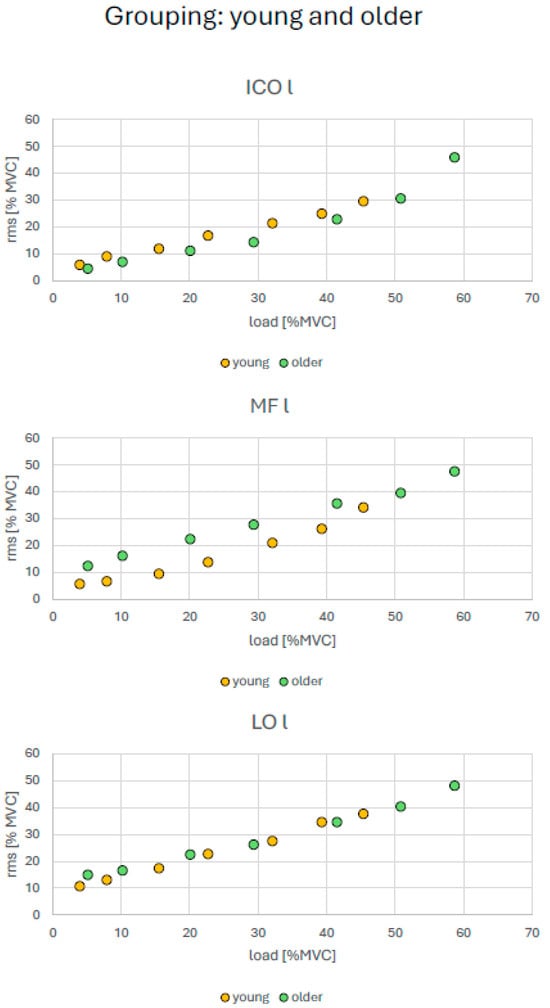
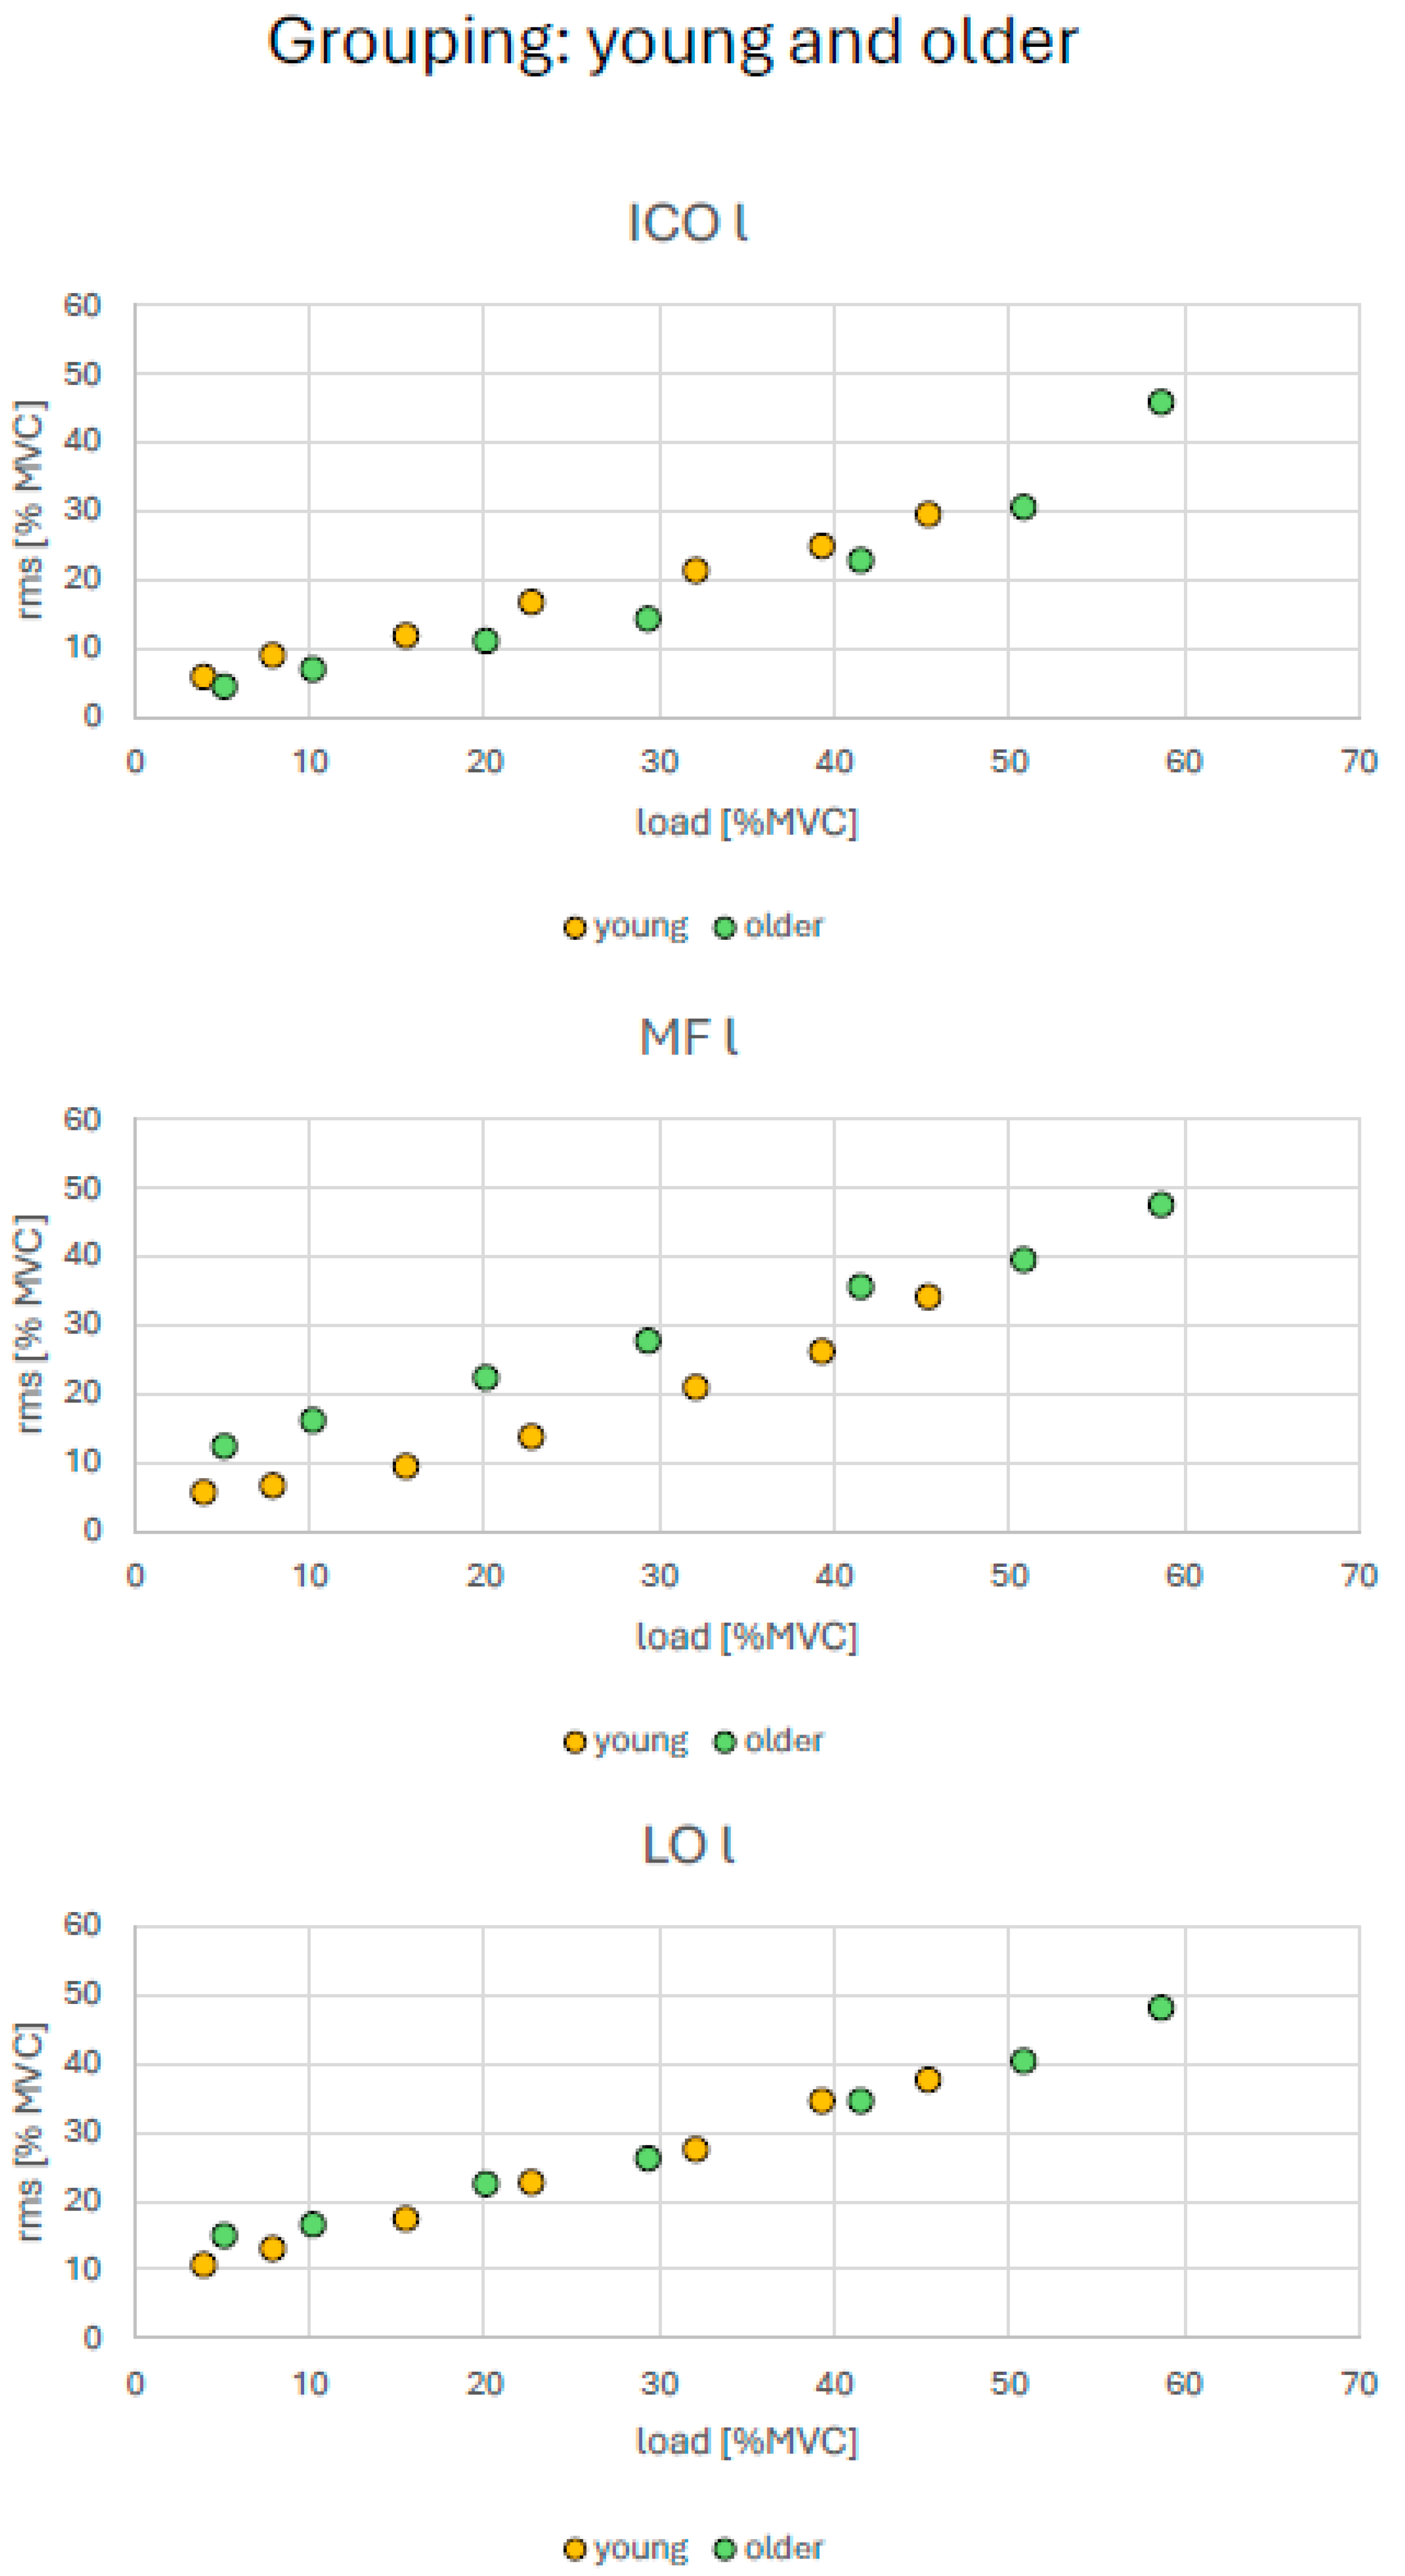
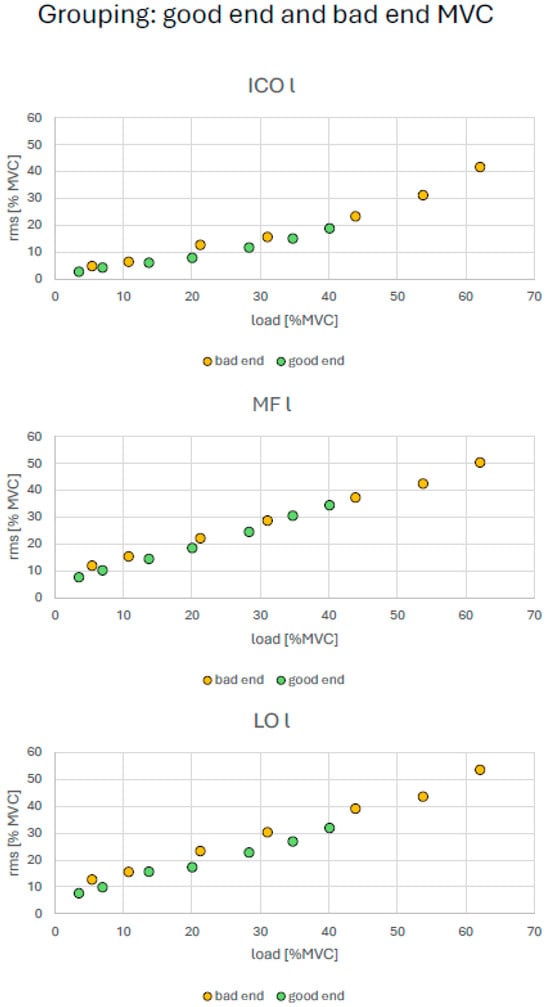
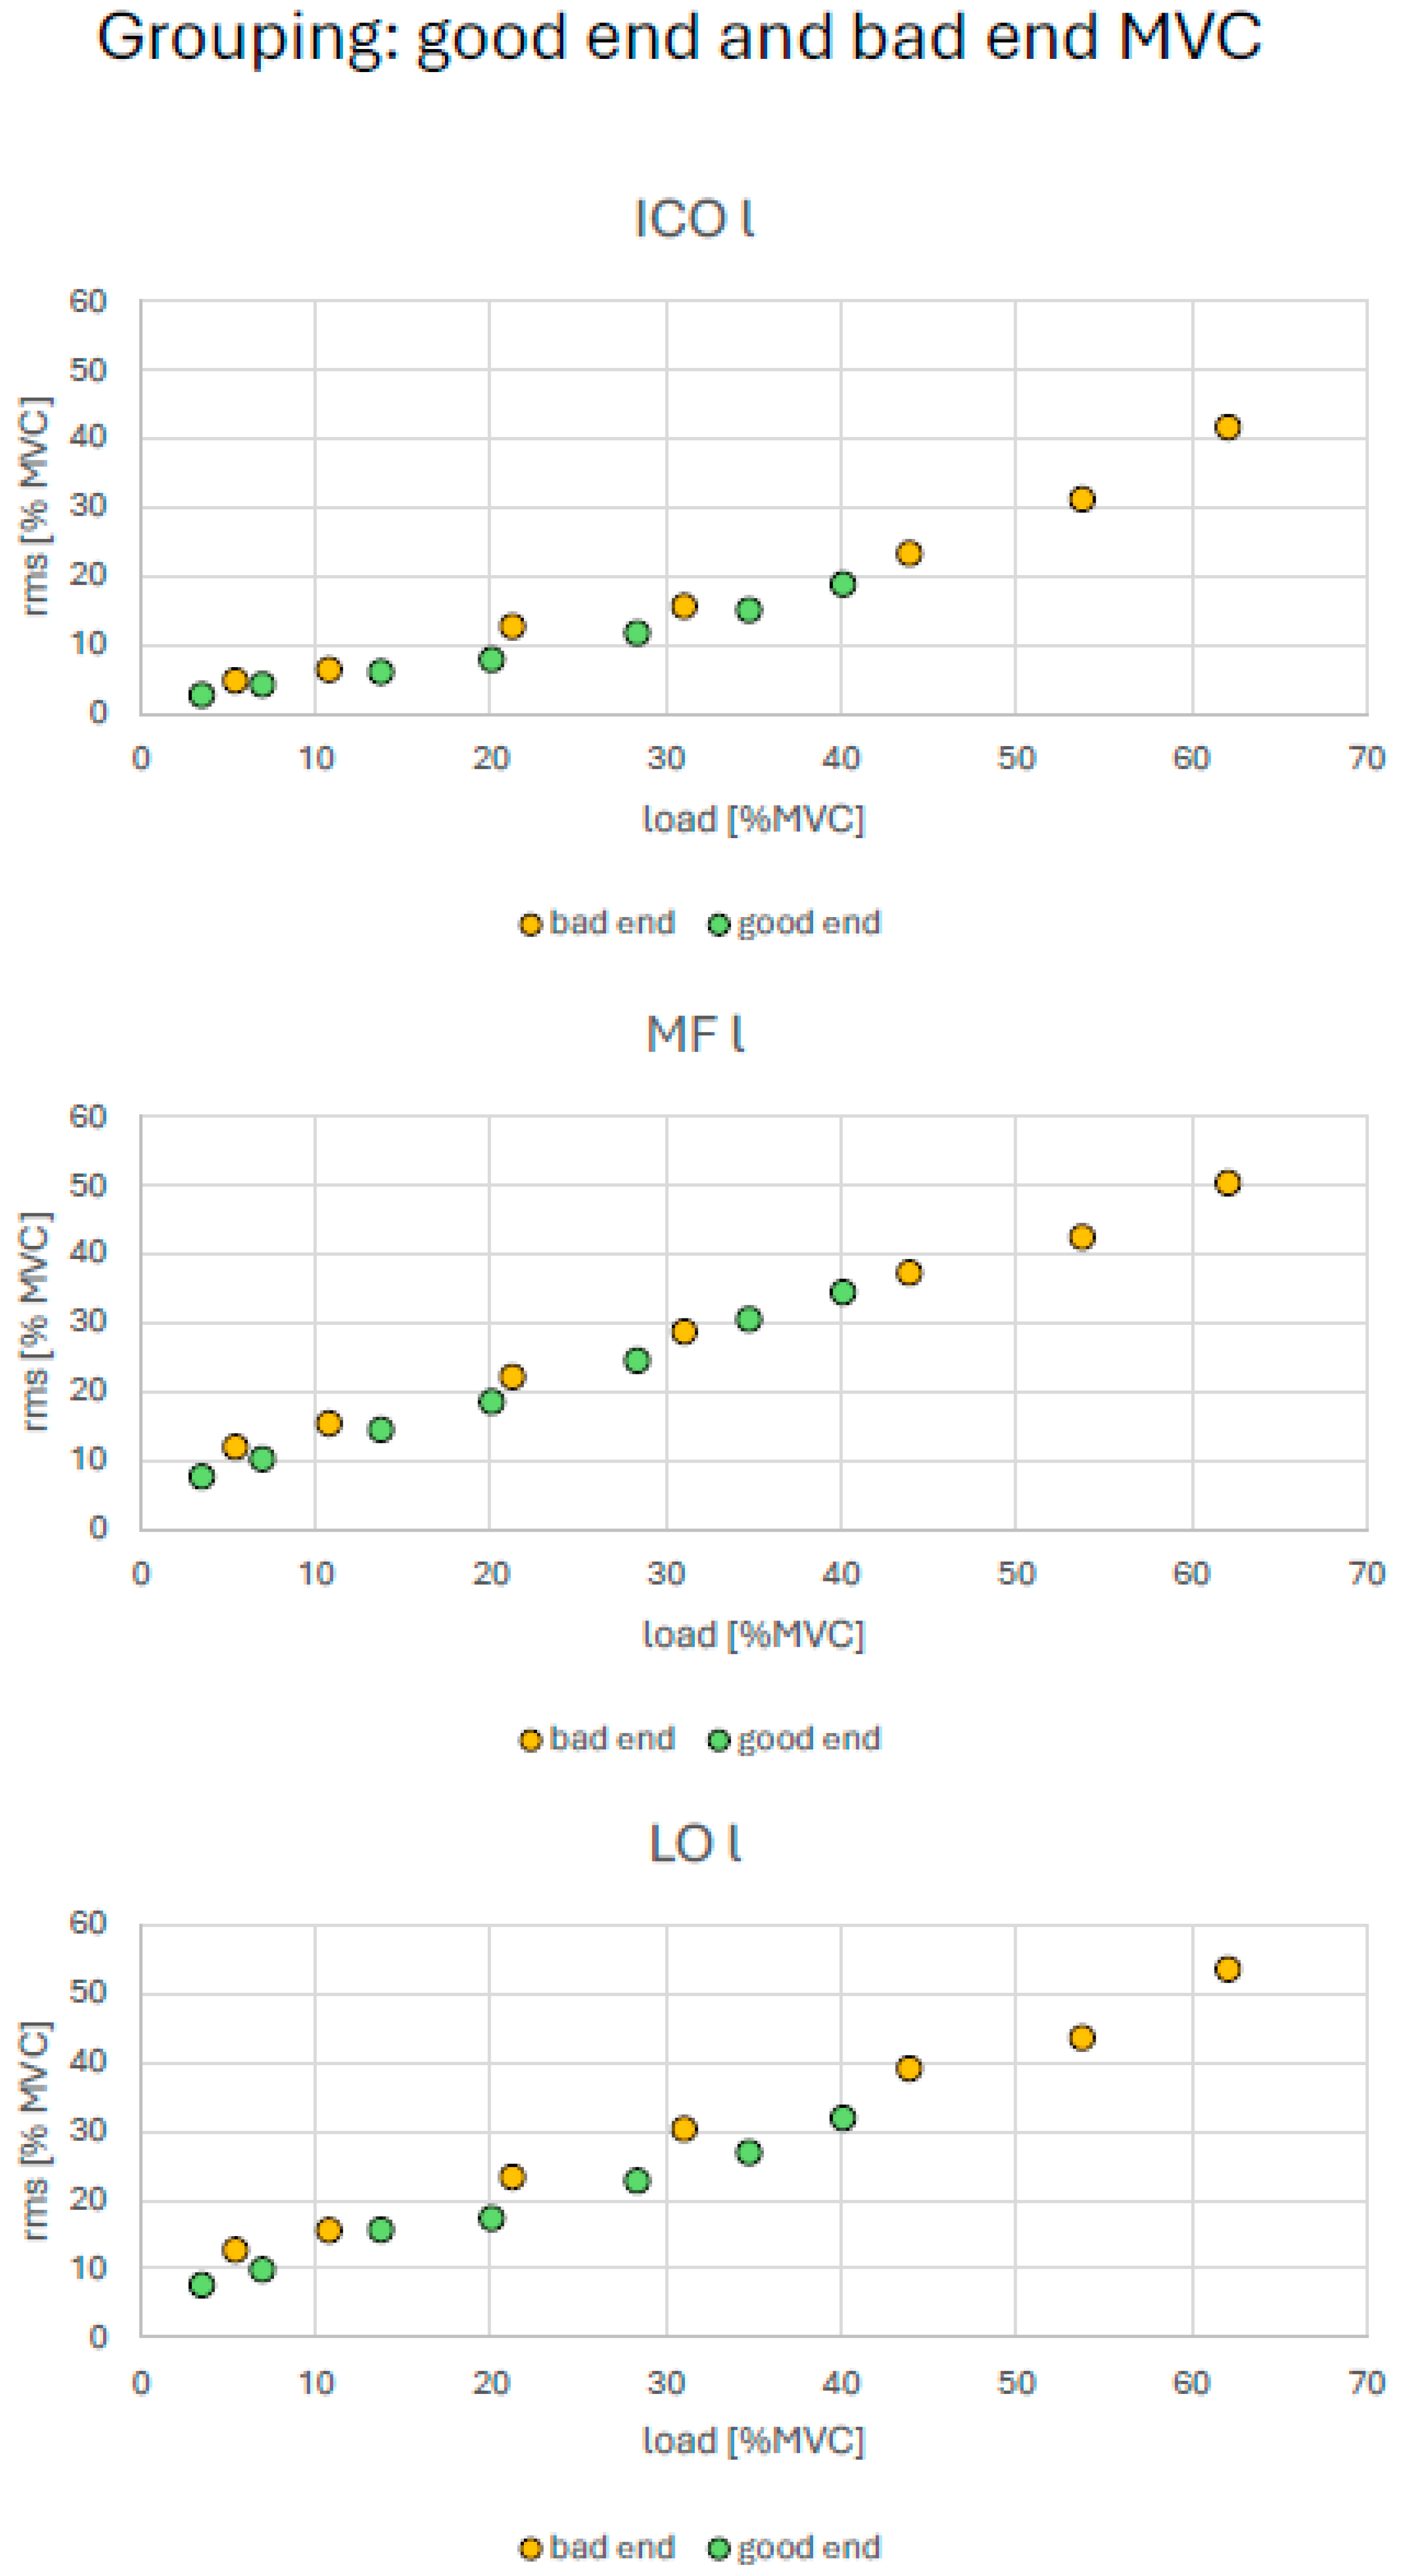
Across all subgroup classifications (sex, age, MVC, UBTR, and BMI), a similar pattern emerged: although the relative amplitude values occupied different x-y positions, they were generally aligned along nearly identical linear trends. These trends were located closer to the origin in men, younger participants, the high-performance MVC and UBTR groups, and the low-BMI group, and farther from the origin in women, older participants, the low-performance MVC and UBTR groups, and the high-BMI group (Figure 8, Figure 9, Figure 10, Figure 11 and Figure 12).
Figure 8.
MVC-normalized SEMG amplitude to force relationship. Subgroups: females and males.
Figure 9.
MVC-normalized SEMG amplitude to force relationship. Subgroups: young and older participants.
Figure 10.
MVC-normalized SEMG amplitude to force relationship. Subgroups: good and bad end of upper-body torque ratio (UBTR).
Figure 11.
MVC-normalized SEMG amplitude to force relationship. Subgroups: good and bad end of MVC.
Figure 12.
MVC-normalized SEMG amplitude to force relationship. Subgroups: low and high BMI values.
At the same time, muscle-specific differences in slope were observed within the individual subgroup characteristics (Table 3). In the sex- and age-based analyses, the ICO showed the least steep slope in women and in the younger subgroup, whereas in men and in the older subgroup the LO showed the shallowest slope relative to the other two back muscles.
Table 3.
Linear and second-order polynomial coefficients for trend curves per muscle (left-sided muscles) and subgroup.
In the MVC-based groups, the slope order was ICO < MF < LO in the low-performance group and ICO < LO < MF in the high-performance group. In the UBTR-based groups, the low-performance group showed the order MF < ICO < LO, whereas the high-performance group showed ICO < LO < MF. In the low-BMI group, the slope order was ICO < LO < MF, while in the high-BMI group it was MF < ICO < LO.
For all polynomial trend lines, the coefficients for x2 ranged from 0.001 to 0.013 and those for x from 0.11 to 0.67. Accordingly, the vertices of the estimated polynomials were consistently located in the negative range and thus outside the measured data. SEMG amplitudes therefore increased continuously with increasing tilt angle, with no turning point within the observed submaximal load range.
The small x2 coefficients further indicate only minor deviations from linearity, with the ICO most often showing the largest x2 coefficients across subgroups. However, these observations are descriptive and could not be statistically confirmed.
4. Discussion
In this cross-study analysis, SEMG data from back muscles were collected under both submaximal and maximal loading conditions in a total sample of 239 participants. Subgroups were defined by sex and by the extreme 10% of the cohort with respect to age, MVC, UBTR, and BMI. The main finding is that, in the submaximal range, no systematic subgroup differences in SEMG amplitude were observed, with two exceptions: the iliocostalis (ICO) showed higher amplitudes in younger than in older participants and SEMG amplitudes were consistently higher in subjects with low compared with those showing high BMI. In contrast, SEMG amplitudes recorded during MVC showed significant and relevant subgroup differences, with stronger, younger and leaner individuals consistently exhibiting higher values.
In the sex comparison, systematically higher MVC-related SEMG amplitudes in men were observed only for the multifidus (MF), whereas no corresponding differences were found for the ICO or longissimus (LO). A further notable finding emerged after normalizing both SEMG amplitude and applied load to the respective MVC values: subgroup data points fell into different regions but aligned along nearly identical, almost perfectly linear trend lines. Overall, differences were more pronounced between muscles than between subgroups, although these muscle-specific differences appeared largely unsystematic.
Regarding external influences on SEMG amplitude, the available evidence comes mainly from training studies. These studies indicate that SEMG amplitudes tend to increase in the maximal range after training [34,48]. In the submaximal range, modest increases have also been reported [49], although other studies found no change [32] or even reduced amplitudes under submaximal load [36]. Such inconsistent findings are commonly attributed to concurrent reductions in antagonist co-activation [50].
Another relevant factor is the distance between the electrode and the active muscle, particularly the thickness of the subcutaneous fat layer [13]. Although skinfold thickness was not measured in the present sample, BMI may serve as an indirect indicator [51,52]. Indeed, when participants were grouped by BMI, systematically higher amplitudes were found in the lower-BMI subgroup. This suggests that BMI affects SEMG amplitude through its influence on the electrode-muscle distance, with thicker subcutaneous tissue attenuating the recorded signal.
However, in the submaximal force range, consistent differences of this kind were found only for the two age groups, and even here only for the ICO. In contrast, the amplitude differences seen during MVC seem to have been driven primarily by available muscle mass or force-generating capacity, as reflected in the patterns female < male, older < younger, and low MVC/UBTR < high MVC/UBTR. Thus, attenuation related to BMI should be considered when interpreting SEMG amplitudes in the submaximal range, whereas in the maximal range its influence appears comparatively small.
With regard to activation of the target musculature, several basic principles are relevant. Muscle force is generated through activation of contractile filaments, but force output depends not only on the amount of available contractile tissue. It is also influenced by the number of recruitable motor units and by intermuscular coordination [48,53,54], particularly in the maximal force range.
A more complex issue is how training-related increases in force capacity are reflected under submaximal conditions. For a given force output x, a well-trained muscle may need to recruit y motor units, whereas a less trained muscle may require y + z motor units to generate the same force. From this perspective, a less trained muscle would be expected to operate with a greater number of active motor units at the same submaximal force level, which should lead to a higher SEMG amplitude than in a better-trained muscle.
Such effects have indeed been reported in more extreme comparisons [31,32]. However, in less pronounced cases, training studies have produced inconsistent findings, suggesting that the relationship between training status and submaximal SEMG amplitude is not straightforward.
During training-induced hypertrophy, individual muscle fibers increase in size [48,53], which also expands their membrane area. This enlargement may increase the measurable voltage contribution of each fiber and thereby offset the effect of greater motor unit recruitment, potentially helping to explain the inconsistent SEMG findings reported in the submaximal range.
The present study, however, did not address short-term training effects. Instead, the sample consisted of a heterogeneous, healthy, and largely non-athletic population approximately 20 to 50 years of age. In this context, SEMG amplitudes were more likely influenced by constitutional factors than by training adaptations or age-related degeneration.
Although men generally show greater absolute force capacity than women [55], systematic sex differences in SEMG amplitude during MVC were observed only for the multifidus (MF). In the submaximal range, no systematic sex differences were detectable. The same pattern was found for the grouping based on maximal force, although these MVC-based groups overlapped substantially in sex distribution, with clearer separation only at the extremes. The low-performance MVC group consisted almost entirely of women, whereas the high-performance group was exclusively men. These groups therefore reflect not only sex-related differences already present in the cohort but also the extreme ends of the observed maximal strength spectrum.
A similar imbalance was present in the age-based subgroups, with the younger group consisting predominantly of women and the older group predominantly of men. However, this did not lead to higher MVC-related SEMG amplitudes in the older, male-dominated group. Instead, higher amplitudes were observed in the younger group. Given that the larger type II fibers are especially susceptible to age-related degeneration [56], this result is not unexpected and is consistent with functional expectations, thereby indirectly supporting the above-provided interpretation.
When subgroups were defined according to extreme UBTR values, with an approximately balanced sex distribution in each group, differences in SEMG amplitude again emerged only during MVC, with higher values in the high-performance UBTR group. Comparison of the sex composition of these groups with that of the MVC-based subgroups suggests that the two grouping strategies do not simply overlap and cannot be considered redundant.
In summary, high absolute force capacity combined with a large physiological reserve is associated with measurably higher SEMG amplitudes during maximal contractions, but not during submaximal force exertion.
The analysis revealed a second noteworthy finding: when SEMG amplitudes normalized to maximal values were related to force values likewise normalized to their respective maxima, no or only very small differences in the amplitude-force relationship were detectable. Within the examined submaximal force range, values from all subgroups therefore fell along linear or only slightly nonlinear curves that differed mainly in the portion of the coordinate system they occupied; that is, they lay closer to or farther from the origin depending on the subgroup.
The amplitude-force relationship of the back muscles can therefore be interpreted as a characteristic that is largely stable and possibly evolutionarily conserved in its expression.
Previous studies have already demonstrated that the amplitude-force relationship is fundamentally region-specific [57,58]. The present findings extend this view by suggesting that, in addition to this known regional specificity, the back muscles in particular show a largely invariant systematic pattern. The subgroups differ mainly in the range covered by their respective curves.
5. Limitations
The presented data are based on a re-evaluation of measurements collected over a 15-year period. During that time, the recording system was changed from a wired device with 24-bit resolution to a wireless device with 12-bit resolution. Although an influence of this change cannot be ruled out completely, both systems were represented with similar frequencies across most subgroups, with one exception in the younger subgroup (wired system: 7; wireless system: 17). In addition, a muscle-specific full analysis including “system” as a covariate did not reveal any relevant effect sizes. The impact of the system change therefore appears negligible.
Across all sub-studies, the same testing device was used, electrodes always came from the same manufacturer, and electrode placement was consistently performed by the same experienced examiner. These factors make substantial systematic bias unlikely, although they cannot be excluded entirely.
To minimize muscular fatigue, tilt angles were applied in ascending order, and each static loading phase of 10 s was followed by a rest period of equal duration. Particular care was taken to ensure that muscle activation was limited to the holding phase. Participants were also instructed to lean relaxed against the shoulder harness during movement toward and away from the target angle, and this was monitored throughout testing.
Regarding MVC assessment, previous experience [21,59], motivation [60], fear [23], and pain [61] are known to affect performance. These factors were addressed by including only healthy, pain-free participants who had been informed about the study procedures. In addition, the first MVC trial was performed as a familiarization trial at approximately 50% of maximal effort. During MVC testing, all participants received standardized verbal encouragement [39,62]. Because the MVC procedure was predefined by the device, it was applied consistently across all sub-studies.
6. Conclusions
For investigations in the submaximal range, specifically up to 100% of upper body weight, SEMG amplitudes of the back muscles do not appear to differ systematically between groups defined by sex, age (up to about 50 years), or force capacity. Separate subgroup analyses are therefore generally unnecessary in this range, and the data may be analyzed in pooled form. An exception applies when groups differ substantially in BMI, because greater subcutaneous fat thickness likely attenuates the recorded SEMG amplitudes. In such cases, normalized data should be preferred.
When both SEMG amplitude and force were normalized to their respective maximal values, analyses of the amplitude-force relationship showed no relevant influence of external factors. Values from different subgroups then occupied only different segments of the same curve, which may be interpreted as a stable, possibly evolutionarily conserved feature of back muscle function. Under these conditions, the amplitude-force relationship was essentially linear.
By contrast, when SEMG data of the back muscles are analyzed during MVC, subgroup-specific evaluation based on sex, age, BMI, and force capacity should be considered, because systematic and characteristic differences between groups are to be expected.
Author Contributions
Conceptualization, C.A. (Christoph Anders); methodology, C.A. (Christoph Anders); software, C.A. (Christoph Anders); validation, B.S., F.S., M.M., L.M., E.D., A.S., C.A. (Christin Alex) and C.A. (Christoph Anders); formal analysis, B.S., F.S., M.M., L.M., E.D., A.S., C.A. (Christin Alex) and C.A. (Christoph Anders); investigation, B.S., F.S., M.M., L.M., E.D., A.S., C.A. (Christin Alex) and C.A. (Christoph Anders); resources, C.A. (Christoph Anders); data curation, B.S., F.S., M.M., L.M., E.D., A.S., C.A. (Christin Alex) and C.A. (Christoph Anders); writing—original draft prepa-ration, C.A. (Christoph Anders); writing—review and editing, B.S., F.S., M.M., L.M., E.D., A.S., C.A. (Christin Alex) and C.A. (Christoph Anders); visualization, C.A. (Christoph Anders); supervision, C.A. (Christoph Anders); project administration, C.A. (Christoph Anders); funding acquisition, C.A. (Christoph Anders). All authors have read and agreed to the published version of the manuscript.
Funding
This research received no external funding.
Data Availability Statement
Data are available by the author on request.
Conflicts of Interest
The authors declare no conflict of interest.
References
- Veiersted, K.B.; Forsman, M.; Hansson, G.A.; Mathiassen, S.E. Assessment of time patterns of activity and rest in full-shift recordings of trapezius muscle activity—Effects of the data processing procedure. J. Electromyogr. Kinesiol. 2013, 23, 540–547. [Google Scholar] [CrossRef] [Scilit] [PubMed]
- Akesson, I.; Balogh, I.; Hansson, G.A. Physical workload in neck, shoulders and wrists/hands in dental hygienists during a work-day. Appl. Ergon. 2012, 43, 803–811. [Google Scholar] [CrossRef] [Scilit] [PubMed]
- Oliva-Lozano, J.M.; Muyor, J.M. Core Muscle Activity During Physical Fitness Exercises: A Systematic Review. Int. J. Environ. Res. Public Health 2020, 17, 4306. [Google Scholar] [CrossRef] [Scilit] [PubMed]
- Robinson, M.; Lees, A.; Barton, G. An electromyographic investigation of abdominal exercises and the effects of fatigue. Ergonomics 2005, 48, 1604–1612. [Google Scholar] [CrossRef] [Scilit] [PubMed]
- Ostelo, R.W.; de Vet, H.C.; Waddell, G.; Kerckhoffs, M.R.; Leffers, P.; van Tulder, M. Rehabilitation following first-time lumbar disc surgery: A systematic review within the framework of the cochrane collaboration. Spine 2003, 28, 209–218. [Google Scholar] [CrossRef] [Scilit] [PubMed]
- Nurse, M.A.; Hulliger, M.; Wakeling, J.M.; Nigg, B.M.; Stefanyshyn, D.J. Changing the texture of footwear can alter gait patterns. J. Electromyogr. Kinesiol. 2005, 15, 496–506. [Google Scholar] [CrossRef] [Scilit] [PubMed]
- Nawab, S.H.; Chang, S.S.; De Luca, C.J. High-yield decomposition of surface EMG signals. Clin. Neurophysiol. 2010, 121, 1602–1615. [Google Scholar] [CrossRef] [Scilit] [PubMed]
- Hogrel, J.Y. Use of surface EMG for studying motor unit recruitment during isometric linear force ramp. J. Electromyogr. Kinesiol. 2003, 13, 417–423. [Google Scholar] [CrossRef] [Scilit] [PubMed]
- Farina, D.; Arendt-Nielsen, L.; Merletti, R.; Graven-Nielsen, T. Assessment of single motor unit conduction velocity during sustained contractions of the tibialis anterior muscle with advanced spike triggered averaging. J. Neurosci. Methods 2002, 115, 1–12. [Google Scholar] [CrossRef] [Scilit] [PubMed]
- De Luca, C.J.; Knaflitz, M. Surface Electromyography: What’s New? C.L.U.T.: Turin, Italy, 1992. [Google Scholar]
- Staudenmann, D.; Roeleveld, K.; Stegeman, D.F.; van Dieen, J.H. Methodological aspects of SEMG recordings for force estimation—A tutorial and review. J. Electromyogr. Kinesiol. 2010, 20, 375–387. [Google Scholar] [CrossRef] [Scilit] [PubMed]
- Huebner, A.; Faenger, B.; Schenk, P.; Scholle, H.C.; Anders, C. Alteration of Surface EMG amplitude levels of five major trunk muscles by defined electrode location displacement. J. Electromyogr. Kinesiol. 2015, 25, 214–223. [Google Scholar] [CrossRef] [Scilit] [PubMed]
- Nordander, C.; Willner, J.; Hansson, G.A.; Larsson, B.; Unge, J.; Granquist, L.; Skerfving, S. Influence of the subcutaneous fat layer, as measured by ultrasound, skinfold calipers and BMI, on the EMG amplitude. Eur. J. Appl. Physiol. 2003, 89, 514–519. [Google Scholar] [CrossRef] [Scilit] [PubMed]
- Amiri, P.; Hubley-Kozey, C.L.; Landry, S.C.; Stanish, W.D.; Wilson, J.L.A. Obesity is associated with prolonged activity of the quadriceps and gastrocnemii during gait. J. Electromyogr. Kinesiol. 2015, 25, 951–958. [Google Scholar] [CrossRef] [Scilit] [PubMed]
- Danoff, J.V. EMG normalization. Phys. Ther. 1986, 66, 270–272. [Google Scholar] [CrossRef] [Scilit] [PubMed]
- Yang, J.F.; Winter, D.A. Electromyographic amplitude normalization methods: Improving their sensitivity as diagnostic tools in gait analysis. Arch. Phys. Med. Rehabil. 1984, 65, 517–521. [Google Scholar] [PubMed]
- Rouffet, D.M.; Hautier, C.A. EMG normalization to study muscle activation in cycling. J. Electromyogr. Kinesiol. 2008, 18, 866–878. [Google Scholar] [CrossRef] [Scilit] [PubMed]
- Nieminen, H.; Takala, E.P.; Viikari Juntura, E. Normalization of electromyogram in the neck-shoulder region. Eur. J. Appl. Physiol. 1993, 67, 199–207. [Google Scholar] [CrossRef] [Scilit] [PubMed]
- Dorel, S.; Guilhem, G.; Couturier, A.; Hug, F. Adjustment of Muscle Coordination during an All-Out Sprint Cycling Task. Med. Sci. Sports Exerc. 2012, 44, 2154–2164. [Google Scholar] [CrossRef] [Scilit] [PubMed]
- Ball, N.; Scurr, J. Electromyography Normalization Methods for High-Velocity Muscle Actions: Review and Recommendations. J. Appl. Biomech. 2013, 29, 600–608. [Google Scholar] [CrossRef] [Scilit] [PubMed]
- Frost, L.R.; Gerling, M.E.; Markic, J.L.; Brown, S.H.M. Exploring the effect of repeated-day familiarization on the ability to generate reliable maximum voluntary muscle activation. J. Electromyogr. Kinesiol. 2012, 22, 886–892. [Google Scholar] [CrossRef] [Scilit] [PubMed]
- Salomoni, S.; Tucker, K.; Hug, F.; McPhee, M.; Hodges, P. Reduced Maximal Force during Acute Anterior Knee Pain Is Associated with Deficits in Voluntary Muscle Activation. PLoS ONE 2016, 11, e0161487. [Google Scholar] [CrossRef] [Scilit] [PubMed]
- Lindstroem, R.; Graven-Nielsen, T.; Falla, D. Current pain and fear of pain contribute to reduced maximum voluntary contraction of neck muscles in patients with chronic neck pain. Arch. Phys. Med. Rehabil. 2012, 93, 2042–2048. [Google Scholar] [CrossRef] [Scilit] [PubMed]
- Ng, J.K.F.; Kippers, V.; Parnianpour, M.; Richardson, C.A. EMG activity normalization for trunk muscles in subjects with and without back pain. Med. Sci. Sports Exerc. 2002, 34, 1082–1086. [Google Scholar] [CrossRef] [Scilit] [PubMed]
- Lebon, F.; Collet, C.; Guillot, A. Benefits of Motor Imagery Training on Muscle Strength. J. Strength Cond. Res. 2010, 24, 1680–1687. [Google Scholar] [CrossRef] [Scilit] [PubMed]
- Mathiassen, S.; Winkel, J.; Hägg, G. Normalization of surface EMG amplitude from the upper trapezius muscle in ergonomic studies—A review. J. Electromyogr. Kinesiol. 1995, 5, 197–226. [Google Scholar] [CrossRef] [Scilit] [PubMed]
- Marras, W.S.; Davis, K.G. A non-MVC EMG normalization technique for the trunk musculature: Part 1. Method development. J. Electromyogr. Kinesiol. 2001, 11, 1–9. [Google Scholar] [CrossRef] [Scilit] [PubMed]
- Burden, A. How should we normalize electromyograms obtained from healthy participants? What we have learned from over 25 years of research. J. Electromyogr. Kinesiol. 2010, 20, 1023–1035. [Google Scholar] [CrossRef] [Scilit] [PubMed]
- de Luca, C.J. The use of surface electromyography in biomechanics. J. Appl. Biomech. 1997, 13, 135–163. [Google Scholar] [CrossRef] [Scilit]
- Gandevia, S.C. Spinal and supraspinal factors in human muscle fatigue. Physiol. Rev. 2001, 81, 1725–1789. [Google Scholar] [CrossRef] [Scilit] [PubMed]
- Lucas-Cuevas, A.G.; Baltich, J.; Enders, H.; Nigg, S.; Nigg, B. Ankle muscle strength influence on muscle activation during dynamic and static ankle training modalities. J. Sports Sci. 2016, 34, 803–810. [Google Scholar] [CrossRef] [Scilit] [PubMed]
- Casolo, A.; Del Vecchio, A.; Balshaw, T.G.; Maeo, S.; Lanza, M.B.; Felici, F.; Folland, J.P.; Farina, D. Behavior of motor units during submaximal isometric contractions in chronically strength-trained individuals. J. Appl. Physiol. 2021, 131, 1584–1598. [Google Scholar] [CrossRef] [Scilit] [PubMed]
- Sterczala, A.J.; Miller, J.D.; Dimmick, H.L.; Wray, M.E.; Trevino, M.A.; Herda, T.J. Eight weeks of resistance training increases strength, muscle cross-sectional area and motor unit size, but does not alter firing rates in the vastus lateralis. Eur. J. Appl. Physiol. 2020, 120, 281–294. [Google Scholar] [CrossRef] [Scilit] [PubMed]
- Aagaard, P.; Simonsen, E.B.; Andersen, J.L.; Magnusson, P.; Dyhre-Poulsen, P. Increased rate of force development and neural drive of human skeletal muscle following resistance training. J. Appl. Physiol. 2002, 93, 1318–1326. [Google Scholar] [CrossRef] [Scilit] [PubMed]
- Del Vecchio, A.; Casolo, A.; Enoka, R.M.; Farina, D. Changes in neural drive after strength training are better estimated from absolute than normalized EMG amplitude. J. Appl. Physiol. 2026, 140, 177–187. [Google Scholar] [CrossRef] [Scilit] [PubMed]
- Santos, P.D.G.; Vaz, J.R.; Correia, J.; Neto, T.; Pezarat-Correia, P. Long-Term Neurophysiological Adaptations to Strength Training: A Systematic Review with Cross-Sectional Studies. J. Strength Cond. Res. 2023, 37, 2091–2105. [Google Scholar] [CrossRef] [Scilit] [PubMed]
- Jenkins, N.D.M.; Miramonti, A.A.; Hill, E.C.; Smith, C.M.; Cochrane-Snyman, K.C.; Housh, T.J.; Cramer, J.T. Greater Neural Adaptations following High- vs. Low-Load Resistance Training. Front. Physiol. 2017, 8, 331. [Google Scholar] [CrossRef] [Scilit] [PubMed]
- Nuzzo, J.L. Narrative Review of Sex Differences in Muscle Strength, Endurance, Activation, Size, Fiber Type, and Strength Training Participation Rates, Preferences, Motivations, Injuries, and Neuromuscular Adaptations. J. Strength Cond. Res. 2023, 37, 494–536. [Google Scholar] [CrossRef] [Scilit] [PubMed]
- McNair, P.J.; Depledge, J.; Brettkelly, M.; Stanley, S.N. Verbal encouragement: Effects on maximum effort voluntary muscle action. Br. J. Sports Med. 1996, 30, 243–245. [Google Scholar] [CrossRef] [Scilit] [PubMed]
- Andreacci, J.L.; LeMura, L.M.; Cohen, S.L.; Urbansky, E.A.; Chelland, S.A.; Von Duvillard, S.P. The effects of frequency of encouragement on performance during maximal exercise testing. J. Sports Sci. 2002, 20, 345–352. [Google Scholar] [CrossRef] [Scilit] [PubMed]
- Argus, C.K.; Gill, N.D.; Keogh, J.W.L.; Hopkins, W.G. Acute Effects of Verbal Feedback on Upper-Body Performance in Elite Athletes. J. Strength Cond. Res. 2011, 25, 3282–3287. [Google Scholar] [CrossRef] [Scilit] [PubMed]
- Kurz, E.; Anders, C.; Walther, M.; Schenk, P.; Scholle, H.C. Force Capacity of Back Extensor Muscles in Healthy Males—Effects of Age and Recovery Time. J. Appl. Biomech. 2014, 30, 713–721. [Google Scholar] [CrossRef] [Scilit] [PubMed]
- Hermens, H.J.; Freriks, B.; Disselhorst-Klug, C.; Rau, G. Development of recommendations for SEMG sensors and sensor placement procedures. J. Electromyogr. Kinesiol. 2000, 10, 361–374. [Google Scholar] [CrossRef] [Scilit] [PubMed]
- SENIAM. Available online: www.seniam.org (accessed on 22 June 2026).
- Ng, J.K.; Kippers, V.; Richardson, C.A. Muscle fibre orientation of abdominal muscles and suggested surface EMG electrode positions. Electromyogr. Clin. Neurophysiol. 1998, 38, 51–58. [Google Scholar] [PubMed]
- Cohen, J. Statistical Power for the Behavioural Sciences; Lawrence Erlbaum: Hillsdale, NJ, USA, 1988. [Google Scholar]
- Benjamini, Y.; Hochberg, Y. Controlling the False Discovery Rate: A Practical and Powerful Approach to Multiple Testing. J. R. Stat. Soc. Ser. B Methodol. 1995, 57, 289–300. [Google Scholar] [CrossRef] [Scilit]
- Garfinkel, S.; Cafarelli, E. Relative changes in maximal force, EMG, and muscle cross-sectional area after isometric training. Med. Sci. Sports Exerc. 1992, 24, 1220–1227. [Google Scholar] [CrossRef] [Scilit]
- Vila-Chã, C.; Falla, D.; Farina, D. Motor unit behavior during submaximal contractions following six weeks of either endurance or strength training. J. Appl. Physiol. 2010, 109, 1455–1466. [Google Scholar] [CrossRef] [Scilit] [PubMed]
- Amarantini, D.; Bru, B. Training-related changes in the EMG-moment relationship during isometric contractions: Further evidence of improved control of muscle activation in strength-trained men? J. Electromyogr. Kinesiol. 2015, 25, 697–702. [Google Scholar] [CrossRef] [Scilit] [PubMed]
- Durnin, J.V.; Womersley, J. Body fat assessed from total body density and its estimation from skinfold thickness: Measure-ments on 481 men and women aged from 16 to 72 years. Br. J. Nutr. 1974, 32, 77–97. [Google Scholar] [CrossRef] [Scilit] [PubMed]
- Nevill, A.M.; Stewart, A.D.; Olds, T.; Holder, R. Relationship between adiposity and body size reveals limitations of BMI. Am. J. Phys. Anthr. 2006, 129, 151–156. [Google Scholar] [CrossRef] [Scilit] [PubMed]
- Farup, J.; Kjolhede, T.; Sorensen, H.; Dalgas, U.; Moller, A.B.; Vestergaard, P.F.; Ringgaard, S.; Bojsen-Moller, J.; Vissing, K. Muscle morphological and strength adaptations to endurance vs. resistance training. J. Strength Cond. Res. 2012, 26, 398–407. [Google Scholar] [CrossRef] [Scilit] [PubMed]
- Seynnes, O.R.; de Boer, M.; Narici, M.V. Early skeletal muscle hypertrophy and architectural changes in response to high-intensity resistance training. J. Appl. Physiol. 2007, 102, 368–373. [Google Scholar] [CrossRef] [Scilit] [PubMed]
- Hunter, S.K.; Angadi, S.S.; Bhargava, A.; Harper, J.; Hirschberg, A.L.; Levine, B.D.; Moreau, K.L.; Nokoff, N.J.; Stachenfeld, N.S.; Bermon, S. The Biological Basis of Sex Differences in Athletic Performance: Consensus Statement for the American College of Sports Medicine. Transl. J. Am. Coll. Sports Med. 2023, 8, 1–33, Erratum in Transl. J. Am. Coll. Sports Med. 2024, 9. [Google Scholar] [CrossRef] [Scilit]
- Paillard, T. Neuromuscular system and aging: Involutions and implications. Geriatr. Psychiatry Neurol. 2013, 11, 379–387. [Google Scholar] [CrossRef] [Scilit] [PubMed]
- Anders, C.; Brose, G.; Hofmann, G.O.; Scholle, H.C. Evaluation of the EMG-force relationship of trunk muscles during whole body tilt. J. Biomech. 2008, 41, 333–339. [Google Scholar] [CrossRef] [Scilit] [PubMed]
- Huebner, A.; Faenger, B.; Scholle, H.C.; Anders, C. Re-evaluation of the amplitude-force relationship of trunk muscles. J. Biomech. 2015, 48, 1198–1205. [Google Scholar] [CrossRef] [Scilit] [PubMed]
- Lykidis, A.; Pechlivanos, R.G.; Angelou, A.; Varvariotis, N.; Sahinis, C.; Amiridis, I.G.; Enoka, R.M. Performance of Youth Athletes Is Not Consistently Determined by Maturity or Training Experience: A Cross-Sectional Study. J. Funct. Morphol. Kinesiol. 2026, 11, 166. [Google Scholar] [CrossRef] [Scilit] [PubMed]
- Bugnon, M.; Walchli, M.; Taube, W. How to benefit from augmented feedback? The influence of motivational and informa-tional content of augmented feedback and the influence of task complexity. Eur. J. Sport Sci. 2023, 23, 1435–1445. [Google Scholar] [CrossRef] [Scilit] [PubMed]
- Chiou, S.Y.; Shih, Y.F.; Chou, L.W.; McGregor, A.H.; Strutton, P.H. Impaired neural drive in patients with low back pain. Eur. J. Pain 2014, 18, 794–802. [Google Scholar] [CrossRef] [Scilit] [PubMed]
- Belkhiria, C.; De Marco, G.; Driss, T. Effects of verbal encouragement on force and electromyographic activations during exercise. J. Sports Med. Phys. Fit. 2018, 58, 750–757. [Google Scholar] [CrossRef] [Scilit] [PubMed]

Disclaimer/Publisher’s Note: The statements, opinions and data contained in all publications are solely those of the individual author(s) and contributor(s) and not of MDPI and/or the editor(s). MDPI and/or the editor(s) disclaim responsibility for any injury to people or property resulting from any ideas, methods, instructions or products referred to in the content. |
© 2026 by the authors. Licensee MDPI, Basel, Switzerland. This article is an open access article distributed under the terms and conditions of the Creative Commons Attribution (CC BY) license.