


Abstract
This study investigated the redistribution of the milk lipid fraction during buffalo mozzarella manufacturing, and it focused on the effects of coagulation and stretching on triglycerides, fatty acids, and cholesterol. Samples of raw milk, curd, whey, mozzarella cheese, and water used in the mozzarella stretching process in manufacturing were collected from ten independent industrial production batches and analyzed for pH, moisture, protein, total fat, fatty acid profile, triglyceride profile, and free cholesterol content. Curd showed the highest fat content (approximately 28–39 g/100 g product), followed by mozzarella cheese (approximately 19–26 g/100 g product). Whey and stretching water contained lower amounts of fat, ranging from approximately 0.27 to 2.15 g/100 g product and from 0.23 to 2.20 g/100 g product, respectively, indicating efficient lipid retention in the curd and cheese matrices. The mozzarella fatty acid profile closely resembled that of the original milk, with oleic and palmitic acids as the predominant fatty acids, together with a slight enrichment in monounsaturated fatty acids and a reduction in saturated fatty acids. The triglyceride profile remained stable throughout processing, suggesting only minor redistribution among triglycerides. These findings demonstrate that coagulation and stretching are critical steps governing lipid retention and composition, highlighting the importance of process control to preserve the nutritional quality of buffalo mozzarella cheese.
1. Introduction
Global milk production is largely dominated by cattle and buffalo milk, which accounted for approximately 81% and 16% of total production, respectively, in 2023, with cattle milk production reaching 783 million t [1]. In terms of composition, buffalo milk is among the richest ones: the main component is fat, whose average percentage is 5.3%, but can reach up to 15% [2,3]. Since the production of many dairy products involves removing moisture or, in general, concentrating on the lipid fraction, milk fat is often a key component in dairy products [4]. It is believed that almost all the fat fractions of milk are dispersed in fat globules which are colloidal aggregates. The core of each globule consists mainly of triacylglycerols (TAGs), esters of fatty acids and glycerol, which account for about 98% of milk lipids [5]. This core is surrounded by a biological membrane called the milk fat globule membrane (MFGM), composed mainly of glycerophospholipids, namely phosphatidylcholine (PC), phosphatidylethanolamine (PE), phosphatidylinositol (PI), phosphatidylserine (PS), sphingolipids mainly sphingomyelin (SM), cholesterol, and proteins. Polar lipids, mainly located in the MFGM, amount to approximately 2.6 mg/g of fat and to 190 mg/L of buffalo milk, which is an amount about 28% higher than the fat present in cow’s milk. Buffalo milk is characterized by a high fat and protein content [6]. Its fat is enclosed in globules measuring approximately 5 µm in diameter, which are larger than those found in cow, sheep, and goat milk (3–3.5 µm) [5]. Since cholesterol is mainly associated with the milk fat globule membrane, differences in fat globule size and membrane surface area may contribute to differences in cholesterol distribution among milk species [7]. The lipid fraction of milk consists of 97–98% triglycerides, 1.5% diglycerides and 0.5% monoglycerides. The composition and structure of triglycerides play a fundamental role as they influence the physical and nutritional properties of milk fat and, consequently, also the characteristics of the processed products obtained from milk [8].
The structure of triglycerides determines physical properties such as crystallization and melting point, which affect the texture and flavor of fat-based products. Triglyceride abundance in buffalo milk ranges from C24 to C54, with peaks in C38 and C50 [9]. Compared to cow’s milk, buffalo milk contains higher quantities of C32 and C36 [10]. Among the fatty acids that make up the triglycerides, the main ones are oleic acid (C18:1, ω9cis), which contributes most to the unsaturated fatty acid profile, namely the monounsaturated and polyunsaturated fatty acids (MUFA + PUFA), and palmitic acid (C16:0), which predominates in the saturated fatty acids (SFA) overall profile. The third most abundant fatty acid is stearic acid (C18:0), whose presence is attributed to the extensive ruminal biohydrogenation of C18:3, C18:2 and C18:1 fatty acids [11,12]. From a technological point of view, buffalo milk can be used to produce a wide range of products: butter, clarified butter oil, soft or hard cheeses, condensed or evaporated milk, ice cream, yoghurt, and buttermilk [13]. One of the best-known products is the Buffalo Mozzarella Cheese, a typical stretched-curd cheese made from the milk of river buffalo (Bubalus bubalis bubalis), produced in central and southern Italy, and recognized with the Protected Designation of Origin (PDO) quality label [14]. The production of buffalo mozzarella begins with heating the milk, followed by the addition of whey starter and rennet to promote coagulation and obtain the curd, which is then broken, matured for a few hours, and subsequently spun with boiling water until a homogeneous and stringy mixture is obtained. The “mozzatura” phase, which involves the manual shaping of the stretched curd, followed by salting in brine, completes the production process [15,16]. During the production of buffalo mozzarella, two stages are particularly important for the chemical and physical characteristics of the final product: the stretching and the acidification of the curd [17]. Stretching, which can be done manually, mechanically or by direct steam injection, is a unique process in mozzarella production, during which the proteins undergo a molecular rearrangement from an amorphous three-dimensional structure to a linear fibrous network. This allows the whey and fat droplets to fill the spaces between the casein protein bundles, transforming the structure from rigid to plastic [18,19,20]. Hydrogen bond interactions play a crucial role in stabilizing protein structures; however, as the temperature rises, these interactions weaken and electrostatic repulsion increases. In summary, heat treatment alters the inter-molecular forces between proteins, causing local denaturation and structural changes which affect the colloidal properties of the solid phase of cheese, resulting in the loss of lipids and proteins that are no longer retained by the fibrous network [19]. The acidification phase of the curd also plays a crucial role, as its characteristics depend on the pH. In the conventional production of stretched-curd cheeses, the pH of the curd decreases as a result of the conversion of lactose into lactic acid, reaching values between 5.4 and 5.1 before stretching. The reduction in pH promotes a series of physical-chemical changes that facilitate the flow of the curd during stretching: solubilization of micellar calcium phosphate, increases in the ratio between soluble and colloidal calcium, and increases in paracasein hydration [21]. pH variations below the abovementioned optimal levels result in a different distribution between colloidal and soluble calcium, affecting the fibrous structure of the curd and reducing its ability to retain components such as fat [21]. Considering that studies on the distribution of the lipid component of buffalo milk during buffalo mozzarella production are limited and outdated, this research aims to analyze the distribution of the fat phase of the raw material, in particular triglycerides and fatty acids, within the finished product and the main processing intermediates (whey, curd, and stretching water), considering the crucial stages of the production process. The objective is to highlight the qualitative and quantitative variations in the lipid fraction of buffalo mozzarella compared to that originally present in the buffalo milk used for its production.
2. Materials and Methods
2.1. Sampling
Sampling was carried out over a period of five months (from November 2024 to March 2025) at a non-PDO commercial dairy plant located in the province of Napoli (Campania, Italy). For each production batch, 100 kg of whole buffalo milk were processed. Two independent production processes were performed each month, resulting in a total of ten independent manufacturing batches analyzed. Samples of raw milk (M), collected before pasteurization, curd (C), whey (W), buffalo mozzarella (MC), and stretching water (SW) were collected from each batch. All analytical determinations were performed in triplicate, and the experimental unit considered for the statistical analysis was the individual production batch (n = 10); triplicate measurements represented analytical replicates.
2.2. Production Process
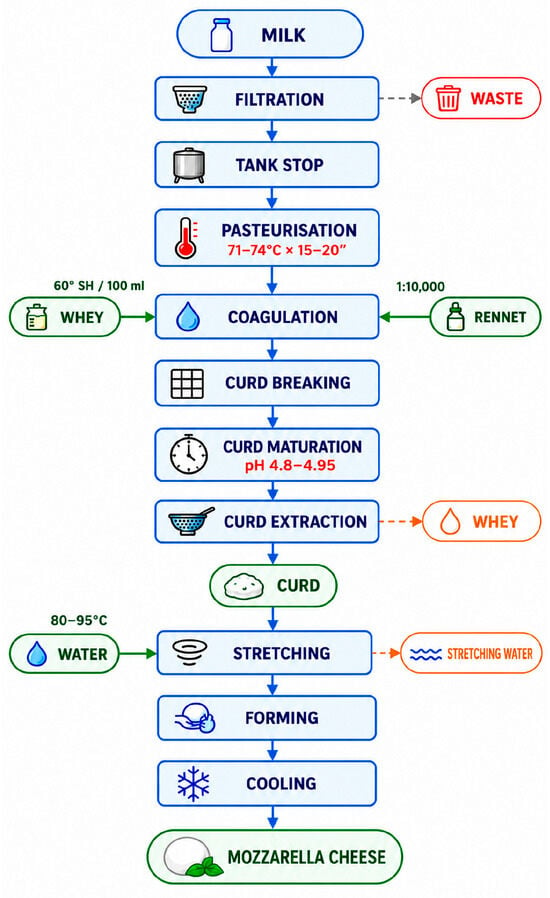
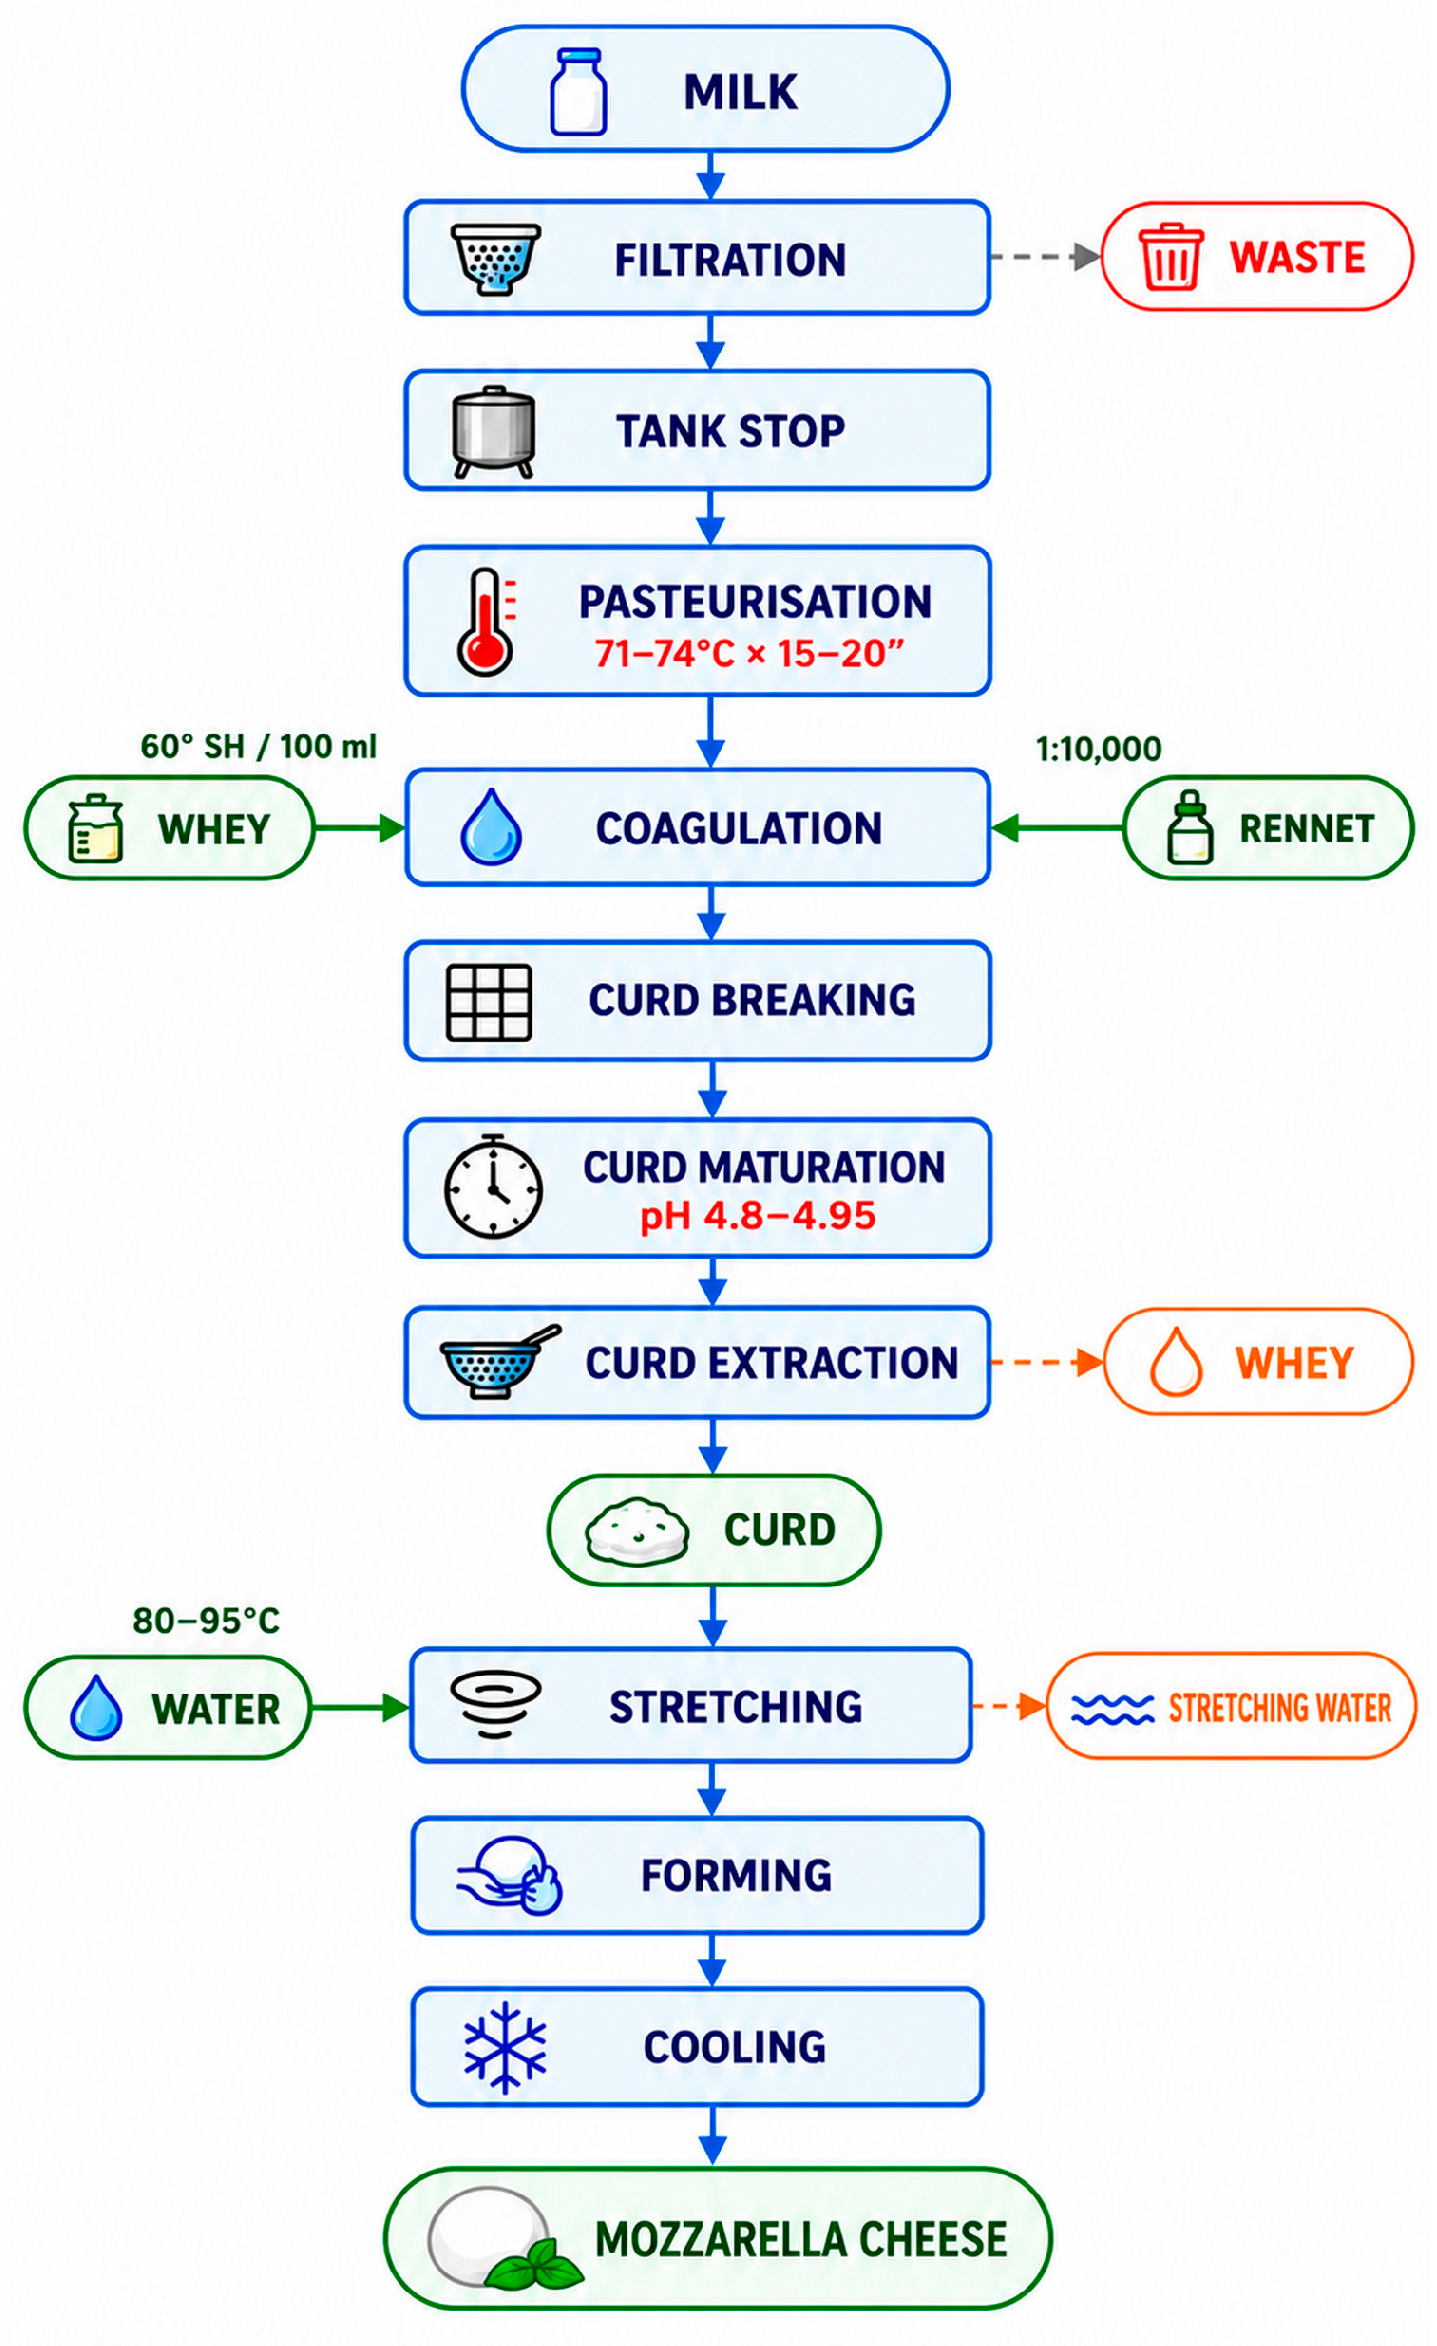
All the production processes studied followed the same technological steps as reported in Figure 1.
Figure 1.
Production process flow of buffalo mozzarella.
The buffalo milk used for production was collected and stored in stainless steel tanks with a capacity ranging from 10–30 t. Before processing began, the milk underwent a protein rebalancing phase. Cold storage at 4–5 °C can promote the dissociation of β-casein from casein micelles into the serum phase, due to the temperature-dependent equilibrium between micellar and soluble caseins [22,23]. Before processing, the refrigerated milk was therefore brought to 15–18 °C, according to the operating conditions adopted in the dairy plant. Then the milk was pasteurized using HTST (High Temperature Short Time) treatment at 71–74 °C for 15–20 s, then rapidly cooled to 36–39 °C. Coagulation took place in stainless steel vats maintained at 36–39 °C, with the addition of 6% natural whey starter (60 °SH/100 mL) and 0.03% (v/v) liquid calf rennet (Caglificio Clerici S.p.A., Cadorago (CO), Italy), characterized by a coagulating activity of 110 IMCU (1:10,000) and an enzymatic composition of 80% chymosin and 20% pepsin. The mixed enzymatic-acid coagulation process was carried out in a double-jacketed stainless steel cheese vat (Tecnolatte S.r.l., Lodi, Italy) equipped with a thermostatic temperature control system, maintaining the milk temperature at 36–39 °C throughout coagulation. Approximately 60 min after adding the rennet, the curd was broken manually with a “spino” (thorn) until granules of 3–6 cm were obtained. After 15–25 min, part of the whey was removed to promote syneresis. The curd was then left to acidify under whey for 3–4 h, maintaining the temperature at 46 °C by adding small amounts of hot whey. Maturation took place through natural fermentation until a pH in the range 4.8–4.95 was reached. The mature curd was finely chopped and immersed in water at a temperature between 80 and 95 °C, with a water/paste ratio of approximately 1.5:1. The stretching, carried out manually for 3.5–6 min, continued until a homogeneous, shiny and stringy paste was obtained, with a final temperature of 68–70 °C. The forming was carried out manually (“rotation”) to obtain 50 and 100 g weights of the buffalo mozzarella, which were immediately immersed in cold water to promote firming. Salting was carried out by immersing the buffalo mozzarella in a saline solution containing 18% NaCl for a maximum period of 1 h. Finally, the finished buffalo mozzarella was immersed in a preservative liquid consisting of acidulated water (using lactic acid, pH 5.5) containing 3% sodium chloride (NaCl).
2.3. pH, Moisture and Dry Matter Determination
The pH value was determined using a SevenDirect SD20 pH meter (Mettler-Toledo S.p.a, Milano, Italy) equipped with a temperature probe. The moisture content of the samples was determined according to the ISO 5534/IDF 4:2004 regulation (Cheese and processed cheese—determination of the total solids content, reference method) by oven drying at 102 ± 2 °C until constant weight [24]. Results are expressed as moisture content (%, w/w).
2.4. Determination of Total Nitrogen and Protein Content
The total nitrogen (TN) content was determined according to the official Kjeldahl method [25], while to determine the protein content, the total nitrogen value obtained was multiplied by the correction factor 6.38 (according to the ISO 8968-1:2014 international reference standard method).
2.5. Fat Content Determination
The fat content determination was performed according to the microwave-assisted extraction (MAE) method reported by Pombal et al. [26], with some modifications. Extraction was performed using a microwave extractor ETHOS UP (Milestone S.p.A., Sorisole (BG), Italy) equipped with an SK-15 rotor. Approximately 2.5 g of sample was weighed into a microwave tube, followed by the addition of 25 mL of hexane and 10 mL of concentrated sulfuric acid (98%, w/w). The acid treatment was applied to promote disruption of the dairy matrix and release of the lipid fraction prior to solvent extraction, in accordance with the general principle of acid-assisted lipid extraction described for dairy matrices [27]. After inserting a magnetic stirring rod, the tube was placed in the vessel and sealed. Once the extractor was loaded, the following temperature program was applied:
- –
- Heating phase: from 25 °C to 100 °C in 10 min.
- –
- Extraction phase: 100 °C for 30 min.
- –
- Cooling phase: from 100 °C to 25 °C in 20 min.
The power was set to 1400 W. At the end of the extraction, the supernatant was collected, filtered through filter paper and dried at 45 °C using a Rotavapor Labourota4000-Efficient (Heidolph Instrument, Schwabach, Germany). The fat content was expressed as g of fat per 100 g of product on a wet-weight basis (g/100 g product). For matrices characterized by a low fat content, particularly whey and stretching water, multiple extractions were performed under the same experimental conditions. The lipid extracts obtained from the replicate extractions were pooled before solvent evaporation in order to recover a sufficient amount of fat for the subsequent fatty acid, triglyceride, and cholesterol analyses.
2.6. Fatty Acid Profile Determination
Fatty acid methyl esters (FAME) were quantified, after transesterification, by gas chromatography (GC) analysis. The fatty acid composition was determined using a gas chromatograph equipped with a flame ionization detector (FID) (Agilent Technologies 6850 Series II, Santa Clara, CA, USA). The analytical procedure was adapted from the method described by Romano et al. [28]. Briefly, a 1% (w/v) fat solution in hexane was prepared. An aliquot (1 mL) of this solution was mixed with 300 µL of 2 N methanolic KOH and vortexed for 1 min at room temperature. After phase separation, 1 µL of the upper phase containing the FAME was collected using a GC syringe and injected into the gas chromatograph. The GC was equipped with a programmed temperature vaporizer (PTV) operating in split mode. The injector temperature was initially set at 85 °C for 0.1 min, then increased at 500 °C/min to 220 °C and maintained for 5 min. The split ratio was 20:1. The oven temperature was programmed as follows: 85 °C for 1 min, increased at 6 °C/min to 120 °C, then at 5 °C/min to 160 °C, and finally at 7 °C/min to 250 °C, which was maintained for 20 min. The FID temperature was set at 250 °C. Fatty acid identification was based on comparison of retention times of samples with those of the external 37-component FAME standard (Supelco, Bellefonte, PA, USA). Individual trans-C18:1 isomers were not chromatographically resolved under the adopted analytical conditions; therefore, the corresponding peak was reported as total trans-C18:1.
Instrument performance was monitored by repeated injections of the standard mixture to verify retention time stability and chromatographic repeatability throughout the analytical sequence. The results are reported as relative percentage values. Fatty acids were classified according to carbon-chain length as short-chain fatty acids (SCFA, C4–C10), medium-chain fatty acids (MCFA, C11–C16), and long-chain fatty acids (LCFA, C17–C24), according to Pegolo et al. [29].
2.7. Triglyceride Determination
Triglyceride (TG) determination was performed according to the method described by Romano et al. [30], with some modifications. In particular, a 5% fat solution in chloroform was prepared and vortexed for 2 min; then, 1 µL of the solution was injected into an Agilent Technologies 8890N gas chromatograph (GC/FID) equipped with Programmable Temperature Vaporization (PTV) (Agilent Technologies 8890N, Santa Clara, CA, USA). The column used was a Restek RTX-65TG capillary column (30 m, 0.25 mm ID and 0.10 µm) (Restek Corporation, Bellefonte, PA, USA). The operating conditions were as follows: PTV at 60 °C for 0.1 min, with an increase of 500 °C/min up to 380 °C for 5 min. The oven temperature was set to 80 °C for 1 min, followed by an increase of 30 °C/min up to 240 °C for 0.1 min and then 4 °C/min up to 360 °C for 5 min. Helium (He) was used as the carrier gas at a flow rate of 2 mL/min, with a split ratio of 15:1. TGs were identified by comparing their retention times with a certified reference material for anhydrous milk fat CRM 519 provided by the Community Reference Office (European Commission, Brussels, Belgium). The results were expressed as relative percentages (%).
2.8. Cholesterol Determination
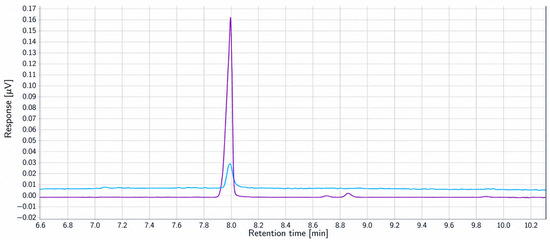
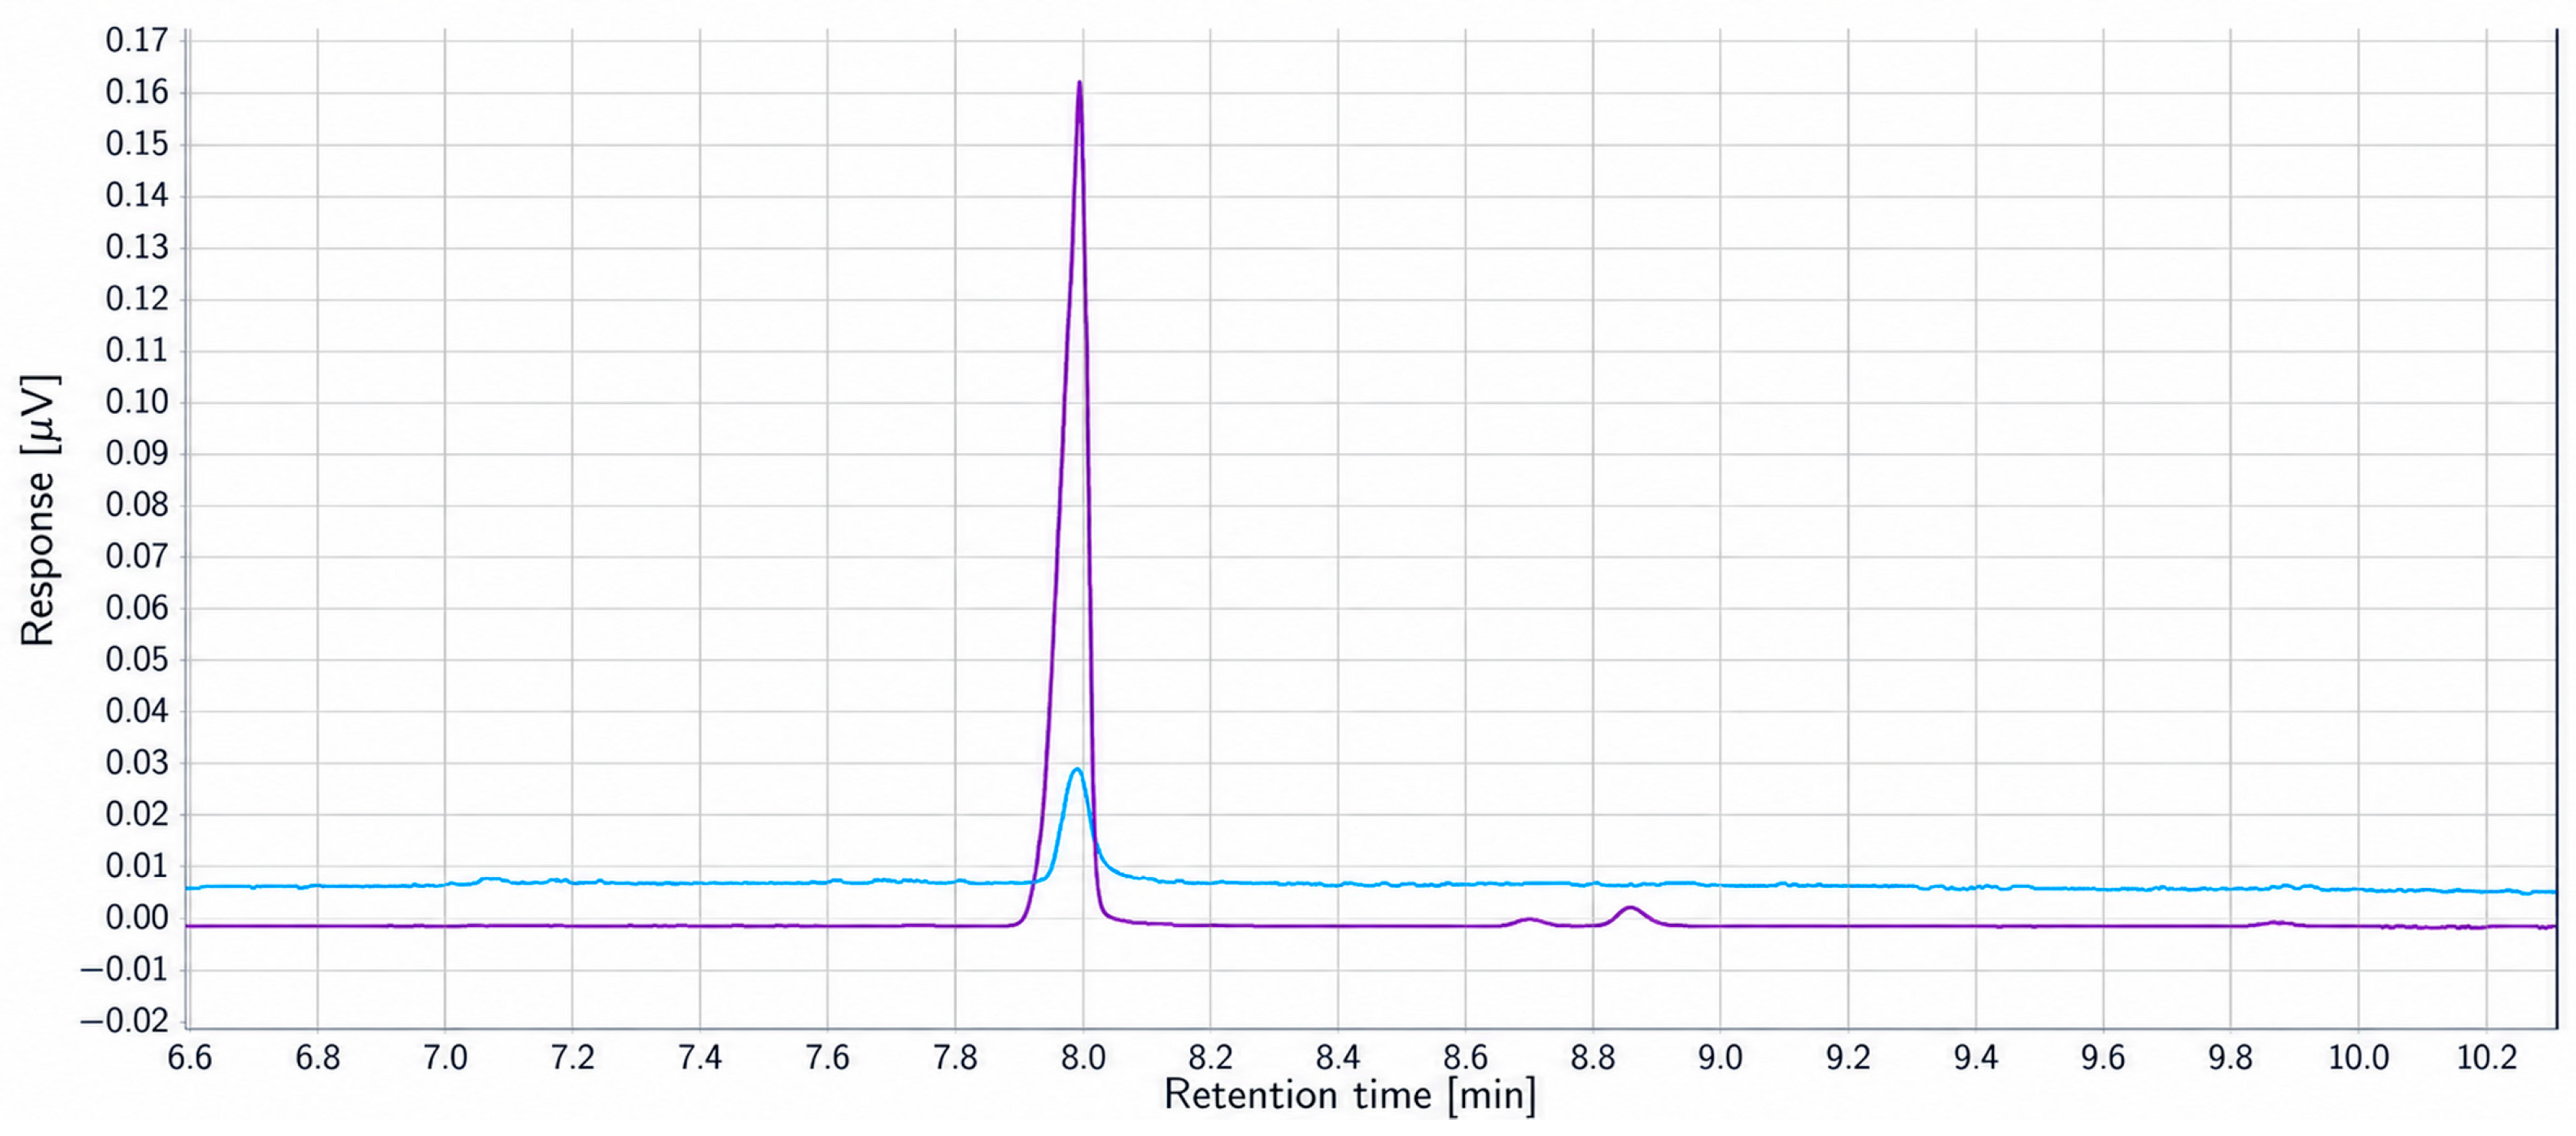
Cholesterol determination was performed according to the method reported by Romano et al. [31], with appropriate modifications. Briefly, a 5% fat solution with chloroform was prepared and vortexed for 1 min. Afterward, 400 µL of a 2 N solution of KOH in methanol was added, and the mixture was vortexed again for 1 min. Then 800 µL of 1 N HCl was added. After vortexing for 1 min, the sample was centrifuged at 4000 rpm for 5 min. One microliter of the resulting supernatant was injected into an Agilent Technologies 8890N gas chromatograph equipped with a programmed temperature vaporizer (PTV), a flame ionization detector (FID) and a Restek RTX-65TG capillary column (30 m, 0.25 mm ID and 0.10 µm) (Restek Corporation, Bellefonte, PA, USA). The inlet was maintained at 80 °C for 0.1 min before increasing at 500 °C per min till T = 380 °C, where it remained for seven min. The oven program started at 80 °C for 0.1 min, then increased by 50 °C per min to 280 °C, remaining at that temperature for 15 min. Helium (He) was used as the carrier gas at a rate of 2 mL/min. A split ratio of 5:1 was used throughout the process. Cholesterol was identified by comparing the peak retention time of the sample with that of an external cholesterol analytical standard (Sigma-Aldrich, St. Louis, MO, USA), which was eluted at 7.9 min as shown in Figure 2. Quantification was performed using a four-point calibration curve (40, 50, 100, and 150 ppm; R2 = 0.9932), and the final results are expressed as milligrams of free cholesterol per 100 g of fat. All samples were analyzed in triplicate. The instrumental limit of detection (LOD) for cholesterol was 5 ppm.
Figure 2.
Overlap between the cholesterol peak of a buffalo milk sample (blue) and the external standard (purple).
2.9. Statistical Analysis
All analytical determinations were performed in triplicate for each production batch, and the results are reported as mean ± standard deviation (SD) of the analytical replicates. The individual production batch was considered the experimental unit (n = 10), while triplicate determinations were considered analytical replicates and were averaged to obtain a single value for each batch and matrix. Data were subjected to one-way analysis of variance (ANOVA), after verification of normality (Shapiro–Wilk test) and homogeneity of variances (Levene’s test). Mean comparisons were performed using Fisher’s least significant difference (LSD) test. Differences were considered statistically significant at p < 0.05. Statistical analyses were performed using XLSTAT software (version 2025.1, Lumivero, Denver, CO, USA).
3. Results and Discussion
3.1. Evaluation of pH, Dry Matter, Buffalo Milk Protein Content, Curd, Whey, Buffalo Mozzarella, and Stretching Water
The analysis of the physicochemical parameters allowed the compositional changes occurring among milk (M), curd (C), whey (W), mozzarella cheese (MC), and stretching water (SW) during buffalo mozzarella production to be evaluated. Buffalo milk showed pH values ranging from 6.62 to 6.75, dry matter contents from 16.85 to 18.14%, moisture contents from 81.85 to 83.13%, and protein contents from 4.54 to 5.79% across the ten production batches (Table 1).
Table 1.
Values of pH, dry matter, moisture and protein content of milk (M) from ten different processes.
These values are consistent with the typical composition of buffalo milk and confirm its high solids and protein content [32]. During the transformation process, milk coagulation leads to the formation of curd (C). The results are reported in Table 2, where the ten samples evaluated are indicated with numbers from C1 to C10 corresponding to the batches analyzed.
Table 2.
Values of pH, dry matter, moisture and protein content of Curd (C) from ten different processes.
As shown in Table 2, curd samples exhibited pH values ranging from 4.54 to 4.86, dry matter contents from 52.63 to 58.75%, moisture contents from 41.24 to 47.35%, and protein contents from 19.05 to 20.91%. Compared with the initial buffalo milk, curd was characterized by lower pH and moisture and markedly higher protein content. This trend is consistent with the acidification and coagulation processes, which promote casein aggregation and the formation of a protein-rich curd, accompanied by the separation of the aqueous whey phase [33]. Whey (W), obtained following curd separation, showed pH values ranging from 4.51 to 4.85, dry matter contents from 5.80 to 6.70%, moisture contents from 93.29 to 94.18%, and protein contents from 1.17 to 1.72% across the ten production batches (Table 3). The high moisture and relatively low protein contents are consistent with the nature of whey as the aqueous phase separated during curd formation. The residual protein fraction mainly reflects proteins remaining in the soluble phase after casein coagulation.
Table 3.
Values of pH, dry matter, moisture and protein content of Whey (W) from ten different processes.
Mozzarella cheese (MC), obtained after curd stretching and shaping, showed pH values ranging from 5.65 to 5.83, dry matter contents from 39.70 to 49.09%, moisture contents from 50.90 to 60.31%, and protein contents from 14.07 to 17.70% across the ten production batches (Table 4). Compared with curd, mozzarella cheese showed higher pH and moisture contents and lower dry matter and protein contents. These changes are consistent with the transformations occurring during the stretching and shaping steps, during which the curd undergoes structural reorganization and interacts with the hot stretching water [34]. The observed variability in mozzarella moisture content may also be influenced by differences in water incorporation and retention during processing.
Table 4.
Values of pH, dry matter, moisture and protein content of Mozzarella Cheese (MC) from ten different processes.
Finally, stretching water (SW) showed pH values ranging from 5.65 to 5.99, dry matter contents from 1.04 to 5.76%, moisture contents from 94.24 to 98.95%, and protein contents from 0.72 to 1.69% across the ten production batches (Table 5). As expected for the aqueous medium used during curd stretching, SW was characterized by a high moisture content and relatively low dry matter and protein contents. The presence of solids and proteins in this processing stream is consistent with the transfer of soluble and dispersed components from the curd into the stretching water during the stretching step [35]. The results obtained agree with those previously reported [36,37], which describe similar trends in chemical-physical parameters throughout the various stages of buffalo mozzarella production. Differences in pH, moisture and protein content reflect the structural and biochemical changes occurring during processing [38,39,40] and confirm the consistency of the experimental data collected. Although some production batches showed identical or very similar values for individual physicochemical parameters, each batch represented a separate production process. The observed similarities reflect the relatively limited variability of some compositional parameters under the industrial processing conditions investigated.
Table 5.
Values of pH, dry matter, moisture and protein content of Stretching Water (SW) from ten different processes.
3.2. Fat Distribution in the Buffalo Mozzarella Processing Steps
The analysis conducted on samples taken at different months from November 2024 to March 2025 in the various processing stages revealed a significant variability in fat distribution throughout the entire process of transforming buffalo milk into mozzarella cheese. This variability can be attributed to (i) fluctuations in the lipid content of the incoming milk and to the technological conditions adopted in the coagulation and (ii) the stretching step, which determines the efficiency of fat retention in intermediate and final products [41].
The fat content of raw buffalo milk ranged from 6.07 to 8.00 g/100 g product (wet basis) across the ten production batches. These values fell within the compositional range expected for buffalo milk and showed moderate batch-to-batch variability. Table 6 reports the fat content of the different processing matrices across the ten production batches, expressed as g fat/100 g product on a wet-weight basis.
Table 6.
Fat content (g/100 g product, wet basis) in milk (M), curd (C), whey (W), mozzarella cheese (MC), and stretching water (SW) across the ten production batches (1–10).
Across the ten production batches, curd showed the highest fat concentration, ranging from 27.82 to 38.54 g/100 g product, followed by mozzarella cheese (19.27–26.16 g/100 g product) and raw milk (6.07–8.00 g/100 g product). Considerably lower fat concentrations were observed in whey (0.27–2.15 g/100 g product) and stretching water (0.23–2.20 g/100 g product). The fat content observed in raw buffalo milk was consistent with the compositional variability reported for Italian Mediterranean buffalo milk [2,32]. Such variability may be related to biological and zootechnical factors, including stage of lactation, season, and feeding conditions, which are known to influence the lipid content and composition of buffalo milk [32]. The higher fat concentration observed in curd compared with milk is consistent with the incorporation of milk fat globules into the coagulated casein matrix and the simultaneous separation of a large proportion of the aqueous phase as whey [35,42]. During coagulation, most of the lipid fraction is physically entrapped within the curd structure, whereas a smaller fraction can be transferred to whey as dispersed fat globules [17,30,33]. Accordingly, whey showed substantially lower fat concentrations than curd in all production batches. However, fat concentration alone does not provide a quantitative estimate of lipid partitioning, since whey represents a considerably larger process stream than curd. Therefore, the actual contribution of whey to fat transfer must be evaluated by considering both its mass and its fat concentration. A decrease in fat concentration was observed from curd to mozzarella cheese, with values ranging from 27.82–38.54 g/100 g product in curd to 19.27–26.16 g/100 g product in mozzarella cheese. This change is associated with the compositional and structural modifications occurring during stretching, during which the curd is exposed to hot water and undergoes extensive rearrangement of the protein matrix [17,34]. Stretching water contained relatively low fat concentrations (0.23–2.20 g/100 g product), indicating that a fraction of the lipid material can be transferred from the curd to the aqueous phase during stretching. The extent of this transfer may be influenced by processing conditions, including temperature, acidity, and stretching time, which can affect the structural organization of the curd and the release of dispersed lipid material [17,18,33,43]. The calculated fat mass balance showed minor deviations from complete closure in some production batches. These discrepancies may reflect experimental uncertainty arising from the combination of process-stream mass measurements and analytical determination of fat concentration and should not be interpreted as actual increases in fat during processing. Therefore, the mass-balance data were used primarily to describe the overall partitioning of fat among the different processing streams. Overall, the concentration data indicate a characteristic distribution of fat among the processing matrices, with curd and mozzarella cheese representing the most lipid-rich fractions and whey and stretching water showing substantially lower fat concentrations. Nevertheless, because the different processing streams differ markedly in mass, concentration data alone cannot be used to quantify fat retention or losses during cheesemaking. For this reason, process-stream masses and the corresponding absolute fat masses were considered to provide a quantitative assessment of lipid partitioning throughout buffalo mozzarella production.
The evaluation of process-stream masses provided additional information for interpreting lipid partitioning during buffalo mozzarella production (Table 7). Curd production ranged from 19.43 to 24.18 kg per 100 kg of initial milk, whereas whey represented the largest process stream, ranging from 75.83 to 80.53 kg/100 kg initial milk. Mozzarella cheese production ranged from 26.03 to 30.25 kg/100 kg initial milk, corresponding to the cheese yield of the ten production batches. These results indicate relatively limited batch-to-batch variability in cheese yield, despite the compositional variability observed in the initial milk and intermediate processing matrices. When fat concentration was combined with the mass of each processing stream, a more quantitative picture of lipid partitioning was obtained (Table 8). The initial milk contained between 6.07 and 8.00 kg of fat per 100 kg of milk. Following coagulation, the fat mass associated with the curd ranged from 5.73 to 7.50 kg/100 kg initial milk, whereas the corresponding fat mass in whey ranged from 0.22 to 1.63 kg/100 kg initial milk. Thus, despite its relatively low fat concentration, whey represented a quantitatively relevant pathway for fat transfer because of the large mass of this process stream. This observation confirms the importance of considering both fat concentration and process-stream mass when evaluating lipid partitioning during cheese-making [17,30,33]. Following stretching and shaping, the fat mass associated with mozzarella cheese ranged from 5.20 to 7.22 kg/100 kg initial milk, while stretching water contained considerably smaller amounts, ranging from 0.02 to 0.24 kg fat/100 kg initial milk. The comparatively low absolute fat mass associated with stretching water indicates that, although lipid material can be released from the curd during stretching, this stream accounted for a smaller quantitative fraction of the fat transferred to the aqueous processing streams. The release of fat during this stage may be influenced by the structural rearrangement of the curd under the combined effects of temperature, acidity, and mechanical treatment [17,18,33,43]. Overall, the mass-balance approach complements the concentration data reported in Table 6 and provides a more appropriate description of lipid partitioning throughout buffalo mozzarella production. In particular, the results show that the quantitative relevance of a processing stream cannot be inferred from its fat concentration alone. Whey, despite its low fat concentration, can account for a measurable amount of fat because of its high process mass, whereas stretching water contributes a smaller absolute fat mass. Most of the fat associated with the initial milk was therefore found in the curd after coagulation and subsequently in mozzarella cheese after stretching, consistent with the physical entrapment of milk fat globules within the casein matrix during cheesemaking [35,42].
Table 7.
Process stream masses and cheese yield across the ten buffalo mozzarella production batches (1–10). Process stream masses are expressed as kg per 100 kg of initial milk. Cheese yield was calculated as the amount of mozzarella cheese obtained per 100 kg of initial milk.
Table 8.
Fat mass distribution (kg/100 kg initial milk) among the different processing streams across the ten production batches (1–10).
3.3. Fatty Acid Profile in Milk, Curd, Whey, Buffalo Mozzarella and Stretching Water
The fatty acid composition and the relative proportions of the different fatty acid classes in milk (M), curd (C), whey (W), mozzarella cheese (MC), and stretching water (SW) are reported in Table 9. Differences in the relative fatty acid composition were observed among the processing matrices.
Table 9.
Fatty acid profile, fatty acid classes and ratios of milk, curd, whey, mozzarella cheese and stretching water (data average is reported).
Saturated fatty acids (SFA) represented the predominant fatty acid class in all matrices, accounting for 66.16% in milk, 66.80% in curd, 68.50% in whey, 64.35% in mozzarella cheese, and 71.46% in stretching water. Conversely, the proportion of unsaturated fatty acids (UFA) was 33.84% in milk, 33.20% in curd, 31.50% in whey, 35.65% in mozzarella cheese, and 28.54% in stretching water. The predominance of SFA is consistent with the characteristic fatty acid composition of buffalo milk and dairy products reported in the literature [30,44]. Among unsaturated fatty acids, MUFA represented the major fraction, with values ranging from 24.12% in stretching water to 31.27% in mozzarella cheese, while PUFA accounted for a smaller proportion of total fatty acids, ranging from 3.37% in whey to 5.44% in milk. Differences were also observed in the relative proportions of short-, medium-, and long-chain fatty acids among the processing matrices, suggesting that the lipid fractions recovered at the different stages of cheesemaking were characterized by different relative fatty acid profiles [19,20]. However, since fatty acid composition is expressed as relative percentages of total fatty acids, an increase or decrease in the relative proportion of an individual fatty acid or fatty acid class cannot, by itself, be interpreted as evidence of selective retention or loss during processing. Among individual fatty acids, palmitic acid (C16:0) was one of the predominant saturated fatty acids in all matrices, ranging from 20.38% in milk to 23.07% in whey. Myristic acid (C14:0) also represented a major component, with values ranging from 17.92% in curd to 20.73% in whey, whereas stearic acid (C18:0) showed comparatively limited variation among the matrices, ranging from 10.28% in mozzarella cheese to 11.22% in whey. These results confirm that the major saturated fatty acids remained quantitatively important components of the lipid fraction throughout the different stages of buffalo mozzarella production [30,45,46]. Among unsaturated fatty acids, oleic acid (C18:1n9c) represented the major cis-monounsaturated fatty acid. Its relative proportion was lower in milk (10.31%) than in curd (17.30%), whey (17.37%), mozzarella cheese (17.30%), and stretching water (16.45%). Linoleic acid (C18:2n6c), one of the principal polyunsaturated fatty acids identified, showed more limited differences among the matrices, with values ranging from 2.55% in mozzarella cheese to 3.03% in curd. Overall, these results indicate that the relative contribution of the major fatty acids to the total lipid profile changed among the different processing matrices. Nevertheless, these variations should be interpreted as changes in relative fatty acid composition rather than as direct evidence of preferential transfer or retention of individual fatty acids during cheesemaking [19,30].
3.4. Triglyceride Profile in Milk, Curd, Whey, Mozzarella and Stretching Water
The triglyceride (TG) profile of the different matrices analyzed during the buffalo mozzarella process is reported in Table 10.
Table 10.
Triglycerides (TG) profile in the analyzed samples (average data are reported).
Overall, the relative triglyceride distribution was broadly similar among milk, curd, whey, mozzarella cheese, and stretching water. Low-carbon-number triglycerides (C24–C32) represented a relatively small proportion of the total triglyceride fraction and showed only limited variations among the different processing matrices. Similarly, triglycerides in the C34–C42 range represented a substantial proportion of the triglyceride profile, with C36 and C38 among the most abundant families. In particular, C38 ranged from 16.25% in milk to 17.57% in mozzarella cheese, whereas C36 ranged from 14.26% in milk to 15.83% in mozzarella cheese. Higher-carbon-number triglycerides (C44–C54) also showed generally comparable relative proportions among the processing matrices, although some differences were observed for individual triglyceride families. In particular, C46 and C48 showed lower relative proportions in mozzarella cheese (5.37% and 7.67%, respectively) compared with milk (6.43% and 8.94%, respectively), whereas the remaining high-carbon-number triglycerides showed comparatively limited variations. The overall distribution was consistent with previous findings reported for buffalo mozzarella and buffalo milk fat [30]. Taken together, these results indicate that the overall relative triglyceride profile was largely maintained across the different processing matrices, despite variations in the relative abundance of some individual triglyceride families. This suggests that the technological steps involved in buffalo mozzarella production did not result in major changes in the overall triglyceride composition of the recovered lipid fractions [34]. However, since triglycerides were expressed as relative percentages of the total triglyceride fraction, differences among matrices should be interpreted as changes in relative composition rather than as direct evidence of selective retention or loss of individual triglyceride families during processing.
3.5. Free Cholesterol Content in Milk, Curd, Whey, Mozzarella and Stretching Water
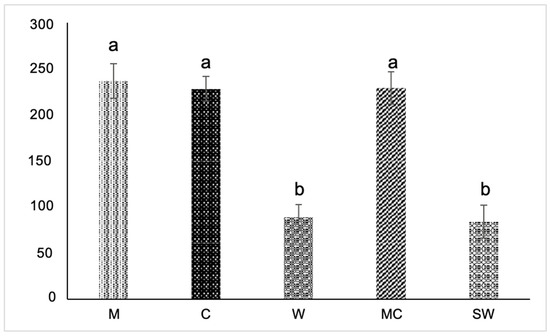
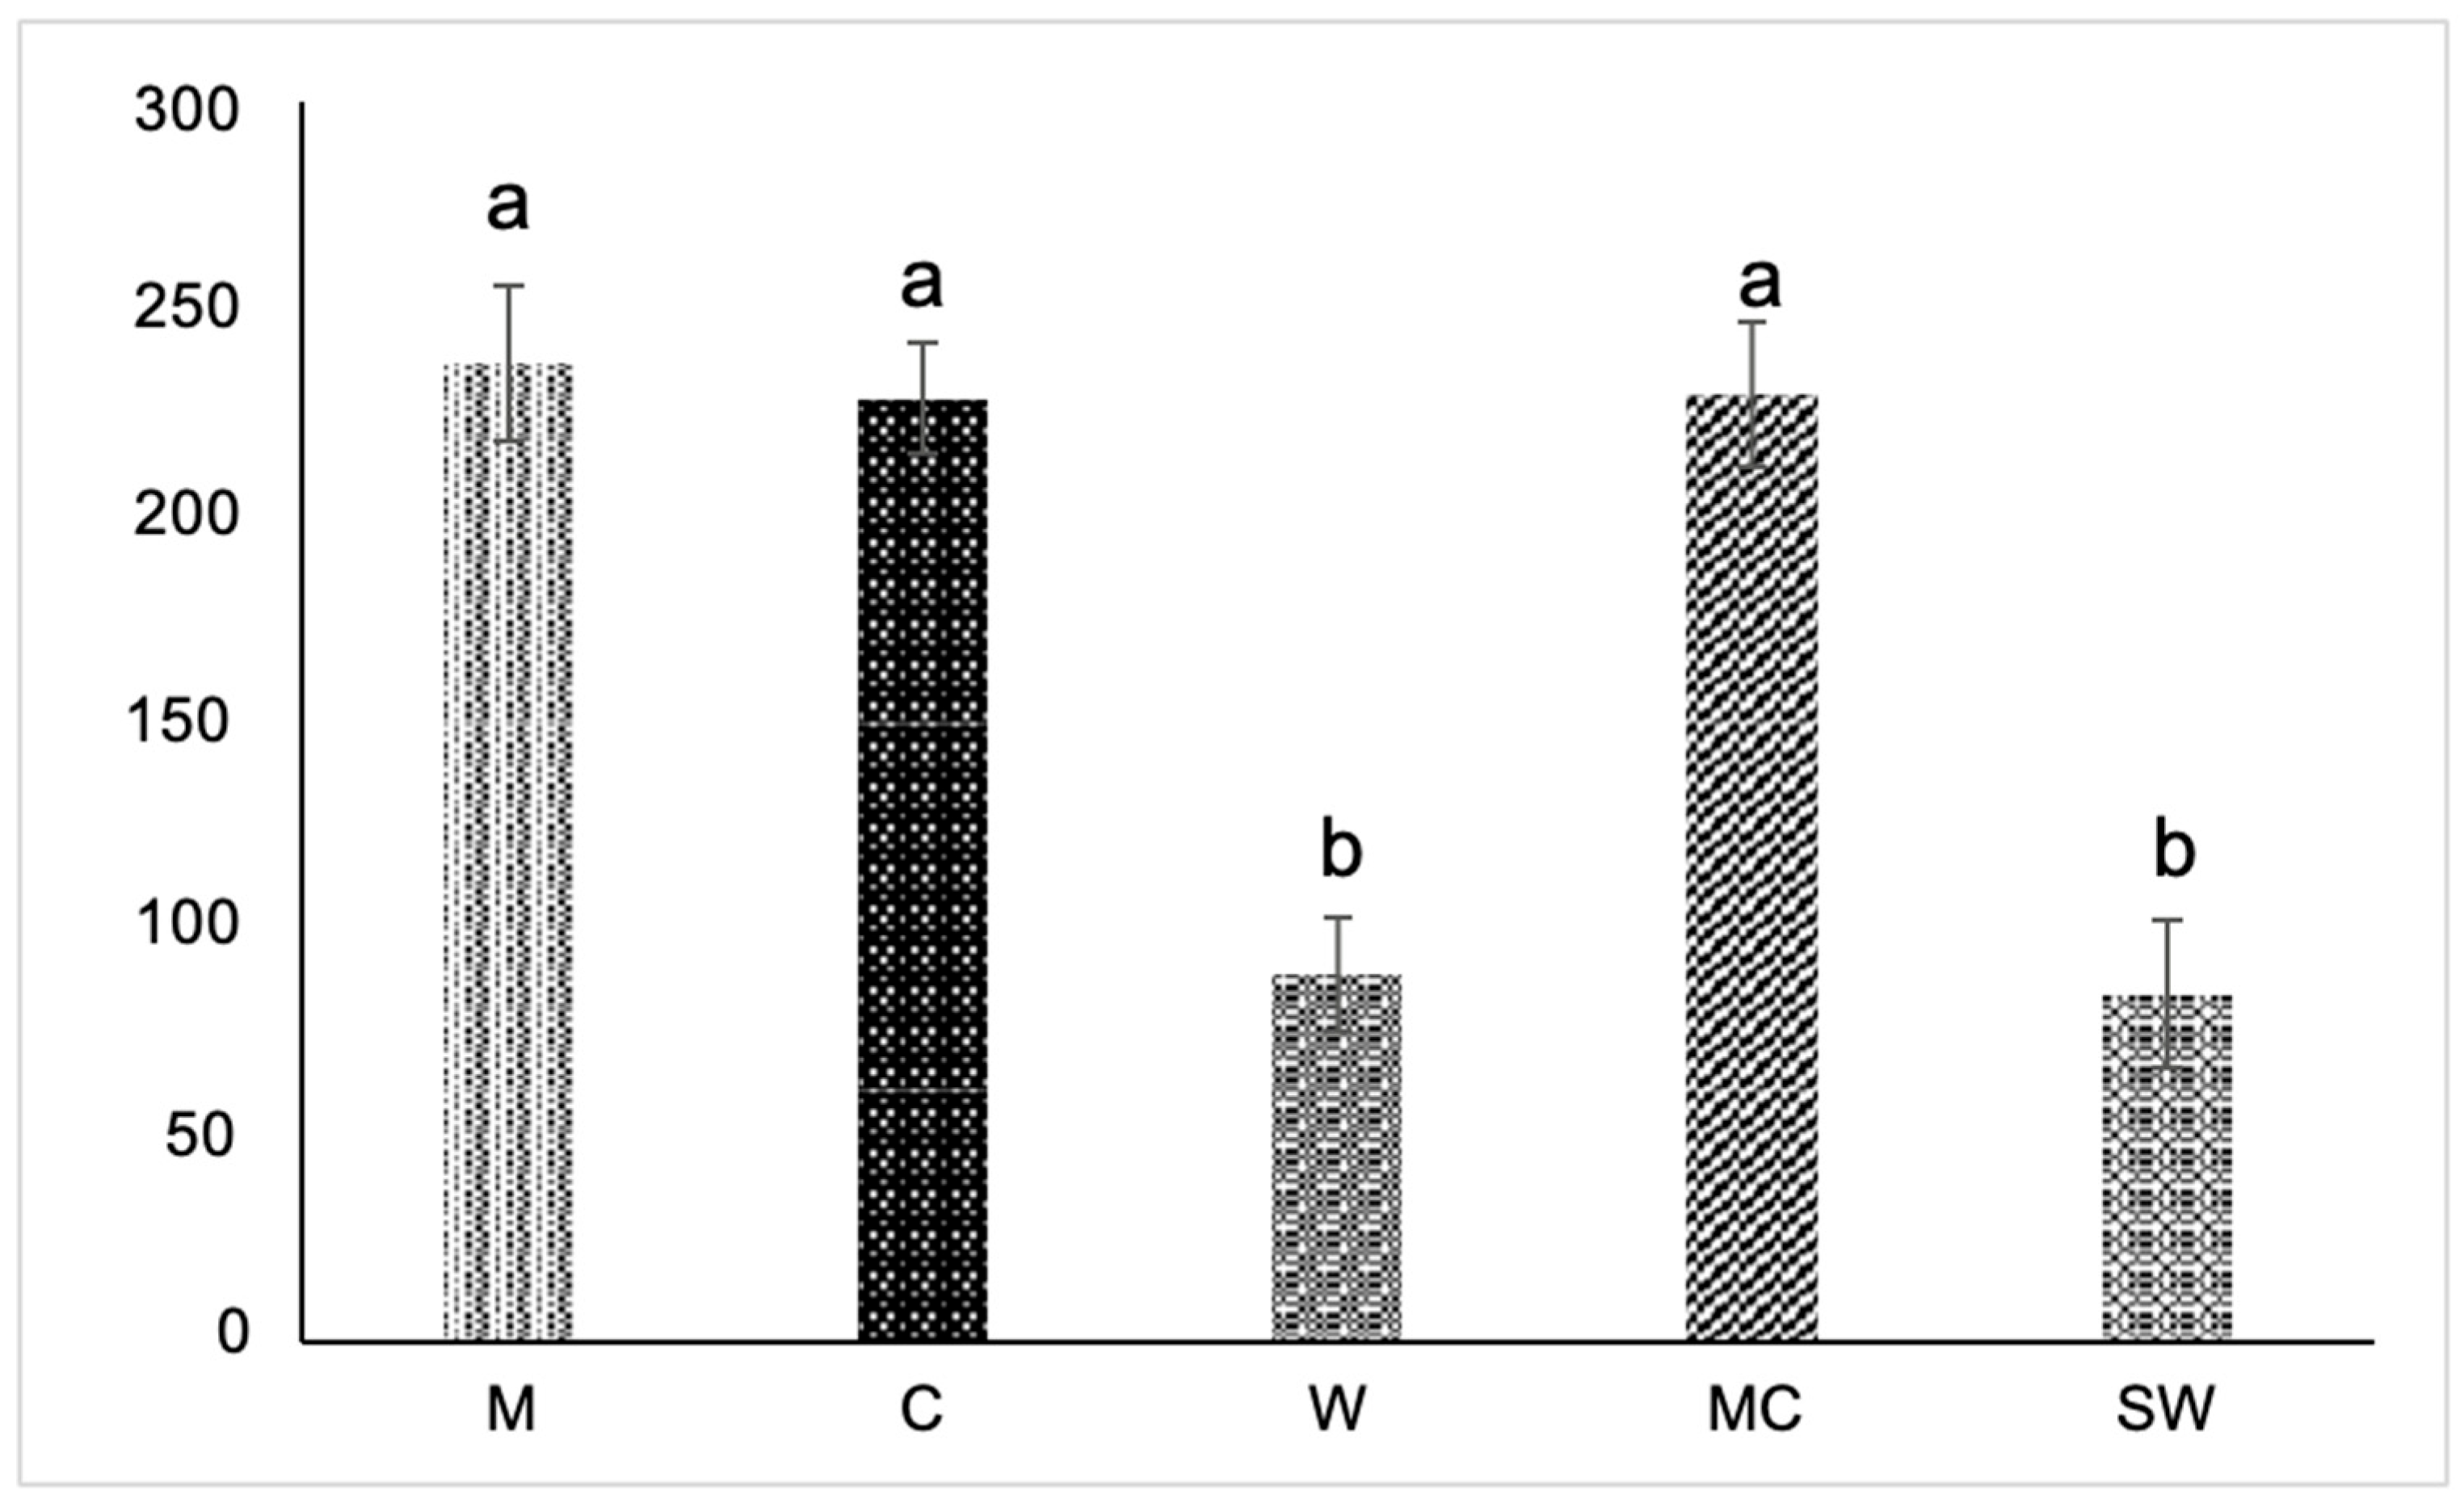
The free cholesterol content analysis in the different dairy matrices shown in Figure 3 indicates variable values between M, C, W, MC, and SW. Buffalo milk showed a free cholesterol concentration of approximately 237 mg/100 g fat, which decreased slightly in C (228 mg/100 g fat) and MC (229 mg/100 g fat).
Figure 3.
Free cholesterol content (mg/100 g fat) in milk (M), curd (C), whey (W), mozzarella cheese (MC), and stretching water (SW). Data are expressed as mean ± standard deviation (SD) across the ten independent production batches (n = 10). Different letters above the bars indicate statistically significant differences among the matrices (p < 0.05), whereas bars sharing the same letter are not significantly different.
The analysis of free cholesterol content showed differences among the lipid fractions recovered from the different processing matrices (Figure 3). Buffalo milk showed a free cholesterol concentration of approximately 237 mg/100 g fat, with comparable values observed in curd (228 mg/100 g fat) and mozzarella cheese (229 mg/100 g fat). In contrast, whey and stretching water showed lower cholesterol concentrations, approximately 89 and 84 mg/100 g fat, respectively. These results indicate that the lipid fractions of curd and mozzarella cheese maintained cholesterol concentrations comparable to those of the initial milk fat, whereas lower values characterized the lipid fractions recovered from the aqueous processing streams. However, since cholesterol was expressed as mg/100 g of extracted fat, these differences describe the cholesterol concentration within the recovered lipid fraction and should not be interpreted as the total amount of cholesterol transferred to each processing stream. Moreover, the low amount of fat recovered from whey and stretching water should be considered when interpreting these values. The cholesterol concentration observed in milk was generally consistent with values previously reported for buffalo milk fat [47,48], while differences among buffalo milk and dairy products may also reflect the natural variability reported in the literature [45,46]. Overall, the results suggest that buffalo mozzarella processing is associated with differences in the distribution of cholesterol among the lipid fractions recovered from the different processing matrices.
4. Conclusions
Overall, the data reported highlights how the lipid quality and distribution in the buffalo mozzarella are closely linked to the process conditions and to the composition of the starting buffalo milk. Future studies should further investigate the relationship between technological variables (pH, temperature, stretching duration) and mozzarella cheese microstructure, as well as evaluate the impact of zootechnical, climate, and dietary factors on the lipid composition and nutritional profile of the derived products. This information could contribute to the optimization and standardization of the buffalo mozzarella production process investigated in this study, with potential positive impacts on product quality and nutritional value.
Author Contributions
Conceptualization, R.R., A.S. and L.D.L.; Methodology, R.R. and A.S.; Software, M.C.; Validation, A.S., L.D.L. and R.R.; Formal Analysis, G.B., S.A. and A.S.; Investigation, S.A., M.C., A.R. and G.B.; Resources, R.R.; Data Curation, A.R., L.D.L. and G.B.; Writing—Original Draft Preparation, S.A., L.D.L., A.S., G.B. and R.R.; Writing—Review & Editing, A.S., R.R., L.D.L. and S.A.; Visualization, A.S., G.B., M.C., S.A. and A.R.; Supervision, A.S., L.D.L. and S.A.; Project Administration, R.R.; Funding Acquisition, R.R. and L.D.L. All authors have read and agreed to the published version of the manuscript.
Funding
This research received no external funding.
Data Availability Statement
The raw data supporting the conclusions of this article will be made available by the authors on request.
Acknowledgments
The authors wish to thank the “Caseificio F.lli Beneduce”, Sant’Anastasia (NA), Italy, for providing the samples subject to analysis, and the Foodtech S.r.L. (Alessandro Acunzo) in Napoli, Italy, for the research support.
Conflicts of Interest
The authors declare no conflicts of interest.
References
- FAO. FAOSTAT: Production: Crops and Livestock Products; Food and Agriculture Organization of the United Nations: Rome, Italy, 2024. [Google Scholar]
- Gantner, V.; Mijić, P.; Baban, M.; Škrtić, Z.; Turalija, A. The Overall and Fat Composition of Milk of Various Species. Mljekarstvo 2015, 65, 223–231. [Google Scholar] [CrossRef] [Scilit]
- Varricchio, M.L.; Di Francia, A.; Masucci, F.; Romano, R.; Proto, V. Fatty Acid Composition of Mediterranean Buffalo Milk Fat. Ital. J. Anim. Sci. 2007, 6, 509–511. [Google Scholar] [CrossRef] [Scilit]
- Waldron, D.S.; Hoffmann, W.; Buchheim, W.; McMahon, D.J.; Goff, H.D.; Crowley, S.V.; Moloney, C.; O’Regan, J.; Giuf-frida, F.; Celigueta Torres, I.; et al. Role of Milk Fat in Dairy Products. In Advanced Dairy Chemistry, Volume 2: Lipids; McSweeney, P.L.H., Fox, P.F., O’Mahony, J.A., Eds.; Springer International Publishing: Cham, Switzerland, 2020; pp. 245–305. [Google Scholar]
- Nguyen, H.T.H.; Ong, L.; Beaucher, E.; Madec, M.-N.; Kentish, S.E.; Gras, S.L.; Lopez, C. Buffalo Milk Fat Globules and Their Biological Membrane: In Situ Structural Investigations. Food Res. Int. 2015, 67, 35–43. [Google Scholar] [CrossRef] [Scilit]
- Zotos, A.; Bampidis, V.A. Milk Fat Quality of Greek Buffalo (Bubalus bubalis). J. Food Compos. Anal. 2014, 33, 181–186. [Google Scholar] [CrossRef] [Scilit]
- Secchiari, P.L.; Zicarelli, L. Formaggi Da Latte Di Bufala : Aspetti Nutrizionali : La Mozzarella Di Bufala Campana. Georg. Quad. III 2014, 2014, 165–173. [Google Scholar] [CrossRef]
- MacGibbon, A.K.H. Composition and Structure of Bovine Milk Lipids. In Advanced Dairy Chemistry, Volume 2: Lipids; McSweeney, P.L.H., Fox, P.F., O’Mahony, J.A., Eds.; Springer International Publishing: Cham, Switzerland, 2020; pp. 1–32. [Google Scholar]
- Khan, I.T.; Nadeem, M.; Imran, M.; Asif, M.; Khan, M.K.; Din, A.; Ullah, R. Triglyceride, Fatty Acid Profile and Antioxidant Characteristics of Low Melting Point Fractions of Buffalo Milk Fat. Lipids Health Dis. 2019, 18, 59. [Google Scholar] [CrossRef] [Scilit]
- Verma, A.; Meitei, N.S.; Gajbhiye, P.U.; Raftery, M.J.; Ambatipudi, K. Comparative Analysis of Milk Triglycerides Profile between Jaffarabadi Buffalo and Holstein Friesian Cow. Metabolites 2020, 10, 507. [Google Scholar] [CrossRef] [Scilit]
- Godinho, F.M.d.S.; Friedrich, M.T.; Modesto, E.C.; Mota, A.d.S.d. Fatty Acid Profile of Buffalo Milk Produced in Southern Brazil. Acta Sci. Anim. Sci. 2024, 46, e63400. [Google Scholar] [CrossRef] [Scilit]
- Tonhati, H.; Lima, A.L.; Lanna, D.P.; de Camargo, G.M.; Baldi, F.; de Albuquerque, L.G.; Montrezor, J.M. Milk fatty acid characterization and genetic parameter estimates for milk conjugated linoleic acid in buffaloes. J. Dairy Res. 2011, 78, 178–183. [Google Scholar] [CrossRef] [Scilit]
- Ménard, O.; Ahmad, S.; Rousseau, F.; Briard-Bion, V.; Gaucheron, F.; Lopez, C. Buffalo vs. Cow Milk Fat Globules: Size Distribution, Zeta-Potential, Compositions in Total Fatty Acids and in Polar Lipids from the Milk Fat Globule Membrane. Food Chem. 2010, 120, 544–551. [Google Scholar] [CrossRef] [Scilit]
- Magliulo, R.; Valentino, V.; Balivo, A.; Esposito, A.; Genovese, A.; Ercolini, D.; De Filippis, F. Microbiome Signatures Associated with Flavor Development Differentiate Protected Designation of Origin Water Buffalo Mozzarella Cheese from Different Production Areas. Food Res. Int. 2024, 192, 114798. [Google Scholar] [CrossRef] [Scilit]
- Borghese, A.; Chiariotti, A.; Barile, V.L. Buffalo in the World: Situation and Perspectives. In Biotechnological Applications in Buffalo Research; Chauhan, M.S., Selokar, N., Eds.; Springer: Singapore, 2022; pp. 3–31. [Google Scholar]
- Fenga, I.; Alinovi, M.; Paciulli, M.; Mucchetti, G.; Chiavaro, E. Structural and Physico-Chemical Changes of Moz-zarella di Bufala Campana Cheese Influenced by Covering Liquid Composition. Foods 2025, 14, 1506. [Google Scholar] [CrossRef] [Scilit]
- Yadav, D.; Bachan, S.; Tiwari, D.; Chaubey, D.; Verma, V.; Singh, G.; Kumar, S. Milk Processing-Future Problem and Solutions. Int. J. Agric. Ext. Soc. Dev. 2025, 8, 5–13. [Google Scholar] [CrossRef] [Scilit]
- Sharma, P.; Munro, P.A.; Dessev, T.T.; Wiles, P.G. Shear Work Induced Changes in the Viscoelastic Properties of Model Mozzarella Cheese. Int. Dairy J. 2016, 56, 108–118. [Google Scholar] [CrossRef] [Scilit]
- Xia, A.; Zhao, J.; Zhou, P.; Liu, X. Effects of Thermal and Stretching Treatments on the Physicochemical and Functional Properties of Mozzarella Cheese. Food Biosci. 2024, 62, 105543. [Google Scholar] [CrossRef] [Scilit]
- Gonçalves, M.C.; Cardarelli, H.R. Kratki prikaz postupka rastezanja sira mozzarella. Food Technol. Biotechnol. 2021, 59, 82–91. [Google Scholar] [CrossRef] [Scilit]
- Guinee, T.P.; Feeney, E.P.; Auty, M.A.E.; Fox, P.F. Effect of pH and Calcium Concentration on Some Textural and Func-tional Properties of Mozzarella Cheese. J. Dairy Sci. 2002, 85, 1655–1669. [Google Scholar] [CrossRef] [Scilit]
- Møller, T.L.; Nielsen, S.B.; Corredig, M. Novel details on the dissociation of casein micelle suspensions as a func-tion of pH and temperature. J. Dairy Sci. 2023, 106, 8368–8374. [Google Scholar] [CrossRef] [Scilit]
- Dalgleish, D.G.; Corredig, M. The structure of the casein micelle of milk and its changes during processing. Annu. Rev. Food Sci. Technol. 2012, 3, 449–467. [Google Scholar] [CrossRef] [Scilit]
- ISO 5534:2004; Cheese and Processed Cheese—Determination of the Total Solids Content (Reference Method). ISO: Geneva, Switzerland, 2004. Available online: https://www.iso.org/standard/35249.html (accessed on 30 June 2026).
- ISO 8968-1:2014; Milk and Milk Products—Determination of Nitrogen Content. ISO: Geneva, Switzerland, 2014. Available online: https://www.iso.org/standard/61020.html (accessed on 2 July 2026).
- Pombal, S.; Lourenço, J.G.; Rocha, P.; Ettlin, D.; Rodilla, J.M. Comparison of a New Total Fat Quantification Method in Cheese Using Microwave Assisted Extraction (MAE) and Soxhlet. Braz. J. Anal. Chem. 2017, 4, 10–15. [Google Scholar]
- Contarini, G.; Povolo, M. Phospholipids in Milk Fat: Composition, Biological and Technological Significance, and Analytical Strategies. Int. J. Mol. Sci. 2013, 14, 2808–2831. [Google Scholar] [CrossRef] [Scilit]
- Romano, R.; Masucci, F.; Giordano, A.; Musso, S.S.; Naviglio, D.; Santini, A. Effect of Tomato By-Products in the Diet of Comisana Sheep on Composition and Conjugated Linoleic Acid Content of Milk Fat. Int. Dairy J. 2010, 20, 858–862. [Google Scholar] [CrossRef] [Scilit]
- Pegolo, S.; Stocco, G.; Mele, M.; Schiavon, S.; Bittante, G.; Cecchinato, A. Factors Affecting Variations in the Detailed Fatty Acid Profile of Mediterranean Buffalo Milk Determined by 2-Dimensional Gas Chromatography. J. Dairy Sci. 2017, 100, 2564–2576. [Google Scholar] [CrossRef] [Scilit]
- Romano, R.; Lambiase, G.; Spagna Musso, S.; Chianese, L. Qualitative and Quantitative Distribution of the Lipid Fraction Induced by the Processing of Buffalo Mozzarella Cheese. Prog. Nutr. 2004, 4, 275–284. [Google Scholar]
- Romano, R.; Borriello, I.; Chianese, L.; Sacchi, R. Effect of Dietary Vitamin E Content on the CLA, Cholesterol and Triglycerides Composition of Italian Mediterranean Buffalo Meat. Ital. J. Anim. Sci. 2007, 6, 1202–1206. [Google Scholar] [CrossRef] [Scilit]
- Boro, P.; Debnath, J.; Das, T.K.; Naha, B.C.; Debbarma, N.; Debbarma, P.; Debbarma, C.; Bala, L.S.; Devi, T.G. Milk Com-position and Factors Affecting It in Dairy Buffaloes: A Review. J. Entomol. Zool. Stud. 2018, 6, 340–343. [Google Scholar]
- Hussain, I.; Yan, J.; Grandison, A.S.; Bell, A.E. Effects of Gelation Temperature on Mozzarella-Type Curd Made from Buf-falo and Cows’ Milk: 2. Curd Yield, Overall Quality and Casein Fractions. Food Chem. 2012, 135, 1404–1410. [Google Scholar] [CrossRef] [Scilit]
- Gernigon, G.; Schuck, P.; Jeantet, R. Processing of Mozzarella Cheese Wheys and Stretchwaters: A Preliminary Review. Dairy Sci. Technol. 2010, 90, 27–46. [Google Scholar] [CrossRef] [Scilit]
- Rinaldi, S.; Palocci, G.; Di Giovanni, S.; Iacurto, M.; Tripaldi, C. Chemical Characteristics and Oxidative Stability of Buffalo Mozzarella Cheese Produced with Fresh and Frozen Curd. Molecules 2021, 26, 1405. [Google Scholar] [CrossRef] [Scilit]
- Addeo, F.; Chianese, L.; Scudiero, A.; Cappuccio, U.; Chemin, S.; Cavella, S.; Masi, P. Impiego di latte congelato per la produzione di formaggio mozzarella di bufala. Il Latte Italy 1992, 17, 1018–1025. [Google Scholar]
- Ahmed, N.S.; El-Gawad, M.A.M.A.; El-Abd, M.M.; Abd-Rabou, N.S. Properties of Buffalo Mozzarella Cheese as Affected by Type of Coagulante. Acta Sci. Pol. Technol. Aliment. 2011, 10, 339–357. [Google Scholar]
- Karabashev, V.; Angelova, T.; Yordanova, D.; Kalaydzhiev, G.; Laleva, S.; Oblakov, N.; Krastanov, Z. Interrelationships between Composition and Coagulation Properties of Milk from Bulgarian Murrah Buffaloes. Int. J. Curr. Res. Acad. Rev. 2018, 6, 43–48. [Google Scholar] [CrossRef] [Scilit]
- Zicarelli, L. Buffalo Milk: Its Properties, Dairy Yield and Mozzarella Production. Vet. Res. Commun. 2004, 28, 127–135. [Google Scholar] [CrossRef] [Scilit]
- Walstra, P.; Walstra, P.; Wouters, J.T.; Geurts, T.J. Dairy Science and Technology; CRC Press: Boca Raton, FL, USA, 2005. [Google Scholar]
- Akan, E.; Yildiz Bayram, O.; Demet Karaman, A.; Kinik, O.; Yerlikaya, O. The Influence of Plant Addition to Some Physi-cochemical, Textural, Microstructural, Melting Ability and Sensory Properties of Mozzarella Cheese. Mljekarstvo 2020, 70, 300–312. [Google Scholar] [CrossRef] [Scilit]
- Rudan, M.A.; Barbano, D.M.; Joseph Yun, J.; Kindstedt, P.S. Effect of Fat Reduction on Chemical Composition, Proteolysis, Functionality, and Yield of Mozzarella Cheese1. J. Dairy Sci. 1999, 82, 661–672. [Google Scholar] [CrossRef] [Scilit]
- Yazici, F.; Akbulut, C. Impact of Whey pH at Drainage on the Physicochemical, Sensory, and Functional Properties of Moz-zarella Cheese Made from Buffalo Milk. J. Agric. Food Chem. 2007, 55, 9993–10000. [Google Scholar] [CrossRef] [Scilit]
- Khuwijitjaru, P.; Adachi, S.; Matsuno, R. Solubility of Saturated Fatty Acids in Water at Elevated Temperatures. Biosci. Biotechnol. Biochem. 2002, 66, 1723–1726. [Google Scholar] [CrossRef] [Scilit]
- Coroian, A.; Erler, S.; Matea, C.T.; Mireșan, V.; Răducu, C.; Bele, C.; Coroian, C.O. Seasonal Changes of Buffalo Colostrum: Physicochemical Parameters, Fatty Acids Andcholesterol Variation. Chem. Cent. J. 2013, 7, 40. [Google Scholar] [CrossRef] [Scilit]
- Abdel-Hamid, M.; Huang, L.; Huang, Z.; Romeih, E.; Yang, P.; Zeng, Q.; Li, L. Effect of Buffalo Breed on the Detailed Milk Composition in Guangxi, China. Foods 2023, 12, 1603. [Google Scholar] [CrossRef] [Scilit]
- Asif, A.H.M.; Sarker, M.A.H.; Deb, G.K.; Habib, M.R.; Arefin, S.; Bari, M.S.; Islam, M.Z.; Harun-ur-Rashid, M.; Siddiki, M.S.R.; Shahjadee, U.F.; et al. Fatty Acid and Amino Acid Profiles of Cheese, Butter, and Ghee Made from Buffalo Milk. J. Adv. Vet. Anim. Res. 2022, 9, 144–154. [Google Scholar] [CrossRef] [Scilit]
- Emakpor, O.L.; Edo, G.I.; Jikah, A.N.; Ikpekoro, V.O.; Agbo, J.J.; Ainyanbhor, I.E.; Essaghah, A.E.A.; Ekokotu, H.A.; Oghroro, E.E.A.; Akpoghelie, P.O. Buffalo Milk: An Essential Natural Adjuvant. Discov. Food 2024, 4, 38. [Google Scholar] [CrossRef] [Scilit]

Disclaimer/Publisher’s Note: The statements, opinions and data contained in all publications are solely those of the individual author(s) and contributor(s) and not of MDPI and/or the editor(s). MDPI and/or the editor(s) disclaim responsibility for any injury to people or property resulting from any ideas, methods, instructions or products referred to in the content. |
© 2026 by the authors. Licensee MDPI, Basel, Switzerland. This article is an open access article distributed under the terms and conditions of the Creative Commons Attribution (CC BY) license.