


Abstract
Some windowless semiconductor photodiodes can detect not only photons but also charged particles, cover a wide spectral range including a part of the ionizing radiation region and, thus, play important roles for synchrotron radiation experiments. To understand the spectral, angular and polarizing properties of semiconductor photodiodes, complex amplitude coefficients of transmittance or reflectance are calculated based on rigorous formulation using Fresnel equations with complex optical constants of the composing materials, whose validity was verified by comparison with experiments. Concrete examples of the behavior on the complex plane are shown as a function of complex optical constants, film thickness, angle of incidence and the wavelength. The results show that the optical properties of the layered system are sensitive to its layer thickness, the angle of incidence and the wavelength in the ultraviolet region where optical indices of the composing materials steeply change. It has been shown that oblique incidence photodiodes are useful as polarization-sensitive devices, and that the graphical technique using the amplitude coefficients expressed on the complex plane is effective and powerful to search for optimal conditions for complex optical constants, film thickness and/or angle of incidence.
1. Introduction
Synchrotron radiation covers a wide spectral range from infrared to X-ray and is almost a unique continuum spectral source in the vacuum ultraviolet (VUV) range. For synchrotron radiation experiments, one of the essential components are photodetectors. In the early stage, photoemission type detectors using external photoelectric effect, such as phototubes and photomultipliers, were widely used. Especially, photomultipliers are known to be highly sensitive enough to detect an individual quantum including a photon owing to the charge multiplication mechanism [1]. However, the detector does not respond to all the incident photons; there exists a probability that the detector does not output a signal. The probability of detection is determined by the quantum efficiency of the photocathode of phototubes or of photomultipliers. When photons enter the surface, some photons are lost by reflection and the rest are absorbed in a certain penetration depth, determined by the absorption coefficient, generating photoelectrons, and only limited portions of the photoelectrons produce a signal by leaving the surface. In general, electron escape depth is much shorter than the photon penetration depth [2] and thus the fact results in rather low quantum efficiency for the photoemission type detectors.
Contrary to the photoemission type detectors, photodetectors using internal photoelectric effect like photodiodes do not need for photoelectrons to leave the surface but to be collected almost perfectly. Therefore, the quantum efficiency of the photodiodes using the internal photoelectric effect, in general, have much higher quantum efficiency than the photodetectors using external photoelectric effect. Cutoff photon energy is determined by the work function for the photoemission type detectors or the bandgap energy for the photodiodes. Since the latter is smaller than the former, sensitive spectral range is, in principle, wider for photodiodes.
Actual spectral range of semiconductor photodiodes is limited by the absorption of the overlayer on the semiconductor substrate. For instance, typical silicon photodiodes with oxide thickness over about 50 nm have no sensitivity below the wavelength of 120 nm due to the strong absorption of the silicon dioxide overlayer. By reducing the oxide thickness to around 8 nm and decreasing the surface recombination of carriers based on special design, stable silicon photodiodes for extreme ultraviolet use with 100% carrier collection efficiency are already commercially available [3]. Recently, further promising results were reported that silicon photodiode achieved solar blindness by minimizing the silicon substrate thickness to enable the operation below the silicon direct bandgap energy (3.5 eV) [4]. For these applications, it is important to investigate the dependence on the spectral properties of the overlayer thickness, substrate thickness, and the angle of incidence.
With these advantages, semiconductor photodiodes are suitable and therefore have been widely used for various synchrotron radiation experiments to measure intensity, to monitor beam position, to align optical setups, etc. An additional prominent feature of synchrotron radiation is that it is linearly polarized in the orbital plane and elliptically polarized off the orbital plane [5]. Therefore, detectors for synchrotron radiation experiments need to be sensitive in such a wide spectral range and are expected to be polarization-sensitive in some applications. Semiconductor photodiodes meet such needs and have been widely used also for polarization measurements.
To realize polarization-sensitive detectors, three mirrors in series combined with a photodetector [6,7] are typically used as a polarization analyzer (triple-reflection polarizer). In this optics, the photodetector surface is placed at the end of the mirrors, normal to the beam. The optics, usually installed in ultrahigh vacuum, must be set so that the outgoing beam direction is identical to the incident beam forcing the optical alignment difficult. Moreover, the detector intensity becomes small due to many-times reflection and general low reflectance in the VUV.
Instead, Saito et al. [8,9,10] proposed a simpler polarization analyzer by using a photodiode placed obliquely to the incident radiation and demonstrated to work successfully in their original VUV ellipsometer [8,11]. The principle for polarization sensitivity used in this method is the fact that reflectances at oblique incidence for s- and p-polarization components differ, and therefore transmittances to the photodiode-sensitive volume also differ, thereby inducing a measurable difference in detector response depending on polarization.
To design and optimize such an optical system consisting of a thin film on an absorbing substrate, rigorous formulation using Fresnel equations with complex optical constants of the composing materials must be applied. Most photodiodes were shown to be optically modeled by a layered structure consisting of a semiconductor substrate covered by a thin surface layer [8,9,10,11,12]. Such previous works show that optical properties of the layered system can be very different from those for a substrate without a surface layer due to the interference effect and absorption by the surface layer. For instance, reflectance for s-polarization can be smaller than that for p-polarization for the double boundary system contrary to the well-known fact for the single boundary system [8,10].
As outlined above, the author and author’s group developed a theoretical model to predict spectral quantum efficiency, angular polarization properties and demonstrated that the model was supported by experiments. Our previous studies show that influence of the change in refractive indexes of the composing material on, especially, the polarization properties are complex and difficult to interpret.
In this paper, we investigate graphical optical design techniques using complex amplitude reflection/transmission coefficients (ARC/ATC) expressed on a complex plane, which can be useful for optical design of photodiodes. It will be shown that the technique is advantageous to obtain insight on how the result changes as a function of various parameters. We especially focus on polarization properties of photodiodes and the role of the surface layer. Concrete examples of the behavior on the complex plane are shown as a function of complex optical constants, film thickness, and angle of incidence (AOI).
2. Fundamentals of Photodiodes [12]
2.1. Definitions
To express radiation intensity, the following two definitions are used. Firstly, photon flux, , is defined by number of incident photons per unit time. Secondly, radiant power, P, is defined by radiant energy of the incident radiation per unit time. When the incident radiation is monochromatic, these two quantities are related with photon energy E by the following equation,
To express the sensitivity of a photodetector, the following two definitions are usually used. Firstly, quantum efficiency, , is defined by the number of photo-generated carrier pairs divided by the number of photons. Secondly, responsivity is defined by the photodiode photocurrent divided by the radiant power. In case that the incident radiation is monochromatic, spectral quantum efficiency, , and spectral responsivity, s, in A/W are related by the following equation, where e is the electronic charge,
For both quantum efficiency and responsivity, two adjectives, external or internal, are further added to both quantum efficiency and responsivity to distinguish incident or absorbed, respectively, for the input radiation corresponding to the two definitions for the input. Specifically, external quantum efficiency, ηext, means the number of photo-generated carrier pairs divided by the number of photons incident to the photodetector. Internal quantum efficiency means the number of photo-generated carrier pairs divided by the number of photons absorbed in the sensitive volume. Then, ηint, and ηext, are related by the following equation,
where R is reflectance of the system, A absorptance of the surface layer, T transmittance of the surface layer (into the sensitive substrate), C carrier collection efficiency, and η′int intrinsic internal spectral quantum efficiency. The ideal intrinsic internal quantum efficiency is unity until the photon energy becomes, at least, two times the bandgap of the semiconductor used, and it begins to exceed 1 due to the impact ionization [13]. Experimental results [13,14,15] show that intrinsic internal quantum efficiency remains almost unity below about 3.6 eV.
In contrast, as the photon energy is increased to the γ-ray range, average energy, ε, required to create an electron-hole pair, becomes almost constant to the photon energy, E [16]. This can also be expressed that the internal spectral quantum efficiency becomes proportional to the photon energy. Therefore, the intrinsic internal spectral quantum efficiency at any photon energy is roughly approximated by
2.2. I-V Characteristics
Current, I, and voltage, V, generated by a photodiode are given by
where IL is the light-generated current, Is saturation current, n the ideality factor, k, Boltzman constant, and T the junction temperature. The second term on the right-hand side expresses the diode characteristics. IL is proportional to the absorbed photon flux, , and is given by
It should be noted that current output under short circuit condition (V = 0), Isc, which is realized when the load resistance is zero, is proportional to . On the other hand, open circuit voltage, Voc, with infinite load resistance (I = 0) is increased as a logarithmic function of when IL >> Is. Therefore, a photodiode current (or voltage) output under finite load resistance theoretically gives nonlinear response to the incident photon flux. Nevertheless, since the I-V curve governed by Equation (5) exhibits nearly perfect constant current characteristics in the vicinity of V = 0, linear response is practically expected if the load resistance is below approximately Voc/(2Isc). This condition is readily achieved by using a trans-impedance circuit [17].
2.3. Photoemission
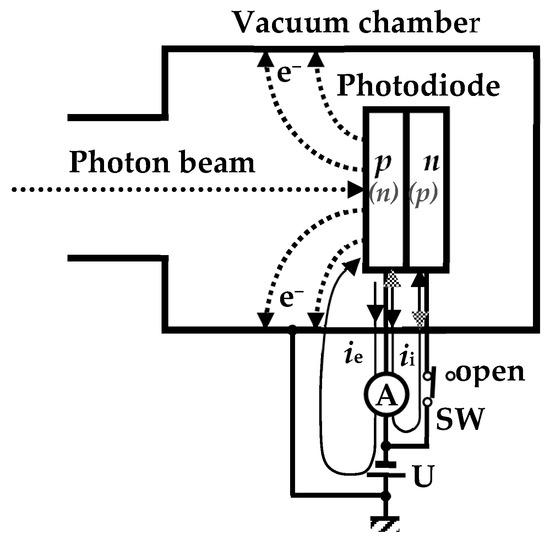
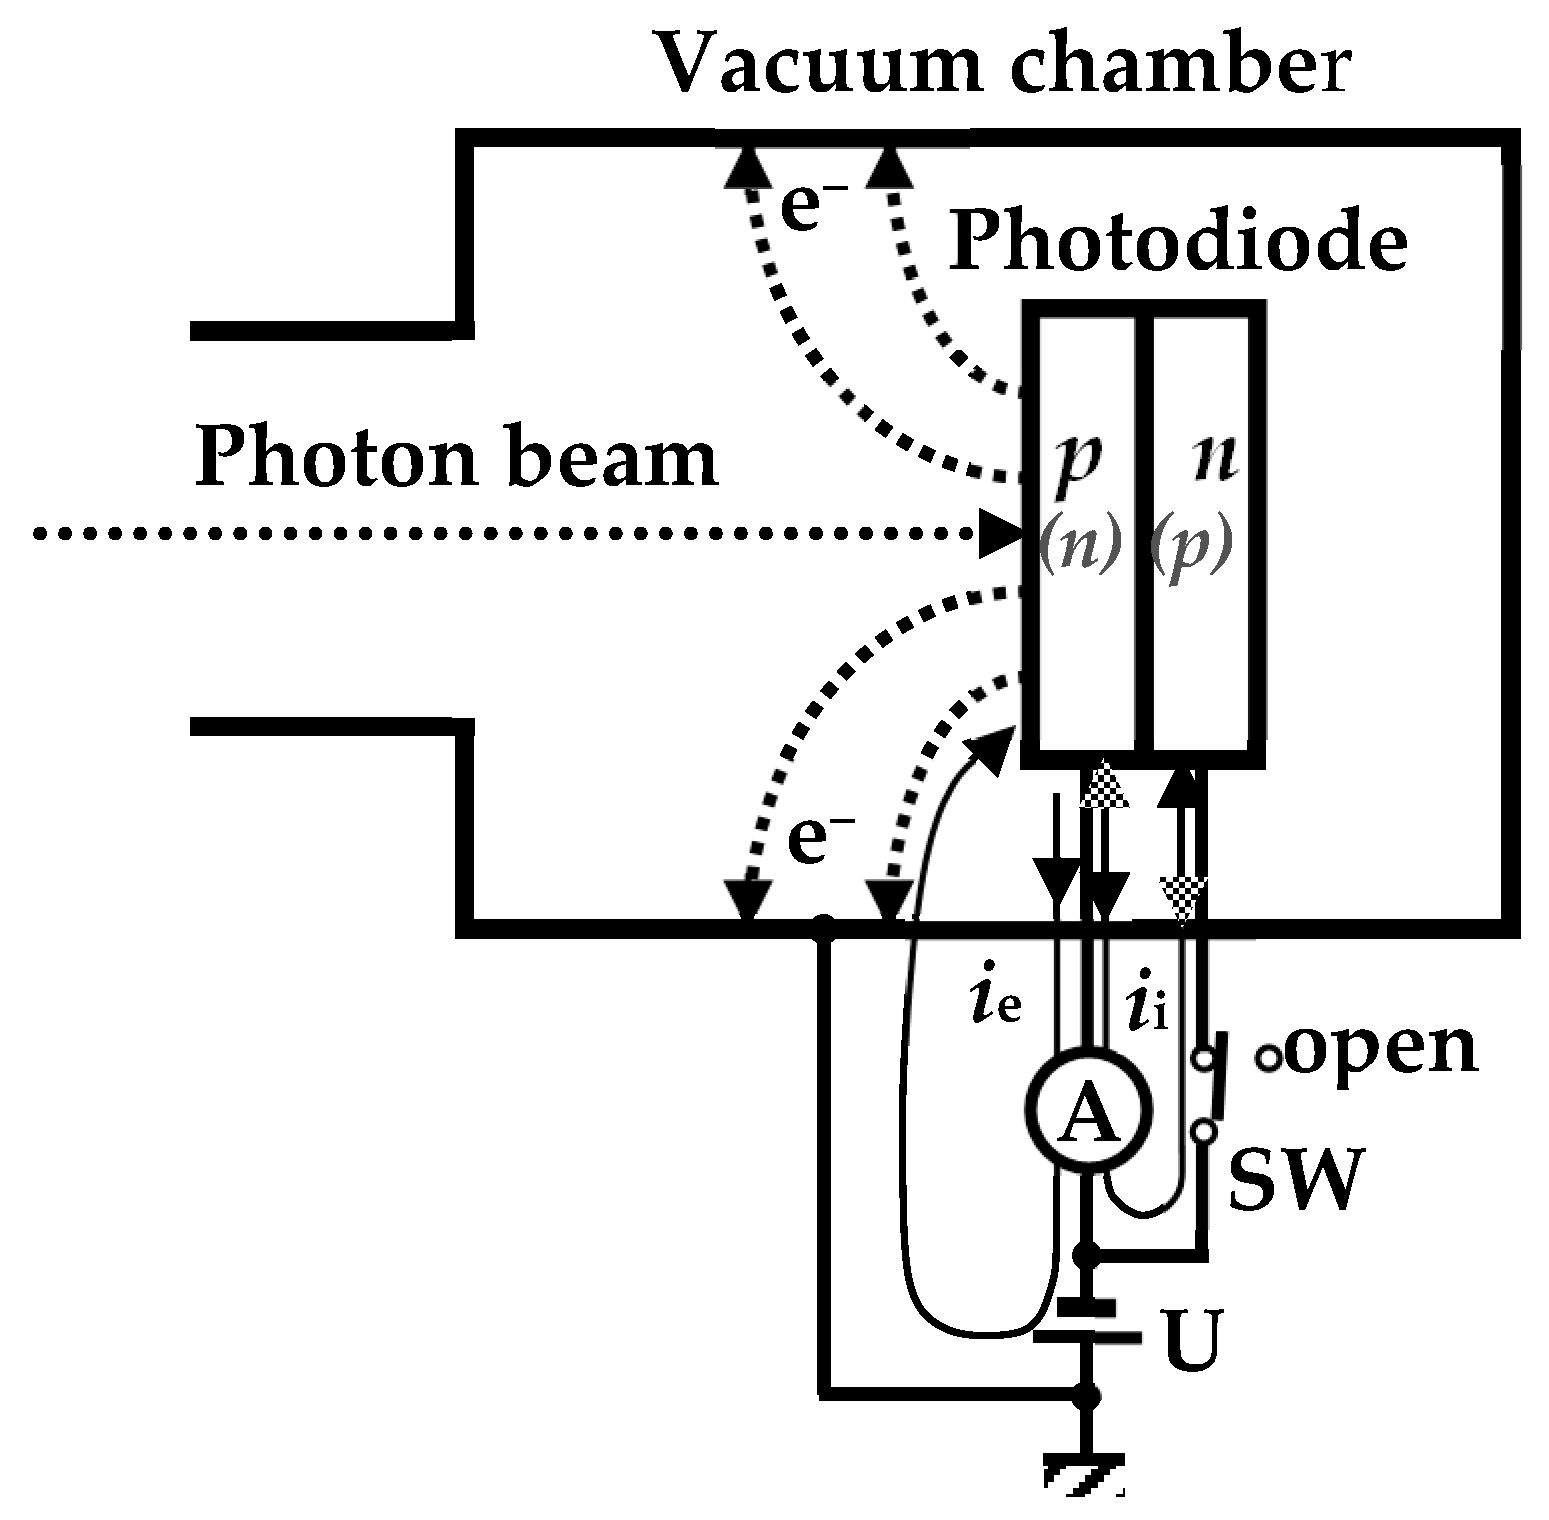
When a photon is energetic enough to cause electron photoemission, it should be noted that the photoemission current results in a difference in the photodiode photocurrent depending on the polarity of the current measurement [18,19]. Figure 1 shows a typical measurement condition in the VUV in which the photodiode is housed in a metal vacuum chamber that is grounded to the earth common to the ground terminal of the electrometer. In this situation, an additional current circuit is formed by electrons photoemitted from the photodiode surface when they reach the vacuum chamber wall [18]. When the rear electrode is grounded as shown in the figure, current measured by the electrometer becomes the photocurrent internally generated, ii, plus the photoemission current, ie. When the switch, SW, is kept open, the electrometer only measures photoemission current.
Figure 1.
Schematics to illustrate photoemission current contribution imposed to electrometer readings depending on the location of the electrometer (A). Rear grounding configuration (the electrometer sensing terminal is connected to the front electrode of the photodiode) is shown. For direct measurement of the photoemission current, the switch SW is set to open [18].
Inversely, when the front electrode is grounded, the electrometer measures only the photocurrent internally generated, ii, without the photoemission current.
Based on these facts, appropriate polarity for precise measurements should be the front grounding configuration to exclude a photoemission current. This is because the photoemission current component is unstable and depends on several conditions such as the geometry surrounding the photodiode, stray electric field and surface condition (contamination) of the photodiode.
3. Theoretical
3.1. Substrate Without Overlayer (Single Boundary System)
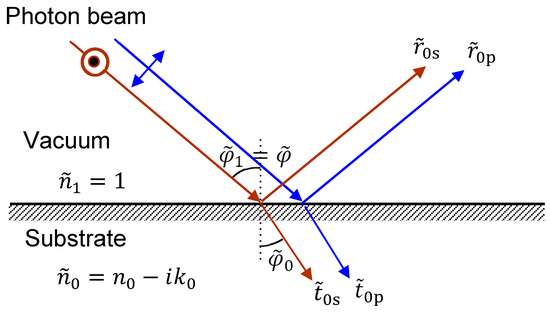
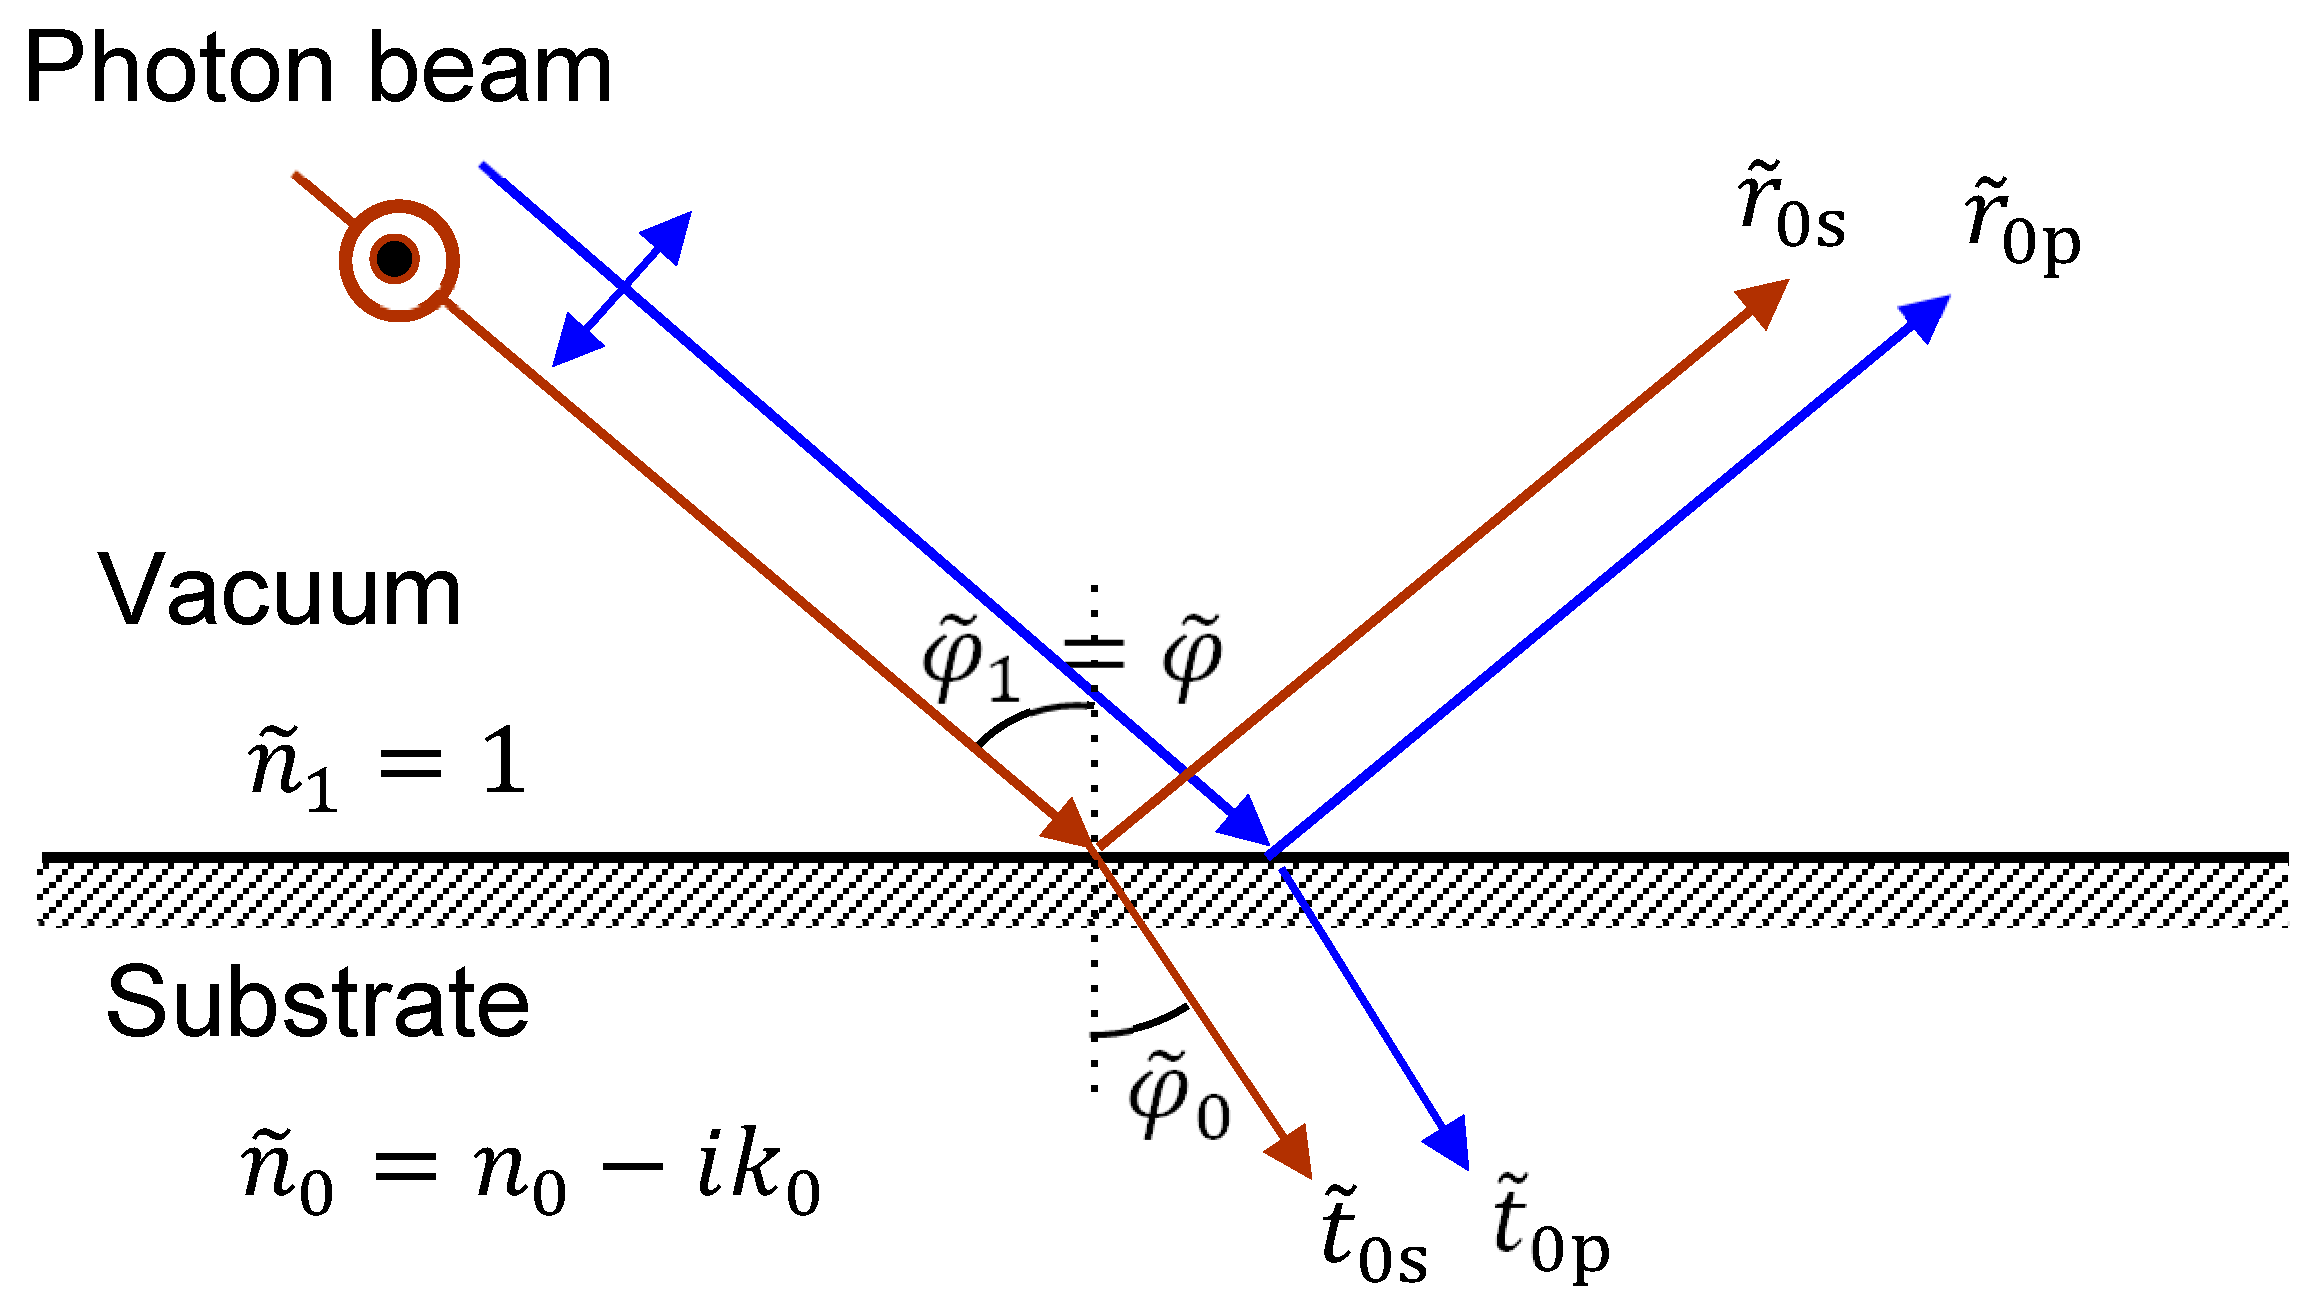
Figure 2 shows a single boundary system in which a substrate with refractive index, ( is a real part and is an imaginary part of the optical constant) is placed in vacuum (. Note that subscript number increments from the bottom starting from 0 to the surface throughout in the paper. The thickness of the substrate is assumed to be thick enough to absorb all the photons penetrated.
Figure 2.
Single boundary system. A substrate with refractive index, , is placed in vacuum (. The AOI from vacuum to the substrate is and refraction angle is .
Transmittance, T, reflectance, R, and absorptance, A, of the film are given, with ATC, , and ARC, , of the film, by the following equations [12]:
Tildes and asterisks in Equations (7) and (8) and any other equations in this paper denote complex numbers and complex conjugates, respectively. The coefficient c in Equation (7) is given for s- and p-components, respectively as shown below:
where the AOI from vacuum to the substrate is and refraction angle is (m = 0). The equation is expressed in a general form applicable also for the double boundary system and the multilayer system that follow in the next subsections. Here, m denotes the top surface layer, and therefore, m + 1-th medium is the one surrounding the system, which is vacuum in general, and we assume here as well. Also, remember that subscript 0 is for the bottom substrate.
ARC, , and ATC, , known as Fresnel’s coefficients are given with m = 0 for s- and p-polarization (denoted by additional subscripts, s and p, respectively) as follows.
Refraction angles are given by the following Snell’s formula,
3.2. Single Film on Substrate (Double Boundary System)
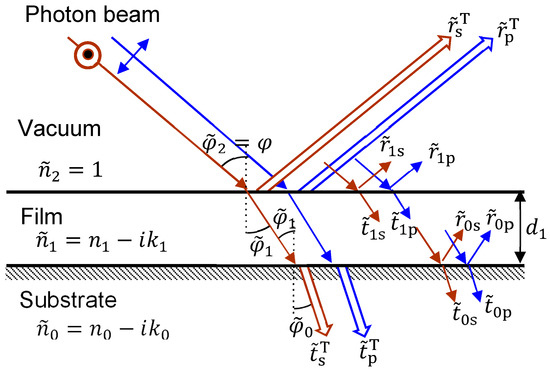
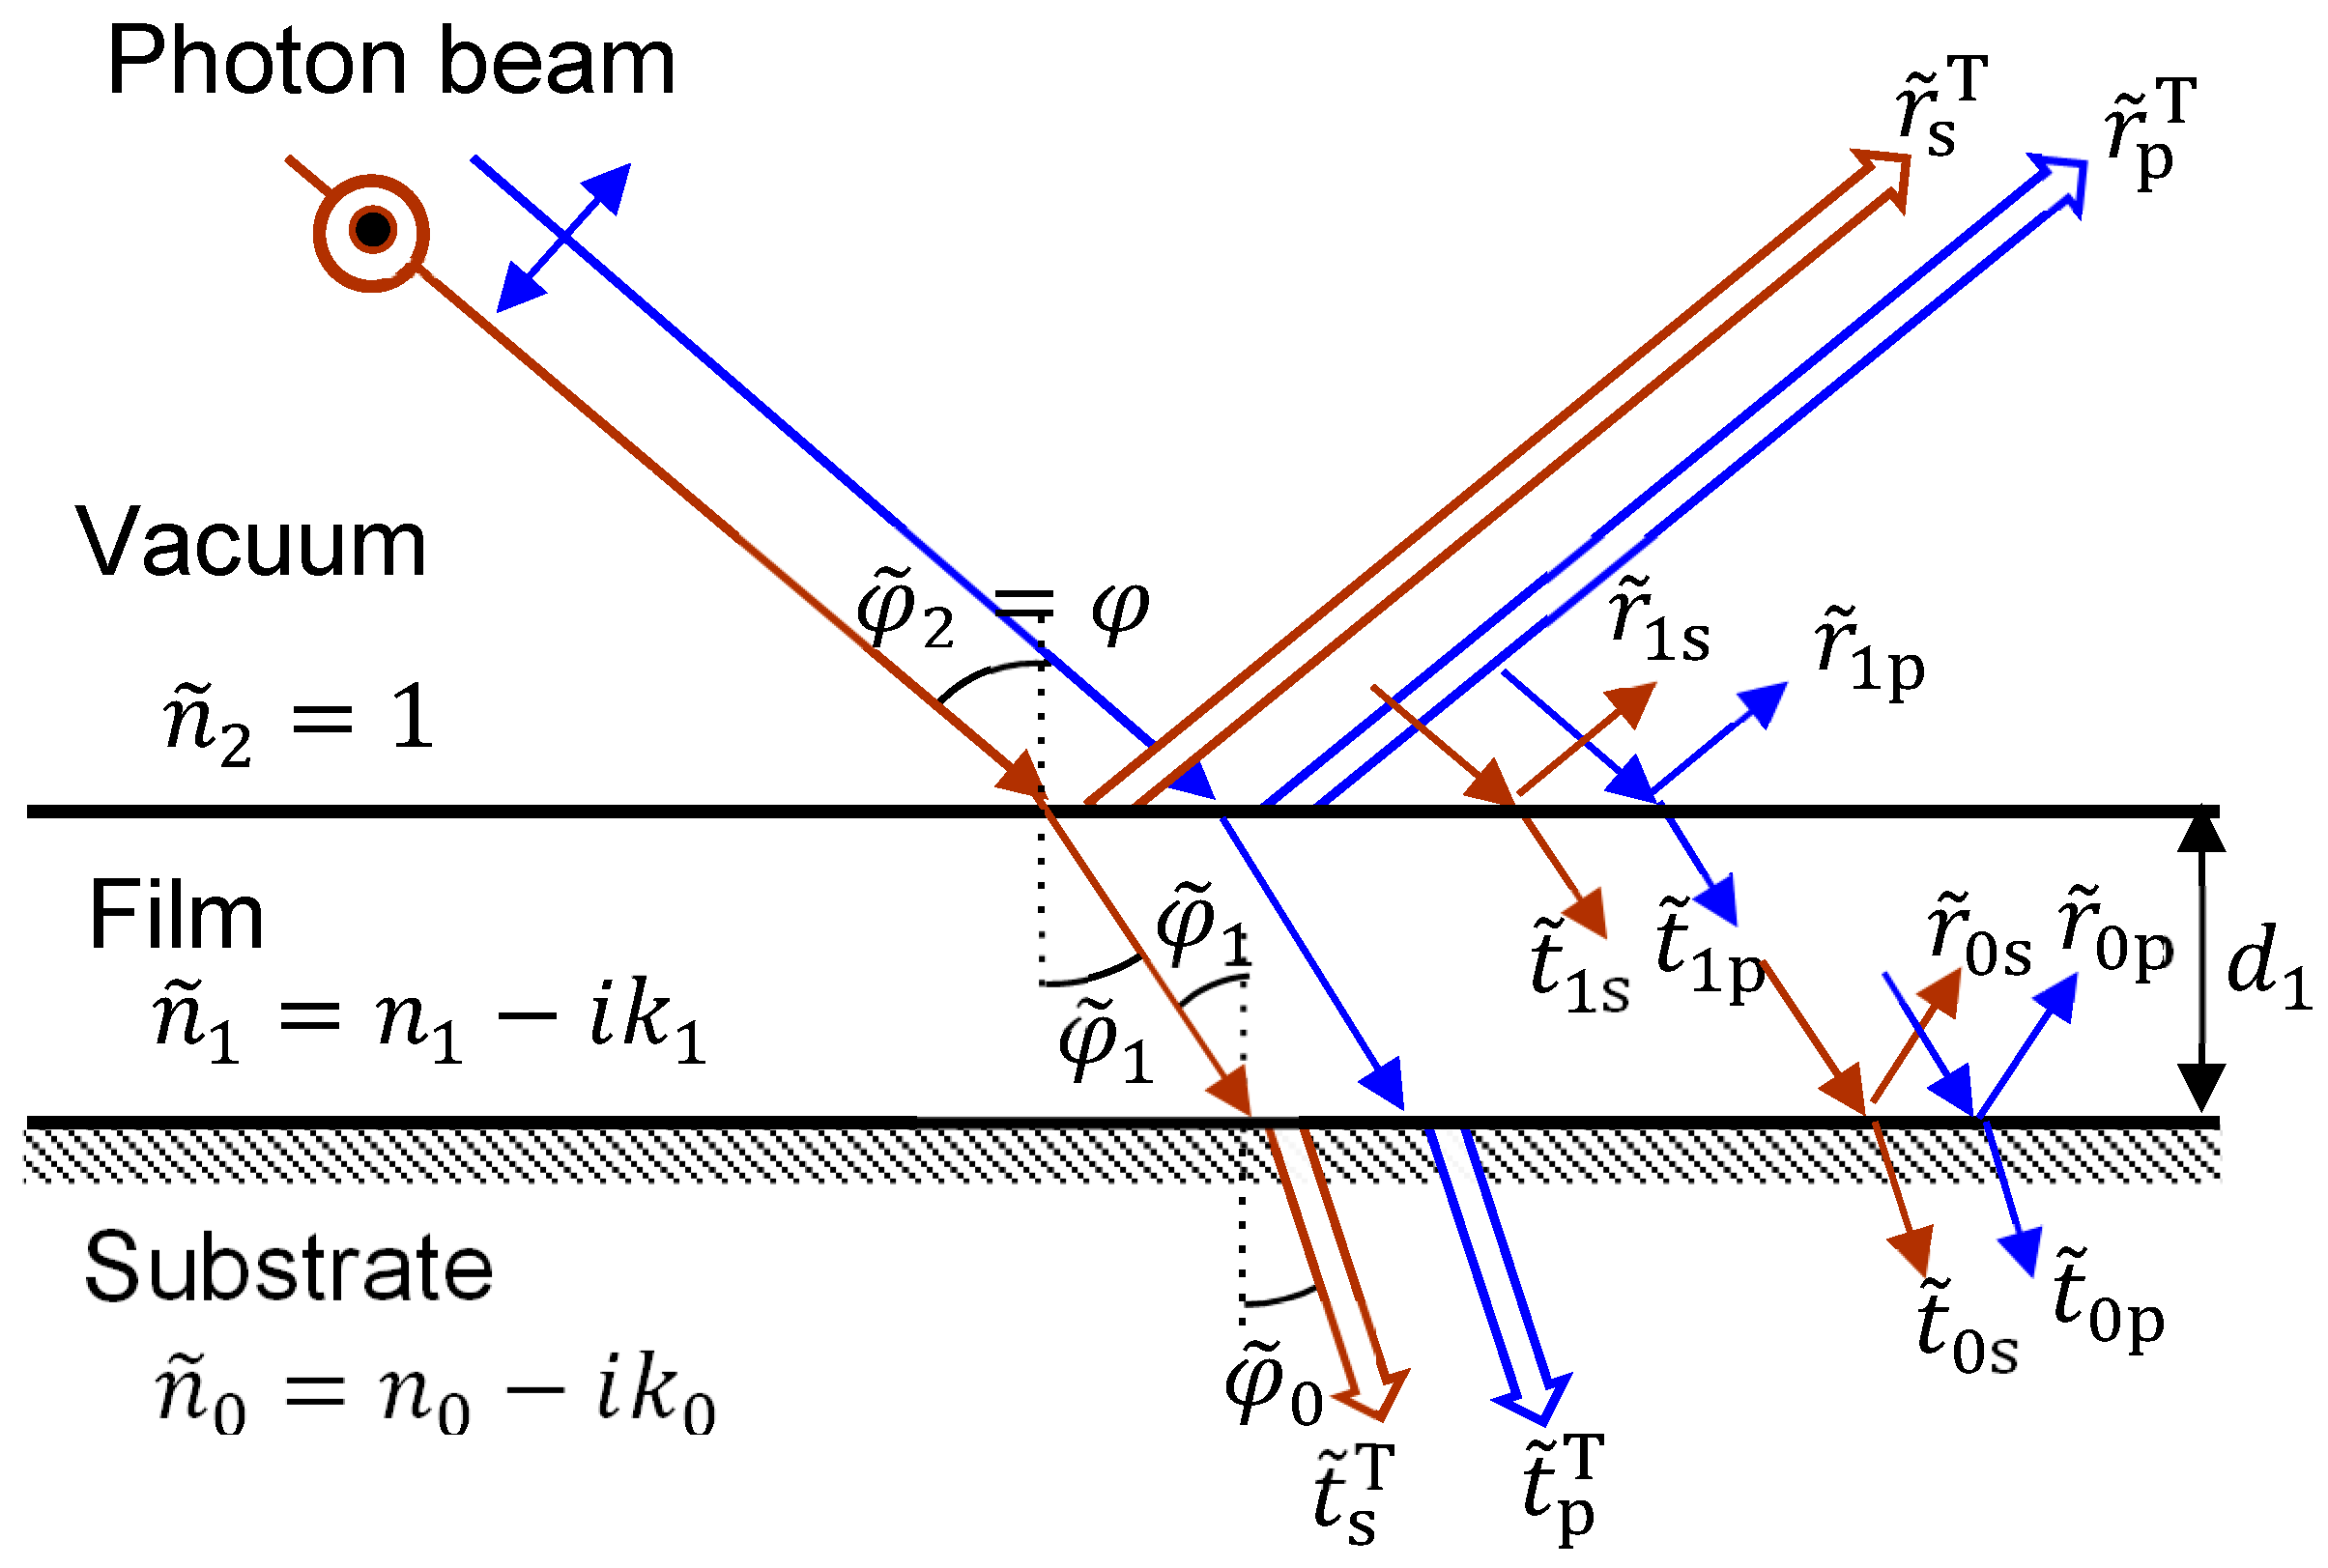
It is known that most photovoltaic cells and photodetectors are optically well-modeled as a double boundary system in which a sensitive substrate is covered by a single surface layer [8,9,10,12]. As shown in Figure 3, such a device placed in vacuum ( is composed of a slab of semiconductor with refractive index, , and a film with refractive index, , whose thickness is, d1, on the slab. For each boundary, Fresnel’s coefficients, , , , and (m = 0, 1) are given by Equations (11)–(14).
Figure 3.
Double boundary system. A substrate with refractive index, , covered by a single film with refractive index, , is placed in vacuum (. The AOI from vacuum to the substrate is , refraction angle in the film is and refraction angle in the substrate is .
When the AOI from vacuum to the substrate is , refraction angle in the film, , and refraction angle in the substrate, , are given by Equation (15). Total complex amplitude coefficients (CACs) including all contributions resulting from the multiple reflections for transmission, , and that for reflection, , of the film are given using Fresnel’s coefficients (Equations (11)–(14)) by the following equations:
3.3. Multilayer System [20]
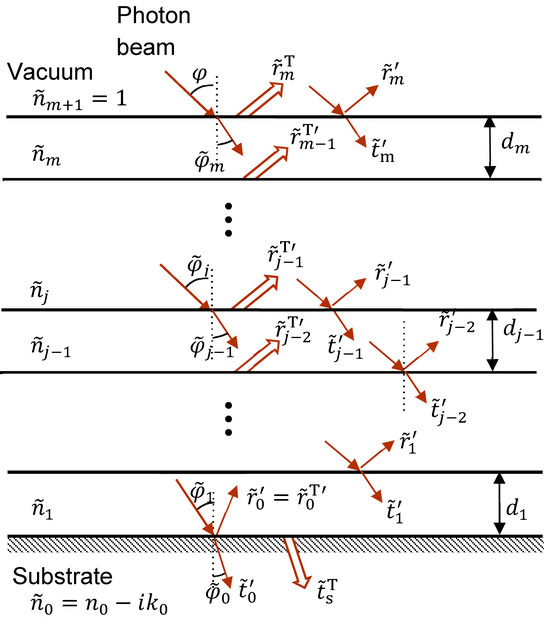
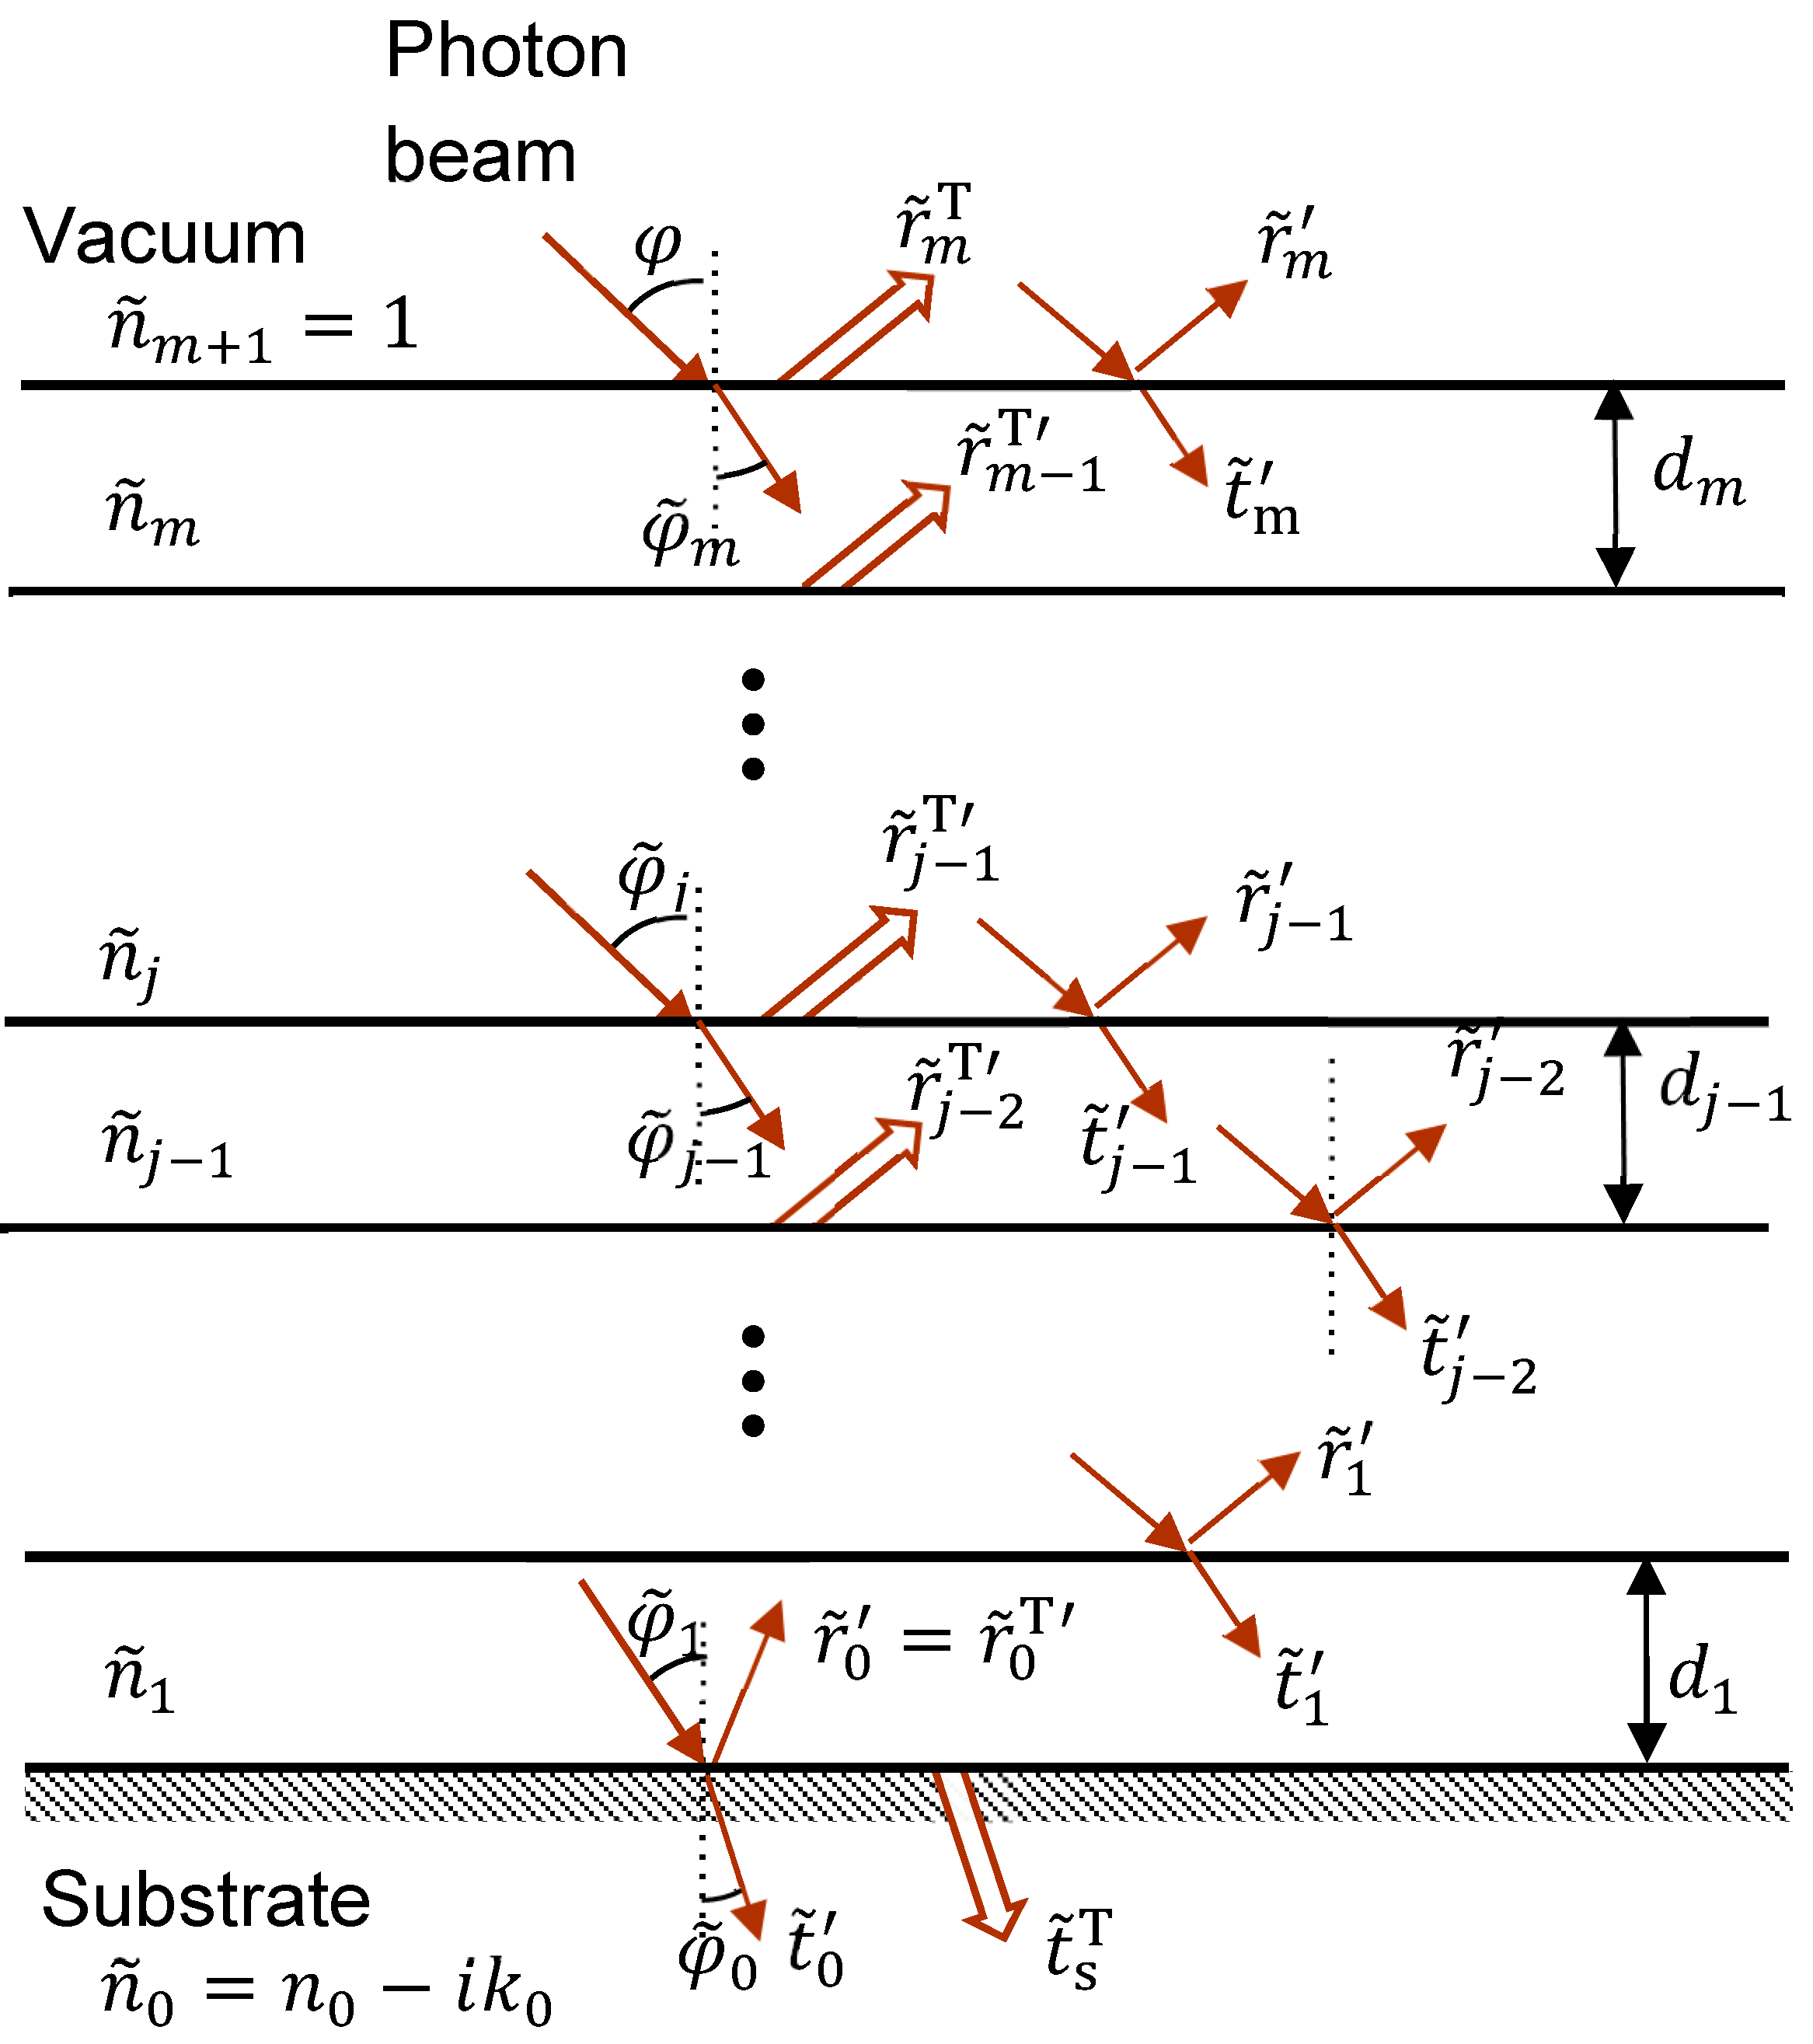
Figure 4 shows a multilayer system composed of a bottom substrate and m overlayers placed in vacuum (. In this figure, polarization identification with s and p is omitted for simplicity. Layer subscript number, j, increments from 0 for the bottom to m for the top (vacuum). The j-th layer (j = 1, 2, …, m) is composed of a material with refractive index, . The AOI from vacuum to the system is , refraction angle in the j-th layer is .
Figure 4.
Multilayer system composed of a bottom substrate and m overlayers placed in vacuum (. The j-th layer (j = 1, 2, …, m) is composed of a material with refractive index, . The AOI from vacuum to the system is , refraction angle in the j-th layer is .
The amplitude reflection coefficient of the multilayer system can be calculated by using the following recurrence formula, which is basically identical to Equation (16). Contrary to the former notation in Equation (16), superscript prime is introduced to show that the quantities are derived from the refractive indices of the two adjacent mediums across the interface.
The total amplitude reflectance of the multilayer system can be obtained by applying this Equation repeatedly from j = 1 to j = m, with .
However, for the design purpose of selecting suitable materials to achieve the highest reflectance, etc., it is unrealistic to use Equation (19) since the number of combinations of the two materials is too large. To remove this shortcoming, the total amplitude coefficients could be expressed in terms of the quantities derived from the refractive index of the layer and that of vacuum, not from those of the two adjacent mediums. Berning [21] first derived such an expression as shown below.
Note that there are no primed quantities. The amplitude reflection coefficient of the m-layer system, , can be calculated by this equation starting from j = 1, with .
Yamamoto et al. [20] rewrites Equation (19) as follows.
If (for instance, in the soft X-ray region), the equation can be approximated by
4. Calculation Results
Based on the analytical equations described in Section 3, calculations are carried out by using MATLAB (v2025b) and the results on reflectance and transmittance for both amplitude and power intensity are shown in this section. For a single boundary system, results as a function of AOI are shown with a matrix combination of n and k of a substrate to grasp their general dependency. For a double boundary system, since the number of combinations for variables is too large, actual data sets [22] for the system of SiO2 on Si at some representative wavelengths are used to show complicated behavior of the layered system. For a multilayer system, it is shown that the system can be treated as an expansion of the double boundary system using recurrence formula. A powerful layer-by-layer design technique is also introduced.
4.1. Substrate Without Overlayer (Single Boundary System)
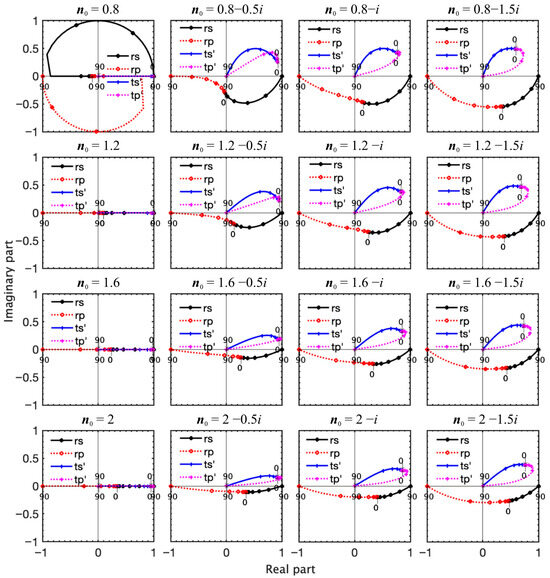
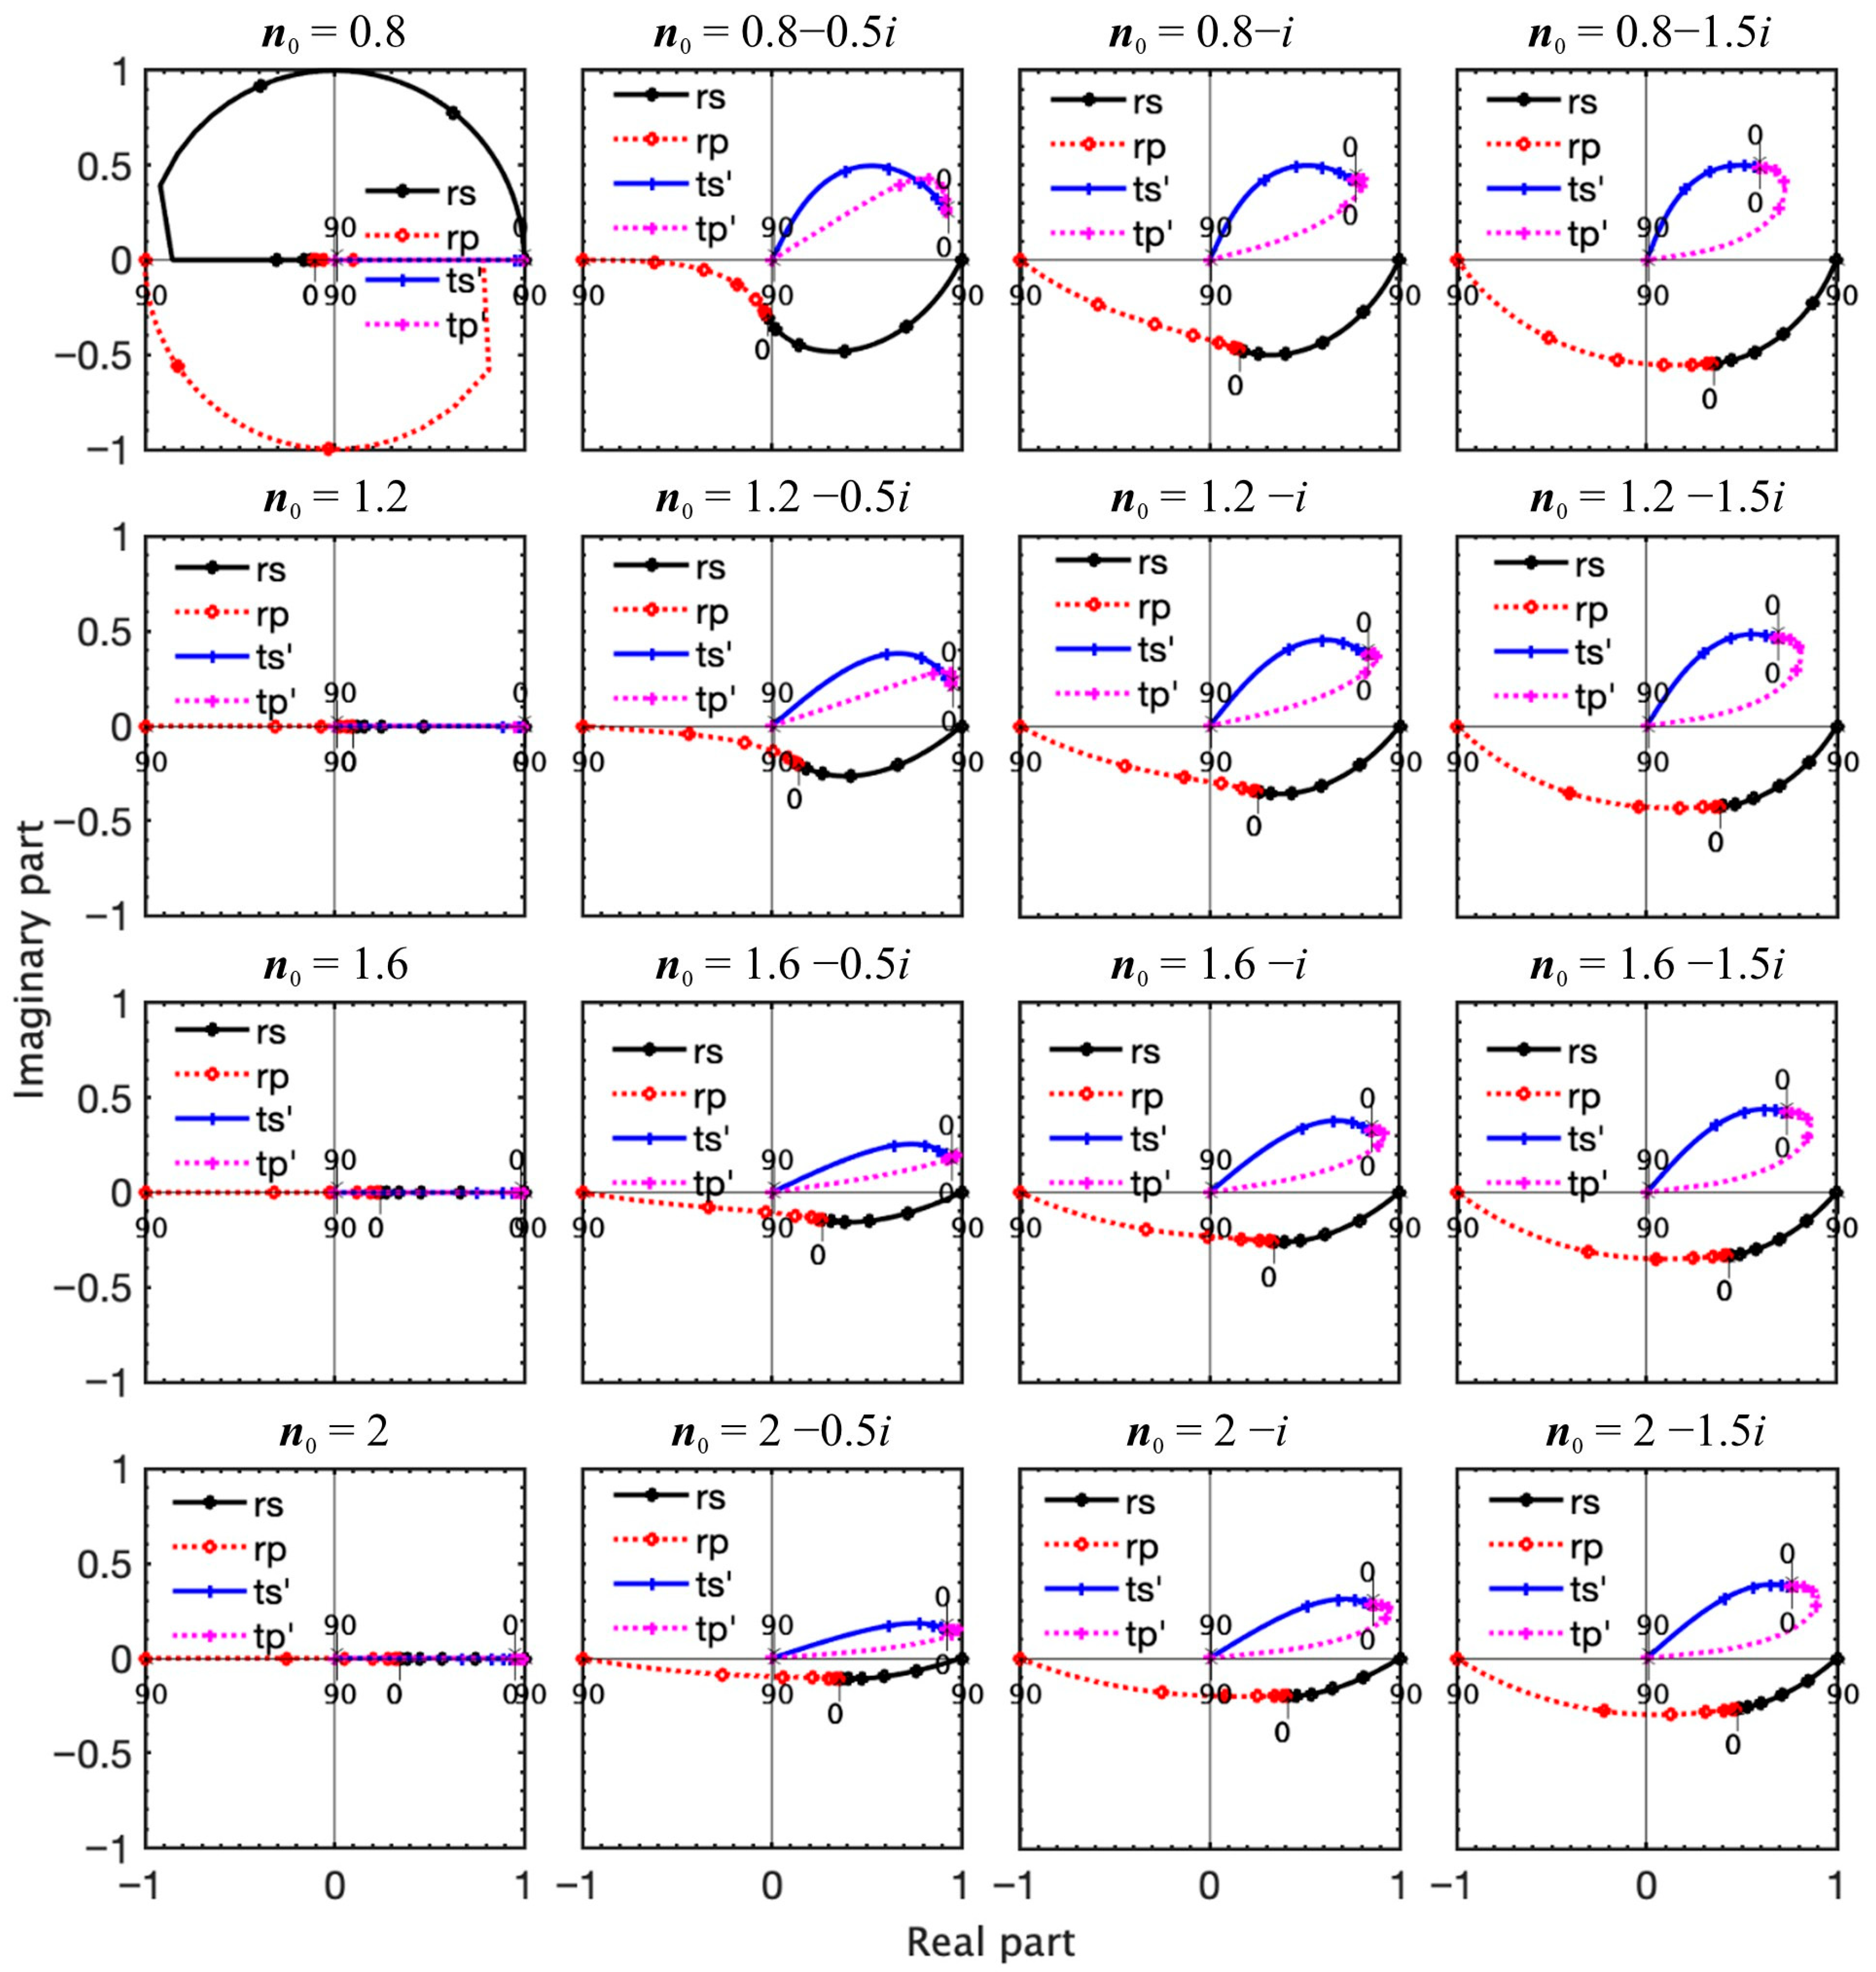
Figure 5 shows ARCs for s- and p-components based on Equations (11) and (12) and products of square root of c (given by Equation (10)) and ATCs for s- and p-components based on Equations (13) and (14) plotted in the complex plane as a function of AOI at some complex refractive indexes of a substrate placed in vacuum. Note that for transmission, a factor of square root of c is multiplied to ATCs. This is because such a multiplier is needed to derive power transmittance as shown in Equation (7). To distinguish the multiplied ATC by c from ATC, superscript prime is added as in t′, ts′ and tp′. Traces of t′, ts′ and tp′ are distorted from traces of t, ts and tp due to the dependence on angles. For both curves of reflection and transmission, markers are shown as a function of AOI every 15 degrees. The points at the AOI of 0° and 90° are indicated with arrows and the numbers.
Figure 5.
ARCs (s-component: solid curve with dots, p-component: dotted curve with dots) and products of square root of c (given by Equation (10)) and ATCs (s-component: solid curve with crosses, p-component: dotted curve with crosses) as a function of AOI at different combinations of real part and imaginary part of the substrate optical constants, .
It should be noted that when (at normal incidence) according to Equations (11) and (12). The reason why the sign is opposite to each other between s- and p-components at normal incidence is just the issue of definition of the coordinate. To coincide with each other for the points of s- and p-components at normal incidence, the sign of is intentionally inverted when plotting in the complex plane throughout this paper. The real part (n0) of the substrate refractive index is changed from 0.8 to 2.0 in step of 0.4 while the imaginary part (k0) of the substrate refractive index is changed from 0i to 1.5i in step of 0.5i. Figures with same n0 and k0 are aligned in a row and in a column, respectively.
As Equation (8) shows, reflectance is proportional to the square of the distance in the complex plane between the point representing the ARC and the origin. Complex argument of the point is equal to the phase difference between the incident wave and the reflected wave. The above interpretations also hold for transmittance since ts′ and tp′ shown in the figure are ATCs multiplied by c given by Equation (10).
Note that all the points are on the real axis when the substrate is transparent (the imaginary part is zero). Since the sign of is intentionally inverted, all the points for reflection are located on the negative side of the real axis meaning that the phase change at reflection is π regardless of the AOI. On the other hand, all the points for transmission are located on the positive side of the real axis meaning that the phase change at transmission is 0 regardless of the AOI.
Under constant n0, both points of reflection and transmission monotonously depart farther from the real axis as k0 increases. By noting the change in distance from the origin and the change in argument at the same AOI, it means for reflection that both the amplitude (reflectance) and the phase change monotonously increase. For transmission, it means that transmittance monotonously decreases, and the phase change monotonously increases.
Under constant k0, both points of reflection and transmission monotonously approach the real axis as n0 increases. It means that the phase change monotonously increases for reflection and monotonously decreases for transmission. On the contrary, there is no monotonous trend for the amplitudes of reflection and transmission but there exists a minimum at certain n0.
The reflectance at normal incidence increases as n0 decreases and k0 increases. The p-reflectance has a minimum at pseudo-Brewster angle, which is located at the intersection of the curve with the imaginary axis.
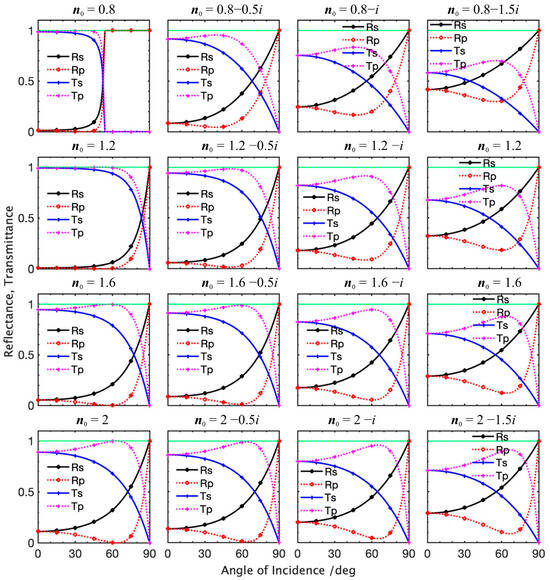
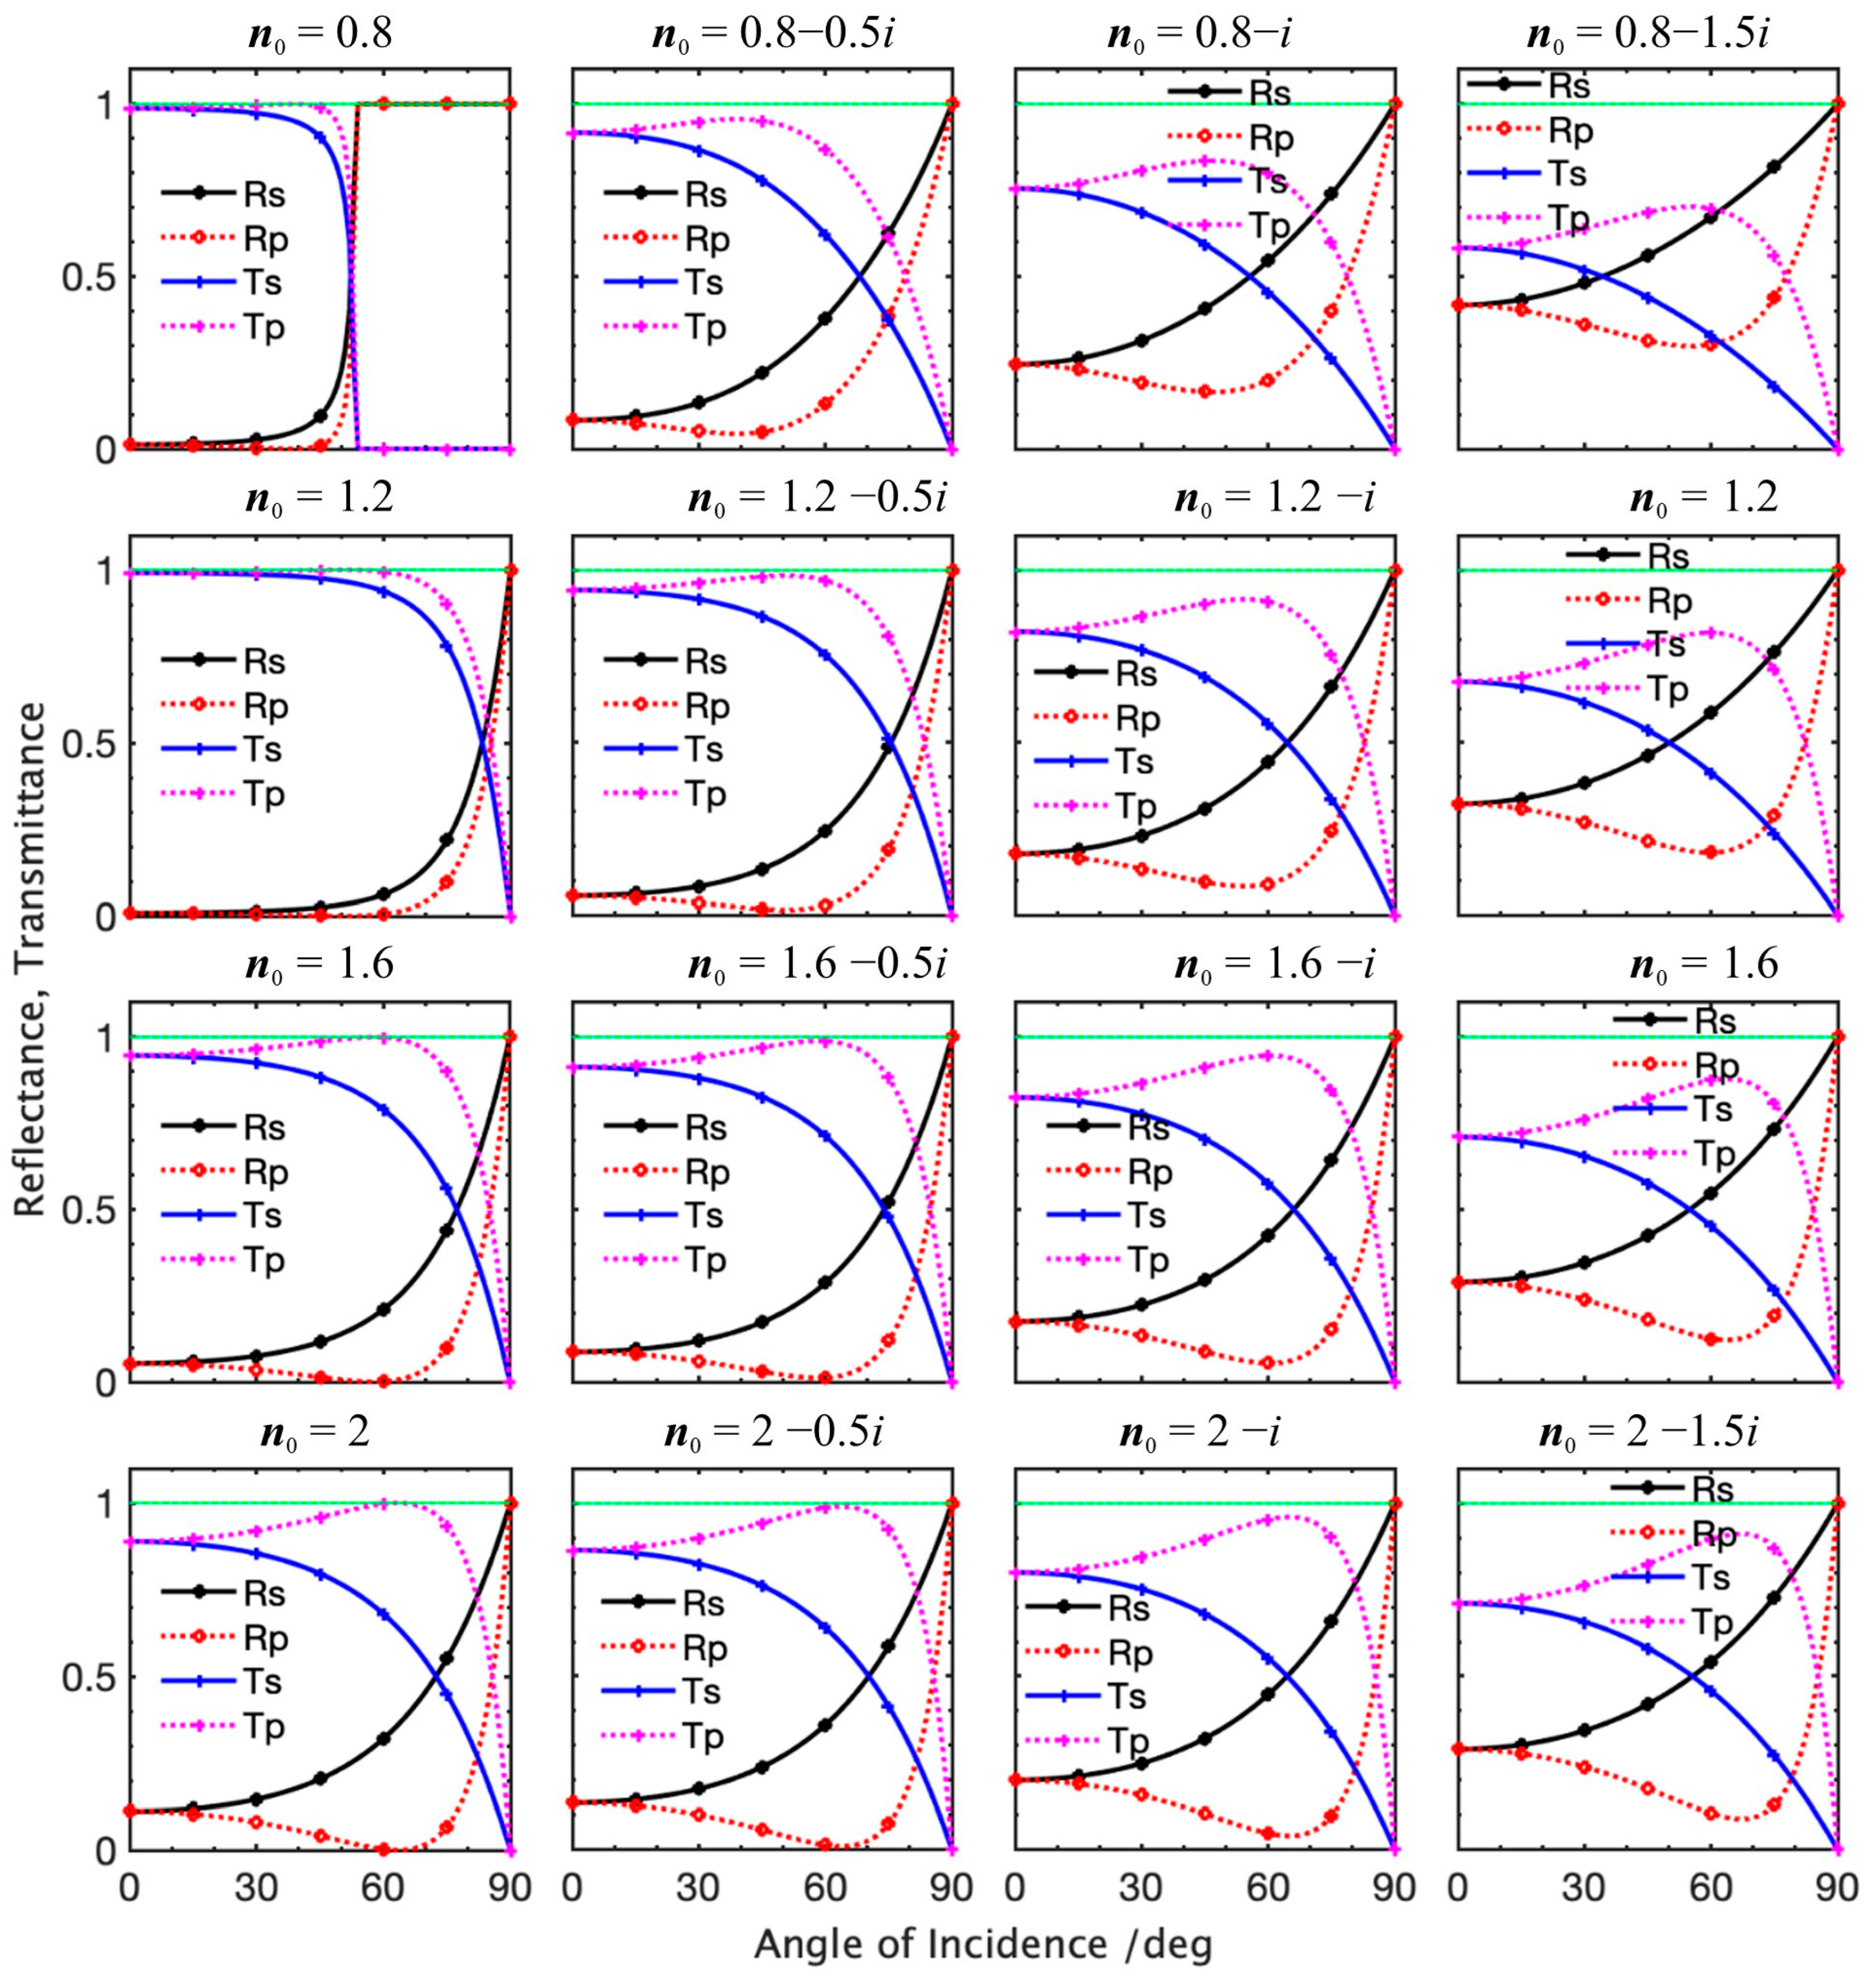
Corresponding figures for reflectance and transmittance are shown in Figure 6. It is important to check the validity of the theoretical formulation, especially on Equation (10) that must be used only for transmittance where the incident medium and the exiting medium are different. For this purpose, sum of reflectance and transmittance (Rs + Ts and Rs + Ts) are shown for every combination of n and k of the substrate and it is confirmed that the sum is always unity as expected.
Figure 6.
Reflectance (s-component: solid curve with dots, p-component: dotted curve with dots) and transmittance (s-component: solid curve with crosses, p-component: dotted curve with crosses) as a function of AOI at different combinations of real part and imaginary part of the complex refractive indexes of a substrate placed in vacuum. The dots and crosses are shown every 15 degrees of AOI. Also, Rs + Ts and Rp + Tp are shown (both curves are overlapped) in green.
4.2. Substrate with a Single Overlayer (Double Boundary System)
As described before, this system is simple but widely used for solar cells and photodiodes. Refractive indices of most materials including SiO2 and Si change largely in the ultraviolet region but do not change much in the visible and infrared regions. Concrete theoretical examples of the SiO2 on Si system in the VUV and UV are given at three wavelengths of 135 nm, 254 nm and 400 nm to understand the behavior of reflection and transmission amplitudes in the complex plane as a function of variable parameters. The wavelengths are chosen to represent characteristic features or practical reasons. At 135 nm, the overlayer (SiO2) is absorptive and the real part of Si refractive indexes, n, is below unity. The wavelength of 400 nm is representative of the region where the imaginary part of SiO2 refractive indexes, k, is almost zero (there is no absorption) and n of SiO2 remains nearly constant. The wavelength of 254 nm is practically important since it is one of the widely used mercury UV line spectra. In addition, this wavelength was chosen to compare the interesting experiment results that will be shown in Section 5.3, in which angular dependence for both p- and s-polarization are almost identical. Optical indices at 245 nm lie in between 135 nm and 400 nm. The complex refractive indices used in this paper are obtained from References [22,23].
For the sake of brevity, computational results at the wavelength of 400 nm is shown in Supplementary Materials.
4.2.1. SiO2 on Si System at the Wavelength of 135 nm
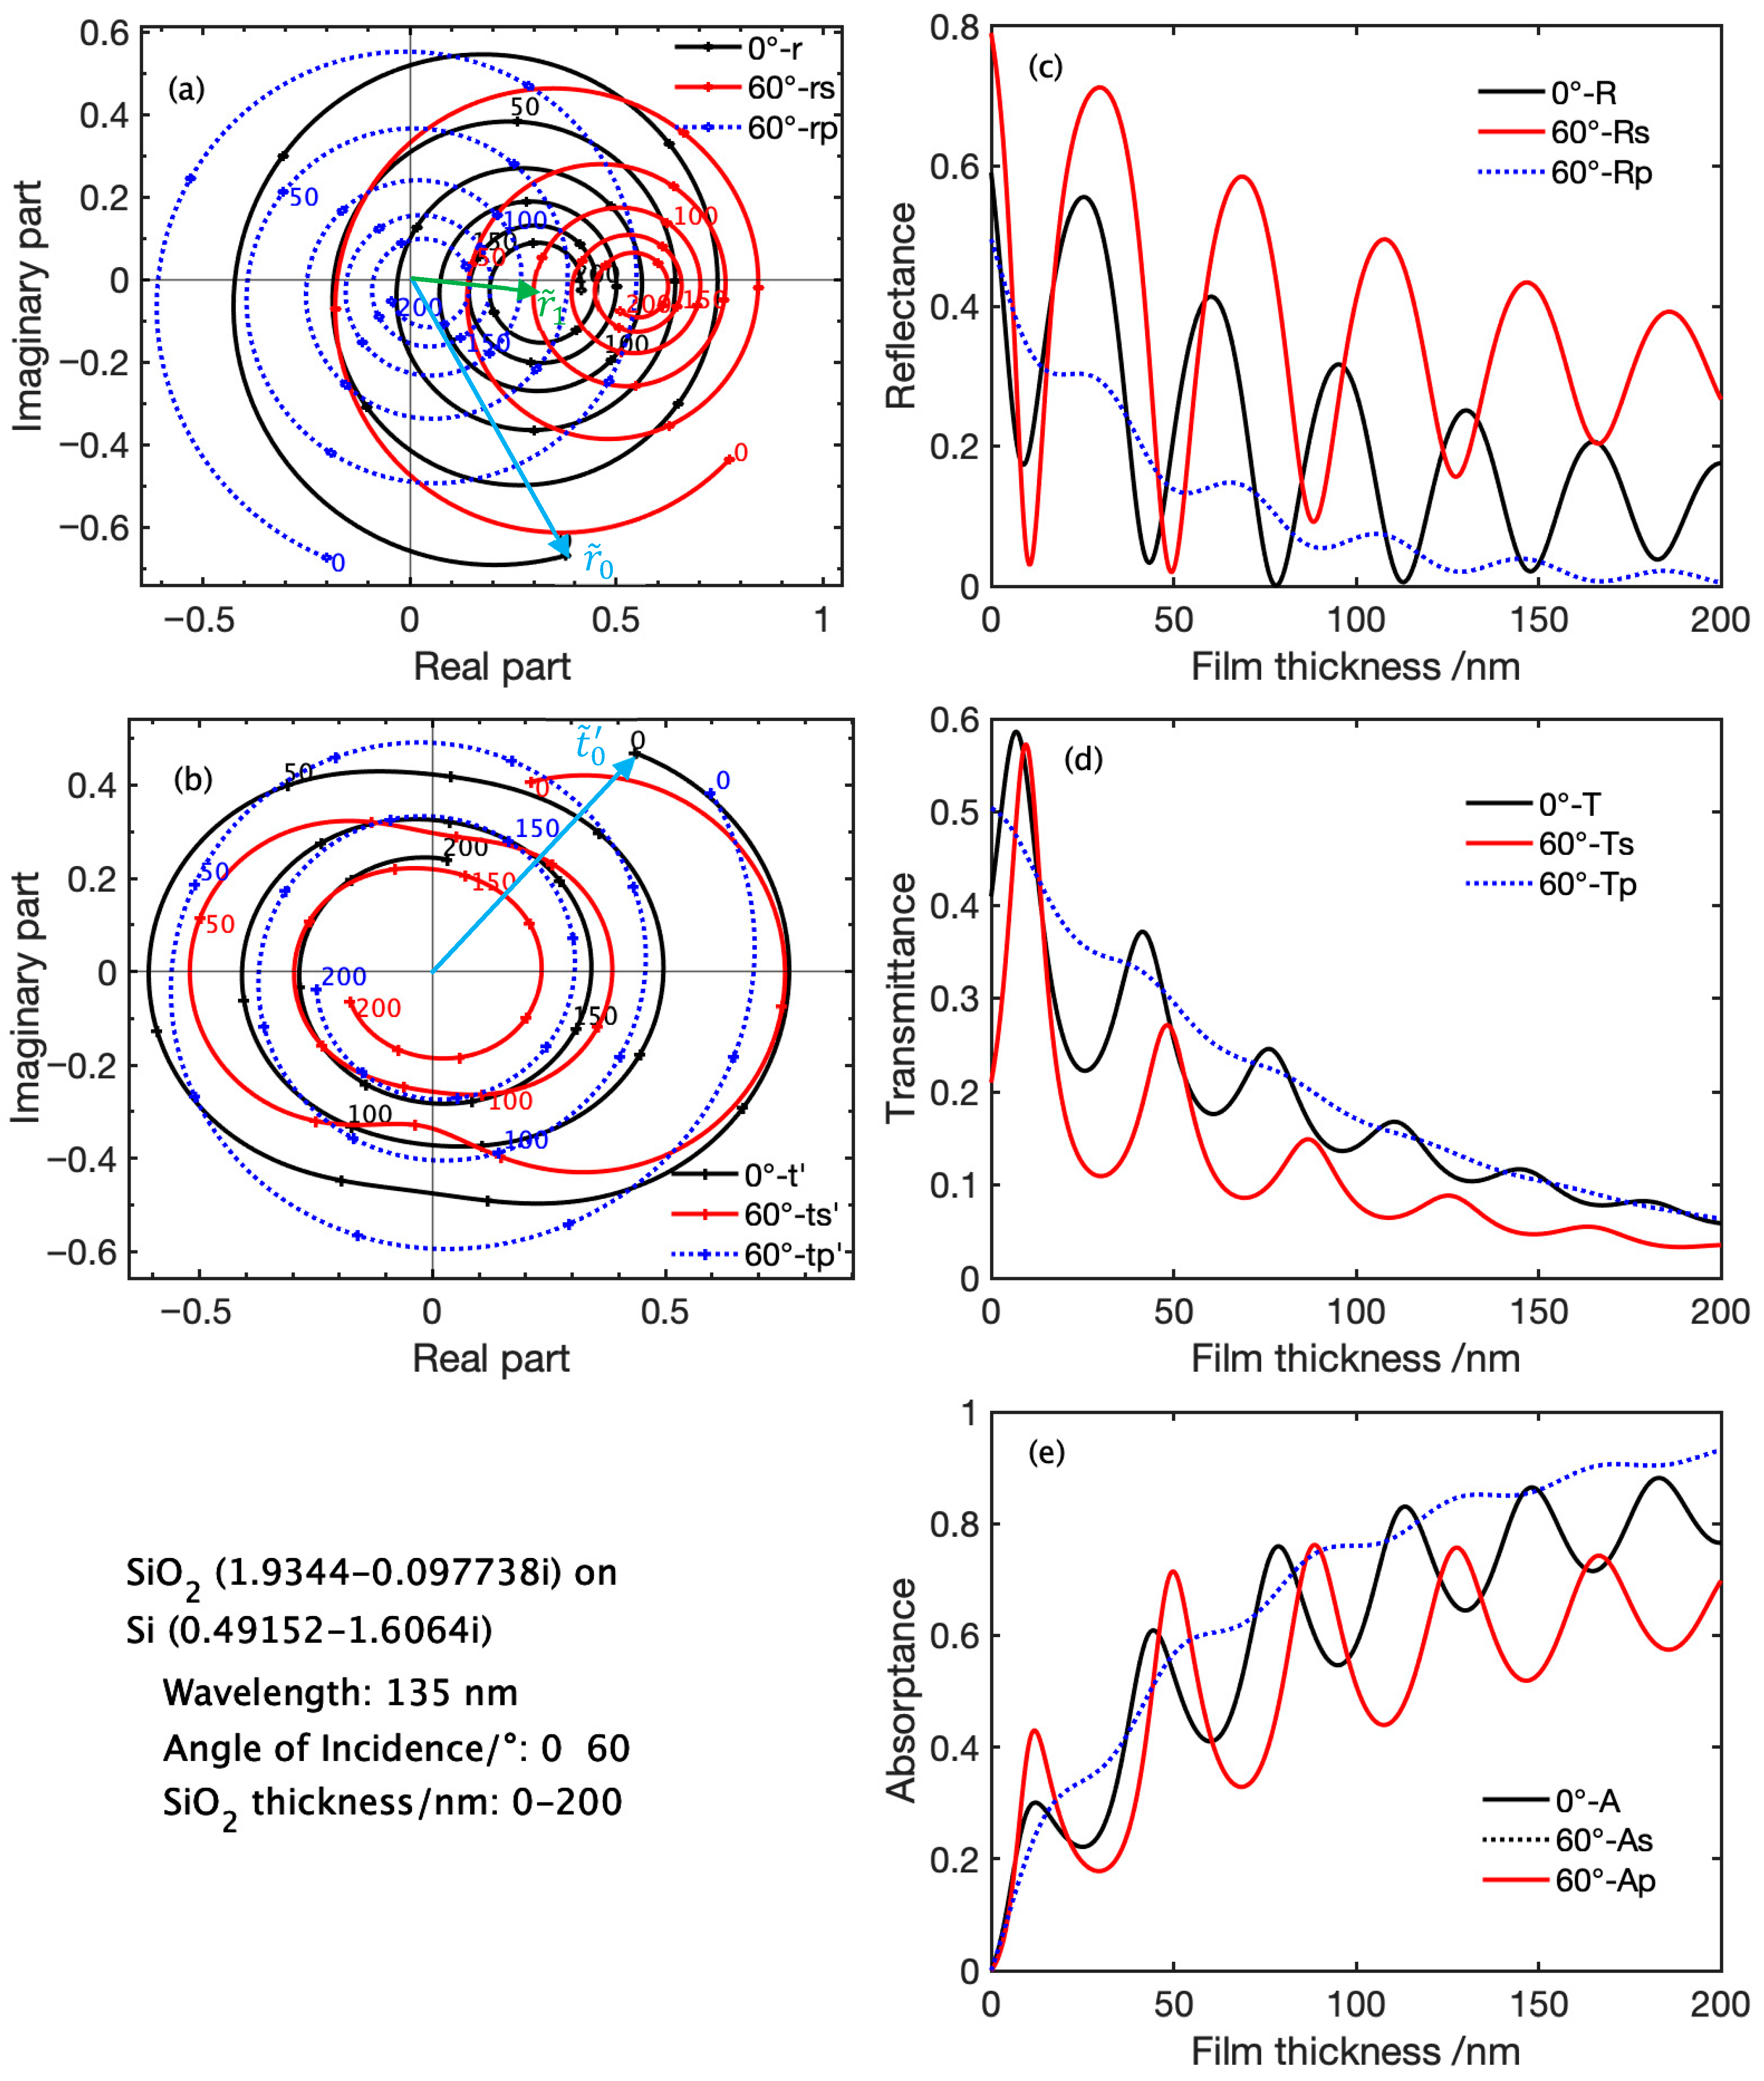
Figure 7 shows ARCs (s-component: solid curve with dots, p-component: dotted curve with dots), products of square root of c (given by Equation (10)) and ATCs (s-component: solid curve with crosses, p-component: dotted curve with crosses), power reflectance, transmittance and absorptance at the wavelength of 135 nm as a function of the SiO2 film thickness from 0 nm to 200 nm at the AOI of 0° and 60°. In Figure 7b, to distinguish the multiplied ATC by c from ATC, superscript prime is added as in t′, ts′ and tp′. For the complex plane representation such as Figure 7a,b, it should be reminded that the square of the distance from the origin equals to power reflectance or transmittance and complex argument of the point is equal to the phase difference between the incident wave and the reflected or transmitted wave. For both curves of reflection and transmission, markers are shown every 10 nm and thickness number in nm are shown every 50 nm at the right side of the corresponding points.
Figure 7.
Calculated results for the system of SiO2 on Si at the wavelength of 135 nm with the AOI of 0° and 60° as a function of SiO2 film thickness from 0 nm to 200 nm. (a): ARCs (s-component: solid curve with dots, p-component: dotted curve with dots); (b): products of square root of c and ATCs (s-component: solid curve with crosses, p-component: dotted curve with crosses). The film thickness is marked every 10 nm. (c–e): Power reflectance, transmittance and absorptance of the SiO2 film.
One of the prominent features of the curves in Figure 7a,b is circular or quasi-circular traces. This is brought by the continuous increase in the phase angle as a function of the film thickness through the phase term δ given by Equation (18) in Equations (16) and (17). With the parameters given here, it can be shown that for the denominator of both equations, change in phase angle and amplitude are relatively small and therefore, each numerator nearly governs the behavior.
The blue spiral curve in Figure 7a is an ARC trace at normal incidence expressed by Equation (16). At the beginning of the locus when there is no overlayer, the point is marked by , corresponds to the ARC of the substrate. As the film thickness increases, the locus goes around clockwise and converges to the point, , corresponding to the ARC of the film with infinite SiO2 film thickness since the photons cannot reach the substrate at this limit. If the film is transparent, the locus does not shrink but becomes a circle with a center at the point, . The film thickness only changes the phase of the ARC point with a given film thickness in relative to , and the distance between the two points remains constant as will be confirmed in Section 4.2.2.
As the AOI is increased from 0, converging point of the spiral curve for s- and p-component shifts to positive- and negative-direction, respectively. The amount of the shift depends on the complex refractive indices of the film in addition to the AOI and is estimated from Figure 5. It should be noted that rotating angle per film thickness (rotating speed) for the AOI of 60° is about half that for normal incidence. This is because cos60° = 1/2 in Equation (18) if the imaginary part of is neglected. It is apparent that the presence of the imaginary part in simply results in absorption or decay in amplitude.
The blue spiral curve in Figure 7b denoted by t’ is a trace of the products of square root of c given by Equation (10) and the ATC expressed by Equation (17). According to Equations (3) and (7), photodiode external quantum efficiency is proportional to the square of the absolute value of t′. The locus of t′ starts from the point, , corresponding to the ATC of the substrate multiplied by c and converges to the origin at the limit of infinite film thickness.
Figure 7c,d show that minimum reflectance for s-polarization at normal incidence is realized when the film thickness is 75 nm, but maximum transmittance is not at this thickness but realized at the film thickness of 10 nm due to the existence of the absorption in the film.
Absorptance shown in Figure 7e is given by A = 1-R-T based on Equation (3). Therefore, film thickness giving reflectance local minimum is nearly equal to the one giving transmittance local maximum and local absorptance maximum.
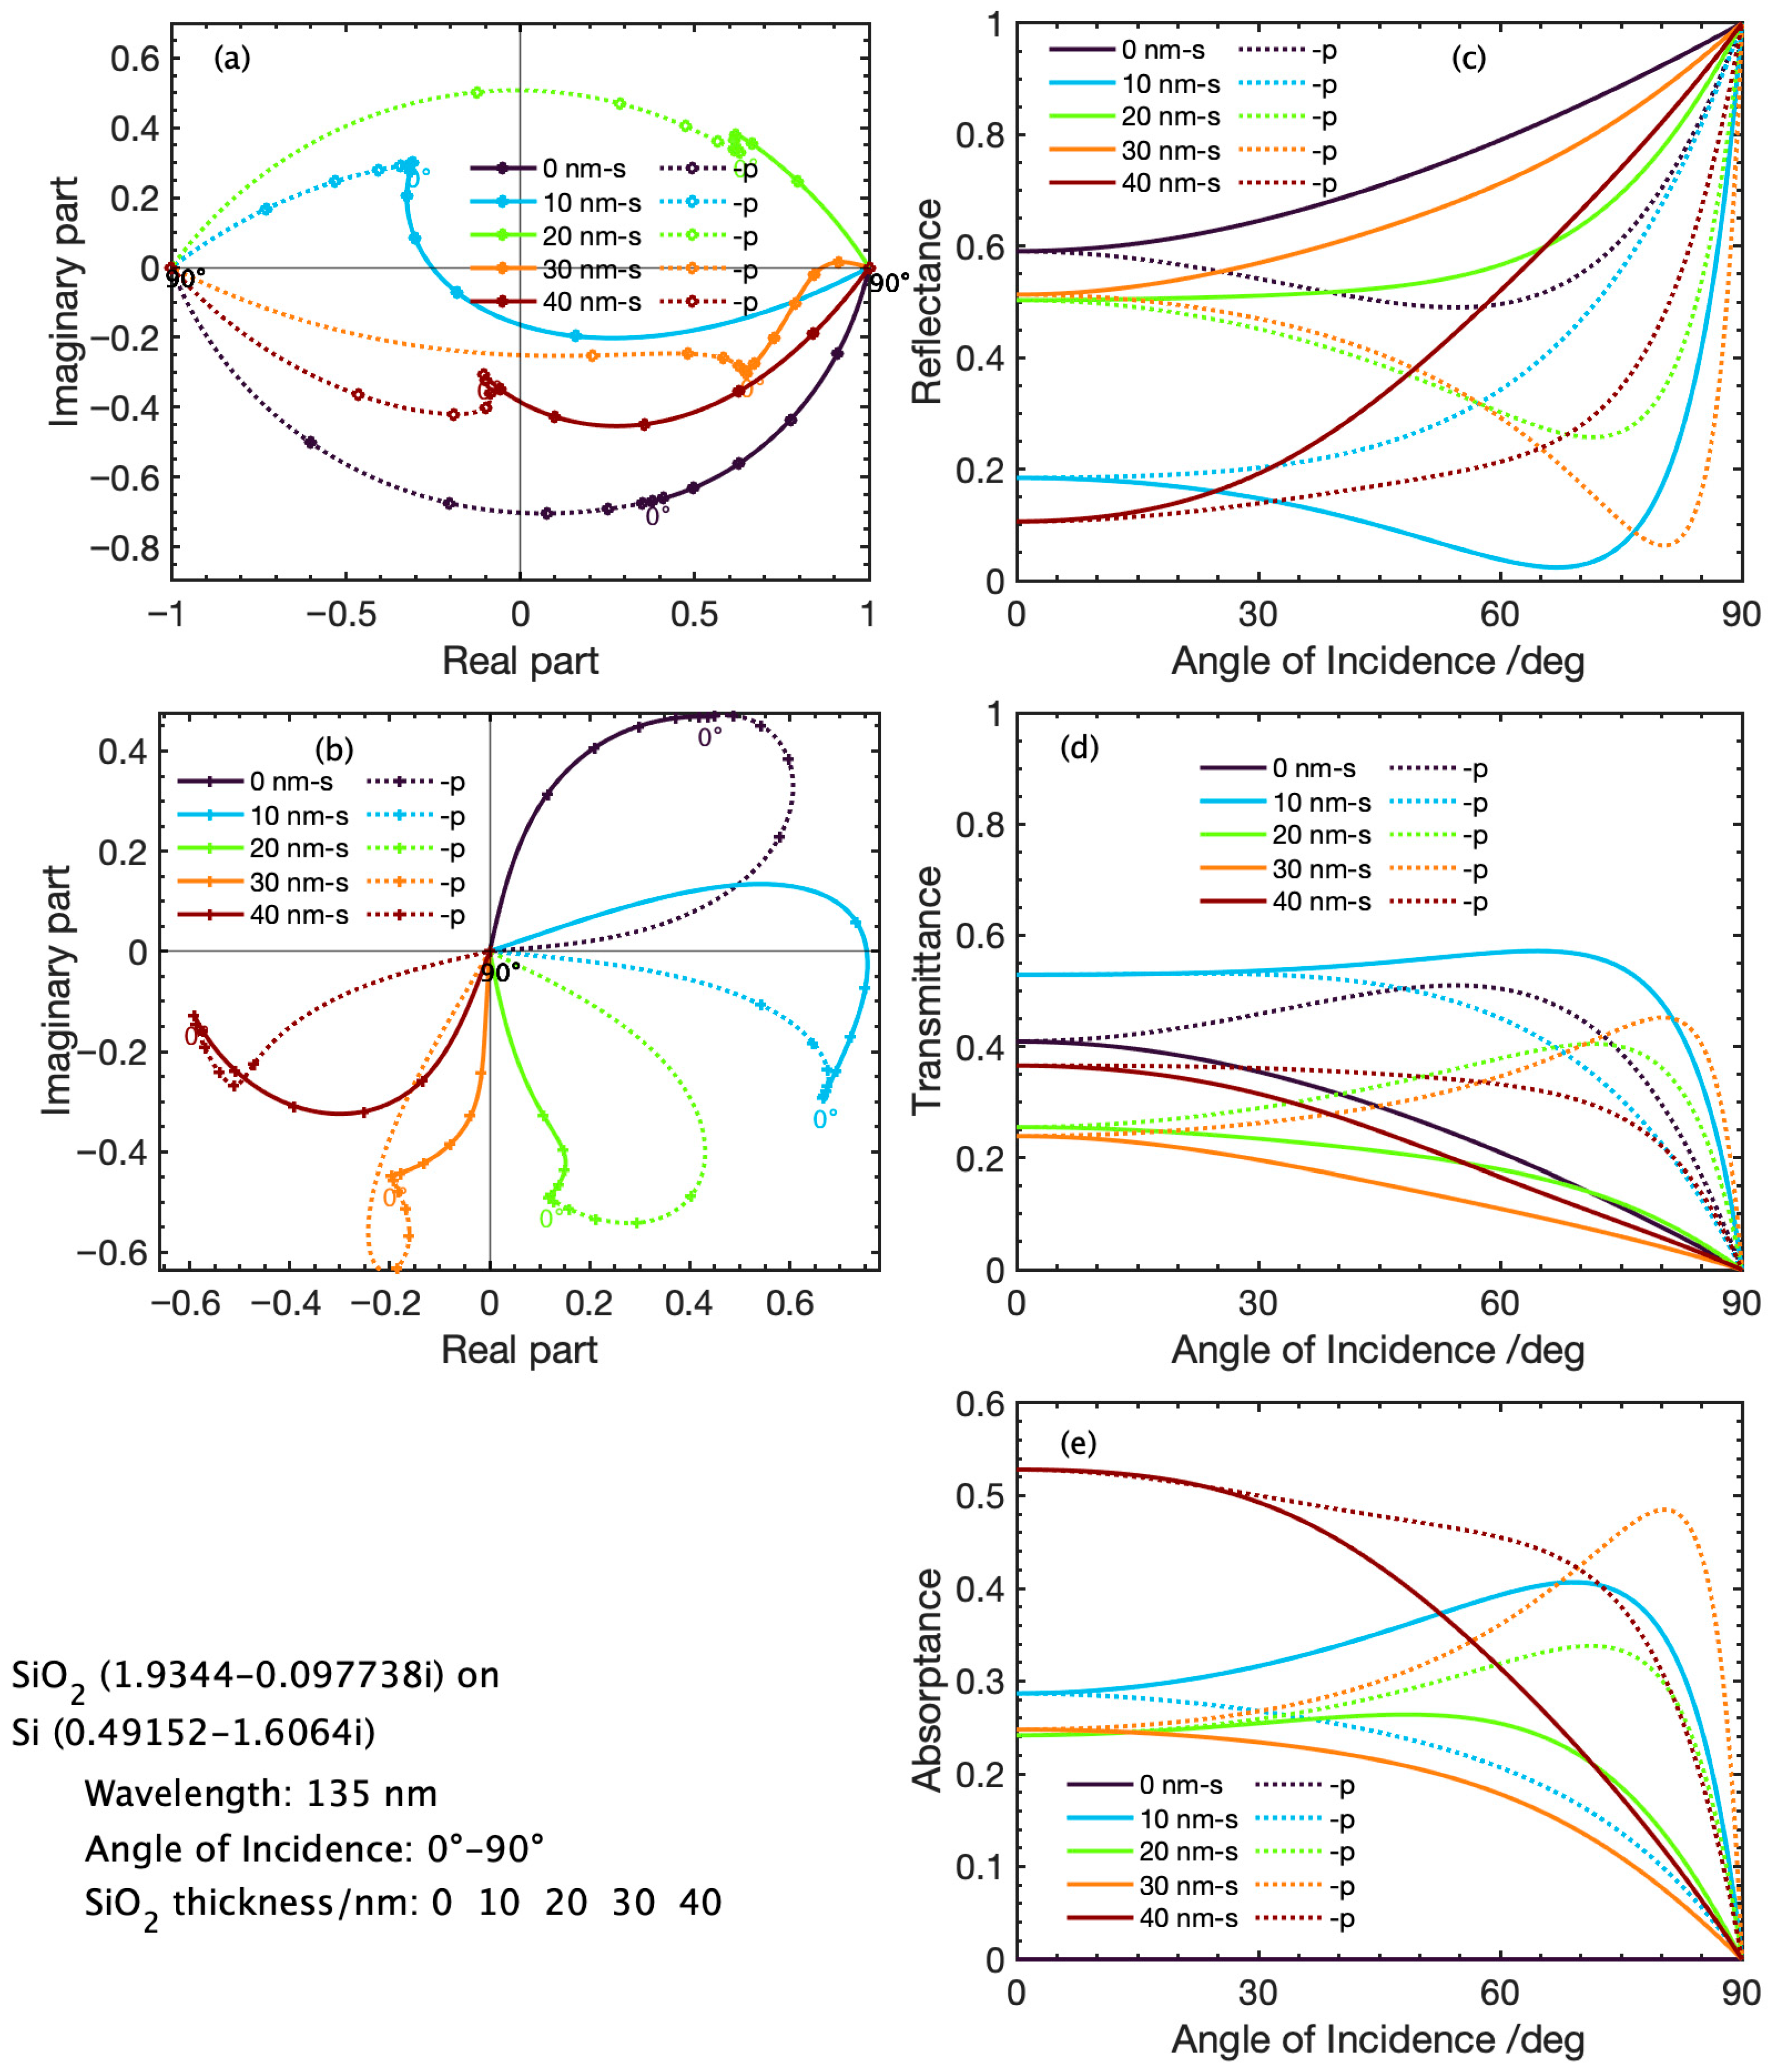
Figure 8 shows results on the same system under the same conditions but expressed differently as a function of the AOI from 0° to 90° under the SiO2 film thicknesses changing from 0 nm to 40 nm in 10 nm step.
Figure 8.
Calculated results for the system of SiO2 on Si at the wavelength of 135 nm with the SiO2 film thickness of 0 nm to 40 nm in 10 nm step as a function of the AOI from 0° to 90°. (a): ARCs (s-component: solid curve with dots, p-component: dotted curve with dots); (b): products of square root of c and ATCs (s-component: solid curve with crosses, p-component: dotted curve with crosses). The AOI is marked every 15°. (c–e): Power reflectance, transmittance and absorptance of the SiO2 film.
The solid curves and dotted curves in Figure 8a show traces of ARCs for s-component and p-component, respectively, when the AOI is changed from 0° to 90° under same film thicknesses from 0 nm to 40 nm in 10 nm step. When there is no film, the trace consisting of both s- and p-components looks semielliptical as seen in Figure 5. However, as the thickness increases, spike-like features emerge around the 0° point.
Unusual phenomenon that Rp can exceed Rs are observed in Figure 8c for the film thickness of 10 nm in the entire AOI. Also, note that Rs can have a minimum for the film thickness of 10 nm, which can be smaller than the value at normal incidence. These phenomena never happen for the single boundary system as seen in Figure 6.
When looking at Figure 8c, it is difficult to predict how the film thickness affects the angular response since the order of reflectance at normal, for instance, is not systematic. On the other hand, representation on a complex plane as shown in Figure 8b clearly gives insights into how the reflectance and transmittance are affected by the film thickness and by the AOI although it is rather complicated.
Comparison between Figure 7a,b and Figure 8a,b shows that the latter is more complicated than the former. In other words, ARC and ATC plots on complex planes as a function of the angle of incidence, , are more complicated than those as a function of the film thickness, d1. The difference is brought by the fact that d1 only affects but affects all the parameters of and in Equations (16) and (17).
4.2.2. SiO2 on Si System at the Wavelength of 254 nm
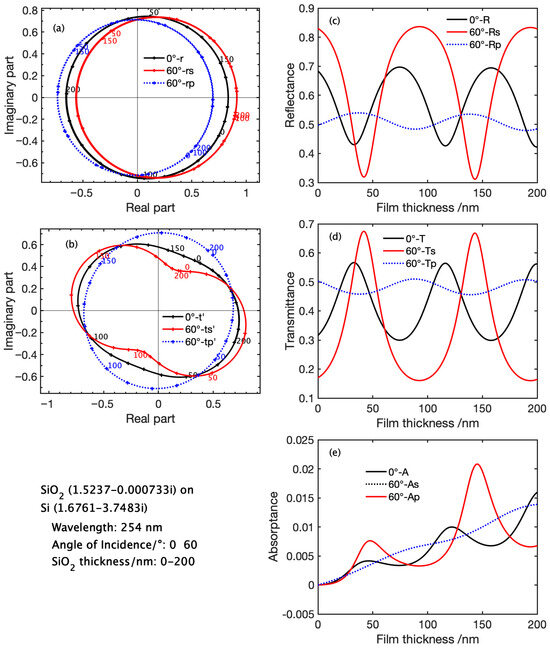
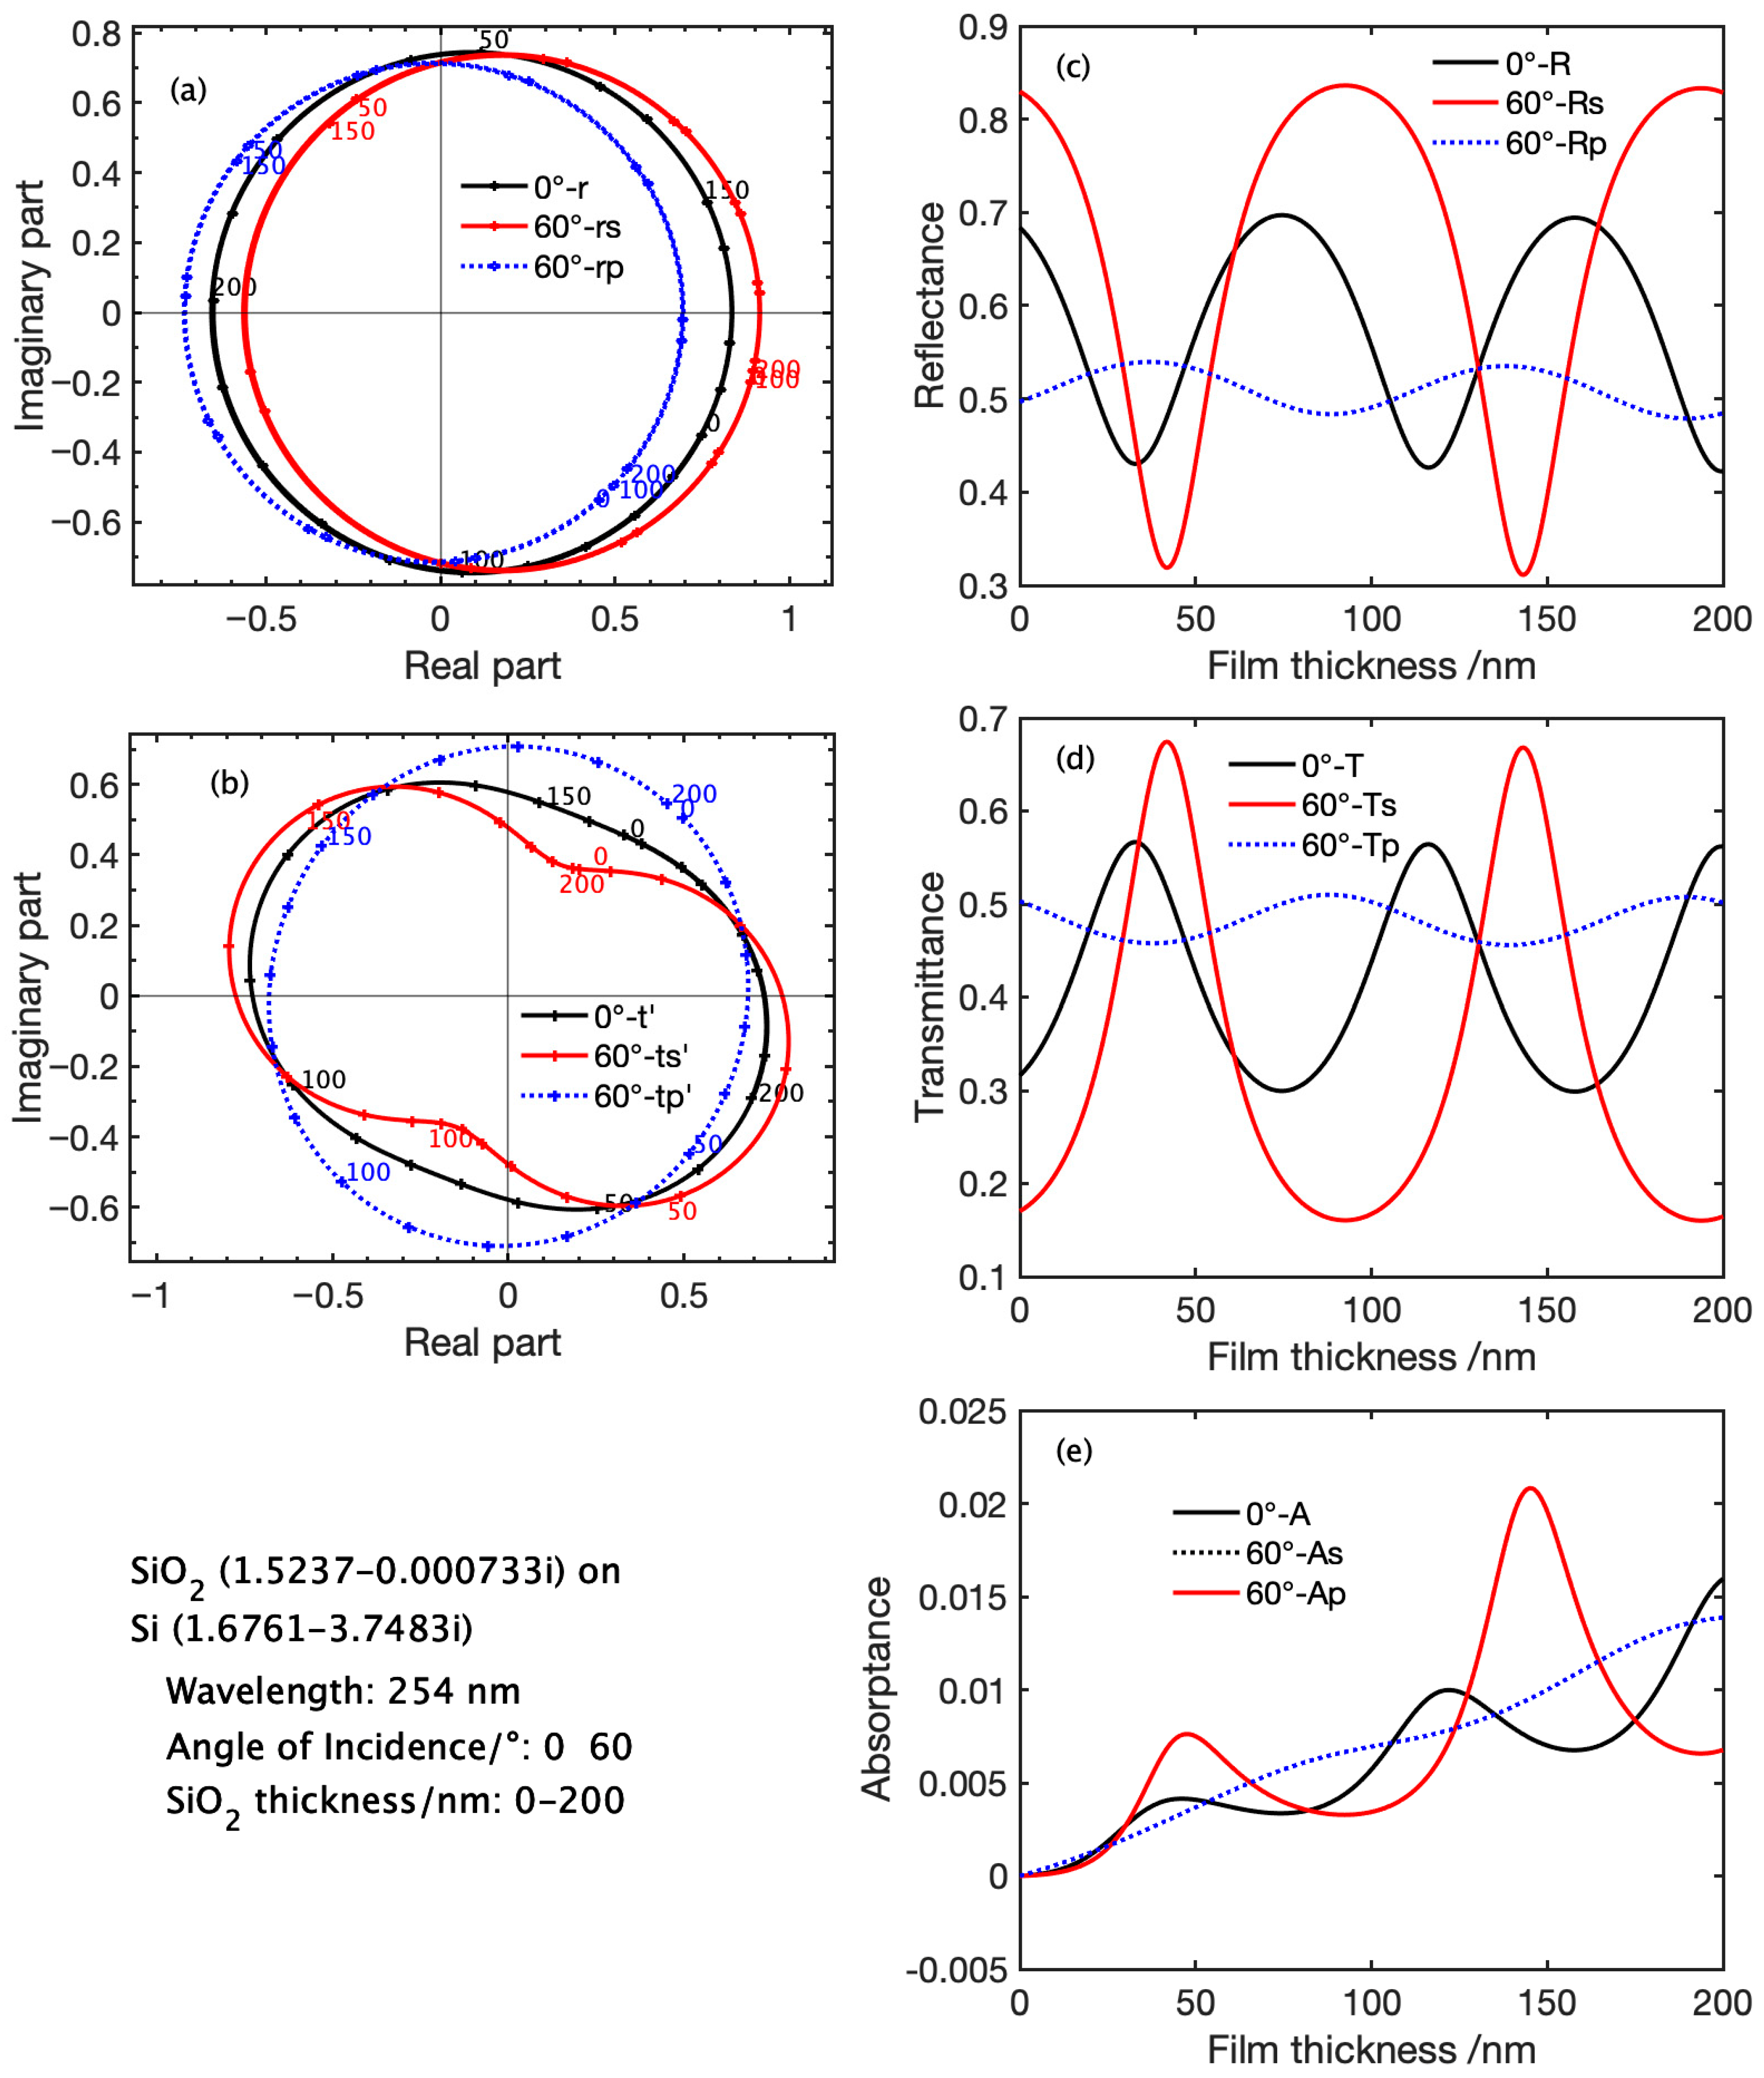
Figure 9 shows ARCs (s-component: solid curve with dots, p-component: dotted curve with dots) and ATCs (s-component: solid curve with crosses, p-component: dotted curve with crosses) together with power reflectance, transmittance and absorptance at the wavelength of 254 nm as a function of the SiO2 film thickness from 0 nm to 200 nm at the AOI of 0° and 60°. For both curves of reflection and transmission, markers are shown every 10 nm and the film thickness number in nm are shown every 50 nm at the right side of the corresponding points.
Figure 9.
Calculated results for the system of SiO2 on Si at the wavelength of 254 nm with the angles of incidence of 0° and 60° as a function of SiO2 film thickness from 0 nm to 200 nm. (a): ARCs (s-component: solid curve with dots, p-component: dotted curve with dots); (b): products of square root of c and ATCs (s-component: solid curve with crosses, p-component: dotted curve with crosses). The film thickness is marked every 10 nm. (c–e): Power reflectance, transmittance and absorptance of the SiO2 film.
As explained in the preceding section, since the rotating angle per film thickness for the AOI of 60° is about half that for normal incidence, the blue trace for the normal incidence rotates two turns while the black (s-component at 60°) and red (p-component at 60°) traces rotates one turn. Contrary to Figure 7a, traces in Figure 9a do not shrink but form almost perfect circles. The difference originates from the fact that the imaginary part of the SiO2 film, k1, is close to zero (slight shrinking in radius can be noticed due to nonzero k1). As noted in the preceding section, nearly perfect circles mean that the change in amplitude and phase of the denominator of Equation (16) is negligibly small and therefore the numerator nearly governs the behavior.
It should be noted that change in reflectance and transmittance for p-components as a function of film thickness is much smaller than those for s-components, in all cases.
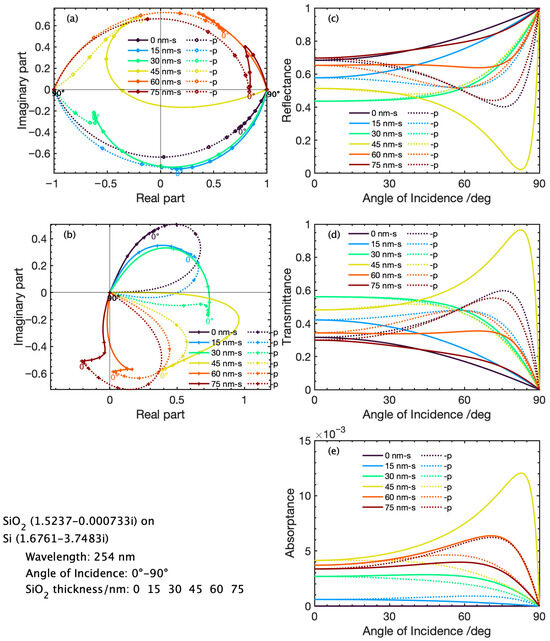
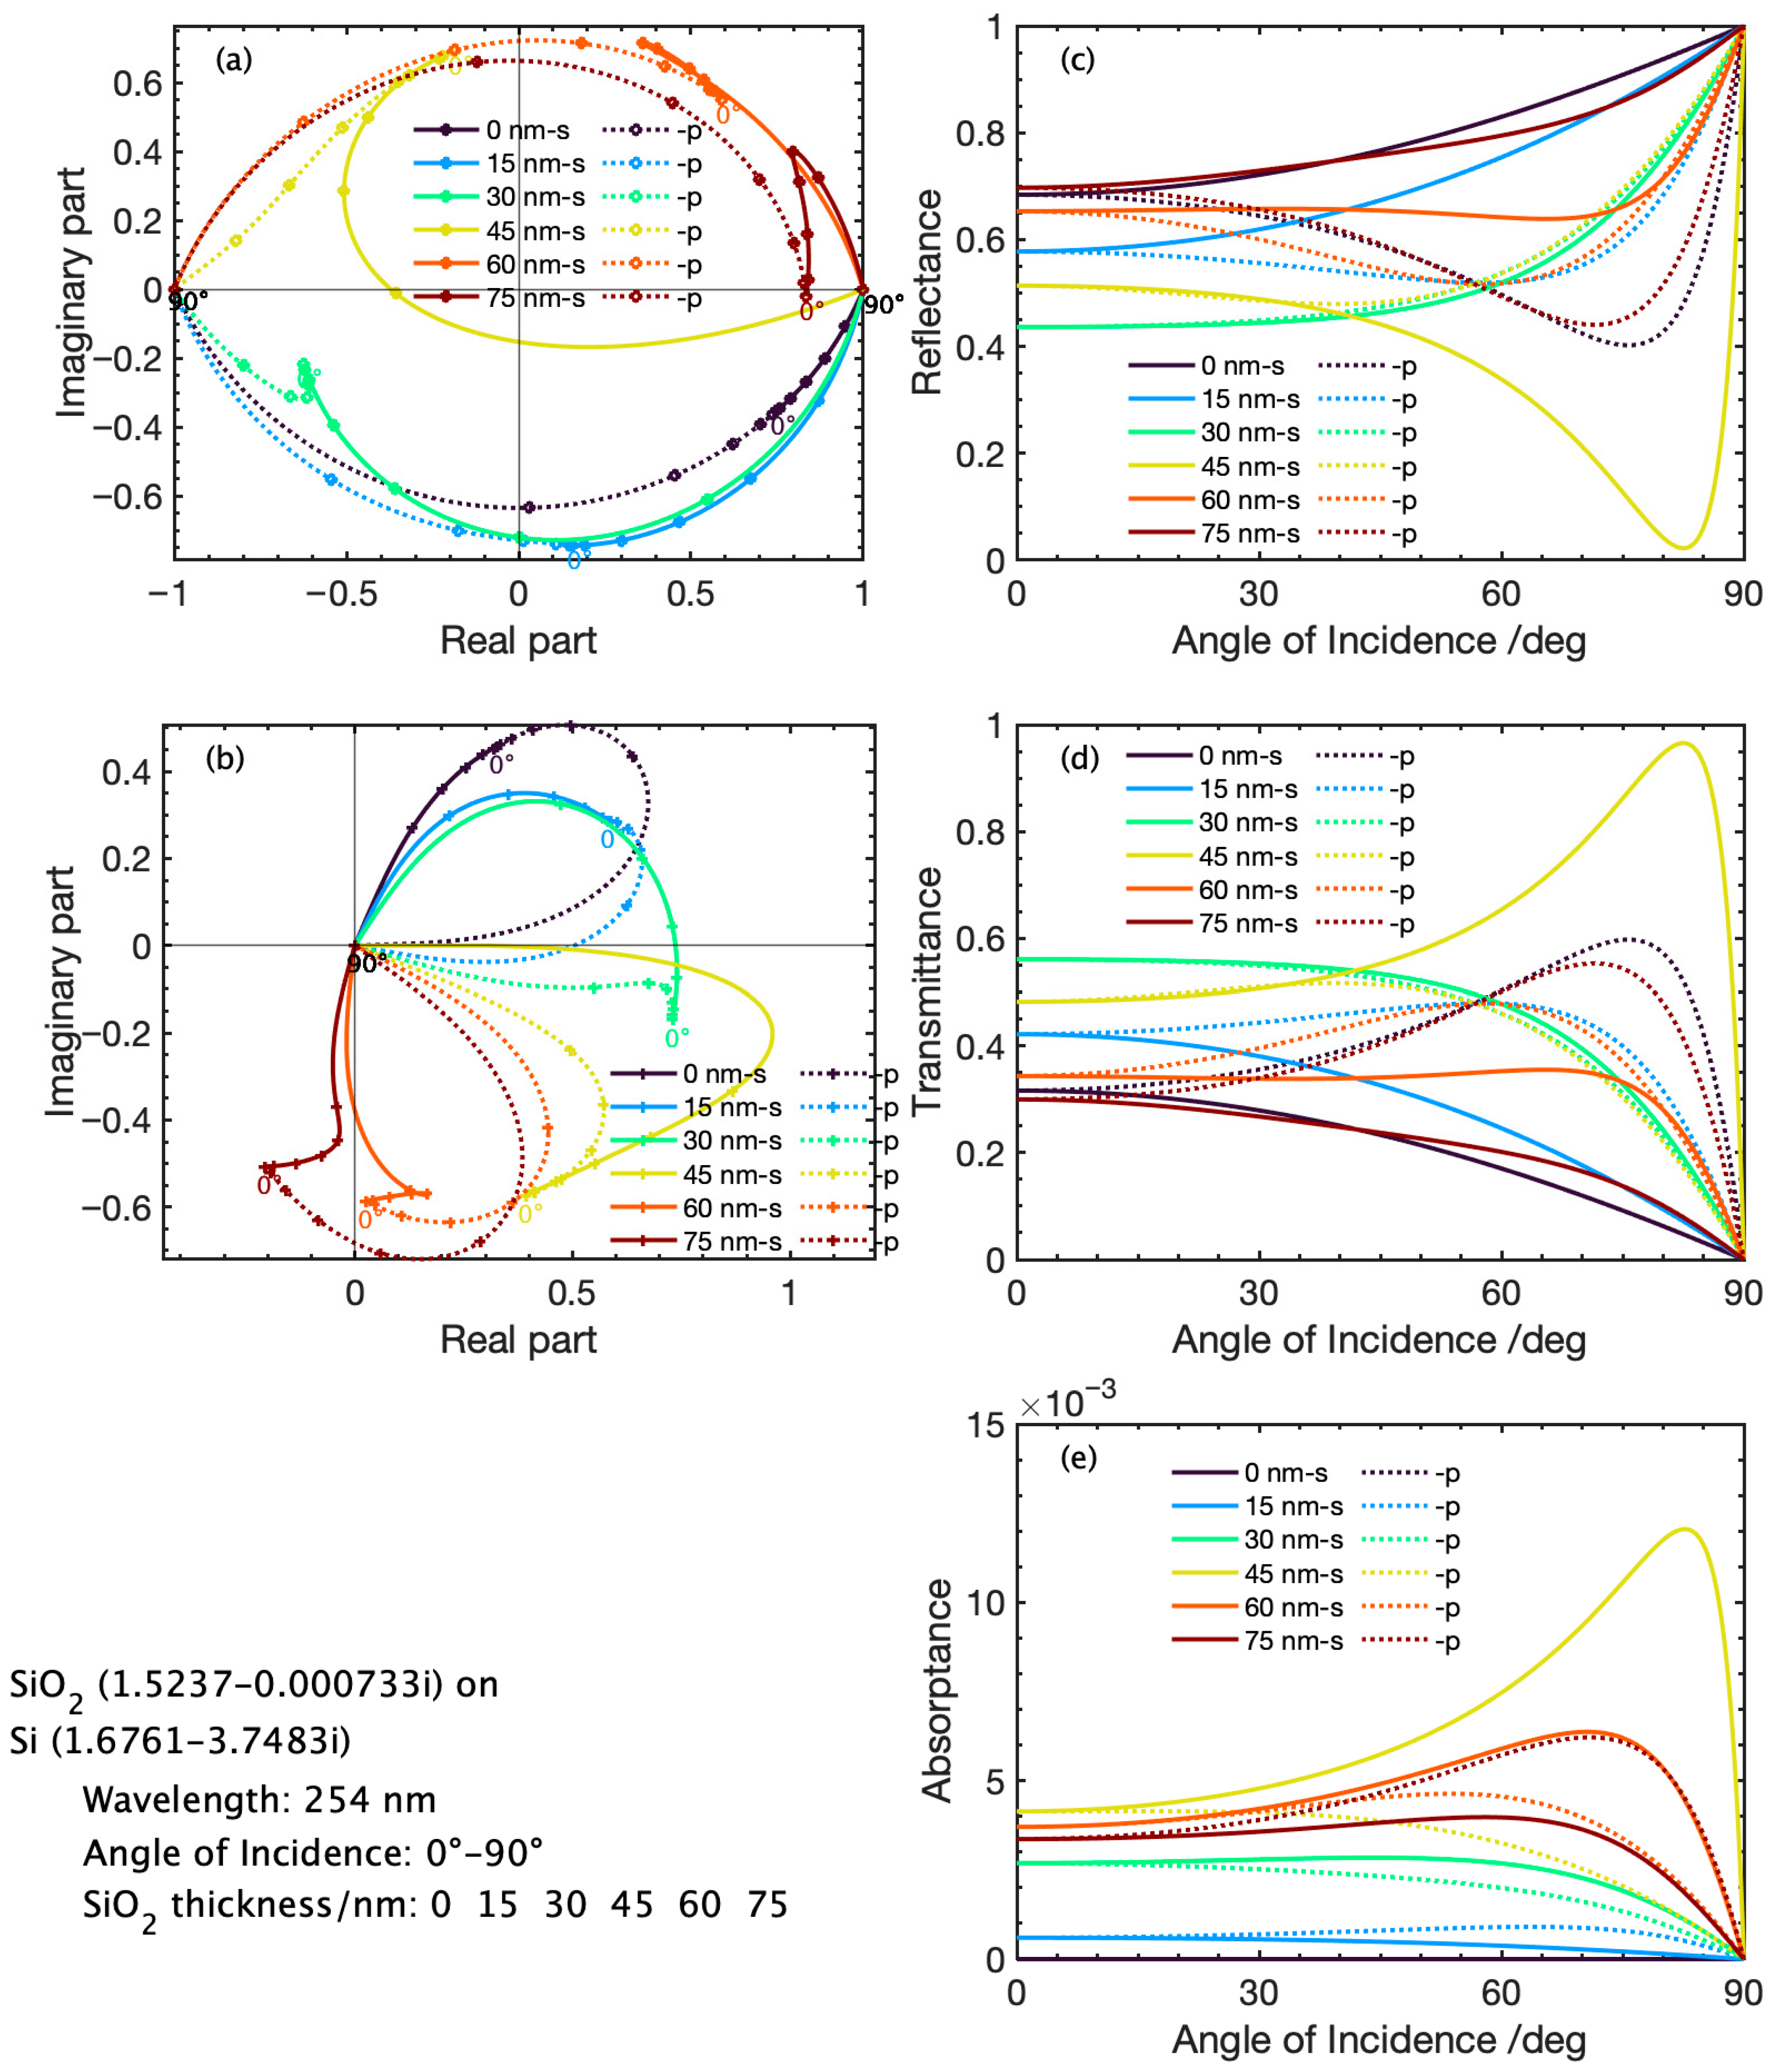
Figure 10 shows calculated results for the system of SiO2 on Si at the wavelength of 254 nm with the SiO2 film thickness of 0 nm to 75 nm in 15 nm step as a function of the AOI from 0° to 90°. In Figure 10a,b, all traces become sharper and more abrupt compared to Figure 9. Figure 10d shows that 45 nm film thickness gives the highest transmittance of 97% for p-polarization at the AOI 82°. Note that the scale of absorptance in Figure 10e is very small (multiplied by 10−3).
Figure 10.
Calculated results for the system of SiO2 on Si at the wavelength of 254 nm with the SiO2 film thickness of 0 nm to 75 nm in 15 nm step as a function of the AOI from 0° to 90°. (a): ARCs (s-component: solid curve with dots, p-component: dotted curve with dots); (b): products of square root of c and ATCs (s-component: solid curve with crosses, p-component: dotted curve with crosses). The AOI is marked every 15°. (c–e): Power reflectance, transmittance and absorptance of the SiO2 film.
4.3. Spectral Properties of SiO2 on Si System
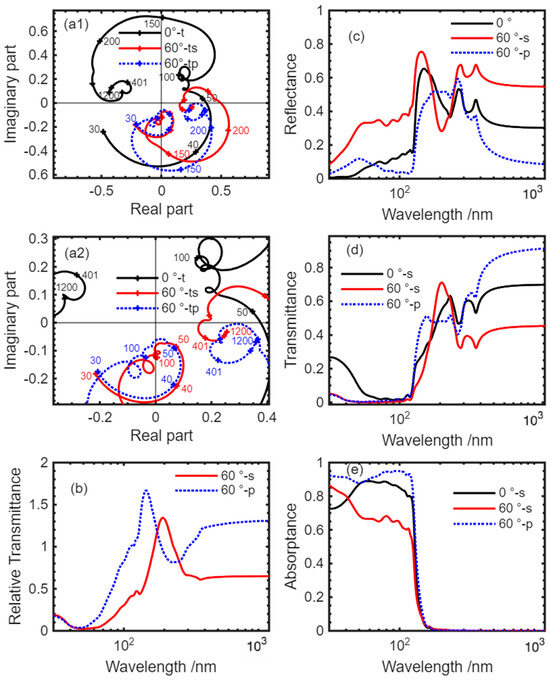
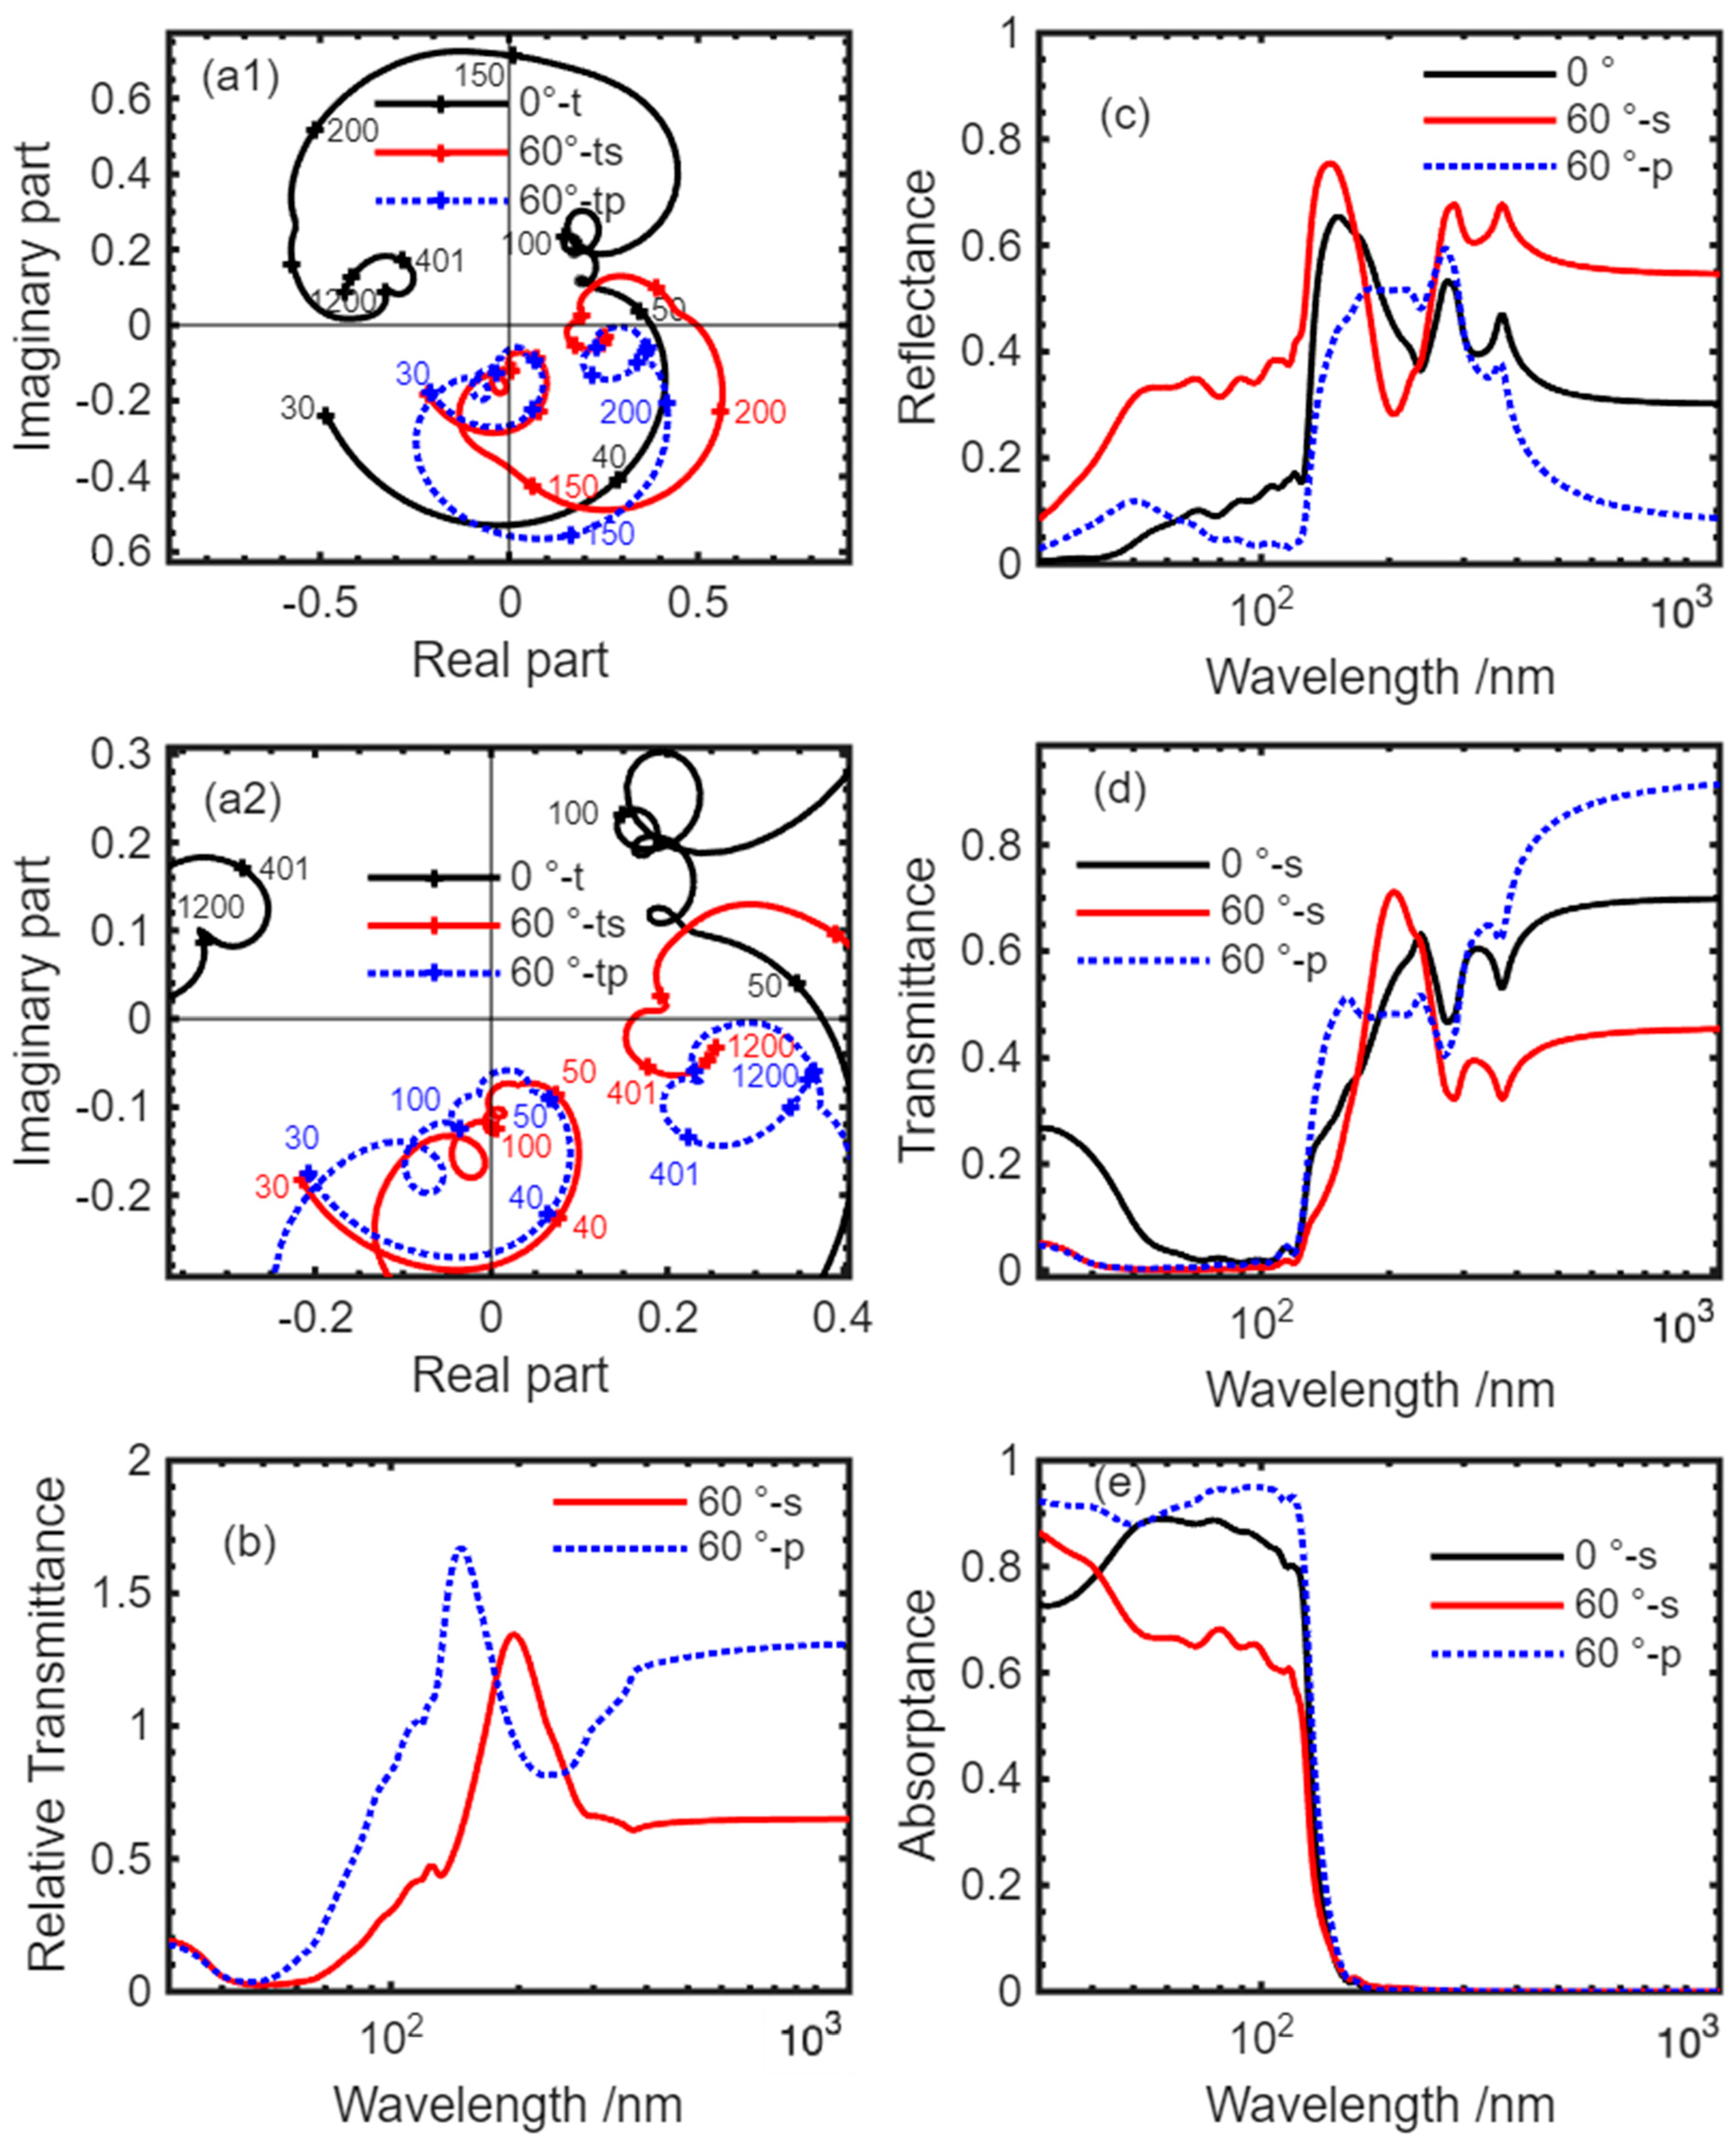
Figure 11 shows calculated results as a function of wavelength from 30 nm to 1200 nm calculated for the system of 30 nm thick SiO2 film on Si at the AOI of 0° and 60°. Specifically, it is composed of (a1): ATCs (s-component: solid curve with dots, p-component: dotted curve with dots); (a2): Enlarged part near the origin of Figure 11a1 to show the details; (b): transmittances of s- and p-components divided by the normal transmittance; (c): power reflectance; (d): transmittance; and (e): absorptance. As Equation (3) shows, quantum efficiency is proportional to transmittance.
Figure 11.
Calculated results for the system of 30 nm thick SiO2 film on Si in the wavelength range from 30 nm to 1200 nm at the AOI of 0° and 60°. (a1,a2): ATCs (s-component: solid curve with dots, p-component: dotted curve with dots) plotted on the complex plane. Numbers near the ATC traces are SiO2 film thickness in nm. (b): transmittances of s- and p-components divided by the normal transmittance. (c–e): Power reflectance, transmittance and absorptance of the SiO2 film.
In Figure 11a1,a2, ATCs at the AOI of 0° and 60° are plotted on the complex plane. Wavelengths are marked with crosses in every 10 nm from 30 nm to 50 nm, in every 50 nm from 50 nm to 300 nm, and in every 400 nm from 400 nm to 1200 nm. Wavelength numbers in nm are shown at 30 nm, 40 nm, 50 nm, 100 nm, 150 nm 200 nm, 400 nm and 1200 nm. The traces show that large change in both optical indices of SiO2 and Si brings large and complicated change in not only amplitude but also phase in the UV (below about 400 nm). In contrast, in the wavelength range from 400 nm to 1200 nm, change in ARC is very limited. Figure 11e shows that the absorption of SiO2 is dominant below 150 nm and it leads to the abrupt decrease in transmittance in this region as shown in Figure 11d. Figure 11b will be compared with experimental results which will be shown in Section 5.2.
4.4. Multilayer System
Under the approximate condition of (for instance, in the soft X-ray region), Yamamoto et al. [20] claimed that to achieve the highest reflectance, criterion for choosing a proper pair of materials, A and B, is to have the smallest possible and and the largest possible , where and are ARCs of A and B, respectively. See the reference [20] for details.
Compared to the soft X-ray region where the condition of can be easily satisfied, in the visible range, , in general, has a non-negligible value. Nevertheless, the results for the SiO2 on Si system in Section 4.2 suggest that the cross term (especially ) is small. In such a case, the above criteria can be useful also in other spectral ranges as a guiding reference.
5. Experimental Verification and Discussion
Some experimental results to compare with the theoretical model described in Section 3 are shown in the wavelength range from 10 nm to 1000 nm for a silicon photodiode, Hamamatsu S1337 windowless type (Hamamatsu Photonics K. K., Hamamatsu, Japan).
5.1. Comparison in External Quantum Efficiency of a Silicon Photodiode
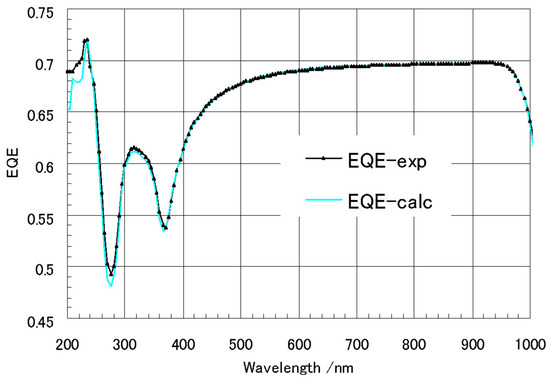
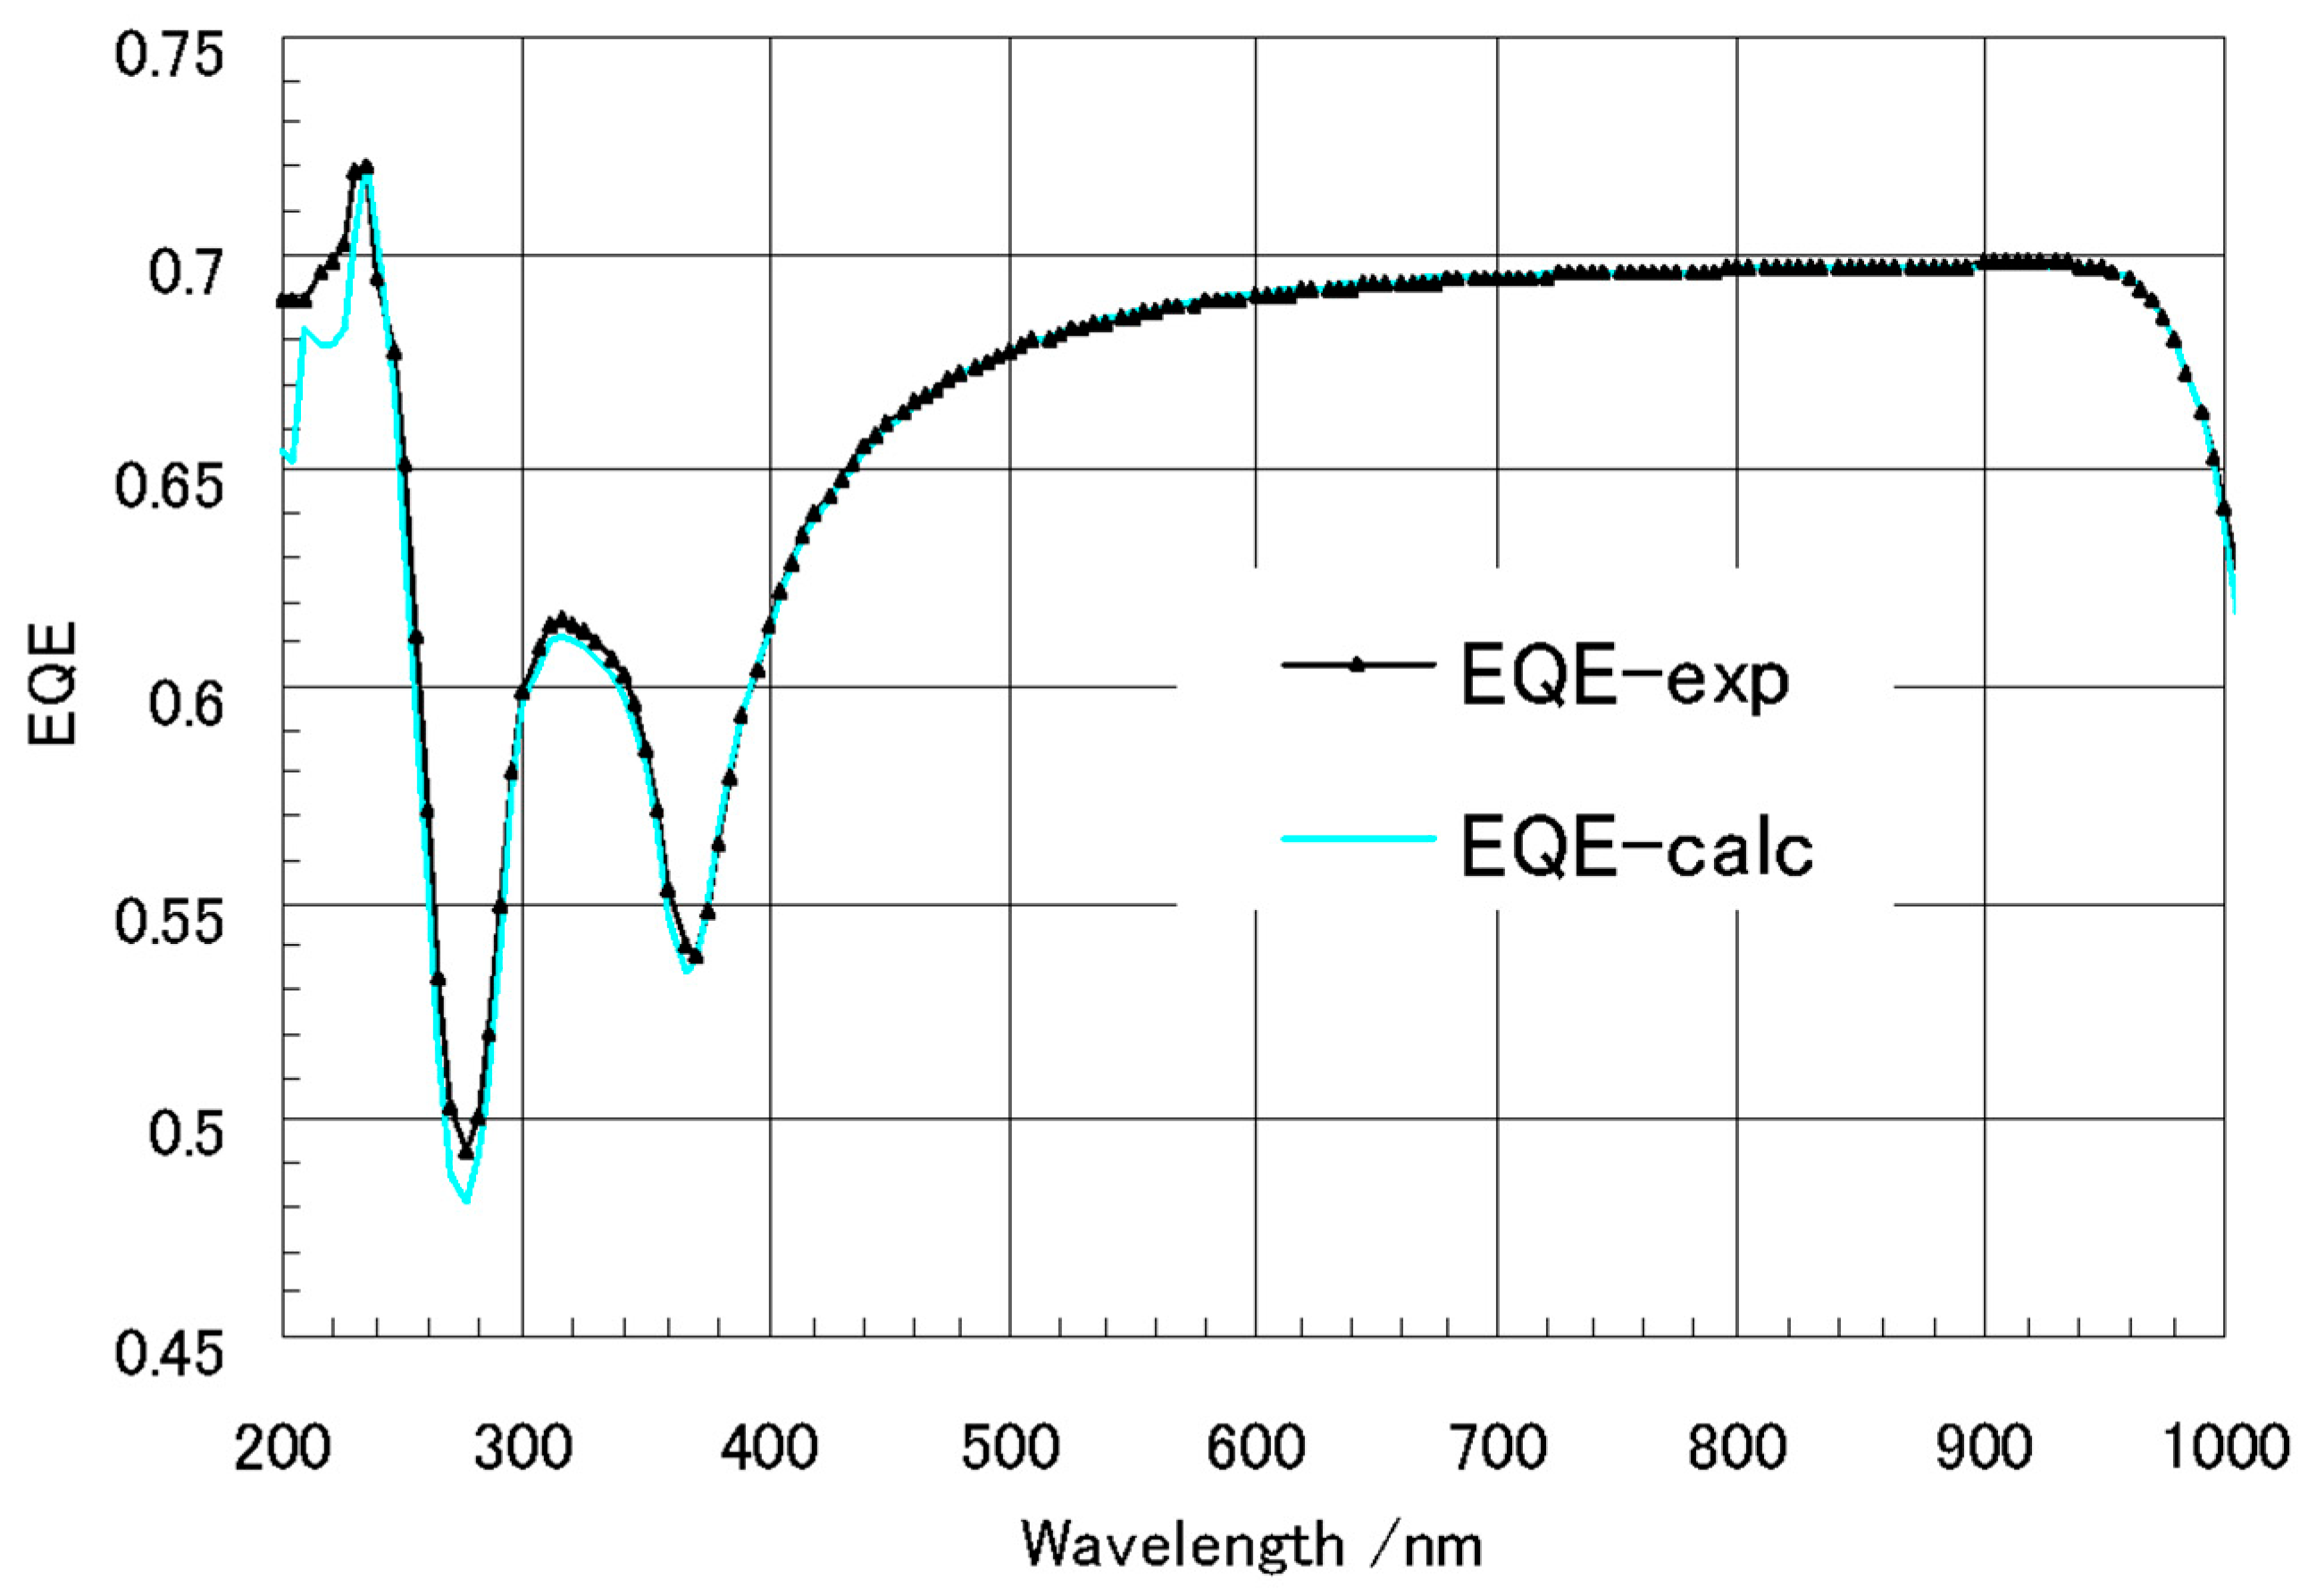
Figure 12 shows comparison results on external quantum efficiency (EQE) [12]. The theoretical results agree within 0.04% with the experiments at laser lines from 458 nm to 633 nm. The good agreement supports the validity of the theoretical model.
Figure 12.
Comparison between the measured external quantum efficiency of a Si photodiode and the calculated one [12].
5.2. Comparison in Spectral Polarization Sensitivity of a Silicon Photodiode
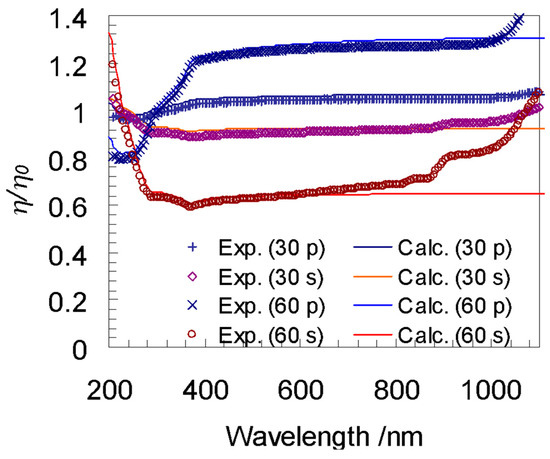
Figure 13 shows comparison results of spectral behavior of the polarization sensitivity [24]. The ordinate is expressed as the spectral quantum efficiency at oblique incidence (30° and 60°) divided by the one at normal incidence. Both experimental and theoretical results agree well except for the near-infrared region. Since the near-infrared radiation can penetrate longer due to the weak absorption, the deviation is highly likely to be caused by reflection by the backside of the Si substrate which was not considered in the model. The discrepancy could be reduced by considering multiple reflections in the substrate since the deviation curves correspond to spectral change in silicon k value.
Figure 13.
Spectral dependence of polarization sensitivity at the angles of incidence of 30° and 60°. Experimental results and the calculated ones are shown by marks and lines, respectively, for p- and s-polarizations. η is quantum efficiency at oblique incidence and η0 the one at normal incidence [24].
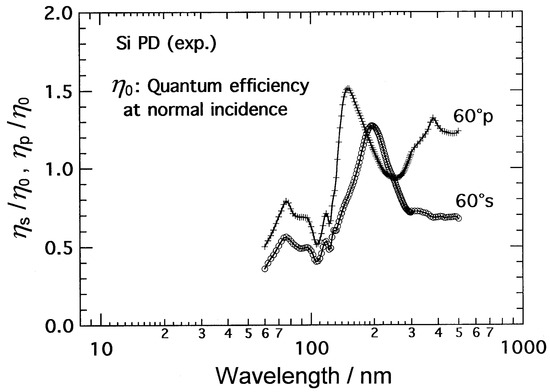
Experimental results at the angle of incidence of 60° corresponding to the theoretical results in Figure 11b are shown in Figure 14. The SiO2 layer thickness was determined to be 27 nm. Except for the region below 140 nm, qualitative agreement between experiment and calculation is obtained. Peak positions (150 nm for p-polarization and 190 nm for s-polarization) and the feature that quantum efficiency for s-polarization exceeds one for p-polarization are well explained by the calculation. Broadening of the peaks and the lower peak value than the calculated are likely caused by roughness of the dioxide surface and/or of the interface between SiO2 and Si. The large lower measured values than the theoretical in the region below about 120 nm could be attributed to a Si dead layer or carrier surface recombination at the Si interface. Even if absorption in the SiO2 layer is strong enough for photons to perfectly attenuate before the substrate, it is observed that the structures below 100 nm coincide well with those of SiO2 absorption. It was reported that there is a charge injection contribution from the oxide to the Si depletion region [10,25]. It was shown that better matching results could be obtained on fitting basis by considering effects of carrier surface recombination [12] and charge injection from the oxide [10,25].
Figure 14.
Experimental results of polarization characteristics for a Si photodiode. The ordinate shows ratios of quantum efficiencies at an angle of incidence of 60° for s-polarization, , and for p-polarization, , to those at normal incidence, [9].
5.3. Comparison in Angular/Polarization Dependence of a Silicon Photodiode
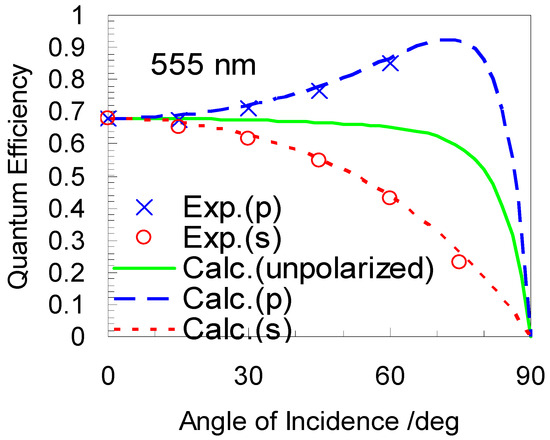
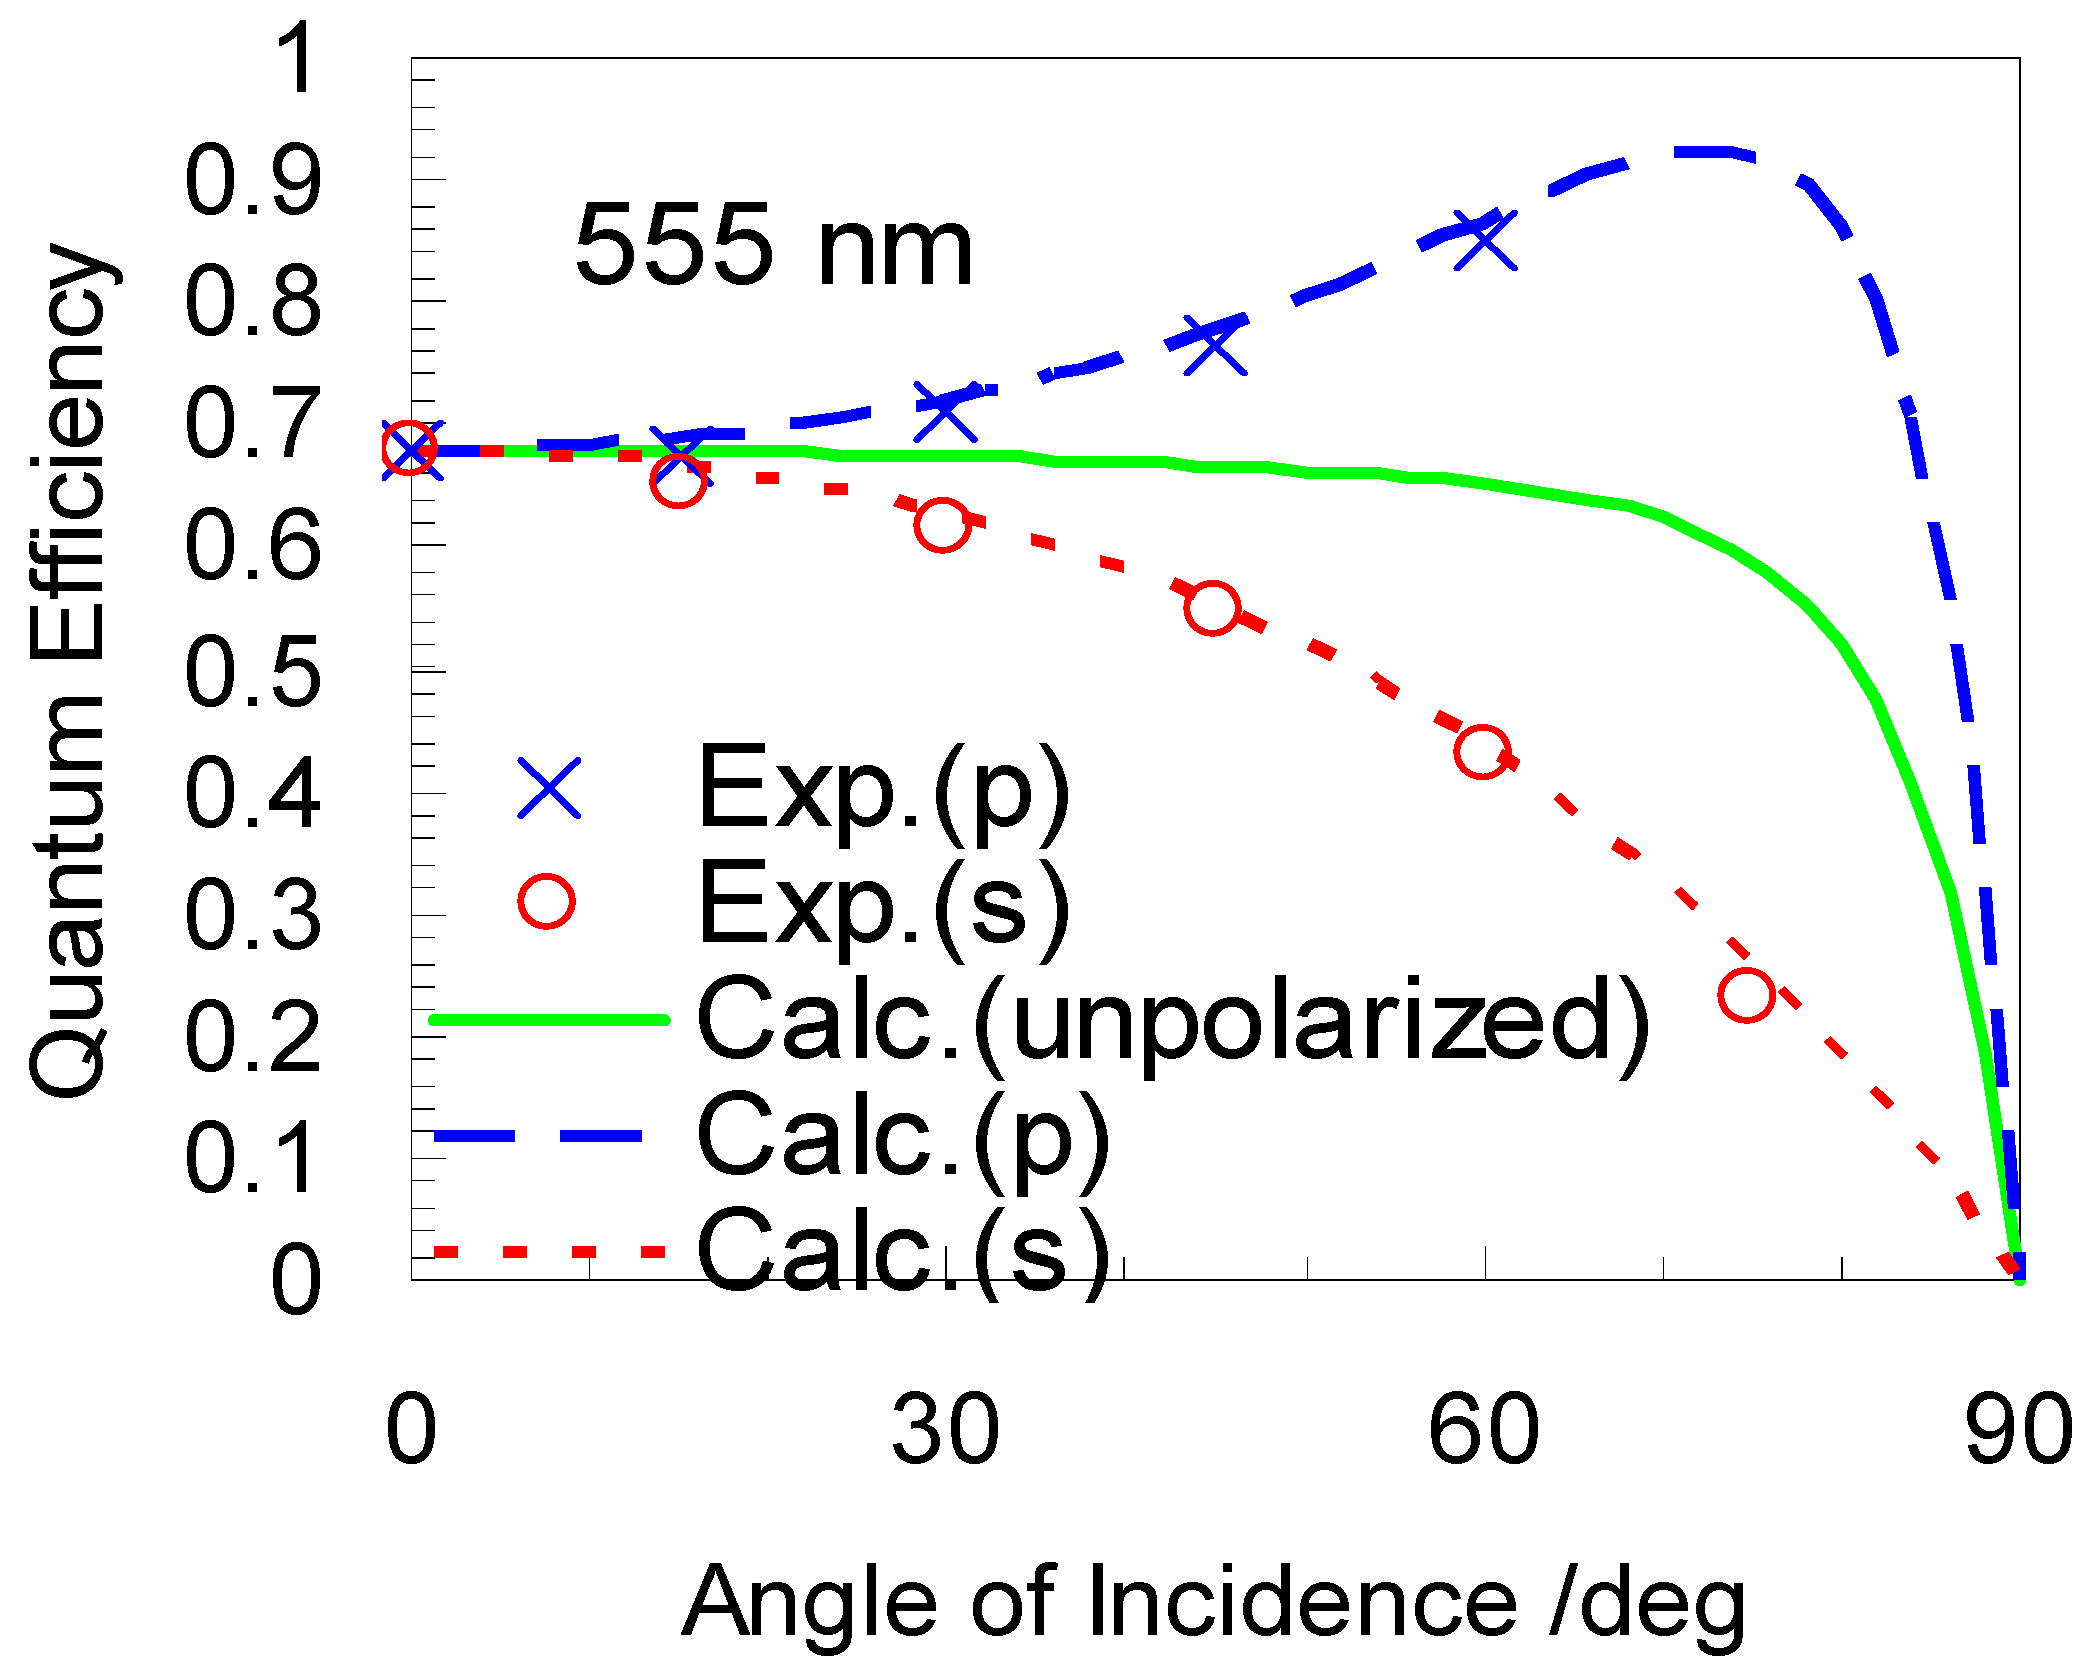
Figure 15 shows comparative results at the wavelength of 555 nm on the angular dependence of quantum efficiency of the silicon photodiode for underfill condition. Quite good agreements are obtained between the experiments and the calculation without any adjustment in scale.
Figure 15.
Measured and calculated quantum efficiency at the wavelength of 555 nm of a Si photodiode with a 30 nm thick SiO2 layer for p- (in blue), s- (in red) polarized and unpolarized radiation (in green) [12].
Since there is no absorption in the oxide layer at this wavelength, the increase in quantum efficiency for p-polarization or decrease for s-polarization is caused by the decrease in reflectance for p-polarization or increase for s-polarization, respectively. For unpolarized incident radiation, the increase in quantum efficiency for p-polarization is nearly canceled out by the decrease for s-polarization except in the vicinity of 90°. Therefore, for overfill condition, it results in nearly perfect angular response called cosine response except in the vicinity of 90°.
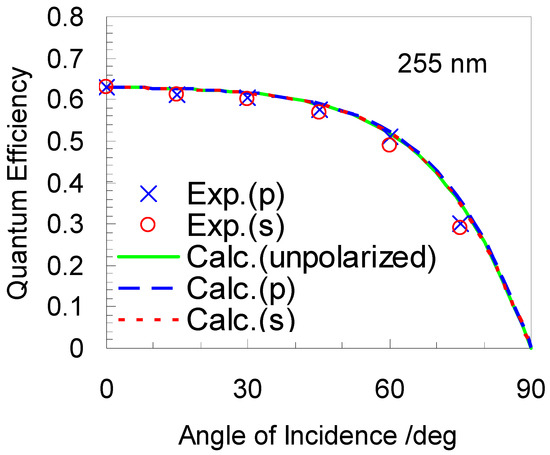
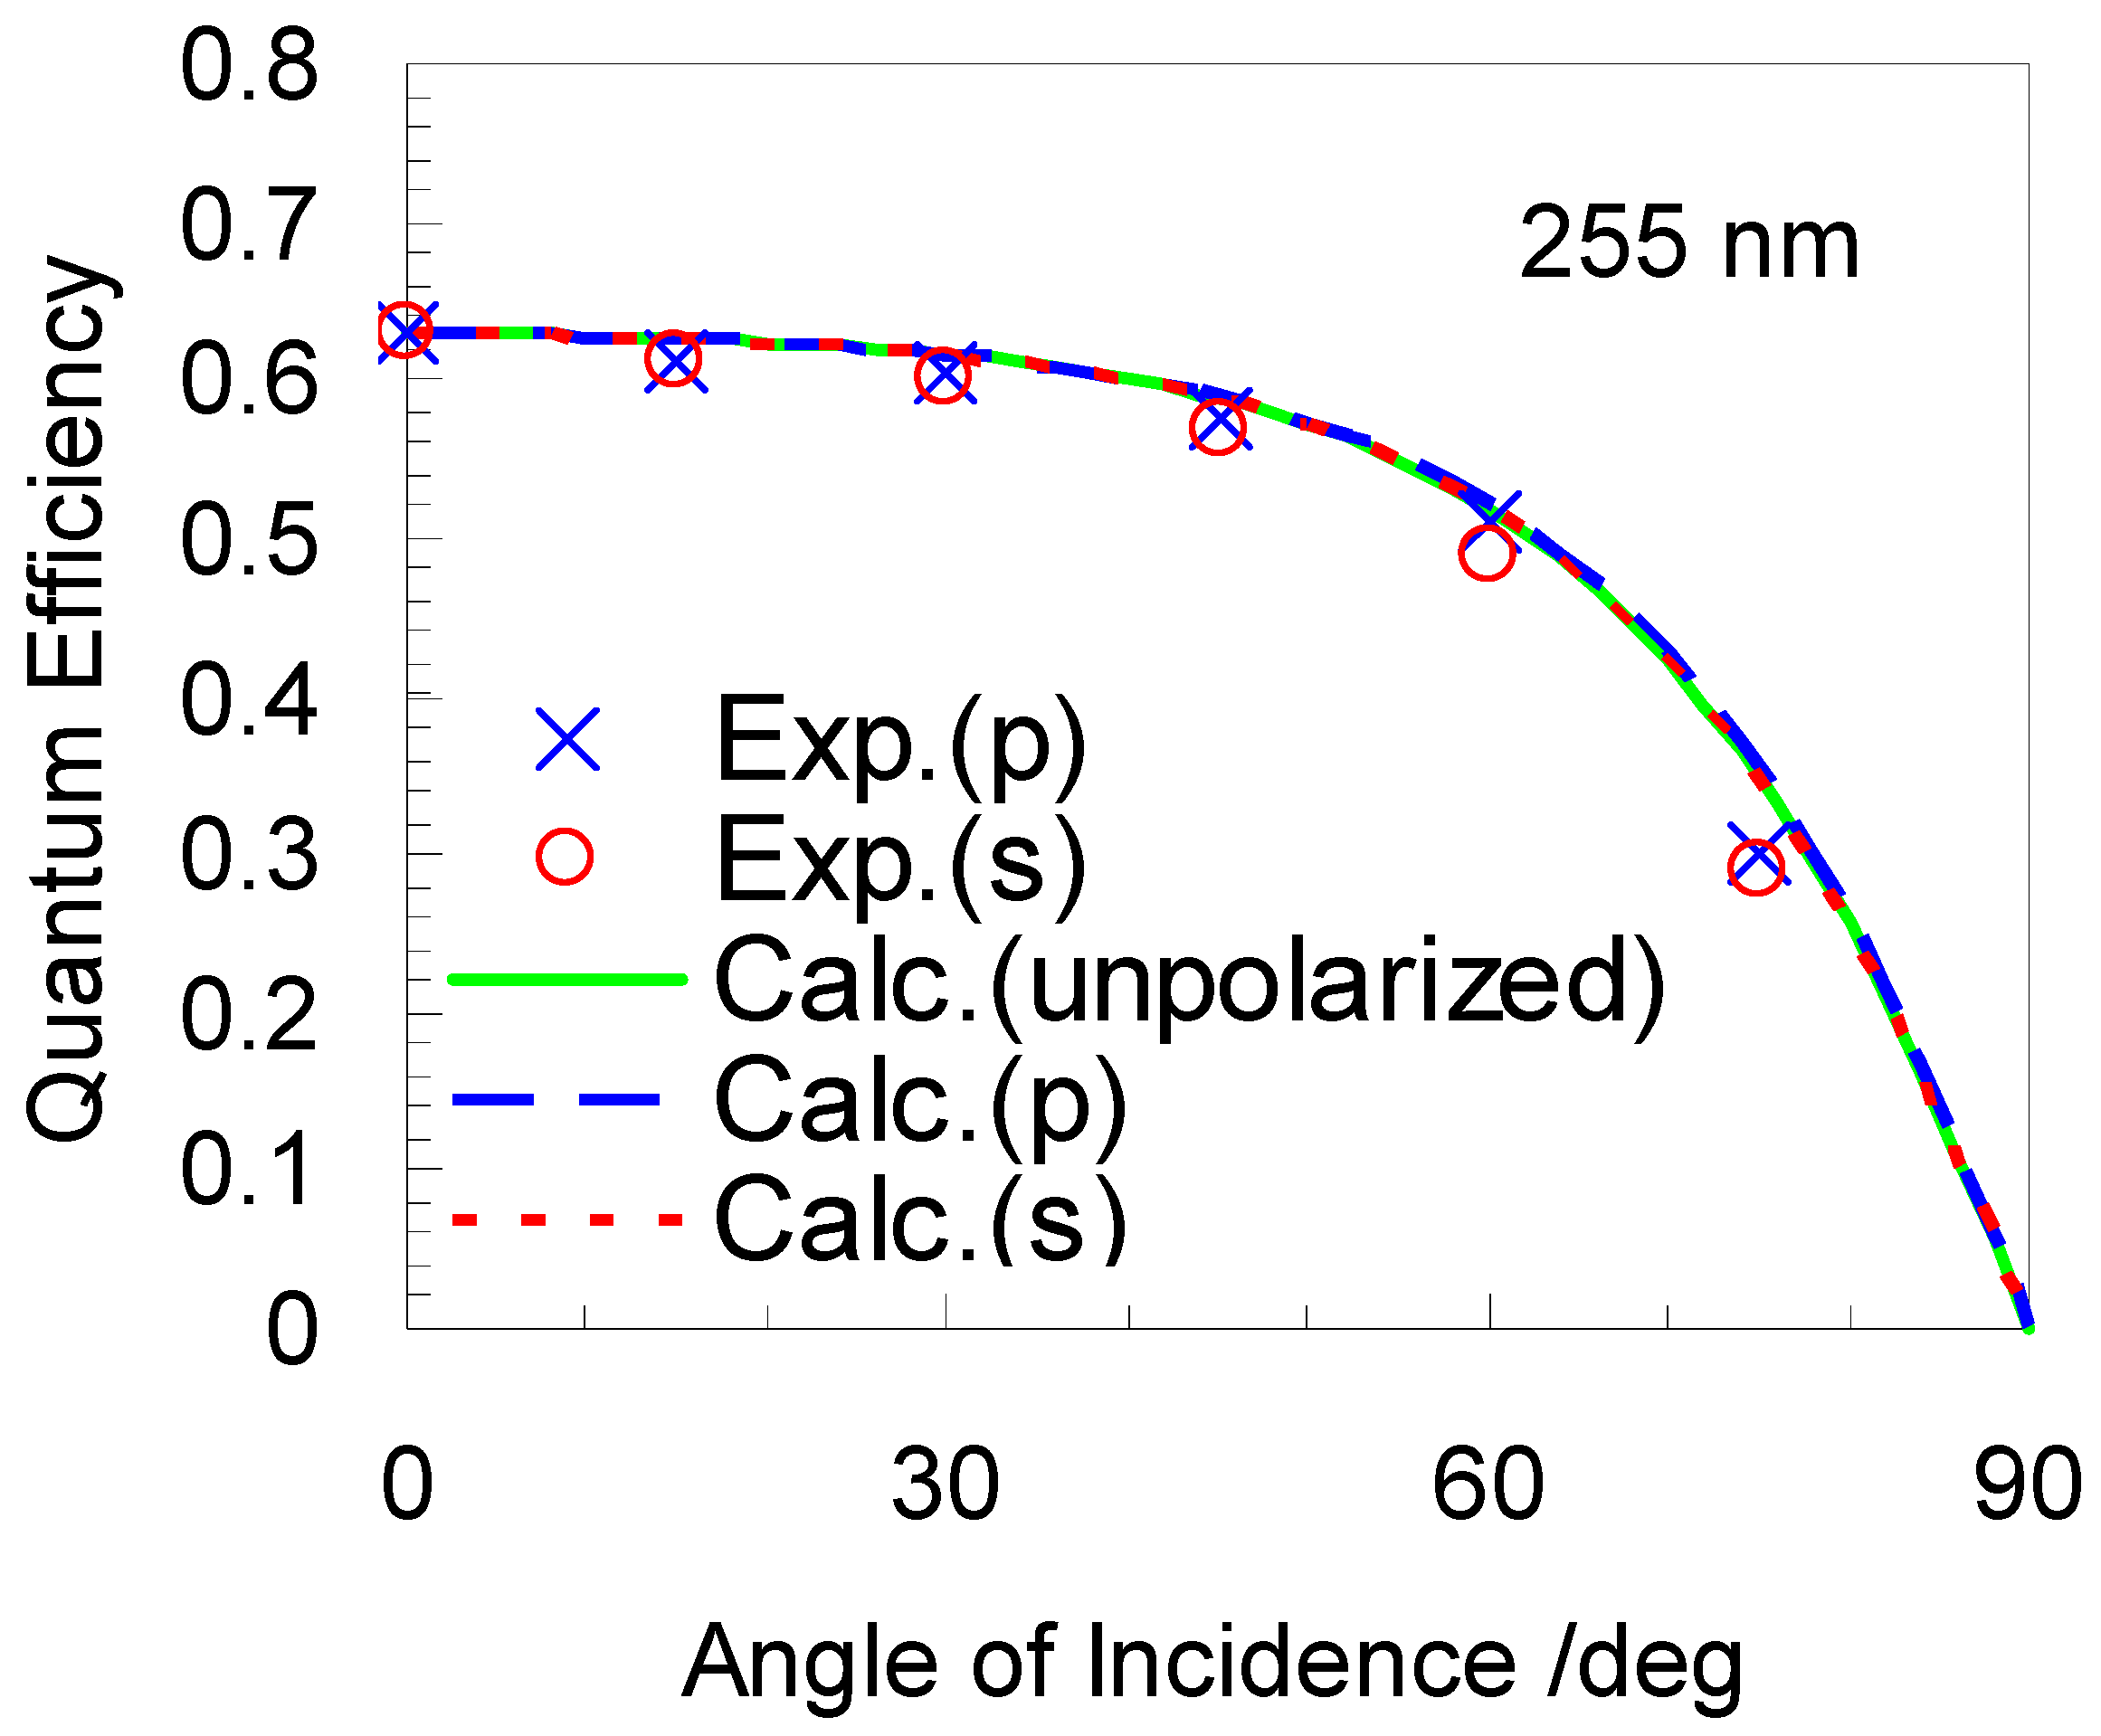
Figure 16 shows the results at the wavelength of 255 nm on the angular dependence of quantum efficiency for the same silicon photodiode for the underfill condition. Angular dependence of both for p- and s-polarization becomes almost identical. Such an unusual phenomenon never occurs for a single boundary system but can occur for such a layered structure under a special combination of film thickness, optical indices of a surface layer and a substrate. The phenomenon is theoretically confirmed by the result with the film thickness of 30 nm in Figure 10d. Since no cancelation occurs between the responses for p- and s-polarization, it leads to large decrease from the ideal cosine response for overfill condition.
Figure 16.
Measured and calculated quantum efficiency at the wavelength of 255 nm of a Si photodiode with a 30 nm thick SiO2 layer for p- (in blue), s- (in red) polarized and unpolarized radiation (in green) [12].
6. Conclusions
A major obstacle in increasing quantum efficiency of semiconductor photodiodes is optical losses. Optical losses refer to reflectance loss from the surface, absorption in a dead layer in front of the sensitive volume including carrier recombination phenomena, and transmission through the sensitive volume.
For such an optical system consisting of a thin film on an absorbing substrate (double boundary system), rigorous formulation using Fresnel equations with complex optical constants of the composing materials is given to simulate photodiodes. The theoretical model agreed absolutely and spectrally with the experimental results under any angle of incidence by taking account of polarization aspects. The excellent agreements support the validity of the theoretical model.
Based on the theoretical model, calculation results on the amplitude coefficients for reflection and transmission as well as corresponding power reflectance and transmittance are given. For a single boundary system, results as a function of the angle of incidence are shown with a matrix combination of n and k of a substrate to grasp their general dependency. For a double boundary system, actual data sets for the system of SiO2 on Si at some representative wavelengths are used as typical examples of the combination of complex refractive indices. For a multilayer system, it is shown that the system can be treated as an expansion of the double boundary system using recurrence formula.
Concrete examples of the traces of amplitude reflection coefficient or amplitude transmission coefficient on the complex plane are shown as a function of various parameters such as the overlayer thickness, the angle of incidence and spectral properties represented by the optical indices of both the surface layer and the substrate. The results show that the optical properties of the layered system are sensitive to its layer thickness, the angle of incidence and the wavelength in the ultraviolet region where optical indices of both the surface layer and the substrate steeply change. As notable differences in optical properties of the layered system from those of a single boundary system, it is shown that reflectance for p-polarization can exceed one for s-polarization and moreover, reflectances for both p- and s-polarization can be almost identical at any angle of incidence at certain conditions.
The results for a silicon photodiode to achieve maximum normal transmittance (giving external quantum efficiency by Equation (3)), and maximum polarization sensitivity defined as Tp/Ts at 60° incident angle, are summarized in the following Table 1.
Table 1.
Conditions for maximum normal transmittance, T0, and maximum polarization sensitivity, Tp/Ts at 60° incident angle, for a silicon photodiode at the representative wavelengths.
Representation of amplitude coefficients for reflection and transmission on the complex plane is advantageous, compared to the traditional representation for power reflectance and transmittance, to obtain the insight on how the result changes as a function of various parameters. It has been proven that the graphical technique on the complex plane is effective and powerful for optical design of photodiodes to search for optimal conditions of complex optical constant, film thickness and/or angle of incidence.
Supplementary Materials
The following supporting information can be downloaded at: https://www.mdpi.com/article/10.3390/qubs10020009/s1, Figure S1: Calculated results for the system of SiO2 on Si at the wavelength of 400 nm with the angles of incidence of 0° and 60° as a function of SiO2 film thickness from 0 nm to 550 nm. CACs of (a): reflection (s-component: solid curve with dots, p-component: dotted curve with dots), and (b): transmission (s-component: solid curve with crosses, p-component: dotted curve with crosses) at the angles of incidence of 0° and 60° as a function of SiO2 film thickness from 0 nm to 300 nm. The film thickness is shown every 100 nm. (c,d,e): Power reflectance, transmittance and absorptance of the SiO2 film.; Figure S2: Calculated results for the system of SiO2 on Si at the wavelength of 254 nm with the SiO2 film thickness of 0 nm to 100 nm in 20 nm step as a function of the AOI from 0° to 90°. (a): ARCs (s-component: solid curve with dots, p-component: dotted curve with dots), and (b): Products of square root of c and ATCs (s-component: solid curve with crosses, p-component: dotted curve with crosses) at the angles of incidence of 0° and 60° as a function of. The film thickness is shown every 100 nm. (c,d,e): Power reflectance, transmittance and absorptance of the SiO2 film.
Funding
This research received no external funding.
Institutional Review Board Statement
Not applicable.
Informed Consent Statement
Not applicable.
Data Availability Statement
Dataset available on request from the author.
Acknowledgments
The author would like to express sincere gratitude to late Yamamoto for fruitful discussion on graphical representation of complex amplitudes for reflection.
Conflicts of Interest
The authors declare no conflicts of interest.
Abbreviations
The following abbreviations are used in this manuscript:
| ARC | Amplitude Reflection Coefficient |
| ATC | Amplitude Transmission Coefficient |
| CAC | Complex Amplitude Coefficient |
| AOI | Angle Of Incidence |
| VUV | Vacuum Ultraviolet |
References
- Hamamatsu Photonics KK Editorial Committee. Photomultiplier Tube—Basics and Applications. Available online: https://www.hamamatsu.com/content/dam/hamamatsu-photonics/sites/documents/99_SALES_LIBRARY/etd/PMT_handbook_v4E.pdf (accessed on 27 January 2025).
- Jablonski, A. Escape Depth of Photoelectrons. Surf. Interface Anal. 1994, 21, 758–763. [Google Scholar] [CrossRef] [Scilit]
- Korde, R.; Prince, C.; Cunningham, D.; Vest, R.E.; Gullikson, E. Present Status of Radiometric Quality Silicon Photodiodes. Metrologia 2003, 40, S145–S149. [Google Scholar] [CrossRef] [Scilit]
- Korde, R.; Seely, J.; Gullikson, E. Solar Blind UV Photodiodes with 100% Internal Quantum Efficiency Based on Silicon Direct Band Gap. In CubeSats, SmallSats, and Hosted Payloads for Remote Sensing VIII; SPIE: Bellingham, WA, USA, 2024; Volume 13146, pp. 77–84. [Google Scholar]
- Westfold, K.C. The Polarization of Synchrotron Radiation. Astrophys. J. 1959, 130, 241–258. [Google Scholar] [CrossRef] [Scilit]
- Barth, J.; Johnson, R.L.; Logothetidis, S.; Cardona, M.; Fuchs, D.; Bradshaw, A.M. Spectroscopic Ellipsometry with Synchrotron Radiation: Latest Developments. In Soft X-Ray Optics and Technology; SPIE: Bellingham, WA, USA, 1986; Volume 733, pp. 265–271. [Google Scholar]
- Koide, T.; Shidara, T.; Yuri, M.; Kandaka, N.; Fukutani, H.; Yamaguchi, K. Elliptical-Polarization Measurements in the Vacuum Ultraviolet and Soft x-Ray Regions with a Reflection Polarimeter. Rev. Sci. Instrum. 1992, 63, 1458–1461. [Google Scholar] [CrossRef] [Scilit]
- Saito, T.; Yuri, M.; Onuki, H. Application of Oblique Incidence Detector to Vacuum Ultraviolet Polarization Analyzer. Rev. Sci. Instrum. 1995, 66, 1570–1572. [Google Scholar] [CrossRef] [Scilit]
- Saito, T.; Yuri, M.; Onuki, H. Polarization Characteristics of Semiconductor Photodiodes. Metrologia 1995, 32, 485–489. [Google Scholar] [CrossRef] [Scilit]
- Saito, T.; Hughey, L.R.; Proctor, J.E.; O’brian, T.R. Polarization Characteristics of Silicon Photodiodes and Their Dependence on Oxide Thickness. Rev. Sci. Instrum. 1996, 67, 3362–3364. [Google Scholar] [CrossRef] [Scilit]
- Saito, T.; Ozaki, K.; Fukui, K.; Iwai, H.; Yamamoto, K.; Miyake, H.; Hiramatsu, K. Vacuum Ultraviolet Ellipsometer Using Inclined Detector as Analyzer to Measure Stokes Parameters and Optical Constants—With Results for AlN Optical Constants. Thin Solid Films 2014, 571, 517–521. [Google Scholar] [CrossRef] [Scilit]
- Saito, T. Spectral Properties of Semiconductor Photodiodes. In Advances in Photodiodes; InTech: London, UK, 2011. [Google Scholar] [CrossRef] [Scilit]
- Alig, R.C.; Bloom, S.; Struck, C.W. Scattering by Ionization and Phonon Emission in Semiconductors. Phys. Rev. B 1980, 22, 5565–5582. [Google Scholar] [CrossRef] [Scilit]
- Zalewski, E.F.; Geist, J. Silicon Photodiode Absolute Spectral Response Self-Calibration. Appl. Opt. 1980, 19, 1214–1216. [Google Scholar] [CrossRef] [Scilit] [PubMed]
- Wilkinson, F.J.; Farmer, A.J.D.; Geist, J. The near Ultraviolet Quantum Yield of Silicon. J. Appl. Phys. 1983, 54, 1172–1174. [Google Scholar] [CrossRef] [Scilit]
- Ryan, R.D. Bandgap Dependence of the Average Energy Required for Electron-Hole Pair Creation in GaAs and in Si. Nucl. Instrum. Methods 1974, 120, 201. [Google Scholar] [CrossRef] [Scilit]
- Yoon, H.W.; Eppeldauer, G.P.; Jarrett, D.G.; Larason, T.C.; Kim, W.-S. Calibrations of Current-to-Voltage Transimpedance Amplifiers Using Electrical Standards. In CPEM 2010; IEEE: Piscataway, NJ, USA, 2010; pp. 753–754. [Google Scholar]
- Saito, T. Difference in the Photocurrent of Semiconductor Photodiodes Depending on the Polarity of Current Measurement through a Contribution from the Photoemission Current. Metrologia 2003, 40, S159–S162. [Google Scholar] [CrossRef] [Scilit]
- Vest, R.E.; Canfield, L.R. Photoemission from Silicon Photodiodes and Induced Changes in the Detection Efficiency in the Far Ultraviolet. In AIP Conference Proceedings; American Institute of Physics: College Park, MD, USA, 1997; Volume 417, pp. 234–240. [Google Scholar]
- Yamamoto, M.; Namioka, T. Layer-by-Layer Design Method for Soft-x-Ray Multilayers. Appl. Opt. 1992, 31, 1622–1630. [Google Scholar] [CrossRef] [Scilit] [PubMed]
- Berning, P.H. Theory and Calculations of Optical Thin Films. In Physics of Thin Films; Academic Press: New York, NY, USA, 1963; Volume 1, pp. 69–121. [Google Scholar]
- Polyanskiy, M. Refractive Index Database. Available online: https://refractiveindex.info (accessed on 10 January 2025).
- Franta, D.; Nečas, D.; Ohlídal, I.; Giglia, A. Optical Characterization of SiO2 Thin Films Using Universal Dispersion Model over Wide Spectral Range. In Proceedings of SPIE; SPIE: Bellingham, WA, USA, 2016; Volume 9890, p. 989014. [Google Scholar] [CrossRef] [Scilit]
- Saito, T.; Shitomi, H.; Saito, I. Angular Dependence of Photodetector Responsivity. In Proceedings of the CIE Expert Symposium on Spectral and Imaging Methods for Photometry and Radiometry; CIE Central Bureau: Vienna, Austria, 2010; pp. 141–146. [Google Scholar]
- Canfield, L.R.; Kerner, J.; Korde, R. Stability and Quantum Efficiency Performance of Silicon Photodiode Detectors in the Far Ultraviolet. Appl. Opt. 1989, 28, 3940–3943. [Google Scholar] [CrossRef] [Scilit] [PubMed]

Disclaimer/Publisher’s Note: The statements, opinions and data contained in all publications are solely those of the individual author(s) and contributor(s) and not of MDPI and/or the editor(s). MDPI and/or the editor(s) disclaim responsibility for any injury to people or property resulting from any ideas, methods, instructions or products referred to in the content. |
© 2026 by the author. Licensee MDPI, Basel, Switzerland. This article is an open access article distributed under the terms and conditions of the Creative Commons Attribution (CC BY) license.