


Abstract
Railway track geometry degradation is a key determinant of infrastructure safety, ride comfort, maintenance demand, and lifecycle cost. This paper presents a measurement-based assessment of track geometry degradation on the analyzed section of railway line M300 in Romania, with emphasis on its practical use for maintenance prioritization. The study uses in situ track-geometry inspection records collected by a track-measuring vehicle (VMC) between 2020 and 2023 on a curved double-track sector, and evaluates the main geometric defect families used in railway practice, including alignment, gauge, longitudinal level, cross-level, and twist. In addition to conventional defect identification, severity grading, and penalty-point scoring, the paper uses a maintenance-oriented interpretation framework based on the campaign-level Defect Severity Index (DSI), the Defect Recurrence Factor (DRF), and the Maintenance Priority Matrix (MPM). In this framework, DSI corresponds to the normalized penalty score per kilometre and is used to compare inspection campaigns, while DRF and MPM extend the interpretation by identifying persistent defect families and translating measured degradation into maintenance priorities. The results show that degradation is non-uniform over time and defect-family-dependent, with cross-level and longitudinal-level defects dominating the cumulative penalty score. The DSI ranged from 467 points/km in September 2022 to 3183 points/km in March 2022, confirming a non-linear degradation and recovery pattern. The proposed indices provide an interpretable extension of the existing penalty-point framework and support condition-based maintenance planning on conventional railway lines.
1. Introduction
Railway infrastructure performance is strongly dependent on the ability of the track system to preserve its geometric quality under traffic loads, ballast degradation, substructure variability, environmental action, and maintenance disturbance. Repeated loading progressively modifies track geometry, increases dynamic wheel–rail interaction, reduces ride quality, and accelerates deterioration of superstructure and substructure components [1,2,3,4]. For this reason, the monitoring and interpretation of geometric parameters remain a core task in railway maintenance engineering.
Among the indicators used in conventional track assessment, longitudinal level, alignment, gauge, and cross-level are the most operationally relevant because they describe the actual running condition of the track and can be directly linked to safety thresholds, maintenance actions, and local infrastructure weaknesses [2,3,5,6]. Recent reviews confirm that railway administrations increasingly rely on track geometry data not only for reactive correction of isolated defects but also for condition assessment, maintenance planning, and degradation modelling [4,5,6,7,8,9].
The literature shows a clear transition from periodic inspection toward data-driven and predictive maintenance. Recent studies have reviewed machine-learning approaches for track geometry degradation, broader data-driven predictive maintenance strategies for rail systems, and the emerging convergence of monitoring, AI, and digital twins [8,9,10,11]. However, the implementation of such approaches still depends on the availability of reliable field measurements and on interpretable engineering workflows able to translate recorded irregularities into practical maintenance decisions.
Measurement technologies have evolved accordingly. In addition to manual inspection and localized devices, track-recording vehicles and in-service monitoring platforms can provide continuous high-resolution data on the geometric condition of the track [12,13,14,15,16]. Still, high-level predictive frameworks do not eliminate the need for transparent case-based analysis. Infrastructure managers continue to require physically interpretable results showing which defects dominate, how they are distributed, and how their severity affects maintenance priority.
Within this context, the present paper investigates a real case study from the Romanian railway network. The analysis focuses on a section on the railway line M 300 and uses VMC measurement records processed under the national defect-scoring logic. The novelty of the paper lies in converting a measurement-centred engineering study into a maintenance-oriented infrastructure manuscript. Rather than proposing a black-box predictive model, the paper develops a clear interpretation framework linking defect families, severity grades, and cumulative penalty scores to maintenance relevance. This responds to the practical gap between advanced degradation modelling and day-to-day decision-making in conventional railway maintenance [17,18,19,20].
To strengthen this maintenance-oriented interpretation without replacing the existing defect-scoring logic, this study reorganizes the penalty-point outputs into a transparent severity–recurrence–priority framework. The Defect Severity Index (DSI) is used as the campaign-level form of the normalized penalty score per kilometre, allowing for direct comparison between inspection campaigns. The Defect Recurrence Factor (DRF) identifies defect families that persist across successive inspection campaigns, while the Maintenance Priority Matrix (MPM) combines severity and recurrence in order to support practical intervention ranking. Therefore, the contribution of the framework lies in the integrated interpretation of severity, recurrence, and maintenance priority, rather than in redefining the existing penalty-point calculation.
The objectives of the paper are therefore as follows:
- •
- Characterize the measured geometric condition of the selected track section;
- •
- Identify the defect families with the greatest influence on the cumulative maintenance score;
- •
- Quantify campaign-level degradation severity using the normalized penalty score, expressed as DSI;
- •
- Evaluate the recurrence of the main defect families using the Defect Recurrence Factor; and show how point-based defect assessment can support maintenance prioritization through the Maintenance Priority Matrix.
These objectives are operationalized by using the normalized penalty score as a campaign-level severity indicator and by adding recurrence and priority-based interpretation through DRF, WDPS, and MPM, while preserving the original penalty-point logic used in railway maintenance practice.
2. Materials and Methods
2.1. Study Area
The analyzed case study concerns a sector on the railway line M300, between km 473+000 and km 476+000. The selected section belongs to a conventional double-track railway and includes several horizontal curves, making it suitable for the study of geometry deterioration under constrained operating conditions. The sector is equipped with type 60 rails, timber and concrete sleepers, and mixed track geometry features over the two tracks. The curve radii reported in the source dataset range approximately between 240 m and 435 m, while cant values vary between 65 mm and 110 mm. The permitted maximum speed for the analyzed section is 50 km/h.
Because the investigated sector is a double-track section, the 3 km physical length corresponds to 6 track km for penalty-score normalization. The main characteristics of the study area are summarized in Table 1.
Table 1.
Main characteristics of the analyzed section.
2.2. Data Source and Monitoring Window
The paper is based on real VMC measurements covering the time frame 2020–2023. The underlying dataset consists of recorded band diagrams and processed defect tables extracted from the geometry inspection workflow. The analysis focuses on the recurring identification of defect families and their contribution to the cumulative technical condition of the section.
The monitored defect families follow the coding used in the Romanian inspection framework:
- •
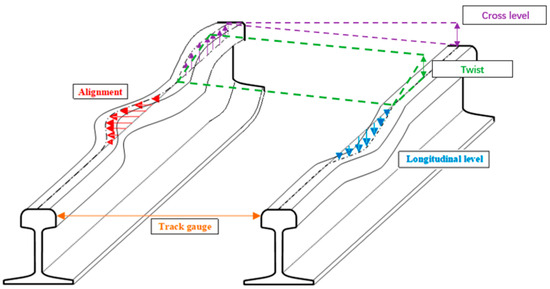
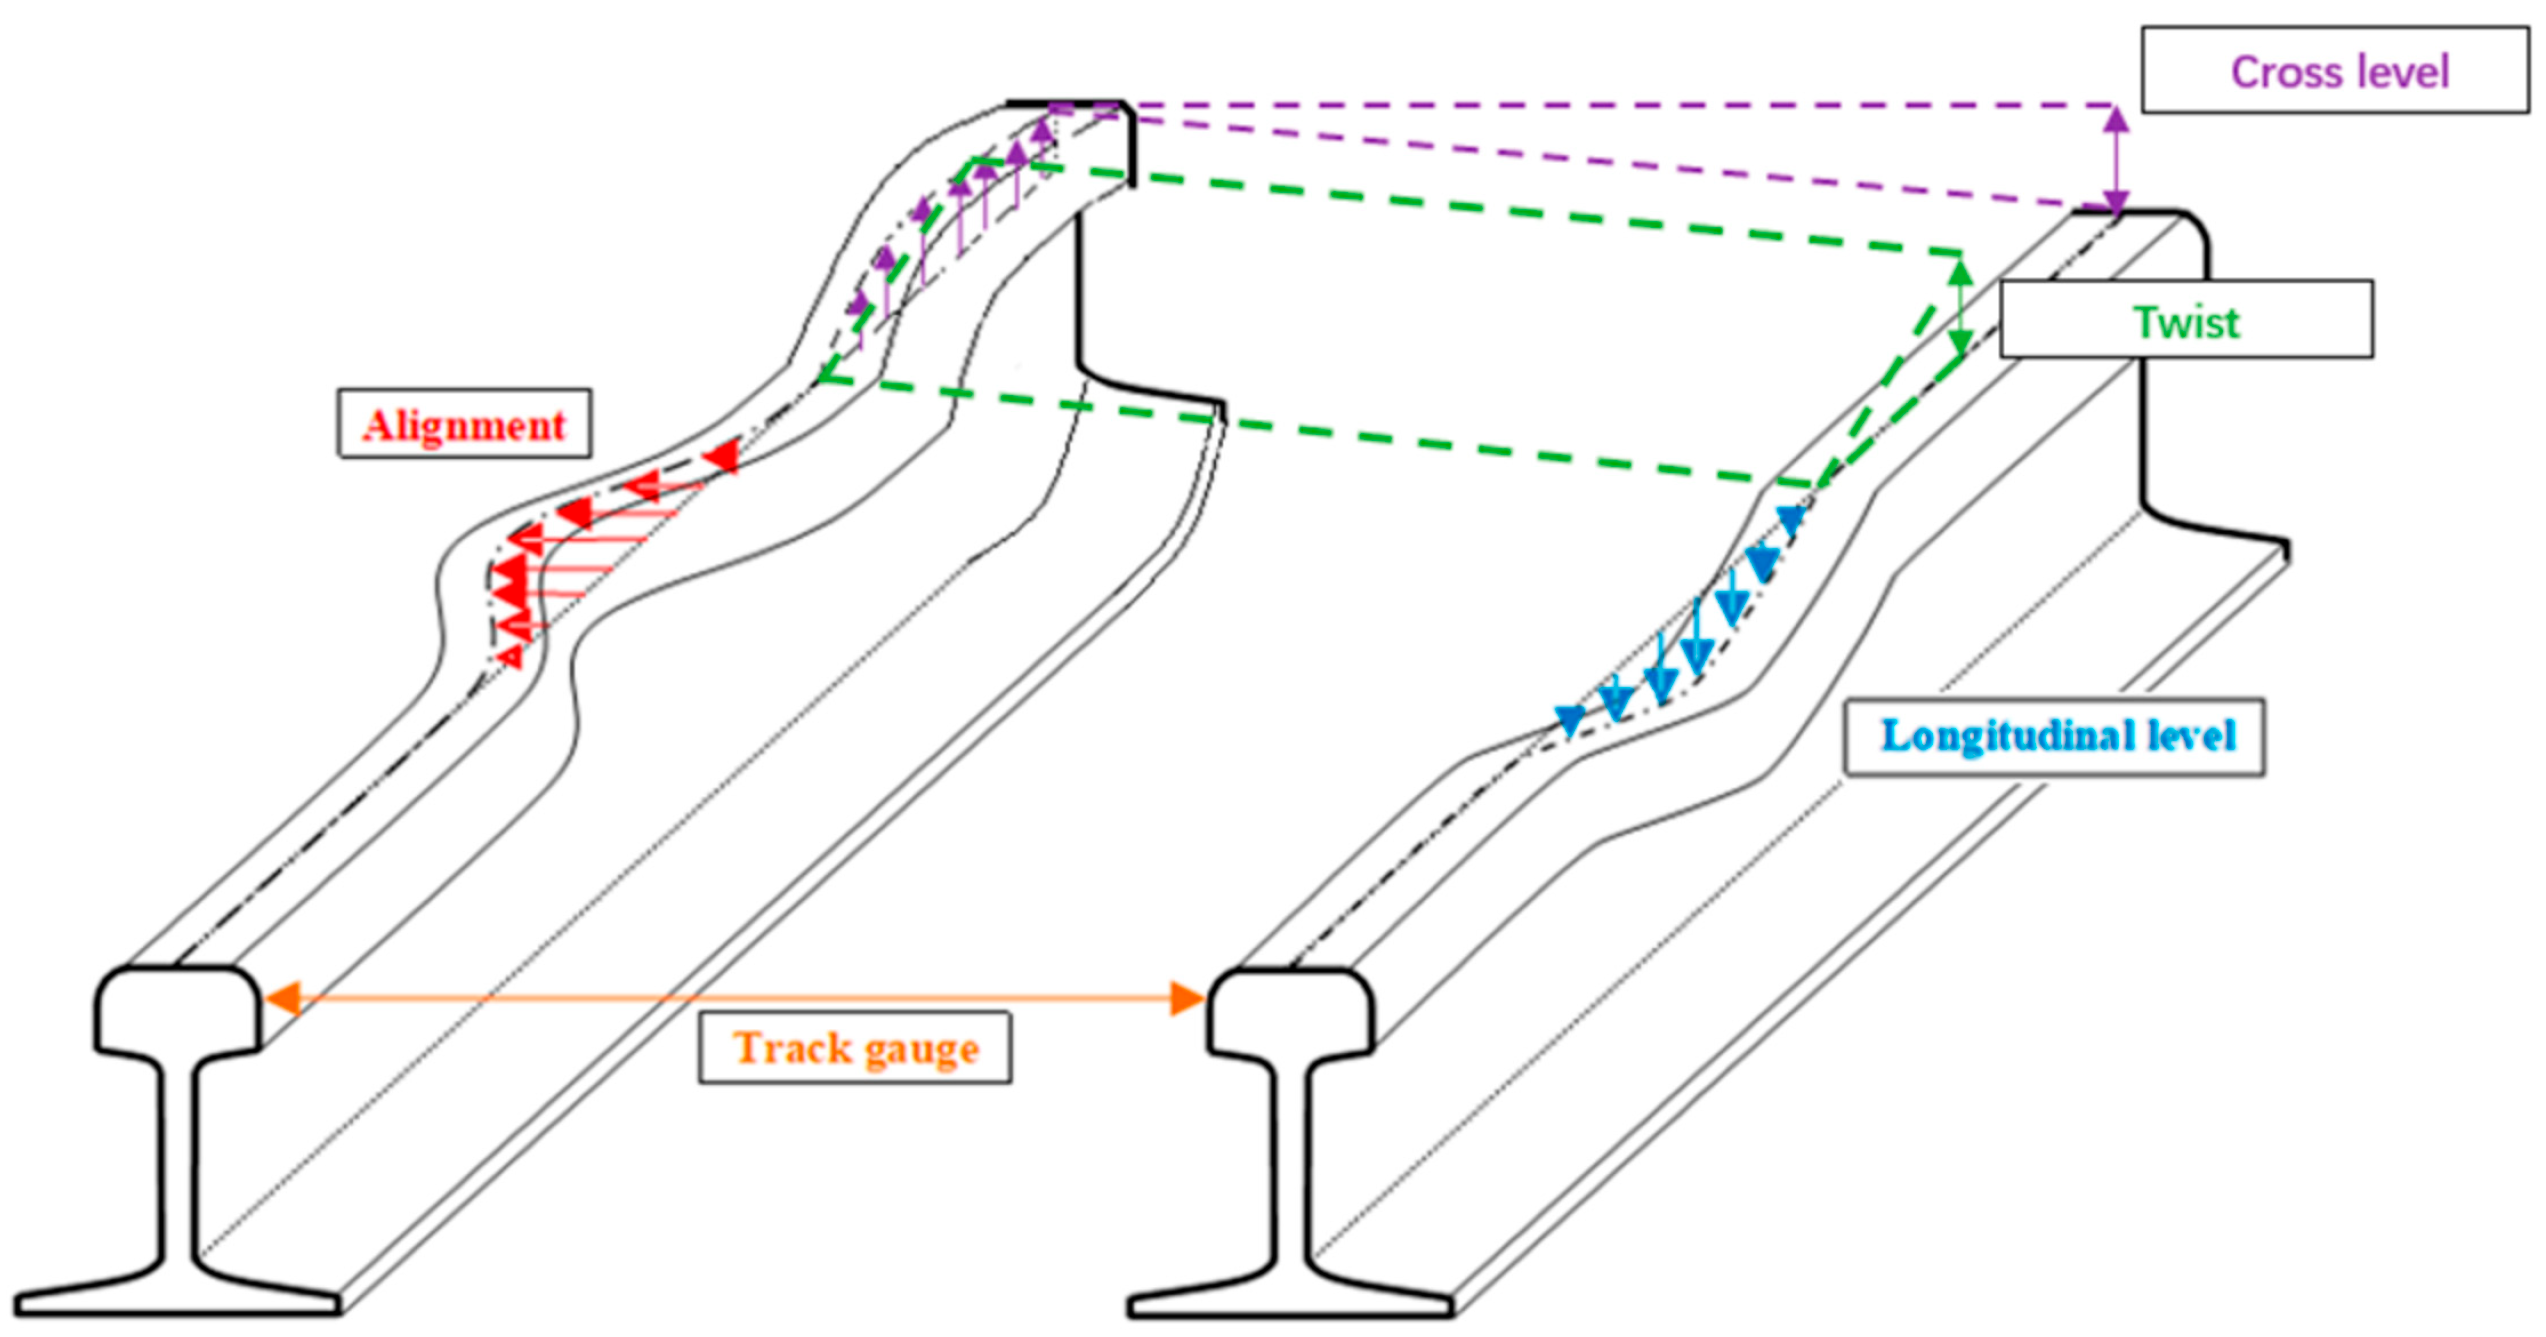
- C: direction/alignment defects;
- •
- L/L: gauge widening and narrowing;
- •
- A/J: longitudinal level defects;
- •
- N/V: cross-level defects;
- •
- R: twist/torsion defects.
Figure 1 presents the main track-geometry parameters used for defect identification.
Figure 1.
Schematic diagram of track geometry parameters [9].
2.3. Geometric Quality and Defect Assessment Framework
To ensure a transparent conversion of raw geometry measurements into maintenance-relevant indicators, the assessment framework used in this study links three interpretation levels: measured geometric parameters, defect severity grades, and cumulative penalty scores. The VMC records were first interpreted according to the main defect families used in Romanian railway practice, namely, alignment, gauge, longitudinal level, cross-level, and twist. Each identified defect was then assigned to a severity grade, and the corresponding penalty score was used to quantify its maintenance relevance.
This approach is useful because the penalty-point system is nonlinear: higher-grade defects receive a disproportionately larger score than lower-grade defects. Therefore, the final score does not only reflect the number of defects, but also their severity. For example, a limited number of grade 4 or grade 5 defects may have a stronger influence on the total score than a larger number of grade 3 defects. The cumulative score was calculated for each inspection campaign and then normalized by the analyzed length of the section in order to obtain a comparable score expressed in points per kilometre.
The total penalty score was calculated as
where is the cumulative penalty score, Ni is the number of defects belonging to grade or category i, and pi is the penalty score assigned to that defect grade. The normalized score was then obtained as
where Pkm is the score per kilometre and L is the total analyzed length of the monitored section. This normalization allows the results from different inspection campaigns to be compared directly and supports the interpretation of track condition from a maintenance-prioritization perspective.
To extend the existing assessment framework, three additional maintenance-oriented indicators were used. These indicators do not replace the penalty-point system; instead, they make the interpretation of severity, recurrence, and priority more explicit.
The Defect Severity Index (DSI) is used in this study as the campaign-level form of the normalized penalty score per kilometre. Therefore, the DSI is numerically equivalent to Pkm from Equation (2), but it is retained as an interpretation label to emphasize the comparison of inspection campaigns and the identification of degradation peaks over time. For the inspection campaign (c), DSI is expressed as
where Ptot,c is the cumulative penalty score recorded during inspection campaign (c), and L is the monitored track length. Physically, DSI represents the density of penalty points per kilometre for a given inspection campaign. Higher DSI values indicate a higher concentration and/or severity of recorded track-geometry defects.
Since DSI is equivalent to the normalized quality score per kilometre, its interpretation was aligned with the quality-score classes defined in Romanian Instruction 329 for track-measuring coaches. The following classes were used: 0–60 points/km = very good; 61–200 points/km = good 1; 201–500 points/km = good 2; 501–900 points/km = satisfactory; 901–1500 points/km = satisfactory 2; and values above 1500 points/km = unsatisfactory. These classes are used only for interpreting DSI/Pkm. The proposed DRF, WDPS, and MPM indicators are not defined in Instruction 329 and are therefore used as complementary prioritization tools rather than regulatory intervention thresholds.
The Defect Recurrence Factor (DRF) was defined as
where DRFj is the recurrence factor of defect family j, nj is the number of campaigns in which defect family j was recorded and Nc is the total number of inspection campaigns.
For ranking purposes, a family-level normalized severity score (FDSI) and a Weighted Defect Priority Score (WDPS) were also used:
In Equations (5) and (6), FDSIj denotes the family-level defect severity score of defect family (j), calculated as the cumulative penalty score of that family, Pj,cum, divided by the monitored track length (L). Thus, FDSIj expresses the penalty-point density of each defect family in points/km. The term DRFj is the recurrence factor of defect family (j), as defined in Equation (4), while WDPSj is the Weighted Defect Priority Score used for maintenance ranking. Therefore, WDPSj gives higher priority to defect families that combine high cumulative severity per kilometre with repeated occurrence across inspection campaigns.
The Maintenance Priority Matrix (MPM) combines the severity contribution of each defect family, expressed through WDPS, with its recurrence, expressed through DRF. It is used as a qualitative ranking tool to translate the numerical indicators into four maintenance categories: priority intervention, corrective intervention, monitoring and targeted correction, and routine monitoring.
The penalty values used in the scoring procedure are summarized in Table 2. These values are applied to each individual recorded defect after it has been classified by the VMC-processing workflow into a defect family and severity grade. Therefore, the penalties in Table 2 are not total aggregated scores; they are severity-grade weights assigned to individual irregularities. The cumulative campaign score is then obtained by summing the penalty contributions of all recorded defects across all defect families.
Table 2.
Penalty scores assigned to each individual recorded defect according to severity grade in the Romanian track-geometry assessment framework.
In the present study, the same penalty value was used for a given severity grade regardless of the defect family. For example, a grade 4 alignment, gauge, longitudinal-level, cross-level, or twist defect contributes 1000 points to the cumulative score. The geometric limits and control wavelengths used to classify the raw VMC signal into severity grades are defined in the national inspection framework and were already embedded in the processed defect tables available for this study. Because the raw geometry signals and threshold-exceedance information were not available, the present paper does not redefine or recalibrate these geometric limits; it uses the pre-classified defect records as input for maintenance-oriented scoring.
2.4. Analysis Workflow
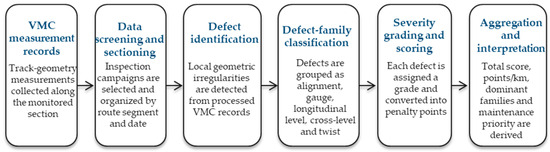
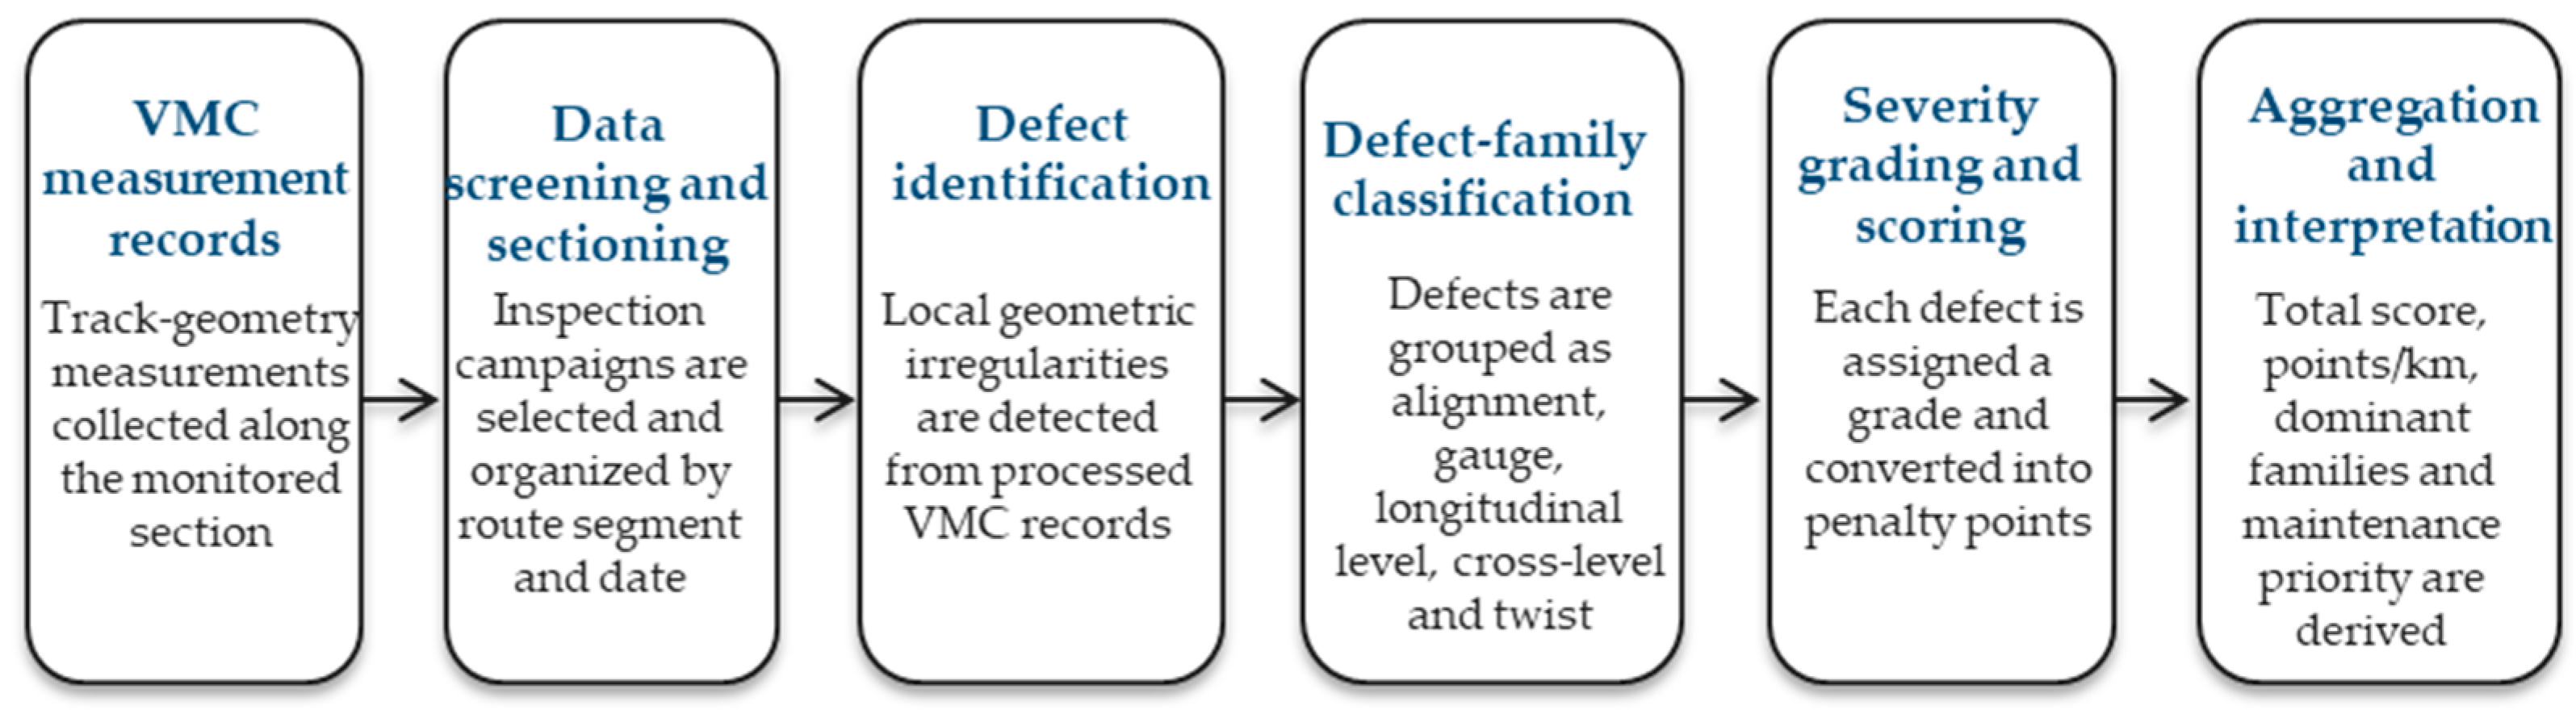
The workflow adopted in the paper is as follows:
- Organize measurement results by inspection measurements;
- Identify defect families and severity grades;
- Calculate cumulative penalty points and normalize them as Pkm, subsequently interpreted as the campaign-level Defect Severity Index;
- Analyze the relative contribution of each defect family to the total score;
- Calculate the Defect Recurrence Factor for the main defect families;
- Calculate the Weighted Defect Priority Score for family-level ranking;
- Classify defect families using the Maintenance Priority Matrix; and
- Interpret the resulting quality class and maintenance priority from an infrastructure -maintenance perspective.
This extended procedure is consistent with the wider railway literature, where track geometry is increasingly used as a practical decision variable for maintenance planning, degradation monitoring, and risk-oriented intervention selection [5,9,17,18,19,20].
Figure 2 illustrates the workflow used to transform VMC inspection records into penalty scores, normalized severity indicators, recurrence factors, and maintenance-priority classes.
Figure 2.
Workflow used to convert VMC measurements into maintenance-oriented penalty scores.
2.5. Uncertainty and Sensitivity Considerations
The assessment is based on processed VMC inspection records and defect tables. Therefore, the analysis does not propagate measurement uncertainty from the raw geometry signal to the final defect grade. Nevertheless, the interpretation of the proposed indicators considered the main sources of uncertainty that may affect track-geometry scoring, including measurement equipment, inspection speed, signal filtering, localization accuracy, threshold settings, and the classification of defects located close to severity limits.
From a scoring perspective, DSI is expected to be more sensitive to uncertainty in high-severity defects because the penalty system is nonlinear and grade 4, grade 5, and grade 6 defects have a disproportionate influence on the cumulative score. By contrast, DRF is less sensitive to penalty magnitude because it depends mainly on the recurrence of defect families across inspection campaigns. The MPM may be affected by both severity and recurrence, but its qualitative interpretation is expected to remain more stable when the same defect families repeatedly dominate the score over several campaigns.
3. Results
To make the link with the research objectives explicit, the results are interpreted at three complementary levels. First, the campaign-level DSI is used to evaluate the severity of the measured track-geometry condition over time. Second, the cumulative penalty contribution of each defect family is used to identify the most critical defect families. Third, the DRF, WDPS, and Maintenance Priority Matrix are used to distinguish persistent defects from isolated high-score events and to translate the measured degradation into maintenance priorities. The chronological inspection results are therefore used as input data for answering three maintenance questions: which defects are most critical, which defects are most persistent, and which defects should be prioritized for intervention?
3.1. General Character of the Measured Degradation
The section exhibits a degradation pattern that is non-uniform over time and defect-family dependent, rather than characterized by a single dominant defect type or by steady monotonic deterioration. This is an important practical result because it indicates that maintenance decisions should not be based solely on average section quality; instead, they should consider the relative weight of each defect family, the normalized penalty-point density, and the recurrence of dominant defect families across inspection campaigns. Such behaviour is fully consistent with previous field-based studies showing that track geometry degradation is cumulative yet spatially selective [18,19,20,21,22,23,24,25,26,27,28,29,30,31,32,33,34].
3.2. Campaign-Level Severity Assessment: September 2020 Baseline
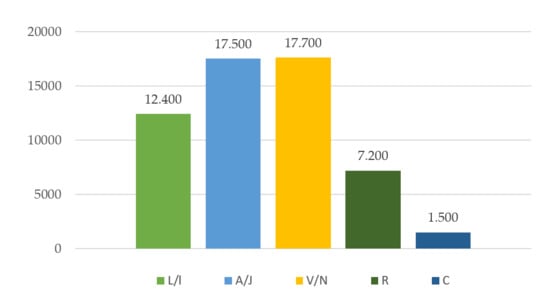
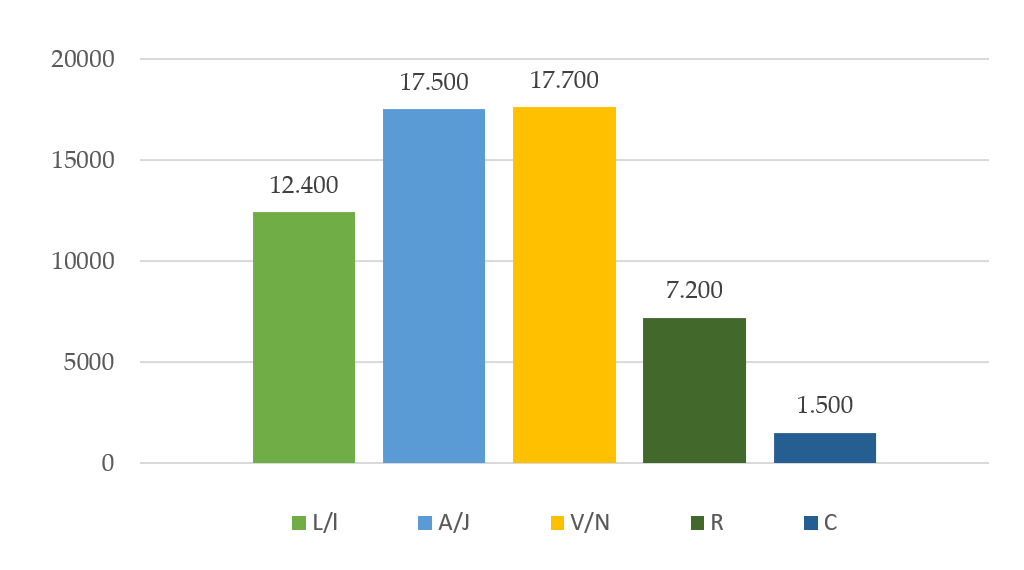
To provide a clearer maintenance-oriented interpretation of the September 2020 inspection, the total penalty points were grouped by defect type over the entire monitored section. This representation highlights not only the cumulative condition of the track, but also the relative importance of each defect family in the final score. Together, these categories accounted for the majority of the total penalty score, indicating that the poor condition of the section was mainly associated with vertical and transverse geometry instability rather than with gauge-related defects. The diagram therefore indicates that the maintenance priority for this inspection should be directed toward correcting level-related and cross-level-related irregularities along the analyzed route. Possible support-related causes should be investigated through complementary field information, such as ballast condition, drainage performance, sleeper condition, and maintenance records.
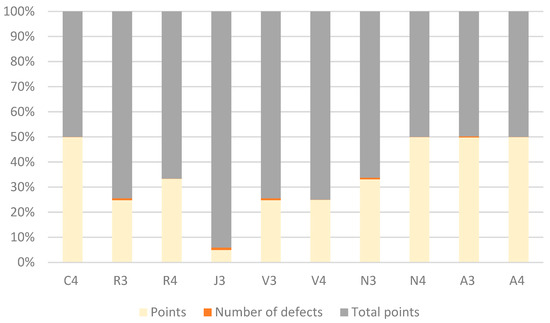
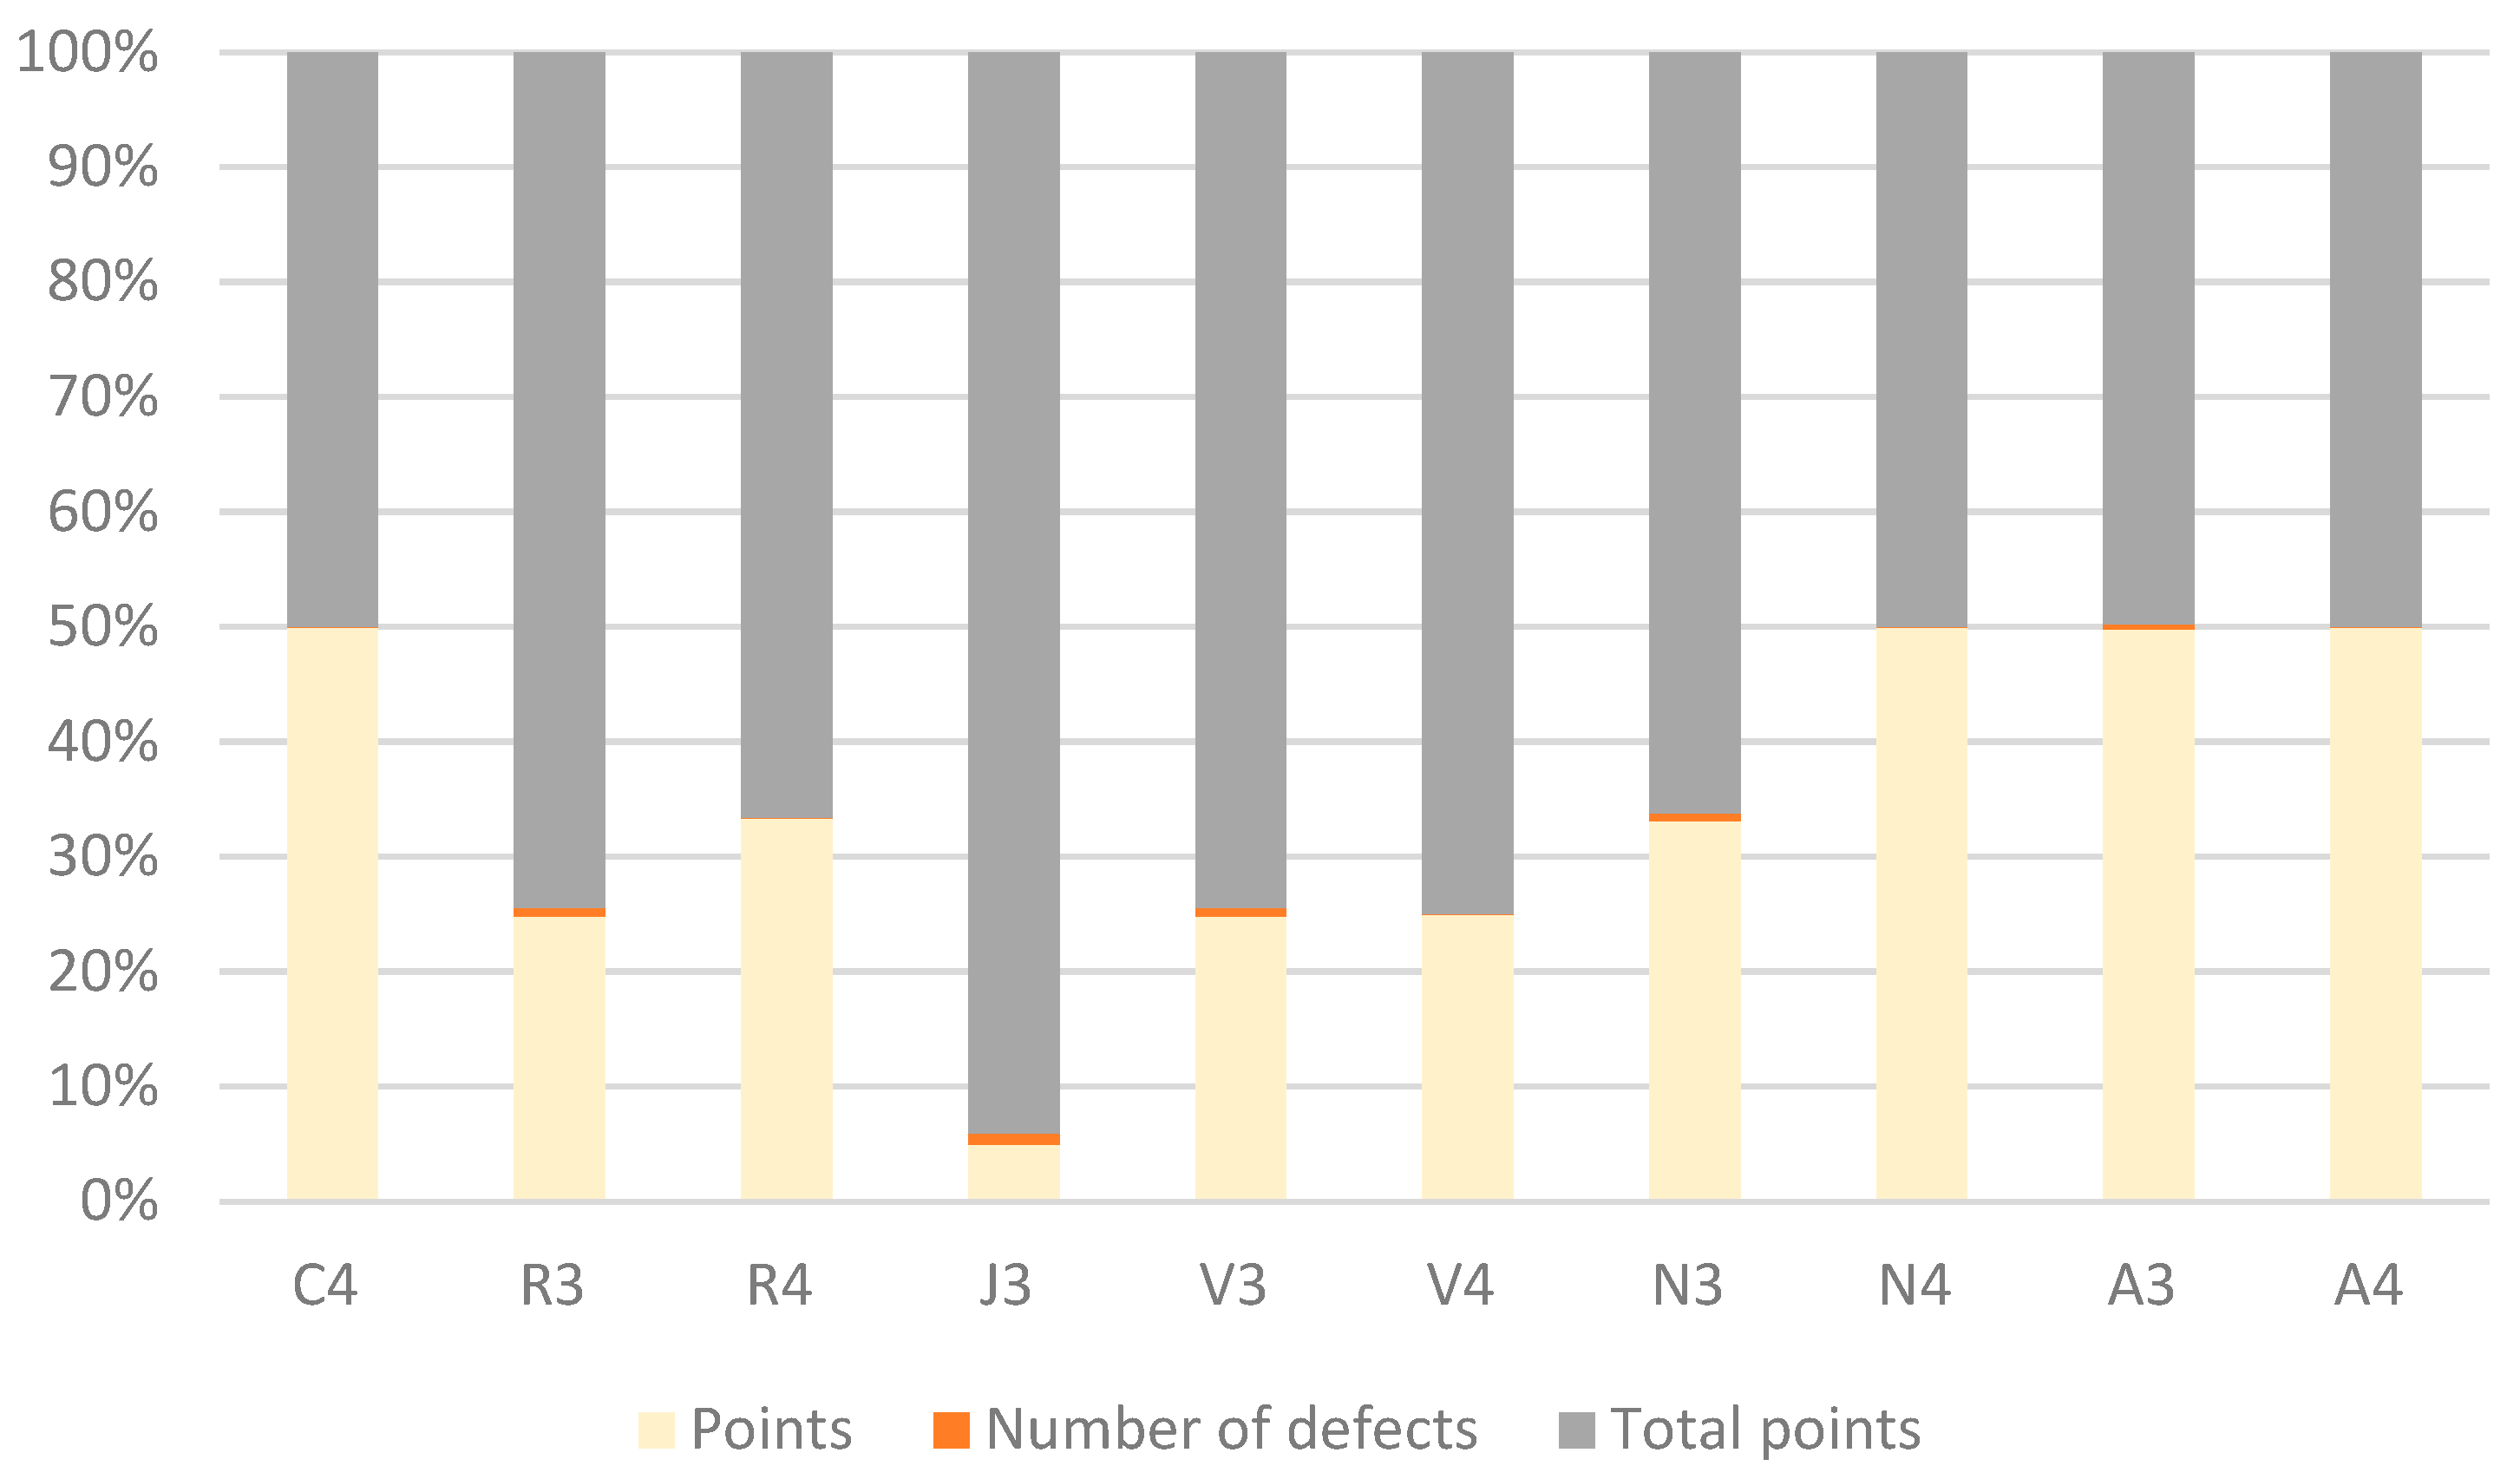
Table 3 provides a detailed numerical basis for the September 2020 penalty-score calculation, while Figure 3 presents the same inspection campaign in graphical form to highlight the dominant defect categories.
Table 3.
Defect counts and penalty-point totals for September 2020.
Figure 3.
Defect counts and penalty-point totals for September 2020.
In Figure 3 the x-axis labels combine the defect family and severity grade: C = direction/alignment defect; R = twist/torsion defect; J = longitudinal-level defect; V and N = cross-level defects; and A = longitudinal-level defect. The number following each letter indicates the severity grade assigned in the inspection framework; for example, C3 denotes a grade 3 direction/alignment defect, while V4 denotes a grade 4 cross-level defect.
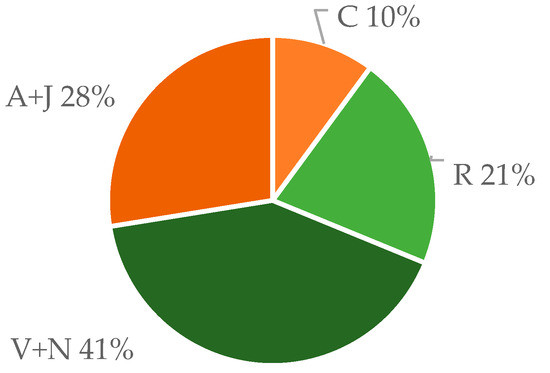
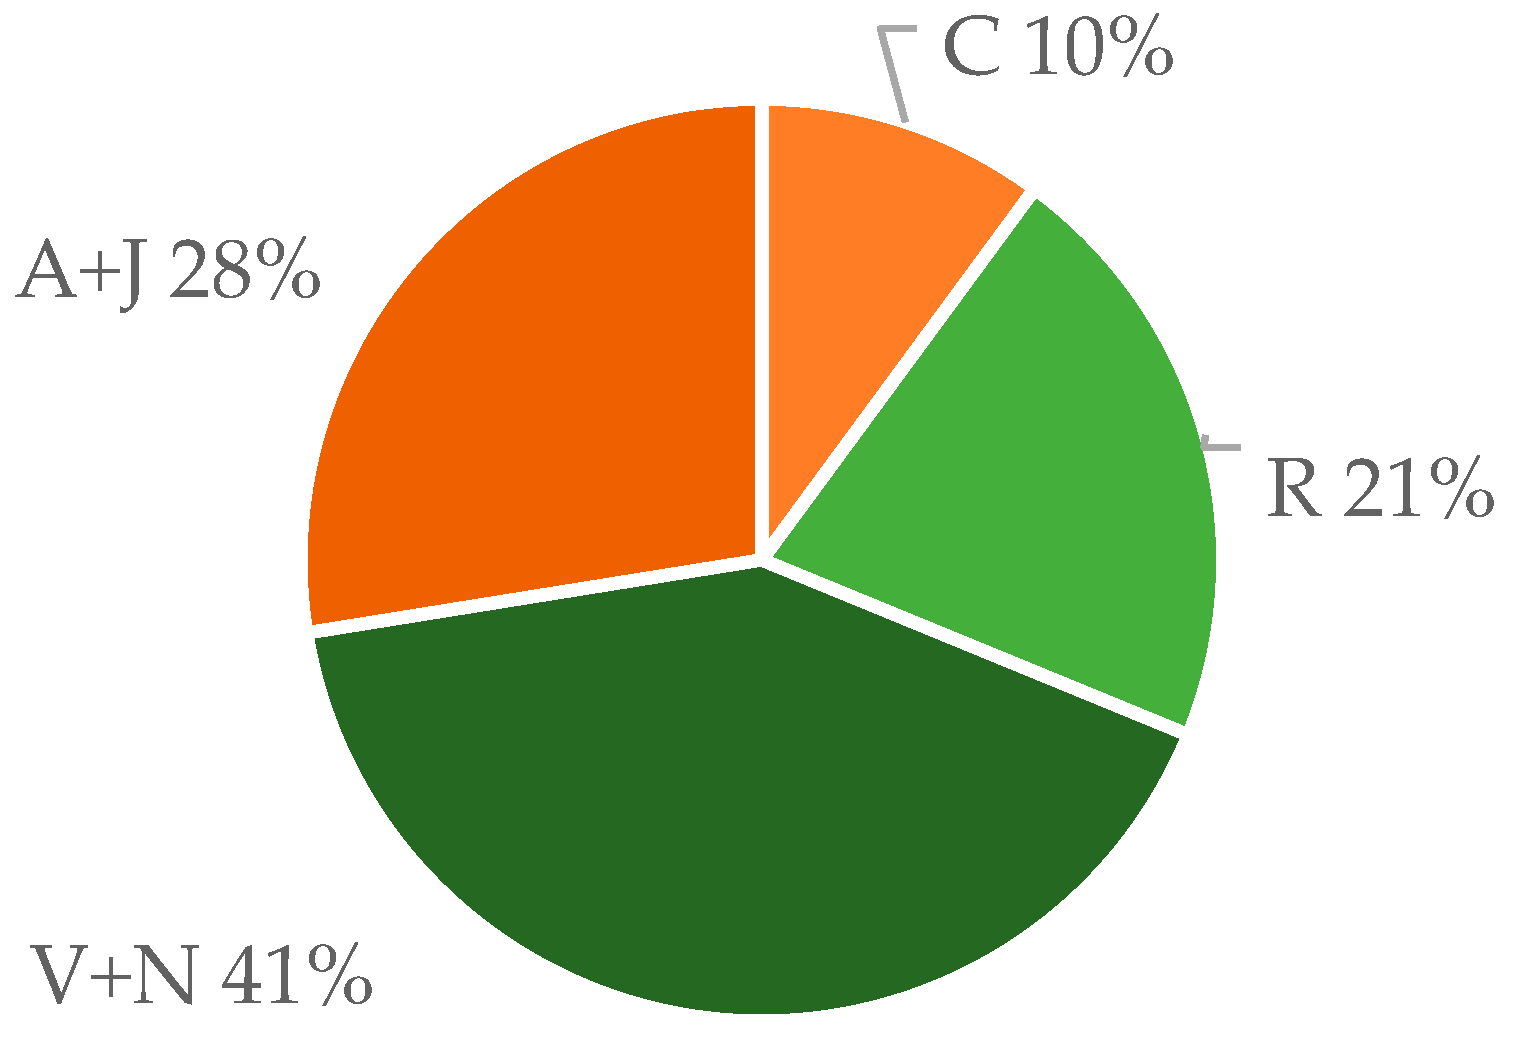
The first clearly documented measurements in the analyzed series are for September 2020, as shown in Figure 4. The processed defect table indicates a total of 10,900 penalty points for the analyzed two-track section, which corresponds to 1816 points/km over the total 6 km monitored length. Because the investigated sector is a double-track section, the 3 km physical length between km 473+000 and km 476+000 corresponds to 6 track km used for penalty-score normalization. According to the source assessment, this leads to an unsatisfactory quality class.
Figure 4.
Relative contribution of defect families to the September 2020 score.
The severity distribution for this inspection campaign was dominated by grade 3 defects (83%), followed by grade 4 defects (13%) and grade 5 defects (4%), with grade 6 defects practically absent in the visible distribution. This indicates that the section’s poor rating was not driven by a large number of extreme defects alone, but by the accumulation of moderate and high-penalty irregularities.
The contribution of defect families to the total score is particularly informative. The score composition shows the following:
- •
- Cross-level defects (V+N) contributed approximately 41% of the total score;
- •
- Longitudinal level defects (A+J) contributed approximately 28%;
- •
- Twist defects (R) contributed approximately 21%;
- •
- Direction defects (C) contributed approximately 10%;
- •
- Gauge defects (L+l) were marginal in the visible score composition.
This result is highly significant for maintenance interpretation, because it shows that the section’s poor condition was primarily a level-related problem, with cross-level and longitudinal level together generating roughly two-thirds of the total penalty score.
3.3. April 2021 Inspection Campaign
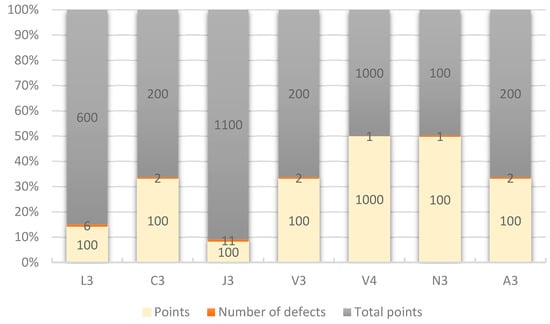
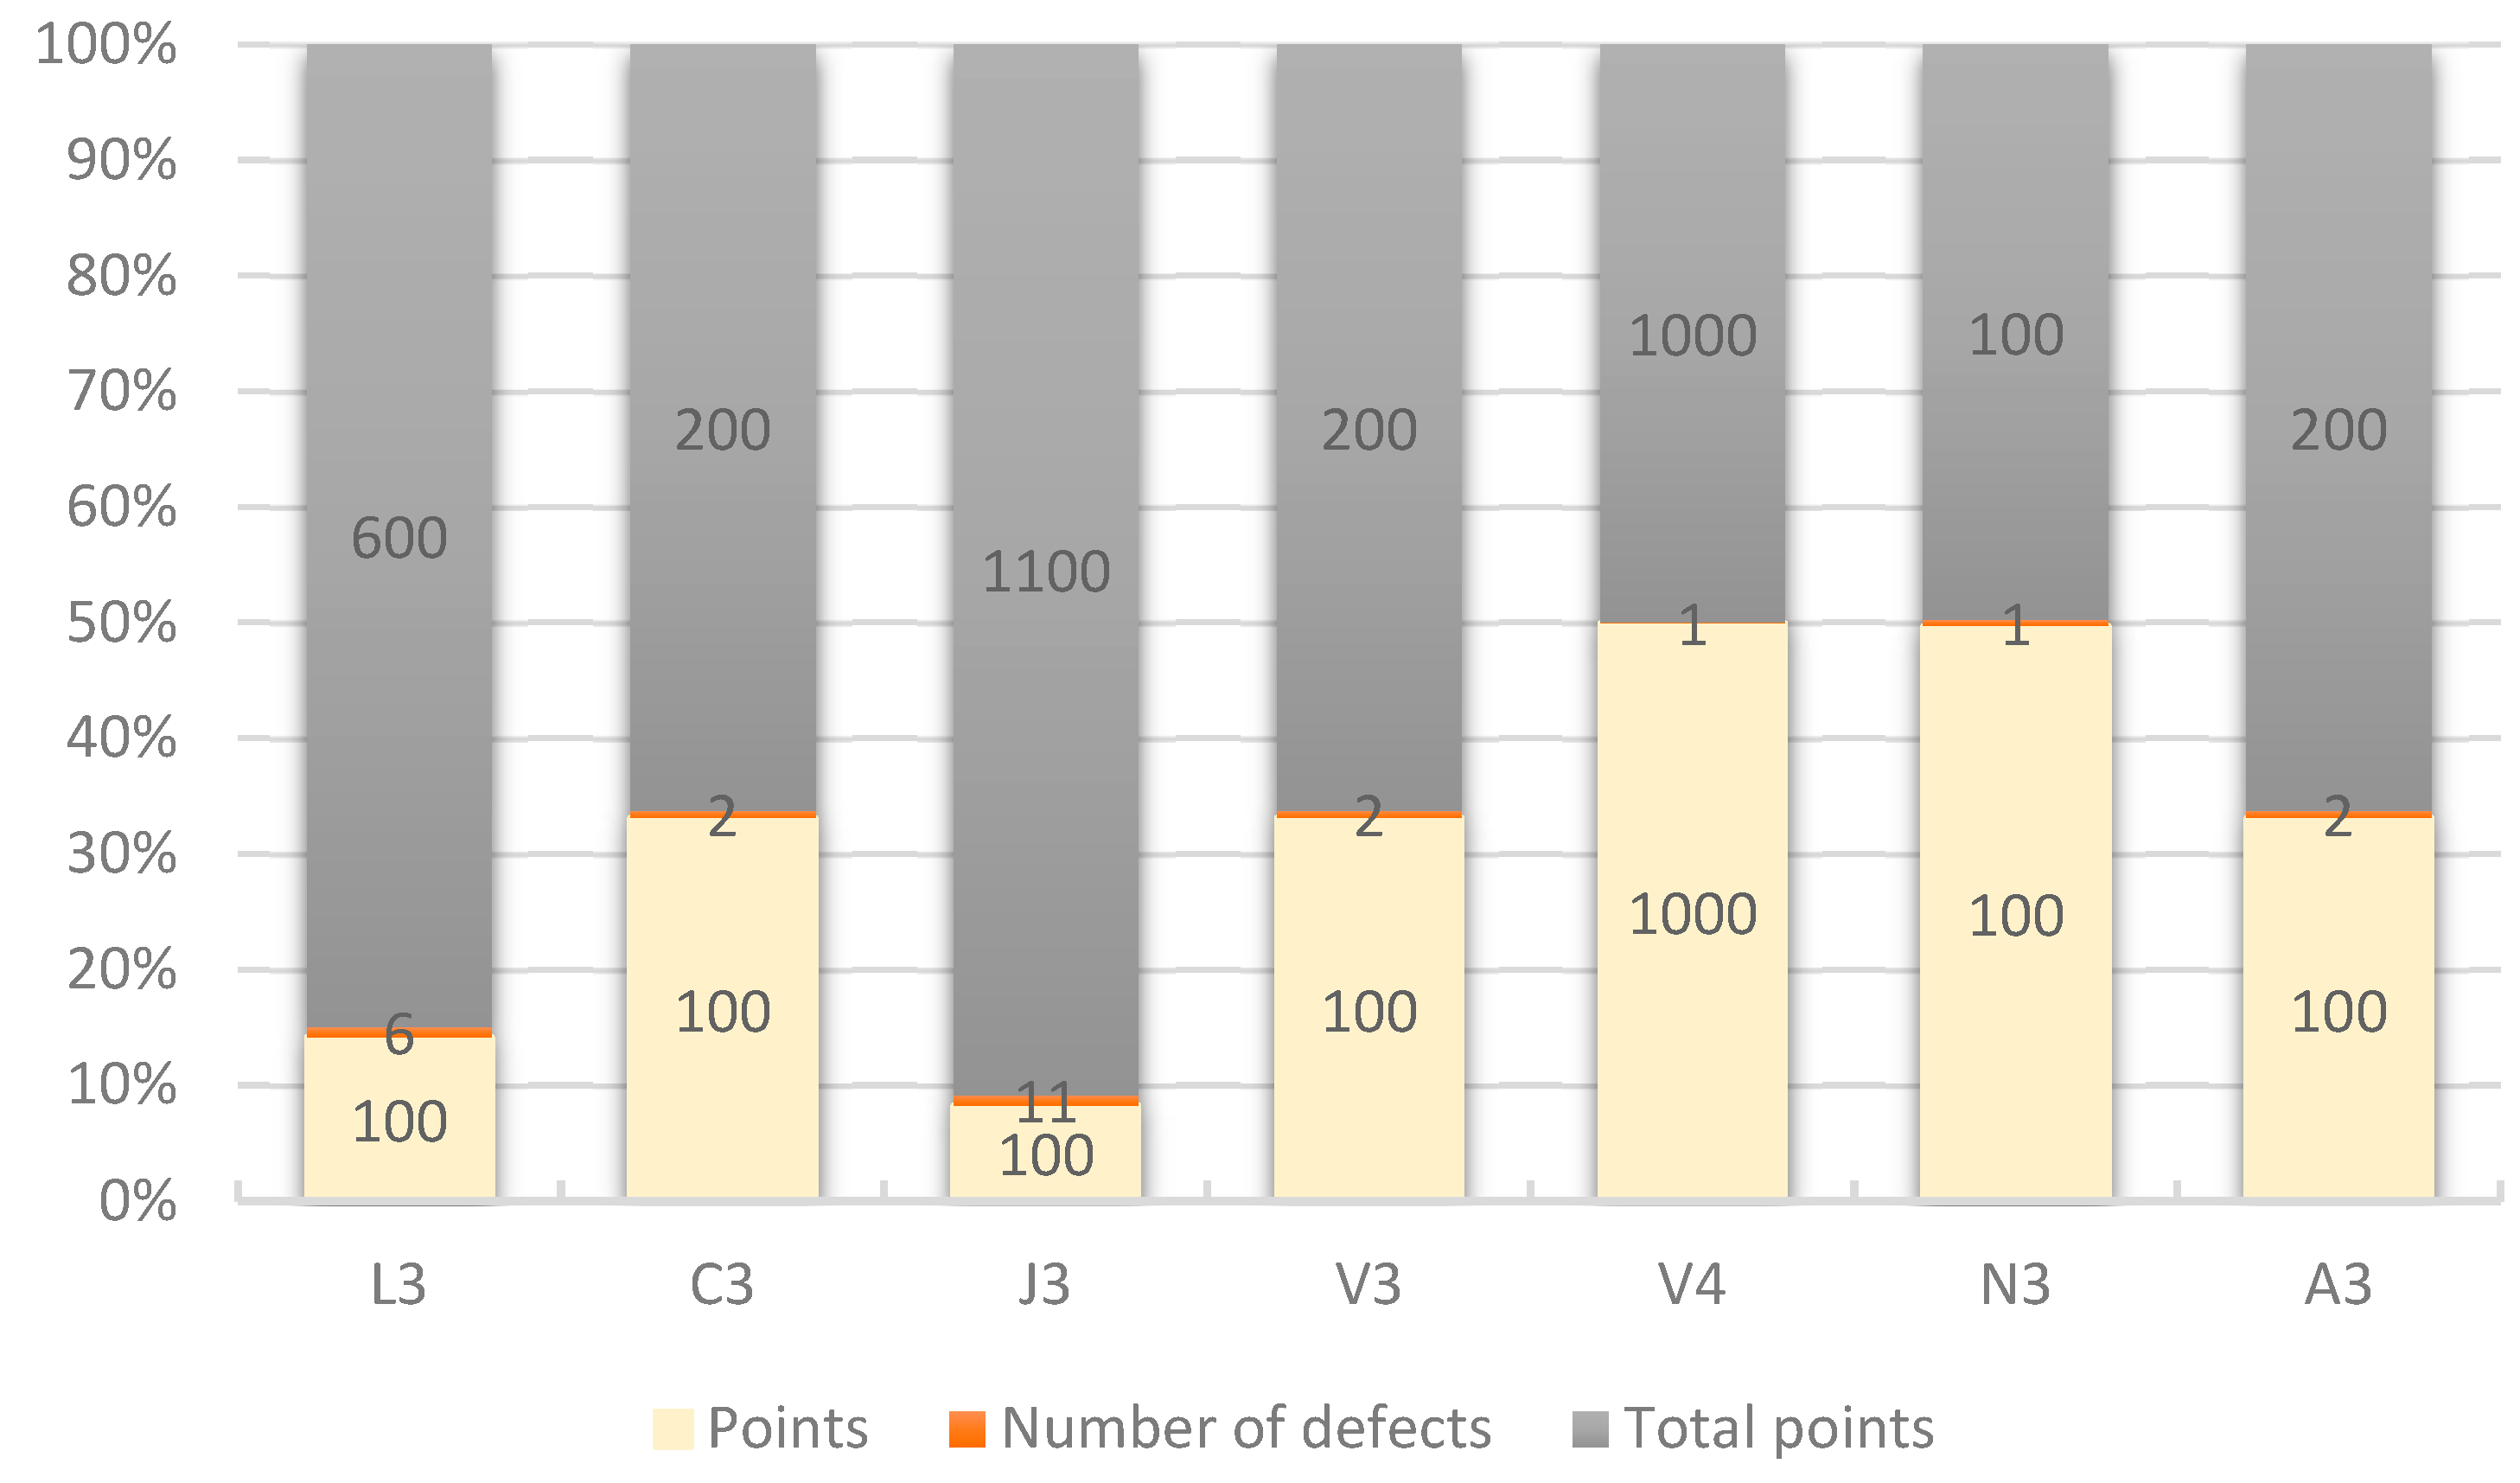
The April 2021 inspection campaign presents a markedly different picture. The total penalty score recorded for the section was 3400 points, which corresponds to approximately 567 points/km over the same 6 km analyzed length, as shown in Figure 5. Compared with September 2020, this represents a substantial reduction in the cumulative score.
Figure 5.
Defect counts and penalty-point totals for April 2021.
The 2021 defect Table 4 shows a much simpler defect portfolio:
Six occurrences of L3, 2 of C3, 11 of J3, 2 of V3, 1 of V4, 1 of N3, and 2 of A3. No grade 5 defects were recorded in this inspection campaign, and only one grade 4 defect remained. From a maintenance perspective, this indicates a substantial improvement in the measured track-geometry condition between the two inspection campaigns. However, the exact timing and type of maintenance interventions carried out during this interval were not available in the dataset. Therefore, the reduction in the cumulative penalty score should be interpreted as an observed improvement in geometry condition, rather than as direct evidence of the effect of a specific intervention such as tamping.
Table 4.
Defect counts and penalty-point totals for April 2021.
Two observations are especially relevant:
- Longitudinal level defects remained persistent, with J3 continuing to dominate the counts;
- The overall severity profile became much less critical, indicating a reduction in higher-penalty irregularities.
This comparison between the 2020 and 2021 inspection campaigns supports the argument that penalty-point analysis is useful not only for diagnosing poor condition, but also for detecting measurable recovery or deterioration trends between campaigns. A quantitative evaluation of maintenance effectiveness would require detailed intervention records, including the type, date, and location of the works performed.
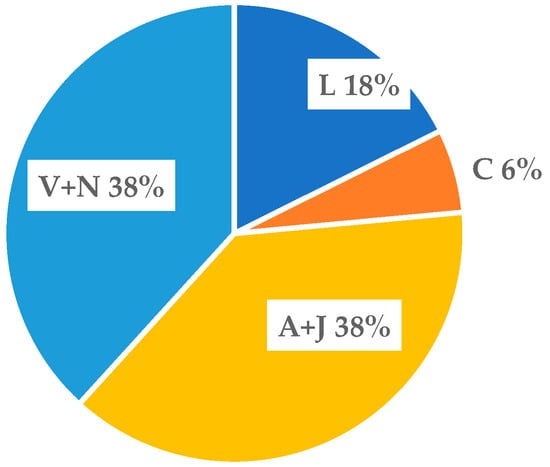
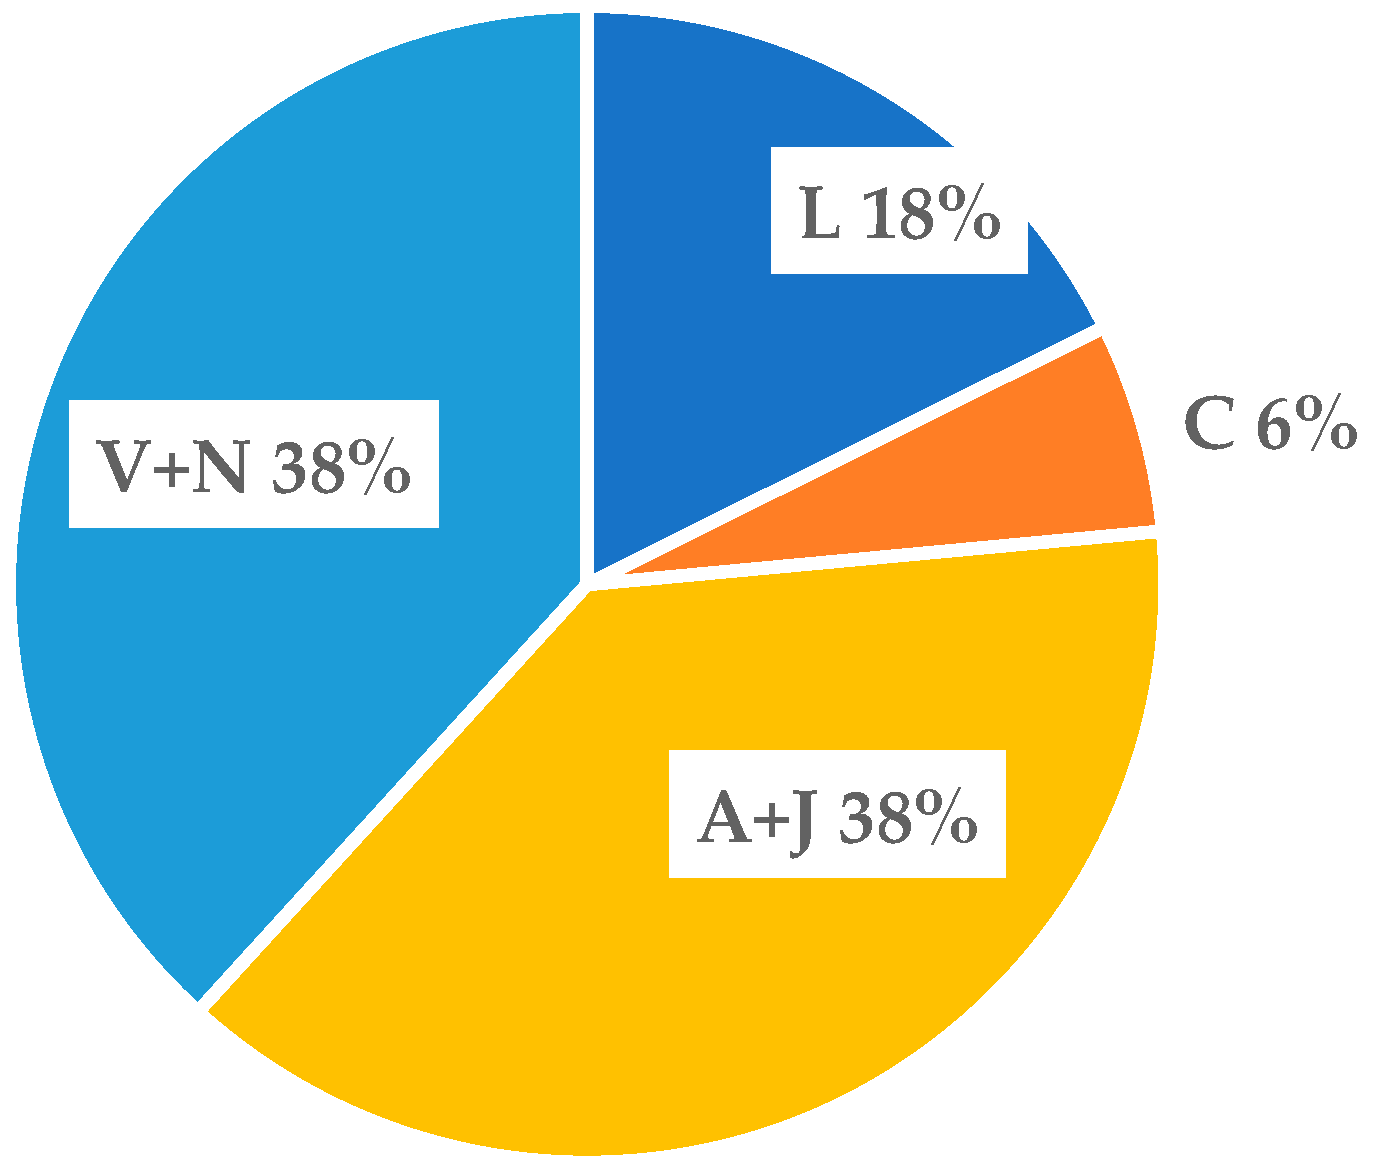
Figure 6 illustrates the relative contribution of defect families to the April 2021 score, showing that longitudinal-level and cross-level defects remained the main contributors, although the overall severity was substantially lower than in September 2020.
Figure 6.
Relative contribution of defect families to the April 2021 score.
3.4. Multi-Campaign Severity Evolution, 2021–2023
The same analytical framework was applied to the 2022 and 2023 measurements, as shown in Table 5, Table 6, Table 7, Table 8 and Table 9.
Table 5.
Defect counts and penalty-point totals for September 2021.
Table 6.
Defect counts and penalty-point totals for March 2022.
Table 7.
Defect counts and penalty-point totals for September 2022.
Table 8.
Defect counts and penalty-point totals for March 2023.
Table 9.
Defect counts and penalty-point totals for September 2023.
The results in Table 5, Table 6, Table 7, Table 8 and Table 9 show that the 2021–2023 monitoring window was characterized by marked variations in both total penalty score and defect-family composition. September 2021 was dominated by gauge-related defects, mainly L3 and L4, which together generated 6200 penalty points out of a total of 8500 points. This indicates that, during this campaign, the deterioration pattern was strongly influenced by gauge-widening or narrowing defects rather than by cross-level or longitudinal-level defects.
The most critical campaign in the extended monitoring window was March 2022, with a total of 19,100 penalty points. This high score was not caused by a single defect family alone, but by the simultaneous contribution of several high-penalty defect types. Cross-level defects contributed strongly through V4 and V5 defects, gauge defects contributed through L4 and L5 defects, and longitudinal-level defects contributed through J3, J4, A3, and A4 defects. Therefore, March 2022 represents the most severe multi-defect condition observed in the available dataset.
After March 2022, the cumulative penalty score decreased substantially in September 2022, when only 2800 penalty points were recorded. This reduction was associated with the disappearance of most grade 4 and grade 5 defects from the processed defect table. However, the increase was observed again in March 2023, mainly due to longitudinal-level defects, and the persistence of V/N and R defects in September 2023 show that the section did not follow a simple monotonic improvement trend. Instead, the results indicate alternating degradation and recovery phases, with different defect families becoming dominant in different inspection campaigns.
Overall, Table 5, Table 6, Table 7, Table 8 and Table 9 show that the monitored section cannot be characterized by a single recurring defect type or by a steady degradation path. Gauge-related defects were dominant in September 2021, cross-level and mixed high-severity defects were dominant in March 2022, and longitudinal-level defects became dominant in March 2023. This confirms the need to evaluate both total penalty score and defect-family composition when translating inspection data into maintenance priorities.
3.5. Most Critical Defect Families Based on Cumulative Penalty Contribution
Following the individual assessment of the September 2020 and April 2021 inspection campaigns, the analysis was extended to the entire monitoring period from September 2020 to September 2023. For this purpose, all available measurement campaigns were consolidated under the same defect classification and penalty-point framework. The cumulative figures presented below provide a comparative overview of the evolution of defect counts, severity grades, total penalty scores, and the contribution of the main defect families over time. This representation allows the multi-year behaviour of the monitored section to be examined consistently, while maintaining the same maintenance-oriented interpretation criteria for all inspection campaigns.
Several of the defect families considered in the assessment, particularly longitudinal-level, cross-level, and twist-related defects, are commonly regarded as sensitive to the support condition of the track. However, in the present study, the available data consist of track-geometry measurements and processed defect scores only. Therefore, these defects cannot be attributed directly to ballast degradation, subgrade settlement, drainage problems, or other specific support-related mechanisms.
When the seven inspection campaigns are analyzed together, level-related and cross-level-related defect families account for a large share of the cumulative penalty score. This indicates that the measured degradation pattern was dominated by vertical and transverse geometry irregularities. These results may point to locations where additional field inspection of ballast, sleepers, drainage, and subgrade conditions would be useful, but they should not be interpreted as direct evidence of a specific deterioration mechanism.
Figure 7 highlights the cumulative dominance of level-related and cross-level-related defect families over the seven inspection campaigns. The figure shows that V+N and A+J defects generated the largest shares of the total penalty score, confirming that vertical and transverse geometry irregularities represented the main contributors to the measured degradation pattern.
Figure 7.
Contribution of level-related and cross-level-related defect families to the cumulative penalty score over the seven inspection campaigns.
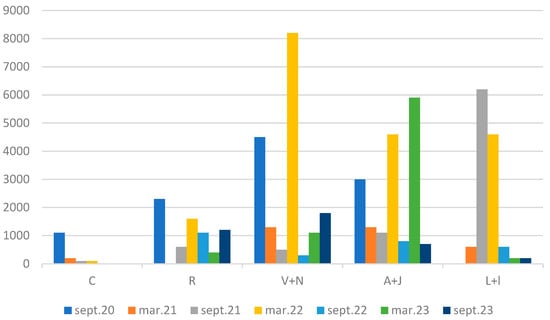
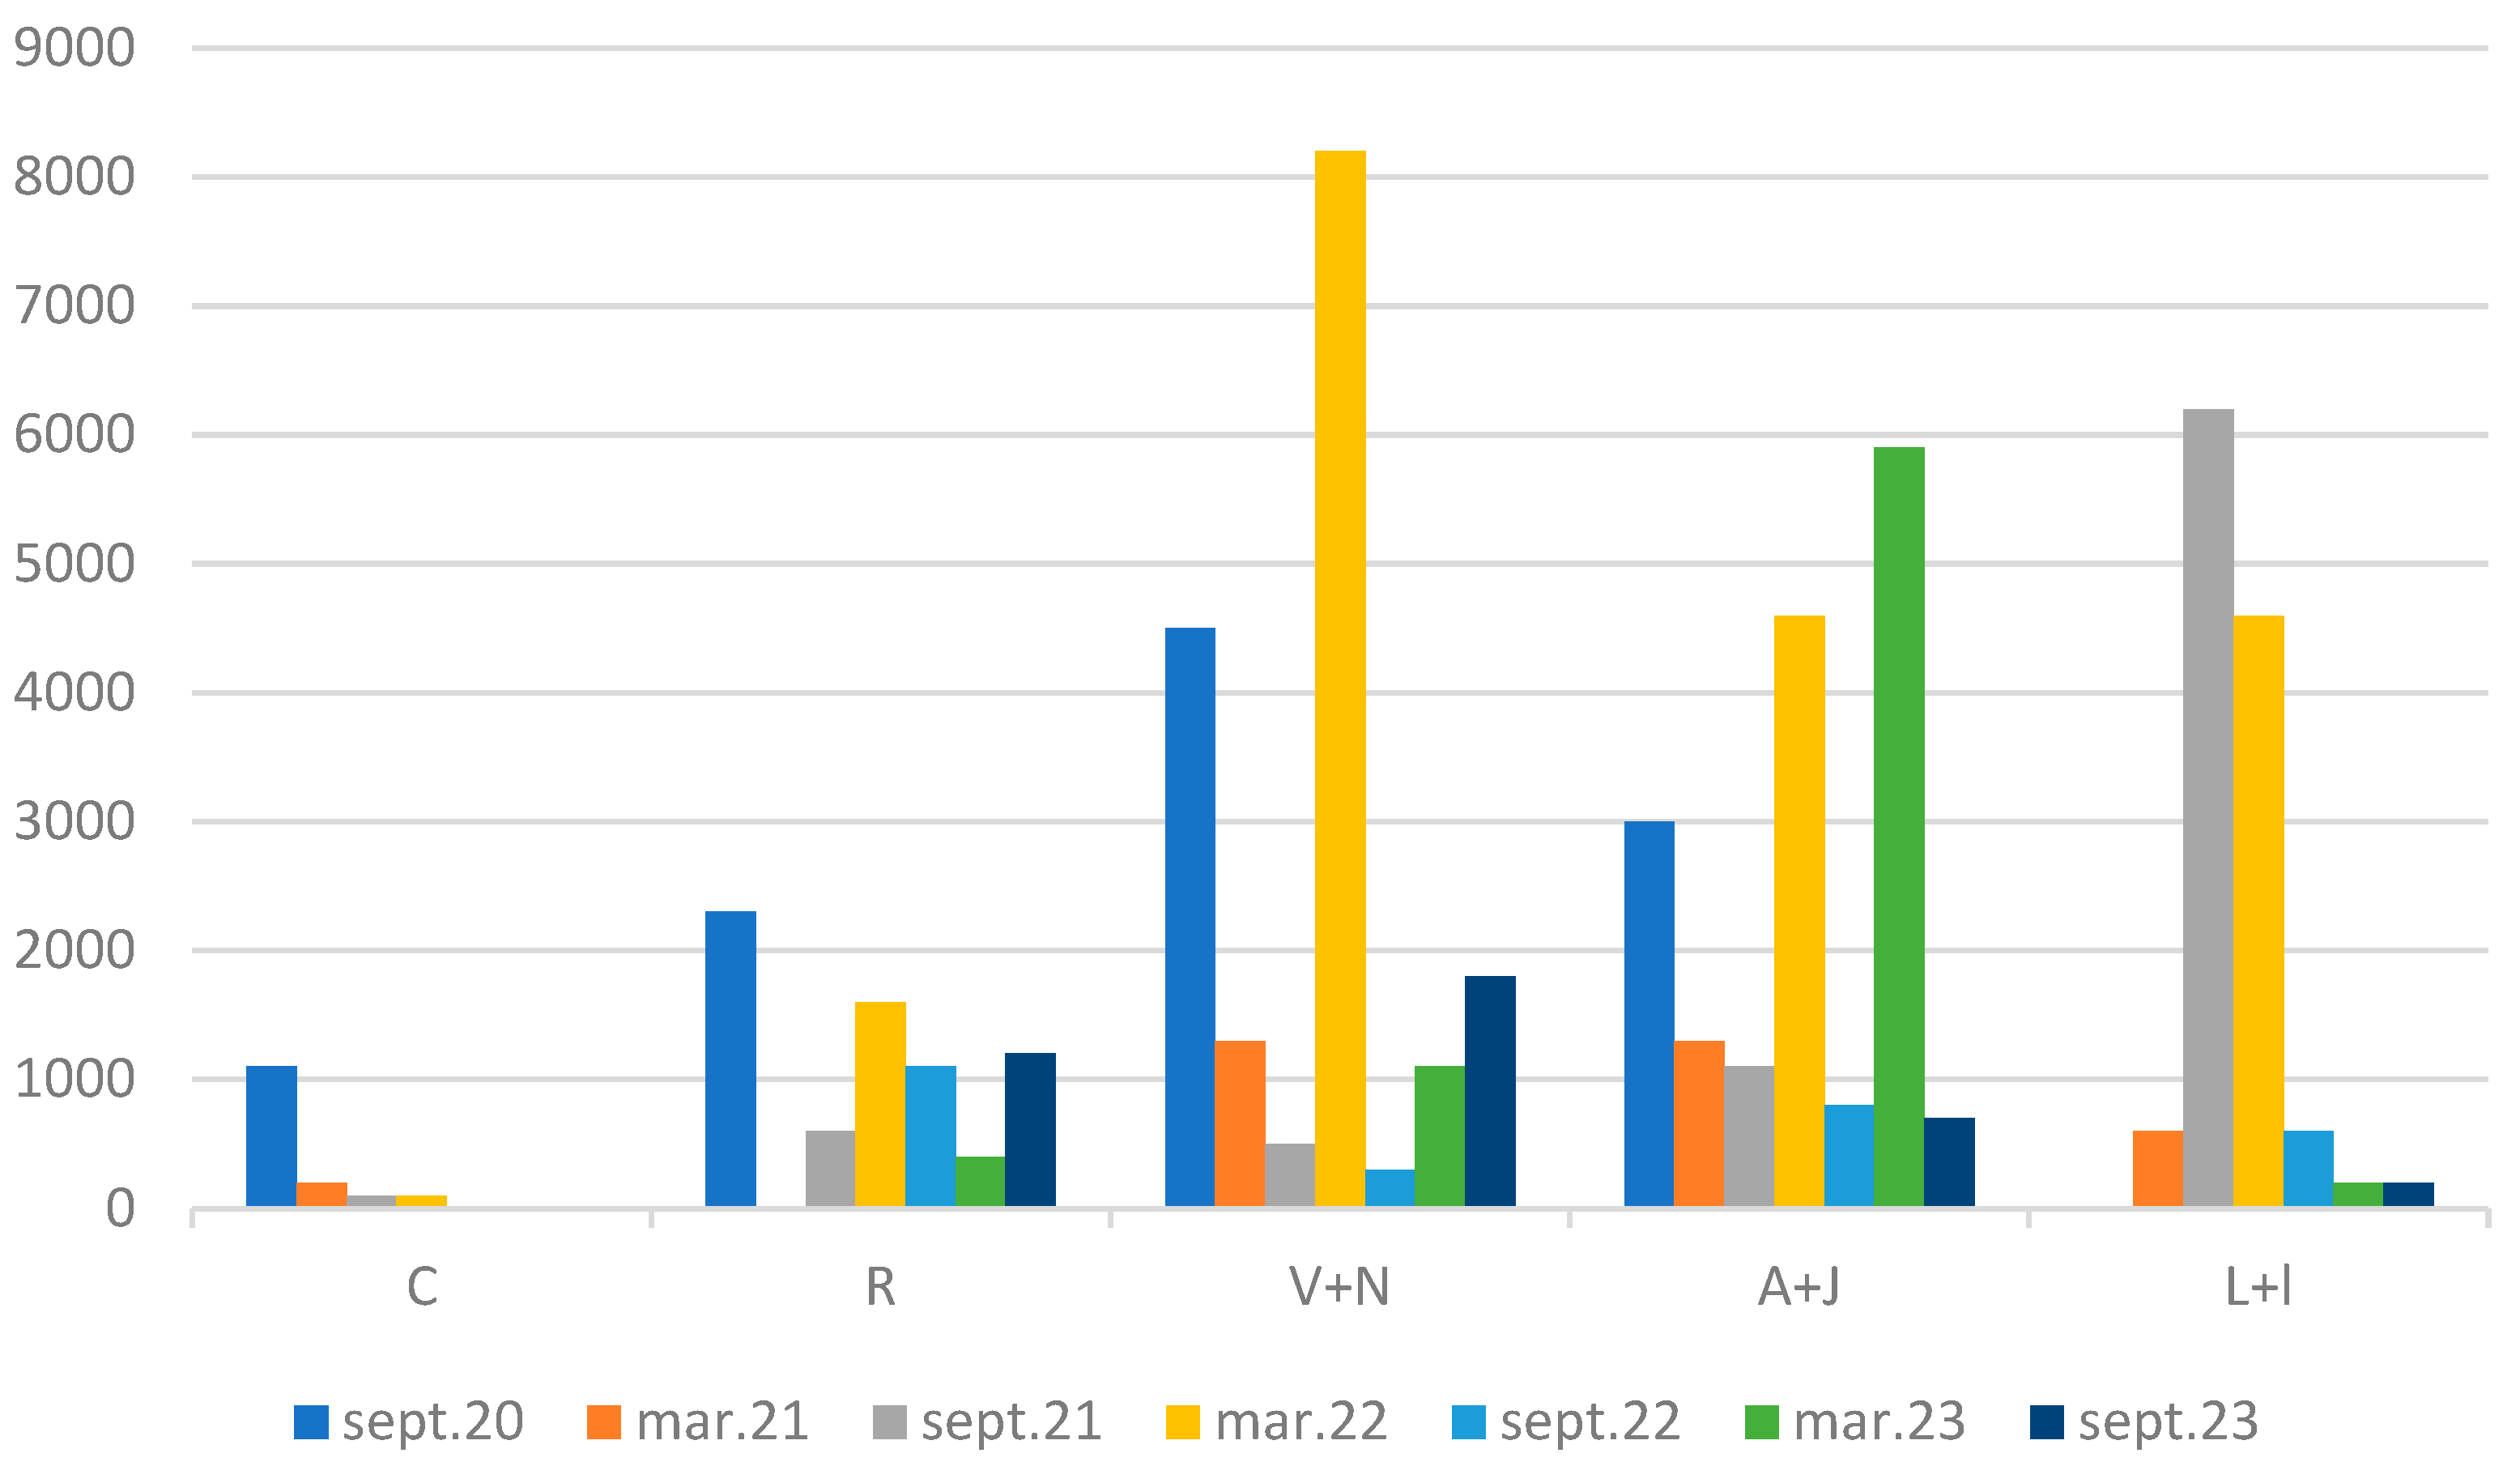
The centralized defect-family assessment for the entire monitoring period is presented in Table 10 and Figure 8. The results show that the cumulative penalty score was not evenly distributed among the defect families. Cross-level defects, represented by the V+N group, and longitudinal level defects, represented by the A+J group, generated the highest cumulative scores over the analyzed period. Together, these two categories accounted for more than 60% of the total penalty score, indicating that vertical and transverse geometry irregularities were the dominant contributors to the technical condition of the section.
Table 10.
Cumulative defect-family contribution over the 2020–2023 monitoring period.
Figure 8.
Evolution of penalty-point scores by defect family over the 2020–2023 monitoring period.
The evolution by inspection campaign also shows that the highest cumulative score was recorded in March 2022, mainly due to the strong contribution of V+N defects and the simultaneous increase in A+J and L+I defects. In contrast, the lowest total score was observed in September 2022, when all defect families recorded relatively reduced penalty values. Alignment defects, represented by the C group, had a limited contribution after September 2020, while twist defects, represented by the R group, showed recurrent but moderate contributions throughout the monitoring period. This centralized representation therefore provides a clearer comparison of the dominant defect mechanisms affecting the analyzed section between September 2020 and September 2023.
3.6. Persistent Defect Families and Maintenance Priority Ranking
The proposed indices were calculated using the penalty scores reported in the existing workflow. The DSI was first determined for each inspection campaign by dividing the total penalty score by the monitored length of 6 track km. This preserves the original penalty-point logic while enabling direct comparison between campaigns.
Using a monitored length of 6 track km, the DSI was calculated for each inspection campaign. The resulting values are summarized in Table 11.
Table 11.
Campaign-level normalized penalty score, expressed as Pkm/DSI, for the 2020–2023 monitoring period.
Since the DSI used in this study is numerically equivalent to the normalized quality score Pkm, its interpretation was aligned with the quality-score classes defined in Romanian Instruction 329 for track-measuring coaches. According to this framework, the following intervals are used: 0–60 points/km = very good; 61–200 points/km = good 1; 201–500 points/km = good 2; 501–900 points/km = satisfactory; 901–1500 points/km = satisfactory 2; and values above 1500 points/km = unsatisfactory. These thresholds are used only for the interpretation of DSI/Pkm. The proposed DRF, WDPS, and MPM indicators are not defined in Instruction 329 and are therefore used as complementary prioritization tools rather than regulatory intervention thresholds.
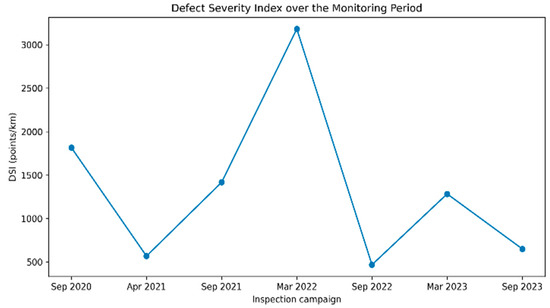
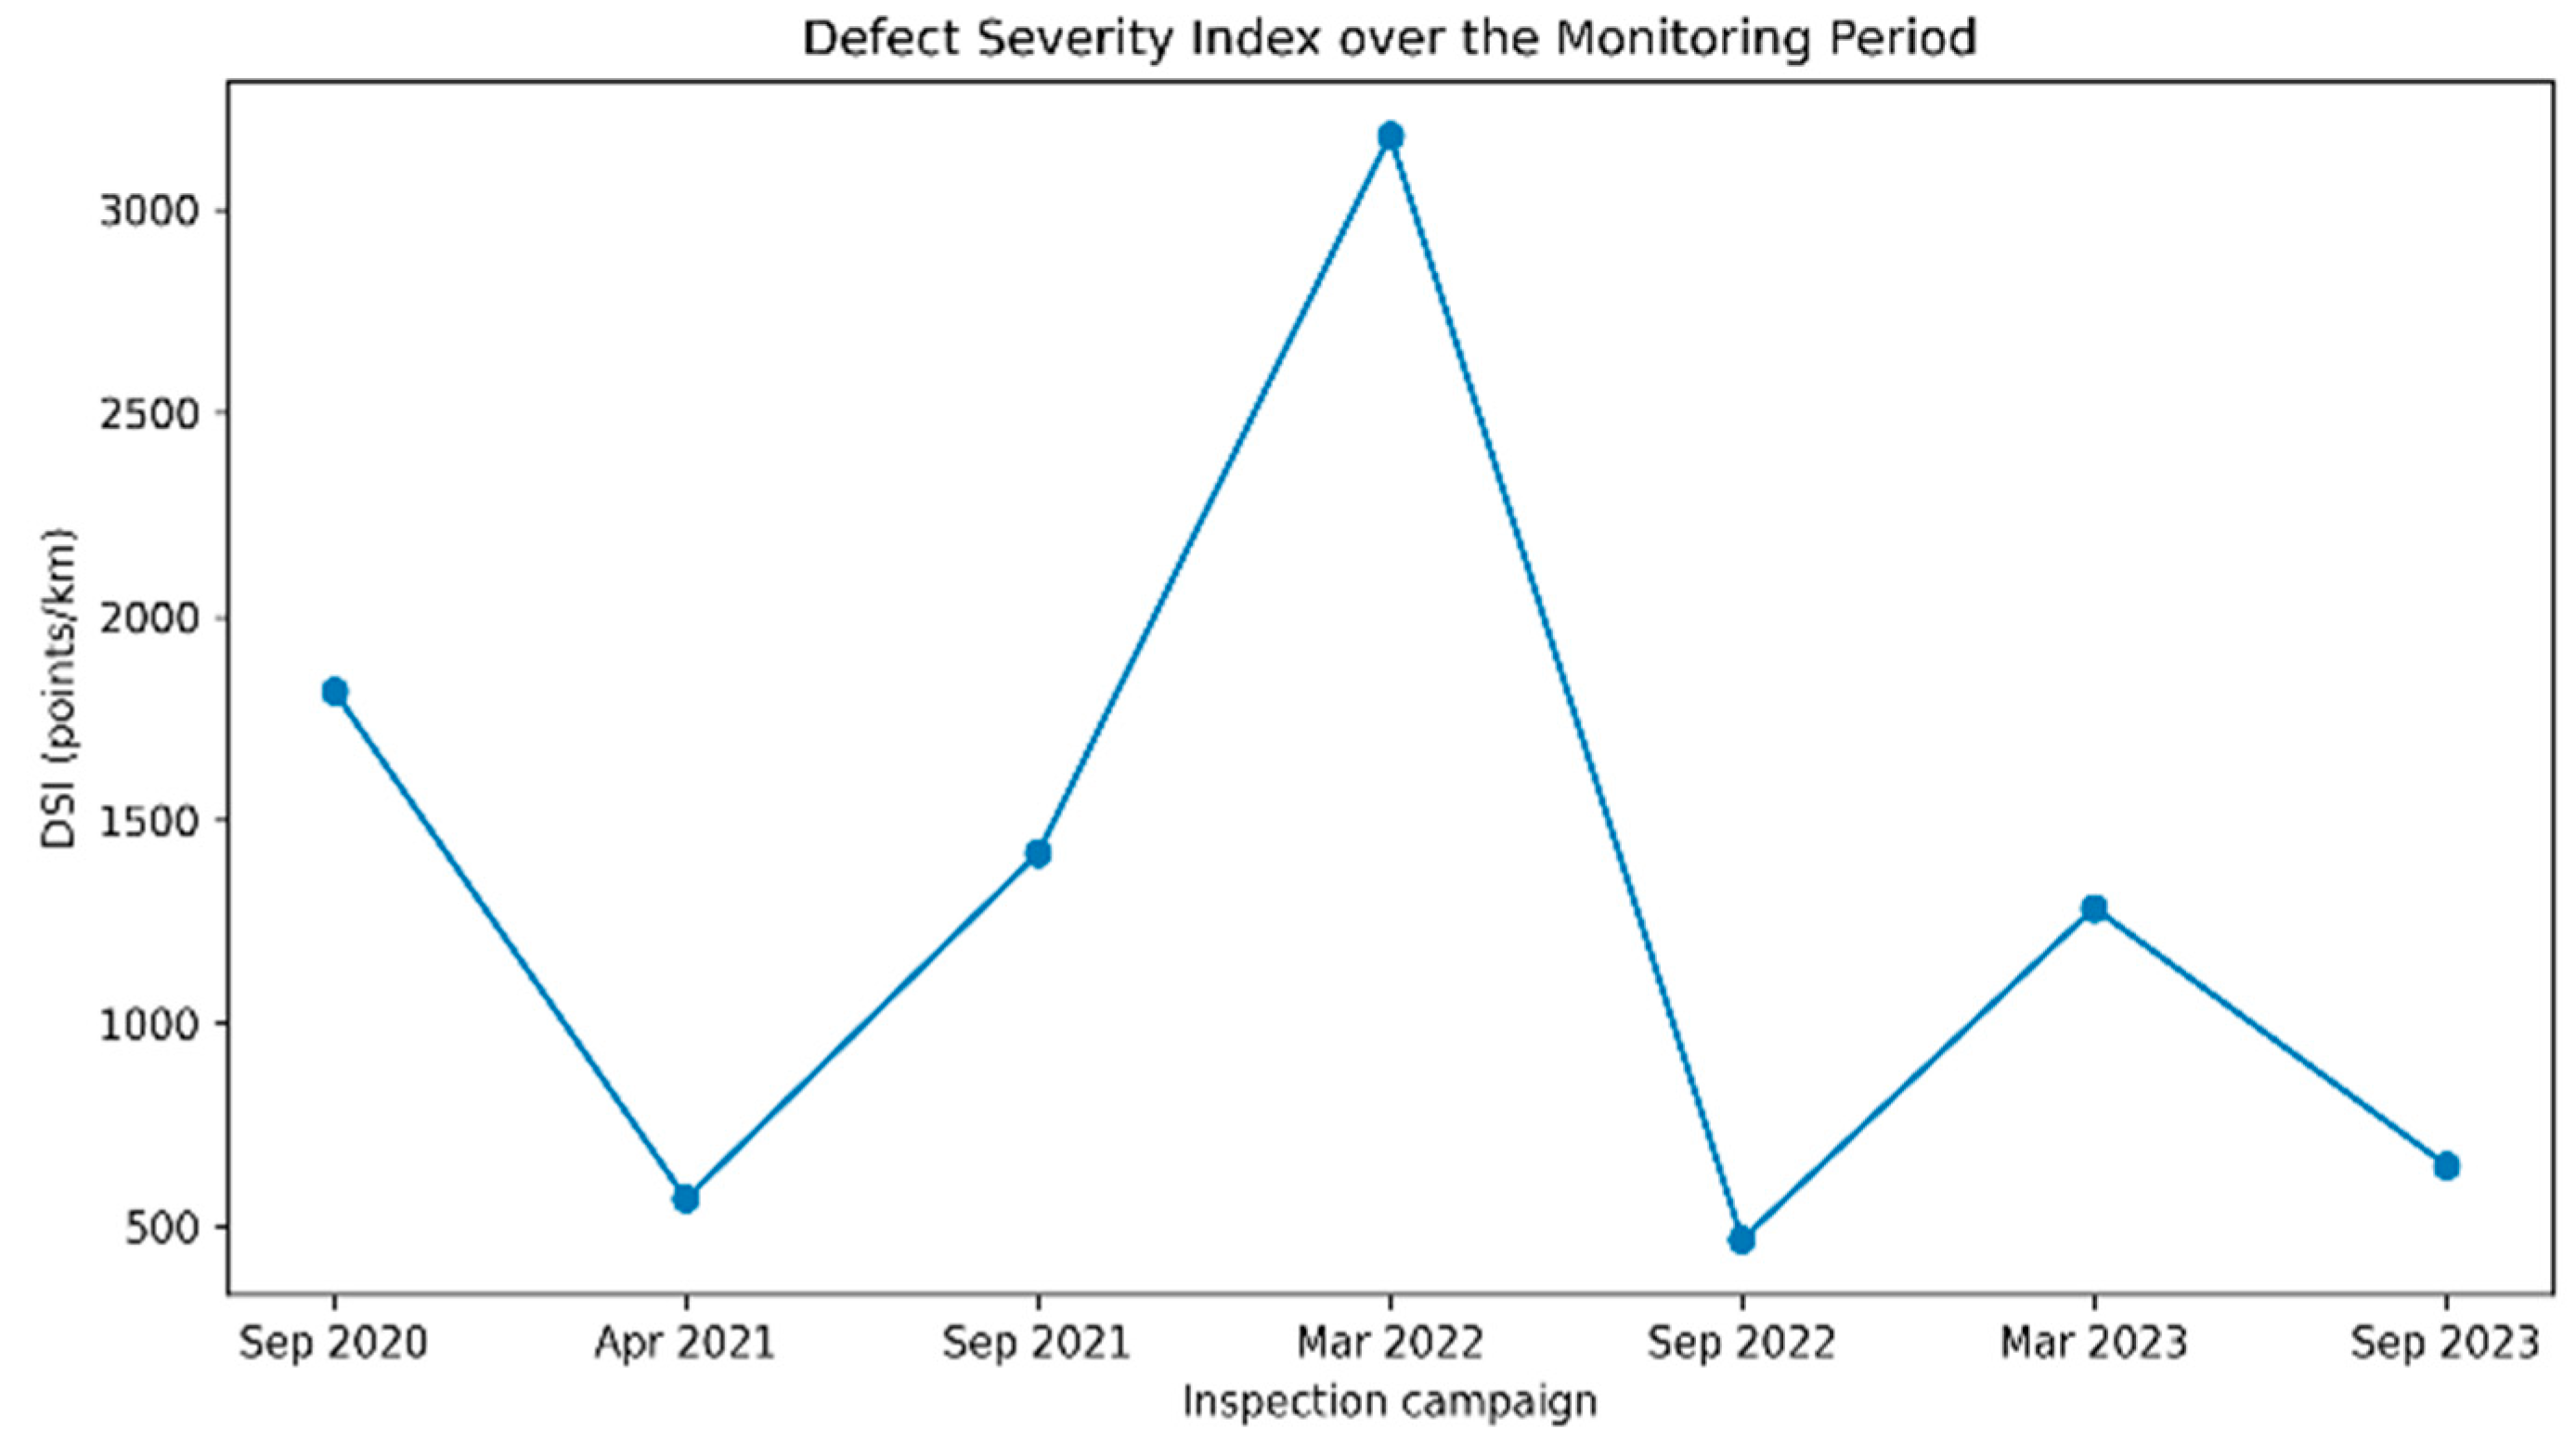
The DSI values confirm that the monitored section did not deteriorate in a simple linear manner. The highest degradation level was recorded in March 2022, while the lowest value was observed in September 2022. The reduction between September 2020 and April 2021 also shows that the normalized indicator can help interpret post-intervention or post-recovery changes in track geometry condition. The temporal evolution of the DSI is illustrated in Figure 9.
Figure 9.
Evolution of the Defect Severity Index over the 2020–2023 monitoring period.
The DSI peak in March 2022 is mainly explained by the simultaneous presence of several high-severity grade 4 and grade 5 defects, especially in the gauge, cross-level, longitudinal-level, and twist defect families. Since the penalty-point system is nonlinear, these high-grade defects strongly increased the cumulative score and produced the maximum DSI value of the monitoring period. The subsequent decrease in September 2022 reflects the much lower number of high-severity defects recorded in the processed inspection table. This decline indicates an observed improvement in measured geometry condition, but it cannot be attributed to a specific maintenance intervention because detailed intervention records were not available.
The DRF and WDPS were then calculated for each defect family using the cumulative defect-family scores presented in Table 10. These indicators show whether the dominant defect families are isolated or persistent across the monitoring period.
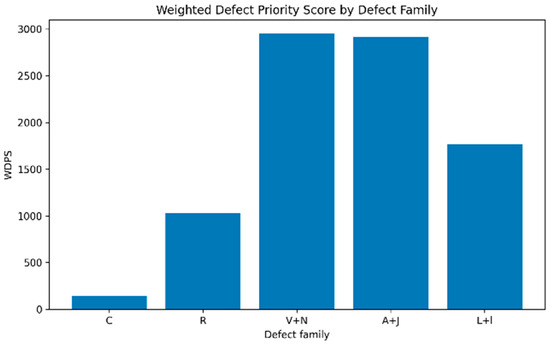
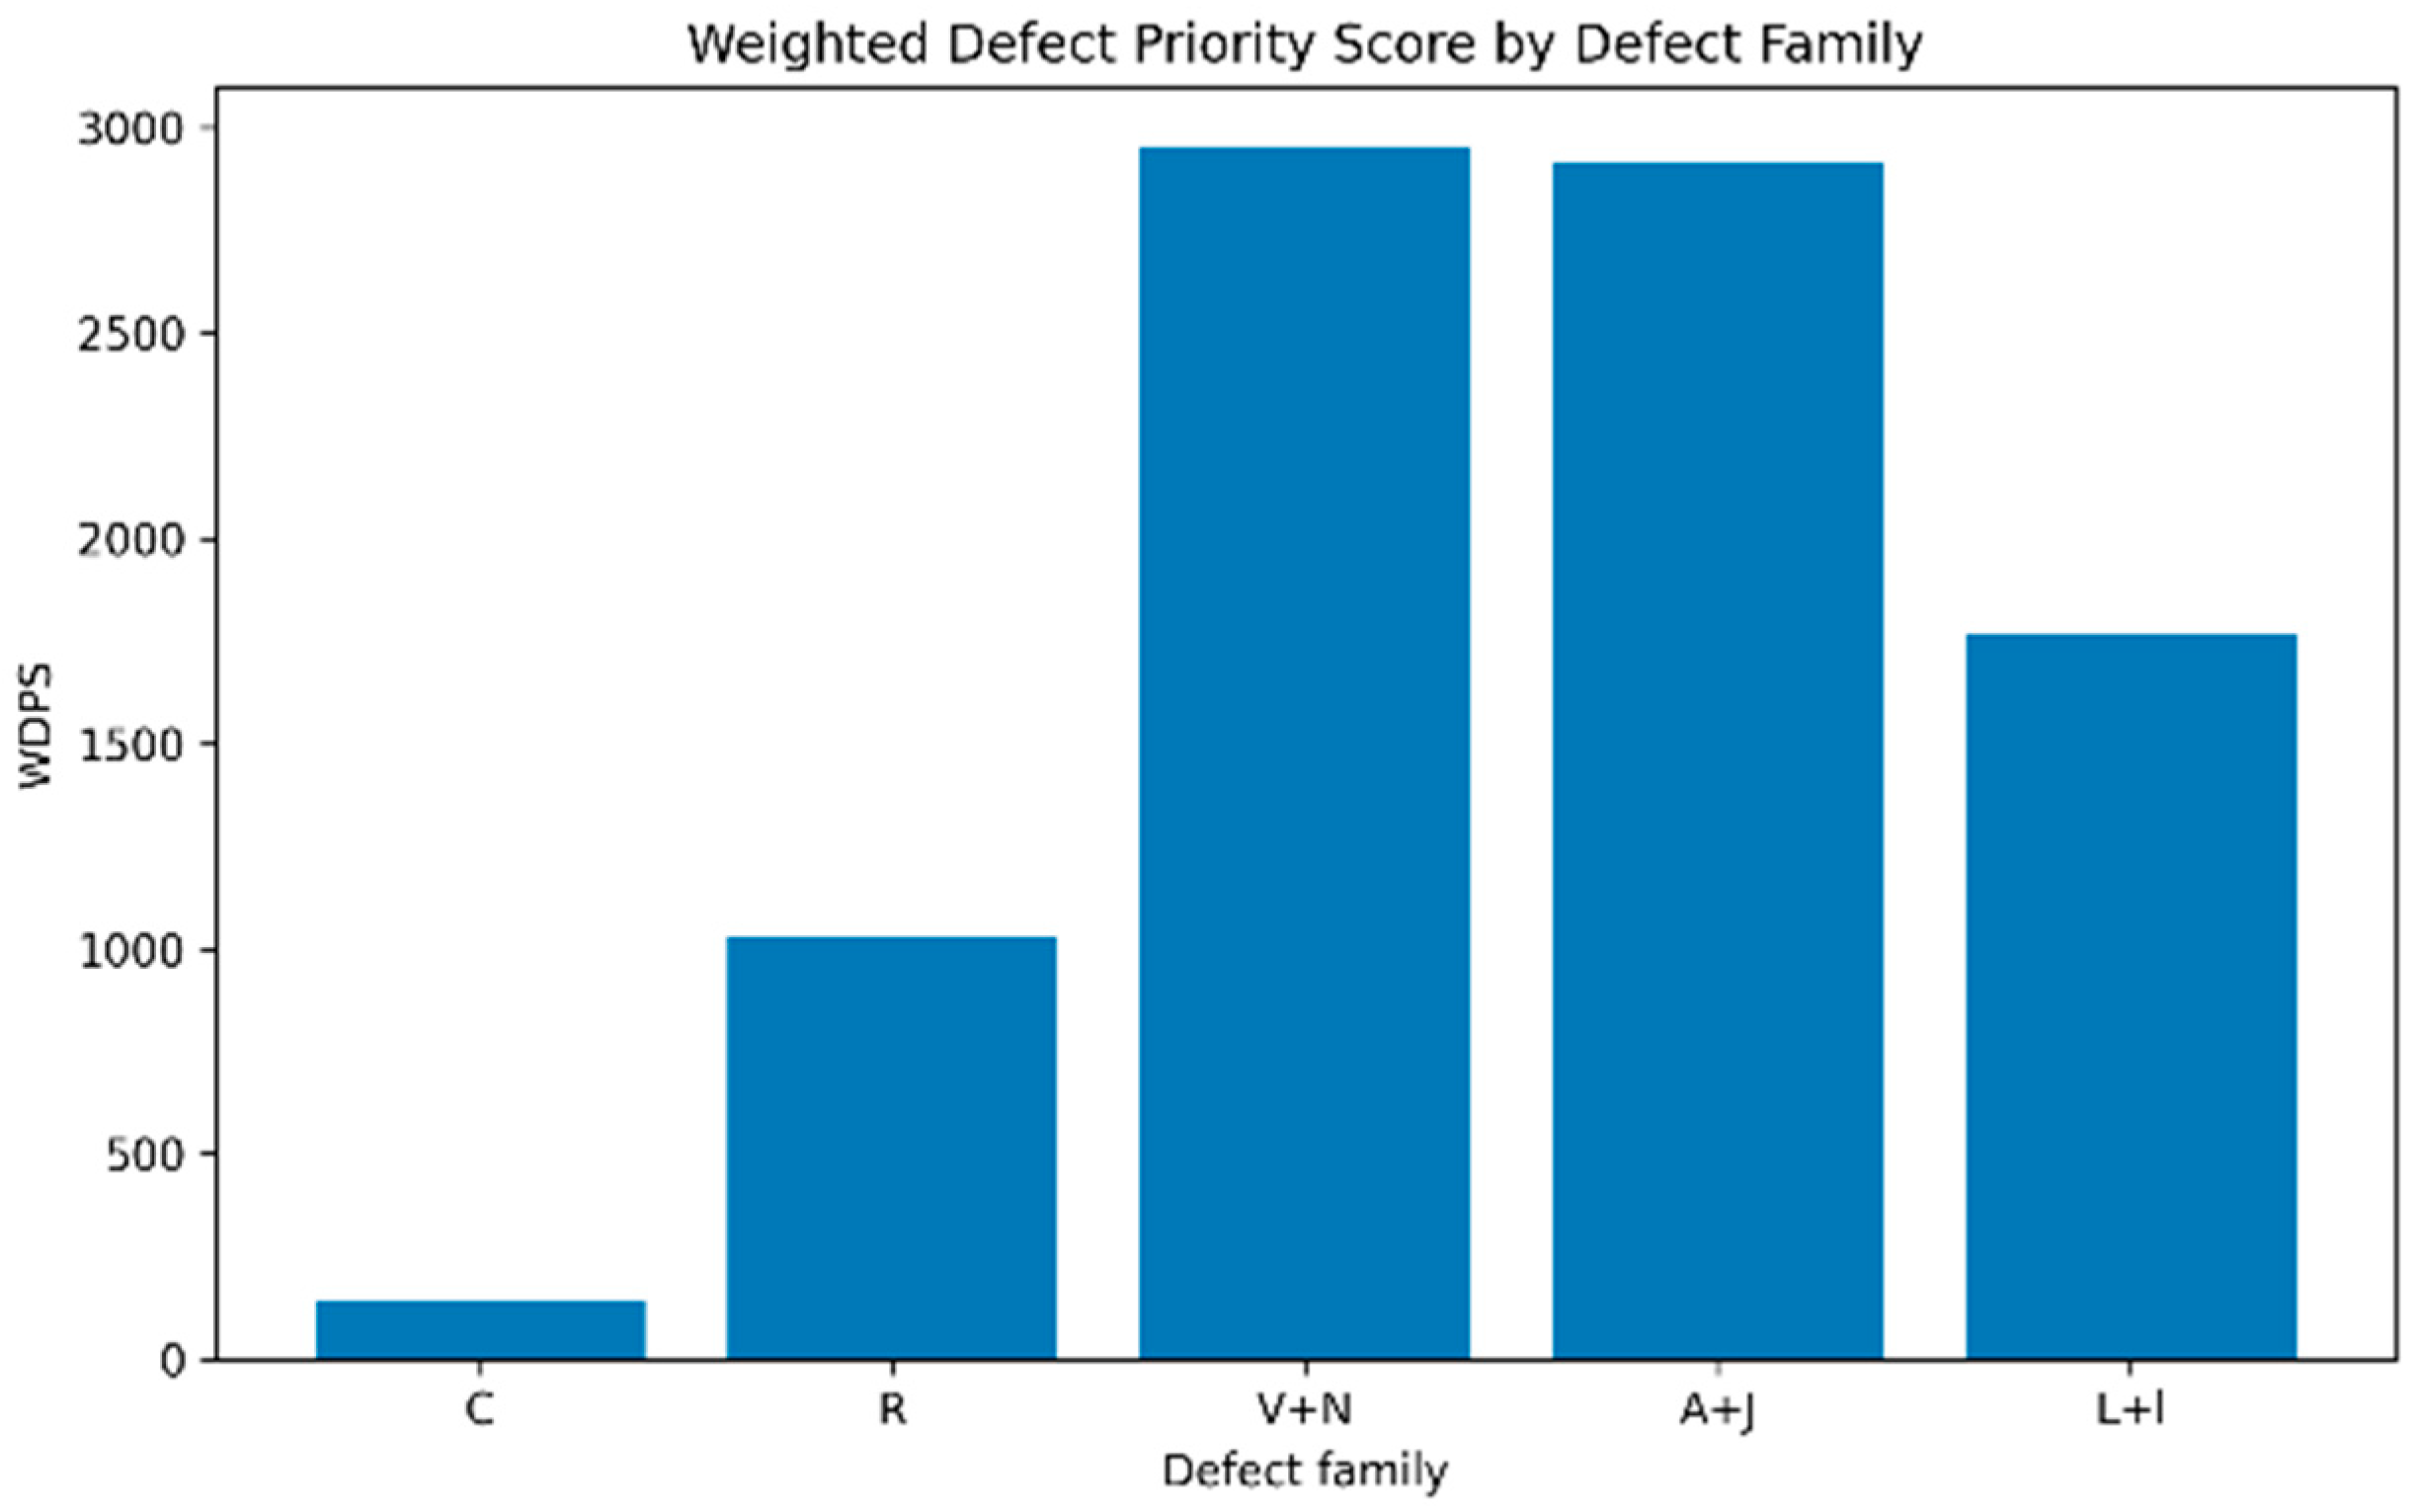
As shown in Table 12 and Figure 10, the highest WDPS values were obtained for cross-level defects (V+N) and longitudinal-level defects (A+J). These defect families combine high cumulative severity with full recurrence across the seven inspection campaigns, making them the most important maintenance priorities in the analyzed section.
Table 12.
Family-level recurrence and maintenance-priority indices.
Figure 10.
Weighted Defect Priority Score by defect family.
DRF and WDPS are used for complementary purposes rather than as two separate severity rankings: DRF identifies persistent defect families, while WDPS combines persistence with cumulative penalty contribution for maintenance ranking. The MPM results indicate that V+N and A+J are the main maintenance priorities because they combine the highest WDPS values with full recurrence across all seven inspection campaigns. L+l is classified as a corrective-intervention category because it has a relevant cumulative contribution but a lower priority score than V+N and A+J. R requires monitoring and targeted correction, while C remains in routine monitoring due to its low cumulative contribution and limited recurrence.
The relative ranking of defect families according to WDPS is presented in Figure 10.
According to the Maintenance Priority Matrix, V+N and A+J were classified as priority intervention categories, L+l as corrective intervention, R as monitoring and targeted correction, and C as routine monitoring.
The results therefore answer the three maintenance questions derived from the research objectives. The most critical defect families were cross-level defects (V+N) and longitudinal-level defects (A+J), which generated the highest cumulative penalty scores over the monitoring period. The most persistent defect families were also V+N and A+J, both with a DRF equal to 1.0, meaning that they were recorded in all seven inspection campaigns. From a maintenance-prioritization perspective, V+N and A+J were therefore classified as priority intervention categories in the Maintenance Priority Matrix. Gauge-related defects (L+l) formed a secondary but still relevant corrective-intervention category, while twist defects (R) required monitoring and targeted correction. Alignment defects (C) had the lowest recurrence and priority level and were classified as routine monitoring.
4. Discussion
The present case study confirms a point that is strongly supported in the literature: track geometry degradation is not simply a gradual average worsening of the track, but a defect-specific and location-sensitive process [17,18,19,20,21,35]. In relation to the first research objective, the DSI values show that the measured condition varied substantially between inspection campaigns, with the highest severity recorded in March 2022 and the lowest severity recorded in September 2022. In relation to the second and third objectives, the cumulative score contribution, DRF, WDPS, and Maintenance Priority Matrix consistently identify cross-level defects (V+N) and longitudinal-level defects (A+J) as both the most critical and the most persistent maintenance priorities.
This finding aligns with recent research showing that level-related parameters are especially informative for identifying ballast- and support-related deterioration. Studies on track geometry degradation, ballast condition, and maintenance planning consistently highlight the practical importance of longitudinal-level-derived indicators and related geometric patterns [35,36]. The strong contribution of cross-level and twist defects in the present study suggests that local support asymmetry, curve-related behaviour, and maintenance history may be relevant diagnostic hypotheses. However, these mechanisms cannot be confirmed from geometry measurements alone and should be examined using complementary field data.
The improvement observed between September 2020 and April 2021 also supports a second important conclusion: cumulative penalty-point analysis is useful for evaluating possible post-maintenance recovery. A reduction from approximately 1816 points/km to 567 points/km is not merely a numerical change; it implies a shift from a defect portfolio containing several high-penalty irregularities to one dominated largely by lower-grade defects. This type of interpretation is particularly valuable for conventional infrastructure managers because it bridges the gap between raw measurement data and maintenance strategy.
The added DSI, DRF, WDPS, and MPM strengthen the maintenance interpretation by distinguishing between severe but temporary defects and persistent defect families. This distinction is important because recurrent level-related defects may indicate locations where deeper support-related problems should be investigated, although the present dataset does not allow such mechanisms to be directly confirmed.
In this context, the proposed DSI–DRF–MPM framework intentionally avoids black-box prediction and instead emphasizes transparent engineering interpretation.
That choice is deliberate. The current literature increasingly explores machine learning, reinforcement learning, and digital-twin-enabled maintenance [8,9,10,11,37,38,39,40], but the practical deployment of such methods still depends on sound field interpretation. In that sense, the present study should be understood as a measurement-to-maintenance framework: it establishes the engineering logic necessary before more advanced condition-based and predictive tools can be implemented.
Finally, the dominance of level-related defects may be interpreted as a diagnostic signal requiring further investigation. Possible mechanisms include ballast degradation, tamping effectiveness, drainage deficiencies, local transition effects, or subgrade variability. Nevertheless, these remain hypotheses, because the present study does not include direct measurements of ballast condition, subgrade stiffness, drainage performance, axle loads, or detailed maintenance actions. Recent studies on tamping performance, ballast monitoring, and settlement behaviour show that repeated geometry problems are often rooted in support conditions rather than in superficial alignment issues alone [41,42,43,44]. This is especially relevant if later measurements reveal repeated recurrence of the same defect families at the same locations.
Compared with the conventional penalty-point method, the proposed indicators do not change the original defect-scoring logic, but make its maintenance interpretation more explicit. The DSI normalizes the cumulative score by track length and allows direct comparison between inspection campaigns. The DRF identifies defect families that recur over time, distinguishing persistent problems from isolated high-score events. The WDPS and MPM combine severity and recurrence, helping infrastructure managers rank defect families according to maintenance relevance.
In practical use, the proposed approach should be applied as a screening and prioritization tool. Defect families classified as priority intervention categories should be selected first for detailed field verification and maintenance planning. Corrective-intervention categories should be treated as secondary priorities, while lower-priority categories should remain under monitoring or targeted local correction. Therefore, the framework supports the allocation of maintenance attention, but it does not replace engineering judgement, field inspection, or official intervention criteria.
The interpretation of the processed VMC records was also supported by the Romanian railway technical instructions that define the national maintenance context, track-measurement practice, track tolerances, rail-defect inspection, and renewal or repair works for railway lines [35,36,37,38,39,40,41,42,43,44].
The present analysis characterizes defect concentration at the section level by using normalized penalty-point density and defect-family contribution. A more detailed spatial characterization of local defect clustering along the track would require defect localization at shorter intervals and should be addressed in future work.
The study also has several limitations. First, the analysis is based on a single railway section, and the proposed indicators should be validated on additional sections with different geometric, operational, and maintenance conditions. Second, the available dataset is based on track geometry inspection records and does not include direct measurements of ballast condition, subgrade stiffness, drainage performance, axle loads, or traffic loading. Third, the exact timing and type of maintenance interventions were not fully integrated into the analysis. Therefore, the observed reductions in penalty scores can be interpreted as changes in track geometry condition, but they cannot be quantitatively attributed to specific maintenance actions.
A further limitation concerns the mechanistic interpretation of defect causes. The proposed indicators identify which defect families dominate the cumulative penalty score and which of them recur across inspection campaigns. However, they do not provide direct causal diagnosis. In particular, the presence of longitudinal-level, cross-level, or twist defects may be compatible with support-related mechanisms, but they cannot be used alone to confirm ballast degradation, subgrade settlement, drainage deficiencies, sleeper defects, axle-load effects, or tamping-related problems. Such causal interpretation requires complementary field measurements and maintenance-history data. Future studies should combine the proposed indices with spatial recurrence mapping, intervention records, repeated inspection data, and infrastructure condition data.
Another limitation concerns measurement and scoring uncertainty. Track-geometry inspection results may be influenced by the measuring system, inspection speed, filtering and processing rules, localization accuracy, threshold definitions, and the classification of defects located near severity limits. Since the available dataset consisted of processed VMC inspection outputs rather than raw repeated measurements, a full quantitative uncertainty analysis could not be performed. This limitation may affect the exact numerical values of DSI and WDPS, especially when high-grade defects are involved. However, the main maintenance interpretation is considered robust because the dominant defect families, particularly cross-level and longitudinal-level defects, recur consistently across several inspection campaigns. Future work should include raw geometry signals, repeated inspection runs, and threshold-based reclassification scenarios to quantify measurement uncertainty more rigorously.
The proposed indicators should therefore be interpreted as maintenance-prioritization tools based on track-geometry measurements, not as standalone tools for identifying the physical causes of degradation. Mechanistic diagnosis requires complementary information on ballast condition, subgrade stiffness, drainage performance, traffic loading, and maintenance history.
5. Conclusions
This paper presented an in situ assessment of track geometry degradation on the analyzed section of railway line M300 using VMC records and maintenance-oriented defect scoring. The main conclusions are as follows.
First, the selected section exhibited a maintenance-relevant, non-uniform degradation pattern, reflected by the variation in normalized penalty scores between inspection campaigns and by the uneven contribution of different defect families. In this study, defect concentration is characterized at the section level through the density of penalty points per kilometre and the dominance of specific defect families, rather than through detailed spatial clustering of individual defects.
Second, the Defect Severity Index showed strong campaign-level variability, ranging from 467 points/km in September 2022 to 3183 points/km in March 2022. This confirms that the monitored section experienced a non-linear degradation and recovery pattern rather than a steady monotonic deterioration.
Third, the most critical defect families were cross-level defects (V+N) and longitudinal-level defects (A+J), which generated the highest cumulative penalty contributions over the monitoring period.
Fourth, the most persistent defect families were also V+N and A+J, both recorded in all seven inspection campaigns and therefore having a Defect Recurrence Factor equal to 1.0.
Fifth, the Maintenance Priority Matrix classified V+N and A+J as priority intervention categories, L+l as a corrective-intervention category, R as monitoring and targeted correction, and C as routine monitoring.
Sixth, the integration of DSI, DRF, WDPS, and MPM provides a transparent extension of the existing penalty-point workflow. These indicators require no additional measurement equipment, but they improve the interpretation of existing inspection data by linking severity, recurrence, and maintenance priority.
The proposed indicators should therefore be interpreted as maintenance-prioritization tools based on track-geometry measurements, not as standalone tools for identifying the physical causes of degradation. Mechanistic diagnosis requires complementary information on ballast condition, subgrade stiffness, drainage performance, traffic loading, axle loads, and maintenance history.
Future work should extend the present multi-year assessment toward spatial recurrence mapping, intervention-effectiveness evaluation, and predictive modelling of the dominant defect families.
Author Contributions
Conceptualization, M.C. and D.M.; methodology, M.C.; validation, A.D.D. and V.M.; formal analysis, A.D.D.; investigation, D.M.; resources, D.M.; data curation, V.M. and M.L.D.; writing—original draft preparation, M.C. and D.M.; writing—review and editing, M.C. and A.D.D.; visualization, M.L.D. and G.P. All authors have read and agreed to the published version of the manuscript.
Funding
This research received no external funding.
Data Availability Statement
No new data were created or analyzed in this study. Data sharing is not applicable to this article.
Acknowledgments
The authors have reviewed and edited the output and take full responsibility for the content of this publication.
Conflicts of Interest
Author Domuta Marcian was employed by the company Arcada. The remaining authors declare that the research was conducted in the absence of any commercial or financial relationships that could be construed as a potential conflict of interest.
References
- Esveld, C. Modern Railway Track; MRT-Productions: Zaltbommel, The Netherlands, 2001. [Google Scholar]
- Berggren, E.G.; Li, M.X.D.; Spännar, J. A New Approach to the Analysis and Presentation of Vertical Track Geometry Quality and Rail Roughness. Wear 2008, 265, 1488–1496. [Google Scholar] [CrossRef] [Scilit]
- Li, M.X.D.; Berggren, E.G.; Berg, M.; Persson, I. Assessing Track Geometry Quality Based on Wavelength Spectra and Track-Vehicle Dynamic Interaction. Veh. Syst. Dyn. 2008, 46, 261–276. [Google Scholar] [CrossRef] [Scilit]
- de Melo, A.L.O.; Kaewunruen, S.; Papaelias, M.; Bernucci, L.L.B.; Motta, R. Methods to Monitor and Evaluate the Deterioration of Track and Its Components in a Railway In-Service: A Systemic Review. Front. Built Environ. 2020, 6, 118. [Google Scholar] [CrossRef] [Scilit]
- Soleimanmeigouni, I.; Ahmadi, A.; Kumar, U. Track Geometry Degradation and Maintenance Modelling: A Review. Proc. Inst. Mech. Eng. Part F J. Rail Rapid Transit 2018, 232, 73–102. [Google Scholar] [CrossRef] [Scilit]
- Falamarzi, A.; Moridpour, S.; Nazem, M. A Review of Rail Track Degradation Prediction Models. Aust. J. Civ. Eng. 2019, 17, 152–166. [Google Scholar] [CrossRef] [Scilit]
- Xie, J.; Huang, J.; Zeng, C.; Jiang, S.-H.; Podlich, N. Systematic Literature Review on Data-Driven Models for Predictive Maintenance of Railway Track: Implications in Geotechnical Engineering. Geoscience 2020, 10, 425. [Google Scholar] [CrossRef] [Scilit]
- Davari, N.; Veloso, B.; Costa, G.d.A.; Pereira, P.M.; Ribeiro, R.P.; Gama, J. A Survey on Data-Driven Predictive Maintenance for the Railway Industry. Sensors 2021, 21, 5739. [Google Scholar] [CrossRef] [Scilit] [PubMed]
- Liao, Y.; Han, L.; Wang, H.; Zhang, H. Prediction Models for Railway Track Geometry Degradation Using Machine Learning Methods: A Review. Sensors 2022, 22, 7275. [Google Scholar] [CrossRef] [Scilit] [PubMed]
- Bianchi, G.; Fanelli, C.; Freddi, F.; Giuliani, F.; La Placa, A. Systematic Review Railway Infrastructure Monitoring: From Classic Techniques to Predictive Maintenance. Adv. Mech. Eng. 2025, 17, 16878132241285631. [Google Scholar] [CrossRef] [Scilit]
- Mutlu, U.; Kaewunruen, S. Digitalised Predictive Maintenance in Railways: A Systematic Review of AI, BIM, and Digital Twins. Infrastructures 2026, 11, 87. [Google Scholar] [CrossRef] [Scilit]
- Khajehei, H.; Ahmadi, A.; Soleimanmeigouni, I.; Nissen, A. Allocation of Effective Maintenance Limit for Railway Track Geometry. Struct. Infrastruct. Eng. 2019, 15, 1597–1612. [Google Scholar] [CrossRef] [Scilit]
- EN 13848-1; 2019 Railway Applications—Track—Track Geometry Quality—Part 1: Characterization of Track Geometry. CEN: Brussels, Belgium, 2019.
- EN 13848-5; 2017 Railway Applications—Track—Track Geometry Quality—Part 5: Geometric Quality Levels—Plain Line, Switches and Crossings. CEN: Brussels, Belgium, 2017.
- Weston, P.F.; Ling, C.S.; Roberts, C.; Goodman, C.J.; Li, P.; Goodall, R.M. Monitoring Vertical Track Irregularity from In-Service Railway Vehicles. Proc. Inst. Mech. Eng. Part F J. Rail Rapid Transit 2007, 221, 75–88. [Google Scholar] [CrossRef] [Scilit]
- Weston, P.F.; Ling, C.S.; Goodman, C.J.; Roberts, C.; Li, P.; Goodall, R.M. Monitoring Lateral Track Irregularity from In-Service Railway Vehicles. Proc. Inst. Mech. Eng. Part F J. Rail Rapid Transit 2007, 221, 89–100. [Google Scholar] [CrossRef] [Scilit]
- Sadeghi, J.; Askarinejad, H. Development of Improved Railway Track Degradation Models. Struct. Infrastruct. Eng. 2010, 6, 675–688. [Google Scholar] [CrossRef] [Scilit]
- Andrade, A.R.; Teixeira, P.F. Uncertainty in Rail-Track Geometry Degradation: Lisbon–Oporto Line Case Study. J. Transp. Eng. 2010, 137, 193–200. [Google Scholar] [CrossRef] [Scilit]
- Guler, H.; Jovanovic, S.; Evren, G. Modelling Railway Track Geometry Deterioration. Proc. Inst. Civ. Eng. Transp. 2011, 164, 65–75. [Google Scholar] [CrossRef] [Scilit]
- Jovanović, S.; Guler, H.; Čoko, B. Track Degradation Analysis in the Scope of Railway Infrastructure Maintenance Management Systems. Građevinar 2015, 67, 247–258. [Google Scholar] [CrossRef] [Scilit]
- Sadeghi, J.; Askarinejad, H. An Investigation into the Effects of Track Structural Conditions on Railway Track Geometry Deviations. Proc. Inst. Mech. Eng. Part F J. Rail Rapid Transit 2009, 223, 415–425. [Google Scholar] [CrossRef] [Scilit]
- Sadeghi, J. Development of Railway Track Geometry Indexes Based on Statistical Distribution of Geometry Data. J. Transp. Eng. 2010, 136, 693–700. [Google Scholar] [CrossRef] [Scilit]
- Sadeghi, J.; Fathali, M.; Boloukian, N. Development of a New Track Geometry Assessment Technique Incorporating Rail Cant Factor. Proc. Inst. Mech. Eng. Part F J. Rail Rapid Transit 2008, 223, 255–263. [Google Scholar] [CrossRef] [Scilit]
- Andrade, A.R.; Teixeira, P.F. Hierarchical Bayesian Modelling of Rail Track Geometry Degradation. Proc. Inst. Mech. Eng. Part F J. Rail Rapid Transit 2013, 227, 364–375. [Google Scholar] [CrossRef] [Scilit]
- CFR (Romanian Railways). Instruction 300: Instruction for the Maintenance of Railway Lines. [Instrucția 300—Instrucția de întreținere a Liniilor Ferate]; CFR (Romanian Railways): Bucharest, Romania, 1982. (In Romanian) [Google Scholar]
- CFR (Romanian Railways). Instruction 303: Instruction for Railway Track Renewal Works. [Instrucția 303—Instrucția Pentru Lucrările de Refacție a Liniei de Cale Ferată]; CFR (Romanian Railways): Bucharest, Romania, 1986. (In Romanian) [Google Scholar]
- CFR (Romanian Railways). Instruction 310: Instruction for the Use of the Track Measurement Trolley. [Instrucția 310—Instrucția Pentru Folosirea Căruciorului de Măsurat Calea]; CFR (Romanian Railways): Bucharest, Romania, 1956. (In Romanian) [Google Scholar]
- CFR (Romanian Railways). Instruction 314: Instruction for Standards and Tolerances for Tracks, Turnouts, Bridges and Tunnels. [Instrucția 314—Instrucția Pentru Norme și Toleranțe la Linii, Schimbătoare de cale, Poduri și Tuneluri]; CFR (Romanian Railways): Bucharest, Romania, 1989. (In Romanian) [Google Scholar]
- CFR (Romanian Railways). Instruction 348: Instruction for Non-Destructive Testing of Rails Using the Rail Flaw Detector. [Instrucția 348 Defectoscopul—Instrucția Pentru Controlul Nedistructiv al Șinelor]; CFR (Romanian Railways): Bucharest, Romania, 1972. (In Romanian) [Google Scholar]
- CFR (Romanian Railways). Instruction for the Diagnosis of the Track and Contact Line Performed with the TMC Track Measurement Vehicle. [Instrucția Pentru Diagnoza Căii și Liniei de Contact Efectuată cu Automotorul TMC]; CFR (Romanian Railways): Bucharest, Romania, 2006. (In Romanian) [Google Scholar]
- CFR (Romanian Railways). Instruction 329: Instruction for the Use of Track Measurement Coaches. [Instrucția 329—Instrucția Pentru Folosirea Vagoanelor de Măsurat Calea]; CFR (Romanian Railways): Bucharest, Romania, 1972. (In Romanian) [Google Scholar]
- CFR (Romanian Railways). Instruction 306: Instructions for Determining Rail Defects and Inspecting Rails in Track. [Instrucția 306—Instrucțiuni Pentru Determinarea Defectelor Șinelor și Pentru Verificarea Șinelor în Cale]; CFR (Romanian Railways): Bucharest, Romania, 1972. (In Romanian) [Google Scholar]
- CFR (Romanian Railways). Instruction 302: Instruction for Carrying Out Major Railway Track Renewal Works. [Instrucția 302—Instrucția Pentru Executarea Lucrărilor de Reparație Radicală a Liniei Ferate]; CFR (Romanian Railways): Bucharest, Romania, 1986. (In Romanian) [Google Scholar]
- CFR (Romanian Railways). Instruction 341: Instruction for the Design, Maintenance and Supervision of Continuous Welded Track. [Instrucția 341—Instrucția Pentru Alcătuirea, întreținerea și Supravegherea Căii Fără Joante]; CFR (Romanian Railways): Bucharest, Romania, 1980. (In Romanian) [Google Scholar]
- Soleimanmeigouni, I.; Ahmadi, A.; Nissen, A.; Xiao, X. Prediction of Railway Track Geometry Defects: A Case Study. Struct. Infrastruct. Eng. 2019, 15, 987–1001. [Google Scholar] [CrossRef] [Scilit]
- Zhao, W.; Qiang, W.; Yang, F.; Jing, G.; Guo, Y. Data-Driven Ballast Layer Degradation Identification and Maintenance Decision Based on Track Geometry Irregularities. Int. J. Rail Transp. 2024, 12, 581–603. [Google Scholar] [CrossRef] [Scilit]
- Sresakoolchai, J.; Kaewunruen, S. Railway Infrastructure Maintenance Efficiency Improvement Using Deep Reinforcement Learning Integrated with Digital Twin Based on Track Geometry and Component Defects. Sci. Rep. 2023, 13, 2439. [Google Scholar] [CrossRef] [Scilit] [PubMed]
- Fumeo, E.; Oneto, L.; Anguita, D. Condition Based Maintenance in Railway Transportation Systems Based on Big Data Streaming Analysis. Procedia Comput. Sci. 2015, 53, 437–446. [Google Scholar] [CrossRef] [Scilit]
- Lasisi, A.; Attoh-Okine, N. Principal Components Analysis and Track Quality Index: A Machine Learning Approach. Transp. Res. Part C Emerg. Technol. 2018, 91, 230–248. [Google Scholar] [CrossRef] [Scilit]
- Bai, L.; Liu, R.; Sun, Q.; Wang, F.; Wang, F. Classification-Learning-Based Framework for Predicting Railway Track Irregularities. Proc. Inst. Mech. Eng. Part F J. Rail Rapid Transit 2016, 230, 598–610. [Google Scholar] [CrossRef] [Scilit]
- Guo, Y.; Markine, V.; Jing, G. Review of Ballast Track Tamping: Mechanism, Challenges and Solutions. Constr. Build. Mater. 2021, 300, 123940. [Google Scholar] [CrossRef] [Scilit]
- Offenbacher, S.; Antony, B.; Barbir, O.; Auer, F.; Landgraf, M. Evaluating the Applicability of Multi-Sensor Equipped Tamping Machines for Ballast Condition Monitoring. Measurement 2021, 172, 108881. [Google Scholar] [CrossRef] [Scilit]
- Wang, H.; Markine, V. Modelling of the Long-Term Behaviour of Transition Zones: Prediction of Track Settlement. Eng. Struct. 2018, 156, 294–304. [Google Scholar] [CrossRef] [Scilit]
- Varandas, J.N.; Hölscher, P.; Silva, M.A.G. Settlement of Ballasted Track under Traffic Loading: Application to Transition Zones. Proc. Inst. Mech. Eng. Part F J. Rail Rapid Transit 2014, 228, 242–259. [Google Scholar] [CrossRef] [Scilit]

Disclaimer/Publisher’s Note: The statements, opinions and data contained in all publications are solely those of the individual author(s) and contributor(s) and not of MDPI and/or the editor(s). MDPI and/or the editor(s) disclaim responsibility for any injury to people or property resulting from any ideas, methods, instructions or products referred to in the content. |
© 2026 by the authors. Licensee MDPI, Basel, Switzerland. This article is an open access article distributed under the terms and conditions of the Creative Commons Attribution (CC BY) license.