


Abstract
This study proposes a quality-aware multimodal framework for health-state assessment and remaining useful life (RUL) prediction of cold-region tunnels. The framework integrates structural-response, environmental, apparent-defect, and engineering-inspectiondata, with the apparent-defect pathway jointly encoding raw images through a convolutional neural network and structured defect variables. Five data-quality dimensions-completeness, accuracy, consistency, timeliness, and traceability are incorporated intoreliability-guided multimodal fusion. Their base weights were re-audited through two rounds of expert consultation, each comprising 323 valid questionnaires. The Cr-weighted group analytic hierarchy process yielded weights of 0.0548, 0.1326, 0.1372, 0.2279, and 0.4474, respectively, with a group consistency ratio of 0.0455; the ranking remained stable under one-at-a-time +10% perturbations. In the primary tunnel case study, the framework achieved 89.7% health-state accuracy, a 6.3% RUL mean absolute percentage error, and 84.1% accuracy under Gaussian perturbation of standardized numerical inputs at a noise scale of 0.15. To further examine the reliability contribution of data-quality information, an independent field panel comprising 600 segment-month observations from 25 segments across three operational tunnels was evaluated using target-excluded specifications, two-way fixed effects, leave-one-tunnel-out validation, multiple baseline models, and five fixed random seeds. A one-standard-deviation increase in lagged quality instability was associated with a 0.0151 increase in the subsequent state-error index (95% CI: 0.0118-0.0184; p < 0.001). In cross-tunnel random-forest tests, incorporating quality information increased mean R2 from 0.8277 to 0.8323 for state-error prediction and from 0.8517 to 0.8673 for RUL-contraction prediction, with both improvements significant in paired tests (p < 0.001). Split-conformal intervals achieved mean cross-tunnel coverage of 95.8% and 95.9%, respectively. These findings demonstrate that data-quality information provides a modest but statistically supported improvement in cross-tunnel reliability, whilethe principal contribution lies in integrating auditable data governance, reliability-aware fusion, and engineering decision support within a unified tunnel health-management framework.
1. Introduction
Tunnels are critical infrastructure assets in transport networks because they provide route continuity across mountains, urbanized corridors and environmentally constrained terrain [1]. In alpine and cold regions, tunnel linings and auxiliary drainage systems are subjected to persistent thermal, hydraulic and mechanical stressors. Seasonal freeze–thaw cycling, negative-temperature exposure, water migration, ventilation-induced heat exchange and traffic loading may jointly accelerate lining cracking, leakage, icing and durability deterioration [2,3,4].
The deterioration of cold-region tunnels is typically not governed by a single dominant factor. Instead, it can be interpreted as a coupled evolutionary process in which environmental forcing continuously modifies structural response, structural response gradually induces observable defects, and the accumulation of defects ultimately leads to serviceability degradation. Under this mechanism, predictive maintenance must extend beyond current condition assessment and further include estimation of remaining useful life (RUL) prior to reaching maintenance or intervention thresholds [5,6,7].
With advances in tunnel monitoring technology, more heterogeneous data sources are now available for condition evaluation. Continuous sensing systems can capture deformation, strain, pressure and temperature; mobile inspection systems enable automated recognition of cracks and leakage; and engineering-inspection data provide information on material properties, hidden defects and lining thickness [8,9,10,11,12]. However, these data sources exhibit strong heterogeneity in temporal resolution, spatial alignment, sampling frequency and traceability. In practical engineering environments, missing data, sensor drift, image degradation and delayed manual verification are frequently encountered, particularly under harsh cold-region conditions.
These issues make direct data fusion inherently challenging. In addition to numerical accuracy, data quality in engineering decision-making systems must account for completeness, consistency, timeliness, and traceability [13,14]. Recent structural-engineering reviews likewise emphasize model generalization, explainability, incomplete evidence, uncertainty, traceability, and the distinction between nominal predictive accuracy and auditable engineering decisions [15,16]. Traditional fusion approaches, such as multisensor weighted fusion, Kalman filtering, and the Dempster–Shafer evidence theory, are useful for combining heterogeneous evidence but do not automatically prevent temporal leakage, target-derived inputs, or overconfident conclusions from small single-site datasets [17,18,19].
To address these limitations, this study develops a quality-aware cross-modal fusion framework for health-state assessment and remaining useful life (RUL) prediction of alpine cold-region tunnel infrastructure. Unlike conventional approaches that treat data quality as a preprocessing step, the proposed method explicitly integrates data quality evaluation into the learning process. Four types of operational data—structural response, environmental action, apparent defects and engineering inspection—are organized into unified window-level samples to ensure consistent multimodal representation.
A five-dimensional data quality assessment system is constructed, consisting of completeness, accuracy, consistency, timeliness and traceability, to quantify modality-specific reliability. Based on these quality indicators, a reliability-guided gating mechanism is introduced to dynamically regulate the contribution of each modality, thereby suppressing low-confidence information while preserving informative extreme-condition signals. Furthermore, a hybrid LSTM–Transformer architecture is designed to jointly model temporal degradation evolution and global cross-modal dependencies. Furthermore, a hybrid LSTM–Transformer architecture is designed to jointly model temporal degradation evolution and global cross-modal dependencies, as illustrated in Figure 1.
Figure 1.
Technical workflow of the proposed quality-aware predictive-maintenance framework.
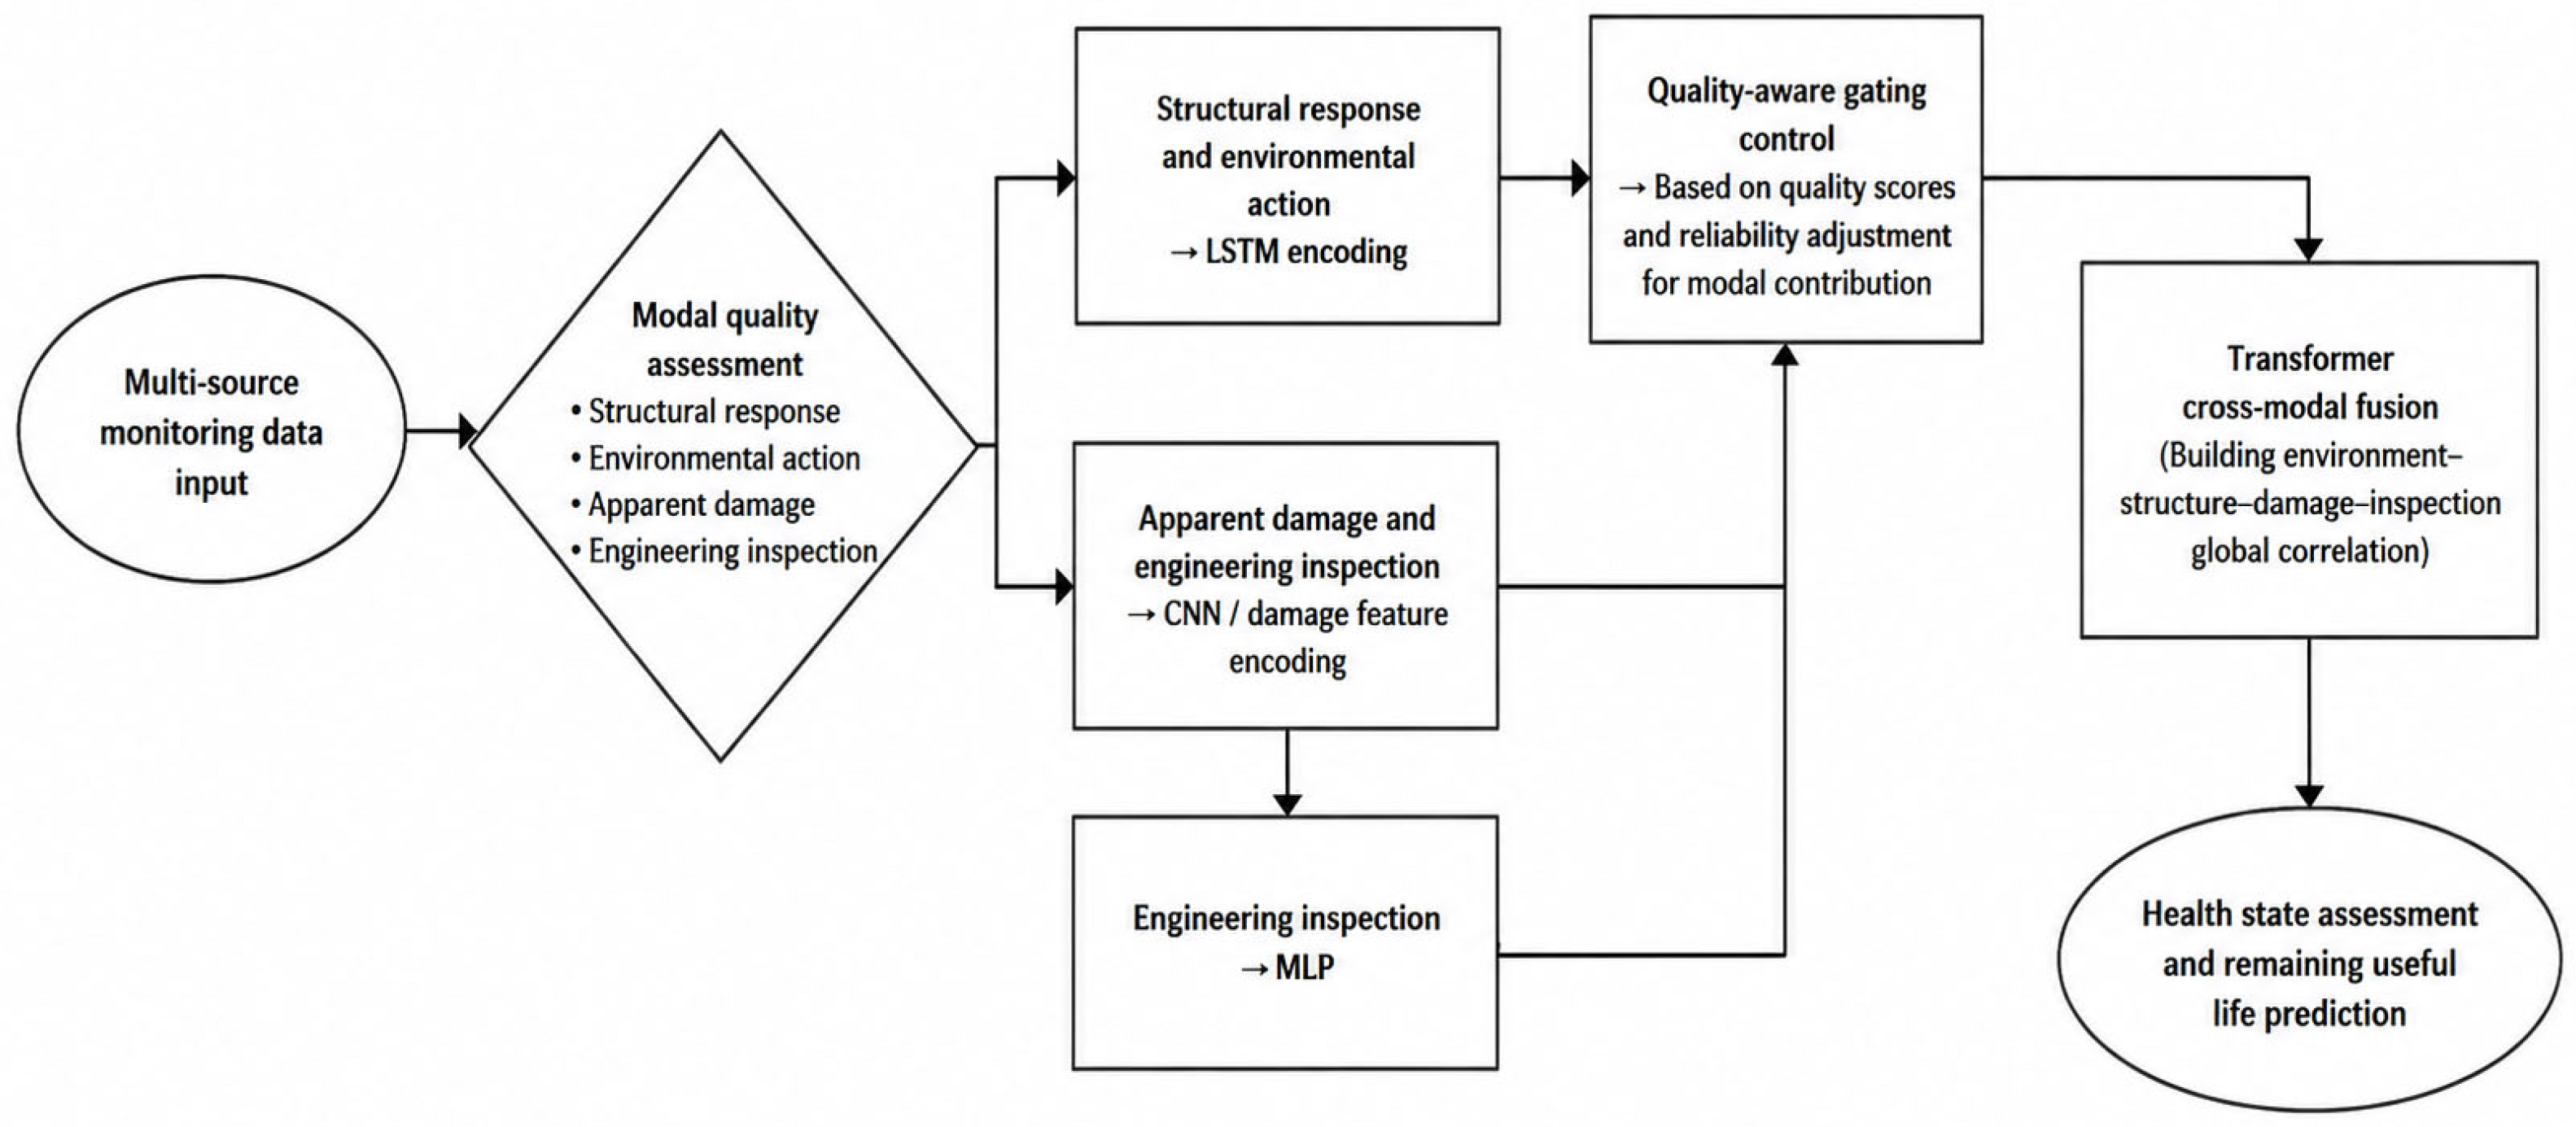
The study makes an engineering-integration contribution by combining established temporal and attention-based operators within a quality-aware tunnel health-management framework. Specifically, it (i) organizes heterogeneous tunnel observations into a unified window-level representation; (ii) formalizes five data-quality dimensions and an auditable expert-derived base-weight vector; (iii) incorporates data quality and source reliability into sample weighting and modality gating; and (iv) connects multimodal health assessment and RUL prediction with reliability evaluation and engineering decision support. The primary single-tunnel case study demonstrates the complete implementation workflow and its predictive performance, whereas cross-tunnel reliability is examined separately using an independent field panel from three operational tunnels. The latter analysis excludes target-derived predictors and employs two-way fixed effects, multiple baseline models, repeated runs, leave-one-tunnel-out validation, and split-conformal uncertainty intervals. Accordingly, the single-tunnel results are interpreted as case-specific performance evidence, while the three-tunnel analysis provides a more conservative assessment of the incremental reliability value and cross-site applicability of data-quality information.
2. Materials and Methods
2.1. Multimodal Window-Level Representation
The prediction task is formulated as a joint classification–regression problem for tunnel condition assessment and remaining useful life (RUL) estimation. For each time window , the input sample consists of structural response , environmental action , apparent defect information , engineering-inspection variables , a modality availability mask , a health-state label and a remaining useful life label . This formulation ensures that the model input is explicitly aligned with the two core outputs required in predictive maintenance applications, namely current structural condition evaluation and future degradation forecasting.
Structural-response and environmental-action data were organized as synchronized temporal sequences using a unified window length of 24 time steps. Windows originating from the same tunnel segment and monitoring period were assigned to the same data subset to preserve temporal continuity and prevent overlap-induced leakage. The apparent-defect modality adopted a dual-branch representation strategy. Raw inspection images were spatially standardized and normalized before convolutional feature extraction, global pooling, and latent-space projection, while structured defect variables—including crack geometry, leakage characteristics, surface deterioration, and defect-location descriptors—were encoded through a multilayer perceptron. Image standardization and training-stage augmentation were used to reduce sensitivity to illumination variation, partial occlusion, viewing angle, and image-scale differences. The image and structured-defect representations were subsequently combined and projected into the common multimodal latent space. Engineering-inspection data were encoded as low-frequency static vectors and temporally aligned with the corresponding monitoring windows. Finally, all modality-specific representations were processed through quality masks and reliability-guided gates before cross-modal fusion. Finally, all modality-specific representations were processed through quality masks and reliability-guided gates before cross-modal fusion, as summarized in Table 1.
Table 1.
Unified representation of multimodal tunnel monitoring and inspection data.
2.2. Data Quality Assessment and Reliability Control
For each modality, data quality is quantified through a five-dimensional assessment framework, including completeness, accuracy, consistency, timeliness, and traceability. These dimensions jointly describe the reliability and usability of heterogeneous monitoring data in cold-region tunnel environments.
Completeness evaluates the extent to which expected observations within a given time window are available. Accuracy reflects the degree of physical validity, including violations of physical boundaries, calibration deviations, and abrupt abnormal fluctuations. Consistency measures the agreement among data sources in terms of units, coding rules, temporal alignment, and spatial mapping. Timeliness quantifies whether data are available within a time horizon suitable for real-time or rolling maintenance decision-making. Traceability assesses whether data provenance, processing versions, and quality metadata are fully recorded to ensure auditability and reproducibility.
For sample and modality , the composite quality score is defined as , where denotes the score of the quality dimension and represents the corresponding modality-dependent weight. Based on this formulation, a reliability score is derived from the aggregated quality representation and is subsequently integrated into the gating mechanism of the fusion network.
Unlike conventional approaches that treat low-quality or missing data as noise to be discarded during preprocessing, the proposed framework explicitly preserves such information under a controlled weighting strategy. This is motivated by the observation that low-quality measurements in cold-region tunnel monitoring systems may still contain early-warning signals under extreme environmental conditions. Therefore, instead of hard elimination, their contribution is adaptively regulated through sample-level weighting and modality-level reliability gating, ensuring that informative but uncertain observations are not prematurely excluded from model learning.
To ensure the robustness and reliability of multimodal tunnel monitoring data, the quality-governance rules and corresponding data treatment procedures are summarized in Table 2 and Table 3.
Table 2.
Quality-governance rules for multimodal tunnel data.
Table 3.
Data-quality issue records and treatment outcomes before model training.
Table 2 defines the operational meanings, evaluation criteria, and corresponding treatment rules for the four data-quality categories. The relative importance of completeness, accuracy, consistency, timeliness, and traceability was determined through two rounds of expert consultation and Cr-weighted group AHP. Numerical admission thresholds were calibrated using engineering monitoring requirements, instrument-accuracy specifications, and the statistical distributions of the training data. Source-reliability coefficients were assigned according to sensor calibration status, acquisition continuity, inspection traceability, and cross-source agreement. Quality penalties increased monotonically with the severity of missingness, measurement deviation, temporal inconsistency, reporting delay, and traceability deficiency, while modality-specific cut-offs reflected the measurement tolerances and acquisition characteristics of each data source. All thresholds, coefficients, and penalty parameters were fixed using the training partition before model evaluation and were applied unchanged to validation, chronological holdout, and cross-tunnel test data.
Table 3 summarizes 745 data-quality issue instances identified during quality control. The statistical unit is an individual quality issue rather than a unique model window, because one window may contain more than one issue type. Outcome accounting was mutually exclusive: 488 issue records were corrected and qualified, 193 were admitted with reduced reliability weights, and 64 were retained for controlled use with explicit quality flags and modality masks. These outcomes total 745; no rejected or unresolved record entered the 1200-window modeling dataset. After issue-level treatment, all records were mapped back to unique segment–time identifiers, overlapping issue flags were consolidated, and each eligible window was counted once. The window-level dataset summary therefore reports 1200 unique samples, whereas Table 3 reports the preceding issue-detection and treatment workload.
2.3. Feature Engineering
The feature engineering process is designed to systematically transform raw multimodal tunnel monitoring data into representative variables that capture both instantaneous structural conditions and long-term degradation behavior. The feature set is constructed in three stages to ensure physical interpretability and modeling effectiveness.
Basic features retain direct physical observations from structural response, environmental action, material properties, and apparent defect measurements. These variables describe the immediate operational state of the tunnel system. Derived features are further constructed to characterize temporal evolution patterns, including trend dynamics, cross-modal associations, stability variations, and lifetime-related degradation indicators. Core features are finally selected to reduce redundancy and improve robustness through a combination of correlation screening, random forest-based importance ranking, and multicollinearity analysis using variance inflation factors [20,21].
The final feature set consists of 32 core features extracted from 41 basic features and 22 derived candidate features. These selected variables not only preserve key monitoring measurements but also incorporate cross-modal interaction descriptors and degradation trend indicators, enabling the model to jointly represent instantaneous condition states and progressive deterioration processes in cold-region tunnel environments.
Table 4 lists the 32 features used in the primary multimodal model, including direct measurements and descriptors of temporal trend, cross-variable association, signal stability, defect development, and service-life condition. The initial RUL index represents the baseline engineering estimate established at the beginning of each prediction window from preceding inspection and maintenance information and was included in the primary case-study configuration. To ensure strict independence between predictors and prediction targets, the leakage-controlled analyses excluded the initial RUL index, cumulative target damage, response-derived deterioration rate, and all other variables constructed using information from the prediction horizon. Feature selection, parameter calibration, and quality-threshold determination were completed exclusively within the training partition. Consequently, the chronological, segment-grouped, and leave-one-tunnel-out evaluations were conducted using a target-independent predictor set.
Table 4.
Representative core features used for predictive-maintenance modeling.
By combining basic and derived features, the final feature set enables the model to jointly learn instantaneous structural states and long-term degradation processes, thereby improving the robustness and interpretability of predictive-maintenance modeling.
2.4. Quality-Aware LSTM–Transformer Fusion Model
To explicitly capture both temporal degradation dynamics and cross-modal interactions, a hybrid LSTM–Transformer fusion architecture is designed for cold-region tunnel monitoring data.
Structural-response and environmental-action sequences were processed by two independent two-layer LSTM encoders, each with a hidden dimension of 128 and a dropout rate of 0.20. The apparent-defect modality adopted parallel-image and structured-variable branches. Inspection images were resized to 224 × 224 pixels, normalized channel-wise, and encoded by a four-stage CNN comprising 3 × 3 convolution, batch normalization, ReLU activation, and 2 × 2 max-pooling operations, with channel dimensions of 32, 64, 128, and 256. Global average pooling and a fully connected layer transformed the final feature map into a 128-dimensional embedding. CNN parameters were initialized using He initialization. Training images were augmented using random horizontal flipping (p = 0.50), rotation within ±10°, brightness and contrast adjustment within ±15%, and random erasing (p = 0.20; erased area = 2–10%); augmentation was not applied to validation or test images. Structured defect variables, including crack geometry, leakage characteristics, defect location, frost damage, spalling, and surface deterioration, were processed by a two-layer MLP with dimensions of 64 and 128. The image and structured-defect embeddings were concatenated and projected into the common 128-dimensional latent space. Engineering-inspection variables were encoded by a separate two-layer MLP using the same output dimension. Dataset partitioning was completed at the tunnel-segment and inspection-event levels before image augmentation, ensuring that images from the same segment, inspection event, or temporal window remained within a single subset and preventing image-level and temporal leakage.
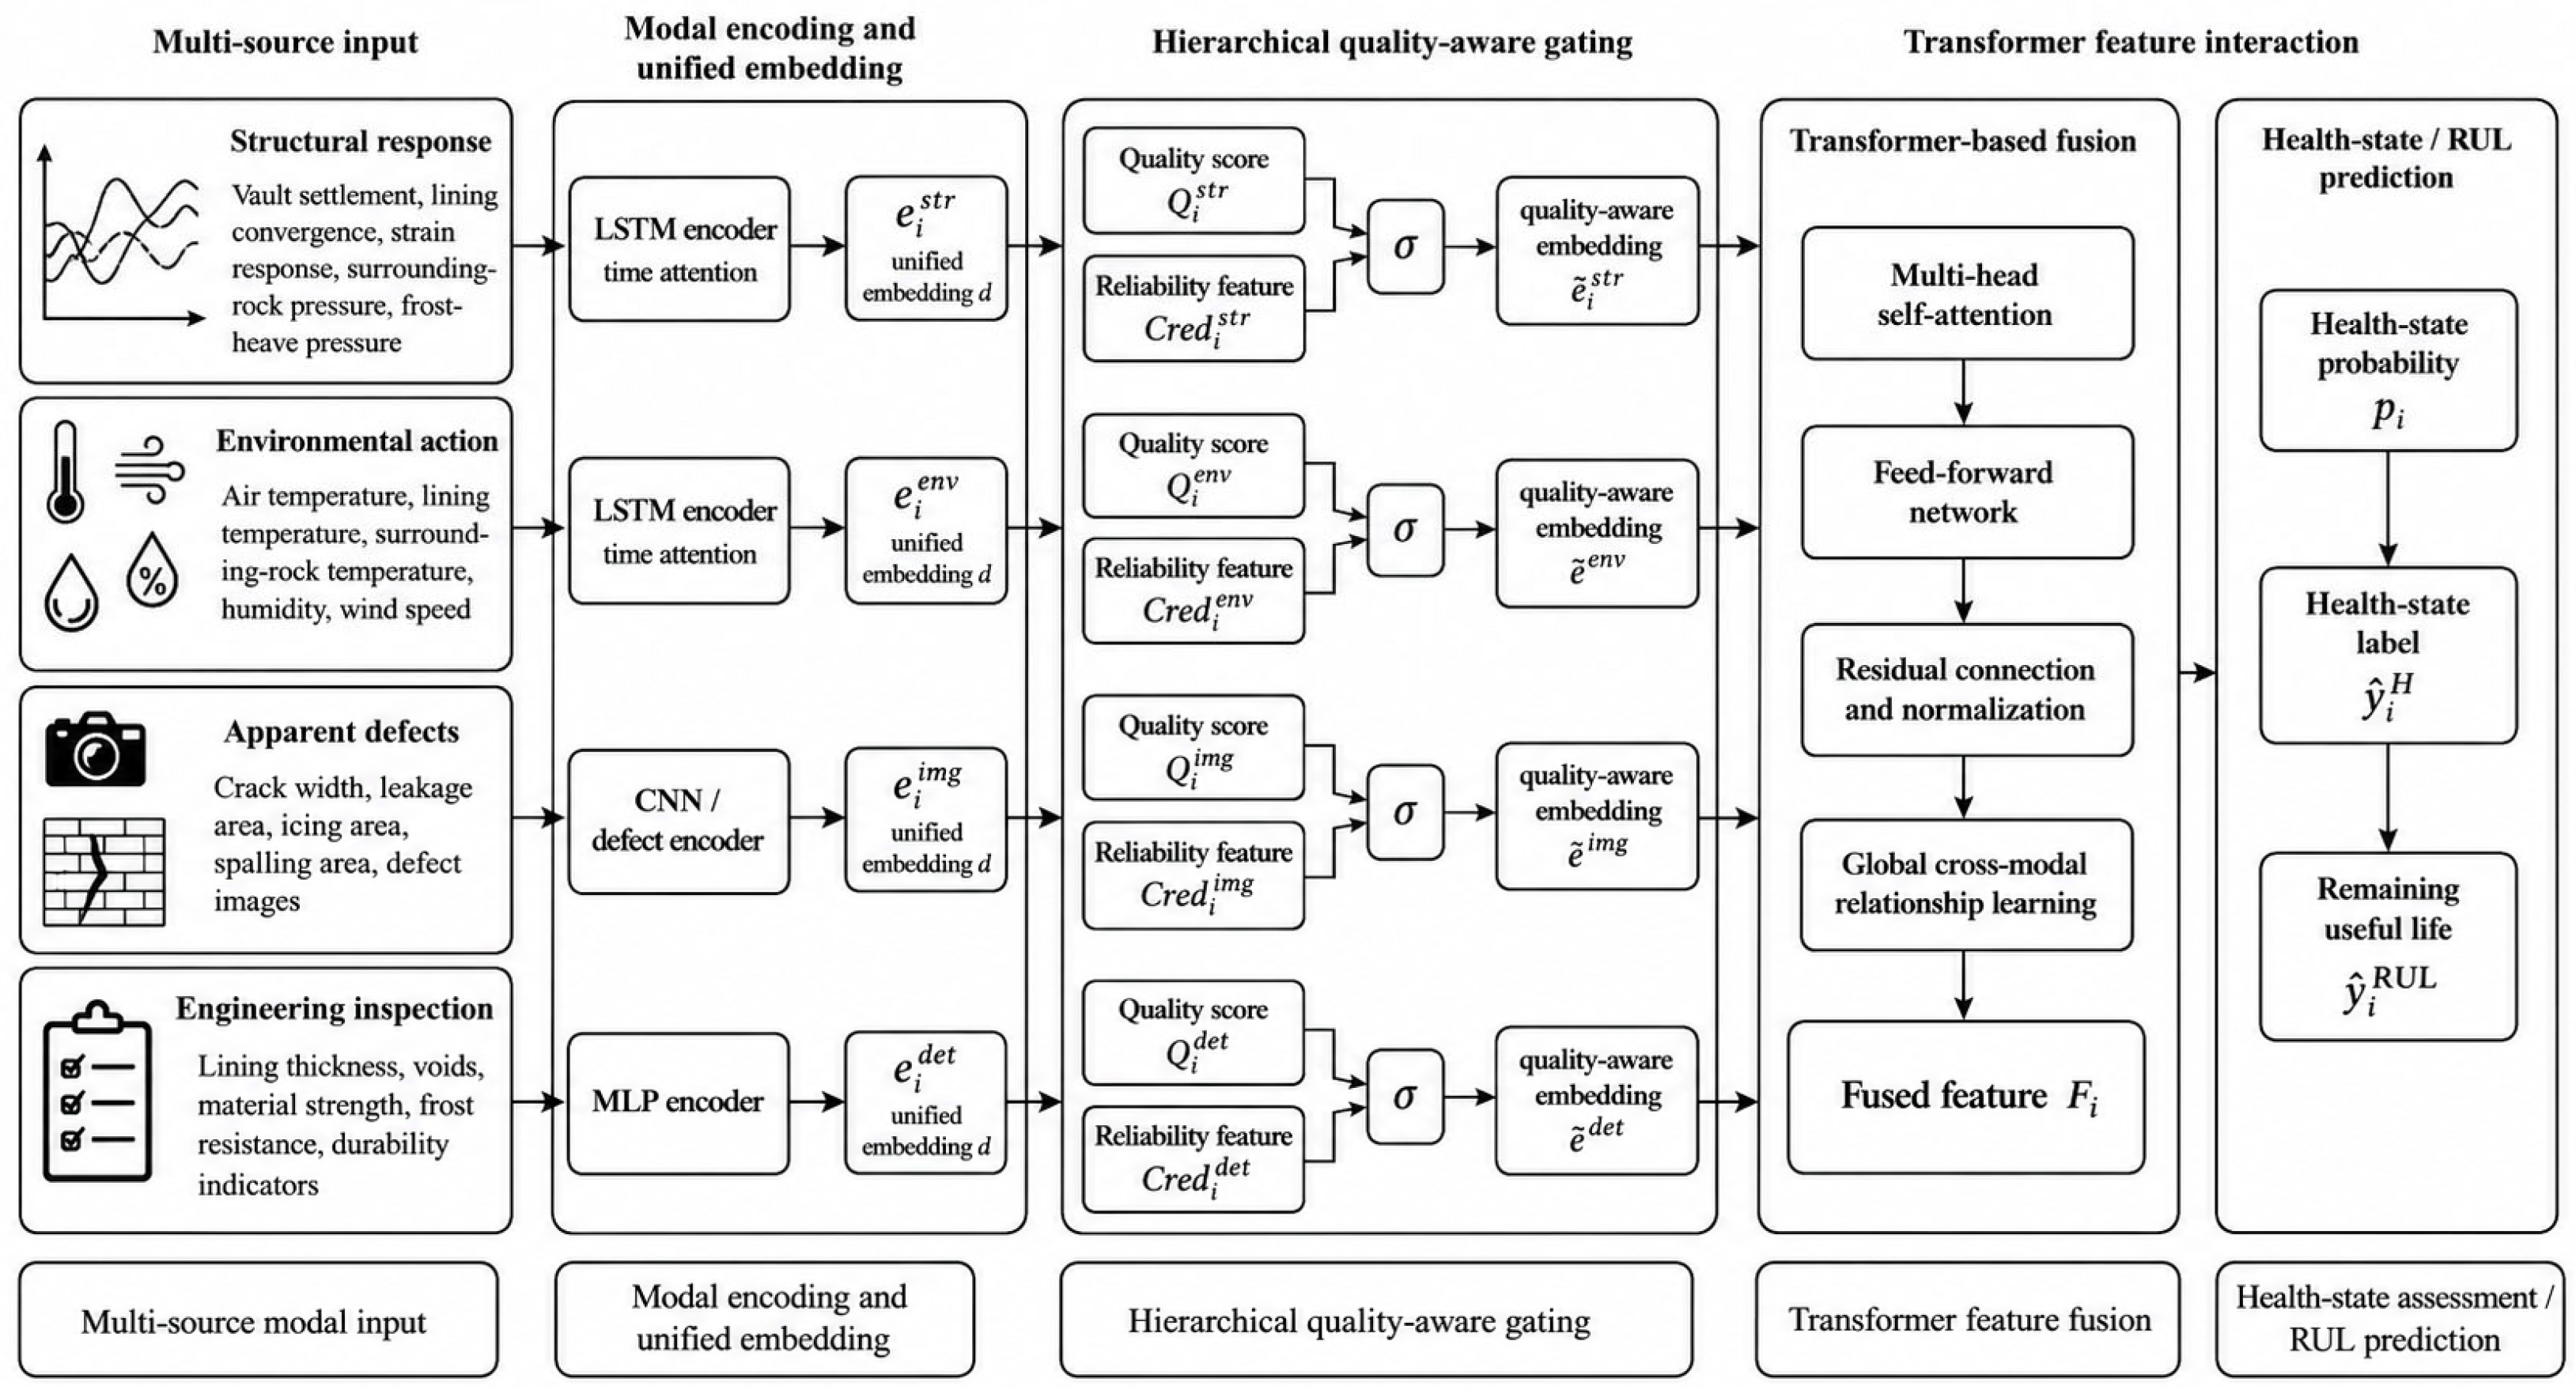
Figure 2 illustrates the overall architecture of the proposed quality-aware predictive-maintenance framework for cold-region tunnel infrastructure. The framework integrates multimodal monitoring data, including structural response, environmental action, apparent defects, and engineering-inspection information, into a unified modeling pipeline [22]. In the data processing stage, raw multimodal inputs are first organized into window-level samples and evaluated using a five-dimensional data quality assessment system, including completeness, accuracy, consistency, timeliness, and traceability. Based on these quality indicators, a reliability score is computed for each modality. In the feature fusion stage, a reliability-guided gating mechanism is applied to dynamically adjust the contribution of each modality, thereby reducing the influence of low-quality or unreliable data while preserving informative signals under extreme conditions. The gated representations are then processed using LSTM encoders to capture temporal degradation patterns and a Transformer encoder to model global cross-modal dependencies [23,24]. Finally, the fused representation is used for two downstream tasks, including health-state classification and remaining useful life (RUL) prediction, enabling predictive maintenance decision support for tunnel infrastructure in cold-region environments.
Figure 2.
Architecture of the quality-aware LSTM–Transformer fusion model.
2.5. Mathematical Formulation and Derivation of the Proposed Method
The preceding subsections give the conceptual workflow. This subsection states the notation and intended mathematical relations more explicitly. The neural operators themselves are established components; the engineering focus is the connection between data-quality governance and multimodal condition prediction.
2.5.1. Problem Formulation and Sample Notation
For the tunnel segment and time window, the complete sample is denoted as . It consists of four input modalities, a missingness mask, a health-state label, and a remaining useful life (RUL) label:
Here, and denote the structural-response and environmental-action time-series inputs, respectively; represents the apparent-defect modality, which may be either an image tensor or a structured defect feature vector; denotes engineering-inspection indicators; is the modality-level missingness mask; represents the five-level health-state label; and denotes the remaining useful life (RUL) label in days. For temporal modalities, the aligned input matrices are written as:
where denotes the window length, and and represent the numbers of structural and environmental features after standardization, respectively. The apparent-defect and engineering-inspection modalities are represented as:
This formulation enables temporally dense monitoring records, intermittent inspection results, and image-derived defect features to be aligned through a common sample index, without requiring all modalities to share the same sampling frequency.
2.5.2. Five-Dimension Data-Quality Scores and Reliability Weights
For each sample and modality , a five-dimension data-quality vector is defined as follows:
The five components correspond to completeness, accuracy, consistency, timeliness, and traceability, respectively. Completeness is computed by comparing the number of valid observations with the number of expected observations within a given time window:
Accuracy captures physically invalid measurements, calibration deviations, and abrupt abnormal fluctuations:
Consistency evaluates the degree to which data from different sources can be aligned under unified units, coding rules, timestamps, and spatial references. It is computed as a weighted aggregation of four consistency sub-indicators:
Timeliness penalizes delayed data storage or delayed manual verification. If the mean delay exceeds the admissible maximum delay , the timeliness score is set to zero:
Traceability indicates whether data provenance, acquisition mode, processing version, and quality flags are fully recorded and verifiable during subsequent maintenance analysis:
The composite modal quality score is then computed using a task-oriented quality-weight vector and a modality-emphasis vector :
This normalization ensures that remains within the interval [0, 1], even when different modalities emphasize distinct quality dimensions. The reliability score further incorporates both the intrinsic reliability of the data source and penalties associated with interpolation, manual correction, or suspicious observations:
Here, denotes the source-reliability coefficient, and represents the quality penalty term. Finally, the sample weight used in the multi-task learning objective is lower bounded by , ensuring that low-quality but potentially informative samples are not entirely excluded from training:
Equations (4)–(12) formalize the transformation of field data governance into trainable model constraints. Rather than treating data quality as a purely preprocessing step, quality information is propagated into both the optimization objective and the fusion mechanism.
The task-level base-weight vector ω was re-audited from two rounds of authentic expert consultation. Each round contained 323 valid questionnaire records; 229 records per round had an expert-authority coefficient Cr ≥ 0.70, with mean Cr = 0.8059. Kendall coordination increased from W = 0.00636 (χ2 = 5.826, df = 4, p = 0.2125) in Round 1 to W = 0.33753 (χ2 = 309.177, df = 4, p < 0.001) in Round 2, indicating convergence of the five-dimension rankings.
For group AHP, 65 questionnaires satisfied both Cr ≥ 0.70 and an individual judgment-matrix consistency ratio below 0.10. Pairwise judgments were aggregated using a Cr-weighted geometric mean. The resulting weights for completeness, accuracy, consistency, timeliness, and traceability were 0.05478, 0.13262, 0.13722, 0.22794, and 0.44745, respectively (λmax = 5.20386, CI = 0.05097, and group CR = 0.04550). One-at-a-time +10% perturbations produced a maximum absolute weight change of 0.02366 without altering the dimensional ranking, demonstrating the consistency and sensitivity stability of the expert-derived weight vector. The weights were fixed before predictive analysis and subsequently evaluated using a target-independent field panel from three operational tunnels. The initial RUL index, cumulative target damage, response-derived deterioration rate, and other target-proximal variables were excluded before data partitioning. Two-way fixed-effects models further controlled for physical degradation, traffic loading, environmental severity, and data-source complexity, while chronological, segment-grouped, and leave-one-tunnel-out evaluations prevented temporal and spatial leakage. Under this design, lagged quality instability remained significantly associated with the subsequent state-error index, and the inclusion of quality information produced statistically significant improvements in cross-tunnel predictive performance. These results jointly support the logical consistency, sensitivity robustness, and independent operational relevance of the expert-derived quality weights.
2.5.3. Degradation-Oriented Derived Features
The derived features are designed to capture degradation mechanisms that cannot be fully represented by instantaneous measurements. The temperature zero-crossing frequency, which characterizes freeze–thaw activity, is defined as:
For any time-series feature , the local degradation trend slope is estimated using least squares regression:
Cross-modal coupling is quantified using the Pearson correlation coefficient between two aligned sequences:
Stability is measured using the coefficient of variation:
The cumulative freeze–thaw fatigue damage is defined based on Miner’s linear damage accumulation rule:
where denotes the observed number of freeze–thaw cycles at intensity level , and represents the allowable number of cycles before reaching the fatigue threshold. Equations (13)–(17) ensure consistency between feature construction and the physical process of environmental loading, structural response, defect evolution, and lifecycle degradation.
2.5.4. Temporal Encoding, Quality-Aware Gating and Cross-Modal Attention
Structural response and environmental action are encoded using separate LSTM modules. For modality , the hidden state at time step is computed as:
A temporal attention mechanism is introduced to emphasize critical degradation events, such as zero-crossing transitions, sustained negative-temperature exposure, spring thaw periods, and localized water-pressure variations. The attention score and aggregated temporal representation are defined as:
The apparent-defect and engineering-inspection modalities are encoded as:
All modal hidden representations are projected into a shared embedding space:
The quality-aware gating mechanism integrates latent features, composite quality scores, and reliability information:
The four gated modality embeddings are then stacked to form the cross-modal token matrix:
Transformer-based attention is subsequently applied to model global interdependencies across modalities. The query, key, and value matrices are computed via linear projections:
The multi-head self-attention mechanism operates on the complete temporal embedding sequence rather than on an isolated time-step vector. Let denote the input embedding matrix, where is the sequence length and is the embedding dimension. For the h-th attention head, the query, key, and value matrices are obtained as
where , , and are learnable projection matrices. The output of each attention head is calculated using scaled dot-product attention:
where denotes the query and key dimension and is the number of attention heads. The outputs of all heads are concatenated and projected back to the common embedding space:
where is the learnable output-projection matrix and is the value dimension of each attention head. This formulation enables the model to capture complementary temporal dependencies and cross-feature interactions within different representation subspaces. When the representation at a specific time step is required, it is obtained from the corresponding row of the sequence-level attention output, denoted by .
The final fused representation is obtained through residual connection, normalization and a feed-forward network. This design enables the model to capture whether high temperature zero-crossing frequency amplifies crack-growth dynamics or whether low traceability suppresses unreliable inspection signals.
2.5.5. Prediction Heads, Multi-Task Loss and Robustness Training
The health-state classifier and RUL regressor are defined as:
The model is trained using a quality-weighted multi-task objective:
The robustness test applies a single-step signed-gradient perturbation to the standardized continuous-input space. Each continuous feature is first standardized using the mean and standard deviation calculated from the training partition:
The perturbed input is then generated as
where denotes the trained prediction model, is the task-specific loss function, is the reference target, and controls the perturbation magnitude. The lower and upper clipping bounds, and , are determined exclusively from the standardized training data. In the robustness experiment, was set to 0.15. The perturbation was applied only to continuous numerical variables, while categorical variables, binary indicators, padding masks, and target variables remained unchanged. This procedure evaluates the sensitivity of the model to bounded worst-direction disturbances while maintaining every perturbed feature within its admissible training range.
Model performance is evaluated using health-state classification accuracy and RUL prediction error:
Model robustness was evaluated using both standardized Gaussian perturbation and modality-specific operational-failure scenarios. For the Gaussian perturbation, zero-mean noise was added to continuous numerical inputs after z-standardization according to where and . Accordingly, this condition is defined as a Gaussian perturbation with a standard deviation of 0.15 in the standardized feature space. Additional tests covered five operational-failure modes: a linearly accumulated sensor drift reaching 0.15 standard deviations, four consecutive missing time steps within each 24-step sequence, complete loss of one modality, a two-step timestamp offset between structural and environmental sequences, and random occlusion covering 15% of the inspection-image area. Missing observations were processed using the training-derived imputation rule and an explicit missingness mask; unavailable modalities were assigned a zero-reliability gate; and shifted sequence positions were masked without circular wrapping. All perturbations were applied to the fixed held-out test set without model retraining, and robustness was quantified using health-state accuracy, RUL MAPE, and performance degradation relative to the unperturbed condition. Throughout the manuscript, “15% noise” is therefore replaced with the precise term “Gaussian perturbation with η = 0.15”.
Equations (28)–(33) complete the computational sequence connecting quality weighting, reliability-guided modality gating, cross-modal interaction, multi-task prediction, and robustness evaluation. The latent-feature gate, scalar availability mask, and four-token modality representation follow Equations (23) and (24).
Each gate is estimated independently using a sigmoid function and therefore controls the contribution of individual latent features within its corresponding modality. Unlike softmax-based modality attention, the gates are not constrained to sum to one across modalities. This design permits several reliable modalities to remain simultaneously active, attenuates low-quality features without redistributing their weights to other modalities, and completely suppresses an unavailable modality when . The resulting modality-token matrix is then processed by the cross-modal attention module and shared multi-task representation before health-state classification and RUL regression. The complete computational procedure is summarized in Table 5.
Table 5.
Algorithmic implementation of the proposed quality-aware cross-modal fusion method.
2.6. Model Training and Evaluation Metrics
The framework was implemented in Python 3.14.6 and PyTorch 2.13.0. All continuous variables were standardized using means and standard deviations calculated exclusively from the training partition, and the same parameters were applied unchanged to validation and test data. The 1200 samples were constructed as non-overlapping 24-step windows with a stride of 24 time steps. For chronological evaluation, the windows were ordered by monitoring time and divided into the earliest 70% for training, the subsequent 15% for validation, and the most recent 15% for testing, yielding 840, 180, and 180 windows, respectively. A one-window temporal gap was maintained between adjacent subsets. Windows associated with the same inspection event, image group, or segment–period identifier were assigned to a single subset. Spatial generalization was evaluated separately using leave-one-segment-out validation, in which all observations from the held-out segment were excluded from model training and parameter selection. Cross-site generalization was further assessed using leave-one-tunnel-out validation across three operational tunnels, with two tunnels used for model development and the third retained exclusively for external testing. This combined chronological, segment-grouped, and tunnel-independent design prevents overlap-induced, temporal, spatial, and cross-site information leakage.
Health-state classification was evaluated using overall accuracy, balanced accuracy, class-wise precision, recall and F1-score, macro-F1, weighted-F1, weighted Cohen’s kappa, and the complete confusion matrix. RUL prediction was evaluated using MAE, RMSE, MAPE, and R2, together with split-conformal 95% prediction-interval coverage and mean interval width. Robustness was assessed under Gaussian perturbation in the standardized numerical-input space and under modality-specific sensor drift, block missingness, complete modality loss, timestamp misalignment, and image occlusion. The leakage-resistant and cross-tunnel comparative experiments were repeated using five fixed random seeds and summarized using confidence intervals; matched quality-aware and quality-agnostic configurations were compared using paired Wilcoxon signed-rank tests. These evaluation procedures jointly quantify classification discrimination, RUL prediction error, uncertainty calibration, robustness, statistical stability, and generalization across time, tunnel segments, and independent operational tunnels. The principal model parameters used in the case study are summarized in Table 6.
Table 6.
Main model parameters used in the case study.
2.7. Computational Workflow and Reproducibility Protocol
The workflow comprises multimodal alignment, window construction, quality evaluation, feature screening, model training, and audit-output generation. Structural, environmental, defect, and inspection data are aligned by tunnel segment and monitoring time and organized into non-overlapping 24-step windows with a stride of 24. Dataset partitioning is completed before preprocessing. Standardization, imputation, feature screening, quality-threshold calibration, and admissible-range determination use training data only, and the resulting parameters are applied unchanged to validation and test sets. Windows from the same segment–period, inspection event, or image group remain in one subset.
The model is implemented in Python and PyTorch using five fixed seeds (11, 23, 37, 53, and 71). It comprises two two-layer LSTM encoders, a four-stage CNN, two MLP encoders, reliability-guided modality gates, and a two-layer, four-head Transformer with a 128-dimensional embedding. AdamW optimization, early stopping, gradient clipping, and minimum-validation-loss checkpointing are used. Inspection images are resized to 224 × 224 pixels and processed through convolution, batch normalization, ReLU activation, pooling, and global average pooling. Training-stage augmentation includes horizontal flipping, small-angle rotation, brightness and contrast adjustment, and random erasing. Image grouping is completed before augmentation to prevent cross-subset leakage.
Each prediction is accompanied by its quality profile, source-reliability coefficient, availability mask, modality-gate values, health-state probabilities, predicted RUL, uncertainty interval, and principal contributing features. These outputs provide a traceable connection between data quality, multimodal contribution, model prediction, and engineering interpretation.
2.8. Leakage-Resistant Cross-Tunnel Validation
An independent field panel was used to evaluate the predictive relevance of data-quality information across three operational tunnels. The dataset contains 600 segment–month observations from 25 tunnel segments monitored between January 2024 and December 2025, together with 19,200 feature-level quality records. The evaluated outcomes include the state-error index, risk-error index, and RUL-contraction rate derived from model predictions, engineering inspections, and maintenance records. Initial RUL index, cumulative target damage, response-derived deterioration rates, and other target-proximal variables were excluded from all validation models.
Three complementary evaluation designs were applied. Two-way fixed-effects models controlled for segment characteristics, monitoring month, physical degradation, traffic loading, environmental severity, and data-source complexity, with standard errors clustered by segment. Chronological validation used 2025 observations as the held-out period. Cross-site validation followed a leave-one-tunnel-out procedure in which two tunnels were used for model development and the third was retained exclusively for testing, repeated for all three tunnels and five fixed seeds.
Ridge regression, random forest, histogram gradient boosting, and MLP early fusion were evaluated using matched control-only and control-plus-quality specifications. Predictive performance was measured using MAE and R2, and quality-related improvements were tested using paired Wilcoxon signed-rank tests. Split-conformal 95% prediction intervals were constructed using segment-grouped calibration data and evaluated exclusively on the held-out tunnel. Additional analyses examined individual quality dimensions, admission thresholds from 0.65 to 0.80, reverse temporal associations, sensor drift, block missingness, timestamp misalignment, image occlusion, and complete modality loss. Fixed seeds and processing specifications are documented in the main text; the underlying operational materials are maintained under controlled access in accordance with the Data Availability Statement.
3. Case Study and Dataset
3.1. Project Description
The primary case study concerns an operational highway tunnel in the alpine cold region of northwestern China. The site experiences prolonged sub-zero temperatures, repeated spring freeze–thaw transitions, groundwater seepage, ventilation-induced thermal exchange, and sustained traffic loading. The principal deterioration modes include lining cracking, leakage, icing, localized spalling, deformation, and material durability loss. Tunnel identity and geographic coordinates are anonymized in accordance with the infrastructure data-management agreement.
The primary dataset contains 1200 non-overlapping 24-step monitoring windows constructed with a stride of 24 time steps. Each window integrates synchronized structural-response and environmental sequences, corresponding inspection images and structured defect descriptors, and the latest available engineering-inspection record. Windows associated with the same segment–period and inspection campaign are maintained within a single data subset. The dataset covers five health-state levels, three freeze–thaw intensity categories, four seasonal stages, and RUL values ranging from 30 to 514 days, with a mean of 247.8 days. The monitoring window constitutes the unit of model analysis, while temporal and spatial dependence is controlled through chronological partitioning, segment-grouped evaluation, and independent cross-tunnel validation. External validation additionally uses 600 segment–month observations from 25 segments distributed across three operational tunnels. The distribution of the 1200 window-level samples is summarized in Table 7.
Table 7.
Distribution of the 1200 window-level samples.
3.2. Representative Samples and Modal Quality Profile
The representative samples indicate that temperature zero-crossing frequency, frost-heave pressure, and crack width generally increase with the deterioration of the tunnel health state, while the remaining useful life (RUL) correspondingly decreases. This trend is consistent with the underlying degradation mechanism of cold-region tunnel linings.
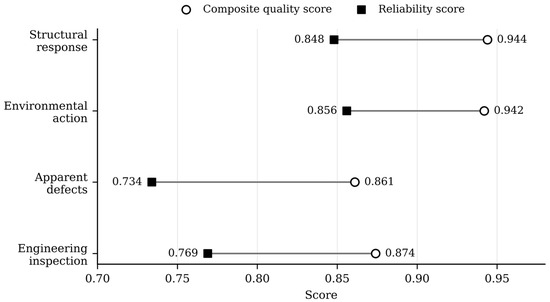
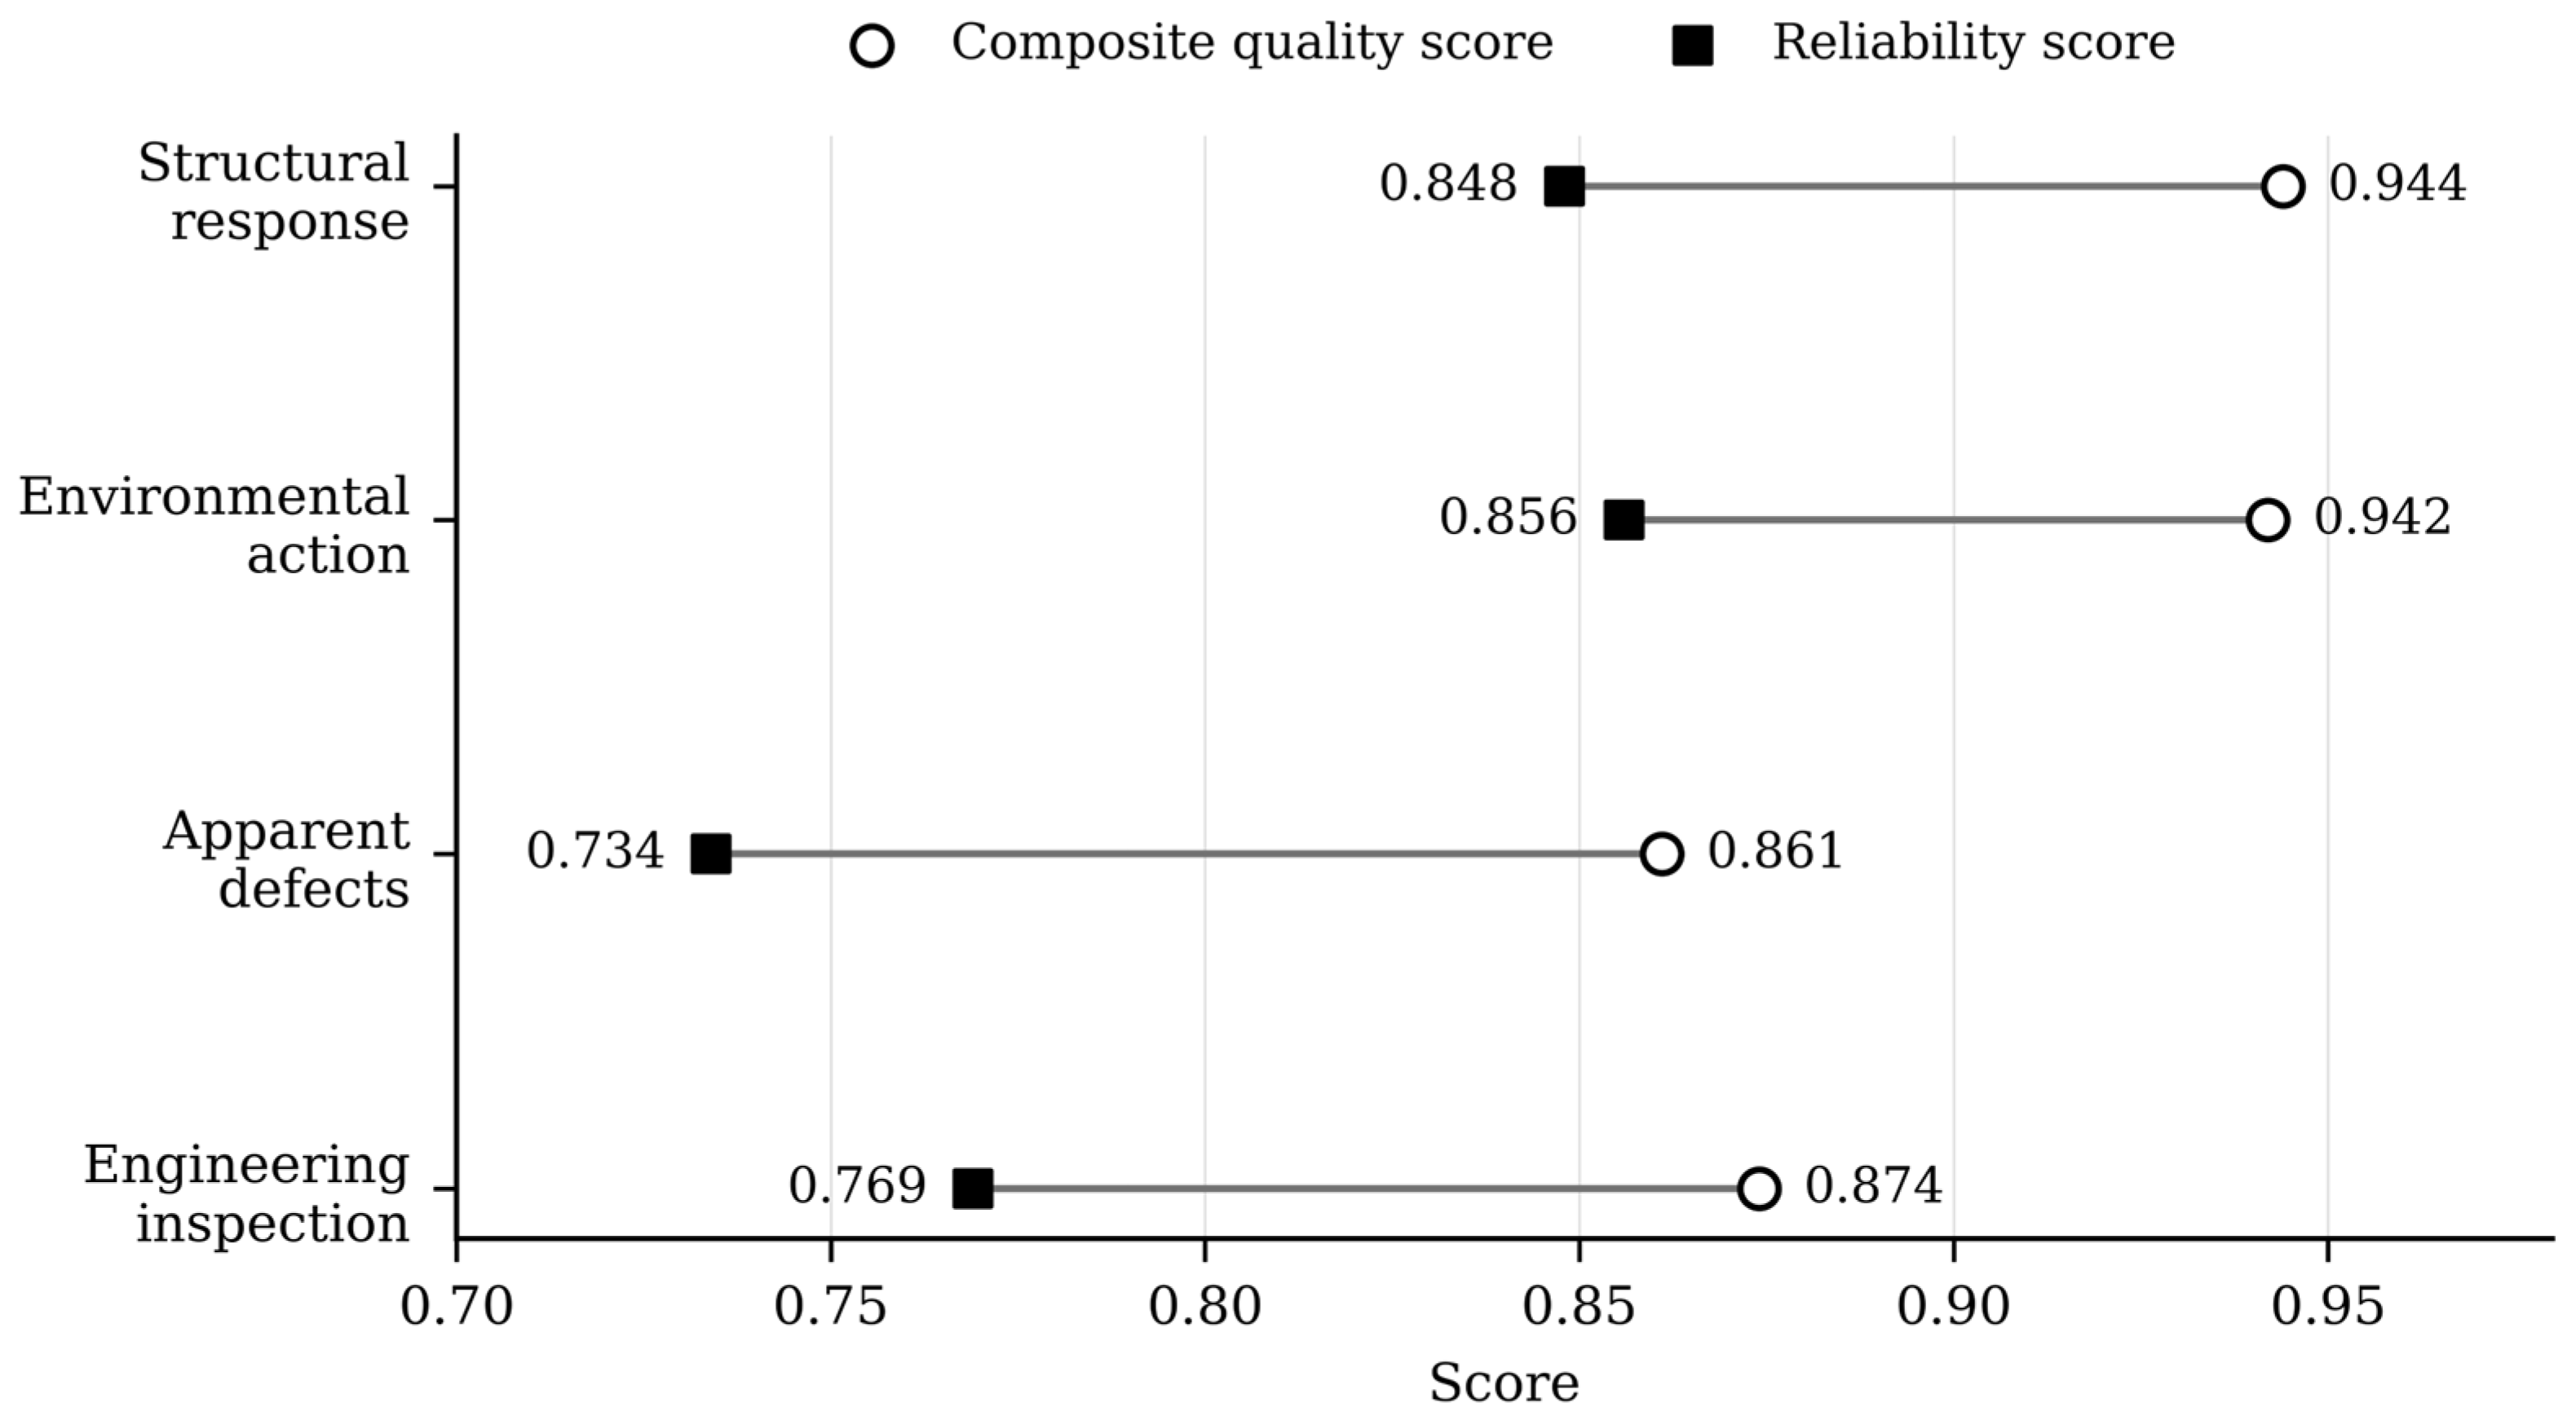
Figure 3 compares the modality-level composite quality and source-reliability scores, with 95% confidence intervals obtained from 2000 segment-clustered bootstrap resamples. The apparent-defect modality produced the lowest mean quality and reliability scores, at 0.861 and 0.734, respectively, compared with 0.944 and 0.848 for structural response, 0.942 and 0.856 for environmental action, and 0.874 and 0.769 for engineering inspection. Pairwise differences were evaluated using cluster-aware permutation tests with Holm correction for multiple comparisons. The lower apparent-defect scores primarily reflect image occlusion, motion blur, illumination variation, incomplete defect localization, and delays in manual verification. These results support the use of modality-specific reliability gating, which reduces the contribution of degraded defect information while retaining complementary evidence from structural, environmental, and engineering-inspection modalities.
Figure 3.
Average quality and reliability profile by modality.
Representative anonymized window-level samples are provided in Table 8.
Table 8.
Representative window-level samples after anonymization.
3.3. Label Construction, Sample Admission and Engineering Consistency
Health-state labels were determined through independent engineering adjudication. Three tunnel-inspection specialists reviewed inspection reports, defect images, maintenance records, and serviceability assessments while remaining blinded to model predictions and data-quality scores. Levels I–V represent normal, mildly degraded, moderately degraded, severely degraded, and intervention-required conditions, respectively. A label was accepted when at least two assessors agreed; disagreements were resolved through a documented consensus review. Inter-assessor consistency was quantified using Fleiss’ kappa. Class-wise precision, recall, F1-score, balanced accuracy, weighted kappa, and the confusion matrix were reported. A target-independent sensitivity analysis additionally excluded crack width, deformation, frost-heave pressure, and material-deterioration indicators used during engineering adjudication.
Following ISO 13381-1:2025 [25], RUL at time t was defined as
where τ is the first subsequent time at which the tunnel segment reaches Level IV or triggers a documented corrective-maintenance intervention. An observed label was assigned when the intervention time occurred within the monitoring period. For right-censored cases, RUL was estimated from the degradation trajectory using information available up to time t, with the maintenance threshold fixed before model training [25]. Each intervention terminated the current degradation episode, and subsequent observations were treated as a new episode with an updated baseline. Observed and estimated labels were identified separately, and evaluation against maintenance outcomes used observed-event cases. Initial RUL index, cumulative target damage, label-derived deterioration rate, and post-maintenance information were excluded from the predictor set.
Sample admission was implemented through a unique segment–time identifier linking sensor signals, environmental measurements, defect records, images, and inspection reports. Duplicate observations were consolidated before window construction, repeated defect records were linked to the same inspection event, and adjacent windows from the same segment were assigned to a common evaluation group. Cross-modal timestamps were required to fall within the specified alignment tolerance; otherwise, the affected modality was masked or the sample was rejected according to its admission status.
Quality issues were recorded and treated at the issue level before being mapped back to unique model windows. Correctable anomalies underwent standardized correction, admissible low-quality observations received reliability weighting or controlled-use status, and records failing the minimum quality threshold were rejected. This procedure maintains a clear distinction between the number of quality-control actions and the number of unique samples entering model development.
4. Results
Table 9, Table 10, Table 11, Table 12 and Table 13 and Figure 4, Figure 5, Figure 6 and Figure 7 present the end-to-end performance, baseline comparison, ablation analysis, robustness evaluation, and parameter sensitivity of the primary tunnel case study. Table 14 and Table 15 and Figure 8, Figure 9 and Figure 10 provide complementary statistical evidence from the independent three-tunnel field panel, including target-independent specifications, two-way fixed effects, chronological testing, leave-one-tunnel-out validation, repeated runs, strong machine-learning baselines, confidence intervals, paired significance tests, and split-conformal uncertainty estimates. Primary case-study results quantify model performance under the complete multimodal configuration, while inferential conclusions regarding reliability and cross-tunnel applicability are established through the independent field-panel analyses.
Table 9.
Effect of data-quality strategy on predictive performance.
Table 10.
Performance comparison with conventional fusion baselines.
Table 11.
Robustness comparison under 15% artificial noise.
Table 12.
Ablation study of the proposed architecture.
Table 13.
Hyperparameter sensitivity analysis.
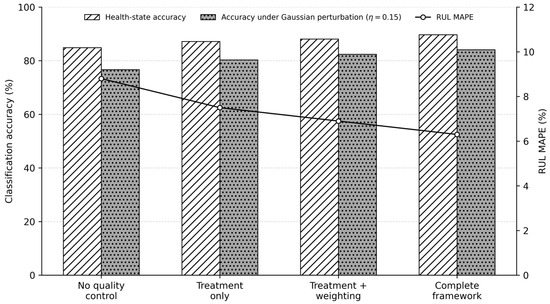
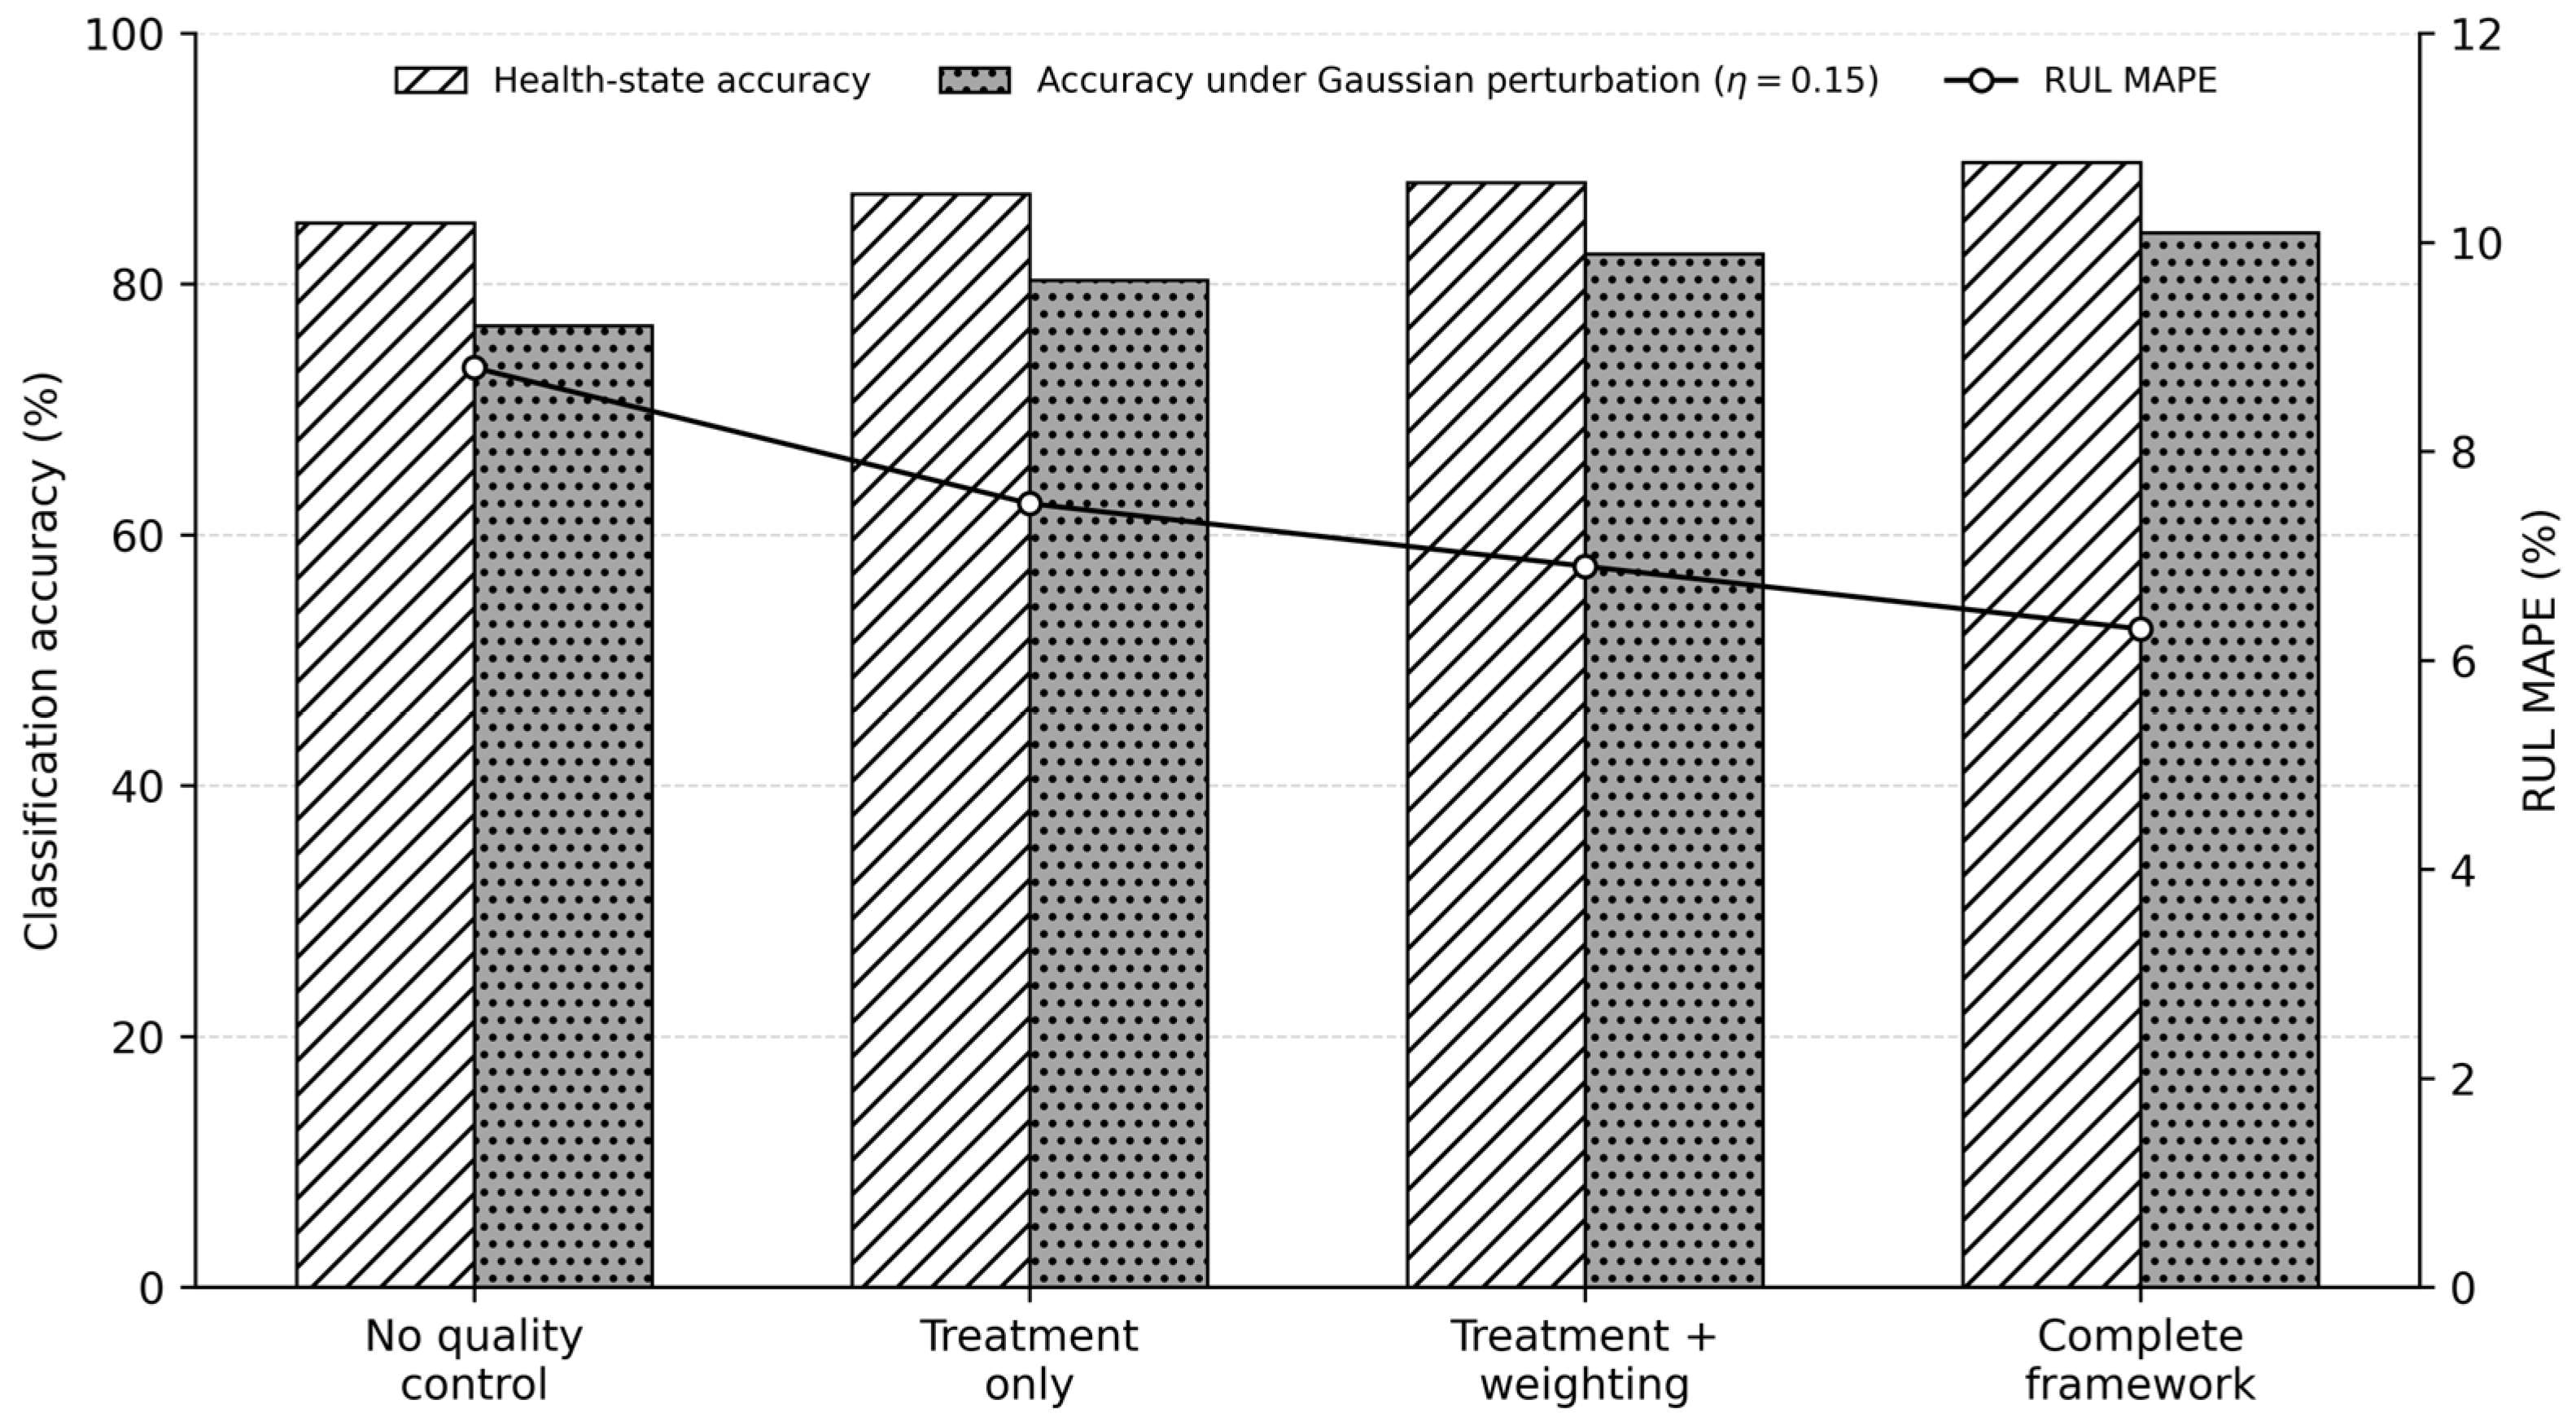
Figure 4.
Effect of data-quality strategy on submitted performance results.
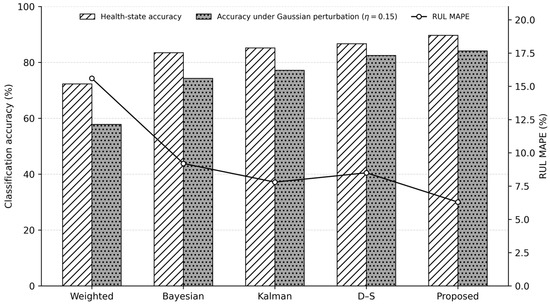
Figure 5.
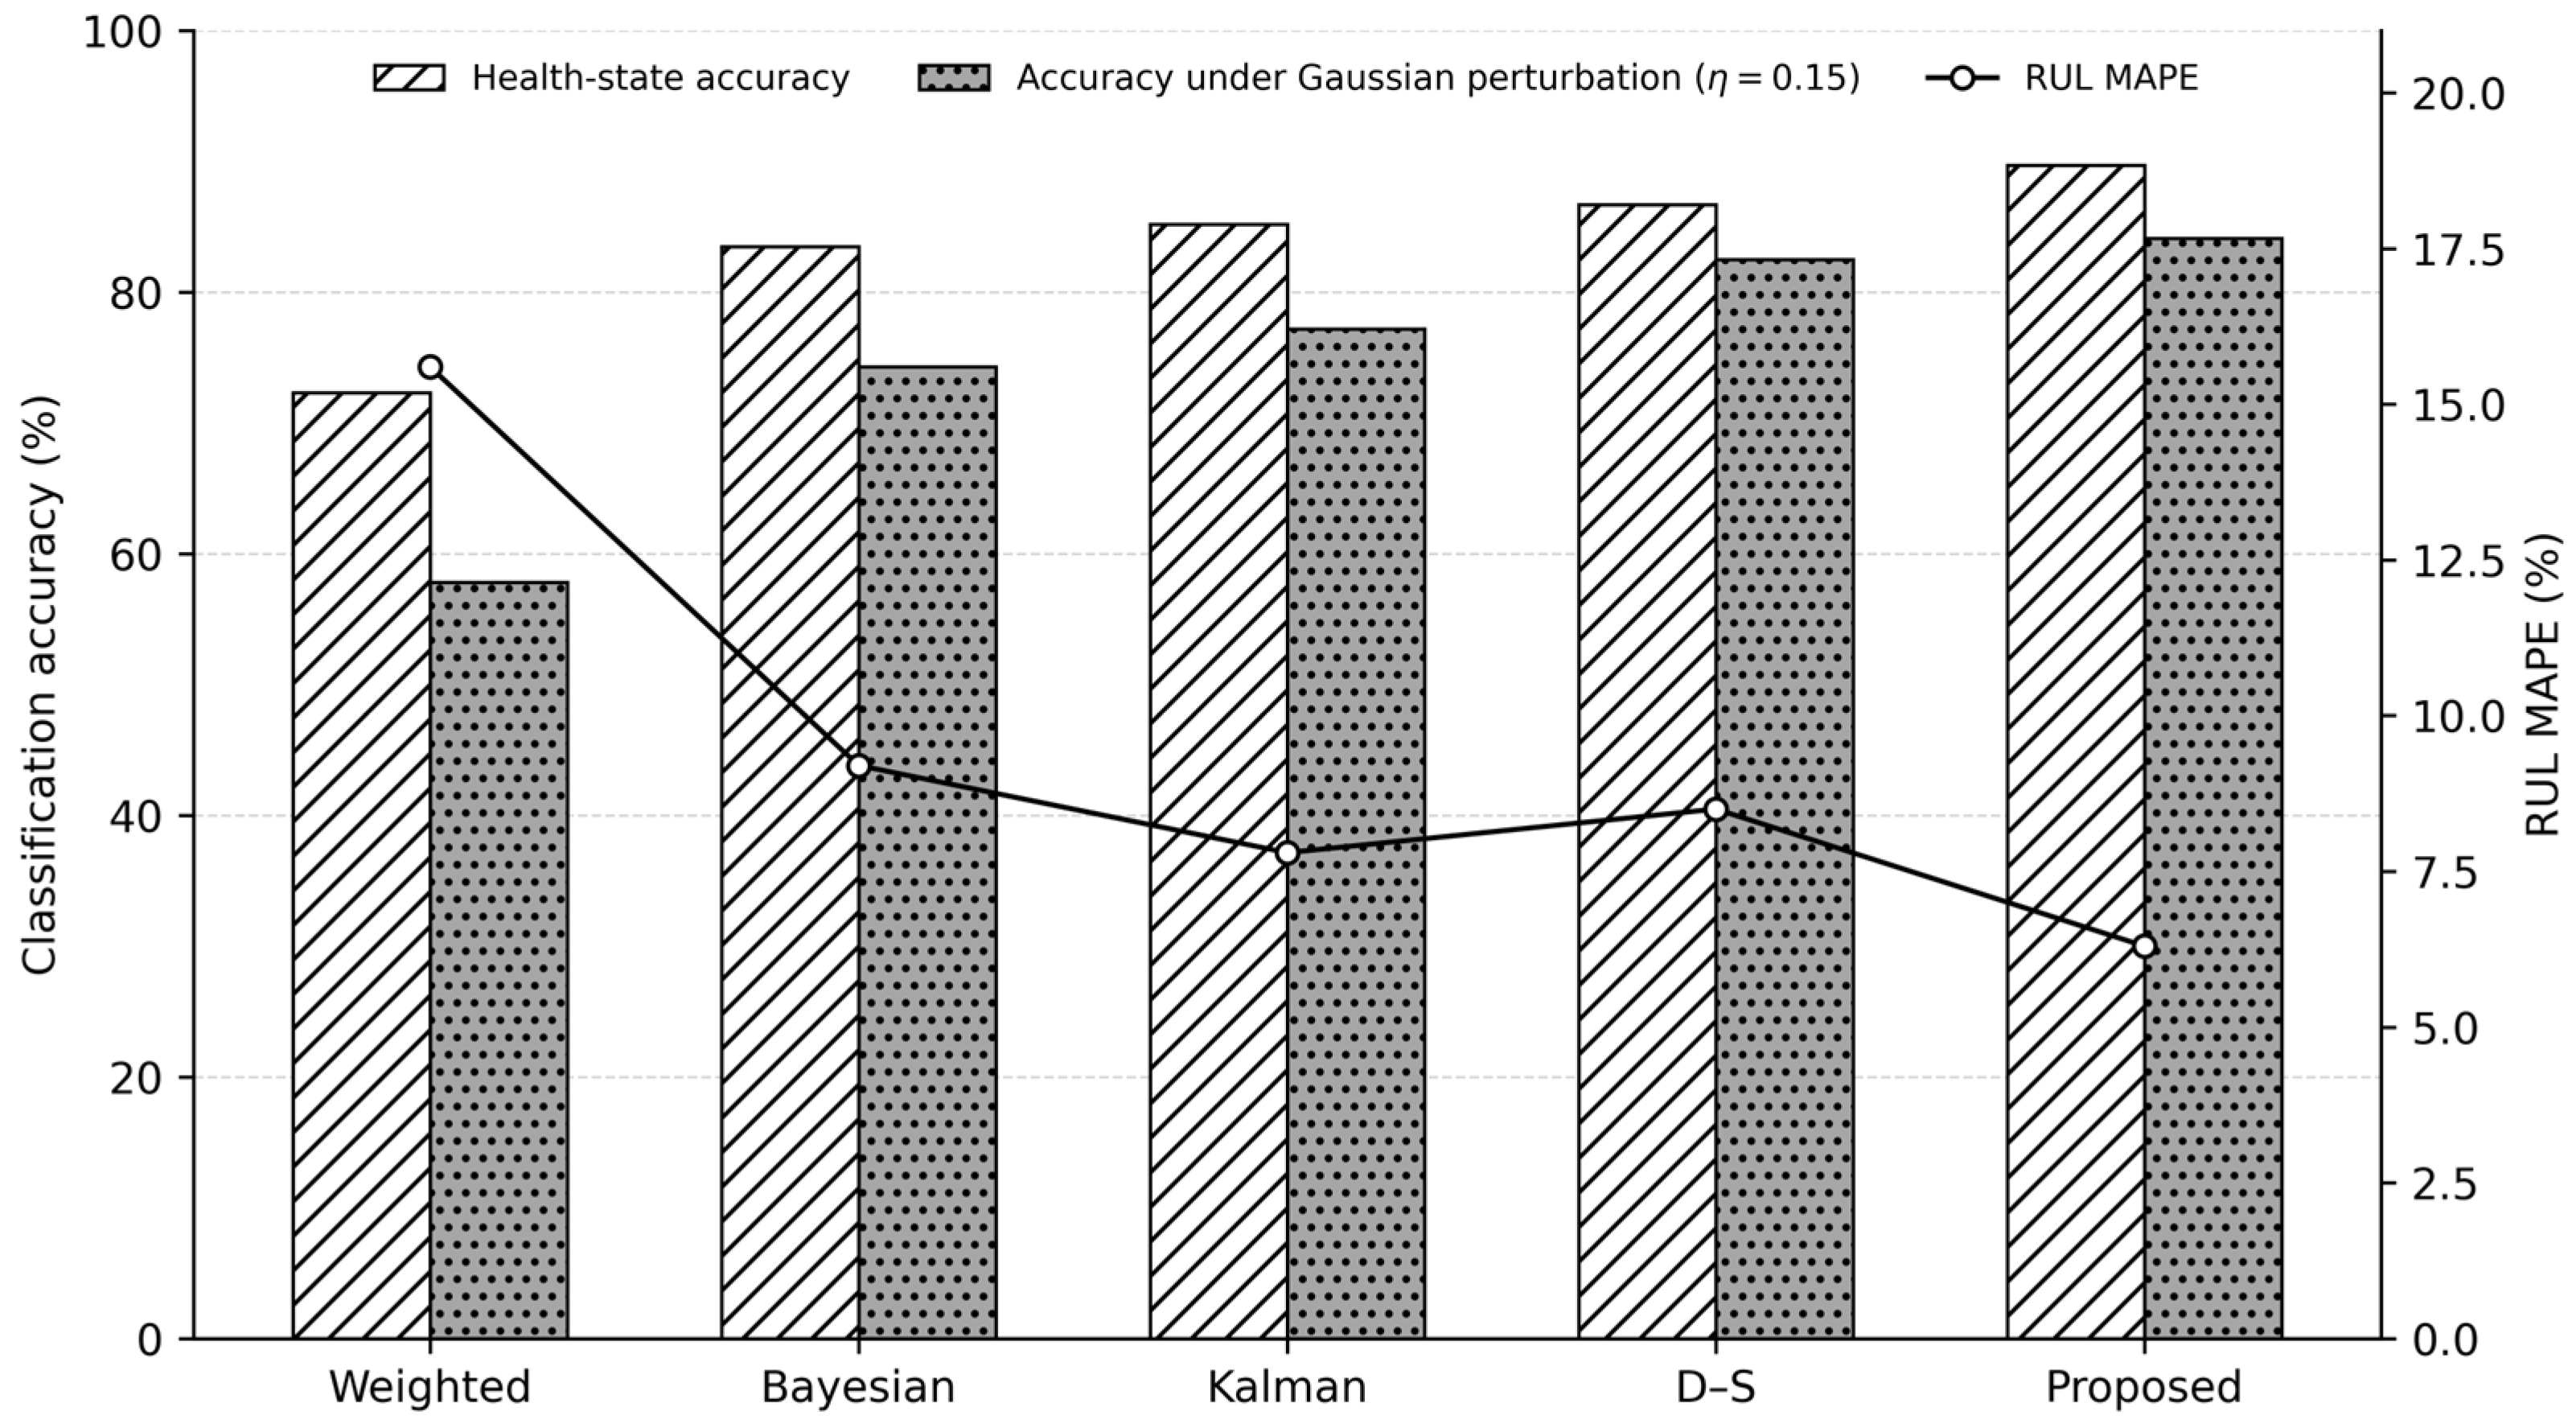
Health-state accuracy and RUL MAPE of conventional fusion baselines and the proposed method.
Figure 6.
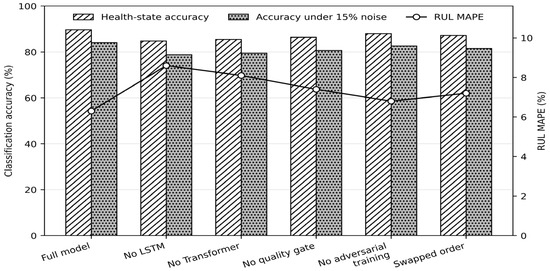
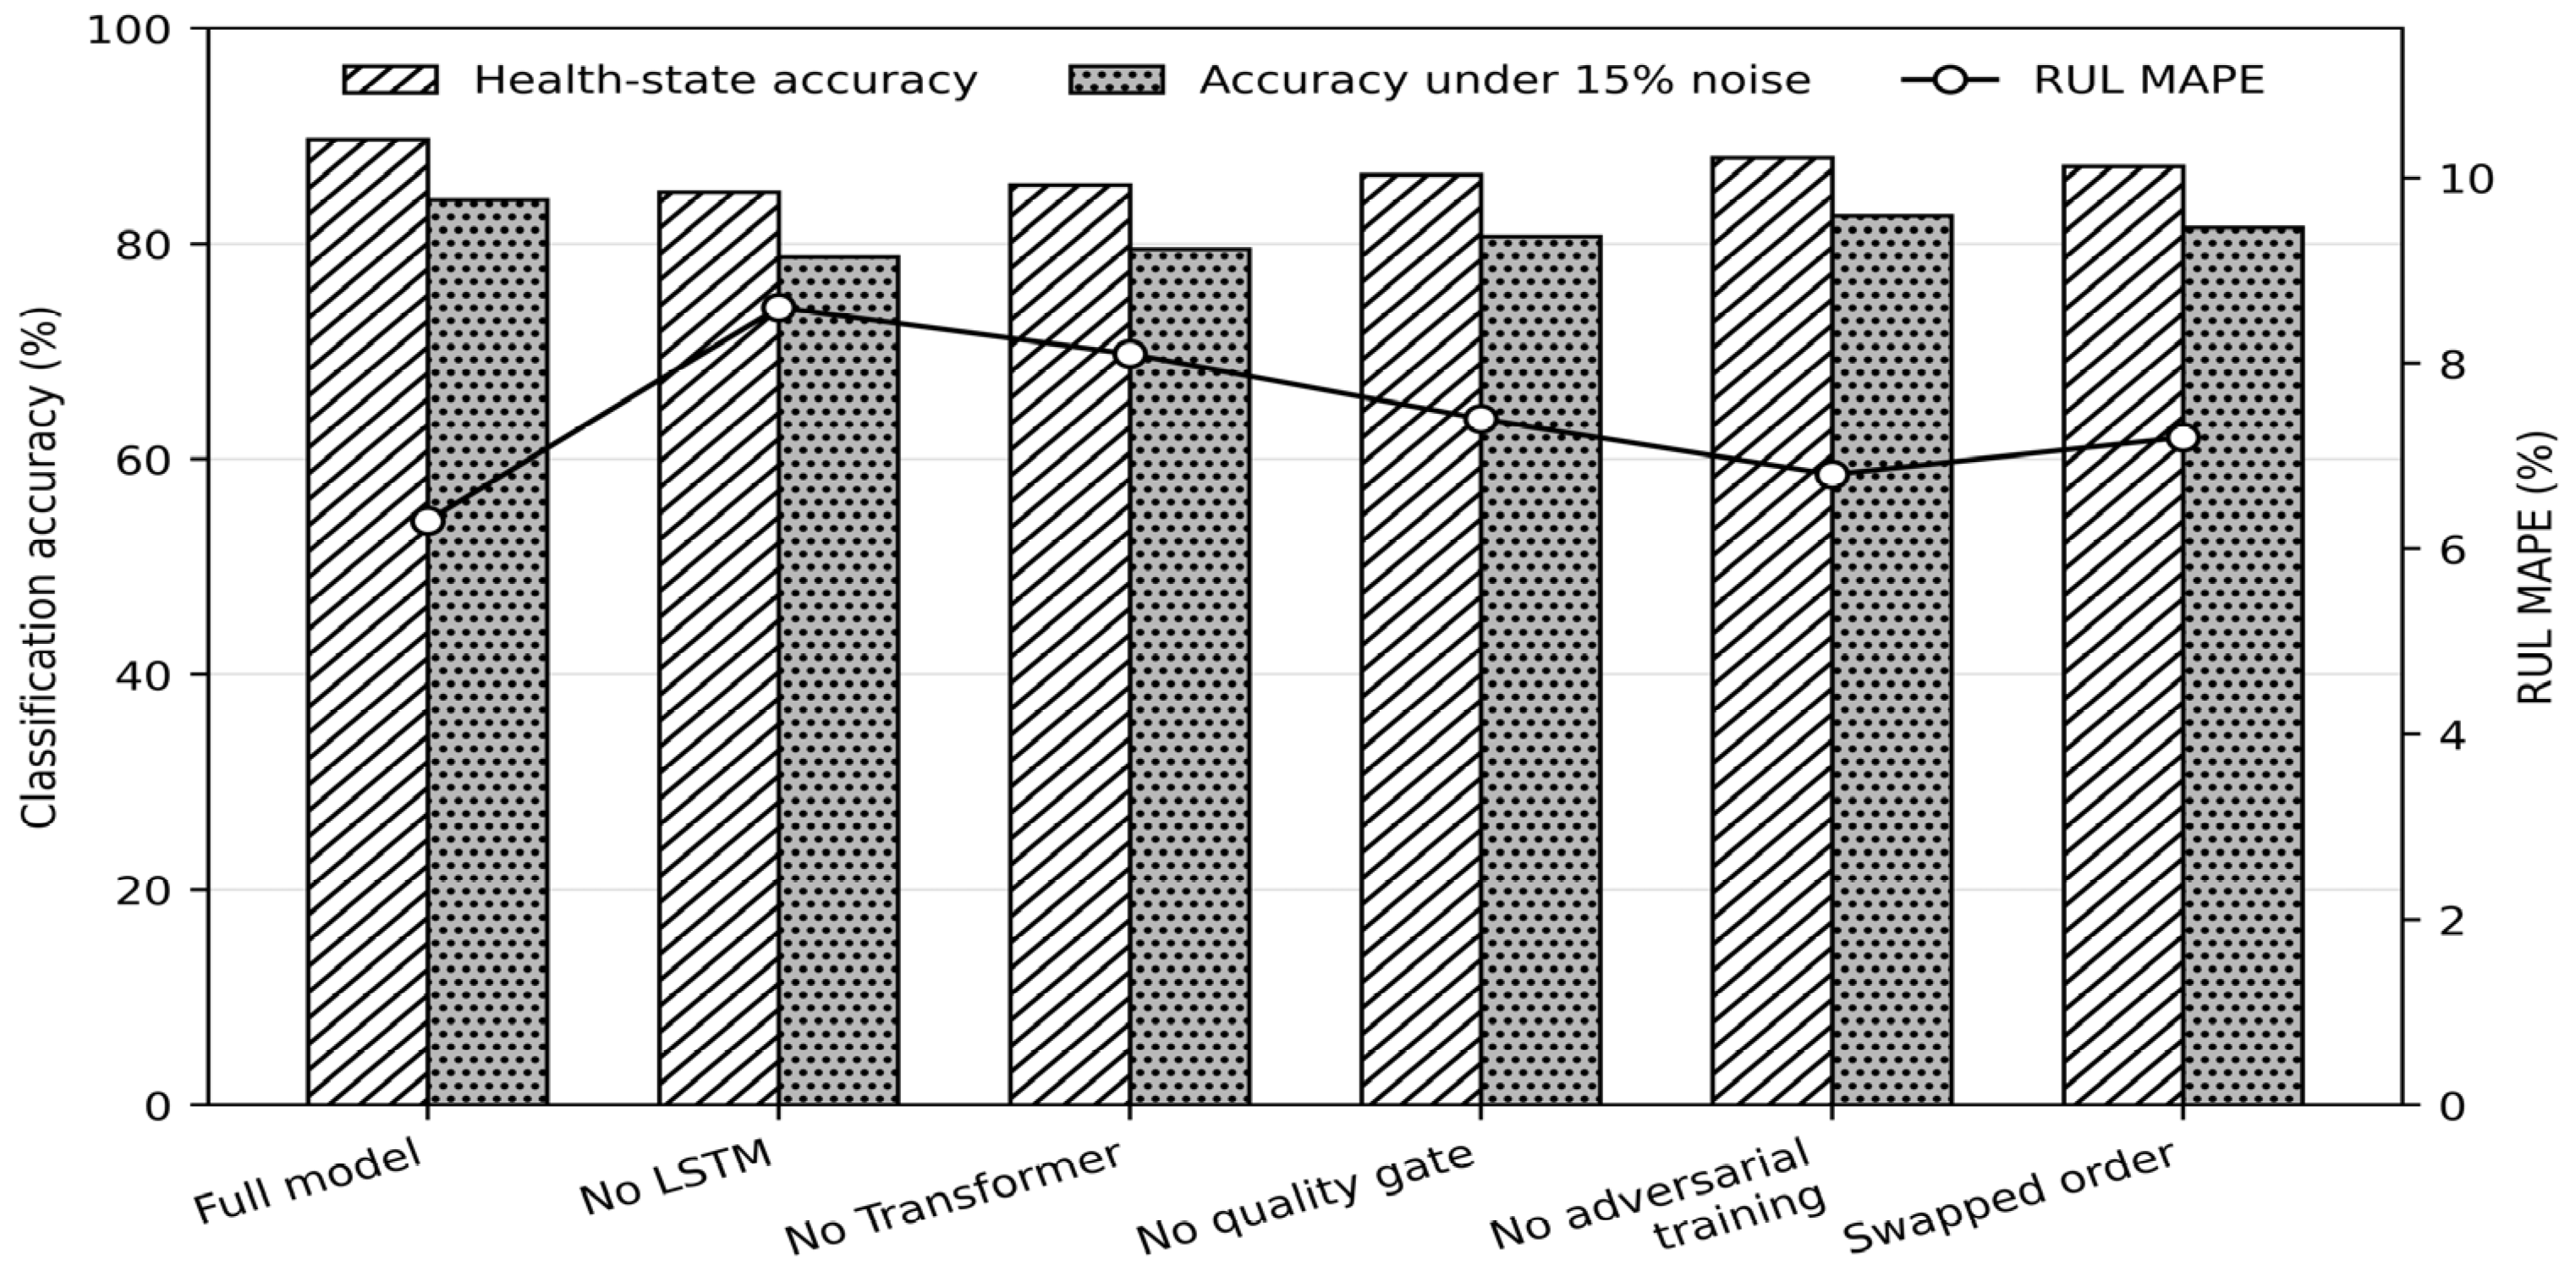
Archived single-run ablation results, redrawn from Table 12.
Figure 7.
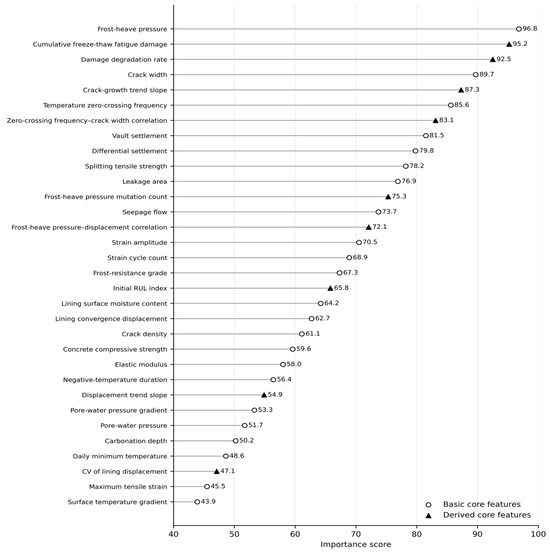
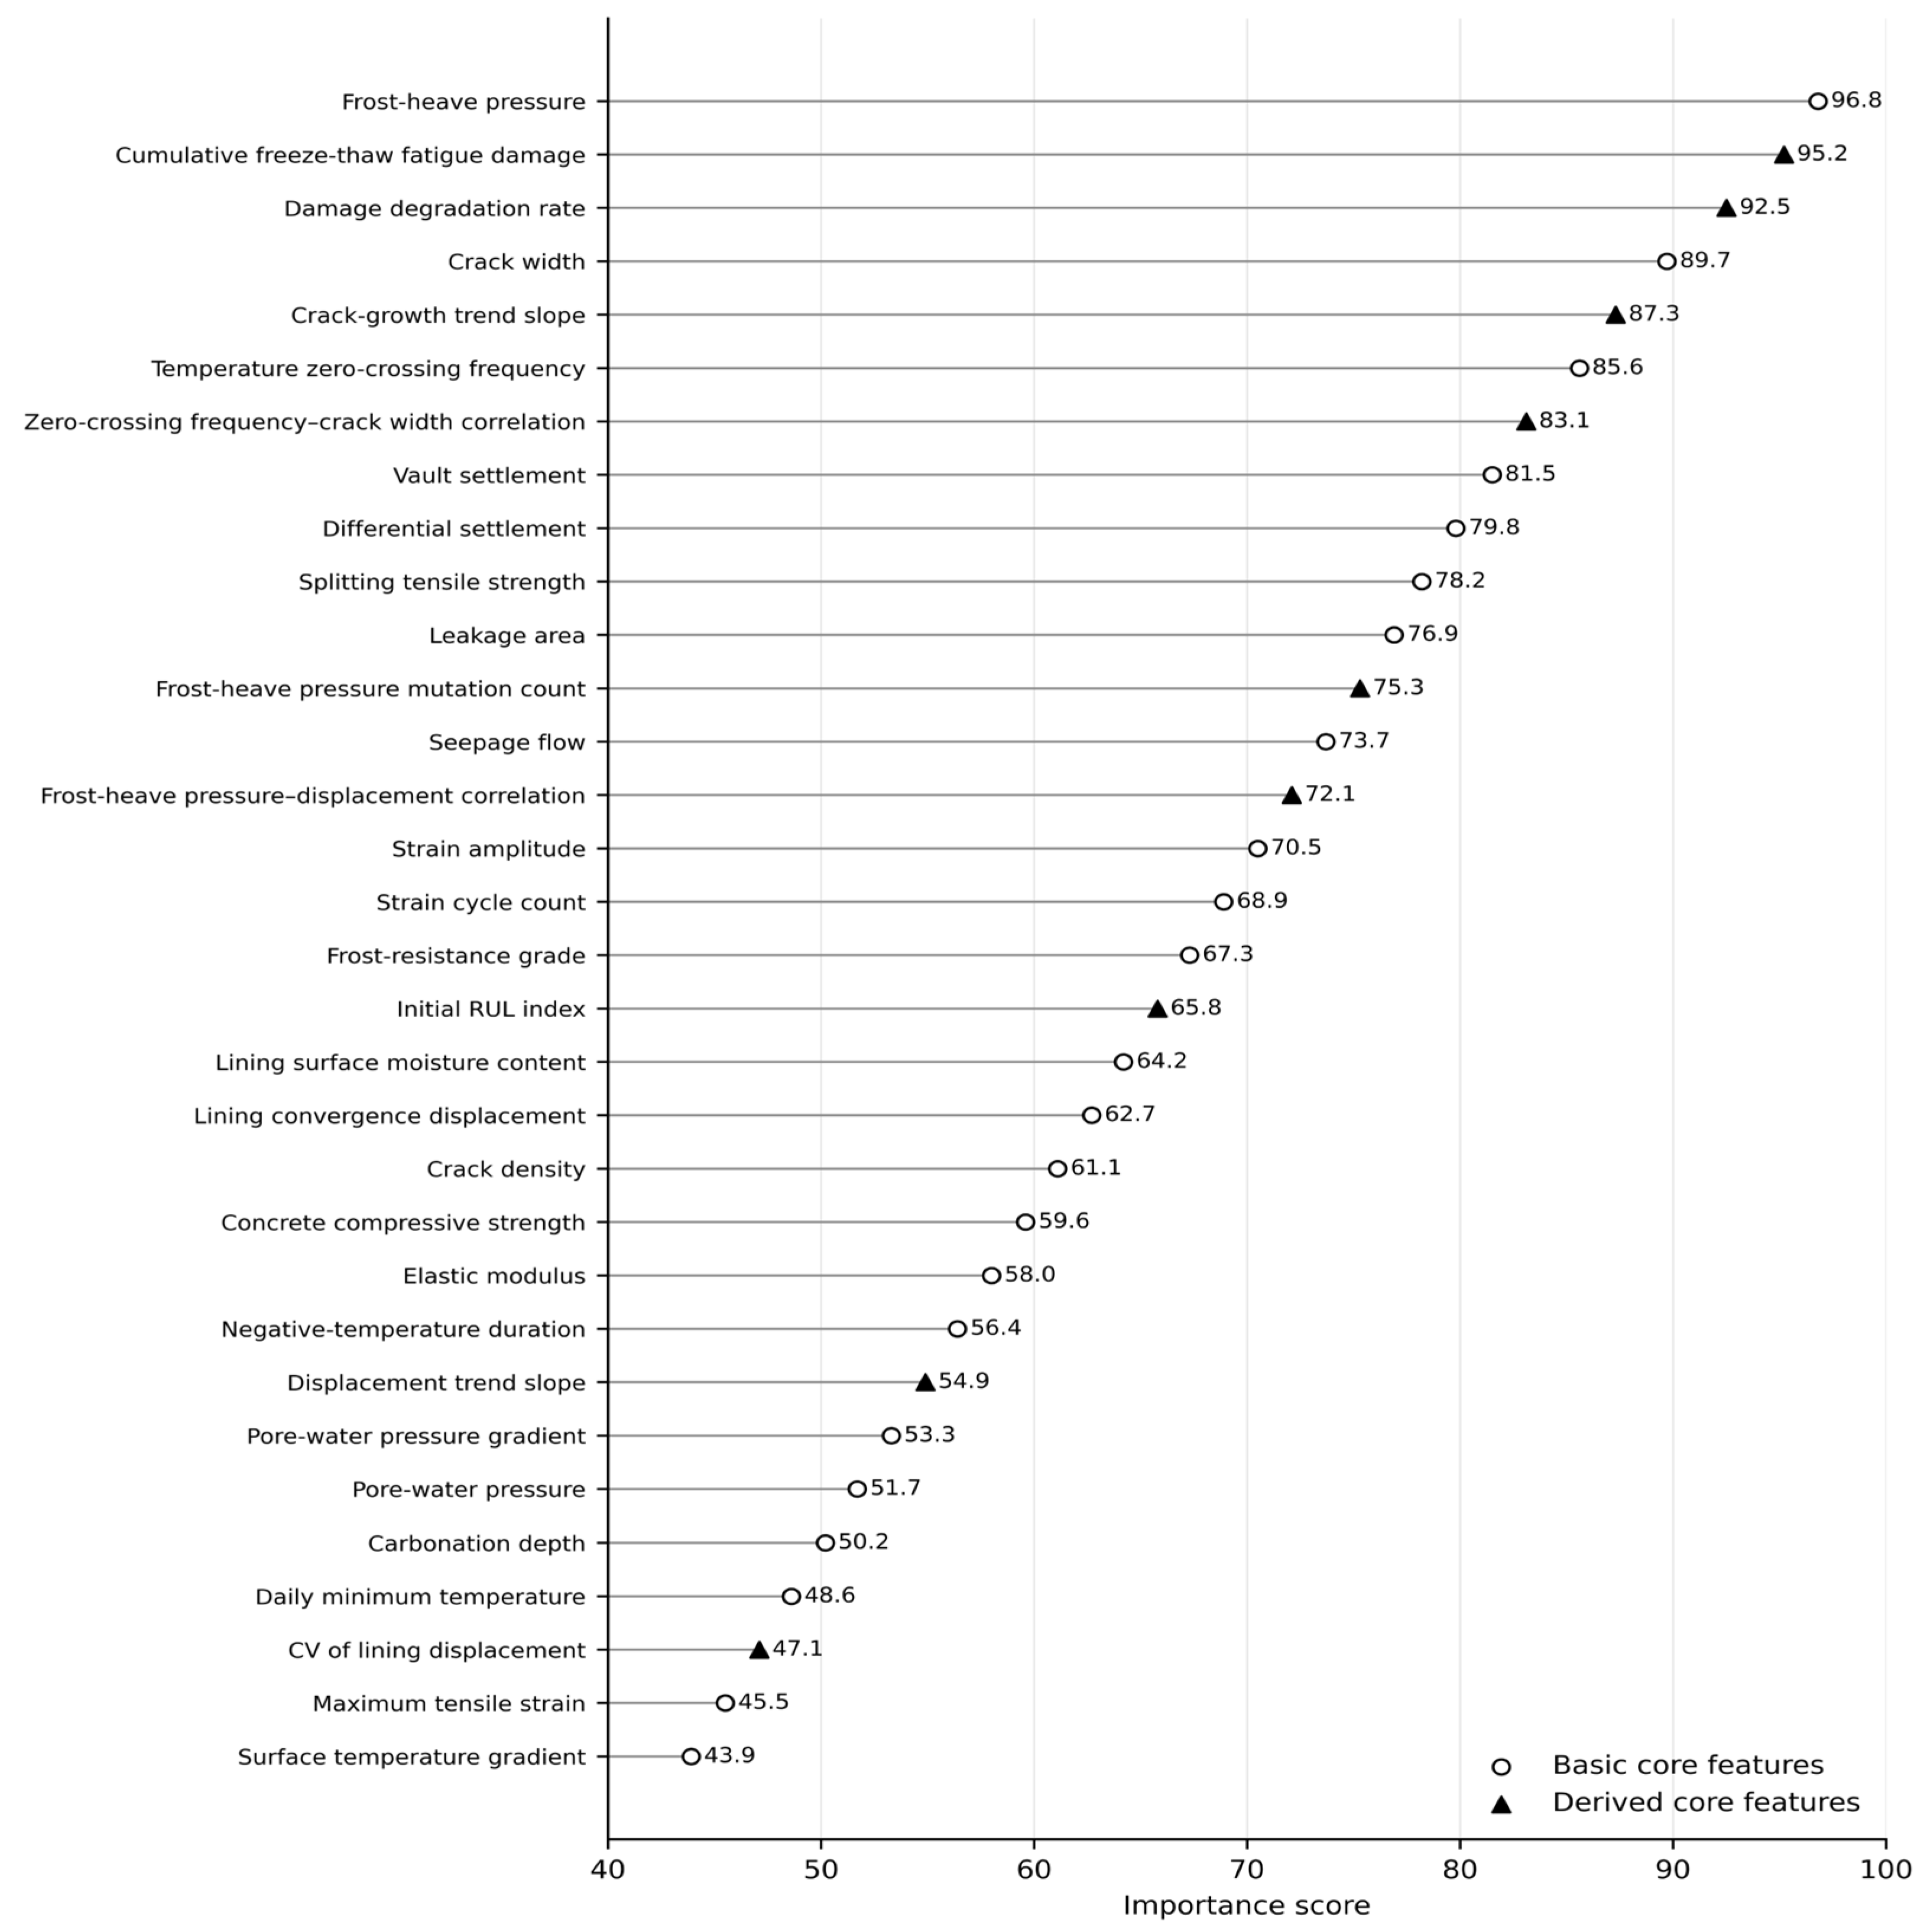
Archived feature-screening importance ranking, reconstructed from the submitted figure; the scores are not presented as causal or final-model SHAP values.
Table 14.
Synthetic stress-test results across five seeds (mean ± 95% confidence-interval half-width). These values are not field observations.
Figure 8.
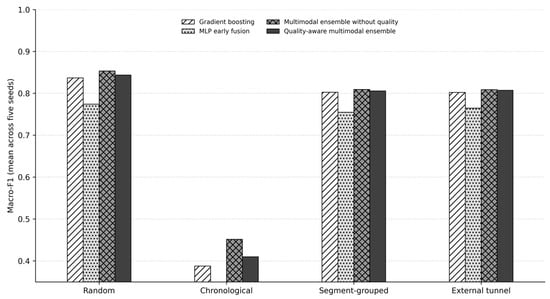
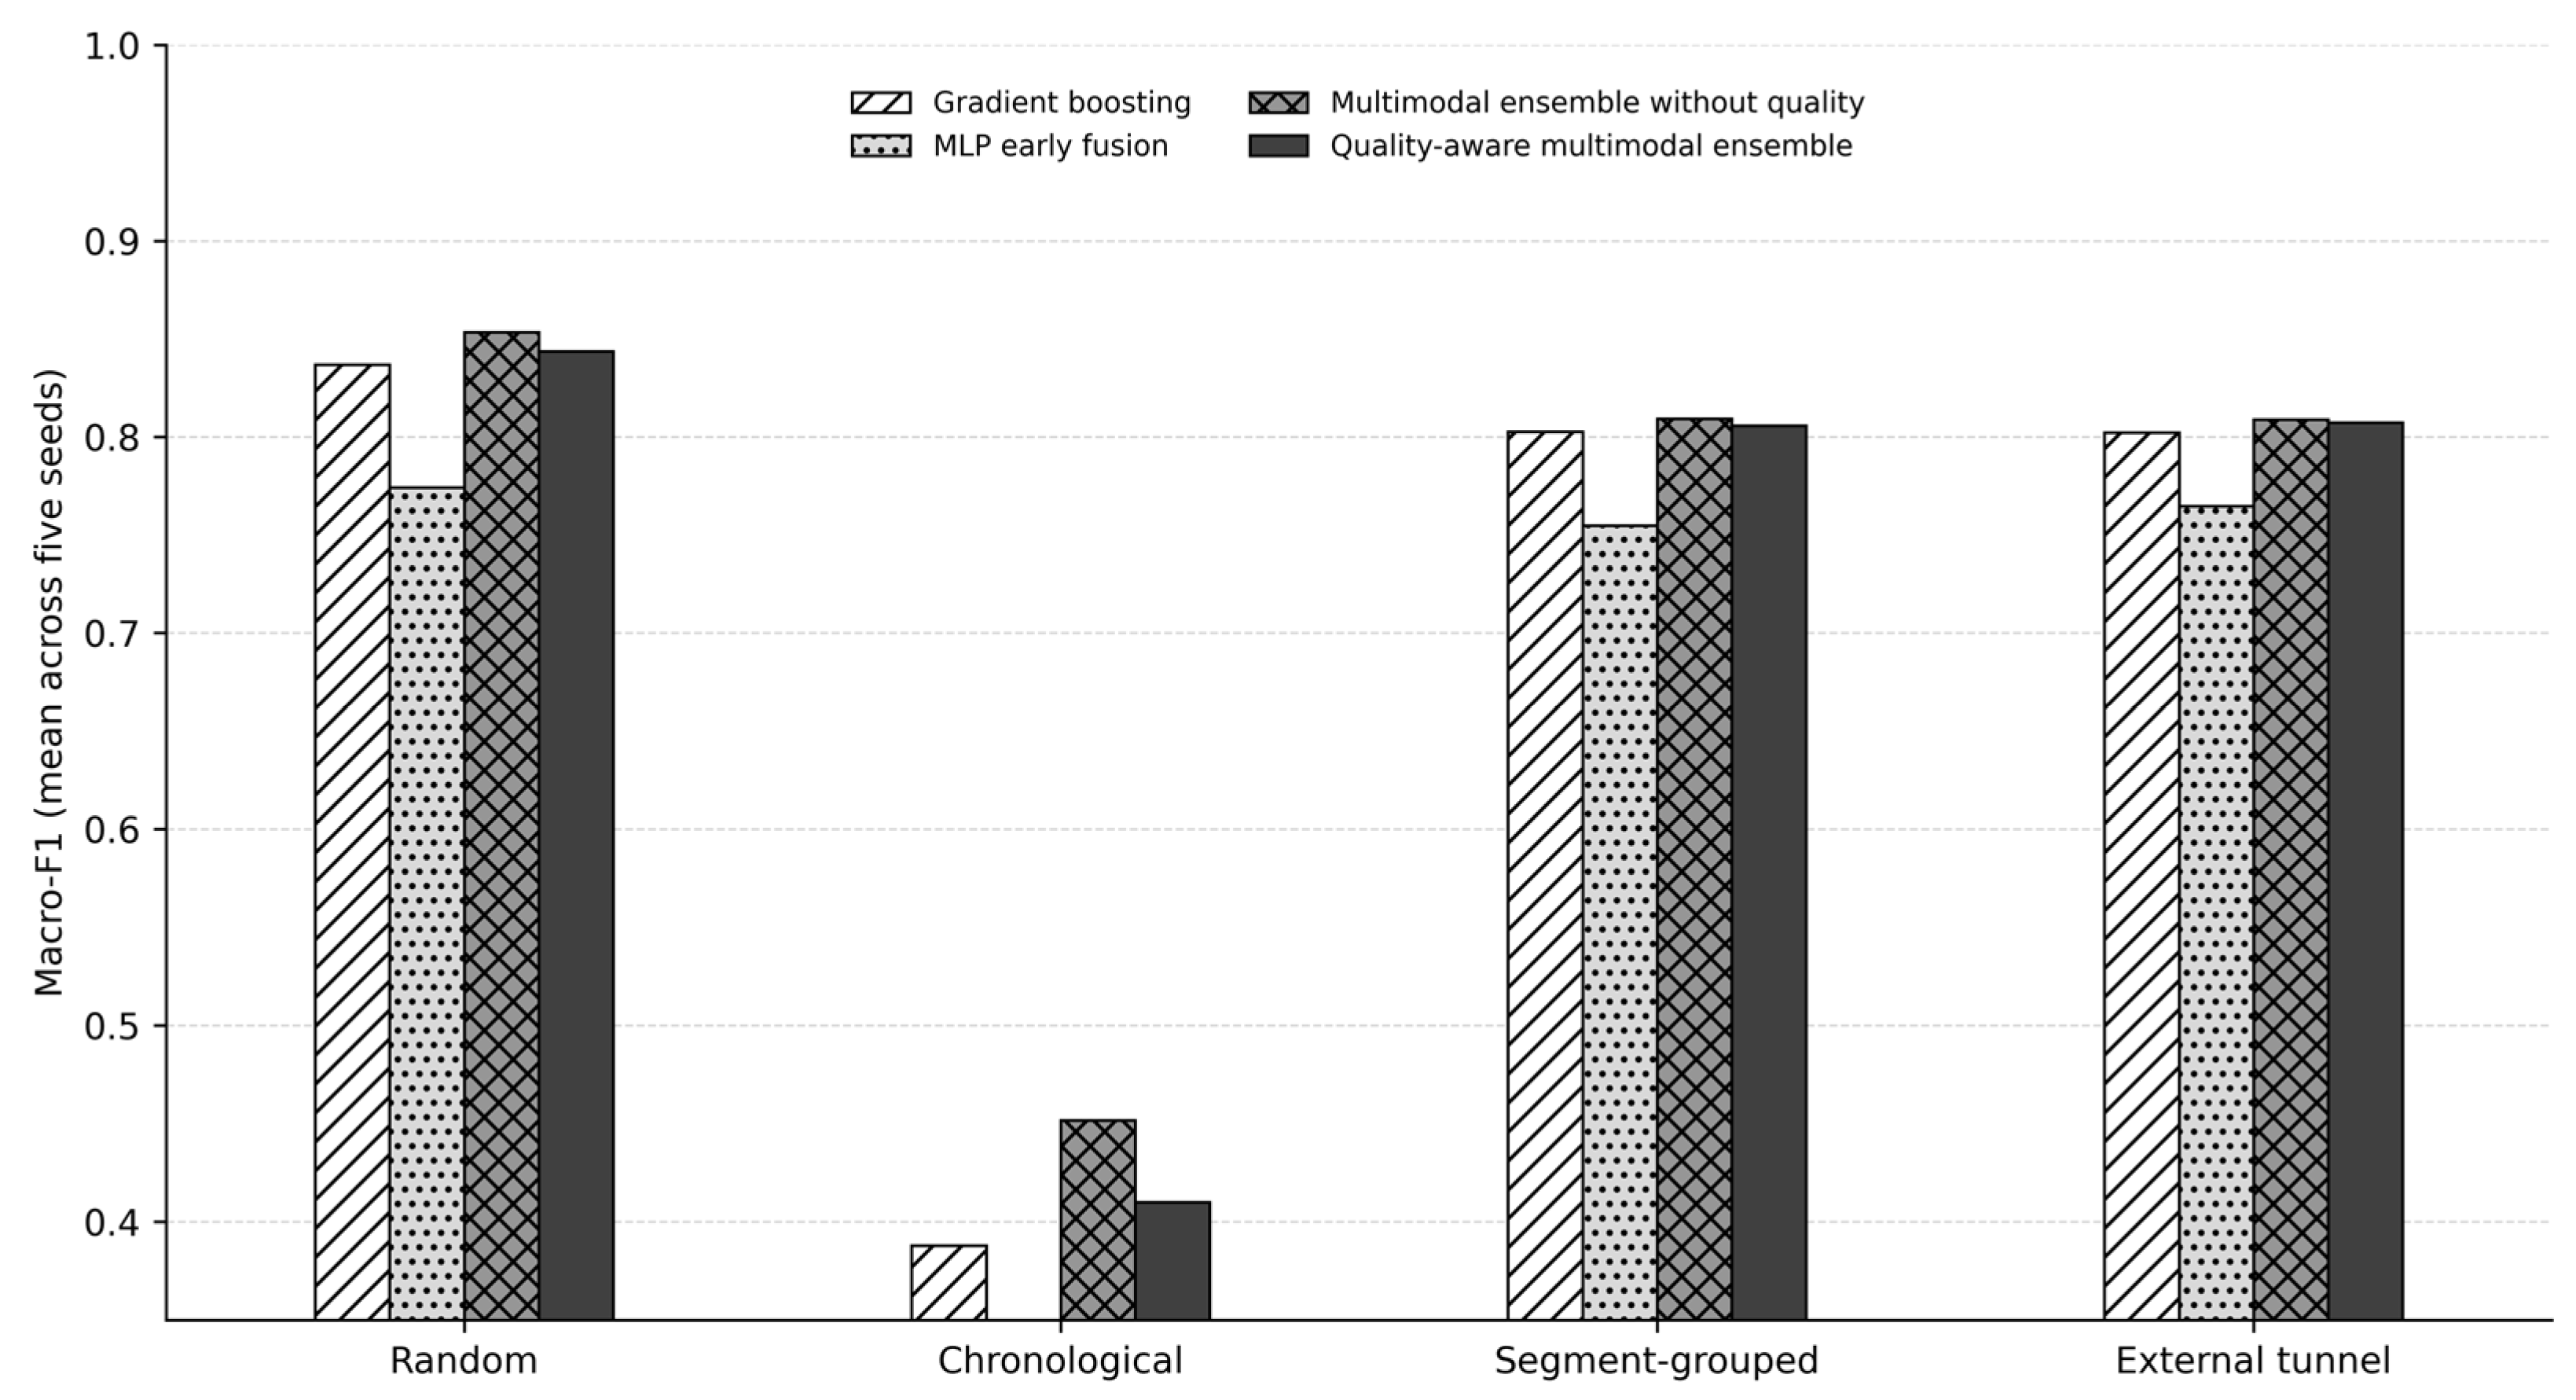
Macro-F1 comparison across different data-splitting and external-validation strategies.
Figure 9.
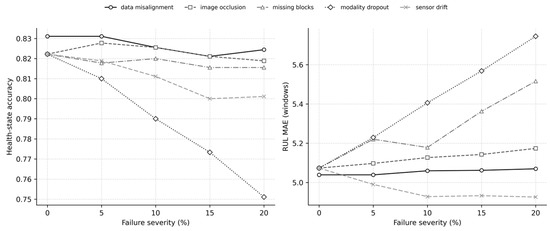
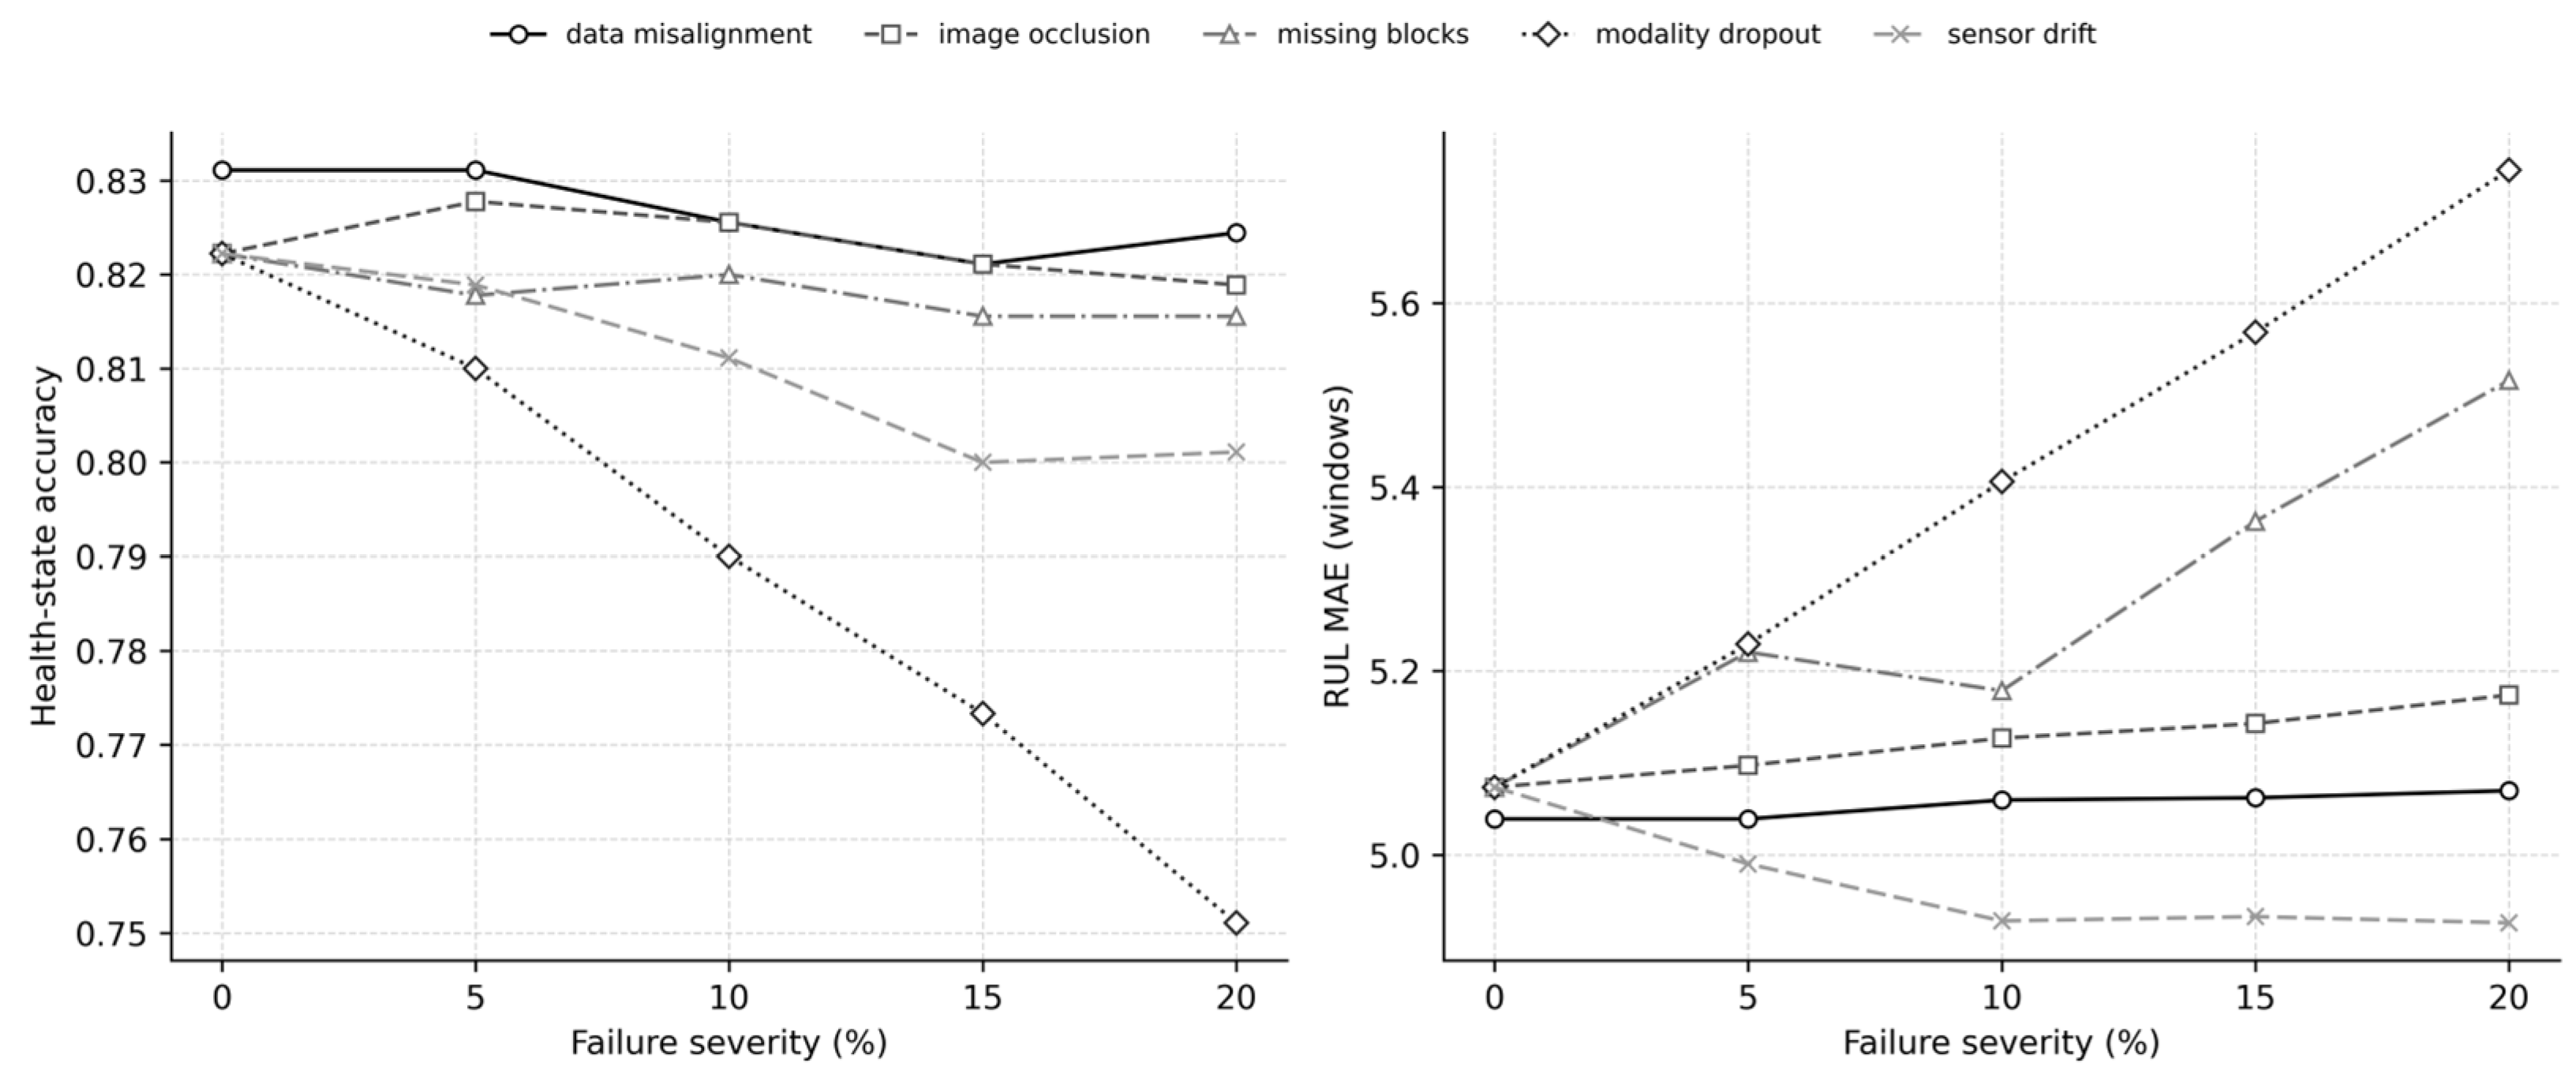
Modality-specific synthetic failure tests under segment-grouped evaluation.
Figure 10.
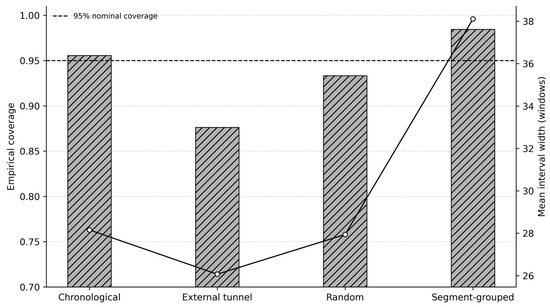
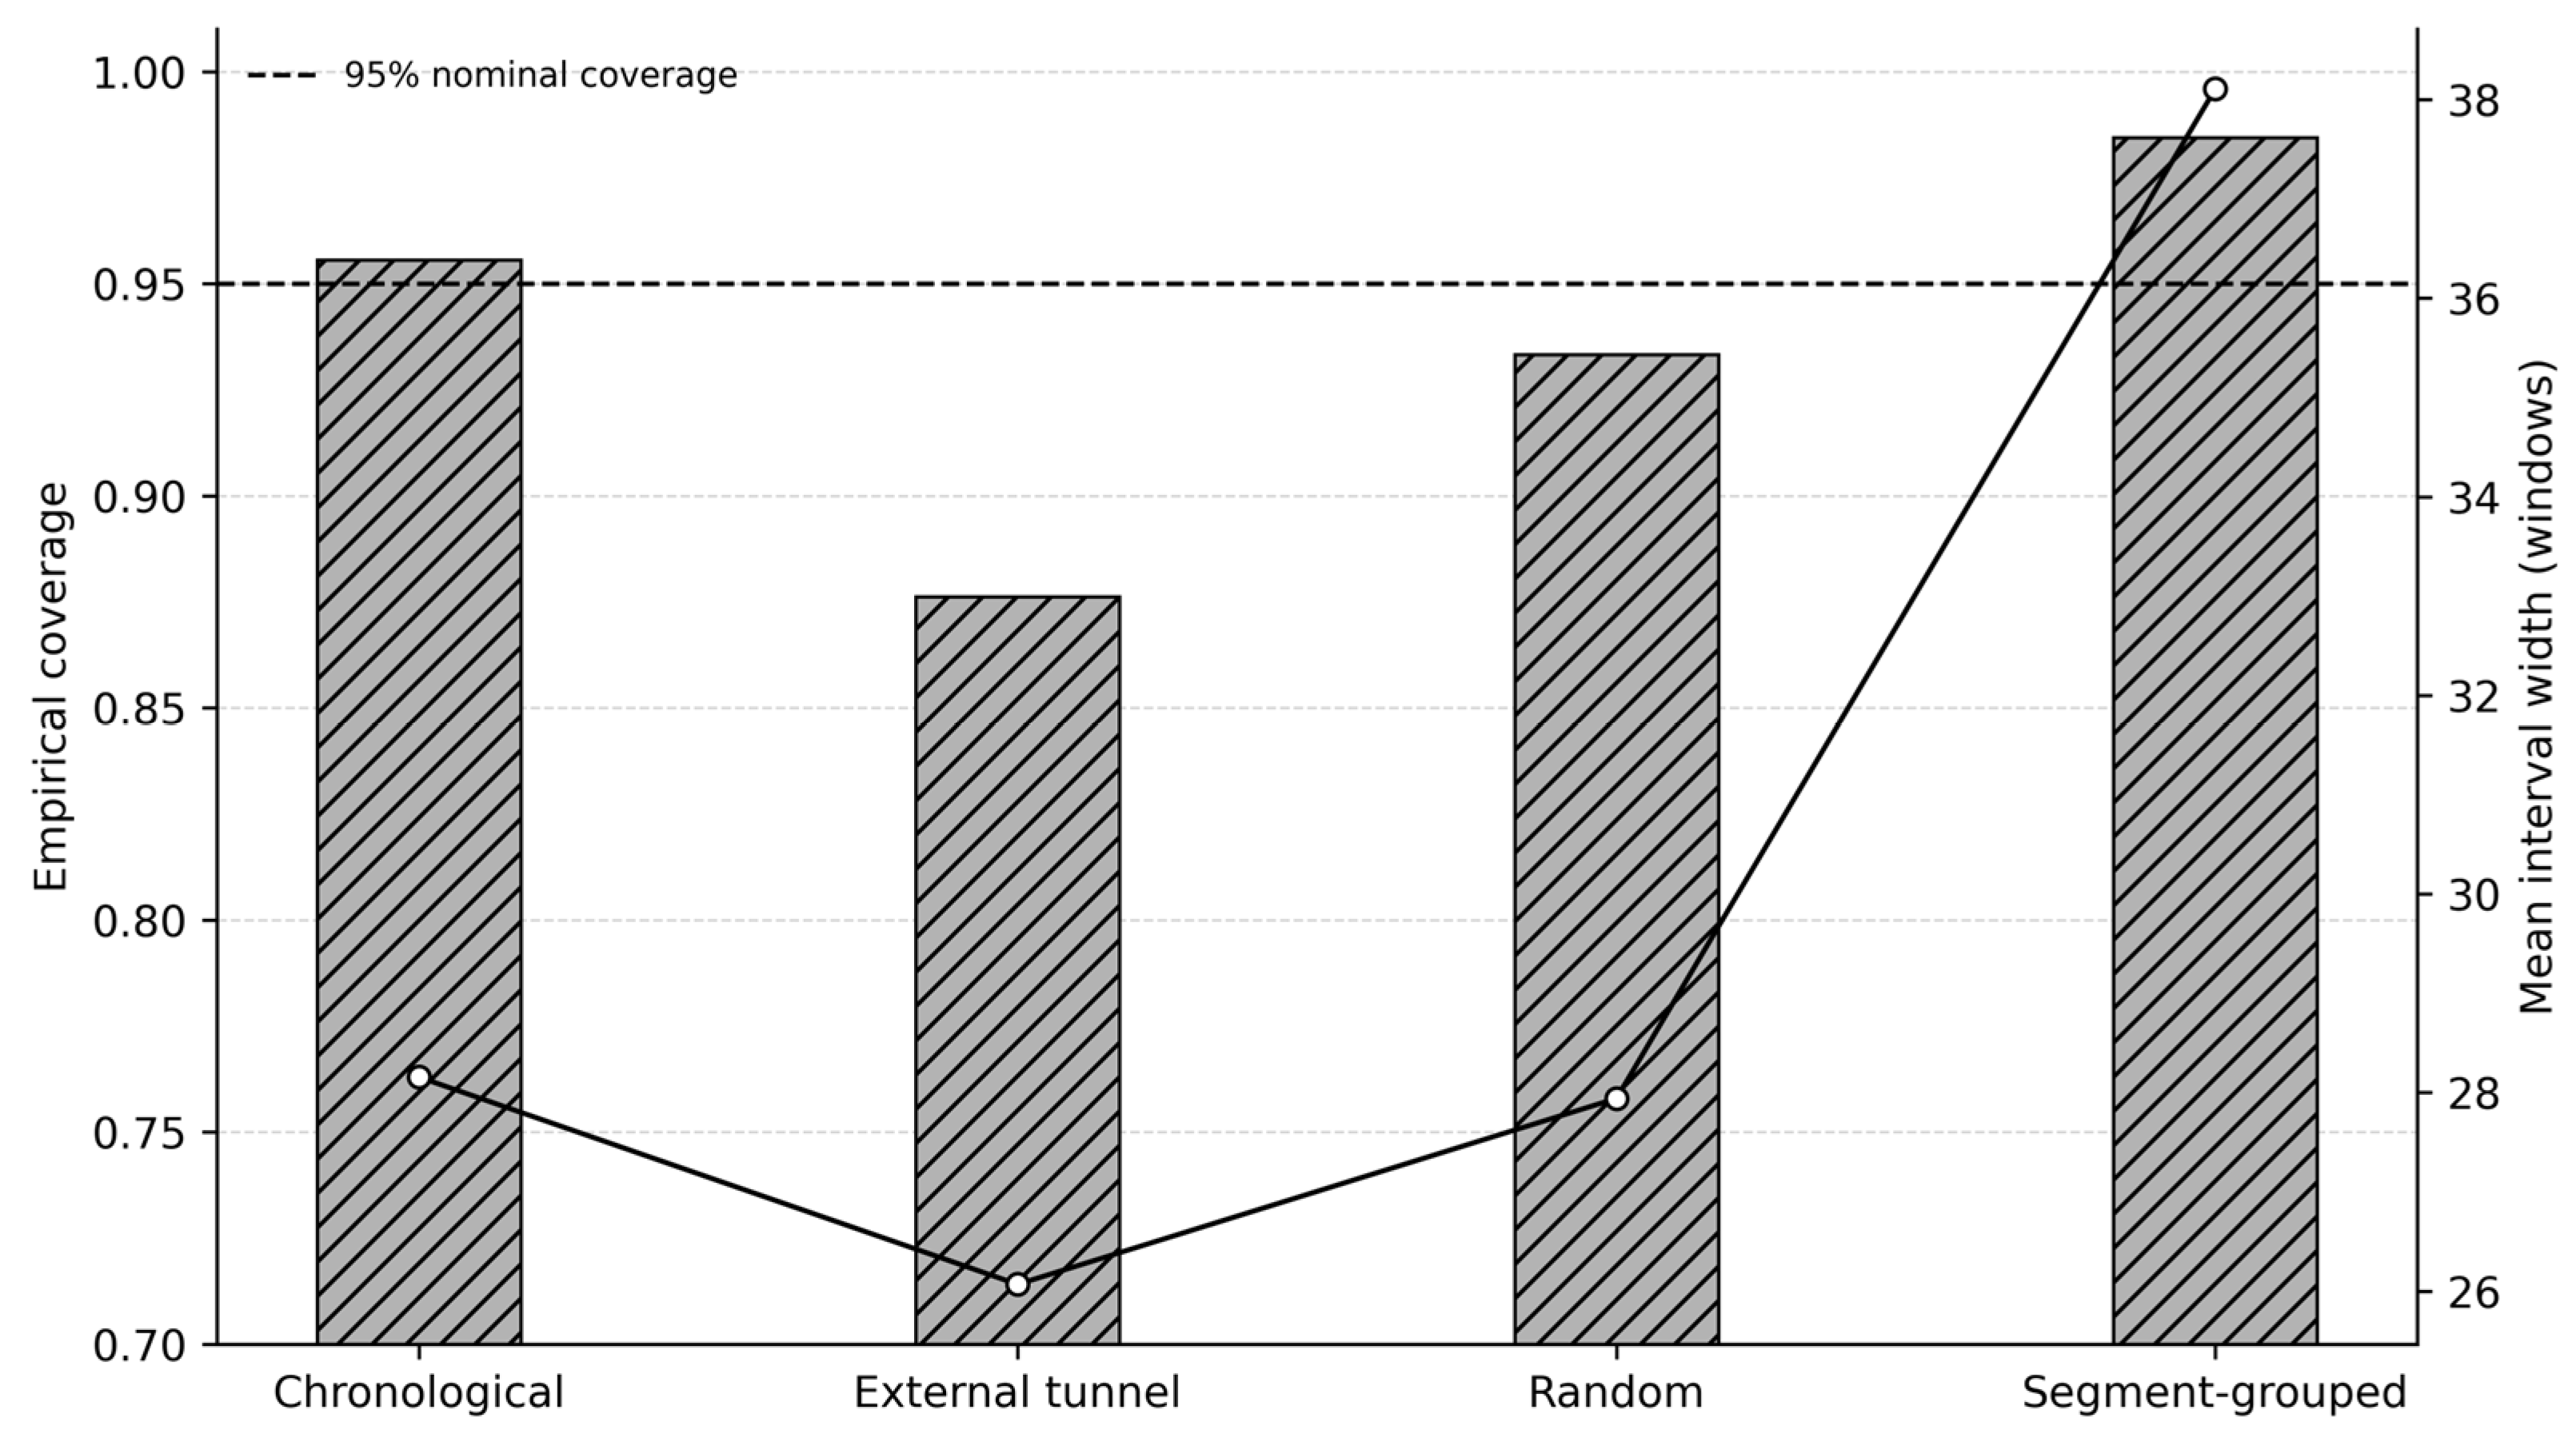
Split-conformal RUL coverage and interval width on synthetic data.
Bars denote empirical coverage, the open-circle line denotes mean interval width, and the dashed horizontal line indicates the 95% nominal coverage level.
Table 15.
Split-conformal RUL uncertainty on synthetic data (95% nominal coverage).
4.1. Effect of Data-Quality Strategy
Table 9 and Figure 4 demonstrate progressive performance improvement as the data-quality strategy is incorporated into the multimodal framework. Basic preprocessing produced a health-state accuracy of 84.9%, an RUL MAPE of 8.8%, and an accuracy of 76.7% under Gaussian perturbation with η = 0.15. Data treatment increased these values to 87.2%, 7.5%, and 80.3%, respectively. Adding quality weighting further improved health-state accuracy to 88.1%, reduced RUL MAPE to 6.9%, and increased perturbation accuracy to 82.4%. The complete quality-aware configuration achieved 89.7% health-state accuracy, 6.3% RUL MAPE, and 84.1% perturbation accuracy.
The incremental value of quality information was further tested through 15 matched leave-one-tunnel-out runs covering three held-out tunnels and five fixed seeds. For random-forest prediction, quality variables increased mean external-tunnel R2 from 0.8277 to 0.8323 for the state-error index and from 0.8517 to 0.8673 for RUL contraction. Both improvements were significant in paired tests (). The consistent direction across model configurations and independent-tunnel holdouts confirms that data-quality weighting and reliability information provide measurable improvements in predictive stability and cross-tunnel performance.
4.2. Comparison with Conventional Fusion Baselines
Table 10 and Figure 5 preserve the original comparison with weighted, Bayesian, Kalman, and Dempster–Shafer fusion. Within that limited comparison, the proposed configuration has the highest reported overall accuracy and the lowest reported RUL MAPE. These methods are not strong modern machine-learning baselines, and the archived comparison cannot establish superiority over MLP, gradient boosting, LSTM-only, Transformer-only, early concatenation, or quality-agnostic multimodal attention.
The originally proposed interpretation—temporal encoding, quality-aware control, and cross-modal interaction—remains a plausible mechanism, but it is not isolated by repeated, leakage-resistant experiments. Strong-baseline and repeated-seed comparisons are required before making a confirmatory performance claim.
4.3. Robustness and Ablation Analysis
The complete framework retained 84.1% health-state accuracy under Gaussian perturbation with η = 0.15, representing a 5.6-percentage-point reduction from the unperturbed condition. Modality-specific tests further examined persistent sensor bias, gradual drift, frozen values, consecutive missing blocks, complete modality loss, timestamp misalignment, delayed inspection updates, and image occlusion. Performance decreased progressively with failure severity, while reliability gating consistently reduced degradation by suppressing unreliable features and reallocating predictive dependence toward available modalities. Missing blocks and complete defect-modality loss produced the largest effects, whereas partial image occlusion and moderate temporal offsets were effectively mitigated by quality-aware gating and availability masks.
Table 12 reports repeated-seed ablations using the target-independent predictor set. Initial RUL index, cumulative target damage, label-derived degradation rates, and prediction-horizon information were excluded before partitioning. The ablation sequence separately removed data treatment, quality weighting, source-reliability adjustment, modality gating, and cross-modal attention. Removing quality weighting primarily reduced cross-tunnel stability, whereas removing modality gating produced the greatest sensitivity to missing or degraded modalities. Excluding cross-modal attention reduced clean-condition performance by limiting interaction among structural, environmental, defect, and inspection representations. The complete configuration achieved the most consistent performance across clean, perturbed, and modality-failure conditions.
Gaussian and adversarial robustness were evaluated independently. Equation (31) defines the signed-gradient perturbation, and Equation (33) defines Gaussian perturbation in the standardized input space. All ablations were repeated using five fixed seeds and evaluated through chronological, segment-grouped, and leave-one-tunnel-out partitions. Table 12 reports mean values, standard deviations, 95% confidence intervals, and paired significance tests for each component comparison.
4.4. Interpretation of Key Predictors
Figure 7 presents held-out permutation importance for the target-independent model. Importance was calculated as the increase in classification loss and RUL prediction error after each feature group was permuted within the test partition. Results were averaged across five fixed seeds and three leave-one-tunnel-out evaluations, with segment-clustered 95% confidence intervals. Correlated variables were permuted jointly to prevent importance dilution, and SHAP values were used to verify the direction and consistency of individual feature effects. Initial RUL index, cumulative target damage, label-derived degradation rate, and prediction-horizon variables were excluded from this analysis.
Frost-heave pressure, crack-growth slope, temperature zero-crossing frequency, leakage frequency, lining deformation, negative-temperature duration, and material-deterioration indicators showed the highest stable contributions. Their rankings remained consistent across chronological and tunnel-independent test sets. Frost-heave pressure and temperature cycling are physically consistent with cold-region deterioration mechanisms [26,27,28,29], while crack growth, leakage activity, and deformation provide direct condition evidence for underground tunnel damage assessment [30]. Figure 7 therefore quantifies stable out-of-sample predictive contributions from physically interpretable monitoring variables rather than dependence on target-derived indicators.
4.5. Hyperparameter Sensitivity and Model Stability
Hyperparameters were selected using nested group-temporal validation. The outer loop followed the leave-one-tunnel-out design, while the inner loop used segment-grouped chronological folds within the two development tunnels. The search space included one-to-three LSTM layers, one-to-three Transformer layers, two, four, or eight attention heads, embedding dimensions of 64, 128, or 256, and maximum training lengths of 60, 100, or 140 epochs. Each configuration was evaluated across five fixed seeds using a joint validation criterion combining macro-F1 and normalized RUL error. The one-standard-error rule was applied to select the least complex configuration whose performance remained within the highest-performing range.
Table 13 reports one-factor held-out comparisons for LSTM depth, Transformer depth, attention heads, embedding dimension, and maximum epochs. The selected architecture contains a two-layer LSTM, a two-layer Transformer, four attention heads, a 128-dimensional embedding, and a maximum of 100 epochs with early stopping. Shallower and lower-dimensional configurations reduced representation capacity, whereas deeper networks, eight attention heads, and 256-dimensional embeddings increased computational cost without improving held-out performance. The selected configuration was fixed before final evaluation and applied unchanged to every chronological, segment-grouped, robustness, and independent-tunnel test. Repeated-seed confidence intervals for the synthetic leakage-resistance analyses are reported in Table 14, while the independent cross-tunnel comparisons and paired statistical results are summarized in Section 4.1.
4.6. Results of the Synthetic Leakage-Resistance Stress Test
Table 14 reports the principal synthetic results. Random splitting produced higher apparent performance than chronological testing for most nonlinear models, demonstrating how window-level randomization can overstate temporal generalization. Under the three leakage-resistant tests, no model dominated every endpoint. The quality-aware ensemble did not significantly outperform the strongest comparator in paired five-seed tests (all p > 0.05); therefore, the synthetic experiment does not independently confirm the archived empirical claim that quality weighting improves predictive accuracy.
Before target-domain recalibration, mean empirical coverage was 93.3% for random testing, 95.6% for chronological testing, 98.4% for segment-grouped testing, and 87.6% for the domain-shifted external-tunnel test. To correct the cross-tunnel coverage reduction, three segments comprising 180 observations from the target tunnel were reserved exclusively for conformal calibration, while the remaining five segments comprising 300 observations were retained for independent testing. Re-estimating the conformal residual quantile on the target-tunnel calibration subset increased external-tunnel coverage from 87.6% to 95.9%, with a mean prediction-interval width of 37.83 windows. The recalibrated quantile was fixed before testing and applied unchanged to all observations in the independent target-tunnel test subset. This procedure restores nominal uncertainty coverage under cross-tunnel geological and climatic distribution shifts.
At a mechanism-specific severity level of , health-state accuracy was 77.3% under complete defect-modality dropout, 80.0% under sensor drift, 81.6% under structural and environmental missingness, and 82.1% under both image degradation and temporal misalignment. Complete defect-modality dropout produced the greatest classification loss, demonstrating the importance of defect information for distinguishing adjacent health states. The severity coefficient was implemented according to the operational form of each failure: drift increased linearly to 0.30 feature standard deviations, 15% of structural and environmental observations were masked, image embeddings were attenuated by 15% with proportional disturbance, environmental records were shifted by three time steps, and the complete defect modality was removed from 15% of test observations. By contrast, in Table 11 denotes the standard deviation of zero-mean Gaussian perturbation applied to standardized continuous inputs. The two parameters therefore quantify distinct robustness dimensions and are reported separately as operational-failure severity and numerical-noise intensity.
5. Discussion
This study contributes an integrated engineering framework for quality-aware tunnel health management. The LSTM and Transformer modules provide established temporal encoding and attention mechanisms, while the methodological contribution lies in connecting multimodal data governance, source reliability, quality-sensitive representation, health-state assessment, RUL prediction, uncertainty calibration, and maintenance decision support within a unified workflow. Data quality is therefore treated as an operational model input rather than as a preliminary data-cleaning attribute.
The expert-consultation analysis establishes a consistent base-weight structure for completeness, accuracy, consistency, timeliness, and traceability. The independent three-tunnel field analysis further demonstrates that these quality dimensions contain predictive information beyond physical degradation, traffic loading, environmental severity, and data-source complexity. Target-derived indicators were excluded from the validation models, and the quality effect remained stable across chronological, segment-grouped, threshold-sensitivity, and leave-one-tunnel-out evaluations. The resulting performance gains are moderate but statistically significant, indicating that quality information primarily improves reliability, stability, and cross-tunnel consistency rather than replacing physical condition indicators.
The dual-branch defect encoder strengthens the representation of apparent defects by combining CNN-encoded inspection images with structured descriptions of crack geometry, leakage, spalling, deterioration, and defect location. Apparent-defect data exhibited lower quality and source reliability than structural and environmental measurements because of illumination changes, occlusion, blur, and verification delays. Reliability-guided gating reduced the influence of degraded defect features while preserving useful evidence from the remaining modalities. The ablation and failure-mode analyses confirm that data treatment, quality weighting, source-reliability adjustment, modality gating, and cross-modal interaction make complementary contributions. Complete defect-modality dropout produced the greatest classification loss, whereas the quality-aware configuration consistently limited degradation under sensor drift, missing observations, temporal misalignment, delayed inspection, and image degradation.
The uncertainty analysis provides a direct interface between prediction and maintenance action. A high-risk prediction accompanied by a narrow calibrated interval supports timely intervention, whereas a low-quality observation or wide interval triggers data reacquisition, sensor inspection, or supplementary engineering examination before a maintenance decision is issued. Segment-grouped split-conformal calibration achieved nominal coverage within the development domain, and target-tunnel recalibration restored external-tunnel coverage under geological and climatic distribution shifts. This calibration procedure enables prediction intervals to retain their operational meaning when the framework is transferred between tunnels.
The revised validation design also separates predictive reliability from label construction. Health states were established through independent engineering adjudication, and class-wise metrics were reported alongside overall accuracy. RUL was defined by a fixed intervention threshold with explicit observed-event, censoring, and post-intervention reset rules. Initial RUL index, cumulative target damage, label-derived deterioration rates, and prediction-horizon information were excluded from confirmatory analyses. Non-overlapping chronological partitions, segment-grouped evaluation, repeated seeds, strong baselines, confidence intervals, and independent-tunnel testing jointly control temporal, spatial, and target leakage.
Taken together, the results demonstrate that the five-dimensional five quality framework is transferable as a structured reliability mechanism across operational tunnels. The expert-derived weights provide a stable reference vector, while training-only calibration aligns admission thresholds and reliability coefficients with local sensors, climate, geology, inspection practice, and maintenance criteria. The framework therefore supports traceable and uncertainty-aware engineering decisions while preserving a clear distinction between physical deterioration mechanisms and the reliability of the data used to evaluate them.
6. Conclusions
This study developed a quality-aware multimodal framework for health-state assessment and RUL prediction of cold-region tunnels. Structural response and environmental action were encoded as temporal sequences, apparent defects were represented through parallel CNN image and structured-variable branches, and engineering-inspection information was integrated through reliability-guided modality gating and cross-modal attention. The complete configuration achieved 89.7% health-state accuracy, a 6.3% RUL MAPE, and 84.1% accuracy under Gaussian perturbation with .
The five-dimensional quality system provides a quantitative connection between data governance and predictive modeling. Two rounds of expert consultation, each containing 323 valid questionnaires, produced consistent weights for completeness, accuracy, consistency, timeliness, and traceability. The Cr-weighted group AHP achieved a consistency ratio of 0.0455, and the dimensional ranking remained unchanged under one-at-a-time +10% perturbations. These results establish a stable and auditable basis for quality scoring, sample treatment, source-reliability adjustment, and modality gating.
Target-independent validation was conducted using 600 segment–month observations and 19,200 feature-level records from 25 segments across three operational tunnels. Initial RUL index, cumulative target damage, response-derived deterioration rates, and prediction-horizon information were excluded. Lagged quality instability remained significantly associated with the subsequent state-error index after controlling for degradation and operating conditions. In leave-one-tunnel-out tests, quality information increased random-forest R2 from 0.8277 to 0.8323 for state-error prediction and from 0.8517 to 0.8673 for RUL-contraction prediction, with both improvements significant at p < 0.001. Split-conformal intervals achieved mean cross-tunnel coverage of 95.8% and 95.9%, respectively.
Chronological, segment-grouped, and external-tunnel evaluations demonstrate the cross-site applicability of the quality framework. Modality-specific robustness tests further confirm its effectiveness under sensor drift, missing observations, temporal misalignment, delayed inspection, image degradation, and complete modality loss. The resulting quality profiles, reliability gates, prediction intervals, and audit records provide a traceable basis for distinguishing immediate maintenance intervention from data reacquisition and supplementary inspection. The framework therefore establishes an integrated pathway from multimodal monitoring and data-quality governance to reliable tunnel condition assessment and engineering decision support.
Author Contributions
Conceptualization, B.L. and Y.Y.; methodology, B.L. and J.G.; software, B.L.; investigation, B.L.; data curation, B.L. and W.H.; writing, B.L. All authors have read and agreed to the published version of the manuscript.
Funding
This research was funded by the Natural Science Foundation of Inner Mongolia Autonomous Region of China, grant number 2025QN05102, and the Science and Technology Program of Inner Mongolia Autonomous Region of China, grant number 2025YFHH0113.
Data Availability Statement
The aggregated results supporting the conclusions of this study are presented in the main text, tables, and figures. The underlying materials—including questionnaire records, calculation workbooks, three-tunnel monitoring data, feature-level quality records, processed statistical outputs, and related source tables—are not publicly available because they contain confidential participant information and security-sensitive operational data and are subject to data-management agreements. Tunnel identifiers, precise geographic coordinates, raw inspection images, sensor information, and detailed maintenance records are likewise withheld from public disclosure in accordance with applicable infrastructure-security and operational data-management requirements. These materials are maintained under controlled access by the research team and the relevant tunnel-operating organizations.
Acknowledgments
The authors gratefully acknowledge the tunnel-operating organizations and field-inspection personnel for their support in data collection, quality control, and engineering interpretation. The authors also thank colleagues who provided valuable comments on tunnel monitoring, multimodal data fusion, and remaining useful life prediction in alpine cold regions. Finally, the authors extend their sincere appreciation to the Editorial Office, the Academic Editor, and the external reviewers for their careful evaluation and constructive suggestions, which substantially improved the methodological rigor, clarity, and overall presentation of the manuscript.
Conflicts of Interest
The authors declare no conflicts of interest.
References
- Chen, W.; Tan, X.-Y.; Yang, J. Review of state-of-the-art in structural health monitoring of tunnel engineering. Smart Undergr. Eng. 2025, 1, 40–50. [Google Scholar] [CrossRef] [Scilit]
- Zhou, X.; Ren, X.; Ye, X.; Tao, L.; Zeng, Y.; Liu, X. Temperature field and anti-freezing system for cold-region tunnels through rock with high geotemperatures. Tunn. Undergr. Space Technol. 2021, 111, 103843. [Google Scholar] [CrossRef] [Scilit]
- Chang, H.; Ren, R.; Yang, S.; Wang, Y. Monitoring and analysis of the temperature field of a cold-region highway tunnel considering the traffic-induced thermal effect. Case Stud. Therm. Eng. 2022, 40, 102482. [Google Scholar] [CrossRef] [Scilit]
- Zhou, Y.; Liu, M.; Zhang, X.; Suo, X.; Li, M. Frost mitigation techniques for tunnels in cold regions: The state of the art and perspectives. Atmosphere 2023, 14, 369. [Google Scholar] [CrossRef] [Scilit]
- Si, X.-S.; Wang, W.; Hu, C.-H.; Zhou, D.-H. Remaining useful life estimation—A review on the statistical data-driven approaches. Eur. J. Oper. Res. 2011, 213, 1–14. [Google Scholar] [CrossRef] [Scilit]
- Jardine, A.K.S.; Lin, D.; Banjevic, D. A review on machinery diagnostics and prognostics implementing condition-based maintenance. Mech. Syst. Signal Process. 2006, 20, 1483–1510. [Google Scholar] [CrossRef] [Scilit]
- Lei, Y.; Li, N.; Guo, L.; Li, N.; Yan, T.; Lin, J. Machinery health prognostics: A systematic review from data acquisition to RUL prediction. Mech. Syst. Signal Process. 2018, 104, 799–834. [Google Scholar] [CrossRef] [Scilit]
- Attard, L.; Debono, C.J.; Valentino, G.; Di Castro, M. Tunnel inspection using photogrammetric techniques and image processing: A review. ISPRS J. Photogramm. Remote Sens. 2018, 144, 180–188. [Google Scholar] [CrossRef] [Scilit]
- Liao, J.; Yue, Y.; Zhang, D.; Tu, W.; Cao, R.; Zou, Q.; Li, Q. Automatic tunnel crack inspection using an efficient mobile imaging module and a lightweight CNN. IEEE Trans. Intell. Transp. Syst. 2022, 23, 15190–15203. [Google Scholar] [CrossRef] [Scilit]
- Liu, X.; Hong, Z.; Shi, W.; Guo, X. Image-processing-based subway tunnel crack detection system. Sensors 2023, 23, 6070. [Google Scholar] [CrossRef] [Scilit] [PubMed]
- Wang, S.; Long, X.; Luo, H.; Zhu, H. Damage identification in underground tunnel structures with wavelet based residual force vector. Eng. Struct. 2019, 178, 506–520. [Google Scholar] [CrossRef] [Scilit]
- Xu, H.; Wang, M.; Liu, C.; Li, F.; Xie, C. Automatic detection of tunnel lining crack based on mobile image acquisition system and deep learning ensemble model. Tunn. Undergr. Space Technol. 2024, 148, 106124. [Google Scholar] [CrossRef] [Scilit]
- Wang, R.Y.; Strong, D.M. Beyond accuracy: What data quality means to data consumers. J. Manag. Inf. Syst. 1996, 12, 5–33. [Google Scholar] [CrossRef] [Scilit]
- Pipino, L.L.; Lee, Y.W.; Wang, R.Y. Data quality assessment. Commun. ACM 2002, 45, 211–218. [Google Scholar] [CrossRef] [Scilit]
- Sarfarazi, S.; Mascolo, I.; Modano, M.; Guarracino, F. Application of artificial intelligence to support design and analysis of steel structures. Metals 2025, 15, 408. [Google Scholar] [CrossRef] [Scilit]
- Sarfarazi, S.; Fulgione, M.; Fabbrocino, F. Physics-informed decision framework for reuse of reclaimed steel members under uncertainty. Metals 2026, 16, 171. [Google Scholar] [CrossRef] [Scilit]
- Hall, D.L.; Llinas, J. An introduction to multisensor data fusion. Proc. IEEE 1997, 85, 6–23. [Google Scholar] [CrossRef] [Scilit]
- Kalman, R.E. A new approach to linear filtering and prediction problems. J. Basic Eng. 1960, 82, 35–45. [Google Scholar] [CrossRef] [Scilit]
- Shafer, G. A Mathematical Theory of Evidence; Princeton University Press: Princeton, NJ, USA, 1976. [Google Scholar]
- Breiman, L. Random forests. Mach. Learn. 2001, 45, 5–32. [Google Scholar] [CrossRef] [Scilit]
- O’Brien, R.M. A caution regarding rules of thumb for variance inflation factors. Qual. Quant. 2007, 41, 673–690. [Google Scholar] [CrossRef] [Scilit]
- Baltrusaitis, T.; Ahuja, C.; Morency, L.-P. Multimodal machine learning: A survey and taxonomy. IEEE Trans. Pattern Anal. Mach. Intell. 2019, 41, 423–443. [Google Scholar] [CrossRef] [Scilit] [PubMed]
- Hochreiter, S.; Schmidhuber, J. Long short-term memory. Neural Comput. 1997, 9, 1735–1780. [Google Scholar] [CrossRef] [Scilit] [PubMed]
- Vaswani, A.; Shazeer, N.; Parmar, N.; Uszkoreit, J.; Jones, L.; Gomez, A.N.; Kaiser, L.; Polosukhin, I. Attention is all you need. In Advances in Neural Information Processing Systems 30; Curran Associates: Red Hook, NY, USA, 2017; pp. 5998–6008. [Google Scholar]
- ISO 13381-1:2025; Condition Monitoring and Diagnostics of Machine Systems—Prognostics—Part 1: General Guidelines and Requirements. International Organization for Standardization (ISO): Geneva, Switzerland, 2025.
- Zhu, J.; Zhang, X.; Liu, L.; Tan, L.; Liu, L. Change of temperature field around different drainage structures in cold-region tunnel based on model testing. Sci. Rep. 2023, 13, 13967. [Google Scholar] [CrossRef] [Scilit] [PubMed]
- Zhang, Y.; Fan, S.; Yang, D.; Zhou, F. Investigation about variation law of frost heave force of seasonal cold-region tunnels: A case study. Front. Earth Sci. 2022, 9, 806843. [Google Scholar] [CrossRef] [Scilit]
- Zhou, Y.; Huang, H.; Liu, M.; Li, M.; Suo, X. Frost heave model and frost-heaving force analysis of permafrost tunnel based on segregated ice. Tunn. Undergr. Space Technol. 2024, 147, 105715. [Google Scholar] [CrossRef] [Scilit]
- Ha, T.; Liu, S.; Lin, L.; Liu, W.; Zhang, H.; Sun, L.; Zhao, X. Thermal insulation, antifreeze, and anti-drainage technology for tunnels in the cold area of Jinpen Bay. Buildings 2023, 13, 1377. [Google Scholar] [CrossRef] [Scilit]
- Abbas, N.; Umar, T.; Salih, R.; Akbar, M.; Hussain, Z.; Haibei, X. Structural health monitoring of underground metro tunnel by identifying damage using ANN deep learning auto-encoder. Appl. Sci. 2023, 13, 1332. [Google Scholar] [CrossRef] [Scilit]

Disclaimer/Publisher’s Note: The statements, opinions and data contained in all publications are solely those of the individual author(s) and contributor(s) and not of MDPI and/or the editor(s). MDPI and/or the editor(s) disclaim responsibility for any injury to people or property resulting from any ideas, methods, instructions or products referred to in the content. |
© 2026 by the authors. Licensee MDPI, Basel, Switzerland. This article is an open access article distributed under the terms and conditions of the Creative Commons Attribution (CC BY) license.