Article

Moisture Migration and Variation in Pile Shaft Resistance During Hydration-Heat-Induced Thawing–Refreezing Around Cast-in-Place Piles in Permafrost

1
College of Civil Engineering and Architecture, Xinjiang University, Urumqi 830017, China
2
Xinjiang Institute of Building Sciences Co., Ltd., Urumqi 830000, China
*
Author to whom correspondence should be addressed.
Infrastructures 2026, 11(8), 282; https://doi.org/10.3390/infrastructures11080282
Submission received: 16 June 2026 / Revised: 29 July 2026 / Accepted: 4 August 2026 / Published: 10 August 2026

Abstract

The shaft resistance of cast-in-place piles in permafrost regions is commonly estimated using the initial moisture content and frozen-soil strength parameters obtained during site investigation. However, concrete hydration heat disturbs the temperature field of the surrounding frozen soil. During thawing and subsequent refreezing, this disturbance induces unfrozen-water migration and moisture redistribution. The resulting changes in the frozen pile–soil interface may cause the measured shaft resistance to deviate from the initial design estimate. In this study, laboratory direct shear tests and engineering-oriented reduced-scale pile–soil segment tests were conducted. The effects of initial moisture content and soil stratification on interface shear strength, the surrounding temperature field, and the post-test moisture distribution were investigated. Vertical pile compression tests were also performed to evaluate changes in pile shaft resistance. The main results are as follows. (1) The shear strength of the concrete–frozen-soil interface varied nonlinearly with moisture content. It increased initially and then decreased, reaching its maximum at a moisture content of 30%. (2) The temperature rise in the surrounding frozen soil was jointly controlled by soil stratification and initial moisture content. Higher moisture contents produced smaller peak temperature rises. In the near-pile region, the maximum difference in peak temperature among soil layers with different moisture contents was approximately 10.8%. (3) During thawing and refreezing, moisture migration was jointly affected by the temperature gradient and the moisture conditions of different soil layers. Unfrozen water migrated toward colder regions or lower-moisture soil layers under temperature gradients, capillary effects, and freezing suction, resulting in near-pile moisture depletion and localized moisture enrichment. For the Group A model, the initial-state estimate underestimated the measured peak shaft resistance by 12.45%. In contrast, for the layered B1 model, the initial-state estimate overestimated the measured peak shaft resistance by 20.58%. (4) A preliminary lumped equivalent coefficient, keq, was introduced to establish a relationship between moisture content and local equivalent interface resistance. After the measured post-test near-pile moisture distributions were incorporated into the calculation, the relative deviation decreased from 12.45% to 7.36% for Group A and from 20.58% to 9.66% for B1.

1. Introduction

In permafrost engineering, cast-in-place piles are widely used in the construction of bridges, roads, and cold-region infrastructure because of their high bearing capacity, strong adaptability, and relatively convenient construction [1]. Unlike pile foundations in conventional regions, cast-in-place piles in permafrost are strongly affected by construction-induced thermal disturbance. Their shaft resistance depends on the pile geometry and the mechanical properties of the surrounding soil. It is also influenced by the hydration heat released by fresh concrete. Field monitoring and numerical simulations have shown that concrete hydration heat disturbs the original thermal equilibrium of the frozen soil around piles. The surrounding soil may warm or even thaw locally and subsequently refreeze under negative-temperature conditions [2,3,4]. During thawing and refreezing, unfrozen water migrates under temperature gradients, capillary suction, and freezing suction. The migrated water may accumulate and refreeze in colder regions, near advancing freezing fronts, or at soil-layer interfaces. This redistribution can alter the bonding condition and mechanical response of the frozen pile–soil interface [5].
Previous studies have investigated hydration-heat-induced pile–permafrost interaction from the perspectives of frozen soil–structure interface behavior, thermal disturbance and refreezing, moisture migration, and pile bearing performance. At the interface scale, Zhao et al. examined the shear behavior and water sensitivity of frozen soil–pile interfaces during thawing using low-temperature direct shear tests [6]. Yuan et al. investigated frozen soil–concrete interfaces under constant normal stiffness and demonstrated that interface strength depends nonlinearly on temperature and moisture content [7]. More recent studies have further shown that normal stress, freeze–thaw history, loading condition, and concrete surface roughness affect the adhesive, frictional, and mechanical-interlocking components of frozen soil–concrete interface resistance [8,9]. These findings demonstrate that interface resistance is controlled by coupled hydrothermal and mechanical conditions rather than by moisture content alone. Recent direct shear studies have specifically confirmed the importance of normal stress and temperature, while roughness studies have emphasized the contributions of ice bonding and mechanical interlocking.
Regarding thermal disturbance and refreezing, Hou et al. analyzed the temperature evolution and refreezing process of cast-in-place pile foundations in permafrost through field monitoring and numerical simulation [2,3]. Bronfenbrener and Bronfenbrener developed a theoretical framework for heat and mass transfer in freezing soil, providing a basis for describing freezing-front advancement [10]. Fan et al. and Wang et al. demonstrated that concrete hydration heat can produce a substantial and persistent thermal-disturbance zone around cast-in-place piles [4,11], while Kong et al. indicated that short-term thawing may weaken the frozen pile–soil interface [12]. Studies of freezing-induced water migration have shown that unfrozen water moves toward colder regions and advancing freezing fronts. This migration is driven by temperature gradients, freezing suction, and capillary forces and produces localized moisture-enriched and moisture-depleted zones [5]. Gao et al. recently investigated the hydrothermal disturbance and mechanical response of bored piles in ice-rich permafrost [13]. Their results showed that pile diameter, ground temperature, and initial moisture conditions influence the pile–soil response. Thawing and subsequent ice redistribution also affected the development of shaft resistance. This study provides direct evidence that hydrothermal disturbance is relevant to pile resistance, but a general procedure for converting a measured post-test moisture profile into spatially updated interface parameters remains to be established.
At the pile scale, Wotherspoon et al. reported that pile response in seasonally frozen ground is closely related to the frozen state of the surrounding soil [14]. Yu et al. and Qiu et al. examined the coupled effects of permafrost degradation, refreezing, and pile bearing-capacity evolution [15,16], and Tang et al. proposed a bearing-capacity degradation model for piles in degrading permafrost [17]. Karagöl et al. further demonstrated that low-temperature conditions can substantially influence early-age concrete hydration and hardening [18]. Research conducted in non-permafrost layered soils also highlights the importance of explicitly representing spatial heterogeneity. Iqbal et al. showed that layer-dependent soil properties affect monopile–soil interaction in a multilayer seabed [19]. Arbi et al. developed data-driven models for pile-capacity prediction in layered soils and emphasized the importance of geotechnical variability and model validation [20]. Although these studies concern different environmental conditions and loading modes, they demonstrate that averaged soil properties may not adequately represent pile behavior in strongly layered profiles.
Despite these advances, the quantitative relationship between hydration-heat-induced hydrothermal disturbance and changes in pile shaft resistance remains insufficiently understood. Previous studies have examined temperature evolution, thawing–refreezing processes, moisture migration, frozen soil–structure interface behavior, and pile bearing performance from different perspectives. However, these aspects have not been systematically linked to clarify how spatially nonuniform moisture redistribution influences the mobilization of shaft resistance. In particular, limited attention has been given to translating the measured post-test moisture profile around cast-in-place piles into depth-dependent equivalent interface resistance.
To address this gap, the present study combines concrete–frozen-soil direct shear tests, temperature monitoring, post-test gravimetric moisture measurements, and engineering-oriented reduced-scale pile–soil segment compression tests. Based on these experimental observations, a moisture-distribution-informed back-analysis framework is developed to characterize the depth-dependent variation in equivalent pile–soil interface resistance using the measured post-test near-pile moisture profile. The resulting local resistance contributions are then integrated along the pile shaft to evaluate the short-term shaft resistance under the tested conditions.

2. Materials and Methods

2.1. Soil Materials and Physicomechanical Properties

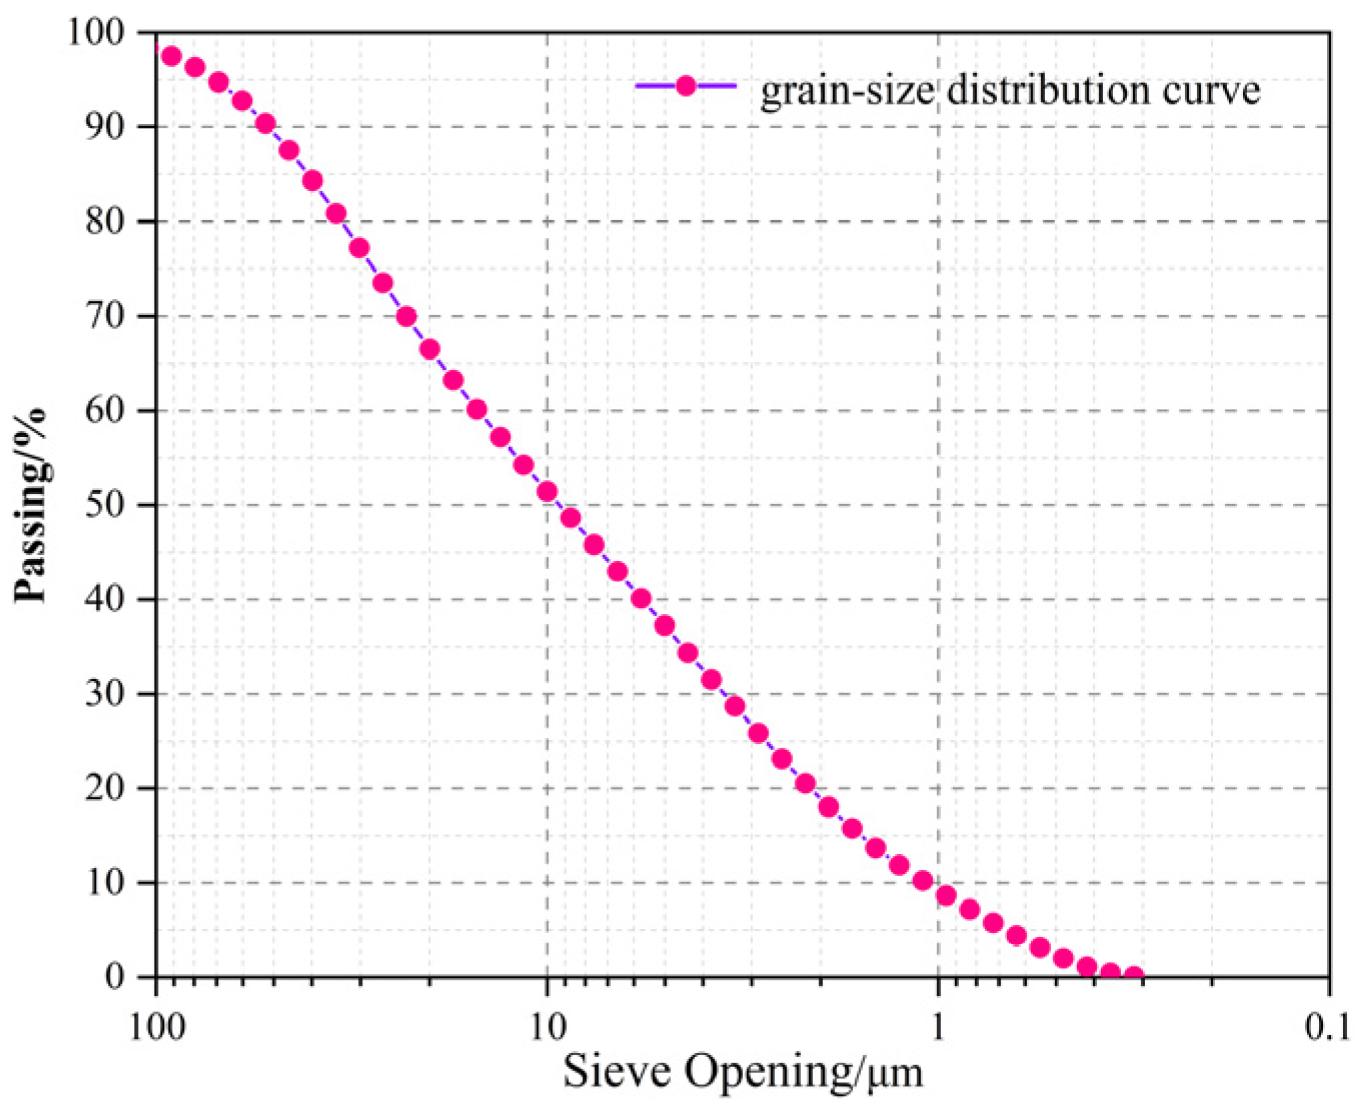
The test soil was collected from the permafrost section of the Naba Highway along National Highway 218 and was classified mainly as silty clay. The basic physical properties are summarized in Table 1, and the particle size distribution curve is shown in Figure 1. Soil sample processing and specimen preparation were performed in strict accordance with GB/T 50123—2019, Standard for Geotechnical Testing Method [21].
The natural moisture content of 21% represents the condition of the collected soil sample rather than a uniform field value. Moisture contents of 15%, 25%, and 35% were selected as field-informed conditions for the principal frozen-soil strata, while 20% and 30% were added as intermediate conditions for the direct shear tests.

2.2. Direct Shear Test Program for the Pile–Soil Interface

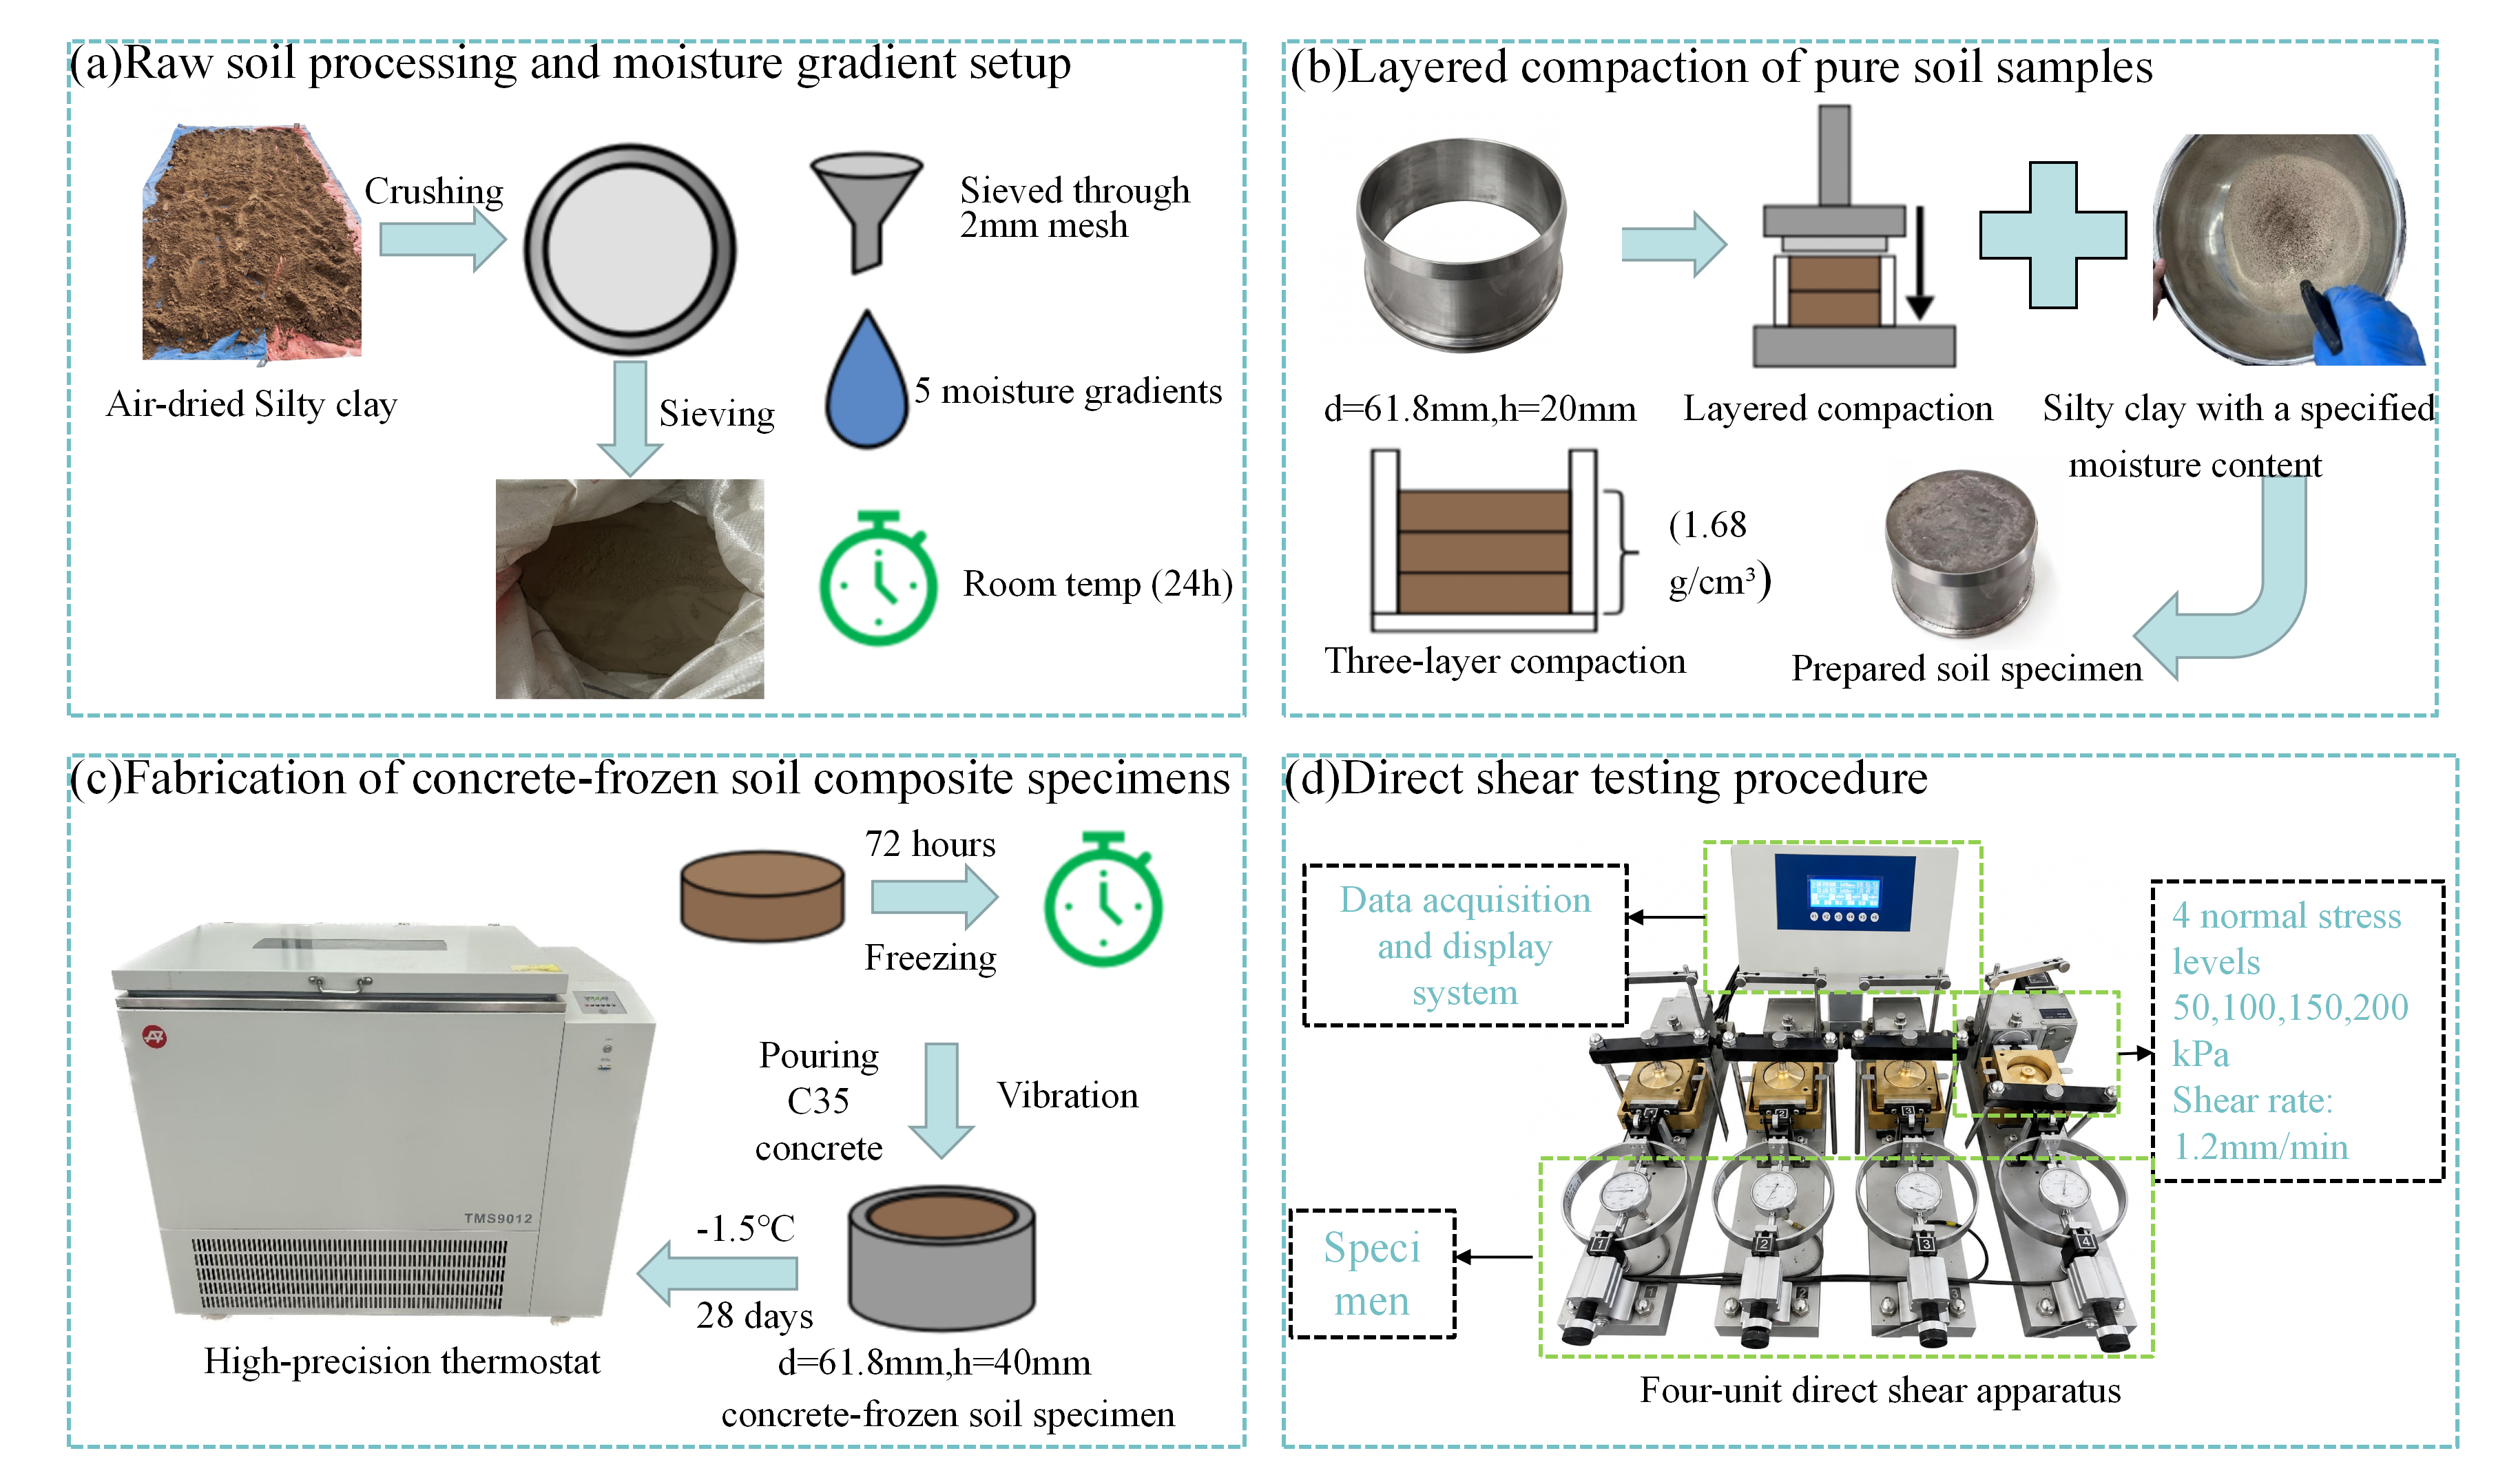
The test apparatus mainly consisted of a strain-controlled direct shear apparatus (ZJ type, Nanjing Soil Instrument Factory Co., Ltd., Nanjing, China), a data acquisition system, a programmable temperature-controlled environmental chamber (TW-WJ800, supplied by Urumqi Bodelier Trading Co., Ltd., Urumqi, China), and a forced-air drying oven.Soil specimens with target moisture contents of 15%, 20%, 25%, 30%, and 35% were prepared by layered compaction in cutting rings with an internal diameter of 61.8 mm and a height of 20 mm. The physical state parameters of the specimens, including dry density, void ratio, and degree of saturation, are summarized in Table 2. The specimens were then sealed to minimize moisture loss and prefrozen for 72 h in an environmental chamber maintained at −1.5 °C. This temperature was selected with reference to the measured mean annual ground temperature at the Chahannur No. 15 Bridge site and was used as the reference temperature for the laboratory tests. Although fresh concrete was cast onto the prefrozen soil, the direct shear specimens were not instrumented to verify a complete hydration-heat-induced thawing, moisture migration, and refreezing history comparable to that of the model pile tests. Owing to their small dimensions and sealed boundary conditions, the direct shear specimens also did not reproduce the spatial temperature gradients and moisture redistribution measured around the model piles.
Fresh concrete with a measured casting temperature of 5 °C and a nominal strength grade of C35 was then cast directly onto the frozen soil surface. The concrete mixture proportions used in the experiments are presented in Table 3. The resulting concrete–frozen-soil composite specimens were conditioned for 28 d in an environmental chamber maintained at −1.5 °C. Because no companion concrete specimens were tested, the actual compressive strength of the concrete after the 28 d low-temperature conditioning period was not determined.
For each moisture-content condition, four composite specimens were prepared, with one specimen tested under each normal stress of 50, 100, 150, and 200 kPa. Thus, one specimen was tested for each moisture-content–normal-stress combination (n = 1).
After the 28 d conditioning period, the specimens were removed from the environmental chamber, immediately transferred to the direct shear apparatus at room temperature, and tested at a shear rate of 1.2 mm/min. The overall specimen preparation and testing procedure is illustrated in Figure 2. The direct shear tests were conducted to establish baseline relationships among moisture content, normal stress, and concrete–frozen-soil interface strength under the adopted laboratory conditions.

2.3. Scaled Model Test Program

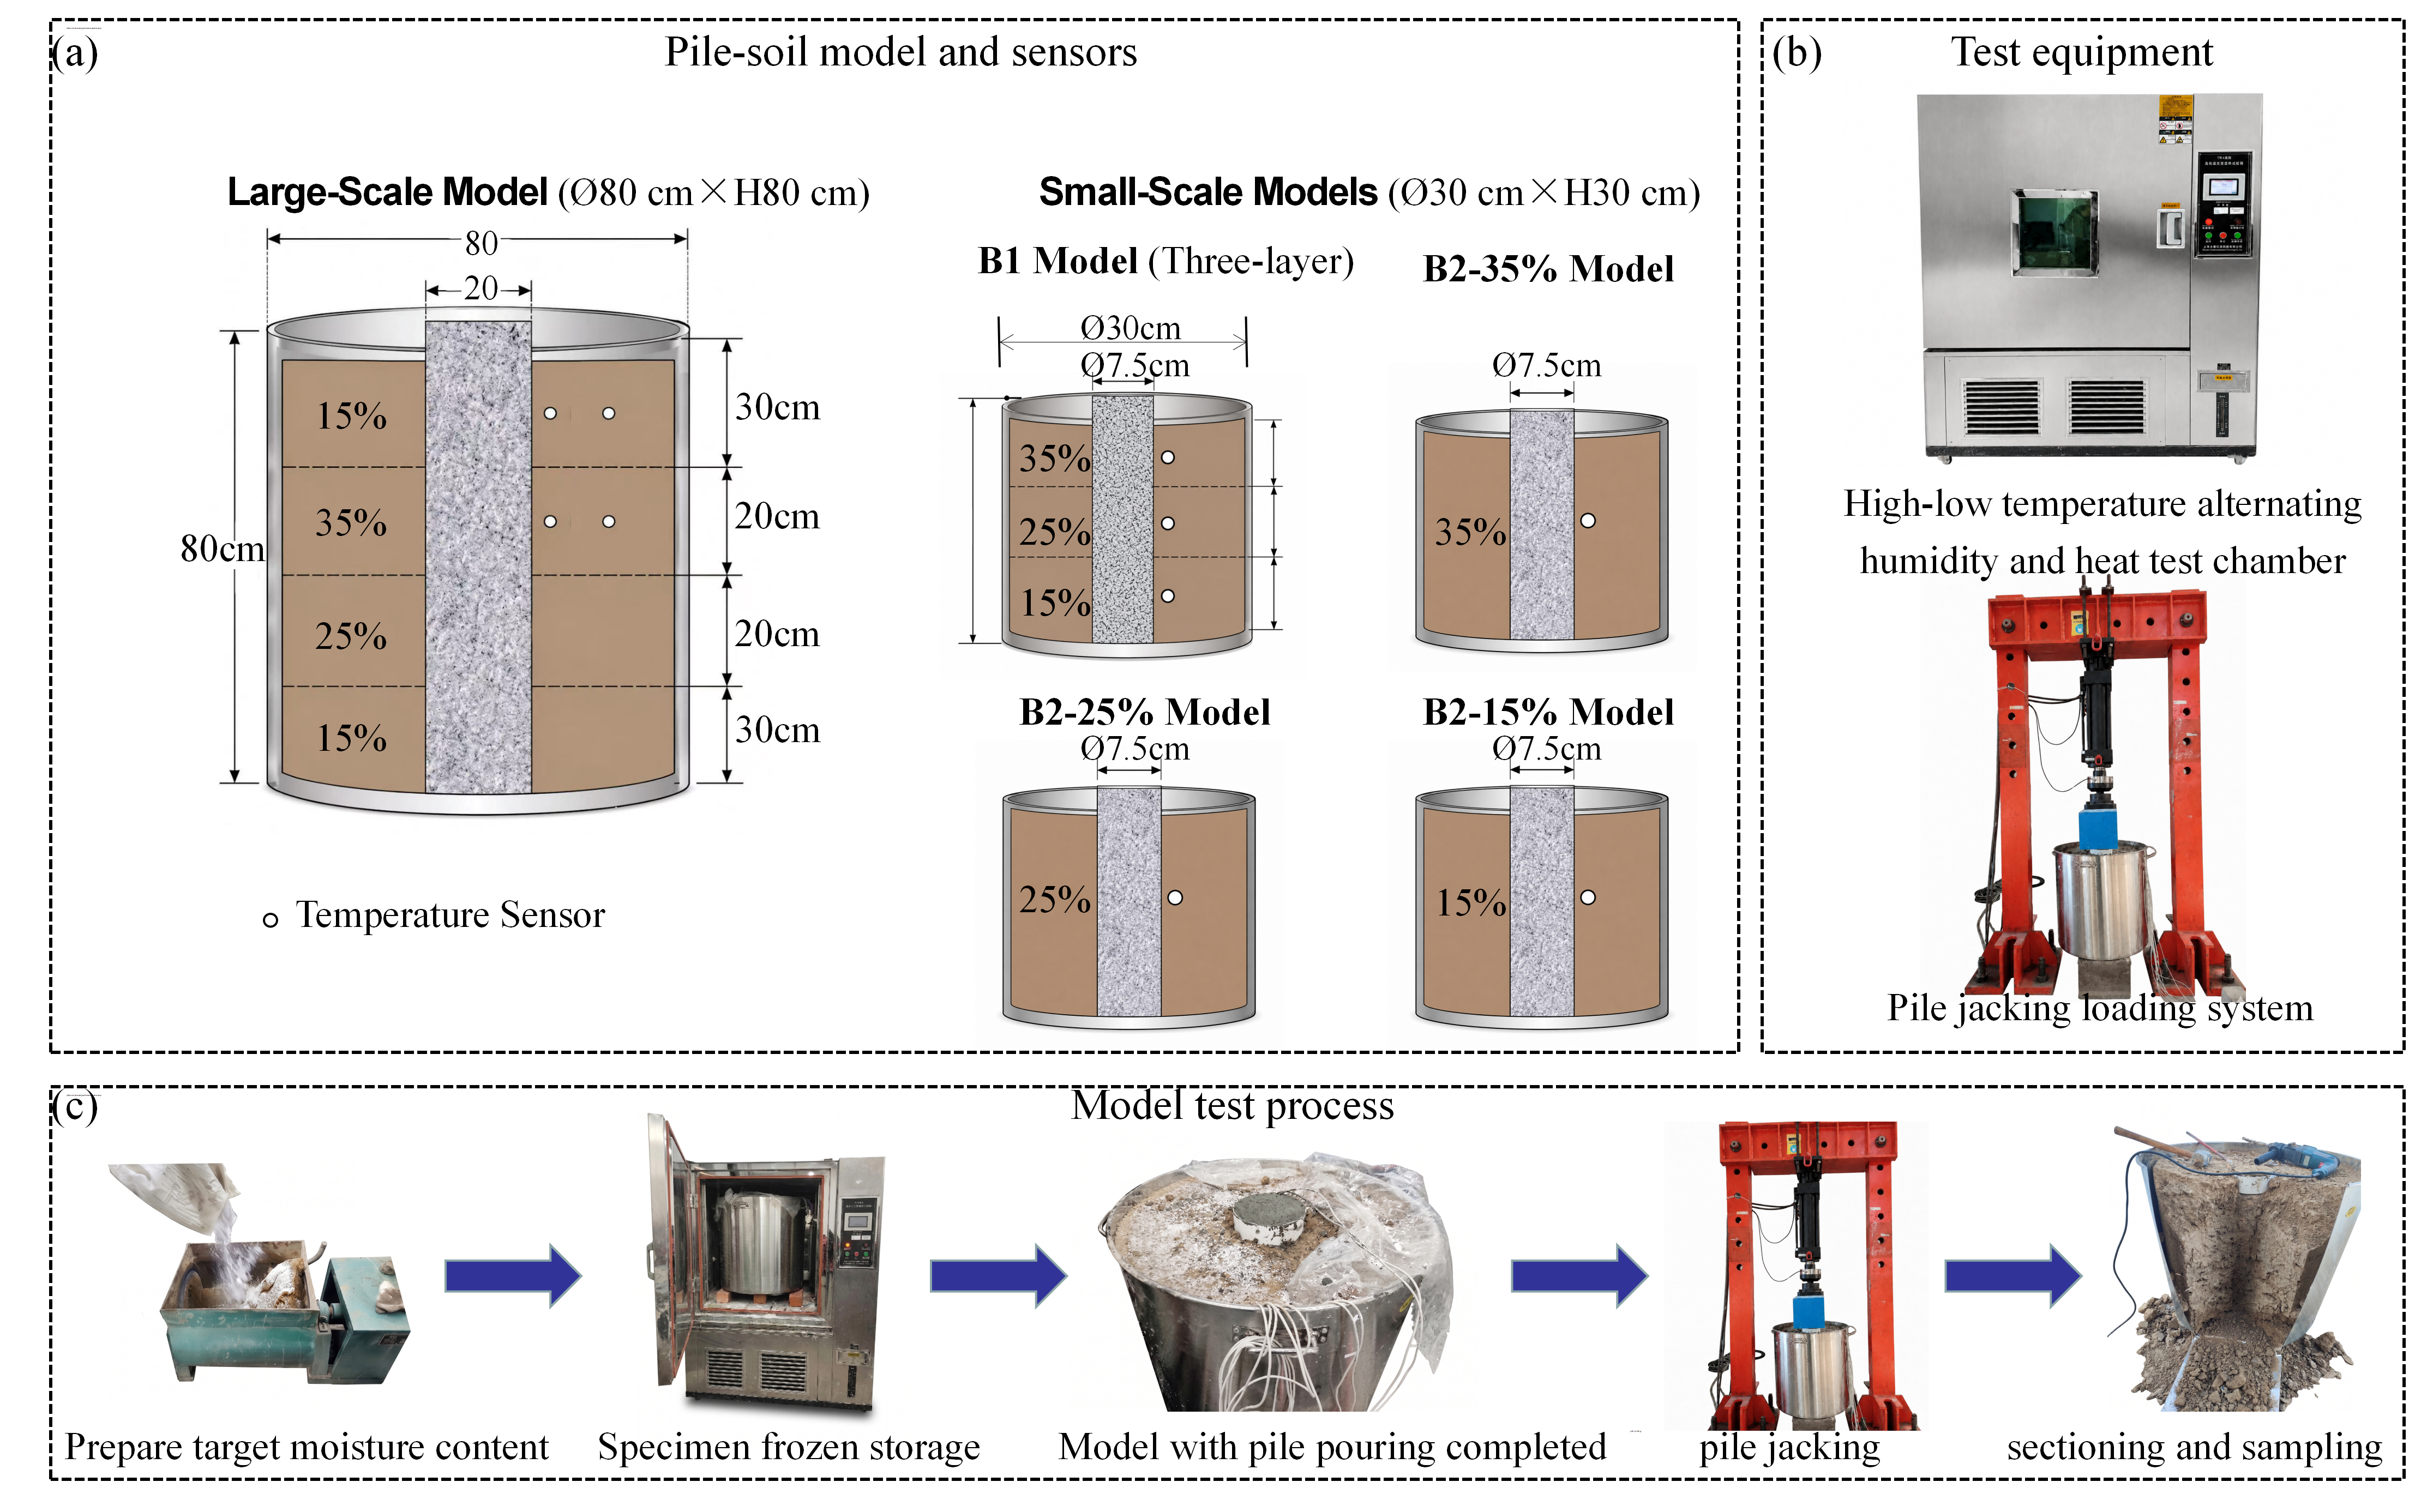
Based on the prototype cast-in-place pile of Chahannur No. 15 Bridge, which has a diameter of 1.5 m and a length of 24 m, two groups of reduced-scale pile–soil models were developed. The Group A and Group B model piles had diameters of 0.20 and 0.075 m, corresponding to pile-diameter ratios of 1:7.5 and 1:20, respectively. These ratios refer only to the pile diameter and do not represent complete geometric, thermal, hydraulic, material, or mechanical similitude. In particular, thermal diffusion time, freezing-front development, capillary transport, and freezing-induced moisture migration were not assumed to scale linearly with pile diameter. Accordingly, the experiments were treated as engineering-oriented reduced-scale pile–soil segment tests designed to investigate local hydrothermal responses and pile–soil interface behavior rather than as fully similar physical models.
The model test system consisted of cylindrical test containers, a hydraulic loading device, a data acquisition system, and a programmable temperature-controlled environmental chamber (TW-WJ800, supplied by Urumqi Bodelier Trading Co., Ltd., Urumqi, China), as shown in Figure 3b. The temperature-monitoring system consisted of embedded temperature sensors, a TRM128 temperature-measurement expansion module, and PC200W software (Campbell Scientific, Inc., Logan, UT, USA) for data acquisition and recording.
The Group A model was prepared in a container with an internal diameter and height of 800 mm. A circular through-opening with a diameter of 200 mm was provided at the center of the container base. During soil placement, a removable plastic tube with a diameter of 200 mm and a length of 900 mm was fixed through the opening to reserve the pile hole.
Five Group B models were prepared in containers with an internal diameter and height of 300 mm. Each container had a circular through-opening with a diameter of 75 mm at the center of its base. A removable plastic tube with a diameter of 75 mm and a height of 300 mm was used to reserve the pile hole.
The sensor layout is shown in Figure 3a. For the Group A model, temperature sensors were installed at radial distances of 0.5 and 5 cm from the pile surface and at depths of 10 and 30 cm. These sensors were used to monitor the radial and vertical temperature evolution of the surrounding soil. For the layered B1 model, temperature sensors were installed at a radial distance of 1 cm from the pile surface and at depths of 5, 15, and 25 cm. For the homogeneous Group B models, one temperature sensor was installed at a radial distance of 1 cm from the pile surface and a depth of 15 cm. These sensors were used to compare the soil temperature responses under different initial moisture contents.
The soil profile of the Group A model was divided into four layers. The prescribed moisture contents were 15%, 35%, 25%, and 15% from top to bottom. The layered B1 model consisted of three soil layers with prescribed moisture contents of 35%, 25%, and 15%. The homogeneous Group B models were prepared with uniform initial moisture contents of 15%, 25%, and 35%, respectively. Each soil layer was compacted, and the temperature sensors were embedded during soil placement.
After the surrounding soil had been placed and prefrozen to a stable condition, the plastic tubes were removed. Nominal C35 concrete was then cast directly into the reserved pile holes and compacted by vibration. The pile holes extended through the central openings in the container bases, and no soil layer was placed beneath the pile tips. The detailed fabrication procedure for the Group A model is shown in Figure 3c.
Vertical loading was conducted 28 d after concrete casting. Loading was initiated when the monitored temperatures of the surrounding soil had returned to approximately −1.5 °C and the temperature curves had become stable.
The model piles were loaded vertically at a displacement rate of 20 mm/min. This rate falls within the range of displacement rates reported for laboratory model pile tests by McLean et al. [22]. However, no loading-rate sensitivity tests were conducted in the present study. The pile-head load, displacement, and elapsed time were recorded simultaneously. Loading was terminated when the pile displacement reached 70 mm. After testing, the soil surrounding the pile was sectioned at predetermined depths and radial distances, and samples were collected from the designated locations for gravimetric moisture-content determination.
One reduced-scale model pile was tested for each experimental condition (n = 1). Independent replicate model pile tests were not conducted. Accordingly, the load–displacement, temperature, and moisture-distribution results are reported as individual experimental observations without statistical error bars.

3. Results

3.1. Shear Strength of the Frozen Pile–Soil Interface

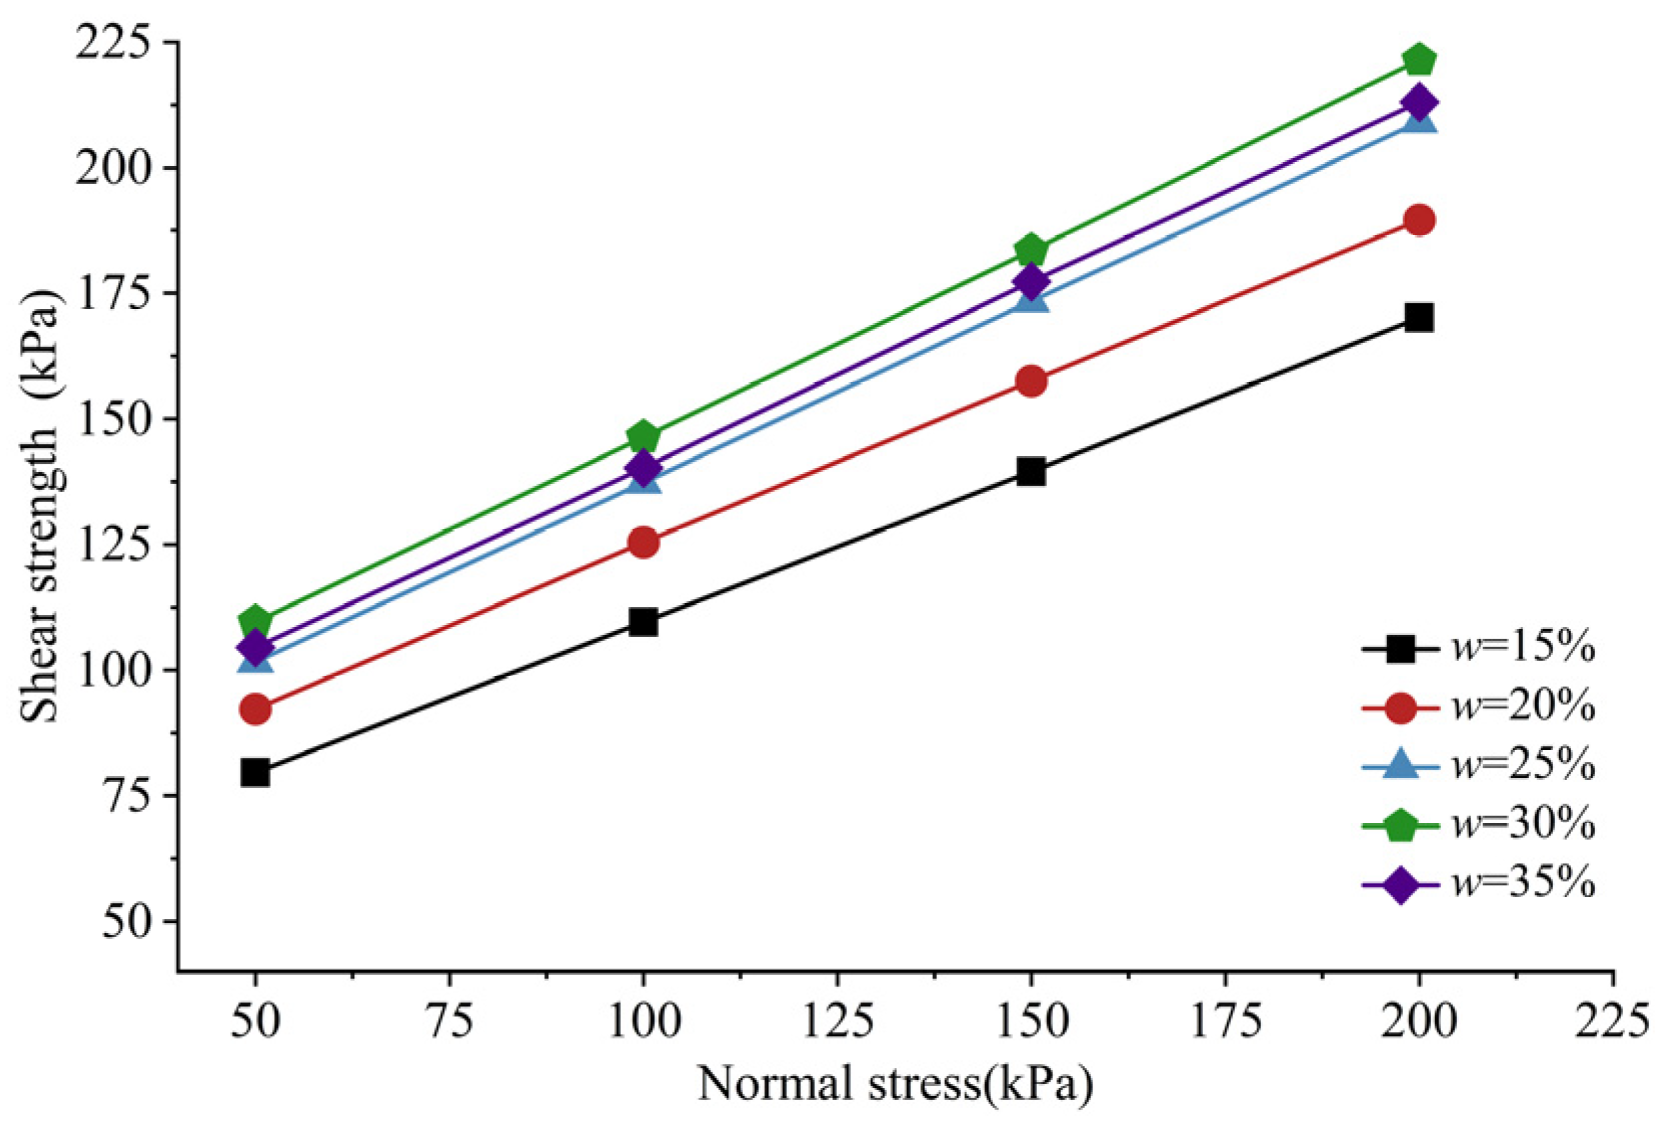
Table 4 presents the cohesion and internal friction angle of the concrete–frozen soil interface. Within the selected moisture content range, both the interface cohesion and internal friction angle exhibited a nonlinear trend, increasing first and then decreasing. At a moisture content of 30%, the cohesion and internal friction angle reached their maximum values. As the moisture content increased from 15% to 30%, the cohesion increased from 50 kPa to 71.6 kPa, while the internal friction angle increased from 31° to 36.6°. At this stage, the increase in ice crystal volume enhanced the mechanical interlocking between ice and the pile surface. When the moisture content exceeded 30%, excessive water caused ice crystal restructuring and separation between the pile surface and soil particles, thereby weakening the interfacial bonding. As a result, the freezing strength of the pile–soil interface decreased, and both cohesion and internal friction angle declined. Figure 4 shows the variation in shear strength of the pile–soil interface with normal stress under different initial moisture contents.

3.2. Temperature Field Evolution of Frozen Soil Around the Pile

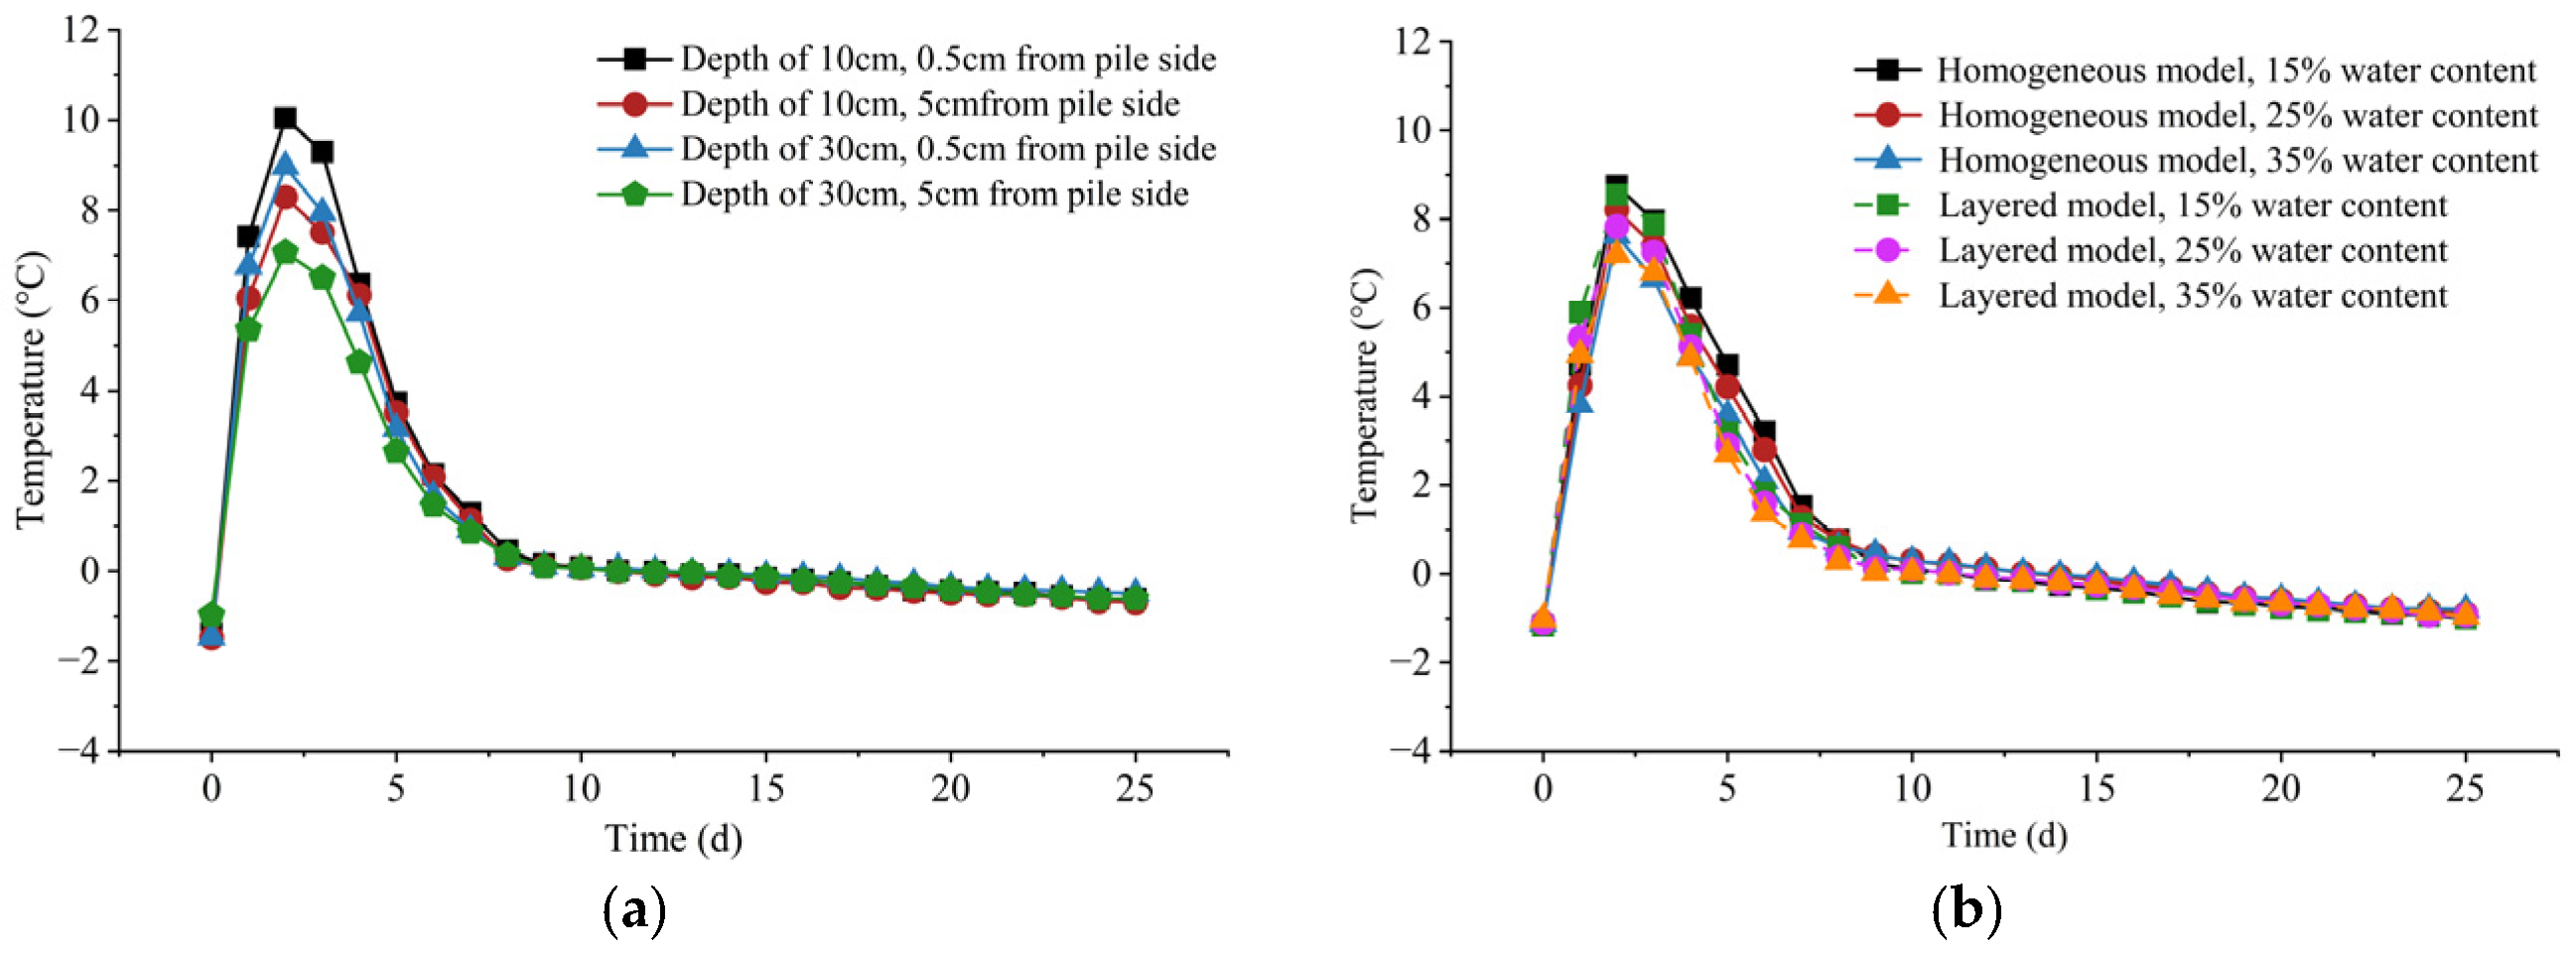
Figure 5 shows the variation in the temperature field of the frozen soil around the pile under different moisture contents, radial distances, and depths. The temperature variations at all monitoring points exhibited clear stage characteristics, which can be divided into three stages: rapid temperature rise, slow temperature decrease, and thermal stabilization. As shown in Figure 5a, the influence of hydration heat on the frozen soil around the pile decreased with increasing radial distance. In the soil layer with a moisture content of 15%, the peak temperature reached 10.08 °C at 0.5 cm from the pile, whereas it decreased to 8.35 °C at 5 cm from the pile. In the soil layer with a moisture content of 35%, the peak temperature at the corresponding monitoring points decreased from 8.99 °C to 7.57 °C. At the same radial distance, the peak temperature also varied among soil layers with different moisture contents, and a higher moisture content resulted in a smaller temperature rise. At 0.5 cm from the pile surface, the peak temperature in the 35% moisture-content layer was 1.09 °C lower than that in the 15% moisture-content layer, corresponding to a difference of approximately 10.8%. At 5 cm from the pile surface, the corresponding difference was 0.78 °C, or approximately 9.3%. The lower peak temperature rise at higher moisture contents may be attributed to the combined effects of phase-change heat absorption, sensible heat storage, and conductive heat dissipation. A higher moisture content increased the amount of heat required for pore-ice melting and soil warming within the phase-transition temperature range, thereby suppressing the local temperature rise. After partial thawing, the increased liquid-water content may also have enhanced heat transfer through the soil and promoted the dissipation of hydration heat away from the pile. Therefore, the measured peak temperature represented the net result of phase-change heat absorption, heat storage, and conductive heat transfer.
As shown in Figure 5b, differences in soil stratification and moisture content distribution jointly affected the temperature field. In the layered frozen soil system, the peak temperature of the 35% moisture content layer was 7.22 °C, which was 0.64 °C and 0.70 °C lower than those of the 25% and 15% moisture content layers, respectively. This further indicates that soil layers with higher moisture contents can inhibit the temperature rise induced by hydration heat to some extent. In addition, comparison between the layered frozen soil model pile and the homogeneous frozen soil model pile showed that, under the same moisture content, heat accumulation was more pronounced in the homogeneous frozen soil, and its overall temperature rise was greater than that in the layered system. In the 15% moisture content layer, the peak temperature of the homogeneous frozen soil model pile was 2.1% higher than that of the layered frozen soil model pile. In the 35% moisture content layer, the peak temperature of the homogeneous frozen soil model pile was further increased by 5.7% compared with that of the layered frozen soil model pile.

3.3. Moisture Redistribution in Frozen Soil Around the Pile


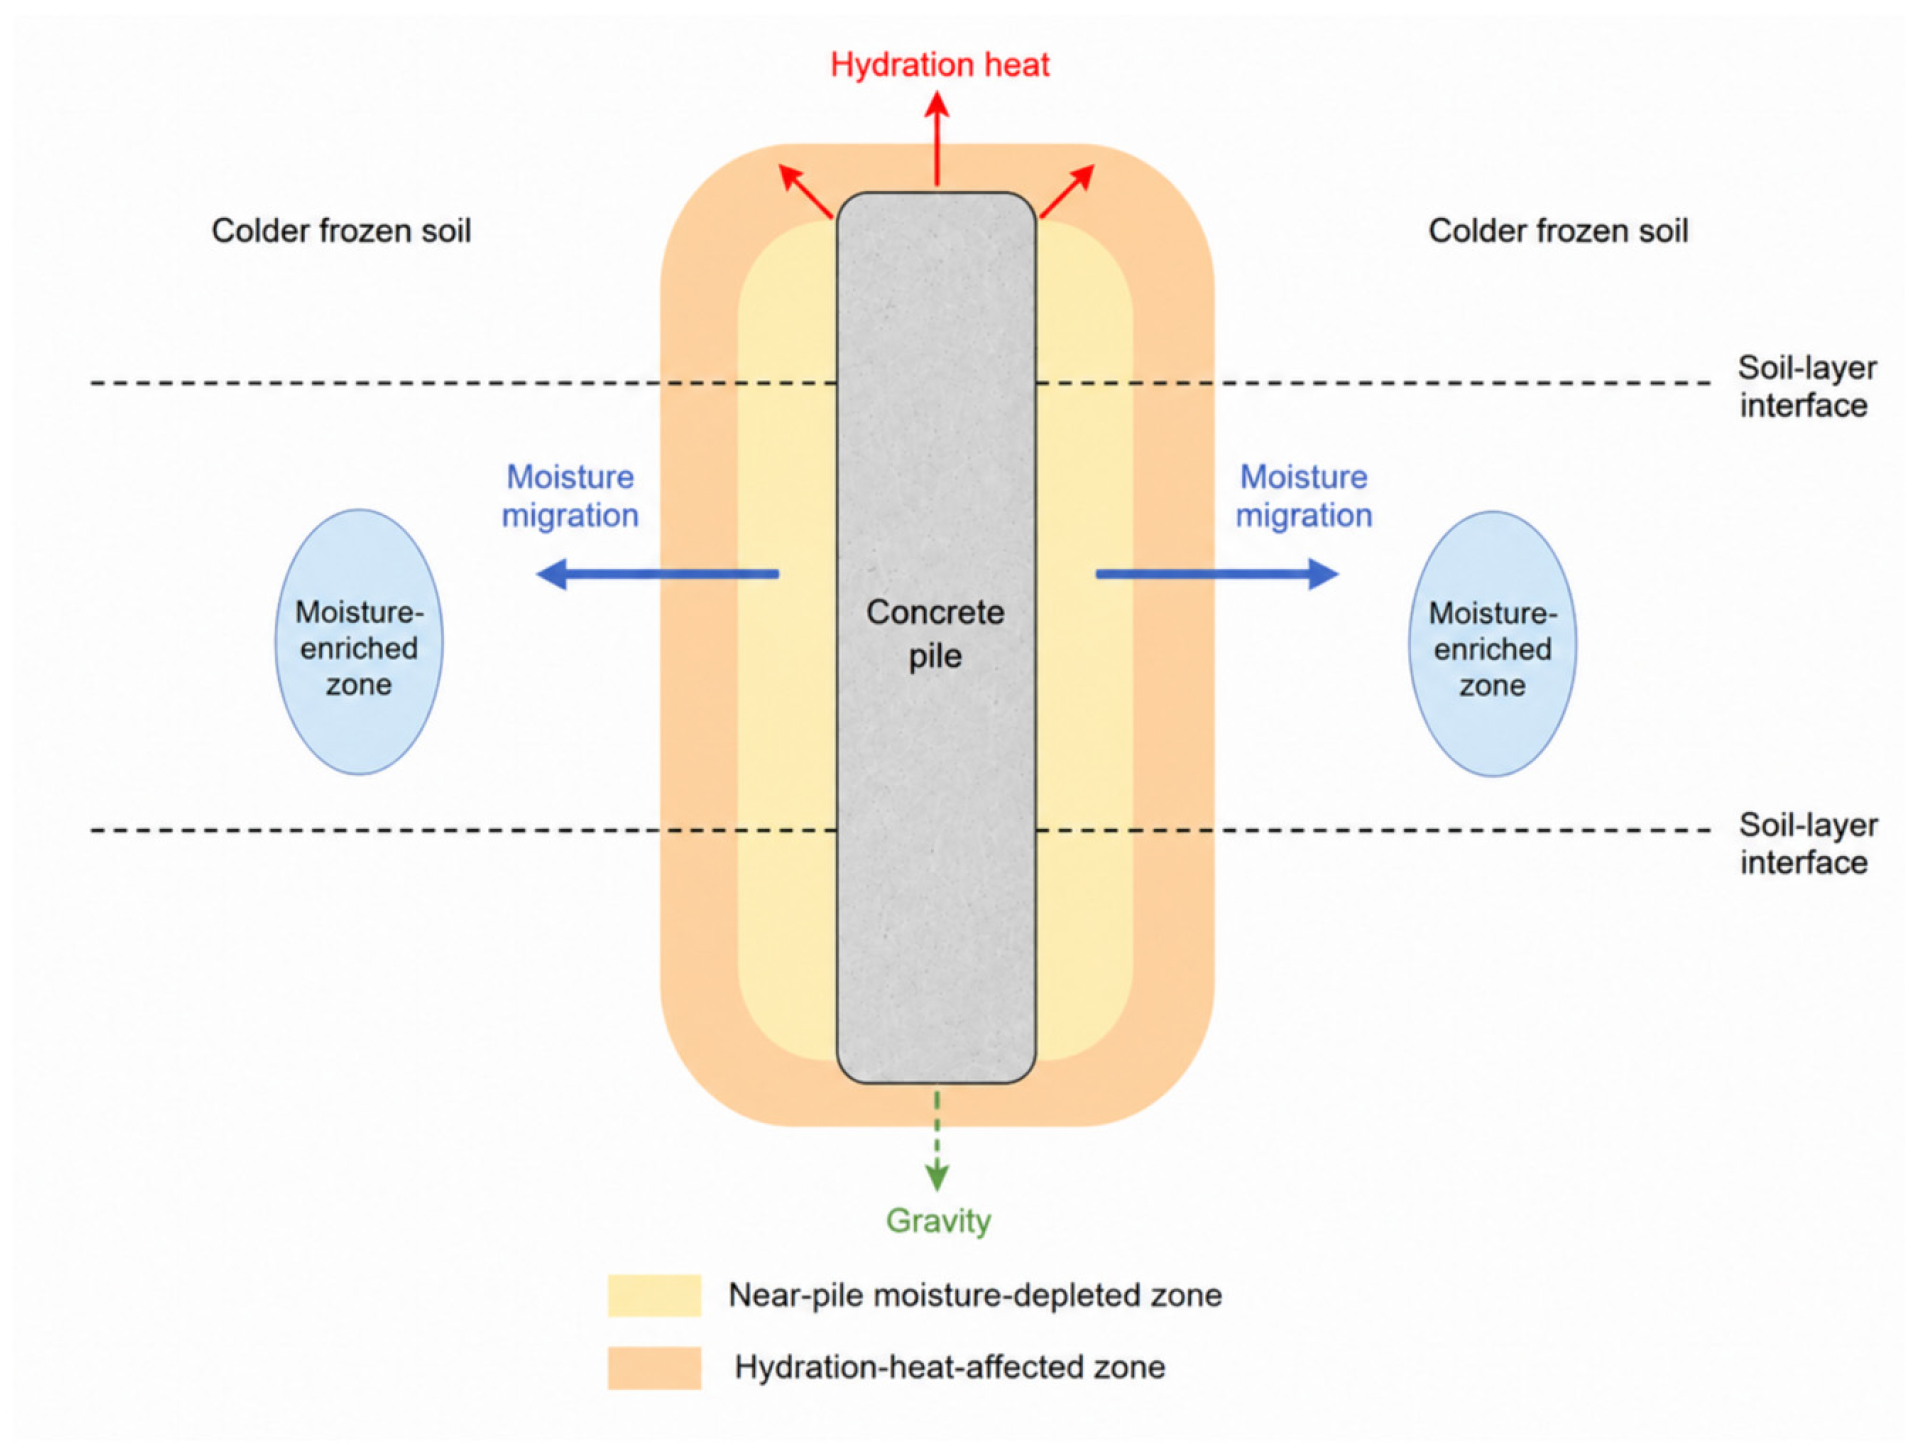
Figure 6, Figure 7 and Figure 8 illustrate the moisture redistribution process in the frozen soil surrounding the pile under different test conditions. The moisture-content profiles were constructed from gravimetric oven-drying measurements of soil samples collected after completion of the model tests. Driven by temperature gradients, gravity, and freezing suction induced by concrete hydration heat, unfrozen water migrated within the soil, leading to pronounced horizontal diffusion and vertical accumulation.
As shown in Figure 6, in the horizontal direction, the frozen soil close to the pile thawed rapidly, creating a large temperature difference with the frozen soil farther from the pile and producing a post-test moisture pattern consistent with outward migration toward the colder region. Within the range of 0.5–10 cm from the pile, the moisture content generally decreased, particularly under the initial moisture content of 35%, where the moisture loss rate in the near-pile region reached 18.7%. A transition zone with bidirectional moisture flow was formed at 15 cm from the pile, whereas significant moisture accumulation occurred at 30 cm from the pile, resulting in a marked increase in moisture content. In the vertical direction, the thawed free water infiltrated downward under gravity and was largely retained by water absorption when encountering the deep freezing front or interfaces between different soil layers. Eventually, moisture mainly accumulated at the soil layer interfaces, forming a distinct moisture migration front within the soil.
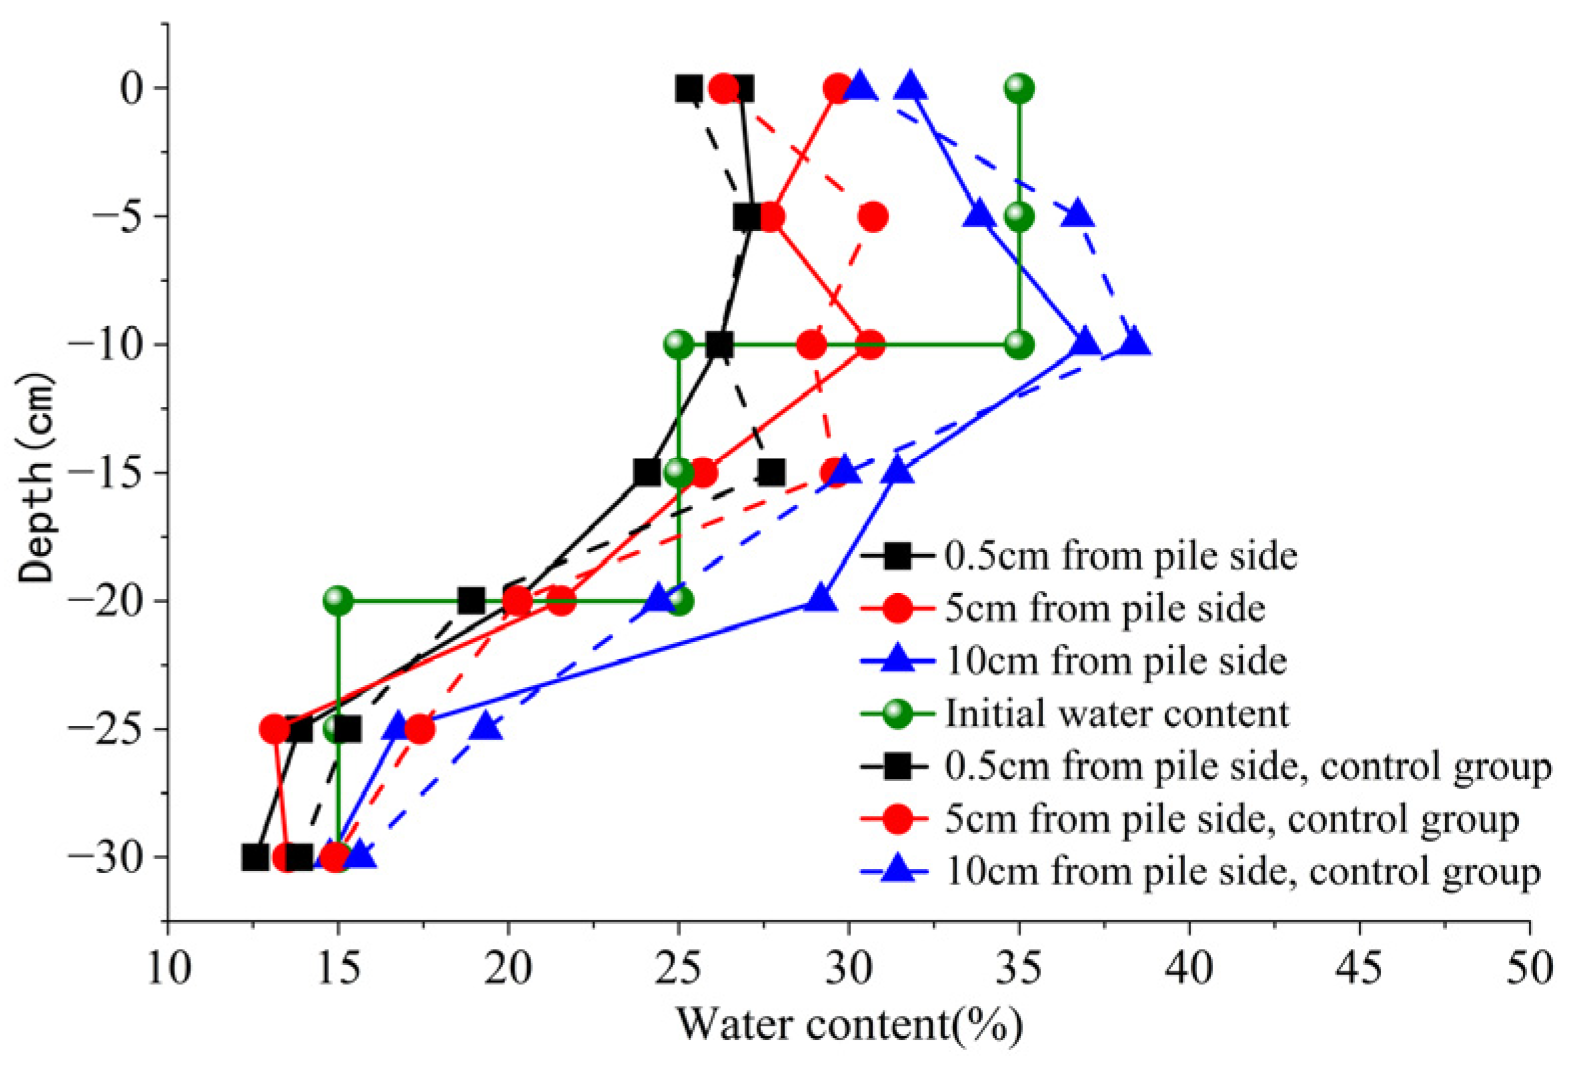
As shown in Figure 7, the moisture distribution in the layered frozen soil model pile was generally consistent with that observed. In the Group A model pile. The moisture redistribution profiles of the test container and the control container further confirmed that moisture migration in layered soil was driven not only by the temperature gradient but also by the soil layer interfaces. In the high-moisture layer at depths of 0 to −10 cm, moisture migration was dominated by strong lateral diffusion. Unfrozen water at the closest near-interface sampling position, located 0.5 cm from the pile surface, was rapidly depleted under the influence of hydration heat and migrated toward the colder region beyond 10 cm, forming a distinct outward moisture migration zone around the pile. In the transition layer from −10 to −20 cm, the soil exhibited a complex bidirectional accumulation pattern. This layer received free water infiltrating from the upper layer, while unfrozen water near its lower part continued to migrate downward under gravity. Owing to the presence of a distinct freezing front at depths of −15 to −20 cm, the moisture content profile suggests that this region was jointly affected by freezing suction and obstruction at the interlayer interface, resulting in an abnormal increase in moisture content and forming the most prominent moisture-enriched zone in the layered system. In the low-moisture layer at depths of −20 to −30 cm, unfrozen water near the pile was drawn upward against gravity by the freezing front above. The combined effect of upward suction and lateral outward migration caused severe moisture depletion in the deep near-pile region, producing an inclined distribution gradient characterized by inner-side drying and outer-side enrichment.
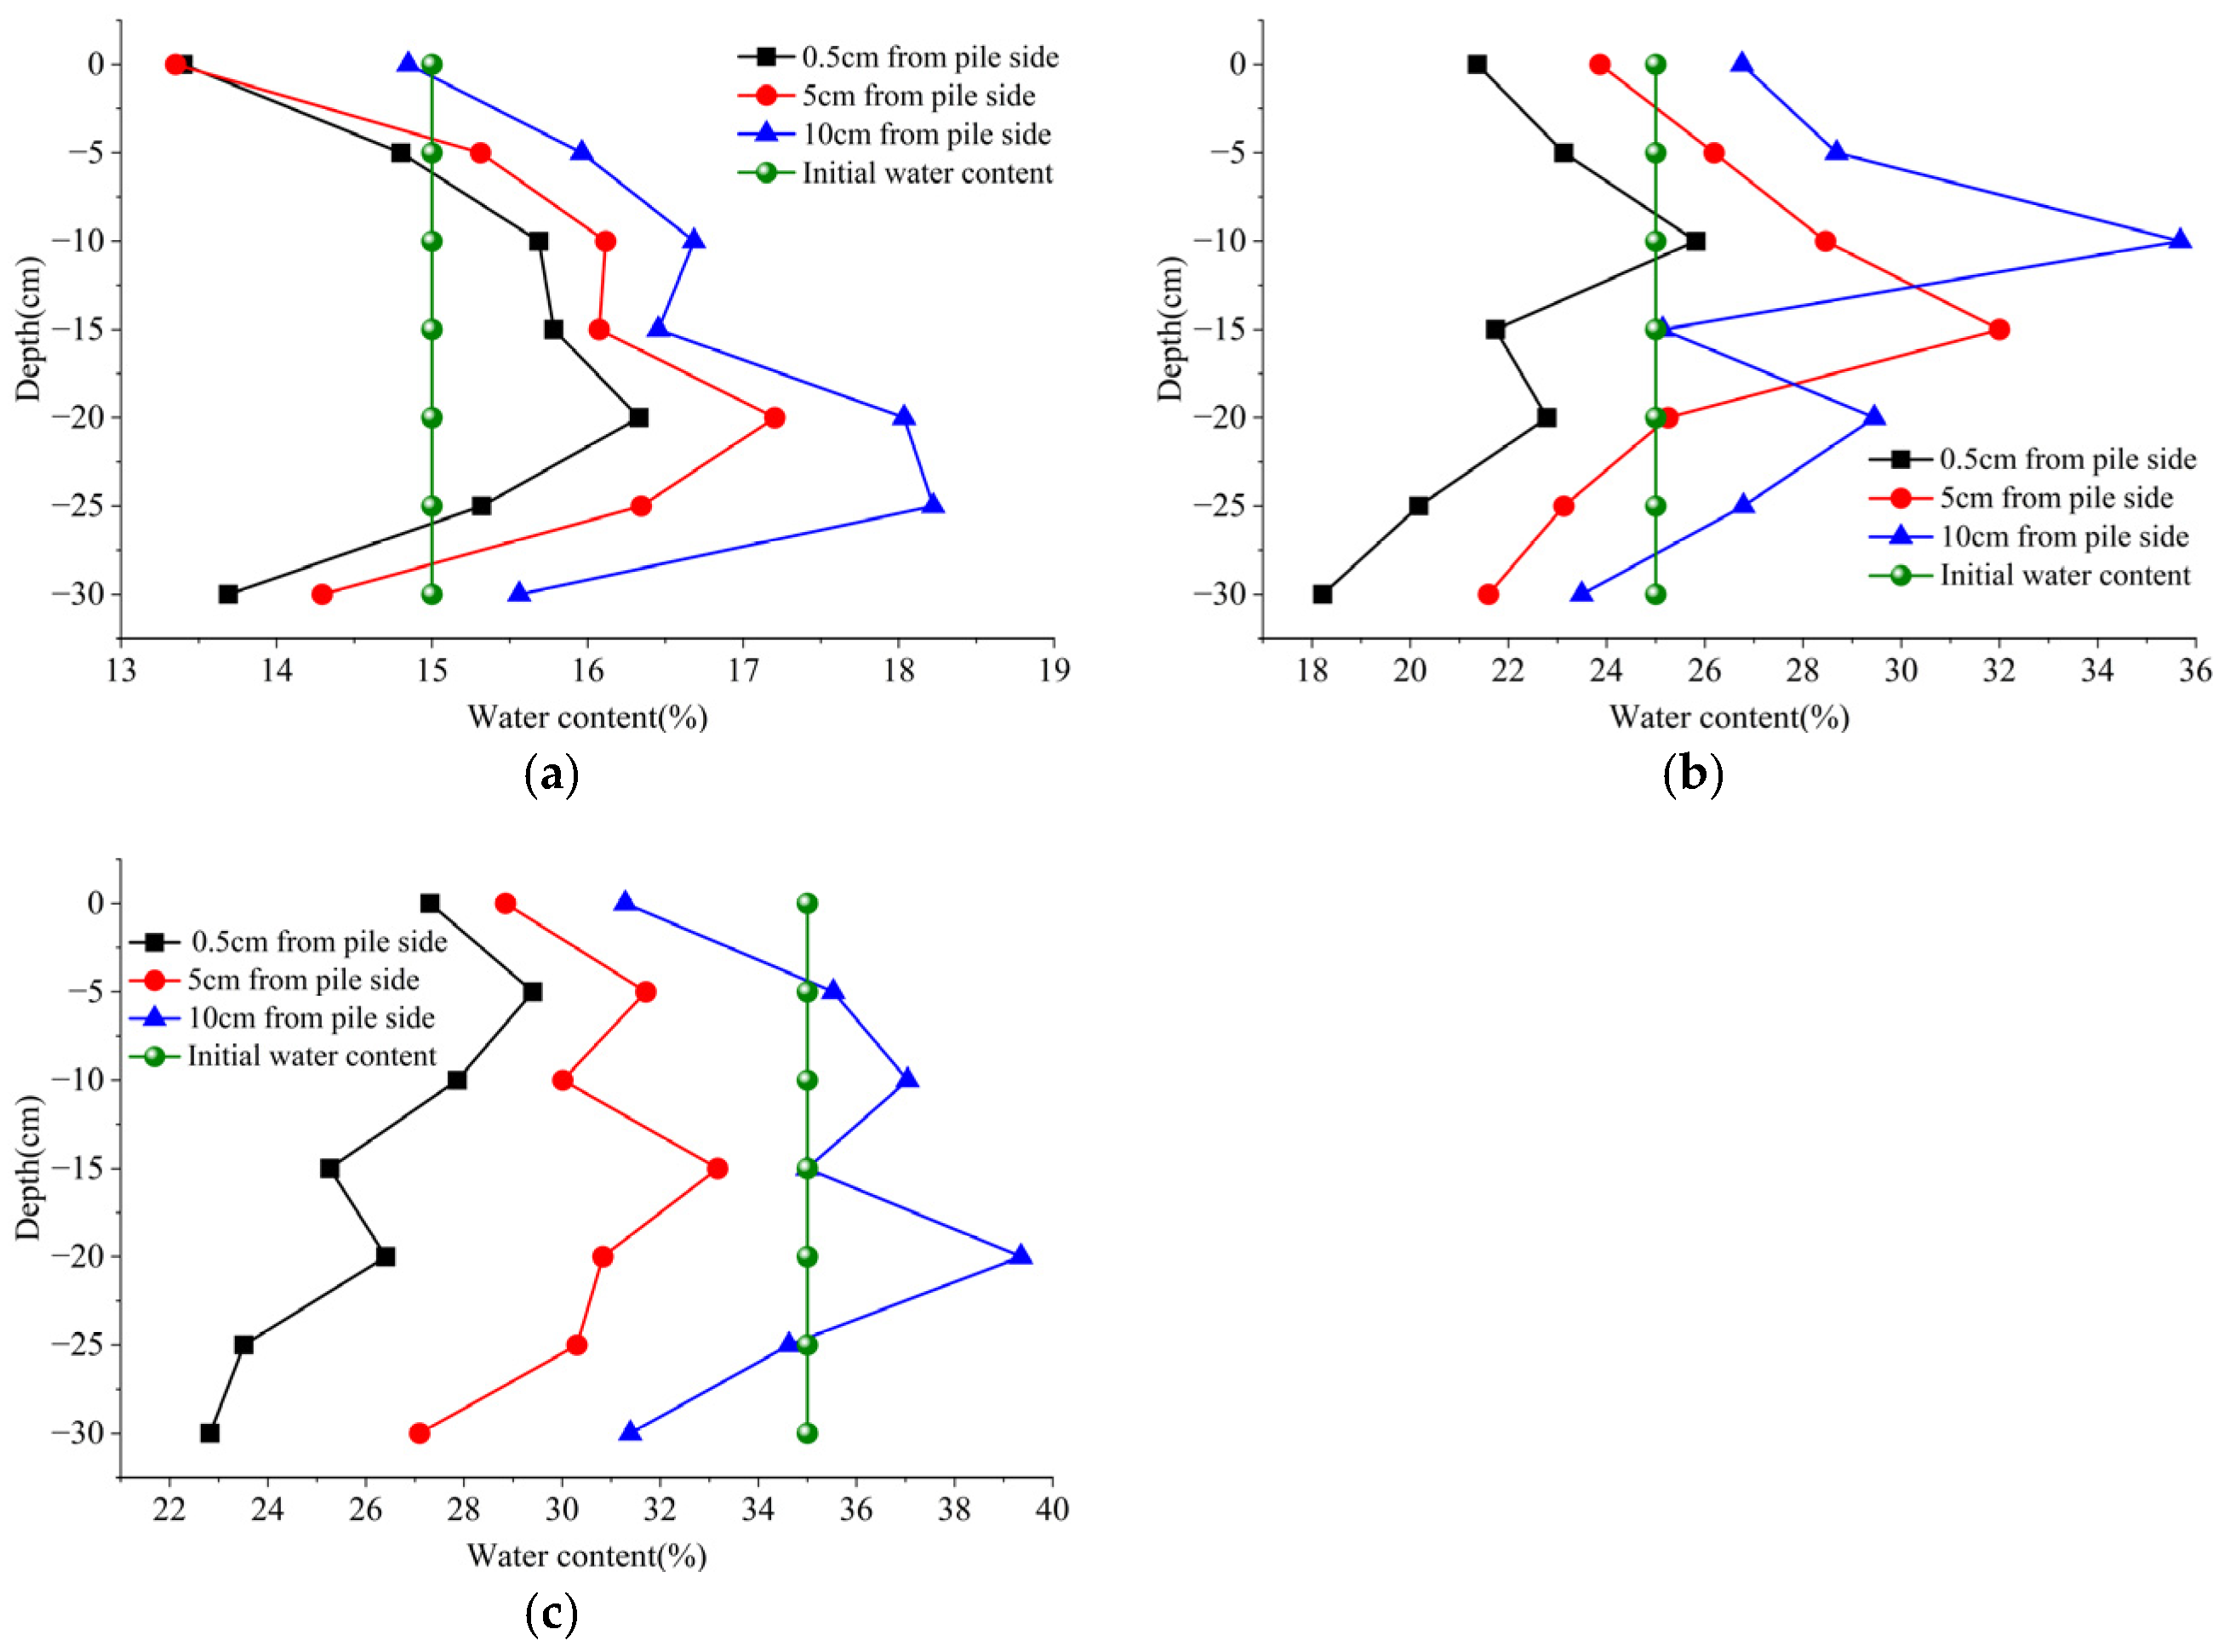
As shown in Figure 8, the moisture content of the frozen soil around the pile was markedly redistributed after hydration heat disturbance, and the intensity of moisture migration varied under different initial moisture contents. In the horizontal direction, within the upper 0–10 cm depth range, the moisture content of the 15% moisture content frozen soil decreased near the pile, whereas it increased to approximately 16.5% at 10 cm from the pile. With increasing initial moisture content, this migration became more pronounced. For the frozen soil with an initial moisture content of 35%, the moisture content decreased to approximately 28% at 0.5 cm from the pile, while it increased to approximately 37% at 10 cm from the pile. In the vertical direction, unfrozen water generated during thawing migrated not only outward from the pile but also downward under gravity. When moisture migrated to the freezing front in the middle–lower region, part of the water was retained and enriched owing to freezing-induced suction. Meanwhile, unfrozen water in the deeper region may have migrated upward under the combined effects of the temperature gradient and suction from the freezing front, forming a distinct moisture-enriched zone in the middle–lower part. Taking the frozen soil with an initial moisture content of 25% as an example, the moisture content near the pile decreased to approximately 20% at a depth of −25 cm, whereas it increased to approximately 30% at 10 cm from the pile. Eventually, the upward migration of bottom water against gravity overlapped with the downward infiltration of free water from the upper layer at a depth of −20 cm, inducing a significant moisture-enriched zone in the middle–lower region.
Based on the measured temperature evolution and post-test gravimetric moisture-content distributions, a conceptual model of moisture redistribution around the cast-in-place pile is presented in Figure 9. Hydration heat produced a warmed and locally thawed or partially thawed zone adjacent to the pile, while the soil farther from the pile remained relatively cold. The resulting radial temperature gradient promoted outward migration of unfrozen water from the near-pile region, whereas gravity contributed to downward movement. The outward migration represents the combined effects of the temperature gradient, capillary action, and freezing suction. Consequently, moisture-depleted zones developed near the pile, while localized moisture enrichment occurred in colder outer regions and near soil-layer interfaces.

3.4. Bearing Failure Characteristics of the Pile–Soil System

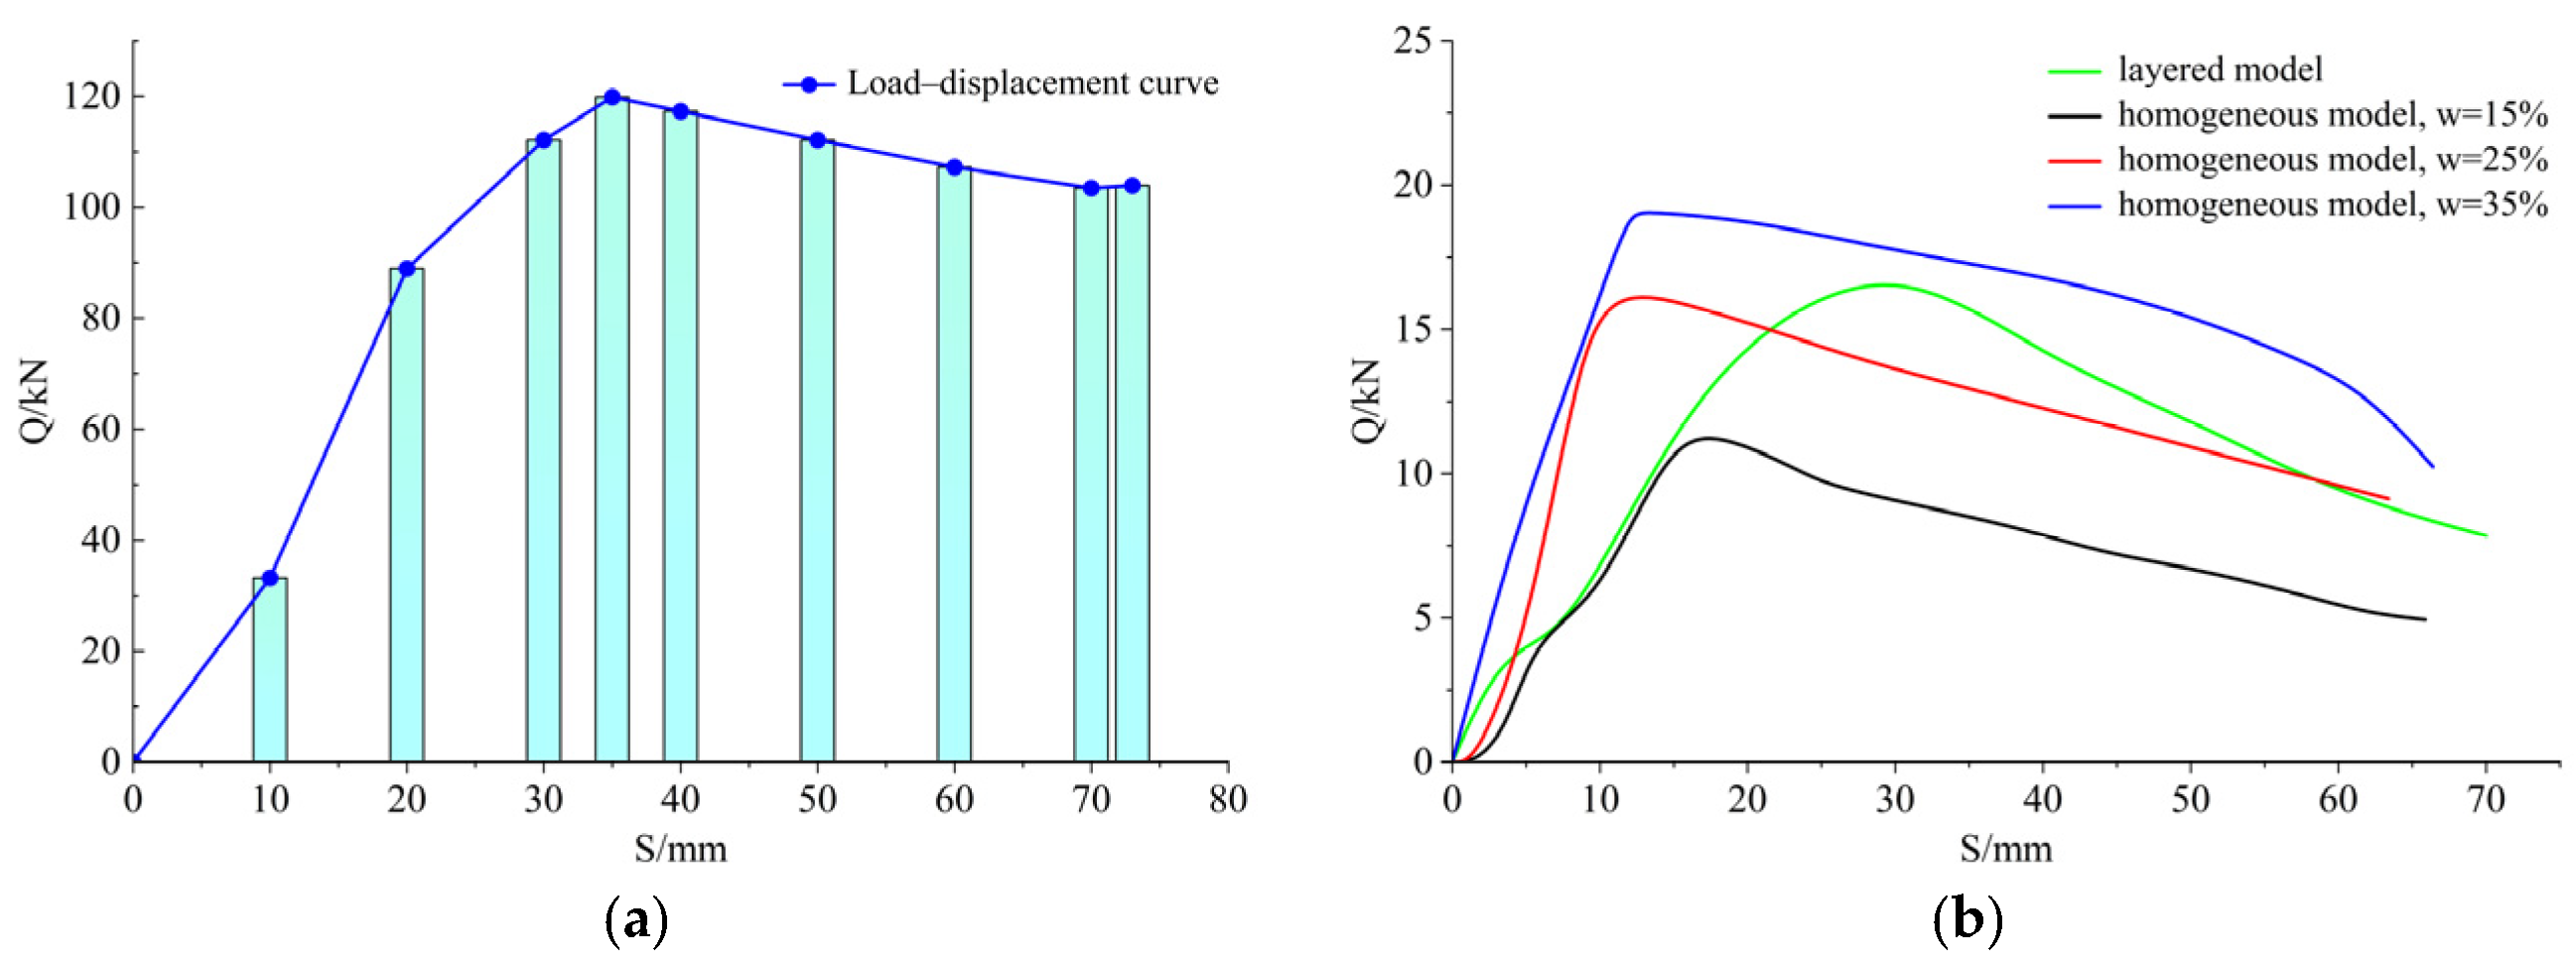
Figure 10 shows the load–displacement curves obtained from the vertical pile compression tests after the monitored soil temperatures had returned to a stable subzero condition. Overall, the curves of all groups exhibited clear stage characteristics, which can be divided into the elastic growth stage, peak failure stage, and residual bearing stage. In the elastic growth stage, the frozen pile–soil interface maintained favorable ice bonding and mechanical interlocking, and the load increased rapidly with increasing displacement. When the ice-bonded structure at the interface reached its limit, the curves entered the peak failure stage, during which the load decreased to varying degrees. Subsequently, the bearing capacity was mainly maintained by residual friction and local ice bonding between the pile and the surrounding frozen soil, and the curves gradually entered the residual stable stage.
As shown in Figure 10a, the large-scale model pile exhibited good integrity and bearing stiffness at the pile–soil interface during the initial loading stage, with the pile-head load increasing approximately linearly. When the displacement reached the critical value of 35 mm, an abrupt interface failure occurred, leading to rapid failure, and the load reached a peak value of 120.13 kN. Subsequently, shear failure developed along the interface, and the bearing capacity decreased rapidly. When the displacement exceeded 60 mm, the load gradually stabilized at approximately 100 kN. The design value of pile shaft resistance calculated based on the initial moisture content obtained from site investigation was 105.17 kN. The absolute difference was 14.96 kN. Using the measured peak resistance as the reference, the relative deviation was 12.45%.
As shown in Figure 10b, for the layered frozen soil system, moisture near the pile migrated outward toward the colder region and soil layer interfaces under the disturbance of concrete hydration heat, reducing the moisture content adjacent to the pile and weakening the interfacial ice bonding. As a result, early shear failure occurred in the layered frozen soil model pile at a relatively small displacement. The load reached a peak value of 17.59 kN at a displacement of approximately 9.6 mm and then rapidly decreased to approximately 7.5 kN. The residual shaft resistance was approximately 42% of the peak value, indicating a post-peak resistance reduction of approximately 58%.
Compared with the layered frozen soil system, the shaft resistance of the homogeneous frozen soil system generally increased with increasing initial moisture content. The peak shaft resistances of the model piles with moisture contents of 15%, 25%, and 35% were 11.53, 16.66, and 19.12 kN, respectively. When the moisture content increased from 15% to 25%, the peak shaft resistance increased by approximately 44.49%. When the moisture content further increased from 25% to 35%, the peak shaft resistance increased by approximately 14.76%, although the growth rate decreased. This result is consistent with the nonlinear variation in interface shear strength with moisture content observed in the direct shear tests, indicating that an appropriate moisture content enhances ice bonding, whereas excessive moisture may limit further strength improvement because of the thickening of the unfrozen water film.
The B1 model reached its peak load at a relatively small displacement, after which its resistance decreased by approximately 58% from the peak value. In contrast, the homogeneous B2 model exhibited a more stable load–displacement response. Thus, the layered soil configuration resulted in a slightly higher peak resistance but poorer deformation capacity and post-peak stability. This early loss of resistance may be related to the nonuniform interface conditions induced by soil stratification and moisture redistribution, which may have facilitated localized failure and progressive debonding along the pile shaft.

3.5. Empirical Relationship for Equivalent Shaft Resistance


To establish a moisture-dependent baseline parameter for the concrete–frozen-soil interface, the direct shear results obtained under normal stresses of 50, 100, 150, and 200 kPa were fitted using the Mohr–Coulomb criterion. The zero-normal-stress intercept, denoted as cint, was used to characterize the baseline interface adhesion. Based on the variation shown in Figure 11, the relationship between the interface adhesion and moisture content was fitted as:
cint(w) = exp(3.028 + 0.0773w − 0.00122w2)
where cint(w) denotes the zero-normal-stress Mohr–Coulomb intercept of the concrete–frozen-soil interface, in kPa, and w denotes the soil moisture content, in %.
Equation (1) was fitted using five prescribed gravimetric moisture contents of 15%, 20%, 25%, 30%, and 35% for the silty-clay–concrete interface specimens used in this study. The specimens were conditioned for 28 d at −1.5 °C and were sheared immediately after transfer to the room-temperature direct shear apparatus. Therefore, Equation (1) should be regarded as a preliminary empirical interpolation applicable only within the tested moisture-content range of 15–35% and under soil, concrete, preparation, thermal-history, and loading conditions comparable to those adopted in the present experiments.
In principle, the local shear resistance of the pile–soil interface includes both adhesive and frictional components and may be expressed in the Mohr–Coulomb form:
τi(w,z) = cint(w) + σ′n(z)tanδ(w)
where σ′n(z) is the effective normal stress acting on the pile surface and δ(w) is the interface friction angle. However, the radial normal stress acting along the model pile was not measured in the present tests. Therefore, the adhesive and frictional contributions could not be independently separated from the pile compression results.
Owing to the isolated pile-tip boundary, the measured peak pile-head load was interpreted primarily as shaft resistance. For the homogeneous B2 model piles, the average equivalent unit shaft resistance was back-calculated as:
[ Q p e a k π D L ]
where Qpeak is the measured peak pile-head load, D is the model pile diameter, and L is the effective pile–soil contact length.
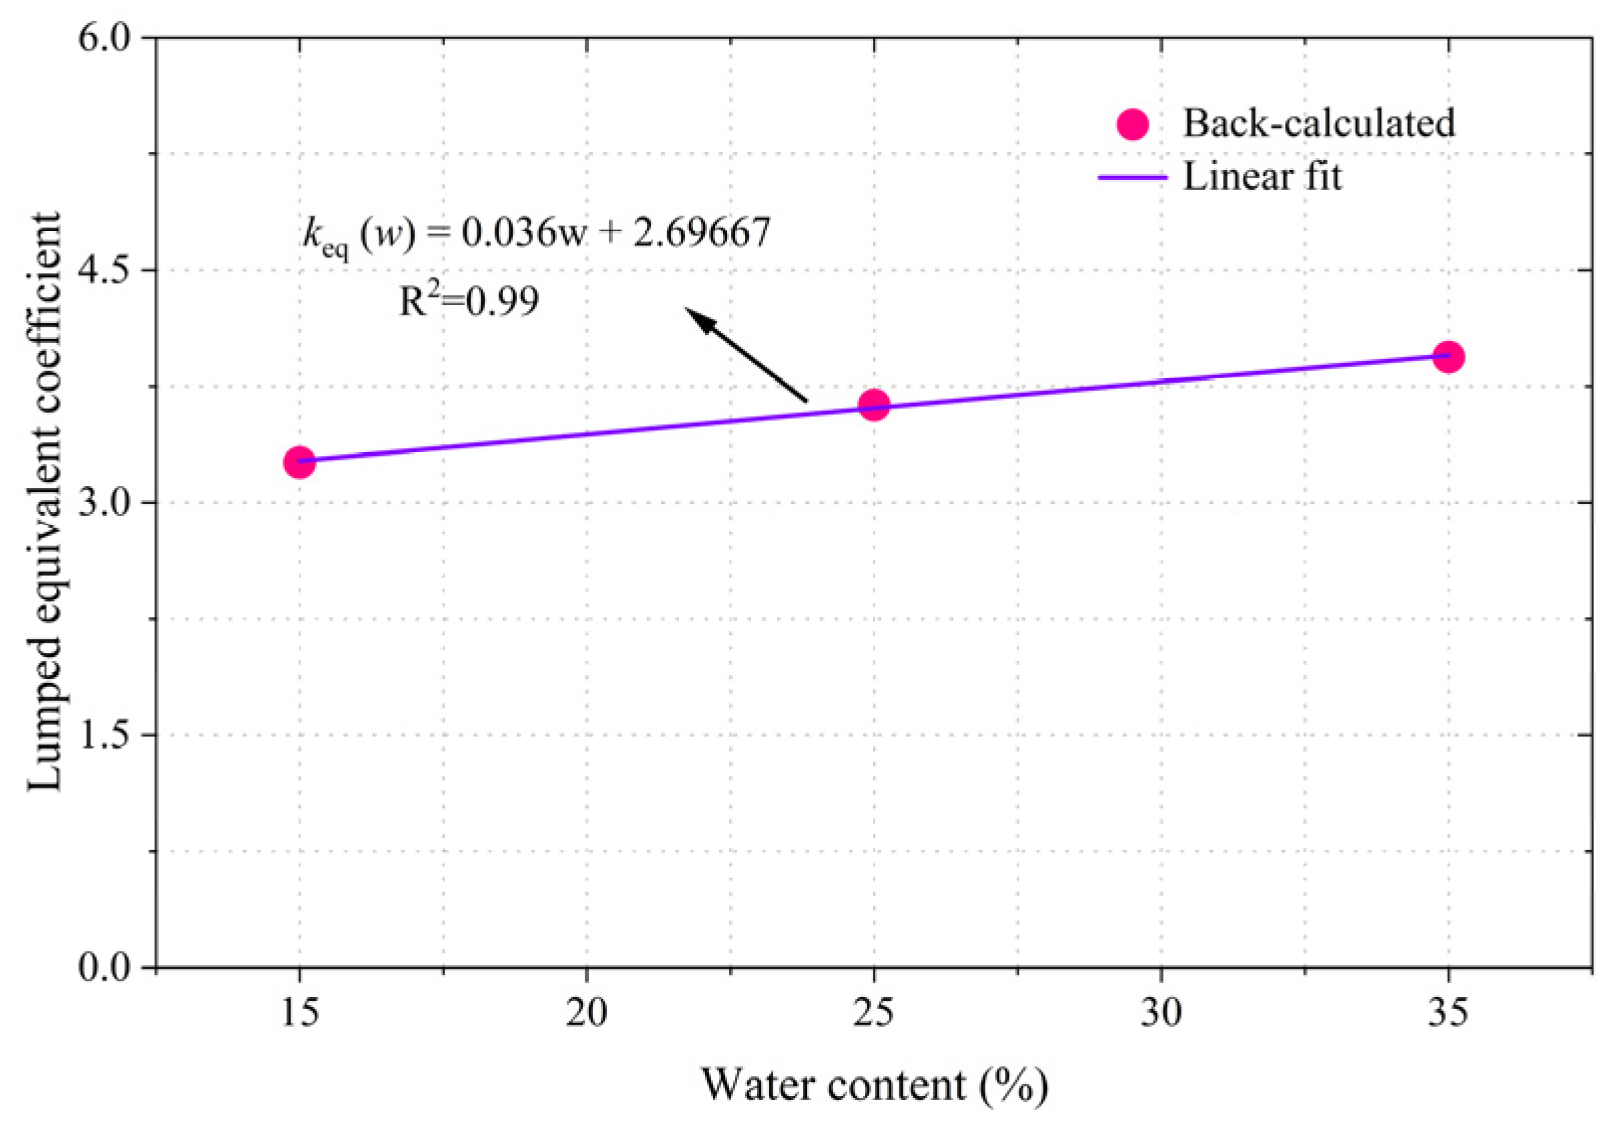
The back-calculated equivalent shaft resistances at moisture contents of 15%, 25%, and 35% were 163.20, 235.81, and 270.63 kPa, respectively. An equivalent empirical coefficient, keq, was defined as:
k e q ( w j ) = τ p i l e ( w j ) c i n t , m e a s ( w j )
where cint,meas denotes the measured Mohr–Coulomb intercept at the corresponding moisture content. The resulting keq values at moisture contents of 15%, 25%, and 35% were 3.26, 3.63, and 3.94, respectively. As shown in Figure 12, the three back-calculated values exhibit an approximately linear increase with moisture content and were fitted using the following empirical relationship:
keq(w) = 0.036w + 2.69667 (R2 = 0.99)
The coefficient keq should not be interpreted as a correction coefficient representing moisture migration or ice bonding alone. Rather, it is a lumped empirical coefficient that collectively incorporates interface friction, radial confinement, refreezing-induced ice bonding, moisture redistribution, loading-rate effects, and other model-specific factors that were not measured separately.
The relationship between keq and moisture content was calibrated using only three homogeneous B2 model pile tests with initial moisture contents of 15%, 25%, and 35%. Therefore, the high coefficient of determination reflects only the internal consistency of these three calibration points and does not demonstrate that the relationship is uniquely linear. The equation should be regarded as a preliminary, model-specific empirical interpolation applicable only within the tested moisture-content range of 15–35% and under conditions comparable to those adopted in the present experiments. It should not be extrapolated beyond this range or interpreted as an intrinsic material relationship.
Figure 12. Relationship between soil moisture content and the lumped equivalent coefficient back-calculated from the homogeneous B2 model pile tests.
Infrastructures 11 00282 g012
By combining Equations (1) and (5), the empirical equivalent shaft resistance can be expressed as:
τeq(w) = keq(w)cint(w) = (0.036w + 2.69667)exp(3.028 + 0.0773w − 0.00122w2)
where τeq(w) denotes the empirically estimated equivalent shaft shear stress under the adopted model conditions. Equation (6) combines the moisture-dependent Mohr–Coulomb intercept obtained from the direct shear tests in Equation (1) with the lumped equivalent coefficient calibrated from the three homogeneous B2 model pile tests in Equation (5). The Group A and layered B1 results were not included in the calibration and were used only for a preliminary cross-configuration assessment. Therefore, Equation (6) should be regarded as a preliminary, model-specific empirical interpolation applicable within the tested moisture-content range of 15–35% and under conditions comparable to those adopted in this study.
The relative deviation was consistently calculated using the measured peak pile-head load as the denominator:
t c L 2 α
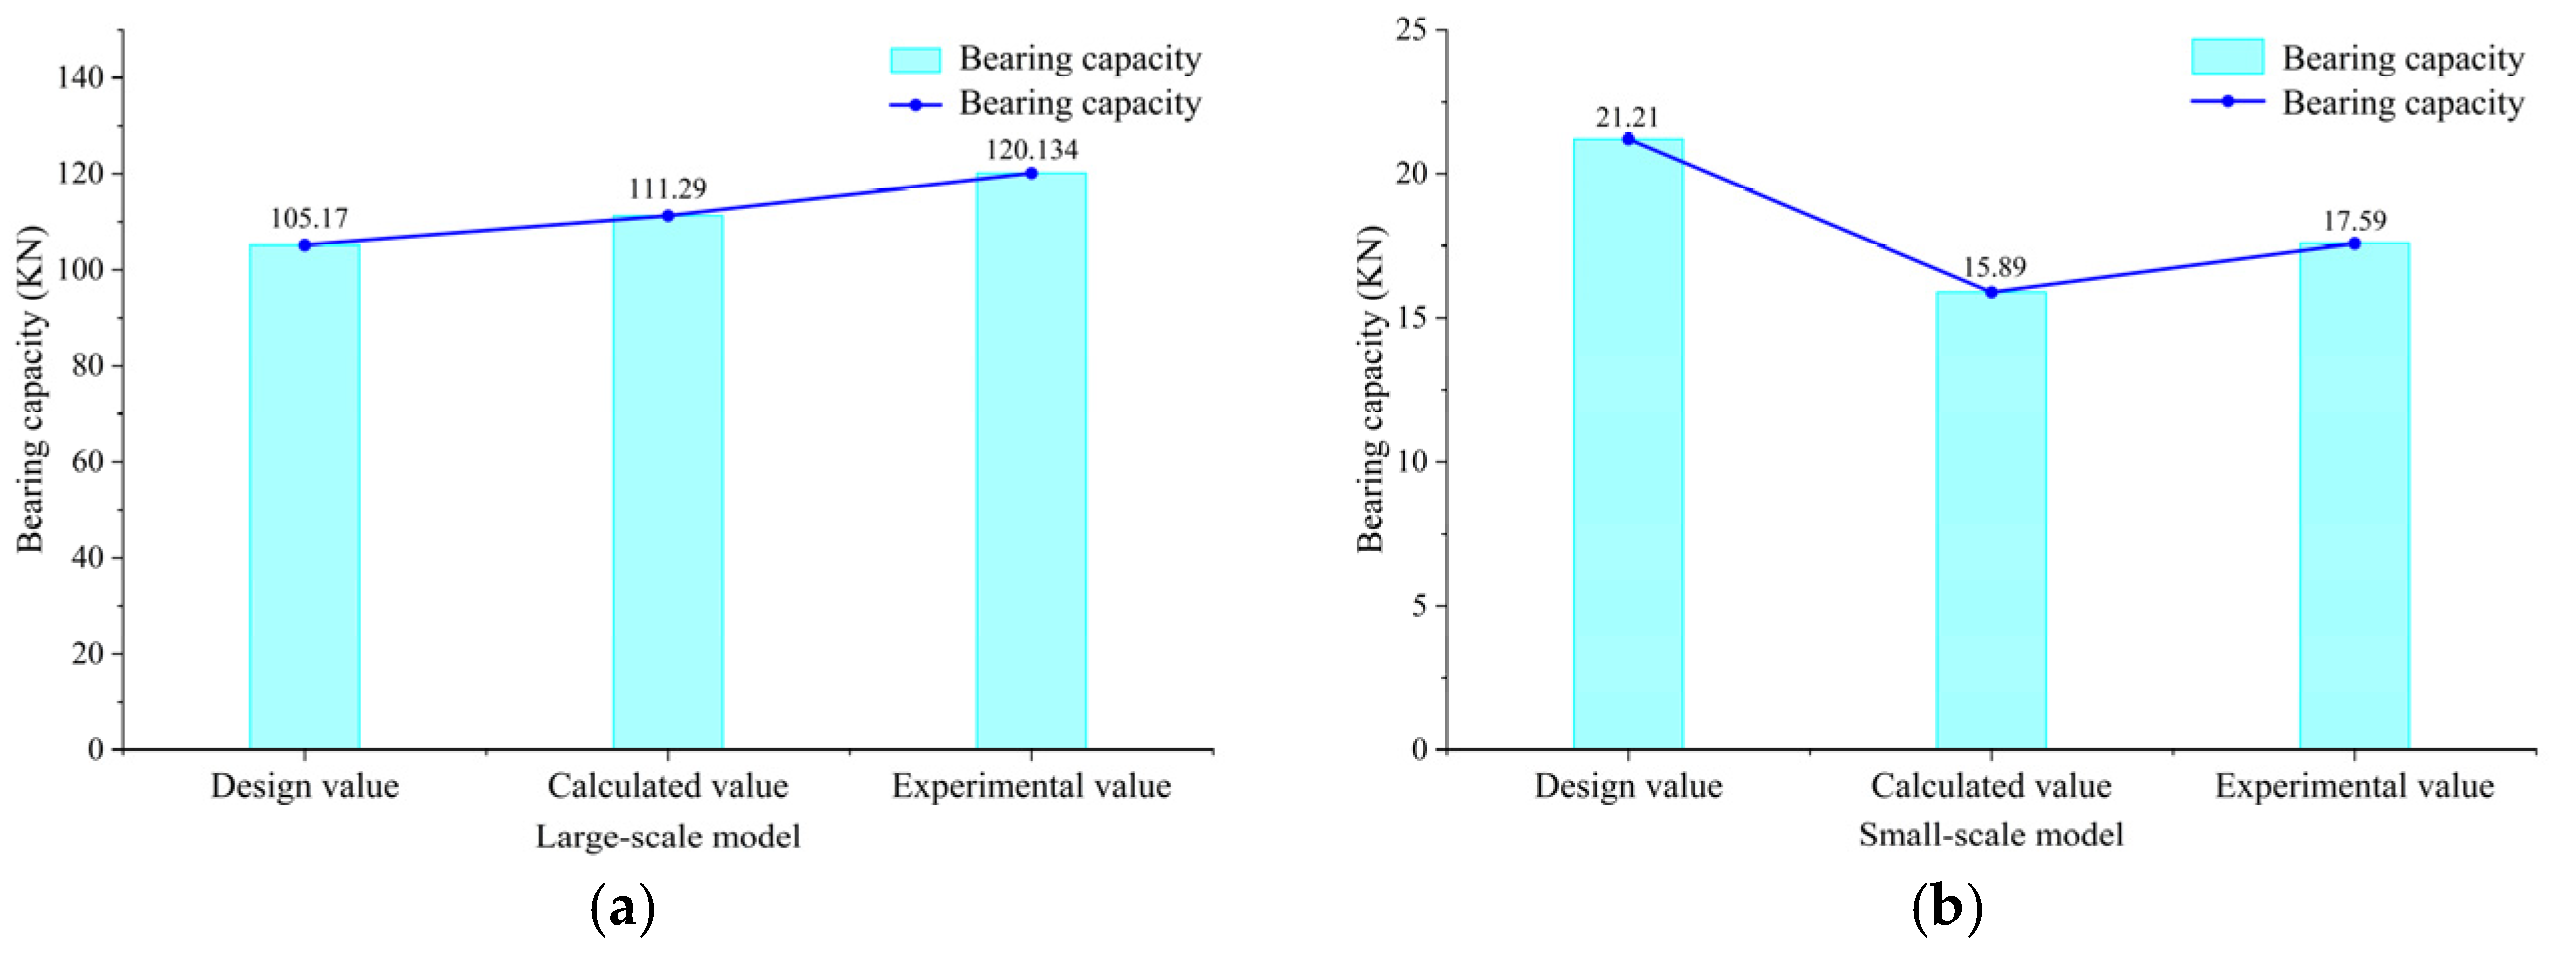
Figure 13 compares the conventional initial-state estimates, moisture-distribution-informed empirical estimates, and measured peak shaft resistances for the large-scale Group A and small-scale layered B1 model piles.
For the Group A model pile, as shown in Figure 13a,the conventional initial-state estimate of shaft resistance was 105.17 kN, whereas the measured peak pile-head load was 120.13 kN, corresponding to a relative deviation of 12.45%. After the measured post-test near-pile moisture-content distribution was incorporated into Equation (6), the empirical estimate increased to 111.29 kN, and the relative deviation decreased to 7.36%.
For the layered B1 model pile, as shown in Figure 13b,the conventional initial-state estimate was 21.21 kN, whereas the measured peak pile-head load was 17.59 kN, corresponding to a relative deviation of 20.58%. After incorporation of the measured post-test near-pile moisture-content distribution, the empirical estimate decreased to 15.89 kN, and the relative deviation decreased to 9.66%. Thus, incorporation of the measured moisture distributions improved the agreement for both tested configurations, although the direction of the estimated change was configuration-dependent. The estimate increased for Group A but decreased for the layered B1 model, and both revised estimates remained lower than the corresponding measured peak values.
Figure 13. Comparison of initial-state estimates, moisture-distribution-informed empirical estimates, and measured peak shaft resistances. (a) Large-scale model piles. (b) Small-scale model piles.
Infrastructures 11 00282 g013
Incorporating the measured moisture distributions therefore reduced the relative deviation for both tested configurations, although the direction of the estimated change depended on the soil configuration. The estimate increased for Group A but decreased for the layered B1 model, and both revised estimates remained lower than the corresponding measured peak loads. Because the measured post-test near-pile moisture distribution is required as an input, the proposed framework represents a moisture-distribution-informed back-analysis approach rather than an a priori engineering design method. The contrasting responses of Group A and B1 are discussed further in Section 4.1 in relation to the soil-layer sequence, near-pile moisture depletion, interlayer moisture enrichment, and interface friction.

4. Discussion

4.1. Configuration-Dependent Effects of Moisture Redistribution on Shaft Resistance

The Group A and layered B1 models exhibited different responses when the measured post-test near-pile moisture distributions were incorporated into the empirical framework. For Group A, the estimated shaft resistance increased from 105.17 to 111.29 kN, whereas for B1 it decreased from 21.21 to 15.89 kN. These opposite changes suggest that the influence of hydration-heat-induced moisture redistribution depended on the locations of moisture-depleted and moisture-enriched zones rather than on the total or depth-averaged moisture content alone.
The observed near-pile moisture depletion and localized enrichment in colder regions and near soil-layer interfaces are consistent with previous studies of freezing-induced moisture migration. These studies showed that unfrozen water tends to migrate toward colder regions and advancing freezing fronts under temperature gradients, capillary forces, and freezing suction [5,10]. The measured temperature and moisture patterns are also consistent with previous field, laboratory, and numerical studies showing that concrete hydration heat produces a transient thermal-disturbance zone around cast-in-place piles and affects the subsequent development of the frozen pile–soil interface [2,3,4,11,12,13]. However, most previous studies mainly described temperature evolution, thawing extent, refreezing, or moisture-migration patterns. The present study further examines how the measured spatial moisture distribution affects the depth-dependent equivalent interface resistance and the integrated shaft resistance.
For the Group A model, the post-test moisture profiles showed moisture depletion in the warmer near-pile region and localized enrichment in colder regions and near soil-layer interfaces. The empirical relationship obtained from the direct shear tests was nonlinear and reached its maximum near a prescribed moisture content of 30%. This nonlinear response is broadly consistent with previous frozen soil–pile and frozen soil–concrete interface studies, which reported that interface strength depends on moisture content, temperature, normal stress, freeze–thaw history, and concrete-surface condition [6,7,8,9]. Within the empirical relationship established in the present tests, moisture loss from some initially high-moisture regions may have shifted the corresponding local state toward a range associated with higher equivalent interface resistance. Moisture enrichment in initially low- or intermediate-moisture regions may also have promoted local ice bonding after refreezing. The integration of these depth-dependent contributions resulted in an increased shaft-resistance estimate for Group A.
The layered B1 model exhibited a different spatial redistribution pattern. In the upper high-moisture layer, the post-test profiles were consistent with outward moisture migration from the near-pile region. A pronounced moisture-enriched zone developed mainly within the 10–20 cm interlayer transition, whereas substantial moisture depletion occurred in the lower near-pile region. Part of the redistributed water therefore accumulated near the soil-layer boundary rather than being uniformly retained within the near-pile zone along the pile shaft. The potential strengthening contribution of the enriched transition zone may have been insufficient to compensate for the reduced equivalent resistance of the moisture-depleted near-pile segments. The resulting spatial discontinuity may also have caused nonuniform load transfer, preferential local failure, and progressive interface debonding. This interpretation is consistent with the lower empirical estimate, the earlier peak response, and the pronounced post-peak resistance loss observed for B1.
The B1 response is also consistent with previous studies showing that spatially varying soil properties can produce nonuniform pile–soil interaction and that strongly layered profiles cannot always be represented adequately using averaged soil parameters [19,20]. Although those studies were conducted under different environmental and loading conditions, they similarly emphasized the importance of explicitly representing soil stratification. The present results extend this concept to hydration-heat-disturbed permafrost by indicating that the position of moisture-depleted and moisture-enriched zones relative to the pile surface can affect both the direction of the resistance adjustment and the post-peak interface response.
The opposite responses of Group A and B1 therefore reflect the combined effects of moisture redistribution, soil-layer sequence, local interface state, frictional resistance, radial confinement, and progressive failure. The principal contribution of the present analysis is to connect previously separate observations of thermal disturbance, moisture migration, interface behavior, and soil stratification by converting the measured spatial moisture distribution into depth-dependent equivalent interface resistance and integrating these local contributions along the pile shaft. Under the tested conditions, the results indicate that moisture redistribution cannot be represented adequately by a single initial or average moisture content.

4.2. Applicability and Main Limitations of the Moisture-Distribution-Informed Framework

The proposed framework should be interpreted within the scope of its experimental calibration. The moisture-dependent baseline relationship, cint(w), was obtained from direct shear tests at five prescribed moisture contents, whereas the lumped equivalent coefficient, keq(w), was calibrated from only three homogeneous B2 model tests at 15%, 25%, and 35%. A high coefficient of determination based on three points does not establish that the relationship is uniquely linear. In addition, only one model pile was tested for each configuration, and the Group A and layered B1 models were used for cross-configuration assessment rather than independent validation. Although incorporation of the measured post-test moisture profiles reduced the relative deviations from 12.45% to 7.36% for Group A and from 20.58% to 9.66% for B1, these improvements represent better agreement under the tested conditions rather than validated predictive capability. Additional intermediate moisture conditions and replicate tests are required to evaluate the functional form, repeatability, and uncertainty of the relationship.
The fitted interface relationship also reflects coupled specimen-state effects. Moisture content and dry density were not varied independently during specimen preparation, and the dry density generally decreased with increasing prescribed moisture content. Therefore, cint(w) incorporates the combined influences of moisture content, dry density, void ratio, degree of saturation, pore structure, and ice bonding. A factorial test program in which moisture content and dry density are controlled independently would be required to isolate their respective effects. Moreover, the actual compressive strength of the concrete after 28 d of conditioning at −1.5 °C was not measured. The nominal C35 grade should therefore not be interpreted as the strength attained under the adopted low-temperature condition. Previous studies have shown that low-temperature curing can retard strength development and alter hydration kinetics and microstructural evolution [23,24]. These changes may have affected the concrete stiffness, near-surface characteristics, ice adhesion, mechanical interlocking, and interface friction.
Several measurement limitations affect the physical interpretation of keq(w). The effective radial normal stress acting on the pile surface was not monitored. Consequently, the contributions of the Mohr–Coulomb intercept, the frictional term σ′ntanδ, refreezing-induced ice bonding, and radial confinement could not be separated quantitatively. The closest gravimetric sampling position was 0.5 cm from the pile surface and represented the near-pile soil rather than the exact concrete–soil contact plane. In addition, the gravimetric moisture profiles were obtained after vertical loading. Large pile displacement and interface shearing may have disturbed the near-pile soil, so the measured profiles may differ from the undisturbed moisture field immediately before loading. Companion models sampled after refreezing but before pile loading would be required to distinguish moisture redistribution caused by thermal processes from that caused by mechanical disturbance.
The loading rate, scale, and container boundaries also limit direct field interpretation. The displacement rate of 20 mm/min lies within the laboratory range reported for model piles in frozen soil [22], but frozen soil–structure interfaces are rate-dependent, and higher loading rates may increase the apparent peak resistance or alter the failure mode. Because no loading-rate sensitivity tests were conducted, the measured resistances should be interpreted as short-term laboratory values. Complete thermohydromechanical similitude was also not established. The ratios of 1:7.5 and 1:20 refer only to pile diameter. For conductive heat transfer, the characteristic diffusion time approximately follows t c L 2 α , and therefore cannot be scaled linearly using the pile-diameter ratio. Freezing-front development and moisture migration are additionally controlled by permeability, pore structure, unfrozen-water behavior, capillary effects, temperature gradients, and freezing suction.
The finite container dimensions may have further influenced the results. For Group A, the radial distance from the pile surface to the steel wall was 0.30 m, equivalent to 1.5 pile diameters. The steel wall may have acted as an additional heat-transfer boundary, influenced moisture migration near the outer region, and restricted radial soil deformation. These effects may have altered the effective radial stress, measured shaft resistance, and back-calculated keq. Because no larger-container comparison or numerical boundary-sensitivity analysis was conducted, their magnitude could not be quantified.
Accordingly, the proposed relationship represents a model-specific, moisture-distribution-informed back-analysis framework under the adopted soil, concrete, geometry, thermal history, loading rate, and boundary conditions. Its application requires a spatial near-pile moisture distribution as an input, which is generally unavailable during the design stage. Prospective engineering application would therefore require either field monitoring after pile installation and refreezing or a validated coupled thermohydromechanical model capable of predicting temperature evolution, phase change, and moisture migration. Until additional calibration and independent validation are available, Equation (6) should not be used as a general engineering design equation.

4.3. Scientific Contribution and Engineering Implications

The principal contribution of this study is the development of a spatially distributed interpretation framework for hydration-heat-disturbed pile–soil interfaces. Unlike conventional calculations based on the initial or depth-averaged moisture content, the proposed approach uses the measured near-pile moisture distribution to update the local equivalent interface resistance and integrates these local contributions along the pile shaft. The opposite adjustment directions observed for Group A and B1 demonstrate that the influence of moisture redistribution depends not only on the overall moisture level but also on the locations of moisture-depleted and moisture-enriched zones relative to the pile shaft.
For piles installed in layered permafrost, particular attention should be paid to near-pile weak zones and soil-layer interfaces. Moisture enrichment away from the pile surface does not necessarily increase shaft resistance, whereas moisture depletion within the near-pile region may weaken local ice bonding and promote preferential interface failure. Consequently, the use of a single average moisture content or a single representative interface parameter may conceal locally weak shaft segments, particularly where high- and low-moisture layers alternate along the pile.
Under the tested conditions, incorporation of the measured post-test near-pile moisture distributions reduced the relative deviation from 12.45% to 7.36% for Group A and from 20.58% to 9.66% for B1. These results indicate that spatially updating the local equivalent interface resistance provides a more representative interpretation of the measured pile response than calculations based solely on the initial moisture condition. At present, the framework is most appropriately used as a back-analysis and diagnostic tool for laboratory tests or field-monitoring data after pile installation and refreezing. Future design-oriented application would require reliable measurement or prediction of the near-pile moisture distribution through field monitoring or a validated coupled thermohydromechanical model. The framework should therefore be regarded as a supplement to, rather than a replacement for, established pile-design methods.

5. Conclusions

Laboratory direct shear tests and model tests were conducted to investigate the evolution of pile–soil interface shear strength, moisture and temperature fields around the pile, and pile bearing capacity during cast-in-place pile construction in permafrost regions. The following conclusions are drawn:
(1)
The shear strength of the concrete–frozen soil interface increased first and then decreased nonlinearly with increasing moisture content, reaching its peak at a moisture content of 30%, where the cohesion and internal friction angle were 71.6 kPa and 36.6°, respectively. The temperature rise in the soil surrounding the pile was jointly controlled by soil stratification and initial moisture content. Higher moisture content reduced the temperature rise due to the stronger heat absorption capacity of high-moisture frozen soil. In the near-pile region, the maximum difference in peak temperature among soil layers with different moisture contents was approximately 10.8%.
(2)
During thawing and refreezing, moisture migration was jointly affected by the temperature gradient and the moisture conditions of different soil layers. Unfrozen water migrated toward colder regions or lower-moisture soil layers under temperature gradients, capillary effects, and freezing suction, resulting in near-pile moisture depletion and localized moisture enrichment. The layered B1 model exhibited a slightly higher instantaneous peak resistance than the homogeneous 25% B2 model but showed earlier interface failure and more pronounced post-peak degradation.
(3)
A preliminary empirical relationship between moisture content and local equivalent interface resistance was established by introducing a lumped equivalent coefficient, keq, to account for the spatial redistribution of moisture around the pile after hydration-heat disturbance. Using the measured peak shaft resistance as the reference, the relative deviation decreased from 12.45% to 7.36% for Group A and from 20.58% to 9.66% for B1.

Author Contributions

Conceptualization, Z.Z. and T.Y.; methodology, T.Y. and Z.Z.; software, T.Y.; validation, Z.Z., X.L. and J.Z.; formal analysis, T.Y.; investigation, T.Y. and J.Z.; resources, X.L. and Z.Z.; data curation, T.Y.; writing—original draft preparation, T.Y.; writing—review and editing, Z.Z., X.L. and J.Z.; visualization, T.Y.; supervision, Z.Z. and X.L.; project administration, Z.Z.; funding acquisition, Z.Z. All authors have read and agreed to the published version of the manuscript.

Funding

This research was funded by the Tianshan Talent Training Program, grant number 2023TSYCLJ0055, under the project entitled “Research on the Disaster Mechanism and Key Technologies for Special Rocks and Soils in Xinjiang and Central Asia under the ‘Dual Carbon’ Goal”.

Data Availability Statement

The data presented in this study are available from the corresponding author upon reasonable request.

Conflicts of Interest

The authors declare no conflicts of interest.

References

  1. Shi, R.; Wen, Z.; Li, D.; Gao, Q.; Wei, Y. Effect of freeze–thaw cycles on the performance of cast-in-place piles in permafrost regions: Working state and action effect sharing. Permafr. Periglac. Process. 2022, 33, 147–159. [Google Scholar] [CrossRef]
  2. Hou, X.; Chen, J.; Jin, H.; Rui, P.; Zhao, J.; Mei, Q. Thermal characteristics of cast-in-place pile foundations in warm permafrost at Beiluhe on interior Qinghai–Tibet Plateau: Field observations and numerical simulations. Soils Found. 2020, 60, 90–102. [Google Scholar] [CrossRef]
  3. Hou, X.; Chen, J.; Yang, B.; Wang, J.; Dong, T.; Rui, P.; Mei, Q. Monitoring and simulation of the thermal behavior of cast-in-place pile group foundations in permafrost regions. Cold Reg. Sci. Technol. 2022, 196, 103486. [Google Scholar] [CrossRef]
  4. Wang, Y.; Mao, X.; Wu, Q.; Cai, P.; Ye, M.; Yin, S. Numerical analysis of concrete hydration heat impact on frozen soil temperature around cast-in-place piles. Materials 2024, 17, 4375. [Google Scholar] [CrossRef] [PubMed]
  5. Fu, Z.; Wu, Q.; Zhang, W.; He, H.; Wang, L. Water migration and segregated ice formation in frozen ground: Current advances and future perspectives. Front. Earth Sci. 2022, 10, 826961. [Google Scholar] [CrossRef]
  6. Zhao, Y.; Mao, X.; Wu, Q.; Huang, W.; Wang, Y. Study on shear characteristics of interface between frozen soil and pile during thawing process in permafrost area. Adv. Civ. Eng. 2022, 2022, 1755538. [Google Scholar] [CrossRef]
  7. Yuan, S.; Cong, J.; Fang, X.; Wu, Y.; Yu, H. Experimental study on the shear characteristics of frozen soil–concrete interface under the constant normal stiffness. Eng. Rep. 2024, 6, e12989. [Google Scholar] [CrossRef]
  8. Zhang, K.; Yan, J.; Mu, Y.; Zhu, X.; Zhang, L. Global and local shear behavior of the frozen soil–concrete interface: Effects of temperature, water content, normal stress, and shear rate. Buildings 2024, 14, 3319. [Google Scholar] [CrossRef]
  9. Xie, M.; Xu, M.; Xu, F.; Wang, Z.; Yin, L.; Wu, X. Study on the shear characteristics of the frozen soil–concrete interface at different roughness levels. Buildings 2025, 15, 2783. [Google Scholar] [CrossRef]
  10. Bronfenbrener, L.; Bronfenbrener, R. Modeling frost heave in freezing soils. Cold Reg. Sci. Technol. 2010, 61, 43–64. [Google Scholar] [CrossRef]
  11. Fan, C.; Gao, Q.; Hao, X.; Wen, Z.; Zheleznyak, M.N. Thermal effects of hydration heat from cast-in-place pile groups on inter-pile permafrost and implications for design strategies. Int. Commun. Heat Mass Transf. 2026, 170, 109911. [Google Scholar] [CrossRef]
  12. Kong, S.; Liu, J.; Liang, R.; Wang, B. Study on thermal disturbance of frozen soil around piles by concrete hydration heat. J. Phys. Conf. Ser. 2022, 2301, 012018. [Google Scholar] [CrossRef]
  13. Gao, Q.; Chen, L.; Wen, Z.; Zhou, Z.; Fan, C.; Brouchkov, A.; Zhirkov, A. Hydro-thermal disturbance and its impact on the bearing characteristics of bored piles in ice-rich permafrost. Appl. Therm. Eng. 2025, 274, 126652. [Google Scholar] [CrossRef]
  14. Wotherspoon, L.M.; Sritharan, S.; Pender, M.J. Modelling the response of cyclically loaded bridge columns embedded in warm and seasonally frozen soils. Eng. Struct. 2010, 32, 933–943. [Google Scholar] [CrossRef]
  15. Yu, D.; Cao, Y.; Zhao, Q. Analysis on the synergistic variation of soil freezing and pile foundation bearing capacity in permafrost regions. Int. J. Transp. Sci. Technol. 2024, 16, 134–149. [Google Scholar] [CrossRef]
  16. Qiu, K.; Yu, W.; Kong, X.; Han, F.; Zhao, Y. Investigation on the bearing capacity evolution of building pile foundation during permafrost degradation. Cold Reg. Sci. Technol. 2024, 221, 104152. [Google Scholar] [CrossRef]
  17. Tang, L.; Yang, L.; Qiu, P.; Jia, H.; Zhang, H.; Li, G. Degradation characteristics and bearing capacity model of pile in degraded permafrost. Proc. Inst. Civ. Eng. Geotech. Eng. 2022, 175, 414–425. [Google Scholar] [CrossRef]
  18. Karagöl, F.; Demirboğa, R.; Khushefati, W.H. Behavior of fresh and hardened concretes with antifreeze admixtures in deep-freeze low temperatures and exterior winter conditions. Constr. Build. Mater. 2015, 76, 388–395. [Google Scholar] [CrossRef]
  19. Iqbal, K.; Xu, C.; Han, Y.; Motalleb, Q.A.; Ijaz, N.; Dou, P. Numerical study on seismic response of offshore wind turbine monopile in multi-layered soil profile of Arabian Sea. Int. J. Struct. Stab. Dyn. 2023, 23, 2350049. [Google Scholar] [CrossRef]
  20. Arbi, S.J.; Rehman, Z.U.; Hassan, W.; Khalid, U.; Ijaz, N.; Maqsood, Z.; Haider, A. Optimized machine learning-based enhanced modeling of pile bearing capacity in layered soils using random and grid search techniques. Earth Sci. Inform. 2025, 18, 332. [Google Scholar] [CrossRef]
  21. GB/T 50123–2019; National Standard of the People’s Republic of China. Standard for Geotechnical Testing Method. China Planning Press: Beijing, China, 2019. (In Chinese)
  22. McLean, J.; Saeidi, A.; Chavali, R.V.P.; Seifaddini, M.; Clement, A.; Barbarisque, T.; Bilodeau, J.-P. Adfreeze strength of wooden piles in warm permafrost soil. J. Cold Reg. Eng. 2023, 37, 04023002. [Google Scholar] [CrossRef]
  23. Husem, M.; Gozutok, S. The effects of low temperature curing on the compressive strength of ordinary and high performance concrete. Constr. Build. Mater. 2005, 19, 49–53. [Google Scholar] [CrossRef]
  24. Lothenbach, B.; Winnefeld, F.; Alder, C.; Wieland, E.; Lunk, P. Effect of temperature on the pore solution, microstructure and hydration products of Portland cement pastes. Cem. Concr. Res. 2007, 37, 483–491. [Google Scholar] [CrossRef]
Figure 1. Particle size distribution curve of the test soil.
Infrastructures 11 00282 g001
Figure 2. Specimen preparation and test procedure for the direct shear test of the concrete–frozen soil interface. (a) Raw soil processing and moisture gradient setup. (b) Layered compaction of pure soil samples. (c) Fabrication of concrete-frozen soil composite specimens. (d) Direct shear testing procedure.
Infrastructures 11 00282 g002
Figure 3. Schematic diagram of the pile–soil scaled model and vertical loading system. (a) Pilesoil model and sensors. (b) Test equipment. (c) Model test process.
Infrastructures 11 00282 g003
Figure 4. Relationship between shear strength and normal stress of the concrete–frozen soil interface under different initial moisture contents. Each data point represents one individual specimen (n = 1); statistical error bars are therefore not shown.
Infrastructures 11 00282 g004
Figure 5. Temporal variation in the temperature field of frozen soil around the pile. (a) Large-scale model pile. (b) Small-scale model piles.
Infrastructures 11 00282 g005
Figure 6. Moisture redistribution in the vertical pile–soil section of the large-scale model pile.
Infrastructures 11 00282 g006
Figure 7. Moisture redistribution in the vertical pile–soil section of the layered frozen soil model pile.
Infrastructures 11 00282 g007
Figure 8. Moisture redistribution in the vertical pile–soil section of homogeneous frozen soil model piles under different initial moisture contents:(a) 15% (b) 25%;(c) 35%.
Infrastructures 11 00282 g008
Figure 9. Conceptual model of hydration-heat-induced moisture redistribution around a cast-in-place pile in frozen soil.
Infrastructures 11 00282 g009
Figure 10. Load–displacement responses of model piles in vertical compression tests. (a) Large-scale model pile. (b) Small-scale model piles. Each curve represents one individual model pile test (n = 1 for each experimental condition).
Infrastructures 11 00282 g010
Figure 11. Relationship between soil moisture content and the Mohr–Coulomb intercept of the concrete–frozen-soil interface.
Infrastructures 11 00282 g011
Table 1. Physical properties of the test soil.
Soil TypeLiquid Limit (%)Plastic Limit (%)Plasticity IndexNatural Moisture Content (%)Representative Field Dry Density (g/cm3)Optimum Moisture Content (%)Maximum Dry Density (g/cm3)GsSum of Measured Soluble Ions (g/kg)
Silty clay31.6016.215.4211.69415.931.7912.7014.237
Table 2. Physical state parameters of soil specimens prepared for the direct shear tests.
Moisture Content (%)Dry Density
(g/cm3)
Void RatioDegree of Saturation
(%)
151.6920.59867.9
201.6930.59290.8
251.5910.69796.8
301.4660.84296.2
351.3660.97796.7
Table 3. Concrete mixture proportions used in the experiments.
ConstituentCement (kg/m3)Water (kg/m3)Fine Aggregate (kg/m3)Coarse Aggregate (kg/m3)Water-to-Cement RatioAdmixtures
Content 334.87167.44819.391131.540.50None
Table 4. Shear strength parameters of the concrete–frozen soil interface.
Initial Moisture Content (%)Cohesion (kPa)Internal Friction Angle (°)
1550.131.0
206032.9
2564.935.4
3071.636.6
3568.736.2
Disclaimer/Publisher’s Note: The statements, opinions and data contained in all publications are solely those of the individual author(s) and contributor(s) and not of MDPI and/or the editor(s). MDPI and/or the editor(s) disclaim responsibility for any injury to people or property resulting from any ideas, methods, instructions or products referred to in the content.