Article

On the Cost Analysis of Low-Noise Pavements

by
Filippo Giammaria Praticò
1,* and
Ezgi Eren
2
1
DIIES Department, University Mediterranea of Reggio Calabria, 89124 Reggio Calabria, Italy
2
Engineering Faculty, Adana Alparslan Turkes Science and Technology University, Adana 01250, Turkey
*
Author to whom correspondence should be addressed.
Infrastructures 2026, 11(7), 249; https://doi.org/10.3390/infrastructures11070249
Submission received: 6 May 2026 / Revised: 10 July 2026 / Accepted: 13 July 2026 / Published: 21 July 2026

Abstract

Low-noise pavements (LNPs) are increasingly important under Green Public Procurement policies, yet public administrations still lack clear guidance on selecting pavement types based on noise-related externalities. Although traffic noise generates substantial societal costs—affecting health, education, and property values—these external burdens are often overlooked or excluded from traditional pavement appraisal and investment decisions, leading to systematically underestimated life cycle costs (LCC). This study develops an integrated framework to monetise traffic-noise impacts within an LCC perspective by combining health effects (Disability-Adjusted Life Years, DALYs), property-value capitalisation (willingness to pay, WTP), and noise-induced educational losses. The system limit is intentionally restricted to noise-related externalities during pavement operations, while agency, user, and vehicle operating costs are excluded. A comprehensive review of existing monetisation approaches is provided, and a new unified method is proposed. The framework is applied to a case study from the LIFE SNEAK project on Via La Marmora (Florence, Italy), comparing existing, acoustically non-optimised, and acoustically optimised surfaces. The results showed that the LIFE SNEAK pavement significantly alleviated the burden of noise on public health and education costs, which were 34% and 33% lower than in the baseline scenario, respectively, with a welfare surplus of +€2.38 million over the ten-year period. In particular, it was noted that the most important economic contribution of LNPs stems from the WTP approach. This study provides clear evidence that noise externalities play a considerable role in long-term pavement cost estimates, thereby supporting the systematic inclusion of these costs in LCC analyses. The proposed method puts forward a practical approach to support the selection of noise-sensitive, sustainable, and socially responsible road pavements.

1. Introduction

With increasing urbanisation, pavements are expected not only to be durable and sustainable, but also to be developed with additional functional properties that reduce traffic noise [1,2]. Therefore, low-noise pavements (LNPs) stand out for their noise-reducing capabilities, as well as their ability to meet environmental sustainability and economic efficiency goals [3]. This is because increasing traffic noise in cities has significant negative effects on human health. LNPs are frequently preferred as a functional pavement to address this problem [4].
LNPs reduce tyre–road noise at the source, typically by altering road surface porosity and texture [5]. For example, porous LNPs also offer safer driving conditions by facilitating effective drainage of water due to their porous structure [2,6]. However, despite these advantages, the construction and maintenance costs of these LNPs may be significantly higher [7]. This cost disadvantage has highlighted the need for a more comprehensive evaluation of LNP-related benefits. Consequently, extensive discussion of the integration of noise into Life Cycle Assessment (LCA) and Life Cycle Cost Analysis (LCCA) is needed, regarding both methodological challenges and decision-making.
Some early methodological work was done by Cucurachi, et al. [8], who demonstrated that noise can also be modelled as an impact category related to human health effects. Additionally, in their study, they adopted an exposure–response approach suitable for toxicological effects while also considering the physical properties of noise. Similarly, Garraín, et al. [9] further developed how one should take traffic noise as a standard environmental impact category. They underlined that each step of detailed vehicle–road interaction modelling should consider Disability-Adjusted Life Years (DALYs) indicators to capture health-related impacts. Supporting this view, Althaus, et al. [10] summarised several LCA-related noise methodologies and concluded that reliable noise assessment necessarily requires ISO-compliant frameworks featuring differentiation at the vehicle level, along with multimodal transport modelling, and sensitivity related to geographical and temporal contexts. Praticò [11], from a life cycle cost (LCC) perspective, demonstrated that rolling noise may account for a dominant share of total environmental costs. Margorínová, et al. [12] highlight that road surface type and degradation behaviour have a great impact on noise-related social costs, further affecting land value and overall project efficiency, thereby again calling for robust pavement deterioration models. Comparative long-term studies were conducted by Cao, et al. [13], and they demonstrated that although some types of pavement mixtures have stronger economic and ecological burdens, modest reductions in noise can greatly counteract such drawbacks when noise is taken into consideration in the context of LCA/LCCA. Finally, in relation to the above, the capability of rubber asphalt to reduce noise was found to be relatively high (cf. Rath [14]), owing to the fact that modest variations in sound level can lead to dramatic variations in sound intensity. In recent years, Piao, et al. [15] observed that road traffic noise can be a major contributor to health impacts, as measured in DALYs. On the other hand, in their study, Haverkamp and Traverso [16] have also pointed out the necessity of integrating environmental, economic, and social aspects, including noise as an externality. Once again, the study asserted that the impacts of social factors, such as noise and comfort, are underestimated in the current conventional LCA [16]. Table 1 provides a summary.
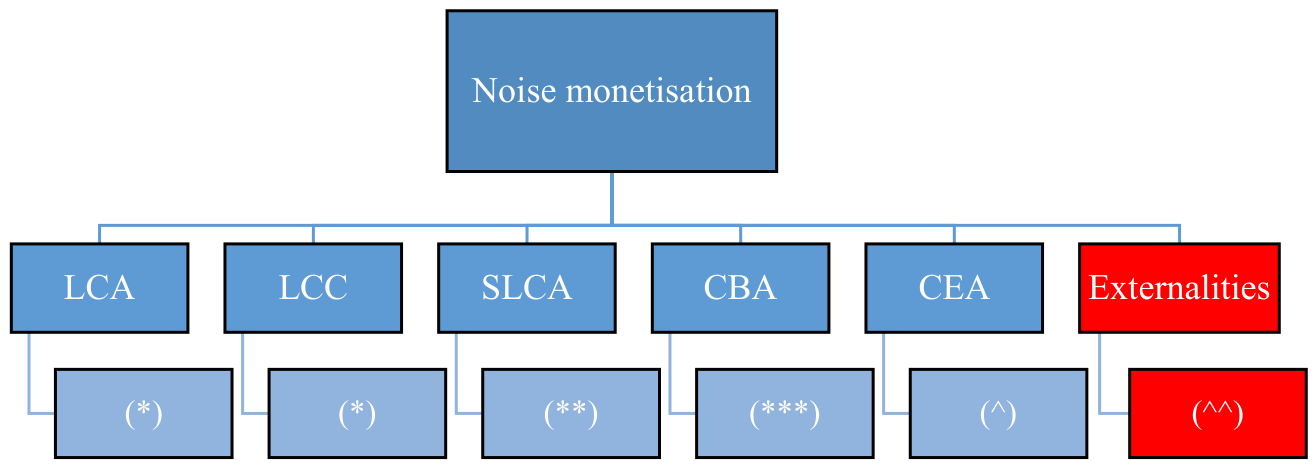
Table 1 and Figure 1 show that noise impacts are addressed within different assessment frameworks, including LCA, LCC, Social Life Cycle Assessment (SLCA), Cost–Benefit Analysis (CBA), Cost-Effectiveness Analysis (CEA), and externalities. As a result, it is difficult to identify a distinct, consistently defined category of noise-related impacts in the literature. Following the European Commission framework [23], the method proposed in this study could be classified as an externality-based approach.
In light of this background, the objectives of this study are threefold:
(1) To determine whether noise-related costs should be included within LCC frameworks and/or alternative assessment approaches;
(2) To identify, compare, and critically evaluate existing methods used to monetise traffic-noise impacts;
(3) To develop and implement a new monetisation method specific to pavement-related noise externalities.
To achieve these objectives, the following tasks were defined:
Task 1: A comprehensive review and synthesis of the literature on noise impacts and monetisation methods (see Section 1).
Task 2: Development and implementation of a new methodological framework to monetise noise-related costs (see Section 2 and Section 3).
Task 3: Derivation of the main findings and implications for the pavement decision-making process (see Section 4 and Section 5).

2. Methodology (Noise as a Cost)

This study is part of the LIFE SNEAK [24] and LIFE SILENT [25] projects. It examines the monetary consequences of reducing noise from road–tyre interactions. Accordingly, research activities carried out in these projects include modelling, scenario definition, data collection, surface labelling studies, and optimisation of developed pavement surfaces. Most of the important inputs have been taken from the literature available from 2021 to 2024 [26,27,28,29,30,31,32].
This section describes the three-step modelling framework adopted to convert noise emissions into monetary impacts, under Task 2: (1) acoustic modelling, (2) dose–response modelling, and (3) monetisation.

2.1. Goal and Scope Definition of the Life Cycle Cost

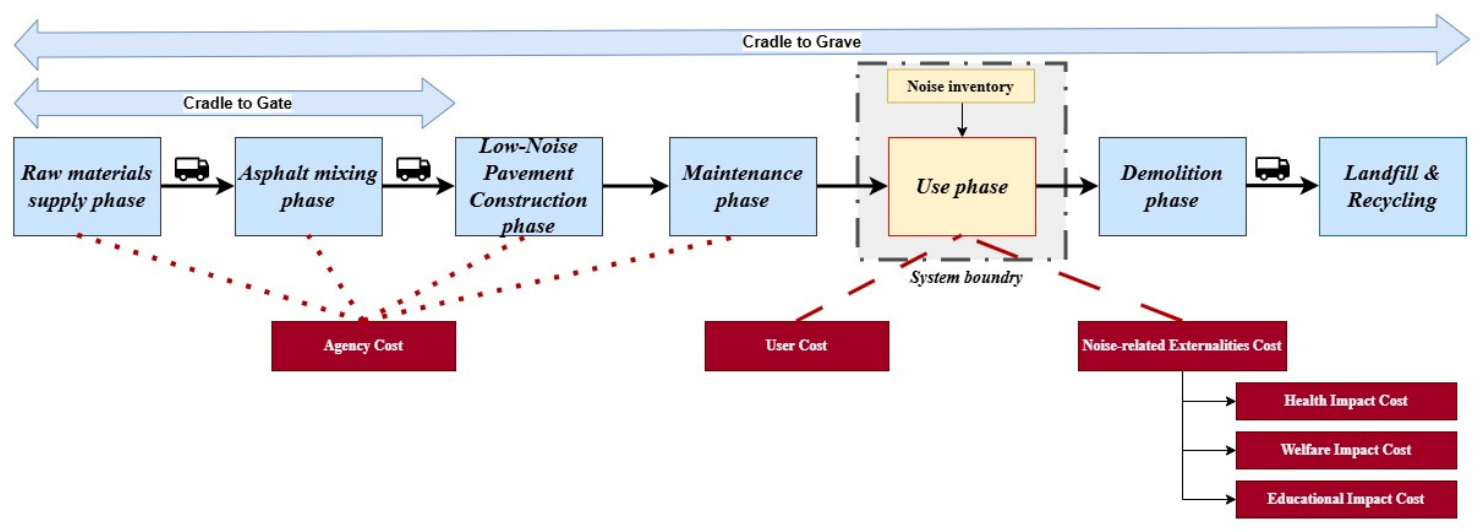
This study adopts a use-oriented LCC framework that focuses on the external costs generated by traffic noise. In this context, therefore, user costs such as construction or maintenance agency costs and travel time or vehicle operating costs were not considered in the analysis. Thus, the LCC system boundary is intentionally restricted to noise externalities occurring during the operational (use) phase of the pavement. This boundary aligns with approaches used in [17,20,33]. Figure 2 shows the system boundaries of the LCC model in this study. Three scenarios were considered:
  • Existing Dense Pavement (EDP): Before the implementation of the new pavement (old pavement close to the end of its life)
  • Non-Optimised Low-Noise Pavement (NO-LNP): Newly laid down pavement, not optimised from an acoustic standpoint.
  • Acoustically Optimised Low-Noise Pavement (AO-LNP): Newly laid down pavement, optimised from an acoustic standpoint.
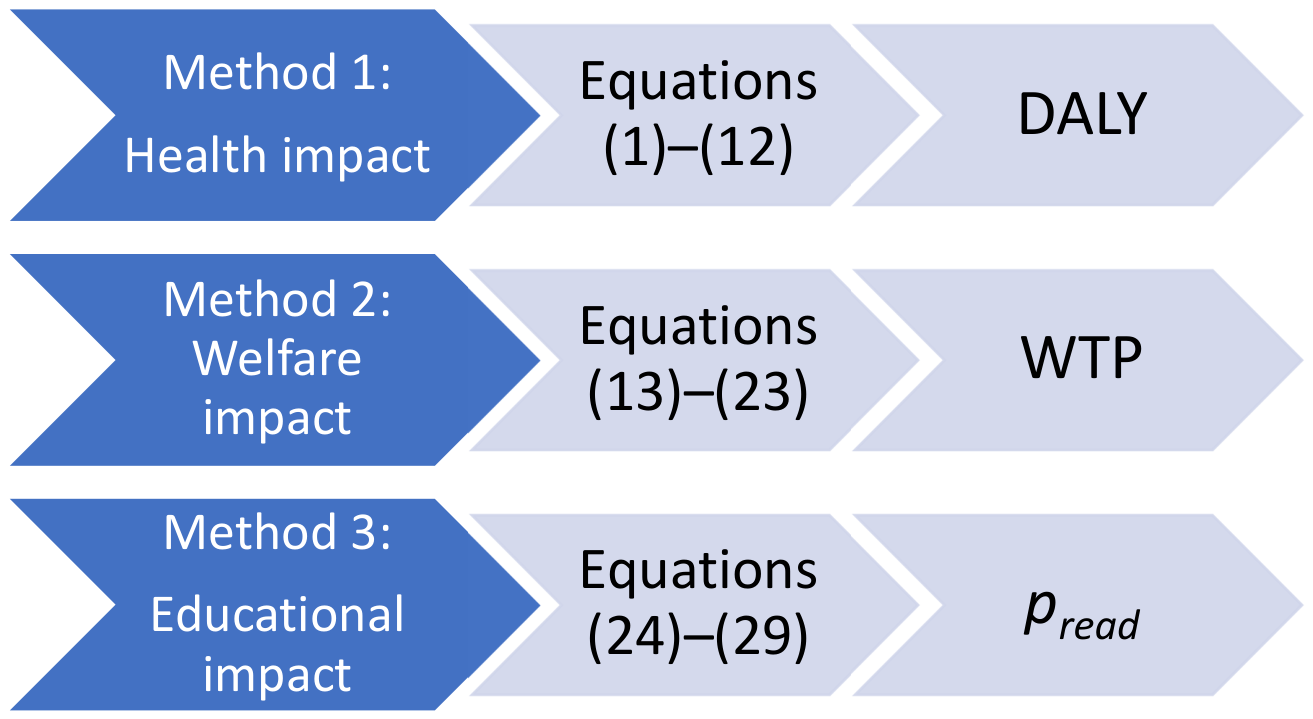
Under these three scenarios, the cost analysis includes only the following noise-related externality cost categories given in Figure 3. The first category is the health impacts, expressed in DALYs and monetised using €/DALY conversion factors. The second category is the welfare impacts derived from WTP, assessed using the hedonic pricing method and monetised through area-level noise-cost conversion factors (€/dB.m2). The final category is the educational impacts, based on noise-induced prevalence of reading comprehension impairment among children (defined as p r e a d ) and monetised using €/student·year conversion factors. This focused boundary ensures that the results specifically reflect how pavement acoustic performance affects societal noise costs over time, from the initial condition (Year 0) to the end of the 10th service year. For clarity, Year 0 represents the baseline condition for each pavement scenario, whereas Years 1–10 correspond to the subsequent service years. Therefore, the assessment tracks the evolution of noise-related impacts from the baseline condition through the end of the 10th service year, rather than as eleven independent annual periods.

2.2. Method 1: Noise Impacts on People’s Health

Harmful effects on human health are often quantified in terms of DALY. The latter is a comprehensive metric that represents the loss of one year of full health (1 DALY corresponds to one lost year of healthy life). Accordingly, based on EEA [34] values calculated using the methodology of ETC-HE [35] the estimated DALYs attributable to road noise in Italy are 190 per 100,000 people. These noise-induced health problems constitute a source of related health expenditures for countries, and DALY is frequently used in the literature as a key indicator in determining these expenses. In this study, the following procedure has been set up (cf. Figure 4) to monetise the economic impact of noise at the beginning of the process:
  • Derivation of Close-Proximity (CPX) through measurement.
  • Derivation of LeqD and LeqN based on Licitra, et al. [36]’s Equations.
  • Derivation of HA and HSD [17] through Equations (9) and (10).
  • Derivation of DALY based on Equation (11).
  • Monetisation based on Equation (12).
For a given year X, the following procedure has been set up:
  • Assessment of ΔLage (the acoustical ageing rate, e.g., 0.58 dB/year).
  • Derivation of LCPX through measurement.
  • Derivation of KB(X), conversion of the LCPX for the X-th year, based on Equation (1), where KB (Belagskorrektur) is the pavement correction factor and represents the acoustic difference (in decibels) between the road surface being studied and a “standard” reference surface (cf. StL-86+ for Road Surfaces, sonROAD18, and Update of the Swiss source model for road traffic noise [37]).
  • Derivation of ΔKB(X), based on Equation (2) (difference for the EDP conditions).
  • Derivation of LeqD and LeqN at the beginning of pavement life, based on Equations (3) and (4)).
  • Derivation of LeqD and LeqN, for the given year X, based on ΔKB(X) (cf. Equations (5) and (6)).
  • When multiple road segments contribute to the noise exposure at a receiver location, the corresponding noise levels are derived (cf. Equations (7) and (8)).
  • Derivation of high annoyance, HA, and high sleep disturbance, HSD, through Equations (9) and (10).
  • Assessment of P(j), the total number of people in the j-th building influenced by the test section.
  • Derivation of the HI (DALY) for the year X, based on Equation (11).
  • Monetisation based on Equation (12). The procedure is explained here in the given X-th year.
As shown in Figure 4, a structured DALY calculation chain is used to assess the health impact of road traffic noise. In this framework, pavement surfaces are first characterised in terms of tyre–road interaction noise using the CPX method in accordance with ISO 11819-2 [38]. Although CPX measurements describe the acoustic performance of pavement surfaces in the near field, they cannot be directly used in health impact assessment, since DALY estimation requires noise exposure levels at receiver locations. Therefore, CPX results are converted into a pavement correction term (KB), which quantifies the surface-specific tyre–road noise characteristics. The relative correction term (ΔKB) is then determined with respect to the reference pavement condition. This correction is subsequently applied to baseline receiver exposure levels to account for surface-induced acoustic differences. Hence, the updated exposure levels are then used as inputs to the dose–response functions for estimating the number of highly annoyed (HA) and highly sleep-disturbed (HSD) individuals, which are ultimately converted into DALY values. DALY values particularly help to quantify the impact of road traffic noise on health by providing a monetary value. This presented sequential framework ensures that pavement-specific acoustic properties are consistently transferred from CPX measurements to the final health impact indicators.
The CPX@50 km/h value is measured for each pavement surface. The measured CPX indices for passenger cars (at 50 km/h) are converted into the pavement correction term KB using the conversion approach described by Piao, Waldner, Heutschi, Poulikakos and Hellweg [17]:
K B ( X ) = ( 1.2468 L C P X s u r f a c e 112.3 ) + L a g e ( X )
where K B ( X ) [dB] is the CPX-derived pavement correction value in service year X, L C P X s u r f a c e [dB(A)] is the measured close-proximity noise level of the evaluated surface at a reference speed of 50 km/h, and L a g e [dB/year] is the acoustical ageing rate, defined as the annual increase in tyre–pavement noise. The variable X [year] denotes the service year after LNP construction, with X = 0 representing the age of the pavement (the first year of life; the age is 0).
A L a g e value of 0.58 dB per year is adopted for EDP, whereas 0.40 dB per year is used for the AO-LNP. For the NO-LNP, an ageing rate of 0.53 dB per year is applied [39]. The ageing rates that were used in this study were obtained from the results of pavement noise monitoring and pavement ageing studies carried out by Bendtsen, Lu and Kohler [39].
The noise reduction close to the tyre due to a given surface, with respect to the EDP, could be measured by comparing the LCPX of the two surfaces. As an alternative, by referring to bystanders, using the KB indicator above, it can be quantified based on the following equation:
K B X = K B X K B E D P
where K B X represents the CPX-based pavement correction term for the pavement surface in year X [dB] and K B E D A represents the corresponding correction term for the existing dense-graded asphalt pavement before LNP implementation (reference condition) [dB]. Thus, the difference K B X quantifies the noise change attributable solely to the pavement surface characteristics at year X, while the EDP value remains the constant reference for all comparisons [dB].
In this study, receiver exposure levels are estimated using the CPX– L d a y and CPX– L n i g h t relationships derived from the field dataset reported by Licitra, Cerchiai and Ascari [36]. The linear regression analysis equations based on field measurements are as follows:
L d a y = 0.7065 L C P X s u r f a c e 5.104
L n i g h t = 0.6153 L C P X s u r f a c e + 9.305
where L C P X s u r f a c e denotes the close-proximity noise level of the pavement surface measured at the standard reference speed of 50 km/h, and L d a y and L n i g h t represent the equivalent A-weighted daytime and nighttime source emission levels associated with road–tyre interaction noise. These quantities are required inputs for subsequent receiver-level noise propagation and exposure assessment. For the reference EDP surface type, the corresponding CPX value L C P X s u r f a c e is used in Equations (3) and (4). Based on this L C P X value of EDP, the associated emission levels L d a y = 65.9 dB and L n i g h t = 59.9 dB are obtained and adopted as the baseline receiver exposure values for all comparative evaluations.
The equivalent A-weighted sound pressure levels at receiver r during the daytime (06:00–22:00) and nighttime (22:00–06:00) periods in service year X are denoted by L e q , r , D , X and L e q , r , N , X , respectively. Surface-specific differences are incorporated through the pavement correction term K B X in service year X, resulting in updated receiver exposure levels:
L e q , r , D , X = L d a y + K B X ,         t = 06 : 00 22 : 00
L e q , r , N , X = L n i g h t + K B X ,         t = 22 : 00 06 : 00
These indicators are subsequently used to calculate Lden, the A-weighted day-evening-night noise level, which represents the annual weighted average noise exposure.
When multiple road segments contribute to the noise exposure at a receiver location, the total daytime and nighttime noise levels ( L e q , r , D , X and L e q , r , N , X ) are calculated as follows:
L e q , r , t o t , D , X = 10 · l g i = 1 n 10 0.1 · L e q , r , i , D , X
L e q , r , t o t , N , X = 10 · l g i = 1 n 10 0.1 · L e q , r , i , N , X
where n is the total number of road segments that have an acoustical impact on the receiver r. Once the total daytime and nighttime noise levels at each receiver building are obtained ( L e q , r , t o t , D , X j o r   L e q , r , t o t , N , X ( j ) ), the corresponding number of people exposed to these noise levels in service year X is determined. The number of individuals experiencing high annoyance (HA) and high sleep disturbance (HSD) is less than estimated using logistic dose–response functions derived from the SiRENE (Short and Long Term Effects of Transportation Noise Exposure) study [40,41]. For each building j (with j = 1, …, k), the probability that a resident is highly annoyed due to road traffic noise is given by the following:
H A X = j = 1 k P j 1 + e x p 8.4495 + 0.1115 · L e q , r , t o t , D , X ( j )
H S D X = j = 1 k P j 1 + e x p 7.1315 + 0.0976 · L e q , r , t o t , N , X ( j )
where P(j) is the total number of people in building j, and k is the number of buildings influenced by the test section.
In this study, the health burden associated with road traffic noise is quantified in DALY, which consists of two components: years lived with disability (YLD) and years of life lost (YLL). Because high annoyance (HA) and high sleep disturbance (HSD) are non-fatal outcomes and do not contribute to premature mortality, the YLL component is assumed to be zero. As a result, all noise-related DALY values in this assessment correspond solely to YLD [36]. The two health outcomes considered—HA and HSD—were converted into DALY using established disability weights of 0.02 and 0.07 DALY per person-year, respectively. For a surface, the total human health impact (DALY) over the service-life period from the initial condition to the end of the 10th service year evaluation period is obtained as follows:
H I s c e n a r i o = X = 0 10 H A X , s c e n a r i o · 0.02 + H S D X , s c e n a r i o · 0.07
where scenario refers to the pavement type under evaluation (e.g., EDP, AO-LNP, or NO-LNP), X denotes the service year after pavement construction, H A X , s c e n a r i o is the number of individuals experiencing high annoyance in service year X for the given pavement scenario, and H S D X , s c e n a r i o is the number of individuals experiencing high sleep disturbance in service year X under the given pavement scenario, 0.02 and 0.07 are the disability weights (DALYs per person-year) associated with HA and HSD, respectively.
The DALY values are converted into monetary terms using national noise-cost statistics following the approach of [17]. In their study, road traffic noise generated 53,318 DALY per year, corresponding to a unit cost of 25,879 EUR per DALY. Accordingly, for each service year X, the total monetary cost of the noise-related health burden associated with a given pavement scenario is calculated as follows:
C o s t s c e n a r i o , X = H I s c e n a r i o , X × C D A L Y
where H I s c e n a r i o , X is the total loss of healthy life corresponding to service year X in the summation above, C D A L Y is the monetary cost assigned to one DALY (25,879 EUR per DALY), and C o s t s c e n a r i o , X represents the total economic value (€) of noise-related health impacts for service year X. This formulation ensures that the health burden can be tracked and monetised year-by-year, reflecting the acoustic performance evolution of each pavement surface throughout its service life.

2.3. Method 2: Noise Impacts on Housing Prices

This method builds on the estimation of the effect of environmental noise variations on housing prices [42]. In turn, it is used as an indirect measure of households’ willingness to pay (WTP) for quieter environments. In the residential market, it is widely established that traffic noise levels above 45 dB are associated with reduced housing desirability and, therefore, lower housing prices [43]. Conversely, noise-reducing interventions, such as noise barriers or LNPs, tend to increase property values by improving local acoustic comfort [44]. In hedonic pricing, it is assumed that house prices reflect the total utility (pleasure) derived from their constituent characteristics.
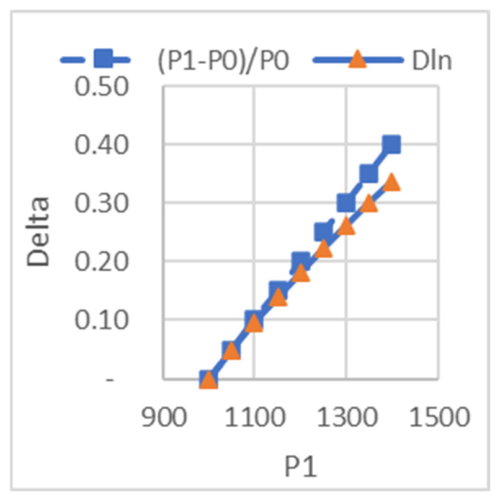
To this end, in this context, when there is the transition from a price P0 to a price P1, instead of considering the percentage change, ( P 1 i P 0 i ) / P 0 i , the difference between the two corresponding natural logs, Δln(price), is often used:
P i P 0 i × l n ( P i )
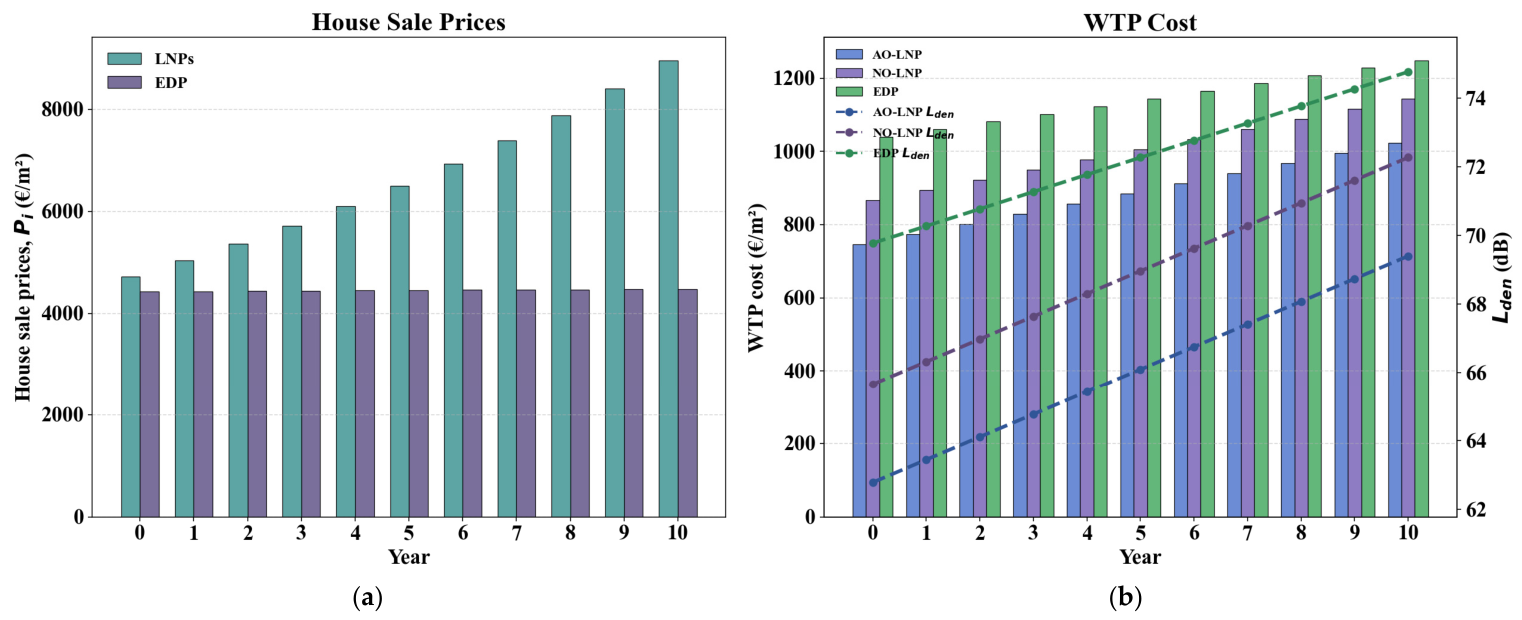
where P 0 i is the initial price, P 1 i is the final price, P i   =   P 1 i P 0 i , P i represents the monetary price difference for dwelling i, and l n ( P i ) is the corresponding change in the logarithm of price (ln P 1 i -ln P 0 i ). To analyse Equation (13), let us refer to Figure 5, where the y-axis reports Delta = ΔP/P0-Δln(P), while the x-axis refers to P1. It is possible to observe that the approximation in Equation (13) is clearly unacceptable for large variations (>0.10). To this end, Figure 5 below shows an initial cost of 1000 €/m2 (Pi = 1000, x-axis), corresponding to the only common point between P/P0 and ln(P), i.e., (1000, 0). The same Figure illustrates how the left- and right-hand sides of Equation 13 diverge markedly when P1 (on the x-axis) exceeds a certain value (namely, 1100 in this case). Indeed, the point (1100, 0.10) represents the boundary of the domain where the left and the right hand are “quite close”. Despite its intrinsic error, Equation (13) offers benefits in terms of symmetry, additivity, and elasticity [45].
For this study, a semi-log hedonic regression model is used to estimate the impact of the LNP on the housing price change. The model can estimate the structural price change resulting from improvements in the acoustic environment. The natural logarithm of the sale price (left-hand) is regressed on a monthly time index (Ti, measured in months) and a binary variable (Afteri), indicating whether the transaction occurred after the installation of the low-noise pavement:
l n ( P i ) = β 0 + β 1 T i + β 2 A f t e r i
Note that P i (sale price of dwelling i), Ti, Afteri are observed, while β 0 ,   β 1 ,   β 2 are the output of the regression process (estimates). In more detail, β 0 is the constant term representing the EDP’s log-price level before the pavement intervention (Ti = 0, Afteri = 0), β 1 is the coefficient associated with the time trend, reflecting the average monthly percentage change in prices due to overall market evolution. The variable A f t e r i equals 1 for transactions following the pavement intervention and 0 otherwise, β 2 captures the percentage change in price associated with the improved pavement condition (NO-LNP or AO-LNP) relative to the previous condition (EDP). The coefficients β 0 , β 1 , and β 2 are estimated by Ordinary Least Squares (OLS). The Newey–West estimator was applied to derive the heteroskedasticity- and autocorrelation-consistent (HAC) standard errors for Ordinary Least Squares (OLS) regression.
The estimated coefficient β 2 represents the proportional change in sale prices attributable to the LNP installation. By referring to the variation in status (from A to B) due to the “sudden” introduction of the new LNP, it is as follows:
P B e x p ( β 0 + β 1 T i + β 2 )
P A e x p ( β 0 + β 1 T i + 0 )
P B P A P A = [ exp β 0 + β 1 T i + β 2 e x p ( β 0 + β 1 T i ) ] e x p ( β 0 + β 1 T i ) e x p ( β 2 ) 1
Hence, this effect is converted into a percentage price change using the following:
π h e d o n i c = P B P A P A = e x p ( β 2 ) 1
where π h e d o n i c is the percentage change in housing prices associated with the pavement intervention derived from the semi-log hedonic model, and β 2 is the coefficient of the post-intervention dummy variable in Equation (18), representing the logarithmic change in sale prices due to the installation of the LNP.
The change in housing prices (ΔP) is linked to the observed difference in Lden noise between the pavement scenarios (ΔLden), enabling the derivation of a location-based noise-cost coefficient:
k c e l l = P L d e n
where k c e l l (€/m2·dB) expresses the monetary valuation of a 1 dB change in noise levels per square metre of residential space. This approach allows observed market behaviour—captured through the hedonic regression—to be consistently translated into a noise-cost coefficient suitable for integration within the LCC framework.
The externality at the dwelling level is calculated by multiplying the noise-cost coefficient k c e l l by the noise surplus above the reference threshold of 45 dB (cf. [46,47]). Accordingly, the WTP-based capitalisation effect for dwelling i is as follows:
Ĉ o s t i = k c e l l × ( L d e n , i 45 )
where L d e n ,   i is a-weighted average sound pressure level over all days, evenings and nights in a year in decibels (dB) for affected dwelling i, and is calculated using Equations (7) and (8).
To obtain the total external noise cost at the area level, WTP, the dwelling-level cost is multiplied by the total affected residential area:
W T P = Ĉ o s t i × A a f f e c t e d
where A a f f e c t e d is the total residential floor area exposed to the noise surplus, obtained by multiplying the number of dwellings by their representative average area. W P T represents the total monetary burden of noise externalities for the entire analysed area.
According to the calculated WTP costs, the term B e n e f i t represents the monetary welfare gain obtained from noise reduction in the pavement scenario. It is calculated as the difference between the noise-related external cost under the EDP surface condition and the corresponding cost under the evaluated scenario:
B e n e f i t = W T P E D A W T P s c e n a r i o
where W T P E D A is the annual noise cost estimated for the existing pavement condition, reflecting higher noise exposure and therefore higher external costs,   W T P s c e n a r i o is the noise cost obtained for the alternative LNP configuration. Thus, B e n e f i t expresses the economic value of noise reduction, with positive values indicating a welfare improvement due to lower noise levels, and negative values indicating increased noise-related costs relative to EDP surface condition.
In addition to the analyses related to WTP, to express the per capita distribution of external costs related to noise, WTP is divided by the number of residents exposed to noise conditions:
C p r = W T P P o p i

2.4. Method 3: Noise Impacts on Educational Activities

Noise has been proven to have a negative influence on the cognitive abilities of children, specifically in reading comprehension. In this research, the influence of road noise on educational attainment was expressed through the day-evening-night equivalent sound pressure level (Lden) that reflects the exposure throughout a whole day.
The connection between noise and the impairment of reading comprehension was calculated based on an exposure–response function developed from several epidemiological studies. The possibility that reading comprehension might suffer from noise pollution was estimated using a logistic function under the condition that the noise intensity is higher than 50 dB.
p r e a d , i = 1 1 + e x p ln 0.1 0.9 + l n 1.38 10 L d e n , i 50 ; i f   L d e n , i 50   d B p r e a d , i = p r e a d , 0 ; i f   L d e n , i < 50   d B
where p r e a d , i is the prevalence of reading comprehension impairment in school i, and p r e a d , 0 represents the baseline prevalence in the absence of noise exposure. Based on European studies given in Table 2 on children’s reading performance, the baseline prevalence was set to the following:
p r e a d , 0 = 0.11
The noise-attributable increase in prevalence was calculated as follows:
p r e a d , i   =   p r e a d , i p r e a d , 0
The corresponding number of additional students affected by noise exposure in each school was then determined as follows:
N r e a d , i = N i · p r e a d , i
where N i denotes the total number of students enrolled in school i.
The economic impact of noise-induced reading comprehension impairment was quantified using a cost-based approach derived from the macroeconomic burden of literacy difficulties. Based on the World Literacy Foundation, literacy difficulties impose a substantial economic burden, estimated at approximately 2% of GDP per capita in developed countries. Hence, this approach is based on a methodology developed by UNESCO, which links literacy-related economic losses to national economic output. Applying this framework to Italy, the total national cost of literacy difficulties was estimated and distributed across the student population, resulting in an annual unit cost of the following:
C r e a d = 760   / ( )
The annual education-related cost attributable to noise exposure for each school was then calculated as follows:
C s c h o o l r e a d , i = N r e a d , i · C r e a d
Finally, the total annual economic impact of noise on educational activities across all schools was obtained as follows:
C t o t a l E d u = i = 1 n C s c h o o l r e a d , i
To account for economic growth over time, the unit cost C r e a d was assumed to increase annually by 1% to reflect GDP growth. This assumption is consistent with macroeconomic approaches used in estimating literacy-related costs as a share of national income.
Consequently, the total educational cost due to noise exposure was computed over the service-life period from the initial condition to the end of the 10th service year, with annual cost escalation. This involves:
  • Modelling based on epidemiology (association between noise and cognitive impairment),
  • Evaluation of population exposure (affected number of students), and
  • Economic cost evaluation (estimation using GDP of literacy difficulties).
This enables quantification of external costs associated with educational impact, even if assumptions are needed.

3. Case Study

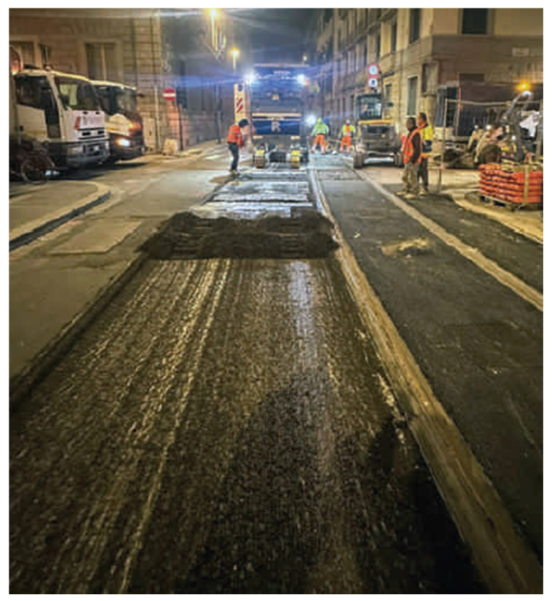
The case study area in this paper, under the LIFE SNEAK project, is located along Via La Marmora, which is a noise-sensitive urban road in Florence, Italy (see Figure 6). The reasons for this choice, as shown in Figure 6, build on the fact that this location is particularly relevant for assessing noise-related externalities, because of the railway and road traffic and the presence of numerous educational areas.
This case study considers the substantial societal benefits that can be realised through the design of acoustically optimised road surfaces in sensitive urban environments, as defined within the LIFE SNEAK project, by incorporating noise-related health, education, and socioeconomic effects into an LCC model. The acoustically optimised pavement intervention under LIFE SNEAK involved replacing the existing pavement with an acoustically enhanced mixture. This mixture was designed to reduce rolling noise by refining surface texture characteristics. For this purpose, it included recycled materials such as rubber crumbs from waste tyres and bitumen modified with recycled mineral oil and wax.
In this paper, the performance of the acoustically optimised pavement was evaluated through a before–and–after comparison, based on both environmental noise levels and tyre–road interaction measurements. Noise monitoring was performed at two representative points along the study section, namely near the Liceo Scientifico Guido Castelnuovo (P01) and in proximity to a residential building (P02). In addition, CPX measurements were used to estimate pavement-related noise emissions through the conversion procedure described in the methodology. The calculations accounted for traffic composition, pavement acoustic performance, and assumptions about acoustic ageing. This dataset has enabled the assessment of noise-related externalities and the estimation of pavement-related noise emissions in different pavement scenarios.
The following educational institutions studied include: (1) Istituto Marconi, Florence Branch, with 50 students, aged 14–19; (2) Pious Schools Florentian, with 100 students, aged 3–19; and (3) Liceo Scientifico Guido Castelnuovo, with 1252 students, aged 14–19. In sum, the exposed population considered in this analysis amounts to 1402 individuals. This population is considered a vulnerable group given the daytime noise exposure and the high susceptibility of these environments to noise disturbances.
The pavement intervention analysed in this case study refers to the application of an acoustically optimised surface developed within the LIFE SNEAK project. The following acoustic indicators were adopted:
(1)
EDP: CPX@50 km/h = 92.40 dB(A);
(2)
NO-LNP: CPX@50 km/h = 89.10 dB(A);
(3)
AO-LNP under LIFE SNEAK project: CPX@50 km/h = 86.80 dB(A).
These values are used as direct inputs to estimate noise-related health, socioeconomic, and educational impacts, and subsequently monetised within the noise-focused LCC framework. The case study is analysed using a noise-focused life cycle cost framework restricted to the monetisation of noise-related externalities. Accordingly, health, welfare, and educational impacts are included, whereas agency costs (e.g., construction, maintenance, and rehabilitation costs) are beyond the scope of the present study.

4. Results and Discussion

4.1. Health Impact Results

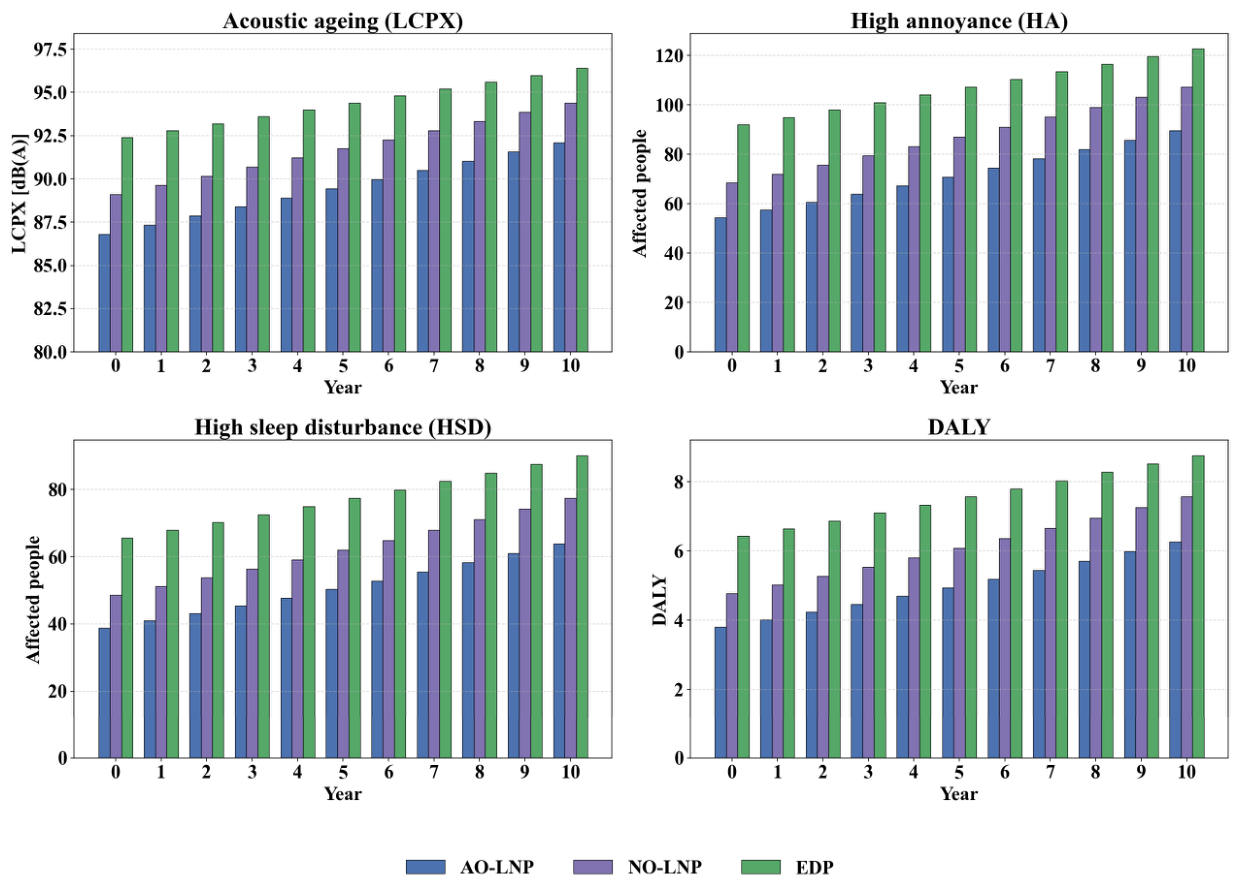
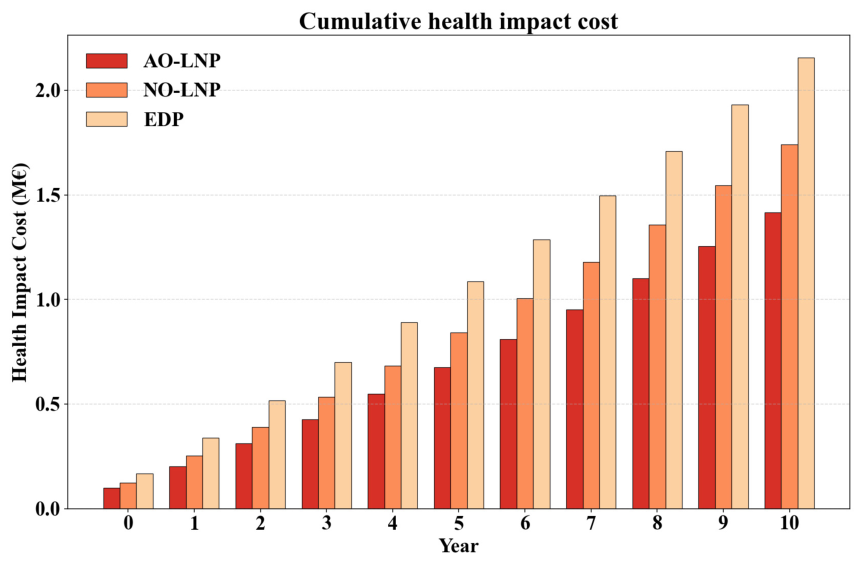
In this study, DALY values were calculated based on the YLD component, whereas the YLL component was excluded from the assessment. This modelling choice in the study is because of epidemiological evidence indicating that road traffic noise predominantly generates non-fatal outcomes such as annoyance and sleep disturbance, which are the main drivers of noise-related disease burden [53,54]. The approach also corresponds with ISO 14008:2019 [55], which provides internationally harmonised rules for monetary valuation of health impacts using €/DALY, and with the EEA [56] noise cost assessment framework recommending YLD-based DALY quantification for road traffic noise. Integrating monetised health damage into LCC assessment is supported by the requirements of CEN EN 17472:2022 [57], which clearly encourages the inclusion of external health and environmental costs in the economic evaluation of infrastructure assets. As a result, Figure 7 presents a comparison of the effects of the three surfaces on human health over the years, while Figure 8 shows the monetisation of these health effects.
For the reference year (t = 0), the monetised health effects show significant differences between the surface scenarios. The highest health-related cost of €166,462 is associated with the EDP. Next, the NO-LNP surface condition takes the lead with €123,594, while the AO-LNP pavement incurs the lowest health cost, amounting to €98,486 only. In absolute terms, the NO-LNP pavement condition yields a health-related cost reduction of 27.75% relative to the existing pavement. In contrast, the AO-LNP surface under the LIFE SNEAK project yields a reduction of 40.84%. The results indicate that the health impact of the noise is the lowest for the LIFE SNEAK pavement and the highest for the current pavement. This finding is consistent with the widely held view that road traffic noise is by far the most important urban environmental stressor, with detrimental effects on health and well-being [56,58].
At the end of the 10-year period, the health cost associated with all the pavement scenarios shows significant increases, reaching €226,790 for the EDP, €195,762 for the NO-LNP condition, and €162,260 for the AO-LNP. Despite these conservative assumptions, the ranking of the alternatives is the same, with the LIFE SNEAK solution exhibiting the lowest health cost. Its health cost is 28.45% lower than that of the EDP and 17.11% lower than that of the NO-LNP pavement. Furthermore, by the end of the decade, health-related noise costs account for approximately 10–12% of the total LCC across all scenarios. This finding highlights the cumulative influence of acoustic pavement ageing on public health outcomes [19]. From a pavement-performance standpoint, the gradual increase in health impacts through the years is also in line with studies that report the decrease in acoustic performance of quiet surfaces due to clogging, texture changes, and material ageing [17,59]. This means that the evolution of noise performance and maintenance strategies should be part of the long-term LCC frameworks. Moreover, these long-term considerations align with the ISO 14040 [60] and ISO 14044 [61] LCA principles, which emphasise the inclusion of performance deterioration and temporal aspects in impact modelling.
In summary, the results point out a major drawback of evaluating pavements solely based on agency cost. When noise-related health externalities are monetised and internalised in accordance with established international guidance (ISO 14008:2019, WHO, EEA, and CEN EN 17472:2022), conventional pavements become costlier than acoustically optimised alternatives. In addition, this cost gap widens over time. This underscores the need to consider an externality-inclusive LCC perspective in the decision-making process for urban infrastructure.

4.2. Willingness to Pay: Results

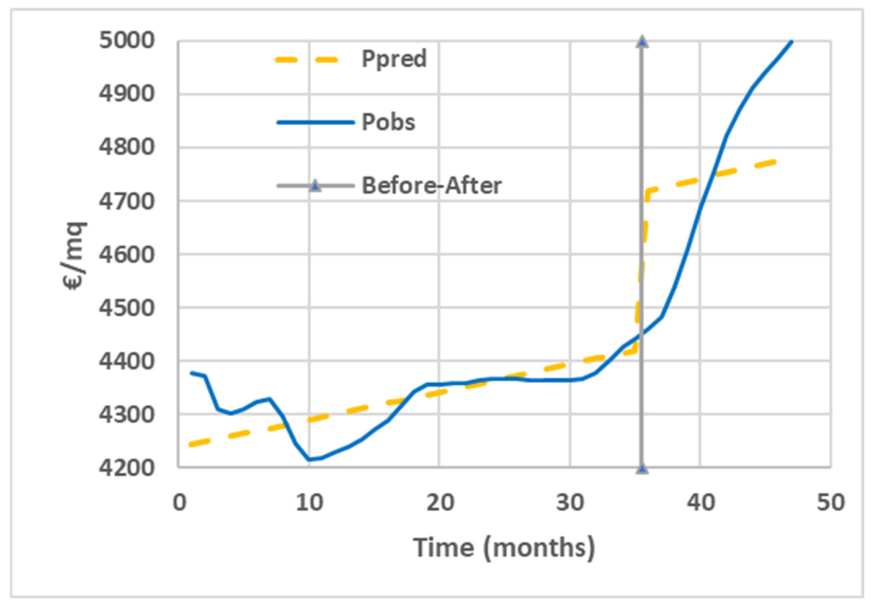
To analyse housing sale prices within the study area using a semi-log hedonic regression model, transaction data covering the period from December 2021 to October 2025 were collected [62]. Figure 9 illustrates the semi-log hedonic regression model results.
The dynamics of the observed and predicted sales prices, as well as the point of intervention, which is the implementation of the silent road surface in November 2024, are given in Figure 9. During the pre-intervention period, the sales prices tend to move along the stable line while observing a slight growth trend in line with the estimated time effect of approximately 0.12% in the average monthly variation. The data series fits well with the semi-log hedonic regression model (R2 = 0.808). This indicates that the model adequately captures the pre-intervention market dynamics. However, after LNP implementation, it is evident that sale prices show a distinct increase, clearly beyond the trend prior to the intervention. This sharp increase in prices becomes even more pronounced in the post-intervention period, and sales accelerate significantly throughout 2025. However, the hedonic results presented in Table 3 are obtained within the framework of a limited “before–after” design, without incorporating control housing market variables or control domains. In this way, the identified increase in housing prices serves as evidence of a strong relationship rather than of the influence of the LNP intervention.
As reported in Table 3 and Table 4, the coefficient of the intervention dummy variable corresponding to the LNP (β2) is positive and statistically significant (β2 = 0.0641, p < 0.001). The variable capturing the time trend is also statistically significant (β = 0.0012, p = 0.0012), implying a marginal increase in housing price per month. Moreover, the model fits well (R2 = 0.808; Adjusted R2 = 0.799), indicating that about 80% of the variation in the sale price is explained by the joint influence of the independent variables. All the results indicate a positive correlation between the post-intervention period and housing prices. However, given the limited sample size and the simplified model specification, the estimated effect should be interpreted with caution and primarily used as an input to the willingness-to-pay assessment framework.
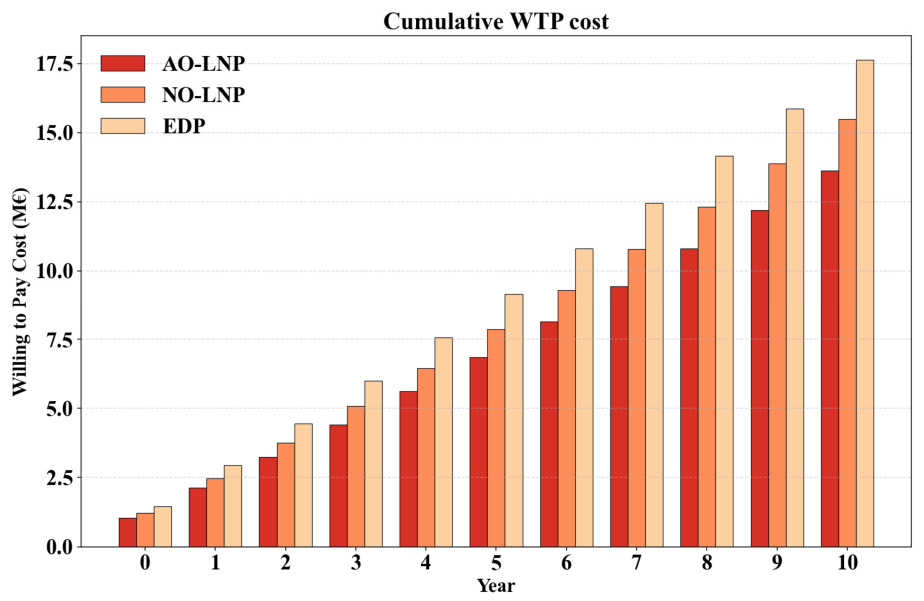
Figure 10, Figure 11 and Figure 12 illustrate the main results. Based on the findings presented in Figure 10, at t = 0, the EDP configuration creates the greatest noise surcharge (Lden = 60.67 dB), leading to a noise cost of €1.46 million for the tract (20 units, 1400 m2). In the case of NO-LNP pavement condition, the noise cost becomes €1.21 million, while the optimised LIFE SNEAK pavement brings the noise cost down to €1.05 million. It corresponds to an immediate gain of €410,200 in terms of welfare under the LIFE SNEAK scenario, clearly illustrating that acoustic optimisation has significantly improved the benefits of WTP by reducing noise.
As a result of the acoustic deterioration of the pavement surface, the Lden value became increasingly higher, growing from 69.8 dB(A) to 74.8 dB(A) within the course of ten years in the case of the EDP scenario. This is related to an acoustic ageing rate equal to 0.40 dB(A)/year, leading to a considerable increase in the associated costs connected to external noise (cf. Figure 11). In the tenth year, the cost of such noise generated by the aged state of the EDP is estimated at €1.75 million. On the other hand, the optimised LNP pavement, associated with a greater ageing rate of 0.53 dB(A)/year and reaching the Lden value of 69.4 dB(A), reduced this cost to €1.43 million. Finally, the unoptimised version of LNP had an ageing rate of 0.53 dB(A)/year and an Lden value of 72.3 dB(A); thus, the external noise cost reached €1.60 million. This led to annual costs in the following order: EDP (€17.62 million), NO-LNP (€15.49 million), and AO-LNP (€13.63 million).
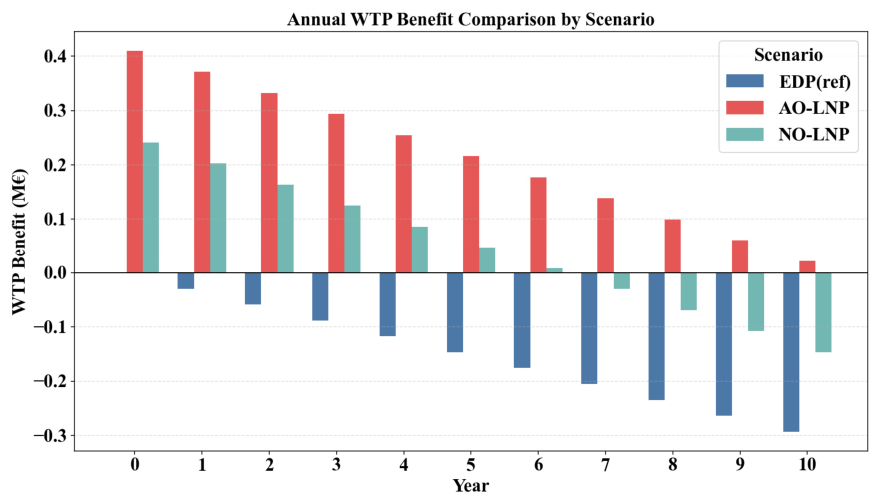
Furthermore, Figure 12 and Table 5 provide a comparative analysis of the benefits from traffic noise externality (WTPs) for all scenarios throughout the assessment period (Year 0–10). According to the results obtained in Table 5, the optimised LIFE SNEAK case scenario yielded the greatest positive net welfare impact of +€2.38 million over 10 years. Whereas the EDP road surface caused a considerable net welfare loss of -€1.61 million. Also, the NO-LNP scenario delivered an insignificant benefit from an economic standpoint. This proves that while the conventional acoustically optimised pavement provides some level of improvement relative to the EDP condition, acoustic optimisation remains critical to translating the benefits.

4.3. Educational Activities Impact Results

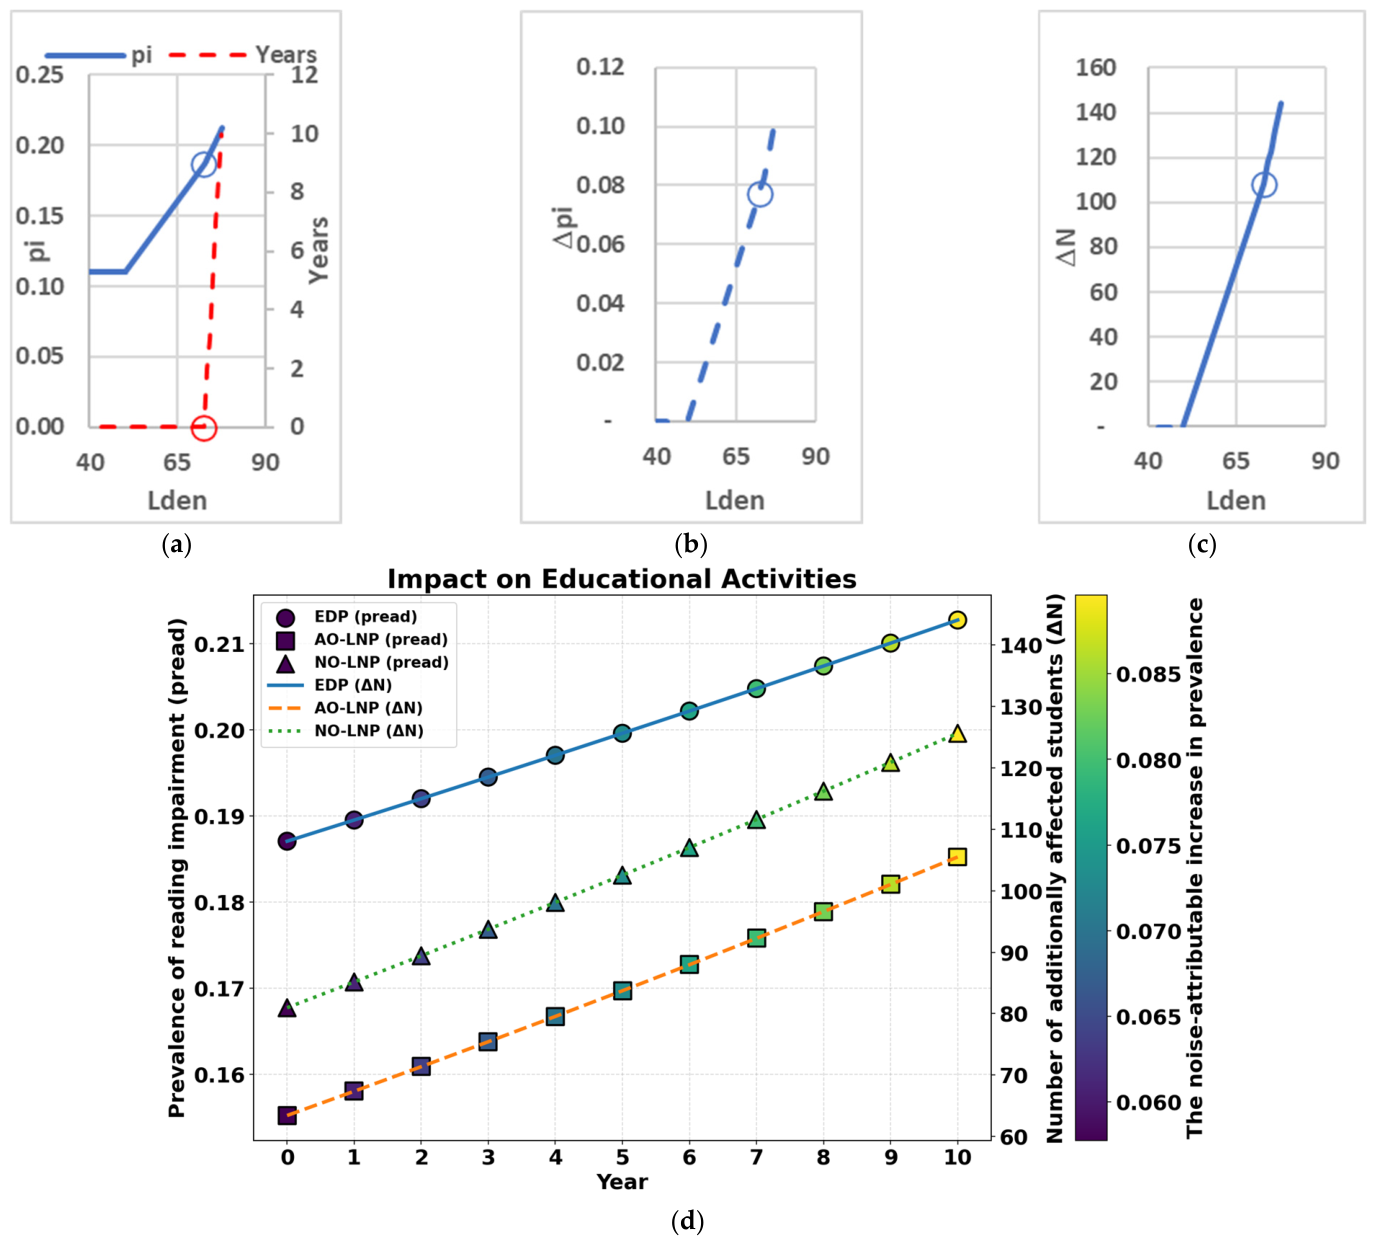
This study quantified the impact of school-environment noise on reading comprehension impairment among children aged 3–19 and the associated economic burden over a 10-year assessment period. Figure 13 shows the assessment of the impact of noise (Lden) on educational activities over the 10-year analysis period, where Lden (Figure 13a, X-axis), pi (Figure 13a, Y-axis), Δpi (Figure 13b), and ΔN (Figure 13c) are reported and the points (10 years; pi = 0.187, Lden = 72.6 dB(A); Δpi = 0.077; ΔN = 108 are illustrated (circular marker). Figure 13a–c refer only to the “before” scenario (EDP) and explain the relationships between causes (time passing) and consequences for acoustic performance and reading impairment. In Figure 13d, (1) The X-axis refers to years. (2) The left Y-axis reports the prevalence (commonness) of reading impairment, pi (defined in 0.11, 1), based on Equation (24), where the prevalence is nonlinearly proportional to Lden. On the other hand, it should be noted that the baseline prevalence value (0.11) was derived from studies conducted on school-age children. Although the educational facilities included students aged 3–19 years, the adopted prevalence estimates originate primarily from studies focusing on children aged 6–15 years, where reported prevalence values ranged between 0.11 and 0.16. To avoid overestimating the educational impacts attributable to traffic noise, the lower-bound value of 0.11 was adopted in the base-case analysis. While this assumption was considered acceptable for an exploratory assessment, a sensitivity analysis was conducted using the prevalence range reported in the literature (0.11–0.16). Moreover, the total number of exposed students was varied by ±20% in order to incorporate uncertainty regarding the age distribution, numbers of enrolment, and representativeness of the educational institutions that were considered in the case study. (3) One of the Y-axes located on the right refers to the number of additionally affected students ΔN, based on Equation (27), where for a given prevalence, the additional number of students is linearly dependent on the total number of students. (4) The second Y-axis located on the right refers to the noise-attributable increase in prevalence, Δpi, based on Equation (26). In Figure 13d, three curves are reported: (A) EDP; (B) AO-LNP; (C) NO-LNP.
According to the applied logistic risk model, the noise-related prevalence of reading impairment (cf. Equation (24)) increased steadily with rising Lden levels, resulting in a higher prevalence of reading comprehension difficulties and a greater number of additional affected students per school. It can be stated that the reference road consistently caused the largest educational burden, which, by the end of the assessment period, amounted to nearly 144 additional affected children. Conversely, the LIFE SNEAK noise-reduction scenario (AO-LNP) resulted in 26.75% (∆N= 105) fewer additional affected students at the end of the 10-year scenario and consistently produced fewer affected students than the EDP scenario. As a result, the AO-LNP scenario had the smallest burden, with NO-LNP showing an intermediate result. While in all cases there was an incremental increase due to acoustic ageing, the use of low-noise roads helped alleviate the burden on education.
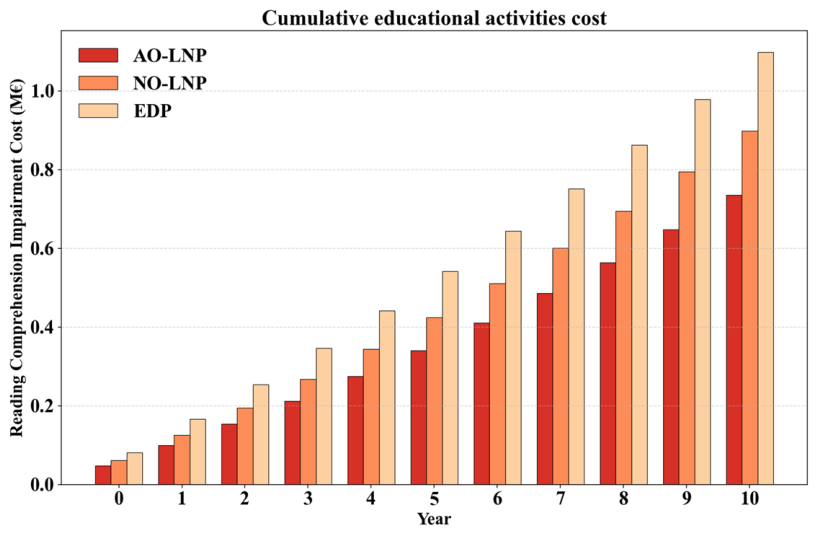
According to Figure 14, in the first year, the total annual cost attributable to noise exposure (cf. Equation (30)) was € 81,304 in the EDP surface scenario, while LIFE SNEAK reduced this cost to € 47,729, corresponding to an approximate 41.2% reduction. The NO-LNP pavement condition scenario (where no noise reduction is given) has generated a cost of € 60,918, thus placing it between the two extremes. Such results point out that even a minor reduction in noise can lead to economic and educational benefits. During the period of 10 years, the noise level scenarios that were progressively increasing showed a clear non-linear upward trend in both pread and C t o t a l E d u . This trend results from the logistic shape of the pread function, in which each increase in Lden causes a relatively larger increase in the prevalence of reading impairment. At the end of the 10th year, the total educational cost per year for the highest noise exposure was €109,785; hence, the total burden was around €1.1 million. On the other hand, the LIFE SNEAK scenario showed significantly lower year-10 costs of €73,490, thereby demonstrating the sensitivity of both cognitive and economic outcomes to small but continuous improvements in the environmental noise condition. Moreover, the gradual increase in GDP was factored into the calculation of the annual literacy-difficulty cost per student (Cread), resulting in a small year-over-year increase in this parameter. This GDP-linked increase also contributed to the rise in total educational costs, especially during the latter part of the assessment period.
The results overall indicate that noise exposure has a significant and increasing negative impact on children’s reading comprehension, resulting in an important financial loss for Italy. No less than the LIFE SNEAK noise-reduction scenario proves that proper management of noise in the vicinity of schools would significantly reduce the chances of cognitive risks and, therefore, the costs to society in the long run. These results underscore the non-negotiable necessity of installing noise-control measures in school areas to protect educational performance and, thus, reduce the cost to the public.

4.4. Sensitivity Analysis

The present methodology relies on a number of parameters derived from literature sources, empirical observations, and modelling assumptions. As with any assessment involving long-term projections of traffic-noise externalities, uncertainties in these parameters may affect the magnitude of expected impacts. Therefore, a sensitivity analysis was conducted to assess the robustness of the results and identify the parameters that most strongly influence the expected externality costs.
Acoustic ageing rates were examined because they directly affect tyre–road noise emissions and the resulting receiver noise levels considered throughout the assessment. Since this parameter influences the estimation of health, welfare, and educational impacts, it represents a key source of uncertainty within the overall framework. Additional analyses were performed for the DALY unit cost and exposed population in the health impact assessment. Similar analyses were conducted for the hedonic regression coefficient and affected residential floor area in the welfare assessment, as well as for the prevalence of reading comprehension difficulties and the exposed student population in the educational impact assessment.
Sensitivity analysis was performed by independently varying each parameter while keeping all other inputs constant. The resulting changes in externality estimates were subsequently analysed to evaluate the reliability of the framework and to determine the influence of individual assumptions on the overall assessment outcomes and the relative ranking of pavement alternatives. Table 6 summarises the parameters considered, the variation ranges applied, and the rationale for their inclusion in the sensitivity analysis.
Sensitivity analysis results in Table 7 reveal distinct patterns for the health, welfare, and education externalities, indicating which engineering, demographic, and economic factors influenced the monetised impact of road traffic noise.
For health externalities, the results indicate that the exposed population and DALY unit cost are the dominant drivers of uncertainty. A ±20% variation in either parameter produced almost proportional changes in the estimated health costs across all pavement alternatives. This behaviour is expected because both variables directly determine the number of affected individuals and the monetary valuation of health losses. In contrast, the acoustic ageing rate had a considerably smaller influence, resulting in changes generally below 6%. Although acoustic degradation affects long-term pavement noise performance, the relatively modest sensitivity suggests that the overall health cost estimates are more strongly governed by demographic exposure and valuation assumptions than by uncertainties in pavement ageing itself.
For welfare externalities, the hedonic coefficient emerged as the most influential parameter. Variations based on the confidence interval of the coefficient resulted in changes exceeding ±33% in all pavement alternatives, substantially larger than those observed for acoustic ageing. This finding reflects the central role of property value depreciation functions in welfare-based noise monetisation approaches. Because the hedonic coefficient measures the damage of noise pollution in monetary terms, any uncertainty in the estimation of the hedonic coefficient leads to uncertainty in the welfare loss calculations. This high level of uncertainty is in line with other studies where considerable differences in valuation were found. Residential floor area also showed a proportional effect on welfare costs, confirming the linear structure of the underlying valuation model.
Education-related externalities exhibited the highest relative uncertainty among the three impact categories. In particular, the prevalence parameter associated with the exposure–response relationship produced the largest variations in the results, reaching more than 80% for the AO-LNP scenario. This outcome indicates that assumptions regarding the prevalence of cognitive effects among exposed students are a critical determinant of education-related cost estimates. On the other hand, the effects from ageing of the acoustic nature were relatively insignificant, with less than 6% change. The exposed student population resulted in proportional variation in the outcomes. Based on this evidence, epidemiological considerations have been proven to introduce more uncertainty into educational impact assessment than engineering ones.
Across all impact categories, the sensitivity analysis consistently demonstrated that the monetised externalities are more sensitive to socioeconomic and epidemiological assumptions than to pavement acoustic ageing. While pavement performance remains an important component of the assessment, uncertainties related to population exposure, economic valuation coefficients, and exposure–response relationships exert a substantially greater influence on the final results. This observation is consistent with the resilience of the comparative ranking among pavement alternatives, given the fact that differences in the rate of ageing of the acoustic properties did not affect the relative performance of EDP, NO-LNP, and AO-LNP. Therefore, it can be seen that the implications of the study are that future research needs to concentrate on the development of more accurate exposure and valuation parameters, as well as epidemiology.

5. Conclusions and Discussion

In current assessment practices, noise is frequently excluded from standard LCA/LCCA procedures, despite its significant and well-documented societal impacts. In the current study, the economic importance of road traffic noise was analysed using an integrated LCC model that considered the health, housing, and educational implications of LNPs. An analysis was conducted, particularly within the framework of European Green Public Procurement principles, in response to the growing policy demand for environmentally and socially friendly sustainable infrastructure solutions.
The following conclusions may be drawn:
  • The scope of this study is limited to the evaluation of use-phase noise-related externalities only. However, by developing a comprehensive noise-monetisation method and applying it to a real case study within the LIFE SNEAK project, this work demonstrates that noise-related externalities are essential, quantifiable, and, importantly, decisive for pavement-related decision-making.
  • From a health perspective, the DALY analysis revealed that noise-induced annoyance and sleep disturbance generate substantial long-term (ten years) external costs, which become increasingly significant when time-dependent degradation of acoustic performance is considered. Although healthcare-related costs represent a smaller burden compared to welfare-related costs, they are steadily increasing over time. The application of acoustically optimised pavements in the LIFE SNEAK project consistently reduced this burden. Compared with the old pavement, the reduction exceeded 34.31% between the baseline condition and the end of the 10th service year.
  • The WTP analyses demonstrated that traffic noise strongly affects housing-market behaviour. Low-noise pavement installation produced an immediate and highly significant capitalisation effect, increasing residential property values by more than 6% after controlling for time trends. In addition, over the 10-year horizon, the optimised LIFE SNEAK pavement was the only solution that generated a positive cumulative welfare effect (+€2.38 million). In contrast, the EDP scenario led to considerable long-run welfare losses (–€1.61 million). Thereby, these results reaffirm that even modest reductions in noise can translate into substantial welfare gains and economic benefits.
  • Another result of this research is the assessment of noise effects on children’s reading comprehension and the related educational expenses (pread), an externality often ignored in transport and pavement evaluations—one of the main silent costs of noise. The logistic exposure–response model indicates that noise pollution increases the likelihood and severity of declines in reading comprehension, especially among sensitive children. It also demonstrates that noise pollution has social consequences, as it links environmental exposure to cognitive performance and, in turn, to human capital development and socioeconomic growth. Furthermore, the findings reveal that AO-LNPs have substantial potential to mitigate the socioeconomic impacts of traffic noise in the educational sector. By mitigating traffic noise pollution, LNPs can ultimately reduce the socioeconomic burden associated with educational costs by 33.6%.
  • The health, welfare, and education evaluations have shown that noise externalities could be a major part of the social effects of pavement systems. This means that noise mitigation through LNPs could yield substantial social gains by reducing health, welfare, and education costs associated with noise pollution. Among all the alternatives tested, the acoustically optimised low-noise pavement (AO-LNP) developed within the LIFE SNEAK project consistently showed the largest reduction in external costs.
  • The sensitivity analysis further demonstrated that the estimated external costs are primarily influenced by socioeconomic and epidemiological assumptions. In particular, the hedonic coefficient, prevalence rate, exposed population, and DALY unit cost had an impact on the results, whereas the acoustic ageing rate had a comparatively limited effect. More critically, none of the tested parameter variations altered the relative ranking of the pavement scenarios. AO-LNP remained the best-performing option across all scenarios, followed by NO-LNP and EDP scenarios. It indicated that the study’s comparative conclusions are robust despite uncertainties in key model inputs.
  • In conclusion, this paper provides empirical support for the argument that noise-related externalities should be incorporated in LCC frameworks on a regular basis. This would not only lead to more accurate cost assessments but also help choose options consistent with the goals of public health, the environment, and social well-being. The findings of this research are indeed a step forward in the development of noise-aware pavement design and, at the same time, offer a practical basis for governments and public authorities seeking to adopt cost-effective, socially responsible road infrastructure strategies.
  • It is noted that the present study was intentionally limited to assessing and monetising noise-related externalities. Construction, installation, maintenance, and rehabilitation costs were not included within the system boundaries. Consequently, the extent to which the quantified societal benefits may offset the additional agency costs associated with low-noise pavements cannot be determined from the current analysis. This should be investigated in future studies adopting a full LCC approach. Therefore, the findings should be interpreted as an assessment of noise-related externality benefits rather than as a complete economic appraisal of pavement alternatives. On the other hand, it must be stated that the findings of this research apply only to the case study of a single urban environment (Florence). As such, they reflect the traffic conditions, population exposure, urban design, educational facilities, and real estate market characteristics of this particular city. In that regard, the monetary values provided here cannot simply be applied to other regions without some recalibration to the local environment. However, the proposed model is versatile enough to be applied to various urban environments with different pavements, traffic conditions, and socioeconomic conditions, as long as noise, demographic, and economic data for a specific region are available.

Author Contributions

Conceptualisation, F.G.P. and E.E.; methodology, F.G.P. and E.E.; validation, F.G.P. and E.E.; formal analysis, F.G.P. and E.E.; investigation, F.G.P. and E.E.; data curation, F.G.P. and E.E.; writing—original draft preparation, E.E.; writing—review and editing, F.G.P.; visualisation, F.G.P. and E.E.; supervision, F.G.P.; project administration, F.G.P.; funding acquisition, F.G.P. All authors have read and agreed to the published version of the manuscript.

Funding

This research received no external funding.

Data Availability Statement

The raw data supporting the conclusions of this article will be made available by the authors on request.

Acknowledgments

The authors would like to thank all those who supported them with this research, especially the European Commission (LIFE SILENT, Sustainable Innovations for Long-life Environmental Noise Technologies, LIFE22-ENV-IT-LIFE-SILENT/101114310|Acronym: LIFE22-ENV-IT-LIFE SILENT) and Giuseppe Colicchio.

Conflicts of Interest

The authors declare no conflicts of interest.

References

  1. Li, H.; Wang, L.; Han, Y.; Zhang, X.; Zhang, H.; Chen, L. Acoustic properties and durability of porous low-noise pavement solutions to improve acoustic environment: A critical literature review. Int. J. Transp. Sci. Technol. 2025. [Google Scholar] [CrossRef]
  2. Eren, E.; Valentin, J.; Gallo, P.; Ahmedzade, P. Fracture Resistance and Self-Healing Potential of Very Thin Asphalt Overlay Enhanced by Microwave Heating. Eskişehir Osman. Üniversitesi Mühendislik Mimar. Fakültesi Derg. 2025, 33, 1739–1750. [Google Scholar] [CrossRef]
  3. Yang, B.; Yuan, M.; Weng, Z.; Li, D.; Leng, Z. Acoustic aging of low-noise pavements in Hong Kong: Regression modelling and mechanism investigation. Transp. Res. Part D Transp. Environ. 2025, 144, 104793. [Google Scholar] [CrossRef]
  4. Peer, M.Y.; Mir, M.S.; Mohanty, B. Evaluation of the spatiotemporal variations of road traffic noise pollution and public cognizance of associated health hazards within urban environments. Int. J. Sustain. Transp. 2025, 19, 923–943. [Google Scholar] [CrossRef]
  5. Mikhailenko, P.; Piao, Z.; Kakar, M.R.; Bueno, M.; Athari, S.; Pieren, R.; Heutschi, K.; Poulikakos, L. Low-Noise pavement technologies and evaluation techniques: A literature review. Int. J. Pavement Eng. 2022, 23, 1911–1934. [Google Scholar]
  6. Karmakar, D.; Pal, M.; Majumdar, K.; Suresh, M.; Roy, P.K. Utilization of porous asphalt material in road construction for reducing the vehicular noise. Mater. Today Proc. 2022, 65, 3602–3609. [Google Scholar] [CrossRef]
  7. Bendtsen, H.; Gspan, K. State of the Art in Managing Road Traffic Noise: Noise-Reducing Pavements; Conference of European Directors of Roads: Brussels, Belgium, 2017. [Google Scholar]
  8. Cucurachi, S.; Heijungs, R.; Ohlau, K. Towards a general framework for including noise impacts in LCA. Int. J. Life Cycle Assess. 2012, 17, 471–487. [Google Scholar] [CrossRef] [PubMed]
  9. Garraín, D.; Franco, V.; Vidal, R.; Moliner, E.; Casanova, S. The noise impact category in life cycle assessment. In Selected Proceedings from the 12th International Congress on Project Engineering; Asociación Española de Ingeniería de Proyectos (AEIPRO): Zaragoza, Spain, 2009; pp. 211–221. [Google Scholar]
  10. Althaus, H.-J.; De Haan, P.; Scholz, R.W. Traffic noise in LCA: Part 1: State-of-science and requirement profile for consistent context-sensitive integration of traffic noise in LCA. Int. J. Life Cycle Assess. 2009, 14, 560–570. [Google Scholar] [CrossRef]
  11. Praticò, F. LCCA for silent surfaces. In Pavement Life-Cycle Assessment; CRC Press: Boca Raton, FL, USA, 2017; pp. 231–240. [Google Scholar]
  12. Margorínová, M.; Trojanová, M.; Decký, M.; Remišová, E. Noise costs from road transport. Civ. Environ. Eng. 2018, 14, 12–20. [Google Scholar] [CrossRef]
  13. Cao, R.; Leng, Z.; Hsu, M.S.-C.; Yu, H.; Wang, Y. Integrated sustainability assessment of asphalt rubber pavement based on life cycle analysis. In Pavement Life-Cycle Assessment; CRC Press: Boca Raton, FL, USA, 2017; pp. 209–220. [Google Scholar]
  14. Rath, P. State of Knowledge Report on Rubber Modified Asphalt; US Tire Manufacturers Association: Washington, DC, USA, 2021. [Google Scholar]
  15. Piao, Z.; Heutschi, K.; Pieren, R.; Mikhailenko, P.; Poulikakos, L.D.; Hellweg, S. Environmental trade-offs for using low-noise pavements: Life cycle assessment with noise considerations. Sci. Total Environ. 2022, 842, 156846. [Google Scholar] [CrossRef] [PubMed]
  16. Haverkamp, P.; Traverso, M. A multi-level life cycle sustainability assessment framework for road pavements and materials. Int. J. Life Cycle Assess. 2026, 31, 100. [Google Scholar] [CrossRef]
  17. Piao, Z.; Waldner, U.; Heutschi, K.; Poulikakos, L.D.; Hellweg, S. Modified life cycle assessment for Low-Noise urban roads including acoustics and monetarization. Transp. Res. Part D Transp. Environ. 2022, 112, 103475. [Google Scholar] [CrossRef]
  18. Ahmed, O.S.; Al-Gahtani, K.S.; Altuwaim, A. Cost–Benefit Framework for Selecting a Highway Project Using the SWARA Approach. Buildings 2025, 15, 439. [Google Scholar] [CrossRef]
  19. Zhu, L.; Zhang, L.; Ye, Q.; Du, J.; Zhao, X. A three-dimensional evaluation model of the externalities of highway infrastructures to capture the temporal and spatial distance to optimal—A case study of China. Buildings 2022, 12, 328. [Google Scholar] [CrossRef]
  20. Hofstetter, P.; Müller-Wenk, R. Monetization of health damages from road noise with implications for monetizing health impacts in life cycle assessment. J. Clean. Prod. 2005, 13, 1235–1245. [Google Scholar] [CrossRef]
  21. Gompf, K.; Traverso, M.; Hetterich, J. Towards social life cycle assessment of mobility services: Systematic literature review and the way forward. Int. J. Life Cycle Assess. 2020, 25, 1883–1909. [Google Scholar] [CrossRef]
  22. Verhaeghe, N.; Vandenbulcke, B.; Lelie, M.; Annemans, L.; Simoens, S.; Putman, K. Cost-Effectiveness of Strategies Addressing Environmental Noise: A Systematic Literature Review. Int. J. Environ. Res. Public Health 2025, 22, 803. [Google Scholar] [CrossRef] [PubMed]
  23. Sartori, D.; Catalano, G.; Genco, M.; Pancotti, C.; Sirtori, E.; Vignetti, S.; Del Bo, C. Guide to cost-benefit analysis of investment projects. In Economic Appraisal Tool for Cohesion Policy 2014–2020; Publications Office of the European Union: Luxembourg, 2015. [Google Scholar]
  24. LIFE SNEAK—Optimized Surfaces Against NoisE and Vibrations Produced by Tramway tracK and Road Traffic. Available online: https://webgate.ec.europa.eu/life/publicWebsite/project/LIFE20-ENV-IT-000181/life-sneak-optimized-surfaces-against-noise-and-vibrations-produced-by-tramway-track-and-road-traffic (accessed on 22 June 2026).
  25. Sustainable Innovations for Long-Life Environmental Noise Technologies. Available online: https://webgate.ec.europa.eu/life/publicWebsite/project/LIFE22-ENV-IT-LIFE-SILENT-101114310/sustainable-innovations-for-long-life-environmental-noise-technologies (accessed on 22 June 2026).
  26. Praticò, F.G.; Perri, G. Are Low-Temperature Asphalts a Good Choice? In Proceedings of the International Symposium on Pavement, Roadway, and Bridge Life Cycle Assessment, Arlington, VA, USA, 6–8 June 2024; pp. 99–106. [Google Scholar]
  27. Praticò, F.G.; Perri, G. A Study on Warm Mix Asphalt Sustainability. In Proceedings of the International Conference on Maintenance and Rehabilitation of Pavements, Guimarães, Portugal, 24–26 July 2024; pp. 284–292. [Google Scholar]
  28. Praticò, F.G.; Fedele, R.; Briante, P.G. On the dependence of acoustic pore shape factors on porous asphalt volumetrics. Sustainability 2021, 13, 11541. [Google Scholar] [CrossRef]
  29. Praticò, F.G.; Fedele, R.; Briante, P.G. Investigation on acoustic versus functional characteristics of porous asphalt. Balt. J. Road Bridge Eng. 2021, 16, 212–239. [Google Scholar] [CrossRef]
  30. Praticò, F.G. “Noisy” issues in road acoustics: A white paper. J. Road Eng. 2022, 2, 61–69. [Google Scholar] [CrossRef]
  31. Praticò, F.G.; Fedele, R. Road pavement macrotexture estimation at the design stage. Constr. Build. Mater. 2023, 364, 129911. [Google Scholar] [CrossRef]
  32. Praticò, F.G.; Fedele, R.; Pellicano, G. Pavement FRFs and noise: A theoretical and experimental investigation. Constr. Build. Mater. 2021, 294, 123487. [Google Scholar] [CrossRef]
  33. Pyko, A.; Eriksson, C.; Oftedal, B.; Hilding, A.; Östenson, C.-G.; Krog, N.H.; Julin, B.; Aasvang, G.M.; Pershagen, G. Exposure to traffic noise and markers of obesity. Occup. Environ. Med. 2015, 72, 594–601. [Google Scholar] [CrossRef] [PubMed]
  34. EEA. Environmental Noise in Europe 2025; European Environment Agency: Copenhagen, Denmark, 2025. [Google Scholar]
  35. ETC-HE. Environmental Noise Health Risk Assessment: Methodology for Assessing Health Risks Using Data Reported Under the Environmental Noise Directive; No 2023/11; European Topic Centre on Human Health and the Environment: Kjeller, Norway, 2024. [Google Scholar]
  36. Licitra, G.; Cerchiai, M.; Ascari, E. Noise monitoring within LIFE NEREiDE: Methods and results. In Proceedings of the INTER-NOISE and NOISE-CON Congress and Conference Proceedings, Madrid, Spain, 16–19 June 2019; pp. 8106–8114. [Google Scholar]
  37. Aballea, F.-E.; Lissek, H.; Utz, S.; Rene, P.-J.; Martin, P. Update of the Swiss source model for road traffic noise. In Proceedings of the 16th International Congress on Sound and Vibration (ICSV16), Kraków, Poland, 5–9 July 2009. [Google Scholar]
  38. ISO 11819-2:2017; Acoustics—Measurement of the Influence of Road Surfaces on Traffic Noise—Part 2: The Close-Proximity Method. International Organization for Standardization: Geneva, Switzerland, 2017.
  39. Bendtsen, H.; Lu, Q.; Kohler, E. Acoustic Aging of Asphalt Pavements: A Californian/Danish Comparison; University of California Pavement Research Center: Davis, CA, USA, 2010. [Google Scholar]
  40. Brink, M.; Schäffer, B.; Vienneau, D.; Pieren, R.; Foraster, M.; Eze, I.C.; Rudzik, F.; Thiesse, L.; Cajochen, C.; Probst-Hensch, N. Self-reported sleep disturbance from road, rail and aircraft noise: Exposure-response relationships and effect modifiers in the SiRENE study. Int. J. Environ. Res. Public Health 2019, 16, 4186. [Google Scholar] [CrossRef] [PubMed]
  41. Brink, M.; Schäffer, B.; Vienneau, D.; Foraster, M.; Pieren, R.; Eze, I.C.; Cajochen, C.; Probst-Hensch, N.; Röösli, M.; Wunderli, J.-M. A survey on exposure-response relationships for road, rail, and aircraft noise annoyance: Differences between continuous and intermittent noise. Environ. Int. 2019, 125, 277–290. [Google Scholar] [CrossRef] [PubMed]
  42. Kamtziridis, G.; Vrakas, D.; Tsoumakas, G. Does noise affect housing prices? A case study in the urban area of Thessaloniki. EPJ Data Sci. 2023, 12, 50. [Google Scholar] [CrossRef]
  43. Moretti, E.; Wheeler, H. The Traffic Noise Externality: Costs, Incidence and Policy Implications; National Bureau of Economic Research: Cambridge, MA, USA, 2025. [Google Scholar]
  44. Lindgren, S. A sound investment? Traffic noise mitigation and property values. J. Environ. Econ. Policy 2021, 10, 428–445. [Google Scholar] [CrossRef]
  45. McMillan, M.L.; Reid, B.G.; Gillen, D.W. An extension of the hedonic approach for estimating the value of quiet. Land Econ. 1980, 56, 315–328. [Google Scholar] [CrossRef]
  46. Van Essen, H.; Van Wijngaarden, L.; Schroten, A.; Sutter, D.; Bieler, C.; Maffii, S.; Brambilla, M.; Fiorello, D.; Fermi, F.; Parolin, R. Handbook on the External Costs of Transport, Version 2019; European Commission: Brussels, Belgium, 2019. [Google Scholar]
  47. Navrud, S. The State-of-the-Art on Economic Valuation of Noise; European Commission DG Environment: Brussels, Belgium, 2002. [Google Scholar]
  48. Cecilia, M.R.; Vittorini, P.; Cofini, V.; Di Orio, F. The prevalence of reading difficulties among children in scholar age. Styles Commun. 2014, 6, 18–30. [Google Scholar]
  49. Castro, E.; Cotov, M.; Brovedani, P.; Coppola, G.; Meoni, T.; Papini, M.; Terlizzi, T.; Vernucci, C.; Pecini, C.; Muratori, P.J.C. Associations between learning and behavioral difficulties in second-grade children. Children 2020, 7, 112. [Google Scholar] [CrossRef] [PubMed]
  50. ELINET. Literacy in Europe: Facts and Figures. 2015. Available online: https://mgciissn.wordpress.com/wp-content/uploads/2017/04/factsheet-literacy_in_europe-a4.pdf (accessed on 25 January 2026).
  51. Italy GDP—Gross Domestic Product. Available online: https://countryeconomy.com/gdp/italy?year=2024&utm_source (accessed on 15 January 2026).
  52. ISTAT. Italian Statistical Yearbook 2025 Executive Summary; ISTAT: Chicago, IL, USA, 2025. [Google Scholar]
  53. Khan, D.; Burdzik, R. Noise and vibration as environmental impacts of transportation: Comprehensive review. Transp. Res. Interdiscip. Perspect. 2025, 34, 101578. [Google Scholar] [CrossRef]
  54. WHO. Environmental Noise Guidelines for the European Region; WHO: Geneva, Switzerland, 2018. [Google Scholar]
  55. ISO 14008:2019; Monetary Valuation of Environmental Impacts and Related Environmental Aspects. International Organization for Standardization: Geneva, Switzerland, 2019.
  56. EEA. Environmental Noise in Europe—2020 (EEA Report No 22/2019); EEA: Copenhagen, Denmark, 2020. [Google Scholar]
  57. EN 17472:2022; Sustainability of Construction Works—Sustainability Assessment of Civil Engineering Works—Calculation Methods. European Committee for Standardization: Brussels, Belgium, 2022.
  58. Levkovich, O.; Rouwendal, J.; Van Marwijk, R. The effects of highway development on housing prices. Transportation 2016, 43, 379–405. [Google Scholar]
  59. Licitra, G.; Moro, A.; Teti, L.; Del Pizzo, L.; Bianco, F. Modelling of acoustic ageing of rubberized pavements. Appl. Acoust. 2019, 146, 237–245. [Google Scholar] [CrossRef]
  60. ISO 14040:2006; Environmental Management—Life Cycle Assessment—Principles and Framework. International Organization for Standardization: Geneva, Switzerland, 2006.
  61. ISO 14044:2006; Environmental Management—Life Cycle Assessment—Requirements and Guidelines. International Organization for Standardization: Geneva, Switzerland, 2006.
  62. Immobiliare.it. Available online: https://www.immobiliare.it/en/mercato-immobiliare/toscana/firenze/ (accessed on 15 December 2025).
Figure 1. Noise monetisation methods in the literature. Symbols: LCA—Life-Cycle Assessment; LCC—Life-Cycle Cost; SLCA—Social Life Cycle Assessment; CBA—Cost–Benefit Analysis; CEA—Cost-Effectiveness Analysis. (*): cf. [17]. (**): cf. [21]. (***): cf. [18]. (^): cf. [22]. (^^): cf. [19,20].
Infrastructures 11 00249 g001
Figure 2. System boundaries of the noise-focused use-phase LCC analysis.
Infrastructures 11 00249 g002
Figure 3. Noise-related externality categories and their indicators.
Infrastructures 11 00249 g003
Figure 4. Monetisation of noise based on DALY (first year).
Infrastructures 11 00249 g004
Figure 5. Error in Ln approximation.
Infrastructures 11 00249 g005
Figure 6. Case study (VIA LA MARMORA, FLORENCE-LIFE SNEAK).
Infrastructures 11 00249 g006
Figure 7. The effect of road noise on human health over the years.
Infrastructures 11 00249 g007
Figure 8. Monetisation of health effects over the years.
Infrastructures 11 00249 g008
Figure 9. Impact of LNP installation on sale prices based on before–after hedonic analysis.
Infrastructures 11 00249 g009
Figure 10. WTP monetisation process. (a) House sale prices; (b) WTP cost (€/m2) related to noise.
Infrastructures 11 00249 g010
Figure 11. Monetisation of WTP effects of noise over the years.
Infrastructures 11 00249 g011
Figure 12. Traffic-noise-related WTP externality benefit assessment.
Infrastructures 11 00249 g012
Figure 13. Assessment of the impact of noise on educational activities: (a) pi and years; (b) Δpi; (c) ΔN; (d) comparison.
Infrastructures 11 00249 g013
Figure 14. Monetisation of reading comprehension impairment effects of noise over the years.
Infrastructures 11 00249 g014
Table 1. Noise impact measurement and monetisation: pertinence to criteria.
ReferencesLCALCCSLCACBACEAExternalitiesMeasurement
Piao, et al. [17]Use phaseExternal cost----Health impact
Ahmed, et al. [18]---Environmental factor—noise/air pollution cost --Noise barriers cost
Zhu, et al. [19]-----Negative
Externality/
Ecological
Noise pollution
Hofstetter and Müller-Wenk [20]-----LCA externalitiesHealth impact
Gompf, et al. [21]--Noise pollution, safety, and convenience---% area inhabited exposed to traffic noise pollution greater than 65 dB,
Fatal and non-fatal traffic accidents, Traffic congestion
Verhaeghe, et al. [22]----Environmental noise related to traffic-Health and well-being costs, Direct medical costs, willingness-to-pay (WTP), return on investment (noise barriers)
Table 2. Parameters, assumptions, and economic inputs used to estimate education-related noise costs.
ParametersUnitReferences and Explanations
p r e a d -Noise-related prevalence of reading comprehension impairment.
p r e a d , 0 0.11Prevalence of reading comprehension difficulties is based on the studies of Cecilia, et al. [48], Castro, et al. [49] and ELİNET [50] conducted in Italy that examined the reading and comprehension skills of children aged 6–15 in schools. This value was accepted as 0.11 in this study.
N i studentsTotal number of enrolled students in school i.
N r e a d , i studentsNumber of additional affected students attributable to noise exposure in school i.
C r e a d 760 €/(student⋅year)Literacy difficulties cost the economy 1.1 trillion euros a year globally, and this cost is over 350 billion euros in the European economy each year [50]. According to this report presented by the World Literacy Foundation, a cost of €1.1 trillion a year is attributed to literacy difficulties in the global economy. The calculation tool used in this estimation is a formula presented by UNESCO, which considers the economy size and structure in different countries. The cost attributed to difficulties in literacy in developing nations is calculated at 0.5% of their Gross Domestic Product (GDP). For emerging economies like China and India, the cost attributed to difficulties in literacy is calculated at 1.2% of GDP, and in developed nations, it is calculated at approximately 2% of GDP, i.e., Italy [50].
 
GDP (2024) in Italy was approximately $2.38 trillion/year [51], while the population in 2024 was about 58.9 million persons [52]. Based on these values, GDP per capita can be estimated as follows:
G D P p c = 2.38   t r i l l i o n   $ 58.9   m i l l i o n 40,405 $ / ( )
By adopting an average exchange rate of 1$ = 0.93€, this corresponds to approximately:
G D P p c = 38,000 / ( p e r s o n   y e a r )
The GDP growth rate was assumed to be 0.01 per year.
 
Based on a GDP per capita of approximately €40,000/year, and adopting α = 2% in line with the literature [50], the unit cost per affected student is estimated as follows:
C r e a d = G D P p c × α 38,000 × 0.02 = 760 / ( s t u d e n t   y e a r )
C s c h o o l r e a d €/yearAnnual educational cost attributable to noise for a given school.
C t o t a l E d u €/yearThe total annual cost of noise impact on educational activities across all schools in the study area.
Table 3. Hedonic regression results for the impact of LNP implementation on housing sale prices.
VariableCoefficient (β)Std. Errort-Statisticp-Value
Constant ( β 0 )8.35220.00831007.08p < 0.001
Time ( β 1 )0.00120.00043.37p < 0.001
After (silent pavement implementation) ( β 2 )0.06410.01613.98p < 0.001
Table 4. Goodness-of-fit statistics for the hedonic price model.
StatisticValue
Number of observations47
R20.808
Adjusted R-squared0.799
F-statistic27.30 (p < 0.001)
Table 5. Comparative traffic-noise-related WTP externality total benefit assessment for all scenarios.
ScenarioTotal Benefit (M€)
EDP−1.61
NO-LNP+0.52
AO-LNP (LIFE SNEAK)+2.38
Table 6. Key sources of uncertainty and variation ranges are considered in the sensitivity analysis.
AspectParameterVariation
Considered
Reason
Health, Welfare and EducationAcoustic ageing rate±20%Uncertainty in the assumed long-term pavement acoustic ageing
HealthExposed population±20%Uncertainty in the number of residents exposed to traffic noise
HealthDALY unit cost±20%Uncertainty in the monetary valuation of health impacts in Italy
WelfareHedonic coefficient β295% CIRegression uncertainty associated with the hedonic price model
WelfareResidential floor area±20%Uncertainty in the representative residential surface area affected by noise exposure
EducationReading comprehension prevalence0.11–0.16Range reported in the literature for reading comprehension difficulties
EducationExposed student population±20%Uncertainty in enrolment data, age distribution, and exposed student numbers
Table 7. Results of the sensitivity analysis.
NoScenarioParamater VariationEDP(M€)NO-LNP(M€)AO-LNP (M€)
1HealthBase case2.161.741.42
2HealthAcoustic ageing rate (+20%)2.231.831.49
3HealthAcoustic ageing rate (–20%)2.091.661.34
4HealthExposed population (+20%)2.592.091.70
5HealthExposed population (–20%)1.731.391.13
6HealthDALY unit cost (+20%)2.602.091.70
7HealthDALY unit cost (–20%)1.731.391.13
8WelfareBase case17.6215.4813.63
9WelfareAcoustic ageing rate (+20%)17.9415.9114.06
10WelfareAcoustic ageing rate (–20%)17.3015.0613.20
11WelfareHedonic coefficient (Upper CI)23.6820.8118.32
12WelfareHedonic coefficient (Lower CI)11.7710.349.11
13WelfareResidential floor area (+20%)21.1418.5816.36
14WelfareResidential floor area (–20%)14.1012.3910.91
15EducationBase case1.10.900.73
16EducationAcoustic ageing rate (+20%)1.130.940.77
17EducationAcoustic ageing rate (−20%)1.070.860.70
18EducationUpper-bound prevalence ( p   = 0.16)0.490.290.12
19EducationExposed student population (+20%)1.321.080.88
20EducationExposed student population (–20%)0.880.720.59
Symbols: CI = Confidence Interval.
Disclaimer/Publisher’s Note: The statements, opinions and data contained in all publications are solely those of the individual author(s) and contributor(s) and not of MDPI and/or the editor(s). MDPI and/or the editor(s) disclaim responsibility for any injury to people or property resulting from any ideas, methods, instructions or products referred to in the content.