


Abstract
Existing spillway piers constructed more than 60 years ago in Japan are usually reinforced with round rebars and have very low rebar ratios; consequently, their seismic response may be strongly influenced by post-cracking bond–slip. However, the applicability of nonlinear analytical models to such piers has not yet been systematically clarified. In this study, practical modeling strategies for existing spillway piers were investigated by performing Incremental Dynamic Analysis (IDA) using both a beam model based on nonlinear moment–curvature (M-φ) relationships and a 3D finite element analysis that explicitly accounts for bond–slip between concrete and rebar. An actual spillway pier was analyzed at multiple seismic intensity levels, and the effects of bar diameter, rebar ratio, and bond condition were examined via 3D finite element analysis. The results showed that the beam model is useful for global screening but may misclassify the damage mode because it cannot explicitly represent bond–slip. By contrast, the 3D finite element analysis reproduced flexure-dominant damage patterns and quantified the influence of bond–slip on maximum displacement, residual displacement, rebar strain, tensile damage distribution, and compression damage distribution. These differences became more pronounced under stronger ground motions and for larger bar diameters and lower rebar ratios. The findings support a staged strategy for seismic performance evaluation that combines beam models for global screening with 3D finite element analysis for detailed member-level assessment.
1. Introduction
Dams are critical infrastructure facilities that serve multiple functions, including flood control, water use, and power generation. Ensuring that reservoir water levels can be properly controlled even after severe earthquakes is therefore essential for dam safety. The International Commission on Large Dams (ICOLD) classifies water-level control facilities, including spillway gates, as safety-critical elements and emphasizes that the reservoir-level control function should be maintained during and after the Safety Evaluation Earthquake (SEE) [1].
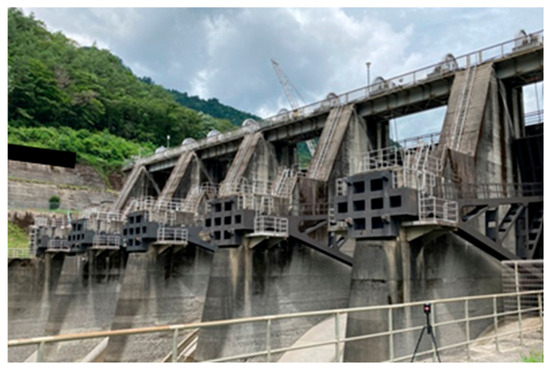
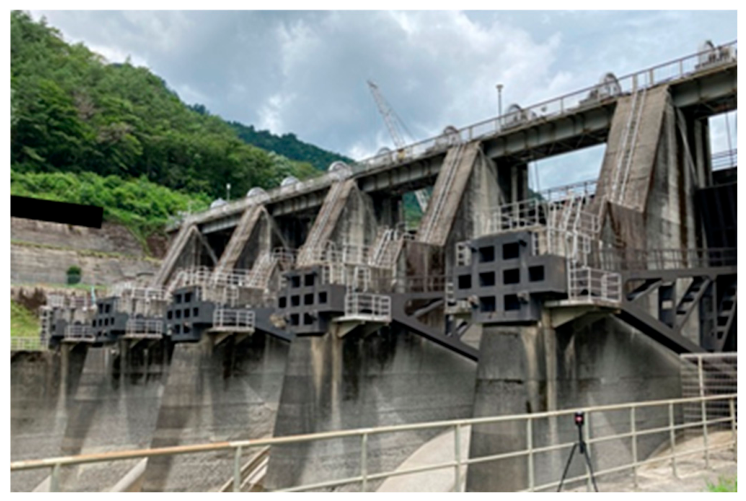
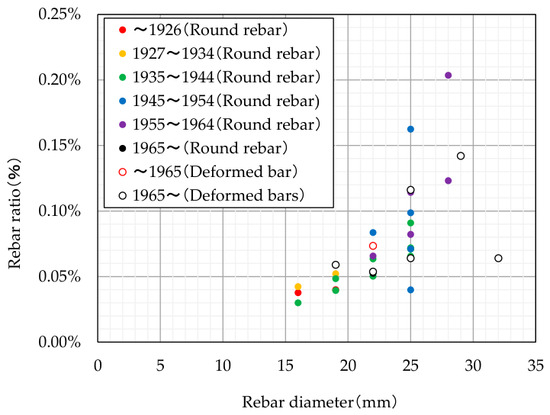
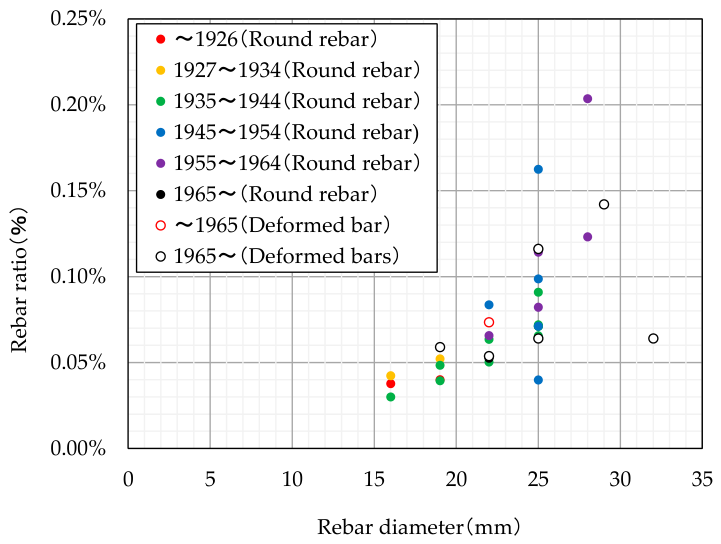
Spillway piers supporting spillway gates are reinforced concrete (RC) structures with relatively thin thicknesses in the dam-axis direction and therefore have structural characteristics that make deformation in this direction likely to predominate during earthquakes (Figure 1). In Japan, there are many dams that were constructed more than 60 years ago, and their spillway piers usually use round rebars as longitudinal reinforcement with relatively low tensile rebar ratios of approximately 0.04–0.20% (Figure 2). In addition, because these spillway piers have an overflow geometry integrated with the dam body, they differ from ordinary RC columns in terms of geometry and boundary conditions. In RC members with low rebar ratios, stiffness degradation after the onset of flexural cracking becomes pronounced, and rebar stress tends to increase rapidly immediately after cracking. Furthermore, unlike deformed bars, round rebars do not possess rib-induced mechanical interlock, and the transfer of bond stress depends primarily on bond strength. As a result, bond–slip tends to become pronounced after cracking. Consequently, in RC members with round rebars and low rebar ratios, bond–slip behavior may develop before reinforcement yielding and strongly influence the deformation response. Therefore, detailed evaluation of the seismic behavior of RC spillway piers with round rebars and low rebar ratios requires nonlinear analysis that explicitly accounts for bond–slip behavior.
Figure 1.
Overall view of the spillway pier.
Figure 2.
The survey results for 32 actual spillway piers in Japan.
In Japan, seismic performance evaluations of existing spillway piers tend to employ beam-element models with nonlinear moment–curvature (M–φ) characteristics to efficiently evaluate the overall structural behavior, including contact with spillway gates. Conversely, some studies have reported the use of 3D finite element dynamic analyses to evaluate the seismic behavior of spillway gates and piers. Limoges and Léger [2] evaluated the loss of functionality associated with increasing earthquake intensity through Incremental Dynamic Analysis (IDA), focusing on post-earthquake gate operability. Song et al. [3] investigated the spillway piers of an arch dam using an integrated model that included the dam body and found that damage concentrated at locations such as the interface between the dam body and the piers. Kanthakasikam et al. [4] evaluated the displacement and damage of the operating bridge located on the top of the spillway pier, as well as the stress and deformation of the spillway gate members. However, these studies did not consider the bond–slip behavior of spillway piers with round rebars and low rebar ratios. Regarding existing RC structures with round rebars other than spillway piers, Fernandes et al. [5] conducted reversed cyclic loading tests and analytical studies on full-scale RC columns. They demonstrated that the experimental behavior could be reproduced by modeling bond–slip using rotational springs. Furthermore, Xue et al. [6] conducted nonlinear finite element analyses of RC beam–column joints and showed that local geometric differences affect the internal load-transfer mechanism of the members. In addition, Han et al. [7] conducted experiments on RC columns with closed FRP ties and showed that the tie ratio affects the deformation capacity and axial–flexural behavior of the members. These studies provide useful insights into the effects of bond–slip modeling, local geometric differences, and transverse reinforcement ratio on the nonlinear behavior of RC members. However, the structures investigated in these studies differ from spillway piers with round rebars and low rebar ratios in terms of geometry, boundary conditions, and reinforcement configurations. Therefore, studies evaluating the seismic behavior of spillway piers with round rebars and low rebar ratios, while accounting for bond–slip behavior, remain limited.
To address this issue, the authors previously conducted reverse-cyclic incremental loading tests on RC specimens to develop an analytical model capable of appropriately evaluating the seismic behavior of spillway piers with round rebars and low rebar ratios. These tests clarified the hysteretic response and failure modes, including the bond–slip behavior of round rebars. Simulations using a 3D finite element analysis also verified the applicability of a bond stress–slip relationship suitable for round rebars and low rebar ratios [8]. In addition, the beam model, widely used as a practical tool for simplified evaluation of contact behavior between spillway piers and spillway gates, was improved through simulations based on recorded earthquake motions [9]. Together, these studies suggested that, in engineering practice, it is rational to employ different analytical models depending on the evaluation objective, namely member-level assessment or overall structural response evaluation.
However, no previous study has systematically evaluated the seismic response of existing spillway piers with round rebars and low rebar ratios using a 3D finite element analysis that incorporates bond stress–slip behavior, or compared the results with beam models. From the standpoint of practical application, the effects of bar diameter and rebar ratio on the bond–slip behavior of round rebars and the resulting damage modes, as well as the rationale for considering bond–slip and the applicable range of the model, have not been sufficiently examined.
In this study, nonlinear IDA is performed on existing spillway piers with round rebars and low rebar ratios using both a beam model based on nonlinear moment–curvature (M-φ) relationships and a 3D finite element analysis that accounts for bond–slip behavior. By comparing the seismic response and performance evaluation results obtained from the two models, the influence of incorporating the bond characteristics of round rebars into the assessment is clarified. In addition, parametric analyses are performed using 3D finite element analysis, with bond condition, bar diameter, and rebar ratio as the principal parameters. Based on their relationship with earthquake intensity, the seismic behavior of spillway piers with round rebars and low rebar ratios is quantified, and a framework for selecting analytical models in engineering practice is discussed.
2. Materials and Methods
In this study, the nonlinear Incremental Dynamic Analysis (IDA) was performed on an actual spillway pier constructed with round rebars and a low rebar ratio to clarify how differences in modeling approach and the inclusion of the bond characteristics of round rebars influence the evaluation results. Two analytical models were employed: a beam model incorporating nonlinear moment–curvature (M-φ) characteristics as a simplified approach, and a nonlinear 3D finite element analysis capable of accounting for bond–slip behavior between rebars and concrete.
In the 3D finite element analysis, bar diameter, rebar ratio, and bond condition between rebars and concrete were selected as the principal parameters, and their effects on the seismic behavior of the spillway pier were quantitatively evaluated. The analysis cases were defined with reference to Figure 2, taking representative ranges of bar diameter and rebar ratio into account.
2.1. Target Spillway Pier and Modeling Assumptions
The spillway pier analyzed in this study is an actual structure constructed in Japan in 1930. Round rebars 16 mm in diameter were used as longitudinal reinforcement, with a rebar ratio of 0.04%. This value corresponds to the minimum rebar ratio observed among the 32 actual spillway piers surveyed in Japan, as shown in Figure 2.
The analysis cases are summarized in Table 1. As shown in Figure 2, among the 32 surveyed spillway piers, the piers reinforced with round rebars had rebar ratios ranging from 0.04% to 0.20% and rebar diameters ranging from 16 to 28 mm. In this study, the analysis cases were defined to examine the effects of bond condition, rebar ratio, and bar diameter while maintaining the structural geometry of the target spillway pier. In addition to the 0.04% rebar ratio used in the target spillway pier, rebar ratios of 0.14% and 0.20% were selected to cover the lower, intermediate, and upper levels among the 32 surveyed cases. In addition to the 16 mm bar diameter used for the target spillway pier, a 28 mm bar diameter, the maximum among the 32 surveyed cases, was selected. In the 3D finite element analyses, Cases 1 and 2 correspond to the target spillway pier and differ only in the bond condition between the rebars and concrete. Cases 3 and 4 were defined by taking Case 2 as the reference case, keeping the bar diameter unchanged, and changing the rebar ratio to 0.14% and 0.20%, respectively. Cases 5, 7, and 8 were defined by changing the bar diameter of Cases 2–4 to 28 mm, respectively, while maintaining the same rebar ratios and bond–slip condition. Case 6 was defined as the full-adhesion counterpart of Case 7 at a rebar ratio of 0.14%. Accordingly, the effect of bond condition was evaluated separately by comparing Cases 1 and 2 at a rebar ratio of 0.04% for φ16 and Cases 6 and 7 at a rebar ratio of 0.14% for φ28. In addition, the geometry of the spillway pier was kept identical to that in Cases 1 and 2 so that the influence of structural geometry was excluded from the parametric comparisons. At the anchorage zone of the longitudinal rebars, cases assuming full adhesion between rebars and concrete were modeled as fixed, whereas cases considering bond–slip were modeled as free. It is noted that the analysis cases in this study do not fully cover all parameter combinations for bar diameter, rebar ratio, and bond condition. Therefore, the effects of bar diameter and rebar ratio are discussed primarily based on cases that consider bond–slip. In contrast, the effect of bond condition is discussed within the specific comparison pairs described above.
Table 1.
Analysis cases.
2.2. Modeling of Spillway Piers Using the Beam Model
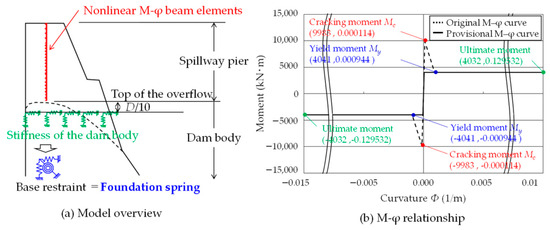
The three-dimensional nonlinear finite element analysis program (TDAP III ver 3.2.7) was used for the beam model analysis. As shown in Figure 3, the portion of the spillway pier above the crest of the overflow section was modeled using beam elements with nonlinear M-φ characteristics. The number of nodes was set to 24 to account for variation in the cross-sectional geometry of the spillway pier. In the beam model, the portion above the crest of the overflow section was modeled as the spillway pier. Therefore, the restraint conditions at the base of the modeled region should account for the restraint provided by the dam body and the influence of the overflow geometry. Accordingly, the foundation-spring modeling method previously examined by the authors was adopted as a practical modeling approach [9]. For the M-φ relationship shown in Figure 3, a provisional M-φ curve that does not account for the cracking moment, Mc, was employed [10]. This choice was made because the model experiments conducted by the authors [8] confirmed that, in RC structures with a low rebar ratio, the yield moment, My, can be smaller than the cracking moment, Mc, and force equilibrium may become numerically difficult to achieve when the flexural capacity decreases abruptly after cracking. In addition, the Takeda model [11], widely used in nonlinear analyses of RC structures, was adopted for the hysteretic restoring force characteristics.
Figure 3.
Beam model diagram used in the analysis.
2.3. Modeling of Spillway Piers Using a 3D Finite Element Analysis
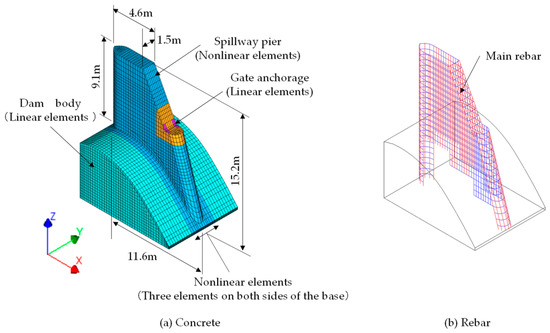
DIANA ver. 10.5 was used for the 3D finite element analysis. The analytical model is shown in Figure 4. Concrete was modeled using first-order solid elements with an element size of 200 mm, which was selected with reference to the authors’ previous studies [8,9] on RC specimens with round rebars and low rebar ratios. In contrast, the rebars were modeled as embedded BAR elements. In the previous studies, the 3D finite element model reproduced the dominant crack location and the localization of rebar strain. Therefore, no additional mesh sensitivity analysis was performed in the present study. Instead, the same mesh discretization was used for all analytical cases, allowing the effects of bond condition, bar diameter, and rebar ratio to be compared under identical analytical conditions. In addition, the dependence of the local compressive damage indicator on mesh size was reduced by applying the weighted averaging procedure described in Section 3.2.5. To account for the influence of the dam body, the modeling range was extended to the anchorage location of the longitudinal rebars, and the overflow geometry was explicitly represented. Based on the previous loading tests and validation analyses [8], which showed that tensile damage and rebar strain were concentrated at the base, the three elements adjacent to the base of the spillway pier on both sides were treated as nonlinear elements. At the same time, the remaining region was modeled as linear. For the boundary conditions, the bottom nodes were restrained in all translational degrees of freedom, and the nodes on the dam body’s side surface were restrained in the Y-direction (dam-axis direction) to represent continuity with the massive dam body and the foundation below the modeled region. Unlike the beam model, foundation springs were not introduced in the 3D finite element model because the stiffness of part of the dam body was already included in the modeled domain.
Figure 4.
Solid model diagram used in the analysis.
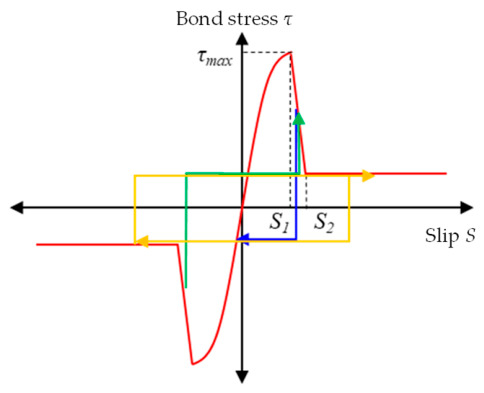
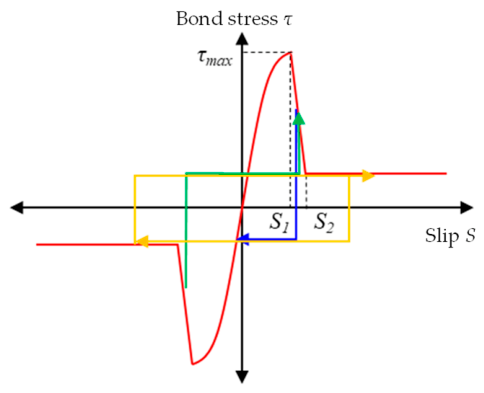
For the bond–slip behavior between rebars and concrete, the bond stress–slip relationship shown in Figure 5 was adopted. This model was formulated by Matsuoka et al. [12] (Equation (1)). In the previous validation study, the 3D finite element model incorporating this relationship reproduced the experimentally observed load–displacement response, the concentration of cracking near the member base, and the localization of rebar strain in RC specimens with round rebars and low rebar ratios up to a drift angle of approximately 1/50, thereby confirming its applicability [8].
where τ is the bond stress (N/mm2), s is the slip (mm), D is the rebar diameter (mm), S1 is 0.02 mm, S2 is 1.5 mm, and σck is the compressive strength of concrete (N/mm2).
Figure 5.
Bond–slip behavior between rebar and concrete.
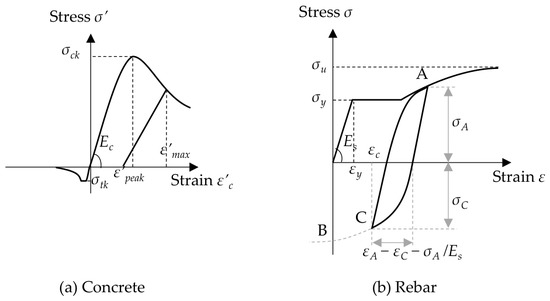
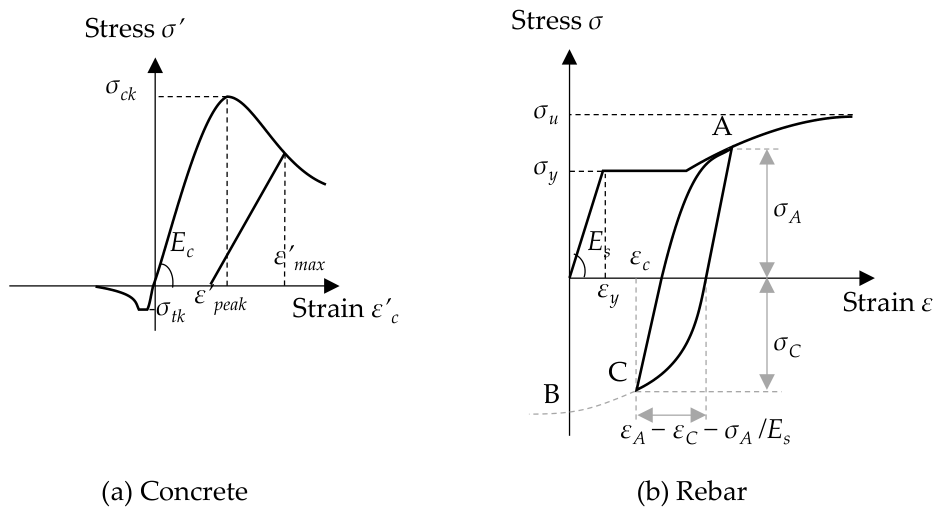
The stress–strain relationships for concrete and rebars are shown in Figure 6. For concrete, the Maekawa–Fukuura smeared-crack model was adopted as the nonlinear material model [13]. The compressive behavior was represented using the elastoplastic fracture model proposed by Maekawa et al. [14]. In contrast, the tensile behavior and post-cracking characteristics were defined in accordance with the Standard Specifications for Concrete Structures of the Japanese Society of Civil Engineers (JSCE) [15]. For shear transfer across crack surfaces, a model that accounts for stiffness degradation associated with crack opening was employed. For the rebars, the proposed equation for the backbone curve, derived from tensile tests and given in the Standard Specifications for Concrete Structures [15], was adopted as the nonlinear material model.
Figure 6.
Stress–strain relationships.
The material properties of the concrete and rebars are listed in Table 2 and Table 3, respectively. For the concrete, the compressive strength σck, tensile strength σtk, Young’s modulus E, and unit mass density γ were taken from test results obtained from specimens sampled from the actual spillway pier. The tensile fracture energy, Gf, was calculated using the equation proposed by Horii et al., which applies to large-sized coarse aggregate [16] (Equation (2)).
where Gf is the tensile fracture energy (N/mm), dmax is the maximum aggregate size, taken as 63.5 mm, and σck is the compressive strength of concrete (N/mm2).
Gf = (0.79 dmax + 80) × (σck/10)0.7
Table 2.
Material properties of concrete.
Table 3.
Material properties of rebars.
For the rebars, the material properties were based on the specified values for reinforced concrete rebars (JIS G3112). The strain at the onset of strain hardening was set to twice the value specified for deformed bars in the Standard Specifications for Concrete Structures [15], based on the trends observed in the material test results obtained by the authors [9] for SR235 round rebars R13 and SR345 deformed bar D13.
2.4. Dynamic Analysis Conditions and Damping Ratio
In the analyses, the self-weight of the spillway pier and the static loads due to hydrostatic pressure acting on the spillway pier and spillway gate were first applied. The resulting stress state was then carried over, and the ground motion was input at the base of the model.
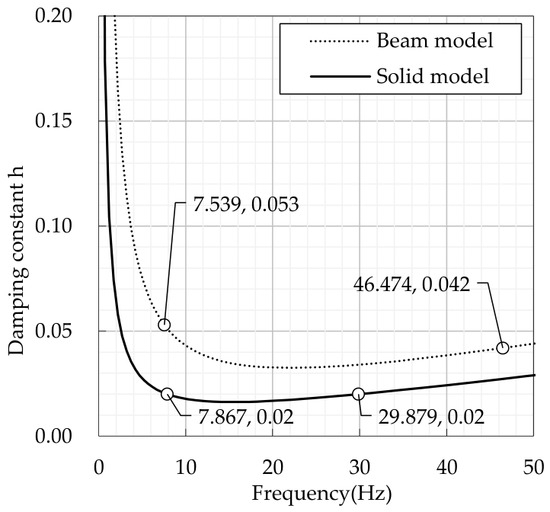
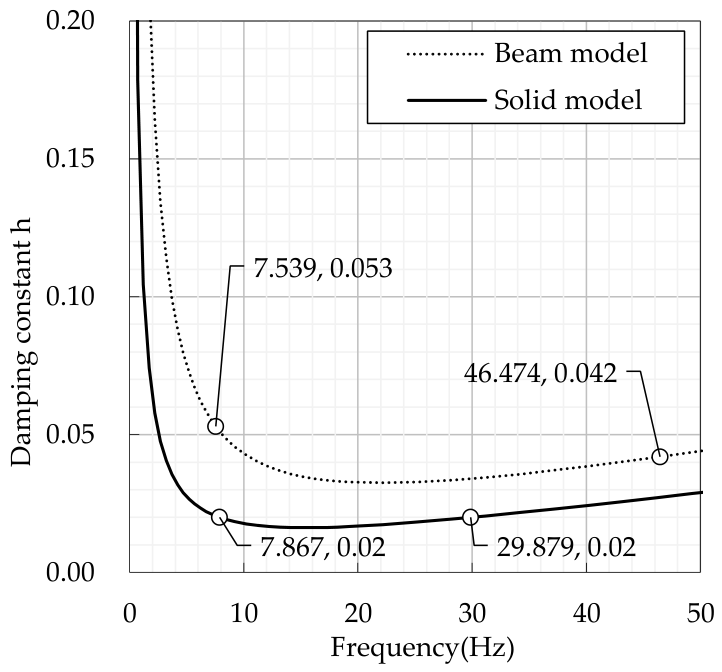
Because earthquake records show that spillway piers tend to vibrate predominantly in the dam-axis direction during earthquakes [9,17], only ground motion in the dam-axis direction was considered in this study. Hydrodynamic pressure during earthquakes was represented as an added mass due to water in contact with the spillway pier’s side surface in the dam-axis direction. The time increment used in the analyses was 0.005 s, and the Newmark-β method (β = 1/4) was adopted for numerical integration. Damping was modeled using Rayleigh damping, as shown in Figure 7, and the coefficients of the mass- and stiffness-proportional terms were determined from the natural frequencies obtained from the eigenvalue analysis. For the 3D finite element analysis, eigenvalue analysis was carried out by assigning a damping ratio of 2% to RC structures in the nonlinear analysis, in accordance with the Specifications for Highway Bridges, and Rayleigh damping was then defined based on the resulting natural frequencies and modal damping ratios. The modal damping ratios of the first mode (7.867 Hz) and the fifth mode (29.879 Hz) were both set to 2%. For the beam model, eigenvalue analysis was conducted by assigning a damping ratio of 2% to the M-φ beam elements, following the Specifications for Highway Bridges, and a damping ratio of 10% to the foundation springs, corresponding to the lower-bound value for foundation damping. The proportional coefficients were then determined to match the modal damping ratios of the dominant modes to those obtained from the eigenvalue analysis. This setting was adopted to account for foundation damping in the base restraint conditions represented by the foundation springs in the beam model. As a result, the modal damping ratios of the first mode (7.539 Hz) and the third mode (46.474 Hz) of the beam model were 5.3% and 4.2%, respectively.
Figure 7.
Rayleigh damping used in the analysis.
Accordingly, analyses were conducted using damping settings commonly adopted in practical applications for each model. The effective damping ratios of the dominant modes, therefore, differ between the beam model and the 3D finite element analysis. It is noted that this difference may affect the response amplitudes.
2.5. Ground Motions Used in the IDA
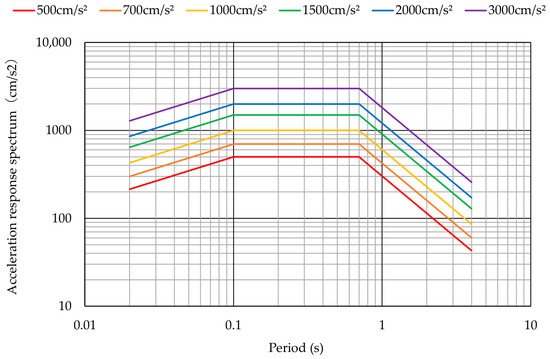
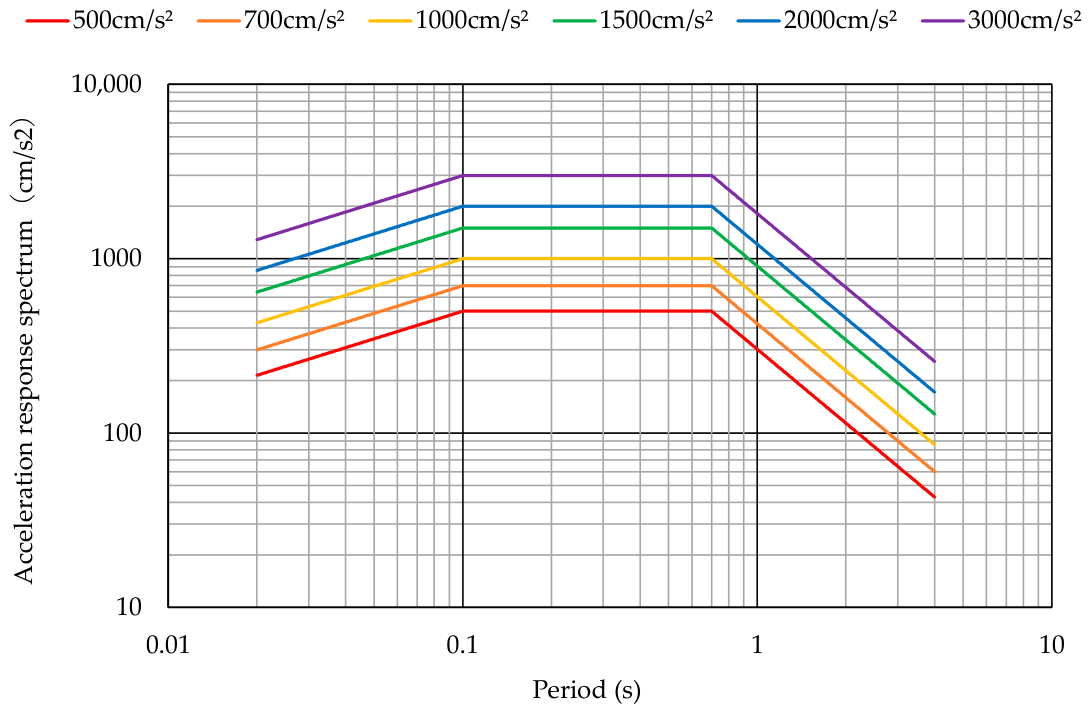
The acceleration time histories used as input ground motions for the IDA were generated with reference to the Guidelines for Seismic Performance Evaluation of Dams against Large Earthquakes [18]. These guidelines present the concept of seismic performance evaluation for dams in Japan subjected to large earthquakes and recommend that dams be evaluated via dynamic analysis using the maximum level of ground motion expected at the dam site in the future. In addition, the guidelines provide a lower-limit acceleration response spectrum that should be considered even when no active fault exists in the vicinity of the dam site. The lower-limit acceleration response spectrum is defined as a target spectrum with a spectral acceleration of 700 cm/s2 over the period range from 0.1 s to 0.6 s. In this study, the entire lower-limit acceleration response spectrum was uniformly scaled by constant factors to define six target spectra with maximum spectral accelerations of 500, 700, 1000, 1500, 2000, and 3000 cm/s2, respectively. For the phase characteristics, the observed record obtained at Hitokura Dam during the 1995 Kobe Earthquake in Japan was used. The 1995 Kobe Earthquake significantly influenced seismic design concepts in Japan, and the observed record at Hitokura Dam is regarded as a representative strong-motion record obtained under conditions close to the dam foundation rock. Accordingly, the phase characteristics of this record were adopted, and input ground motions were generated to be compatible with the six target spectra. Figure 8 shows the acceleration response spectra of the six generated input ground motions.
Figure 8.
Acceleration response spectrum of the six generated input ground motions.
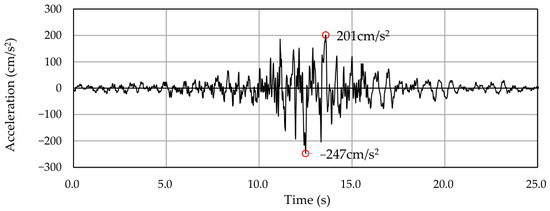
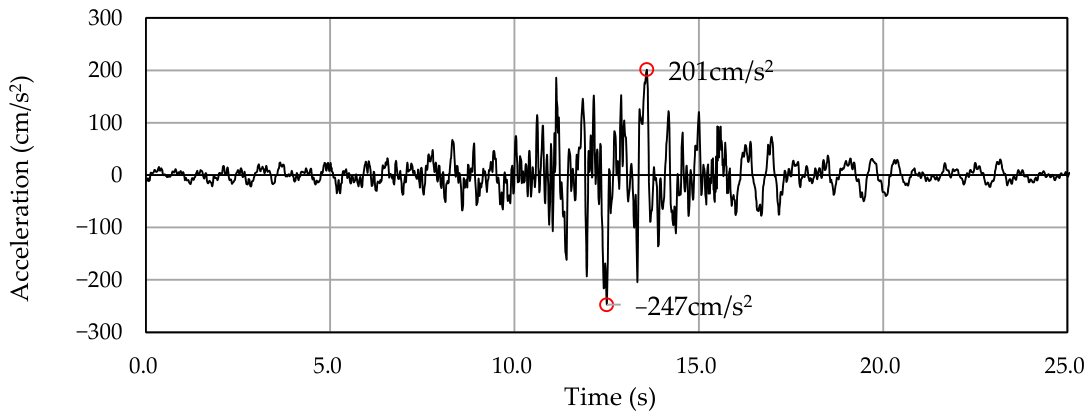
The corresponding peak ground accelerations at the base of the spillway pier were 247, 346, 494, 742, 989, and 1483 cm/s2, respectively; hereafter, the input motions are referred to by these peak ground acceleration values. For the 3D finite element analysis, since preliminary analyses confirmed that the response remained nearly linear at 346 cm/s2, only cases at 346 cm/s2 and above were analyzed. Among the generated ground motions, the motion with a peak ground acceleration of 247 cm/s2 is shown in Figure 9 as an example.
Figure 9.
Acceleration time history of the input ground motion (corresponding peak ground acceleration: 247 cm/s2).
3. Results of IDA
3.1. Comparison Between the Beam Model and the 3D Finite Element Analysis
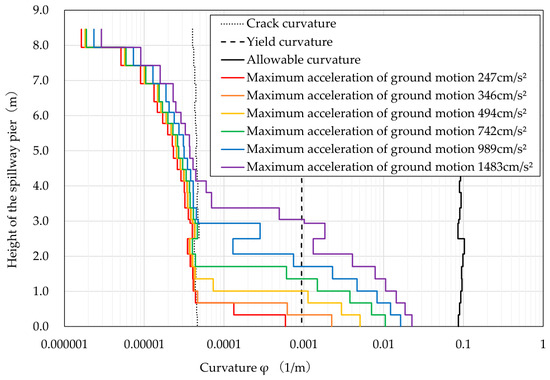
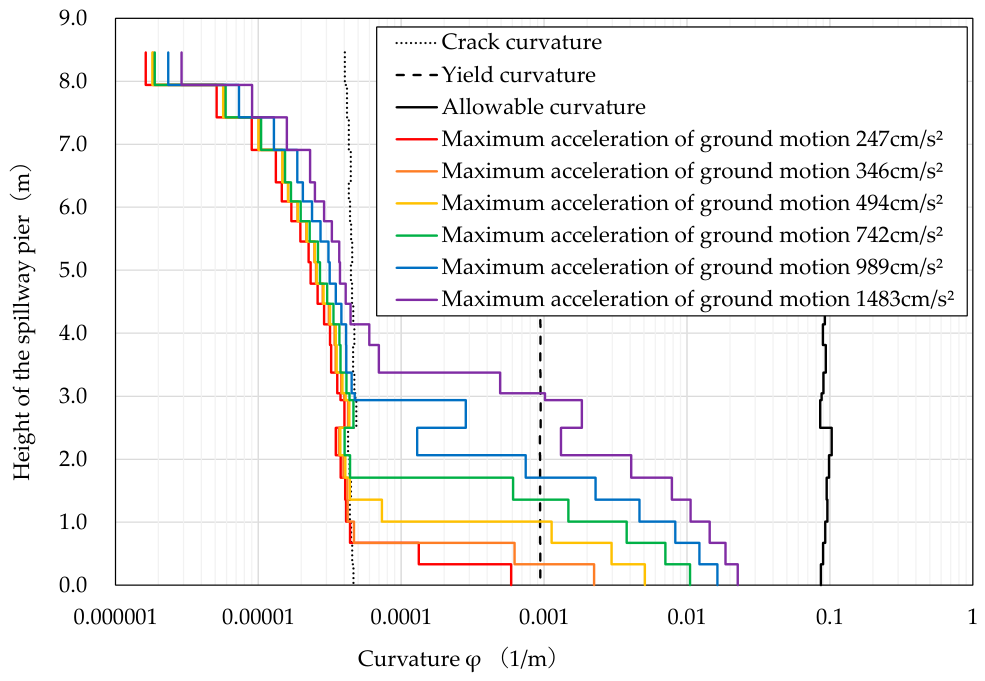
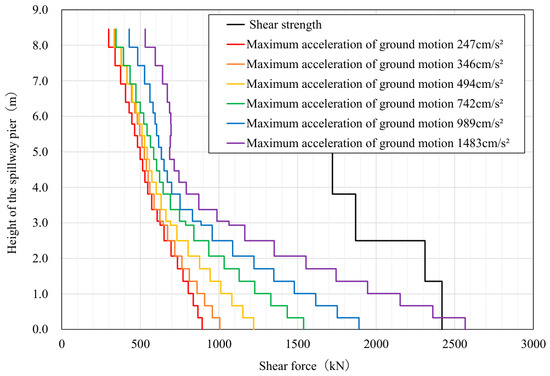
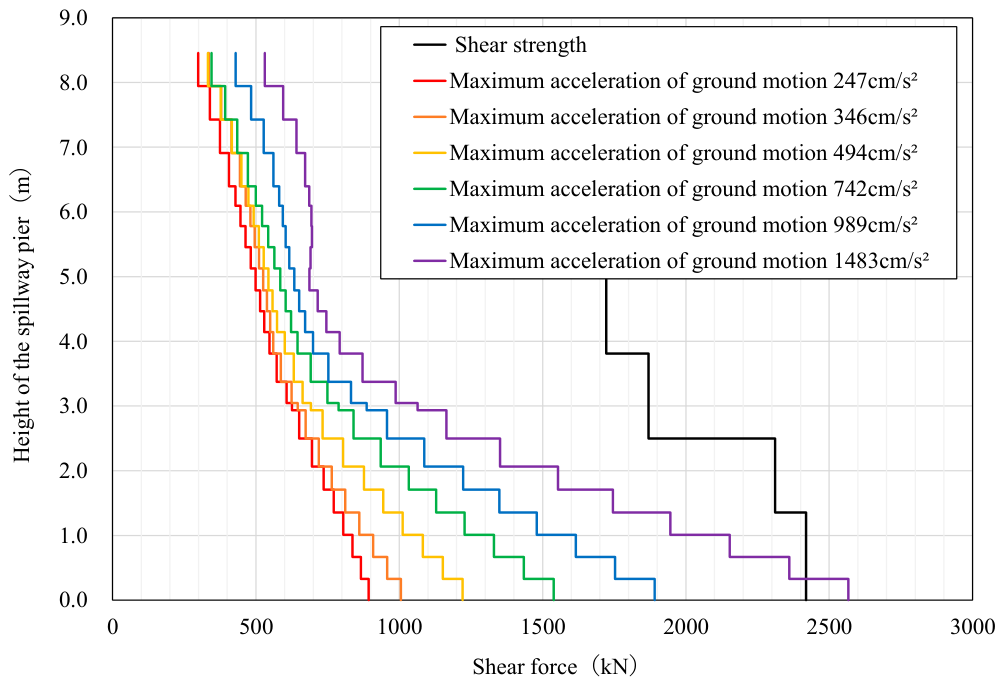
Figure 10 shows the curvature distribution along the height of the spillway pier obtained from the beam model, with the curvature plotted on a logarithmic scale. In contrast, Figure 11 shows the corresponding distribution of response shear force along the height of the spillway pier. The response curvature and response shear force are defined as the maximum values of the time–history response of each element. The allowable curvature and shear capacity used to verify gate piers and weir piers under SEE are calculated based on the Specifications for Highway Bridges [8]. These values were calculated using Equation (3) and Equations (4)–(6), respectively.
where φa is the allowable curvature (1/m), φy is the yield curvature (1/m), φu is the ultimate curvature (1/m), and a is the safety factor (1.5 for near-field inland earthquakes).
where Ps is the shear capacity (N), Sc is the shear capacity carried by concrete (N), Ss is the shear capacity carried by transverse reinforcement (N), Cc is the correction factor accounting for the effects of cyclic loading under load reversal (0.8 for near-field inland earthquakes), Ce is the correction factor related to the effective depth of the cross section (0.7 for the target spillway pier), Cpt is the correction factor related to the longitudinal tensile rebar ratio (0.9 for the target spillway pier), τc is the average shear stress carried by concrete (0.41 N/mm2 for the target spillway pier), b is the width of the pier cross section perpendicular to the direction used for calculating shear capacity (mm), d is the effective depth of the pier cross section parallel to the direction used for calculating shear capacity (mm), Aw is the cross-sectional area of transverse reinforcement arranged at spacing a and angle (mm2), σsy is the yield strength of transverse reinforcement (N/mm2), a is the spacing of transverse reinforcement (mm), and θ is the angle between the transverse reinforcement and the vertical axis (°).
Figure 10.
The curvature distribution along the height of the spillway pier.
Figure 11.
The shear force distribution along the height of the spillway pier.
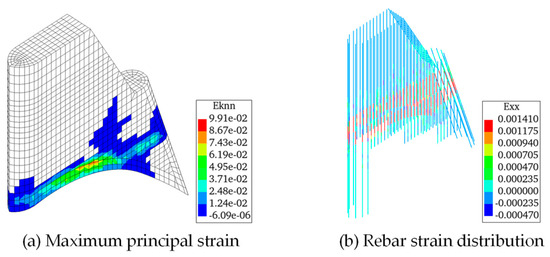
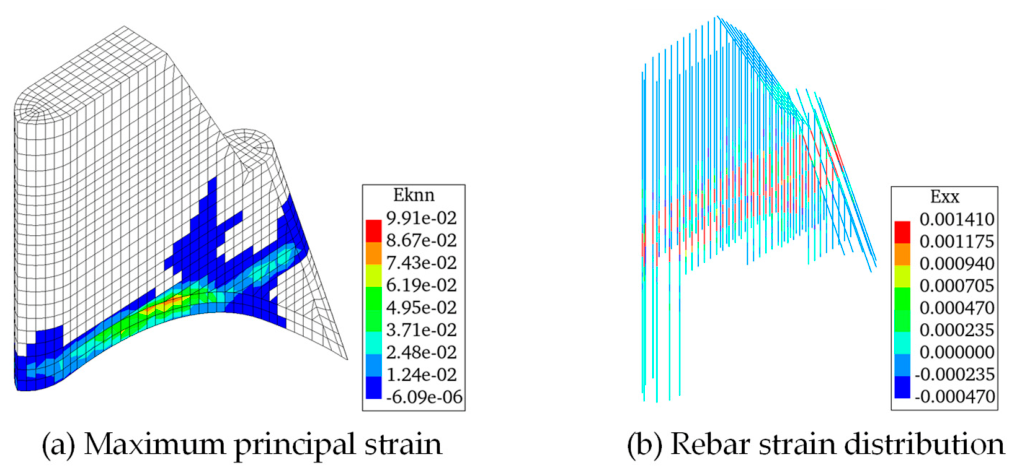
Figure 12 shows the maximum principal strain distribution and rebar strain distribution obtained from the 3D finite element analysis under the input ground motion with a peak ground acceleration of 1483 cm/s2. The results are presented at t = 25.000 s, when the crack strain reached its maximum, and at t = 13.785 s, when the rebar strain reached its maximum.
Figure 12.
3D finite element analysis response at a peak ground acceleration of 1483 cm/s2.
As shown in Figure 10, the response curvature at the base of the spillway pier in the beam model exceeded the cracking curvature under the input ground motion with a peak ground acceleration of 247 cm/s2, and it also exceeded the yield curvature at 346 cm/s2. However, even under the input ground motion with a peak ground acceleration of 1483 cm/s2, the response curvature remained below the allowable curvature, indicating that flexural failure did not occur. Figure 11 shows that, under the input ground motion with a peak ground acceleration of 1483 cm/s2, the response shear force at the base of the spillway pier was approximately 2567 kN. In contrast, the shear capacity calculated using Equations (4)–(6) was 2419 kN. Thus, the response shear force exceeded the shear capacity by approximately 148 kN, corresponding to about 6%, leading to a post-processing classification as shear failure based on the beam model response.
In general, RC structures with low rebar ratios are expected to exhibit flexure-dominant behavior because their flexural capacity is relatively smaller than their shear capacity. However, the beam model used in this study indicated shear-dominant failure, which is inconsistent with the general mechanical tendency. It is noted that this result was obtained from a post-processing comparison of the response demand and the calculated capacity and does not reflect the numerical simulation of shear failure progression in the analysis. By contrast, Figure 12 shows that, in the 3D finite element analysis, horizontal cracks and rebar strain were predominant at the base of the spillway pier. In contrast, no diagonal cracks attributable to shear were observed. In addition, under the input ground motion with a peak ground acceleration of 1483 cm/s2, the yielded region extended approximately 3.0 m above the base in the beam model. In contrast, the 3D finite element analysis was limited to approximately 1.0 m above the base, indicating a clear difference between the two models. Therefore, the damage-mode classification obtained from the beam model may not be consistent with the damage characteristics indicated by the 3D finite element analysis. The possible causes of these differences are discussed in Section 4.
3.2. Seismic Response of the Spillway Pier Obtained from the 3D Finite Element Analysis
3.2.1. Maximum Displacement
The maximum displacement of the spillway pier is an important indicator in seismic performance evaluation because it affects potential contact with the spillway gate and the safety of the operating bridge at the top of the pier. In this study, maximum displacement is defined as the maximum response displacement at the top of the spillway pier. Based on the survey of 32 actual spillway piers in Japan, the one-sided clearance between the spillway pier and the gate ranged from 3 to 15 mm, with an average of approximately 7.4 mm. In addition, the bearing seat length of the operating bridge ranged from 350 to 1000 mm, with an average of approximately 650 mm. Therefore, in this study, 7.4 mm and 650 mm were used as representative reference values for discussing maximum displacement. It should be noted that these values are averages from the 32 surveyed cases and are not universal acceptance criteria.
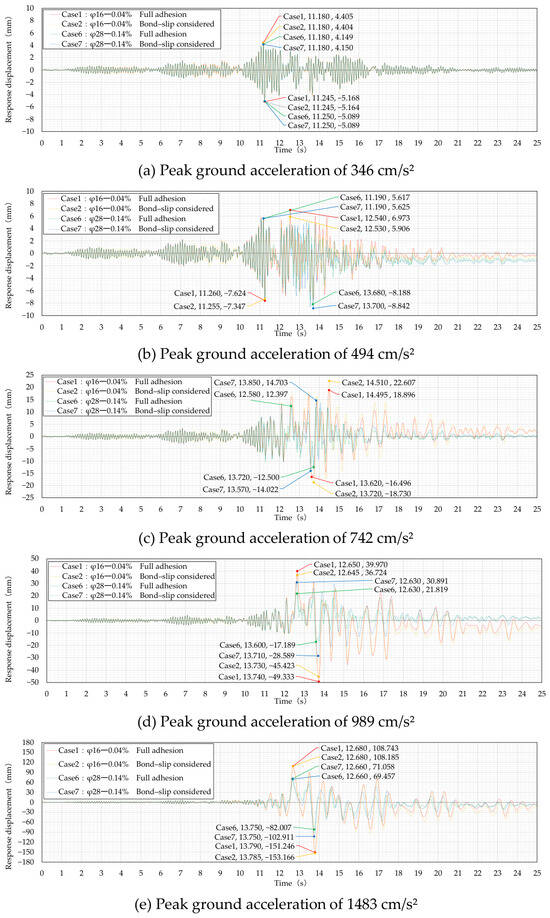
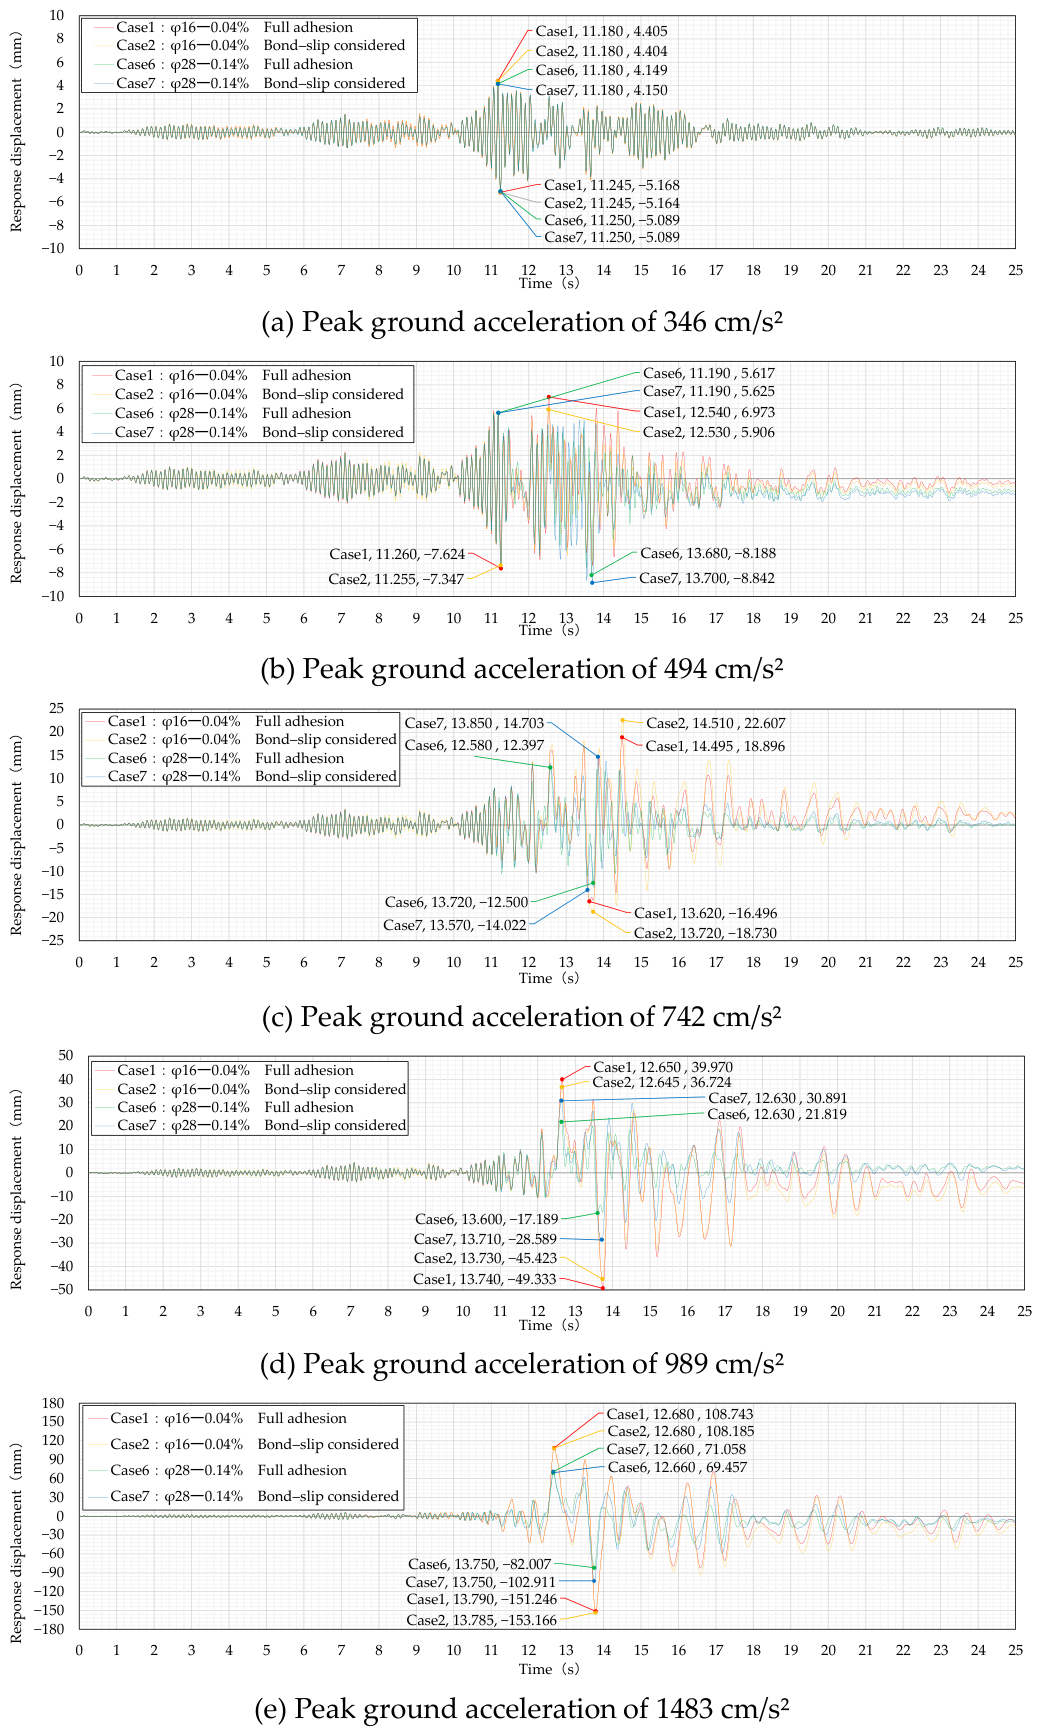
Figure 13 shows the time histories of the response displacement at the top of the spillway pier for Cases 1 and 6, in which full adhesion was assumed for the rebars, and for Cases 2 and 7, in which bond–slip was considered. Because Cases 1 and 2, and Cases 6 and 7, have the same amount of reinforcement within each pair, the effect of bond condition can be directly compared for each pair. When the peak ground acceleration was 346 cm/s2, no significant differences were observed among the cases in either maximum displacement or the time at which maximum displacement was reached. However, when the peak ground acceleration reached 494 cm/s2 or higher, differences in maximum displacement became apparent depending on the bond condition.
Figure 13.
Time histories of the response displacement.
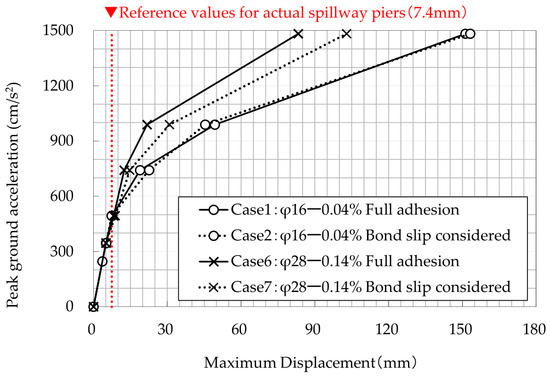
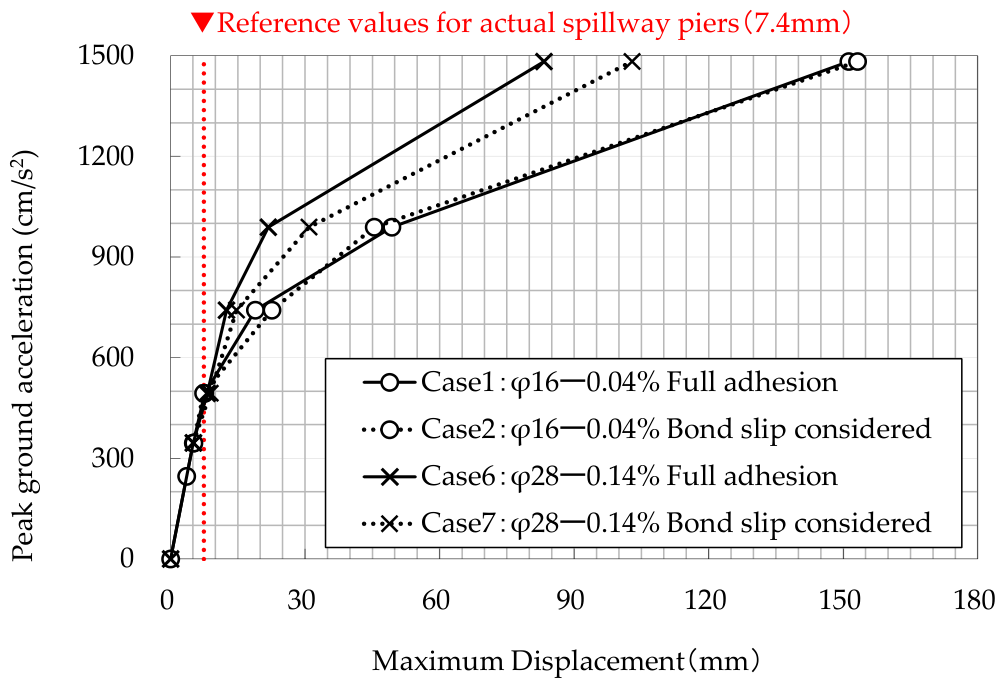
Figure 14 shows the relationship between peak ground acceleration and maximum displacement. Because Cases 1 and 2 and Cases 6 and 7 have the same amount of reinforcement within each pair, the effect of bond condition can be directly compared for each pair. In all cases, the response remained approximately linear up to a peak ground acceleration of about 494 cm/s2, whereas above 742 cm/s2 the maximum displacement increased rapidly, indicating pronounced nonlinear behavior. At a peak ground acceleration of 1483 cm/s2, the difference attributable to bond condition was small for Cases 1 and 2 with a bar diameter of 16 mm, amounting to approximately 2 mm. By contrast, for Cases 6 and 7 with a bar diameter of 28 mm, the effect of bond condition was substantial, and the difference in maximum displacement reached approximately 36 mm. The maximum ratio of displacement in the bond–slip case to that in the full adhesion case was 1.20 at a peak ground acceleration of 742 cm/s2 for Cases 1 and 2, and 1.42 at a peak ground acceleration of 989 cm/s2 for Cases 6 and 7.
Figure 14.
Effect of bond condition on the relationship between the peak ground acceleration and the maximum displacement.
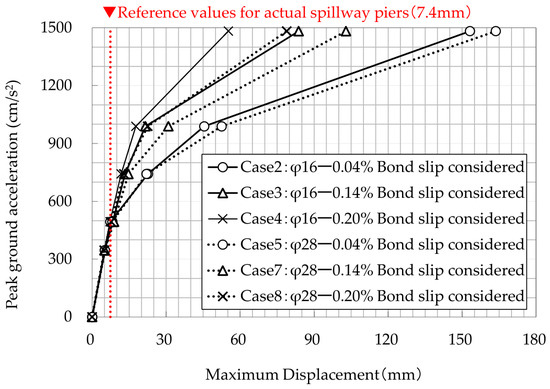
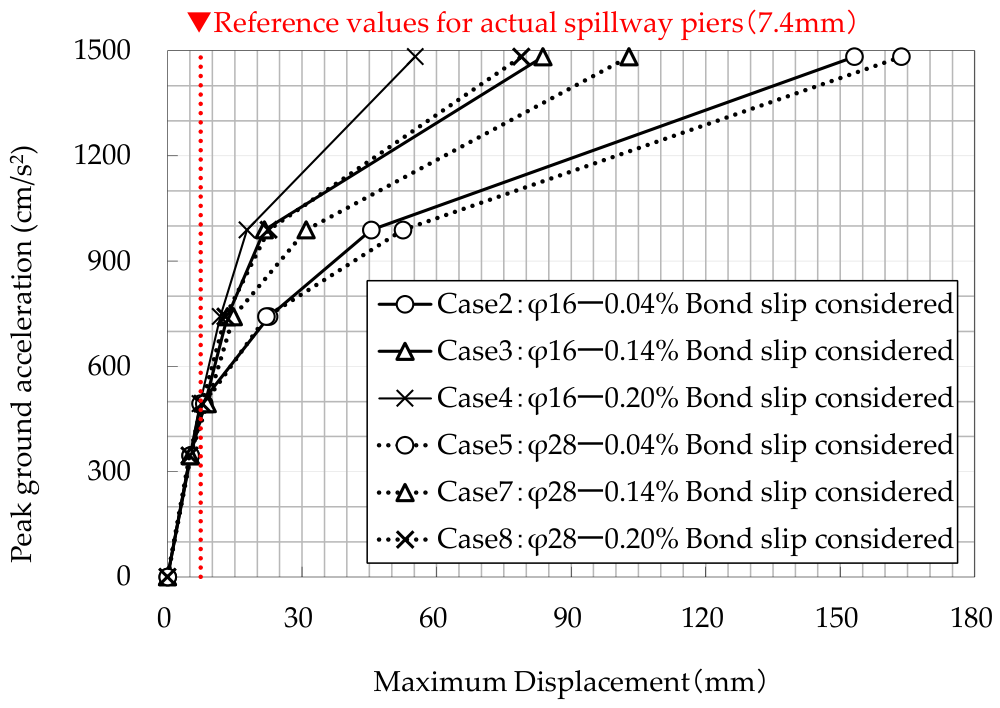
Figure 15 shows the relationship between peak ground acceleration and maximum displacement for all cases in which bond–slip was considered. At the same rebar ratio, the maximum displacement increased with bar diameter. The maximum displacement was 1.16, 1.43, and 1.43 times larger for a bar diameter of 28 mm than for 16 mm at rebar ratios of 0.04%, 0.14%, and 0.20%, respectively. The strain difference Δεck at the upper end of a rebar segment of unit length l, when the bond stress τ reaches the bond strength τck, can be expressed using Equation (7).
where Δεck is the difference in reinforcement strain over a rebar segment of unit length l when the bond stress τ reaches the bond strength τck, τck is the bond strength (N/mm2), l is the unit length of rebar (mm), E is the elastic modulus of the rebar (N/mm2), and φ is the rebar diameter (mm).
Figure 15.
Effect of bar diameter and rebar ratio on the relationship between the peak ground acceleration and the maximum displacement.
This suggests that as the bar diameter increases, the strain difference Δεck decreases, so slip between rebars and concrete may initiate at a lower strain level. Under the same bar-diameter condition, maximum displacement increased as the rebar ratio decreased. This trend is attributed to the lower flexural capacity and stiffness at lower rebar ratios, which make the response more susceptible to concrete nonlinearity at an earlier stage.
Finally, comparison with representative reference values for actual spillway piers—namely, a gate clearance of 7.4 mm and an operating-bridge bearing seat length of 650 mm—indicates that, under the conditions considered in this study, maximum displacement generally remained within the gate clearance up to a peak ground acceleration of approximately 494 cm/s2. Although maximum displacement increased under larger input motions, it did not reach the bearing seat length even at a peak ground acceleration of 1483 cm/s2. It should also be noted that the maximum drift angle obtained in this study was approximately 1/50, which lies within the applicability range of the bond stress–slip relationship adopted in the analytical model.
3.2.2. Residual Displacement
Residual displacement of the spillway pier is an indicator of the post-earthquake operability of the spillway gate and of the serviceability of the spillway pier. In this study, residual displacement is defined as the absolute value of the relative displacement, at the end of the input ground motion (t = 25.0 s), between the base of the spillway pier at the elevation of the crest of the overflow section and the top of the spillway pier.
According to the survey results for 32 actual spillway piers in Japan, the average one-sided clearance between the spillway pier and the gate was approximately 7.4 mm from the viewpoint of spillway-gate operability. In addition, from the viewpoint of spillway-pier serviceability, and with reference to the Guidelines and Commentary for Seismic Performance Verification of River Structures [19] and the Manual for Seismic Performance Verification of Hydropower Facilities [20], one-hundredth of the spillway-pier height was calculated for the 32 cases. The resulting values ranged from approximately 88 to 340 mm, with an average of approximately 135 mm. In this study, 135 mm was adopted as a representative reference value for discussing residual displacement. It should be noted that this value is an average value obtained from the 32 surveyed cases and is not a universal acceptance criterion.
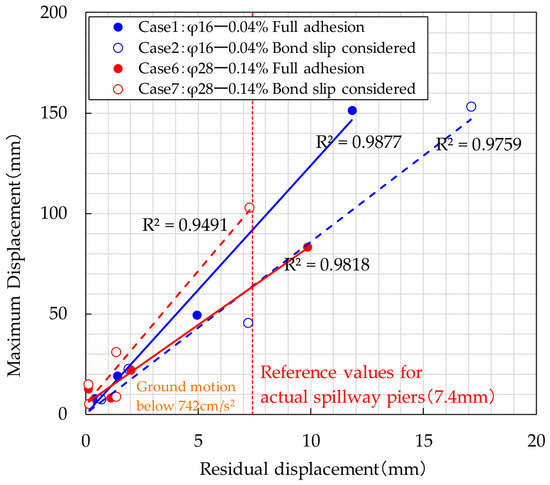
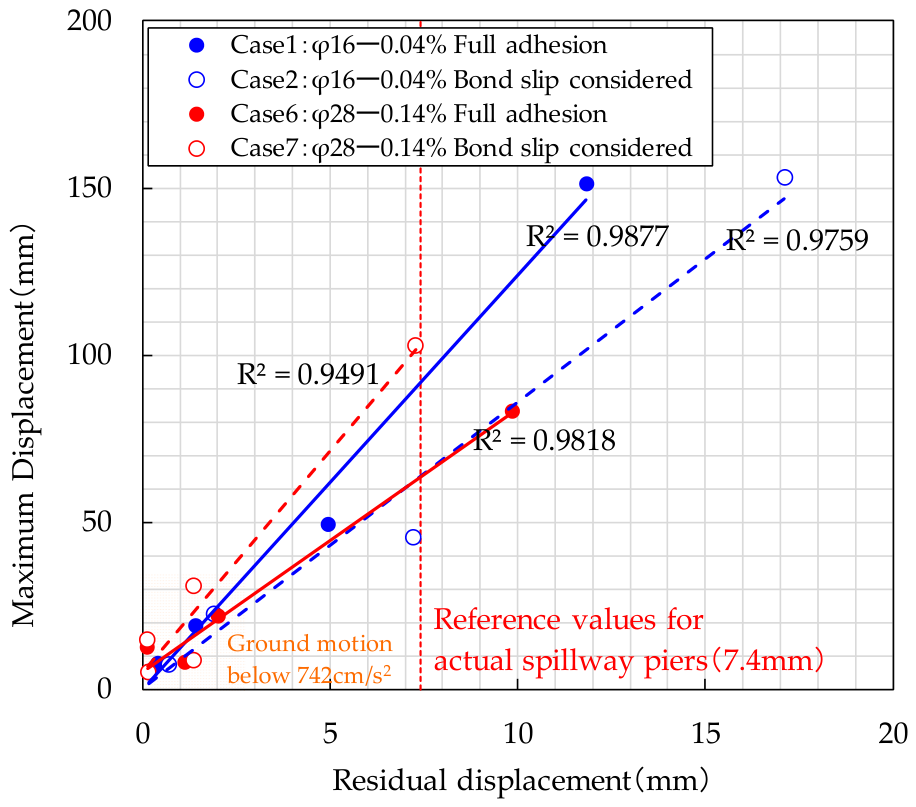
Figure 16 shows the relationship between maximum displacement and residual displacement at the top of the spillway pier for Cases 1 and 6, in which full adhesion was assumed, and for Cases 2 and 7, in which bond–slip was considered. Because Cases 1 and 2, and Cases 6 and 7, have the same amount of reinforcement within each pair, the effect of bond condition can be directly compared for each pair. Comparison of Cases 1 and 2 indicates that, for the same maximum displacement, residual displacement was larger in Case 2, where bond–slip was considered. In contrast, comparison of Cases 6 and 7 shows that, for the same maximum displacement, residual displacement was smaller in Case 7, where bond–slip was considered.
Figure 16.
Relationship between maximum displacement and residual displacement (comparison between full adhesion and bond–slip).
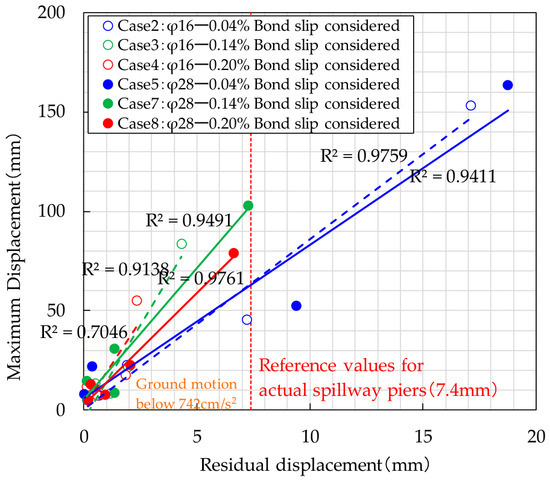
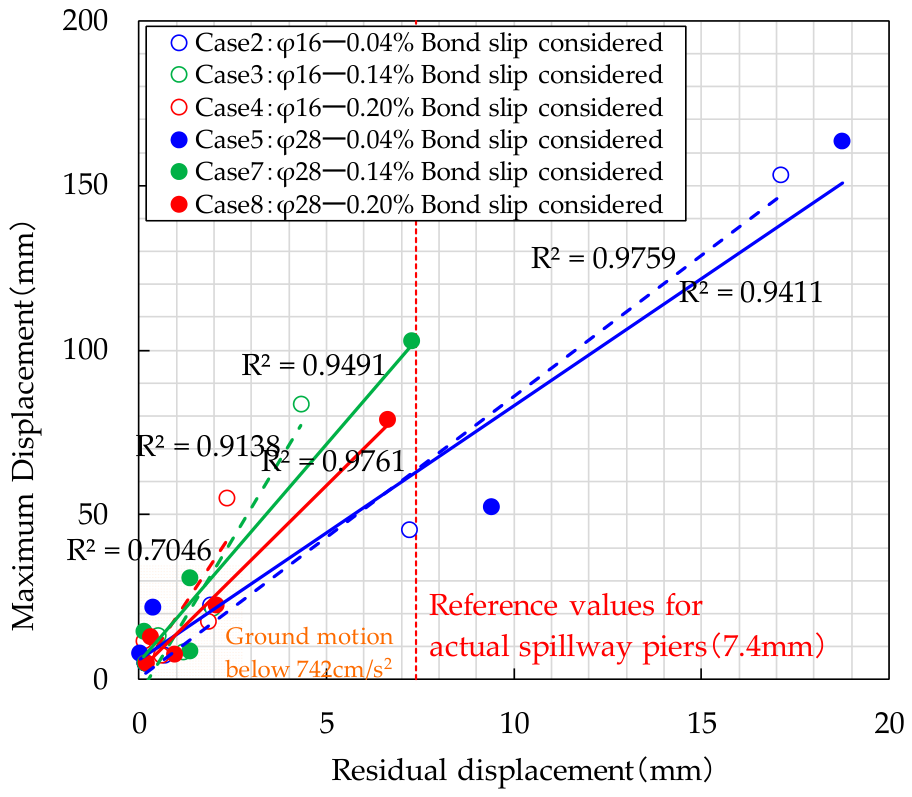
Figure 17 shows the relationship between maximum displacement and residual displacement for all cases in which bond–slip was considered. At the same rebar ratio, residual displacement tended to increase with increasing bar diameter. Under the same bar-diameter condition, residual displacement tended to increase as the rebar ratio decreased.
Figure 17.
Relationship between maximum displacement and residual displacement (comparison among cases considering bond–slip).
These results indicate that residual displacement is correlated with maximum displacement and that, when bond–slip is accounted for, residual displacement tends to increase due to the apparent reduction in stiffness. On the other hand, under some conditions, such as Cases 6 and 7, the response after bond degradation between rebars and concrete exhibited larger displacement amplitudes under cyclic loading while maintaining relatively high self-centering capability, resulting in smaller residual displacement.
Finally, comparison with the representative reference values derived from the 32 actual spillway piers indicates that, under the conditions considered in this study, residual displacement generally remained within 7.4 mm up to a peak ground acceleration of approximately 742 cm/s2. Although residual displacement increased under larger input motions, it did not reach one-hundredth of spillway pier height (135 mm) even at a peak ground acceleration of 1483 cm/s2.
3.2.3. Reinforcement Strain
In evaluating damage to the spillway pier, it is important to identify both the strain distribution and the maximum strain of the longitudinal rebars associated with flexural deformation. In the reversed cyclic incremental loading tests conducted by the authors [8] on RC specimens simulating actual spillway piers, cracks were found to concentrate within the plastic hinge region at the base of the low-rebar-ratio spillway pier, and the ultimate state was reached through the fracture of the reinforcement. On this basis, the strain of the longitudinal rebars is treated in this study as a damage indicator for the spillway pier. In the previous cyclic loading tests conducted by the authors on RC specimens simulating spillway piers with round rebars and low rebar ratios, no rebar fracture occurred within the concrete, even when the rebar strain reached approximately 30,000 μ [8]. In addition, the simulation of the same experiment conducted by Sugimoto et al. [21] showed that the experimental behavior could be reproduced in the range where the rebar strain was approximately 30,000 μ or higher. Therefore, in this study, a rebar strain of 30,000 μ, based on experimental and simulation results, was used as a reference value for discussion. It should be noted that this value was adopted only as an experimental reference value and should not be interpreted as a universal strain limit.
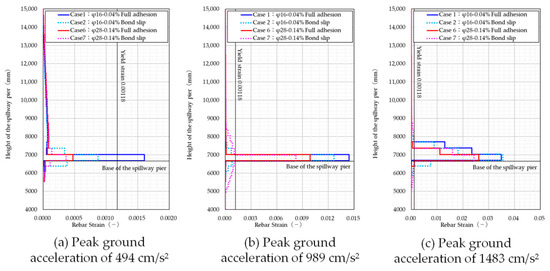
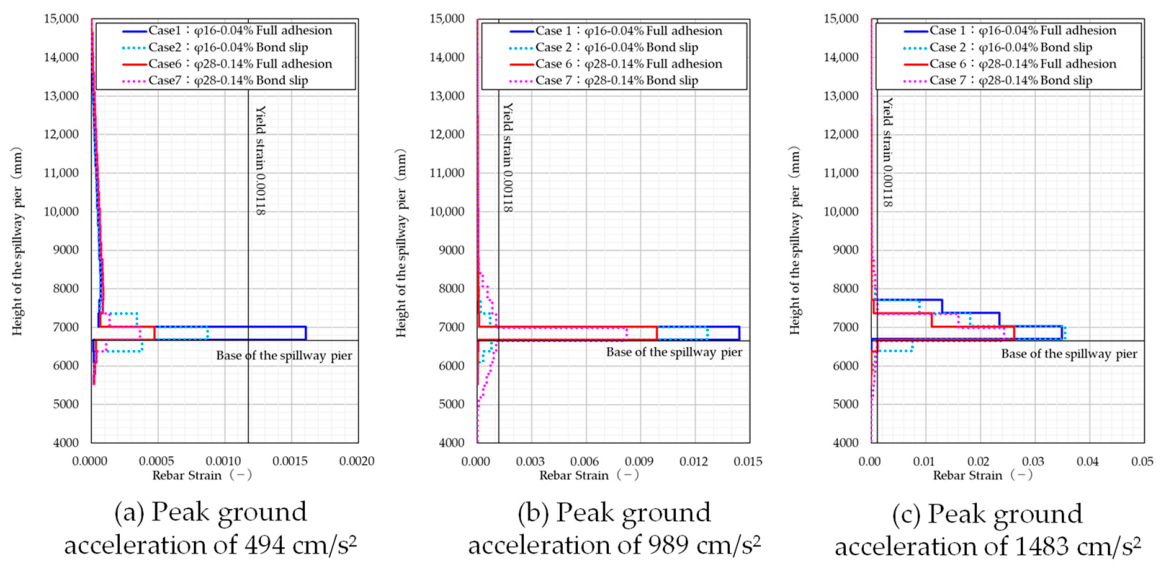
Figure 18 shows the rebar strain distributions for Cases 1 and 6, in which full adhesion was assumed, and for Cases 2 and 7, in which bond–slip was considered. Because Cases 1 and 2, and Cases 6 and 7, have the same amount of reinforcement within each pair, the effect of bond condition can be directly compared for each pair.
Figure 18.
Rebar strain (comparison between full adhesion and bond–slip).
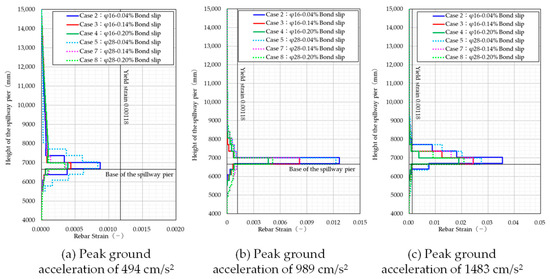
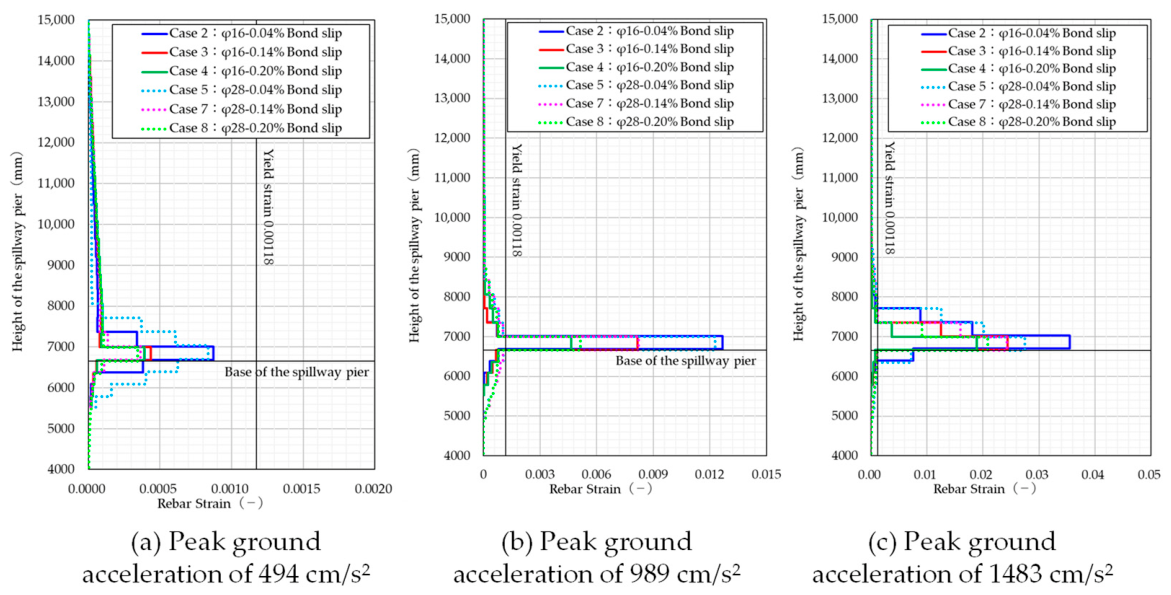
Rebar strain was extracted from the longitudinal rebars at the elevation of the crest of the overflow section using the values at the end of the analyses (t = 25.0 s) for peak ground accelerations of 494, 989, and 1483 cm/s2. Focusing on the effect of bond condition, rebar strain concentrated at the base of the spillway pier in the full adhesion cases for all input motions, whereas in the bond–slip cases, the maximum strain still occurred at the base, but the strain distribution extended over a wider range in the longitudinal direction.
Figure 19 shows the rebar strain distributions for all cases in which bond–slip was considered. Under the same rebar ratio condition, a larger bar diameter produced a smaller maximum strain at the base and a wider strain distribution in the longitudinal direction. This tendency is attributed to the fact that, for larger bar diameters, bond degradation between the rebars and concrete occurs at a relatively low strain level, reducing the likelihood of strain localization. It should be noted that, in all cases, even at a peak ground acceleration of 1483 cm/s2, the strain at the anchorage end of the longitudinal rebars (Z = 4000 mm) did not exceed the yield strain of 1180 μ, indicating that no rebar pullout occurred as a result of bond failure. The yield strain was calculated from the yield strength σy and Young’s modulus Es.
Figure 19.
Rebar strain (comparison among cases considering bond–slip).
Finally, with reference to the representative values for actual spillway piers, the rebar strain at the base exceeded 30,000 μ under a peak ground acceleration of 1483 cm/s2 in Cases 1 and 2, both with a rebar ratio of 0.04%. By contrast, in Case 5, which had the same rebar ratio but a larger bar diameter, the rebar strain did not reach 30,000 μ. These results indicate that both bar diameter and bond condition significantly influence the spatial distribution and the maximum value of rebar strain.
3.2.4. Tensile Damage Distribution
In seismic damage assessment of spillway piers, identifying tensile damage is important. In particular, it is necessary to confirm whether diagonal cracks attributable to shear develop. In this study, crack characteristics were evaluated to determine whether tensile damage attributable to shear deformation had occurred.
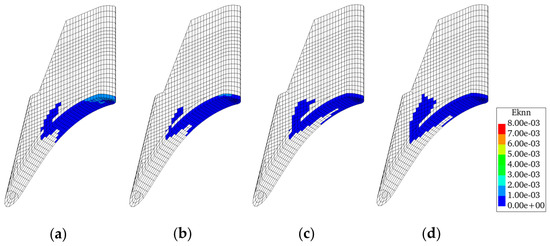
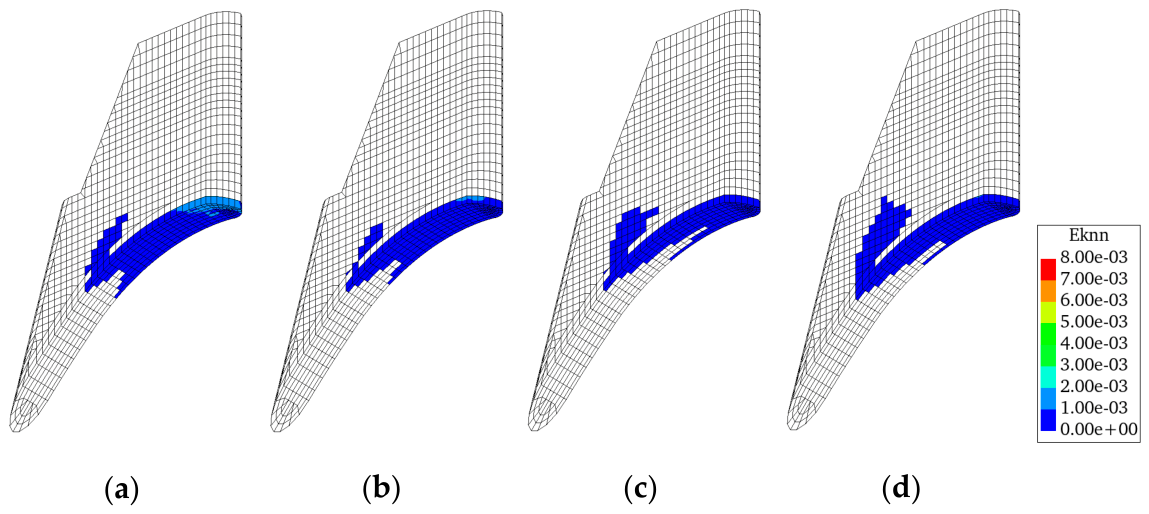
Figure 20 shows the maximum principal strain distributions at the end of the input motion (t = 25.0 s) for the peak ground acceleration of 494 cm/s2 for Cases 1 and 6, in which full adhesion was assumed, and for Cases 2 and 7, in which bond–slip was considered. Because Cases 1 and 2, and Cases 6 and 7, have the same amount of reinforcement within each pair, the effect of bond condition can be directly compared for each pair. Figure 21 shows the maximum principal strain distributions at the end of the input motion (t = 25.0 s) for the peak ground acceleration of 989 cm/s2 for all analysis cases. The figures provide an easy way to understand the crack location and tensile damage level from the distribution of the maximum principal strain.
Figure 20.
Maximum principal strain distributions at a peak ground acceleration of 494 cm/s2 (t = 25.00 s). (a) Case1. (b) Case2. (c) Case6. (d) Case7.
Figure 21.
Maximum principal strain distributions at a peak ground acceleration of 989 cm/s2 (t = 25.00 s). (a) Case 1. (b) Case 2. (c) Case 3. (d) Case 4. (e) Case 5. (f) Case 6. (g) Case 7. (h) Case 8.
With respect to the bond condition, no significant differences in tensile damage were observed among the cases at a peak ground acceleration of 494 cm/s2. By contrast, at a peak ground acceleration of 989 cm/s2, tensile damage near the base of the spillway pier was slightly more extensive in Cases 2 and 7, in which bond–slip was considered, than in Cases 1 and 6, in which full adhesion was assumed. Under the same rebar ratio, cases with larger bar diameters exhibited more severe tensile damage near the base. In addition, under the same bar-diameter condition, propagation of tensile damage tended to be suppressed as the rebar ratio increased.
It should also be noted that, in all cases, no diagonal tensile damage attributable to shear deformation was observed, and shear failure is therefore not considered to have occurred. Furthermore, in the reversed cyclic incremental loading tests conducted by the authors [8] on RC specimens simulating actual spillway piers, a single crack initiated and penetrated through the base of the spillway pier, and the maximum strain of the longitudinal rebars was concentrated at the base. The maximum principal strain distributions and the locations of rebar strain obtained in this study are consistent with these experimental observations.
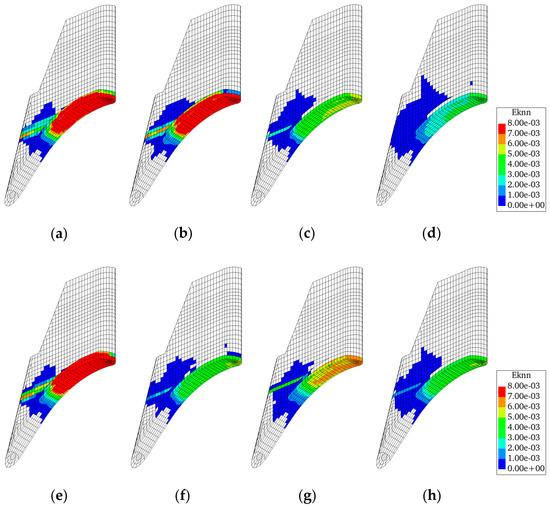
3.2.5. Compression Damage Distribution
In the seismic damage assessment of the spillway pier, it is important to identify not only tensile damage but also compressive damage in the base concrete. Previous studies [22,23] have reported that compressive damage may develop at the base of RC bridge piers with round rebars and of RC wall piers with low rebar ratios due to rocking during earthquakes. In this study, compressive damage was evaluated using the normalized accumulated strain energy, Wn (Equation (8)), proposed by Saito et al. [24]. In the equation, Σσij·dεij represents the sum of the products of the stress and strain increment components and corresponds to the incremental work per unit volume. Therefore, its time–history integration corresponds to the accumulated strain energy in the concrete during the seismic response. Wn is a normalized index of this accumulated strain energy with respect to the compressive strength of concrete, and was used not as the compressive strain itself but as an indicator of the accumulation of compressive damage under cyclic compression.
where Wn is the normalized accumulated strain energy, f is a reference quantity corresponding to the maximum compressive stress, n is the number of calculation steps, σij is the concrete stress tensor, and dεij is the strain increment tensor.
The threshold value of Wn was set at 1500 μ in accordance with the Standard Specifications for Concrete Structures of JSCE [15]. This value was adopted as the threshold for the normalized cumulative strain-energy index, Wn, and its numerical magnitude is comparable to the strain corresponding to the peak compressive stress of concrete. However, Wn was not treated as a direct compressive strain limit but rather as an indicator of cumulative concrete damage under cyclic compression.
where is the averaged damage index, Dd is the localized damage index, s is the distance from the element integration point, w (s) is the weight function, and V is the volume of the averaging region.
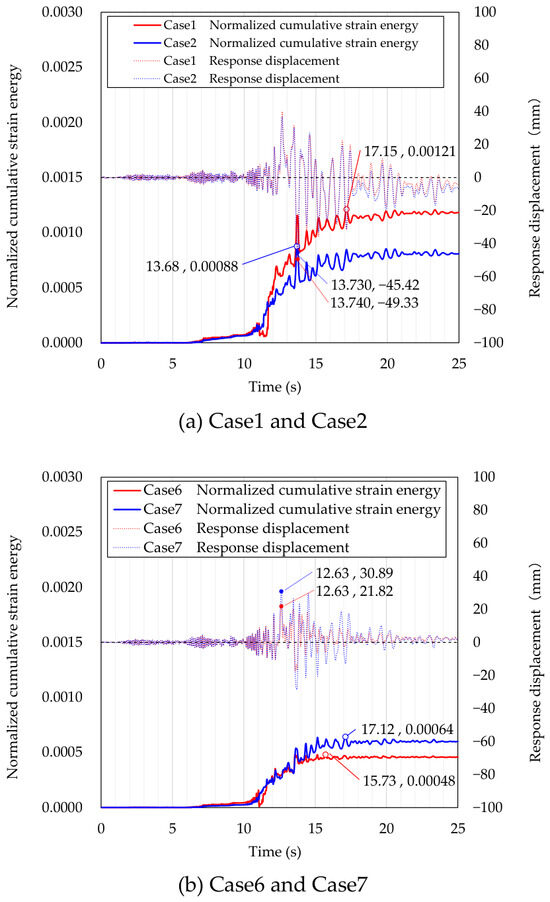
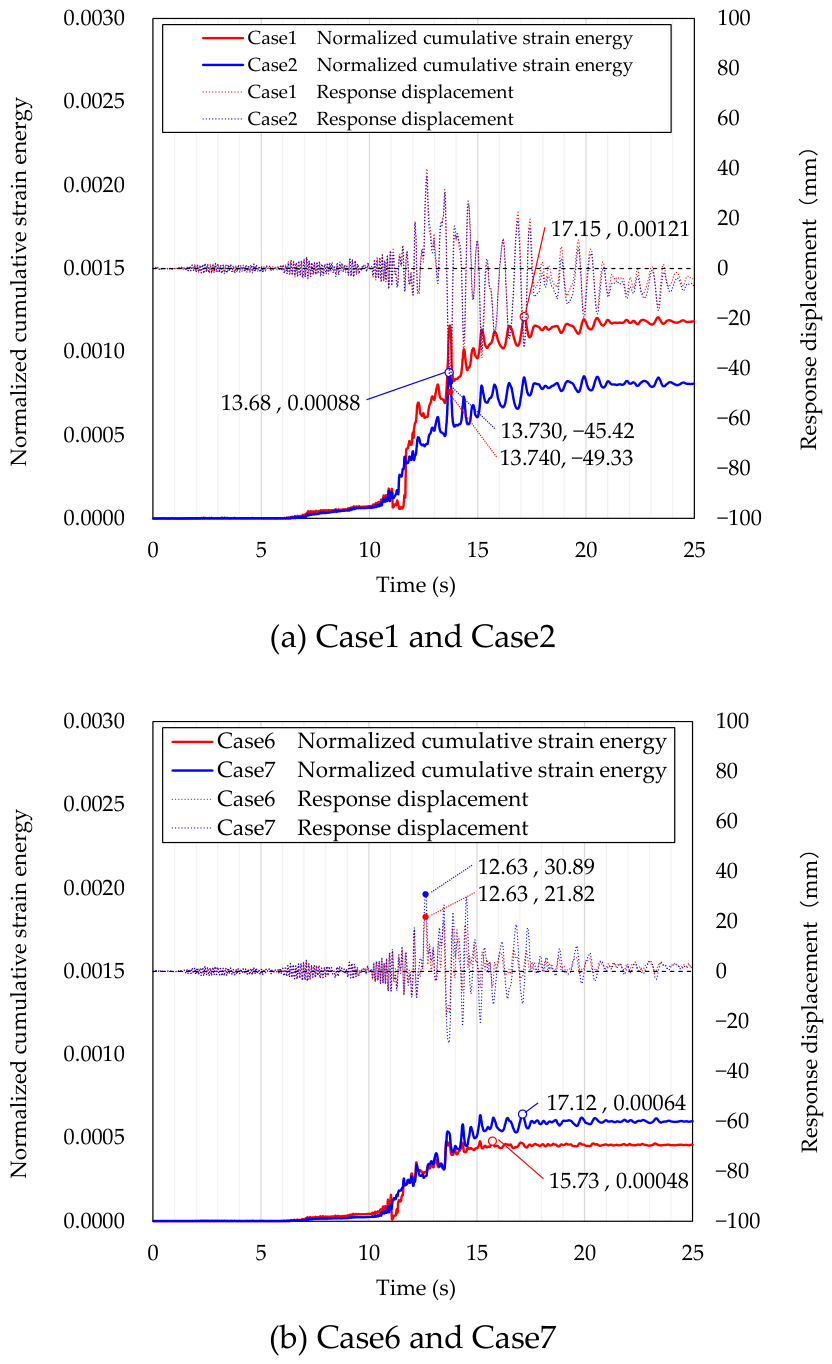
Figure 22 shows the time histories of the compressive damage indicator Wn and the response displacement at the top of the spillway pier for Cases 1 and 6, in which full adhesion was assumed, and for Cases 2 and 7, in which bond–slip was considered. Because Cases 1 and 2, and Cases 6 and 7, have the same amount of reinforcement within each pair, the effect of bond condition can be directly compared for each pair. In all cases, Wn accumulated as the earthquake progressed, even though it repeatedly increased and decreased. This behavior is considered to result from the repeated opening and closing of cracks at the base of the spillway pier under cyclic shaking in the dam-axis direction, which alternately induced compressive strain increments in the positive and negative directions. The time at which Wn reached its maximum varied across cases and did not necessarily coincide with the time of maximum displacement. This is considered to reflect differences in energy-absorption capacity among the cases, leading to differences in the timing of the rapid increase in compressive stress and strain increments in the nonlinear range after maximum displacement had been reached.
Figure 22.
Time histories of the normalized accumulated strain energy and the response displacement at a peak ground acceleration of 989 cm/s2.
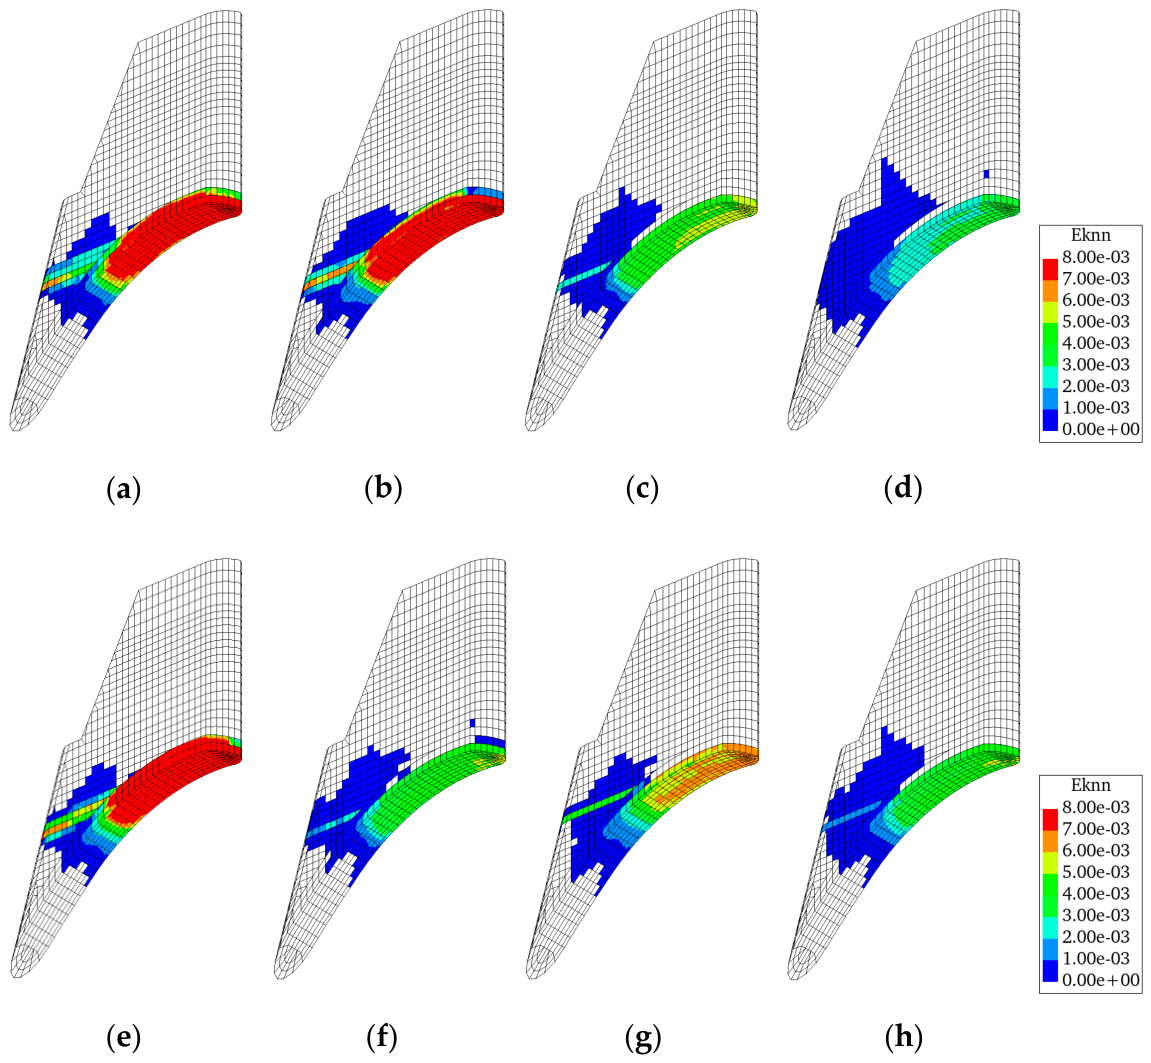
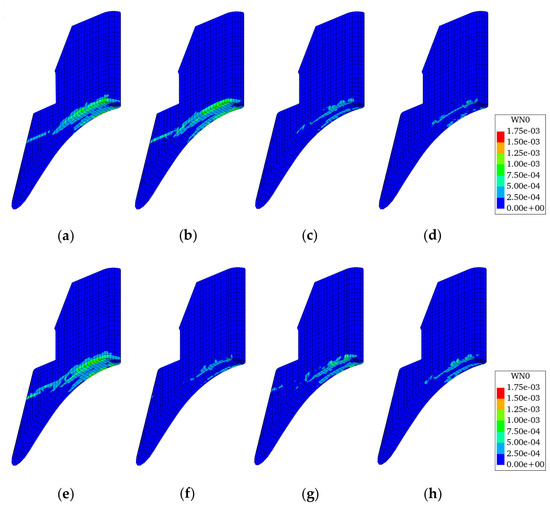
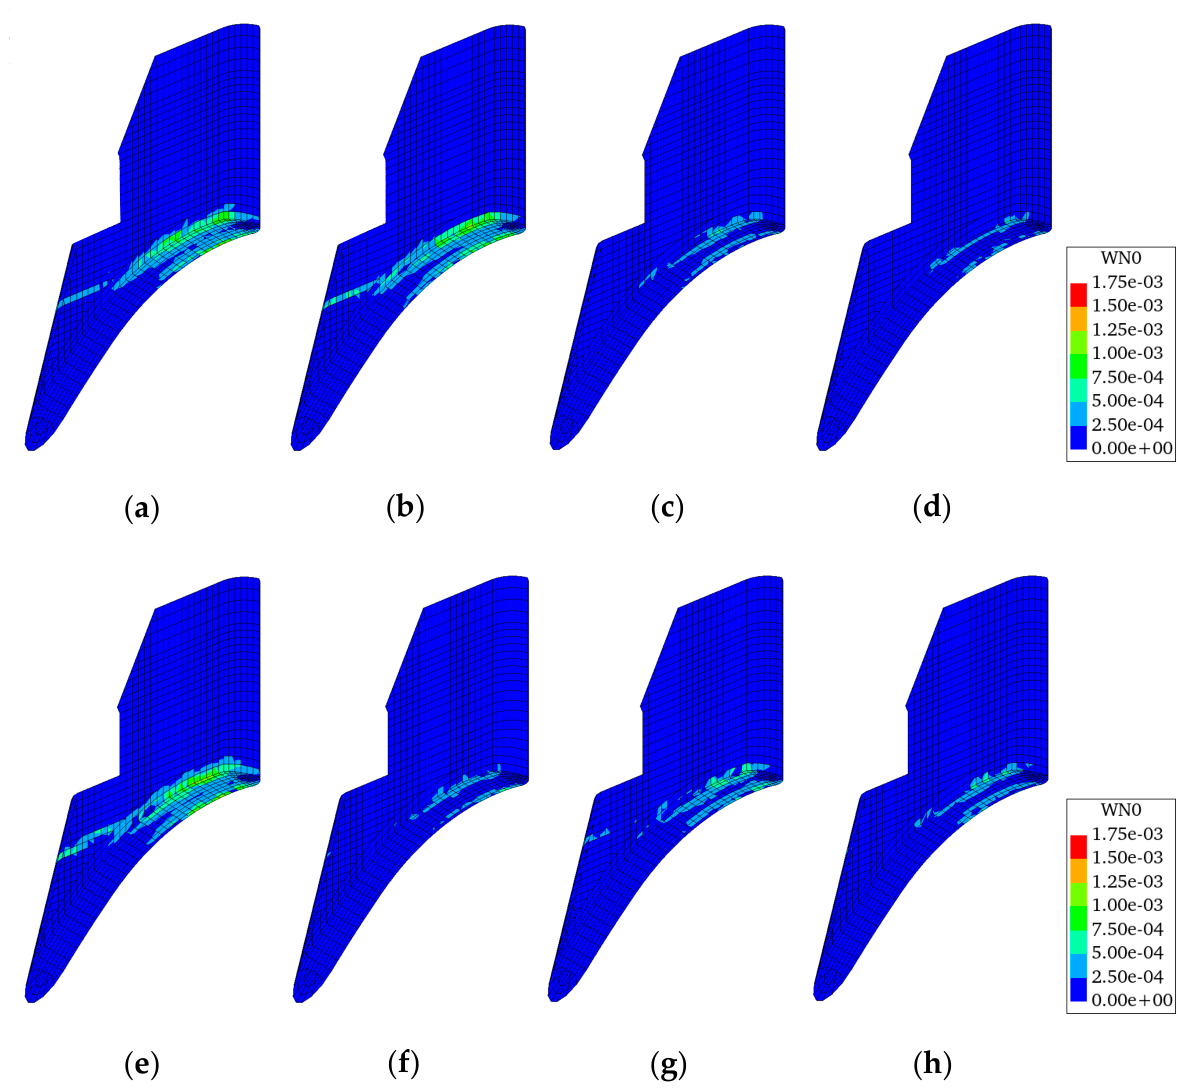
Figure 23 shows the compressive damage distribution evaluated using the normalized accumulated strain energy Wn at the end of the input motion (t = 25.0 s) for the peak ground acceleration of 989 cm/s2 for all analysis cases. With respect to bond condition, Case 7, in which bond–slip was considered, showed a wider compressive damage near the base of the spillway pier than Case 6, in which full adhesion was assumed. Under the same rebar ratio condition, the compressive damage tended to spread more widely around the base as bar diameter increased. In addition, under the same bar-diameter condition, the extent of the region in which compressive damage developed tended to decrease as the rebar ratio increased. These distribution characteristics are consistent with the results for maximum displacement and tensile damage distribution presented in the preceding sections.
Figure 23.
Compressive damage distribution of Wn at a peak ground acceleration of 989 cm/s2 (t = 25.00 s). (a) Case 1. (b) Case 2. (c) Case 3. (d) Case 4. (e) Case 5. (f) Case 6. (g) Case 7. (h) Case 8.
4. Discussion
4.1. Applicability of the Beam Model Using Nonlinear M-φ Relationship
Because of its relatively low computational cost and ease of model construction, the beam model is a practical analytical approach for evaluating contact behavior between spillway piers and spillway gates, as well as the response of the overall structural system, including multiple spillway piers.
However, for spillway piers with round rebars and a low rebar ratio, the present results confirmed that the damage-mode classification obtained from the beam model may differ from that obtained from the 3D finite element analysis incorporating bond–slip behavior. Unlike deformed bars, round rebars do not possess rib-induced mechanical interlock, and bond stress tends to degrade after cracking. As a result, member behavior is likely to be influenced not only by rebars yielding but also by bond–slip. In contrast, such effects cannot be explicitly represented in the beam model. This limitation may have contributed to the discrepancy in the predicted damage mode. In addition, the assumptions underlying the design shear-strength equation and the allowable curvature may not necessarily be consistent with the structural characteristics of spillway piers with round rebars and low rebar ratios.
More specifically, the seismic loading acting on a spillway pier is mainly governed by distributed inertial forces associated with the self-weight of the pier, and the contribution of higher modes cannot be neglected in addition to the first vibration mode, in which the pier crest vibrates significantly. The shear-strength equation for RC members is considered to have been developed primarily for beam and column members subjected to concentrated loading; therefore, appropriate evaluation of shear span is required when it is applied to members subjected to distributed loading. Moreover, this equation is formulated to promote flexural failure as the primary mode of failure and, in practical applications to RC members with a small shear span-to-depth ratio, such as spillway piers, corrections based on experimental evidence are sometimes introduced. In this study, the same shear-strength equation was used for both the beam model and the 3D finite element analysis to ensure consistent evaluation conditions for comparison; however, this assumption may have affected the resulting damage-mode classification. Furthermore, allowable curvature is generally calculated based on the force equilibrium between concrete compression and tension in the longitudinal rebars, whereas, for existing structures, it is often governed by the concrete’s ultimate strain. In RC structures with a low rebar ratio, the tensile resistance provided by the rebars is limited, and the allowable curvature, therefore, tends to be estimated as relatively large. In the case of round rebars, bond–slip also alters the stress distribution within the rebars, potentially leading to discrepancies from the actual nonlinear behavior.
Accordingly, although the beam model is effective for understanding global structural behavior and for initial screening, it has limitations when applied to detailed evaluation of local damage modes and nonlinear behavior for each member in spillway piers with round rebars and low rebar ratios.
4.2. Applicability of the 3D Finite Element Analysis Incorporating Bond–Slip Behavior
The 3D finite element analysis incorporating the bond–slip characteristics of round rebars is an analytical approach that can directly represent bond deterioration and bond-stress softening specific to round rebars. Compared with deformed bars, round rebars do not exhibit mechanical interlock, and stress transfer between rebars and concrete changes after cracking. As a result, member behavior is more susceptible to bond–slip effects. For spillway piers constructed with round rebars and low rebar ratios, as considered in this study, these nonlinear characteristics may have a non-negligible influence on seismic response. The use of a 3D finite element analysis, therefore, enables a more realistic assessment of damage by explicitly accounting for the bond behavior specific to round rebars.
The results of the IDA demonstrated that the 3D finite element analysis incorporating the bond–slip behavior of round rebars can capture the seismic behavior of spillway piers with round rebars and low rebar ratios through multiple response indicators, including maximum displacement, residual displacement, rebar strain, tensile damage distribution, and compression damage distribution. In particular, a major advantage of the 3D finite element analysis is that it allows the effects of bar diameter and rebar ratio on deformation response and damage distribution to be quantified systematically. It is noted that the previous experimental study [8] was based on static cyclic loading tests; therefore, direct quantitative comparison with the dynamic IDA results obtained in the present study is limited. Further validation of the 3D finite element model using dynamic cyclic loading tests or field observation records of actual spillway piers during earthquakes is desirable.
At the same time, the 3D finite element analysis requires substantial modeling effort and computational cost, and its routine application to all seismic performance evaluations is not necessarily practical. The present results indicate that, for relatively small input ground motions, differences in the maximum and residual displacements between analyses with bond–slip and full adhesion are not always large. This suggests that 3D finite element analysis should be applied selectively in practice, particularly when beam model results raise uncertainty about damage-mode classification or when the influence of bond–slip behavior in round rebars is expected to become significant. In addition, the analysis cases in this study do not fully cover all combinations of bar diameter, rebar ratio, and bond condition; the observed trends should be interpreted within the scope of the selected case matrix.
4.3. Practical Use of Different Analytical Models in the Seismic Assessment of Existing Spillway Piers
Based on the results and discussion above, it is practical in the seismic assessment of existing spillway piers with round rebars and low rebar ratios to select analytical models not only according to the evaluation objective but also to consider whether bond–slip behavior specific to round rebars may affect the response.
When evaluating contact behavior between the spillway pier and the spillway gate, as well as the global response of the system, the beam model is advantageous because of its high computational efficiency and its ability to capture overall response trends and sensitivity to earthquake intensity. By contrast, when the beam model results leave uncertainty in damage-mode classification, or when the bond–slip characteristics of round rebars are expected to influence the response, it is effective to employ a 3D finite element analysis that can appropriately represent both the structural geometry and the bond–slip behavior of round rebars. Such a model enables a more detailed assessment of the damage mode of the spillway pier, its deformation capacity, and its post-earthquake serviceability.
In other words, a staged analytical strategy in which the beam model is used to understand global system behavior and for initial assessment, while the 3D finite element analysis is used for local damage evaluation and detailed investigation of bond–slip behavior in spillway piers with round rebars and low rebar ratios, can be regarded as a practical and effective approach to the seismic assessment of existing spillway piers. The findings of this study provide a basis for selecting nonlinear analytical models that account for the nonlinear behavior specific to existing spillway piers with round rebars, and they offer useful implications for the safety assessment of infrastructure structures in which post-earthquake functional retention is of primary importance. Regarding future work, this study has several limitations. The IDA was performed using a single recorded ground motion scaled to multiple intensity levels. Therefore, record-to-record variability in ground motions was not considered. In addition, hydrodynamic pressure during earthquakes was simplified as an added mass acting in the dam-axis direction. Furthermore, the analyses were conducted for a single prototype spillway pier with a specific geometry, boundary conditions, and reinforcement layout. Although the analysis cases were selected based on survey results for existing spillway piers in Japan, the applicability of the observed trends to other spillway piers with different reinforcement layouts, dam geometries, boundary conditions, reservoir conditions, and seismic environments should be further examined.
5. Conclusions
In this study, nonlinear IDA was performed on an actual spillway pier with round rebars and a low rebar ratio, using both a beam model and a 3D finite element analysis that accounted for bond–slip behavior. The effects of differences in modeling approach, as well as of explicitly considering the bond characteristics of round rebars, on seismic response and damage-mode evaluation were investigated. In addition, parametric analyses using 3D finite element analysis, with bar diameter, rebar ratio, and bond condition as variables, were conducted to quantitatively characterize the seismic behavior of existing spillway piers with round rebars and low rebar ratios. The principal findings of this study are summarized as follows:
- For spillway piers with round rebars and low rebar ratios, the damage-mode classification obtained from the beam model may differ from that obtained from the 3D finite element analysis. This indicates that the beam model has limitations when used to evaluate the flexural and shear behavior of the spillway pier.
- By employing a 3D finite element analysis capable of representing the bond–slip behavior of round rebars, the effects of bar diameter, rebar ratio, and earthquake intensity on maximum displacement, residual displacement, rebar strain, tensile damage distribution, and compression damage distribution could be quantitatively evaluated while reflecting the nonlinear characteristics specific to round rebars.
- Consideration of the bond–slip characteristics of round rebars led to differences in seismic response and damage indicators compared with the case of full adhesion, with these effects becoming more pronounced for larger bar diameters and lower rebar ratios. In other words, under conditions involving round rebars and low rebar ratios, bond–slip may significantly influence seismic response. At the same time, it was also confirmed that, depending on the level of input ground motion and the combination of structural parameters, there are ranges in which the influence of bond–slip remains limited.
- Based on these findings, it is practical in the seismic assessment of existing spillway piers with round rebars and low rebar ratios to select analytical models not only according to the evaluation objective but also with consideration of whether bond–slip behavior specific to round rebars may affect the response and damage mode. A 3D finite element analysis capable of representing the bond–slip characteristics of round rebars is desirable for detailed evaluation of the damage mode and deformation capacity of the spillway pier. Moreover, to better understand the overall system behavior and for initial-stage screening, a staged analytical strategy in which a beam model and more detailed models are used at different stages is likely to be effective in engineering practice. It should be noted that further validation is needed to assess the applicability of the proposed approach to spillway piers with reinforcement layouts, dam geometries, and boundary conditions other than those considered in the analysis cases of this study.
Author Contributions
Conceptualization, Y.M. and H.N. (Hikaru Nakamura); methodology, Y.M.; software, Y.N. and S.U.; validation, Y.M., T.A. and H.N. (Hiroshi Nakajima); formal analysis, Y.N. and S.U.; investigation, Y.N. and S.U.; resources, Y.N. and S.U.; data curation, Y.M., Y.N. and S.U.; writing—original draft preparation, Y.M.; writing—review and editing, T.A., H.N. (Hiroshi Nakajima), Y.N., S.U. and H.N. (Hikaru Nakamura); visualization, Y.M.; supervision, H.N. (Hikaru Nakamura); project administration, Y.M. All authors have read and agreed to the published version of the manuscript.
Funding
This research received no external funding.
Data Availability Statement
The data presented in this study are available from the corresponding author upon reasonable request. Some data are not publicly available due to confidentiality restrictions related to the target infrastructure.
Acknowledgments
The authors would like to express their sincere gratitude to Tatsuo Nishiuchi, Yoshinori Miyagawa, and Keita Sugimoto of the Central Research Institute of Electric Power Industry, and to Ayumu Nakano of NEWJEC Inc., for their valuable advice on organizing the analytical results.
Conflicts of Interest
The authors declare no competing interests. Yoshiki Matsuoka, Takenori Araki, and Hiroshi Nakajima were employed by Kansai Electric Power Co., Inc. Yasuyuki Nakanishi and Satoshi Uchida were employed by NEWJEC Inc. There is no conflict of interest between any of the authors and these companies.
References
- International Commission on Large Dams (ICOLD). Selecting Seismic Parameters for Large Dams: Guidelines; Bulletin 148; ICOLD: Paris, France, 2016. [Google Scholar]
- Limoges, A.; Léger, P. Seismic safety assessment of gated spillways. J. Perform. Constr. Facil. 2009, 23, 209–218. [Google Scholar] [CrossRef] [Scilit]
- Song, L.; Wu, M.; Wang, J.; Xu, Y. Seismic damage analysis of the outlet piers of arch dams using the finite element sub-model method. Earthq. Eng. Eng. Vib. 2016, 15, 617–626. [Google Scholar] [CrossRef] [Scilit]
- Kanthakasikam, R.; Charatpangoon, B.; Hansapinyo, C.; Buachart, C.; Kiyono, J. Seismic safety analysis of dam appurtenant structures in northern Thailand. KSCE J. Civ. Eng. 2024, 28, 2885–2896. [Google Scholar] [CrossRef] [Scilit]
- Fernandes, C.; Melo, J.; Varum, H.; Costa, A. Experimental and numerical analysis of the cyclic behaviour of RC beam-column connections with plain reinforcing bars. In Proceedings of the 15th World Conference on Earthquake Engineering (15WCEE), Lisbon, Portugal, 24–28 September 2012. [Google Scholar]
- Xue, Z.; Lam, S.-S.E.; Lo, C.I.; Fang, S. A modified softened strut-and-tie model for non-seismically designed beam-column interior joints strengthened with unsymmetrical chamfers. Structures 2023, 53, 614–624. [Google Scholar] [CrossRef] [Scilit]
- Han, S.; Xiao, G.; Wang, P.; Xu, C.; Zhou, A.; Yu, J.; Ou, J. Axial-bending behavior of hybrid fiber-reinforced polymer-steel reinforced concrete columns with novel closed ties: Confinement mechanism and equivalent design. Eng. Struct. 2026, 353, 122236. [Google Scholar] [CrossRef] [Scilit]
- Matsuoka, Y.; Otsubo, Y.; Arimitsu, T. Cyclic behavior of RC structures using round rebars with ultra-low rebar ratio and applicability of the bond-slip model. In Proceedings of the East Asian Area Dam Conference: Sustainable Development and Management of Dams and Reservoirs for the Future Generations, Nagoya, Japan, 4–5 June 2024. [Google Scholar]
- Matsuoka, Y.; Otsubo, Y.; Arimitsu, T. Nonlinear analytical modeling of dam gated pier based on earthquake records. In Proceedings of the 28th ICOLD Congress on Large Dams, Chengdu, China, 16–23 May 2025. Paper No.Q.111–R.17. [Google Scholar]
- Mitsuishi, S.; Shimamoto, K. Seismic performance evaluation of dams against large-scale earthquakes. Dam Gijutus (Dam Technol.) 2009, 274, 6–35. [Google Scholar]
- Takeda, T.; Sozen, M.A.; Nielsen, N.N. Reinforced concrete response to simulated earthquakes. J. Struct. Div. ASCE 1970, 96, 2557–2573. [Google Scholar] [CrossRef] [Scilit]
- Matsuoka, Y.; Nakamura, H.; Kunieda, M.; Kawamura, S. Mechanical behavior evaluation of RC members using round bars by finite element analysis. Proc. Jpn. Concr. Inst. 2011, 33, 595–600. [Google Scholar]
- Maekawa, K.; Pimanmas, A.; Okamura, H. Nonlinear Mechanics of Reinforced Concrete; Spon Press: London, UK, 2003. [Google Scholar]
- Japan Society of Civil Engineers. Standard Specifications for Concrete Structures: Structural Performance Verification; JSCE: Tokyo, Japan, 2007. [Google Scholar]
- Japan Society of Civil Engineers. Standard Specifications for Concrete Structures: Design; JSCE: Tokyo, Japan, 2022. [Google Scholar]
- Horii, H.; Uchida, Y.; Kashiwayanagi, M.; Kimata, H.; Okada, T. Examination of tensile softening characteristics for concrete dam strength evaluation. Electr. Power Civ. Eng. Assoc. 2000, 286, 113–119. [Google Scholar]
- Ariga, Y. Three-dimensional dynamic analysis of the strong-motion behavior of spillways composed of T-shaped piers and reverse L-shaped piers. J. Struct. Eng. A 2008, 54A, 273–282. [Google Scholar]
- Rivers Bureau, Ministry of Land, Infrastructure, Transport and Tourism. Guidelines for Inspection of Dam Seismic Performance for Large-Scale Earthquakes (Draft) and Commentary; MLIT: Tokyo, Japan, 2005.
- Ministry of Land, Infrastructure, Transport and Tourism. Guidelines and Commentary for Seismic Performance Verification of River Structures—IV. Sluices, Culverts, and Weirs; MLIT: Tokyo, Japan, 2020. [Google Scholar]
- Nuclear and Industrial Safety Agency, Ministry of Economy, Trade and Industry; Electric Power Development Co., Ltd.; Tokyo Electric Power Services Co., Ltd. Manual for Seismic Performance Evaluation of Hydropower Facilities; NEWJEC Inc.: Tokyo, Japan, 2012. [Google Scholar]
- Sugimoto, K.; Matsuoka, Y. A study on seismic performance verification criteria for RC structures with low rebar ratio subjected to cyclic bending. In Proceedings of the 78th Annual Academic Conference of the Japan Society of Civil Engineers, V-78, Hiroshima, Japan, 11–15 September 2023. [Google Scholar]
- Sawamatsu, T.; Mitamura, H.; Nishi, H.; Matsumoto, T.; Kaho, Y. Hysteretic characteristics of RC bridge columns using round bars. J. Struct. Eng. A 2012, 58A, 333–342. [Google Scholar]
- Shinohara, M.; Suezaki, M.; Sakai, J.; Hoshikuma, J. Evaluation of failure characteristics, lateral strength, and ductility of RC bridge pier walls with low longitudinal rebar ratios. J. Struct. Eng. A 2015, 61A, 265–272. [Google Scholar]
- Saito, S.; Maki, T.; Tsuchiya, S.; Watanabe, T. Strain based damage indicators for finite element analysis of rein-forced concrete structures. Structures 2023, 58, 105473. [Google Scholar] [CrossRef] [Scilit]

Disclaimer/Publisher’s Note: The statements, opinions and data contained in all publications are solely those of the individual author(s) and contributor(s) and not of MDPI and/or the editor(s). MDPI and/or the editor(s) disclaim responsibility for any injury to people or property resulting from any ideas, methods, instructions or products referred to in the content. |
© 2026 by the authors. Licensee MDPI, Basel, Switzerland. This article is an open access article distributed under the terms and conditions of the Creative Commons Attribution (CC BY) license.