Article

Incorporating Increased Road User Costs into Pavement Management Modeling: A Case Study of Two-Lane Rural Highways

by
Khaled A. Abaza
1,* and
Mohamed S. Yamany
2,3,*
1
Civil Engineering Department, Birzeit University, Birzeit P.O. Box 14, West Bank, Palestine
2
Department of Engineering & Technology, East Texas A&M University, Commerce, TX 75428, USA
3
Department of Construction Engineering, Faculty of Engineering, Zagazig University, Zagazig 44519, Egypt
*
Authors to whom correspondence should be addressed.
Infrastructures 2026, 11(7), 238; https://doi.org/10.3390/infrastructures11070238
Submission received: 2 June 2026 / Revised: 1 July 2026 / Accepted: 9 July 2026 / Published: 13 July 2026

Abstract

The impact of increased road user costs on optimal pavement rehabilitation plans has been investigated using a simplified pavement management model. The increased road user costs include elevated vehicle operating costs (VOCs) due to work-zone lane closures and traveling on severely deteriorated pavements. A model is proposed for estimating the VOC for work-zone lane closures on two-lane rural highways, considering both stopping and idling costs. Another model for approximating the increased VOC associated with driving on poor/bad pavements is suggested as a function of the relevant VOC rate and a proportionality factor. Sample results are presented for a two-lane rural pavement network comprising 54.2 lane-kilometers. The sample optimal rehabilitation plans derived, excluding increased VOC, are associated with substantially higher VOC due to driving on severely deteriorated pavements. The inclusion of increased VOC because of badly damaged pavements has resulted in an improved pavement network without incurring extra expenses for highway agencies. The annual budget required to eliminate the VOC resulting from severely damaged pavements is $2.5 million while neglecting increased VOC, which decreases to $1.5 million when accounting for increased VOC. The incorporation of increased VOC has shifted fund allocation more towards substandard pavements. The optimal rehabilitation plan is associated with a $1.0 million annual budget, yielding a maximum road user saving of $0.411 million.

1. Introduction

Pavements deteriorate over time as a result of the cumulative effects of progressive traffic loading and diverse weather conditions. If pavements are allowed to reach advanced stages of deterioration, the consequences will lead to substantially increased highway user costs, primarily related to vehicle operating costs (VOCs) [1,2,3,4]. The increased VOC includes fuel consumption, repair and maintenance, depreciation, and tire costs. Another element of increased road user costs is the VOC associated with work-zone lane closures during the implementation of pavement maintenance and rehabilitation works [5,6,7]. The execution of rehabilitation work on a two-lane highways frequently requires the closure of one lane. Lane closures typically result in heightened road user VOCs, delays, and vehicular emissions [8]. Certain researchers proposed models to optimize work-zone scheduling to minimize user costs and delays [9,10]. However, limited research exists in the literature regarding the integration of increased road user costs into pavement management modeling procedures [1].
The pavement management problem is typically formulated as an optimization model with the main objective of maximizing the overall conditions of a given pavement network, constrained mostly by financial limitations [11,12,13,14]. The pavement management issue can be solved for a single time horizon, such as one or two years, when the objective is to derive a single maintenance and rehabilitation (M&R) plan. It can also be solved for several time horizons when the goal is to develop a long-term M&R schedule with a specific M&R plan for each time horizon within a defined analysis period [4,15,16]. However, the formulation of a long-term M&R schedule requires the incorporation of a pavement performance prediction model. The pavement conditions at the beginning of each time horizon form the basis for any optimization model aimed at enhancing the pavement network conditions. An advanced pavement management model typically incorporates a performance prediction model, which may be deterministic, probabilistic, or based on machine learning techniques [17,18,19,20,21,22].
Pavement performance is generally evaluated using key performance indicators such as the present serviceability index (PSI), pavement condition index (PCI), and international roughness index (IRI). These key performance indices have been widely utilized in several pavement management applications [23,24,25,26]. A reliable performance indicator should consider both the functional and structural characteristics of a pavement structure [27]. The IRI primarily assesses roadway profile roughness (i.e., functional assessment), the PCI predominantly focuses on structural deficiencies, including various types of cracking, while the PSI places greater importance on functional performance, making it highly correlated to the IRI. Several correlation models have been developed involving the three outlined performance indicators (i.e., PSI, PCI, and IRI) [28,29,30].
This paper develops a simplified pavement management model (PMM) that can be solved for a single time horizon without requiring a performance prediction model. The model was primarily designed to consider major rehabilitation actions that can produce significant improvements in the pavement network conditions. A specific rehabilitation strategy is required for each pavement class, depending on its pavement condition, provided it can restore the pavement to its original condition. A current assessment of the pavement network conditions constitutes the model’s main data requirement. The pavement evaluation was conducted using a portable roughness measurement device called IRIMETER-2, designed to yield the IRI value for short pavement sections with a 5 m lane length. The proposed PMM was employed to investigate the impact of increased road user costs on optimal rehabilitation plans. This research paper has three main objectives, summarized as follows:
(1)
Develop a model for estimating the increased vehicle operating cost (VOC) due to work-zone lane closures, considering the special case of two-lane rural highways. The VOC shall include the stopping and idling costs. The model shall yield the VOC in the unit of (USD/m2) to be consistent with the unit used in computing the pavement rehabilitation cost.
(2)
Develop a model for estimating the increased VOC due to traveling on severely deteriorated pavements. The model shall yield the VOC in the unit of (USD/m2) for pavement classes with poor/bad conditions, which is achieved by employing an increased VOC proportionality factor.
(3)
Develop a modeling mechanism that integrates the impact of increased VOC into the process of yielding optimal rehabilitation plans. In particular, a cost-effectiveness parameter is introduced in the cases of excluding or including VOC.

2. Increased Road User Costs

This study examines two main increased road user costs: the increased VOC due to lane closure and the increased VOC due to traveling on severely deteriorated pavements. The elevated VOC resulting from lane closures during the execution of pavement rehabilitation work is considered for the case of two-lane rural highways, which encompasses stopping and idling costs. The stopping cost is associated with deceleration and acceleration actions, while the idling cost is incurred when vehicles are stationary with their engines operating [31,32,33,34].

2.1. Increased VOC Due to Lane Closure

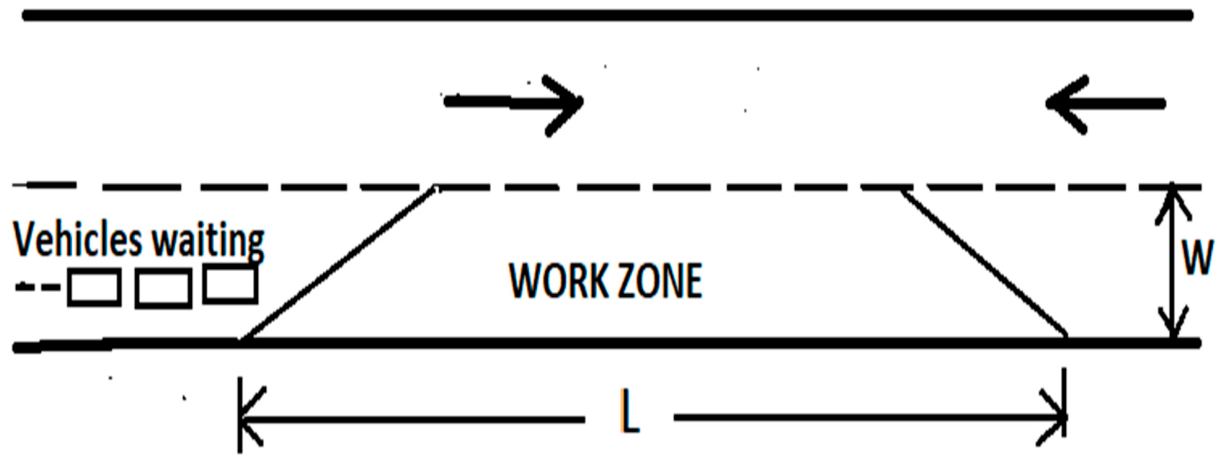
On a two-lane rural roadway, in the absence of a detour, the vehicular traffic in both directions is alternately directed to use the same lane while rehabilitation work is being carried out on the other lane, as shown in Figure 1. Vehicular traffic is held in one direction for a certain period of time, while traffic from the opposing direction is allowed to traverse the work-zone area; thereafter, the initially halted traffic is allowed to traverse through the other lane. Therefore, traffic from both directions endures additional vehicle operating costs due to stopping and idling [31,35,36]. The stopping cost includes the deceleration expense associated with making a complete stop and the acceleration expense required to regain the initial approach speed. Nevertheless, the idling cost covers the expenses of operating vehicle engines when stationary for the entire duration of the holding period. The stopping cost is typically calculated as a function of approach speed (S), while the idling cost is directly related to the length of the holding time period (T). The costs for stopping and idling are typically assessed in USD per 1000 vehicles.
Therefore, the increased user cost due to work-zone lane closures focuses on the increased VOC associated with stopping and idling. However, it is required to estimate the stopping and idling costs in USD per square meter, the unit employed for calculating rehabilitation costs, to facilitate the integration of increased stopping and idling costs into pavement management modeling. Equation (1) can be used to estimate the increased lane closure cost (LCi) in the unit of (USD/m2) due to stopping and idling, in relation to the ith rehabilitation plan. LC is a function of stopping and idling cost units (UCS and UCI) measured in USD/1000 V, the average hourly traffic volume (AHV) during the work shift for both directions, work-shift duration (D) in hours, the number of work shifts (NSi) required to execute the ith rehabilitation plan, and the length and width (L and W) of the work-zone area in meters. Equation (1) quantifies the increased VOC due to stopping and idling in the unit of USD, subsequently dividing the outcome by the work-zone area to obtain the cost per square meter (USD/m2). According to Equation (1), the lane closure length (L) is directly proportional to the number of work shifts (NSi); the optimal combination of L and NSi is the one that results in the minimum lane-closure cost (LCi).
L C i = ( U C S + U C I ) × A H V × D × N S i L × W
where
LCi = lane-closure cost (USD/m2) for the ith rehabilitation plan;
U C S = cost unit associated with stopping (USD/1000 V);
U C I = cost unit for idling (USD/1000 V), which depends on holding period (T);
AHV = average hourly traffic volume (vph) during work shift in both directions;
D = work-shift duration in hours;
NSi = number of required work shifts for the ith rehabilitation plan;
L = lane length (m) of work-zone area per work shift;
W = lane width (m) of work-zone area.
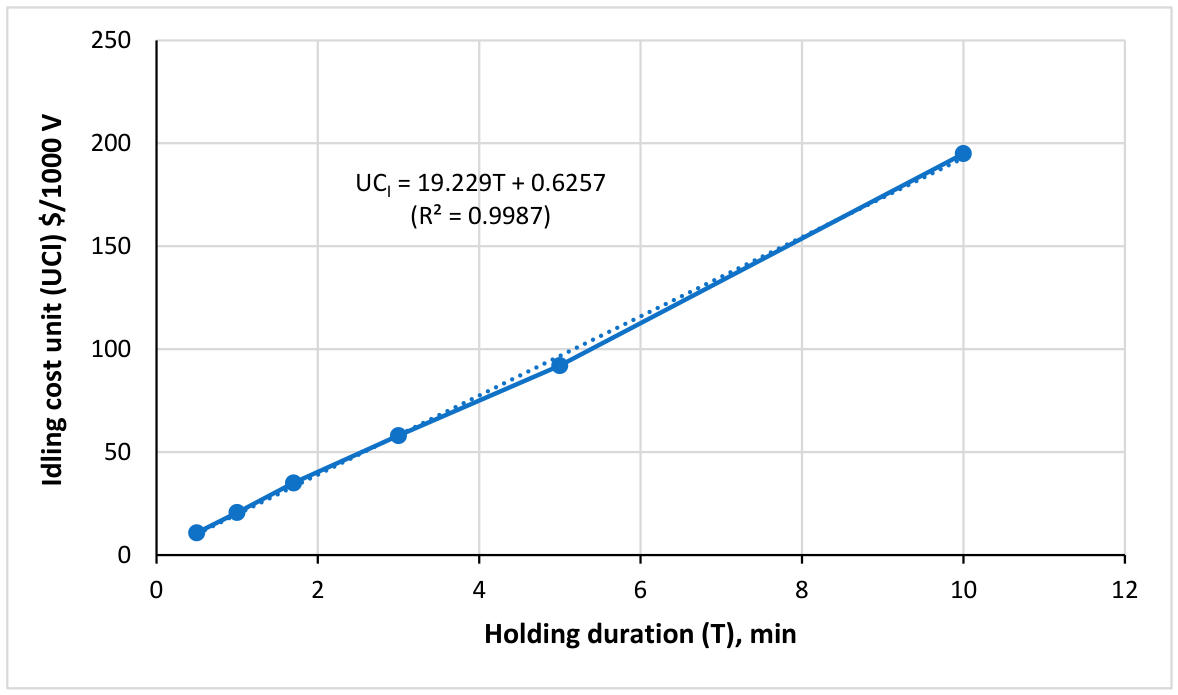
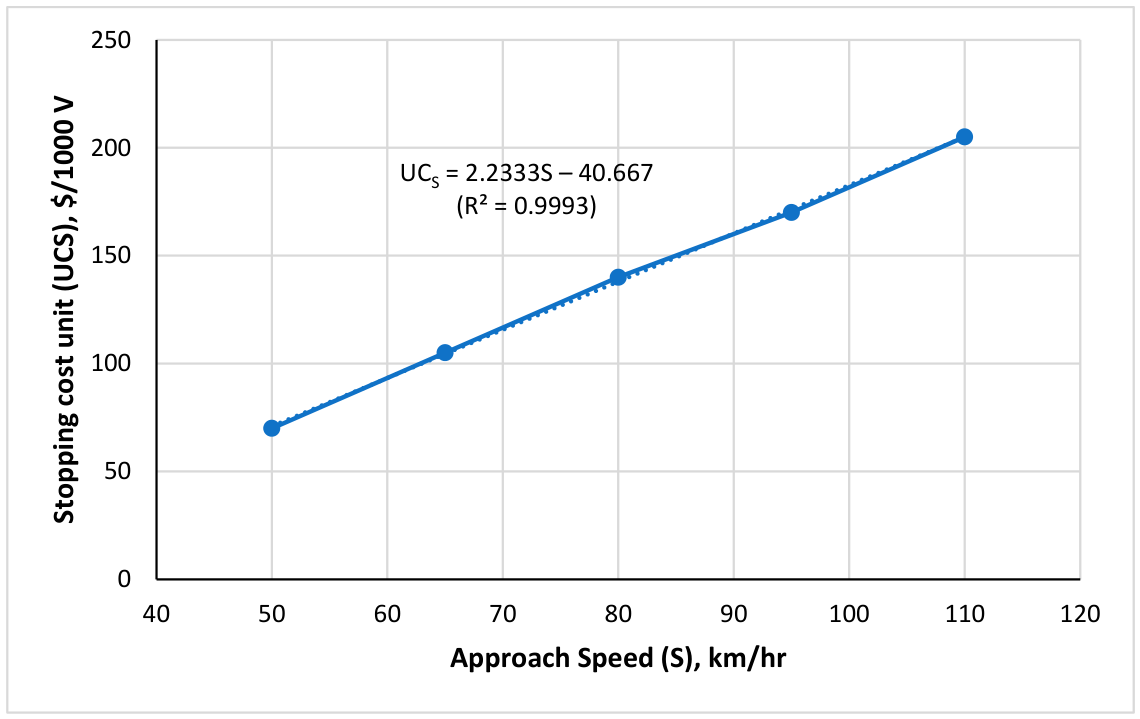
AASHTO conducted comprehensive analyses to assess the road user costs associated with highway improvement projects, documented in the publication referred to as the Red Book [31]. The 1977 edition of the AASHTO Red Book was published in a Stanford Research Institute report for the National Cooperative Highway Research Program (NCHRP) [32]. Therefore, the 1977 edition of the AASHTO Red Book has been consulted for the purpose of estimating sample cost units for vehicle stopping and idling. The sample cost units have been scaled off from the pertinent stopping and idling nomographs and adjusted using consumer price indexes to reflect the 2025 local market prices. Figure 2 illustrates a sample linear relationship that correlates the vehicle idling cost unit (UCI) expressed in (USD/1000 V) to the vehicle holding period (T) in minutes. Similarly, Figure 3 depicts a linear correlation for calculating the vehicle stopping cost unit (UCS) in (USD/1000 V) based on approach speed (S) in (km/h). Figure 2 and Figure 3 will serve as the basis for estimating the increased stopping and idling cost units utilized in the sample presentation provided later.

2.2. Increased VOC Due to Pavement Deterioration

Traveling on severely deteriorated pavements can substantially elevate the VOC. Former studies have demonstrated that traveling on poor/bad pavements can result in a substantial rise in highway user costs [3,16,33]. Ahmed et al. [3] reported that this increase may vary from 27 to 45%. This study aims to annually estimate the increased VOC resulting from pavement deterioration, based on the assumption that a one-year time horizon is utilized in formulating a pavement management schedule consisting of (m) rehabilitation plans, each tailored to a specific pavement class. Pavement classes with poor/bad conditions are subject to elevated VOC levels. In particular, the annual vehicle operating cost (AVC) can be estimated using Equation (2). The AVC for a given pavement network is calculated in USD as the product of VOC unit (UCO) in USD per 1000 vehicle lane-kilometer (USD/1000 VK), average daily traffic (ADT) in vehicles/day, pavement network length (LN) in lane-kilometer, and 365 days/year. The VOC unit (UCO) is the key parameter in Equation (2), which can be approximated using local market prices or relevant publications, such as the 1977 edition of the AASHTO Red Book [31,32].
A V C =     U C O × A D T × L N   × 365
where
AVC = annual vehicle operating cost for a given project/network in USD;
UCO = vehicle operating cost unit (USD/1000 VK);
ADT = average daily traffic (vehicles/day);
LN = project/network length (lane-kilometer).
However, as mentioned earlier, it is essential to quantify all relevant increased user costs in the unit of (USD/m2) to be consistent with the unit associated with rehabilitation cost rates, which are typically expressed in (USD/m2). Therefore, the annual increased VOC in (USD/m2) associated with pavement class (i), DCi, can be computed using Equation (3), where the AVC is divided by the network surface area, SAN, in (m2). The result is then multiplied by an increased VOC proportionality factor, PF(i), to yield the DCi for the pavement class (i) as a proportion of AVC. Therefore, the PF(i) is introduced to account for the expected increase in VOC as a result of pavement deterioration, with its value directly correlated to the severity level of pavements in the ith class.
DC i = AVC SA N PF ( i )   ( i = 4 , 5 , 6 )
where
DCi = increased annual VOC for the ith pavement class because of severely deteriorated pavements, (USD/m2);
AVC = as defined earlier;
SAN = pavement project/network surface area (m2);
PF(i) = increased VOC proportionality factor for the ith class wherein PF(i + 1) > PF(i).
According to Equation (3), it is suggested to apply the increased VOC to pavements in classes (4–6) when employing a total of six pavement classes (m), with class (1) being the class with the best pavement condition. In the sample presentation provided later, the increased VOC proportionality factor, PF(i), is assigned the mild values of 0.05, 0.10, and 0.15 for pavement classes 4, 5, and 6, respectively. The corresponding DCi values are estimated to be 10.94, 21.90, and $32.84/m2 based on ($180/1000 VK) VOC unit (UCO) estimated based on local prices, 12,000 vehicles/day average daily traffic (ADT), 54.2 km network lane-length (LN), and 195,120 m2 network surface area (SAN).
The increased VOC due to pavement deterioration can also be estimated using the Highway Development and Management model (HDM-4) published by the World Road Association (PIARC) and the World Bank [37]. The VOC due to pavement deterioration is estimated as a function of pavement roughness (IRI), roadway geometry, traffic volume, vehicle types, and traffic speed. The increased VOC is estimated as the difference between the VOC for a future IRI value and the VOC associated with a baseline IRI. Therefore, the HDM-4 procedure can be used to validate the assumed values of the increased proportionality factor, PF(i). The future IRI value is the average class IRI value ( I R I ¯ i ) , while the baseline IRI value represents the anticipated value for a new pavement (IRIo). Alternatively, the PF(i) values can be calculated using the results presented in the NCHRP Report 720 Model [38]. It is reported that an increase in roughness of approximately 1 m/km IRI results in an increase of about 2–3% in VOC, depending on the traffic speed and vehicle class.

3. Simplified Pavement Management Model

A simplified pavement management model (PMM) is proposed for the purpose of incorporating the two previously outlined increased vehicle operating costs, specifically, arising from work-zone lane closures and severely deteriorated pavements. The suggested PMM applies to a single time horizon, such as one or two years. It requires the use of an appropriate pavement condition indicator, such as the IRI, PSI, or PCI, to assess the current pavement condition of a given project or network. It does not necessitate the incorporation of a pavement performance prediction model as its application is limited to a singular time horizon.
The IRI has been utilized in the development of the proposed PMM, wherein short pavement lane sections can be assessed using portable instruments for profile roughness measurement, such as the IRIMETER-2 employed in this study. The IRIMETER-2 is a product of Englo LLC, Tallinn, Estonia. The IRIMETER-2 calculates the IRI value for pavement segments with 5 m lane length, and its operating system can generate a result summary for a specified number of pavement classes (m) as requested by users [27]. The operating system can additionally provide relevant statistics for the IRI measurements, including the number of pavement sections (Ni) and the average IRI value,   I R I ¯ i , associated with the ith class as delineated in Equation (4a). The current pavement proportion available in the ith class, Pi, can be determined using Equation (4b), while the current average IRI value for a given pavement network, CIRIN, can be calculated using Equation (4c).
I R I ¯ i   = j = 1 N i I R I i , j N i ( i = 1 , 2 , , m , )
P i = N i N T   w h e r e       N T = i = 1 m N i
C I R I N = i = 1 m P i × I R I ¯ i
where
IRIi,j = the IRI measurement for the jth pavement section in the ith pavement class;
Ni = the number of pavement sections in the ith class;
M = number of specified pavement classes;
I R I ¯ i   = the average IRI value associated with the ith pavement class;
Pi = the pavement proportion of the ith class;
NT = the total number of pavement sections for the pavement network;
CIRIN = the current average IRI value for the pavement network.
The proposed PMM is primarily designed to deal with major rehabilitation actions that can yield significant improvements in the network IRI value. An appropriate rehabilitation strategy is to be specified for each pavement class, excluding the class with the best pavement condition. Each rehabilitation strategy is represented by a rehabilitation variable labeled (Xi). The rehabilitation variable, Xi, pertaining to pavements in the ith class, signifies a faction of the current pavement proportion, Pi, such that Xi is less than or equal to Pi. Each rehabilitation variable is expected to make an improvement in the network IRI value, resulting in a reduced class IRI value, RIRIi, as defined in Equation (5a). The reduction in the network IRI value, RIRIN, is derived from the implementation of all potential rehabilitation variables as presented in Equation (5b). Equation (5b) excludes class (1) as it contains pavements in the optimal condition. It is presumed that all rehabilitation actions implemented across the various pavement classes can reduce the average class IRI value from its current value, I R I ¯ i , to the initial IRI value, IRIo. The IRIo is essentially the IRI value attributed to a new pavement, assumed to be the same value regardless of the major rehabilitation actions undertaken. Nonetheless, the model may be readily adjusted to ensure that the IRIo is different for each rehabilitation action.
R I R I i = X i × ( I R I ¯ i I R I o )
R I R I N = i = 2 m X i × ( I R I ¯ i I R I o )
where
RIRIi = reduced IRI value for the ith class as a result of major rehabilitation;
Xi = rehabilitation variable as applied to pavements in the ith class;
I R I ¯ i = as defined before;
I R I o = initial/original IRI obtained as a result of major rehabilitation;
R I R I N = reduced average network IRI value as a result of major rehabilitation.
The proposed PMM is defined in Equation (6) with the objective of minimizing the modified average network IRI value, IRIN, as a result of major rehabilitation. The IRIN is defined as the difference between the current average network IRI value, CIRIN, and the reduced average network IRI value, RIRIN, derived from rehabilitation variables applied to various pavement classes, with the exception of class 1. The minimization procedure is to take place with respect to the rehabilitation variables, Xi, with the optimal solution being the one that yields the lowest IRIN value. Two relevant constraints must be enforced while minimizing the objective function. The first one mandates that the total rehabilitation cost, RC, must not exceed the allocated annual budget, AB, whereas the second constraint imposes the natural limits placed on each rehabilitation variable. The objective function and constraints defined in Equation (6) are linear, allowing for the utilization of software packages designed to solve linear programming problems to solve the linear model outlined in Equation (6).
Minimize   I R I N = C I R I N R I R I N = i = 1 m P i × I R I ¯ i i = 2 m X i × ( I R I ¯ i I R I o )
Subject to
(1)
R C = i = 2 m ( X i × S A N × R C i ) A B
Where SAN = (5W) NT
(2)
0 X i P i (i = 2, 3, …, m)
Where
IRIN = modified average network IRI value after major rehabilitation;
RC = total annual network rehabilitation cost, USD;
RCi = rehabilitation cost unit associated with the ith class, USD/m2;
W = width of the surveyed 5 m long pavement sections (m);
Other variables as defined earlier.
A key metric for the optimal selection of rehabilitation variables is the cost-effectiveness ratio, CEi, as delineated in Equation (7). It is simply a ratio of rehabilitation cost unit, RCi, associated with the ith rehabilitation action/variable and the corresponding reduction in the IRI value. The ith rehabilitation variable exhibiting the lowest cost-effectiveness ratio is most likely to be prioritized in the optimal solution [27]. Equation (7) presents the calculation of the CEi value when increased user costs are neglected.
C E i   = R C i I R I i = R C i I R I ¯ i I R I o
However, when considering the increased road user costs, a net cost-effectiveness ratio, NCEi, must be taken into account as presented in Equation (8). The net cost unit, NCi, used in Equation (8) accounts for the two previously defined increased VOC components, namely due to lane closure, LCi, and traveling on severely deteriorated pavements, DCi. The rehabilitation cost is funded by highway agencies, whilst the LCi is incurred by highway users; thus, both cost units, RCi and LCi, must be added to reflect the total cost to society. Nonetheless, the DCi must be subtracted as it represents a saving to society upon the completion of rehabilitation work.
N C E i   = N C i I R I i = R C i + L C i D C i I R I ¯ i I R I o
The sample presentation that follows will investigate the potential application of the two outlined cost-effectiveness ratios, CEi and NCEi, in yielding reliable optimal solutions. The VOC due to lane closure associated with the ith rehabilitation variable, LC(Xi), is computed from Equation (9a) in USD. Similarly, the VOC due to severely deteriorated pavements associated with the ith rehabilitation variable, DC(Xi), is calculated using Equation (9b). The DC(Xi) is only incurred for the pavement portion not selected for rehabilitation, (PiXi).
L C ( X i ) = X i × L C i × S A N
D C ( X i ) = ( P i X i ) × D C i × S A N
All variables involved in Equations (9a) and (9b) have been previously defined. The total network VOC, TCN, for a particular rehabilitation plan is the sum of the total costs associated with lane closure, LC, and damaged pavements, DC, as calculated using Equation (10). As previously stated, pavements in class (1) are not deemed eligible for major rehabilitation due to their superior condition.
T C N = L C + D C = i = 2 m L C ( X i ) + i = 2 m D C ( X i )

4. Sample Presentation

The impact of integrating the increased VOC into optimal pavement rehabilitation plans has been examined using a sample network of 54.2 lane-kilometers that belongs to the two-lane rural highway system in the Ramallah District, Palestine. The sample pavement network was assessed utilizing the portable vehicle-mounted IRIMETER-2 profilograph (manufactured by Englo LLC, Tallinn, Estonia), which measures longitudinal roughness using two sensors installed on the front wheels of a passenger car. The sensors quantify the vehicle’s vibration, subsequently translating it into an IRI value [27]. The IRIMETER-2 device provides the IRI value for pavement sections measuring 5 m in lane length. Table 1 presents a summary of statistics for the sample IRI measurements collected from the investigated pavement network, categorized into six classes (m). Classes 1–5 are defined using equal IRI ranges, whereas class 6 is designated for pavements with IRI greater than 10, as specified in Table 1. The total number of IRI measurements, NT, is 10,840, with each measurement representing a pavement section with a 5 m lane length. The proportions of pavement classes, Pi, and the average class IRI values, I R I ¯ i , are also provided, which represent the essential parameters in the proposed simplified pavement management model (PMM).
Five rehabilitation strategies are proposed for pavement classes (2–6) as detailed in Table 2. The suggested rehabilitation options include a thin hot-mix asphalt (HMA) overlay for classes 2 and 3, cold milling followed by overlay for classes 4 and 5, and complete reconstruction for class 6. These sample rehabilitation strategies are selected based on local practices and engineering judgment. Table 2 presents the rehabilitation cost units, RCi, associated with applicable pavement classes, together with the number of work shifts, NSi, required to rehabilitate a 0.5 lane-kilometer pavement segment, where the duration of each work shift, D, is 8 h.
The increased VOC due to lane closure, LCi, has been estimated using Equation (1) assuming an average hourly traffic volume, AHV, of 800 vehicles/hour, a work-zone length, L, of 500 m, and a work-zone width, W, of 3.6 m. The idling cost unit, UCI, is estimated to be 92 USD/1000 V, derived from the linear model illustrated in Figure 2, based on a 5 min average holding period (T). The stopping cost unit, UCS, is estimated from the model illustrated in Figure 3 to be 140 USD/1000 V, based on an approach speed (S) of 80 km/h. The resulting lane-closure costs, LCi, are presented in Table 1 for various pavement classes. The added VOC rates are estimated based on the distribution of 70% passenger cars, 15% light trucks, 10% heavy trucks, and 5% buses. Cost adjustment factors (multipliers) are applied to different types of vehicles as recommended by the 1977 edition of the AASHTO Red Book.
The elevated VOC resulting from traveling on substandard pavements, DCi, has been computed using Equations (2) and (3), with the findings presented in Table 1 for classes (4–6). the aforementioned sample DCi values have been calculated based on a vehicle operating cost unit, UCO, of 180 USD/1000 VK, an average daily traffic, ADT, of 12,000, a network lane length, LN, of 54.2 km, and a network surface area, SAN, of 195,120 m2. The increased VOC proportionality factor, PF(i), is assigned the mild values of 0.05, 0.10, and 0.15 for classes 4, 5, and 6, respectively. It can be noticed that the sample DCi values are substantially higher than the corresponding increased VOC due to lane closure, LCi. This is because the DCi are incurred over the entire year, while the LCi are only experienced during the work-shift periods. The cost-effectiveness and net cost-effectiveness ratios, CEi and NCEi, were calculated using Equations (7) and (8), respectively, with sample results provided in Table 1. The sample NCEi values are lower than the corresponding CEi values for classes (4–6), indicating that the rehabilitation of pavements in these classes will receive higher priority over other classes, as demonstrated later.
The proposed linear PMM in Equation (6) has been solved for different annual budget values, AB, considering the previously described sample pavement network. The optimal solutions are presented in Table 3 based only on the major rehabilitation costs while excluding increased user costs. These solutions were obtained using the software package “Maple 7,” specifically developed for solving linear programming problems. The optimal solution for a $0.5 million annual budget involves solely one rehabilitation variable, X 3 , which corresponds to the lowest cost-effectiveness ratio, CEi. With the annual budget rising to $1.0 million, the optimal solution, in addition to X 3 , has incorporated the variable X 4 , which possesses the next lowest CEi value. The same trend of selecting rehabilitation variables with the lowest CEi values has continued as the allocated annual budget increased. Once the annual budget reached $2.5 million, all pavements in classes 3 to 6 were picked up, but only a portion of class 2 pavement, characterized by the highest CEi, was chosen for rehabilitation. The optimal modified average network IRI value, I R I N , has decreased from 4.56 to 1.76 with the annual budget increasing to $2.5 million.
Table 4 presents sample optimal values of increased road user costs, LC( X i ) and DC( X i ), due to lane closures and severely damaged pavements, respectively, when excluded from consideration in the proposed PMM. It has been assumed that DC(Xi) is only applicable to classes (4–6), which exhibit the worst pavement conditions. The DC(Xi) are estimated for the pavement portions uncovered by the optimal rehabilitation variables (i.e., P i X i ) as defined in Equation (9b). Table 4 indicates that the total costs, DC, are substantially higher than the corresponding LC values, with DC being inversely proportional to the allocated annual budget. The DC vanished when the annual budget reached $2.5 million, although the LC peaked at $0.16 million at the same budget level. This implies that the derivation of an optimal rehabilitation plan that solely accounts for major rehabilitation costs, while ignoring increased user costs, necessitates an annual budget of about $2.5 million to eliminate the annual DC attributable to severely deteriorated pavements.
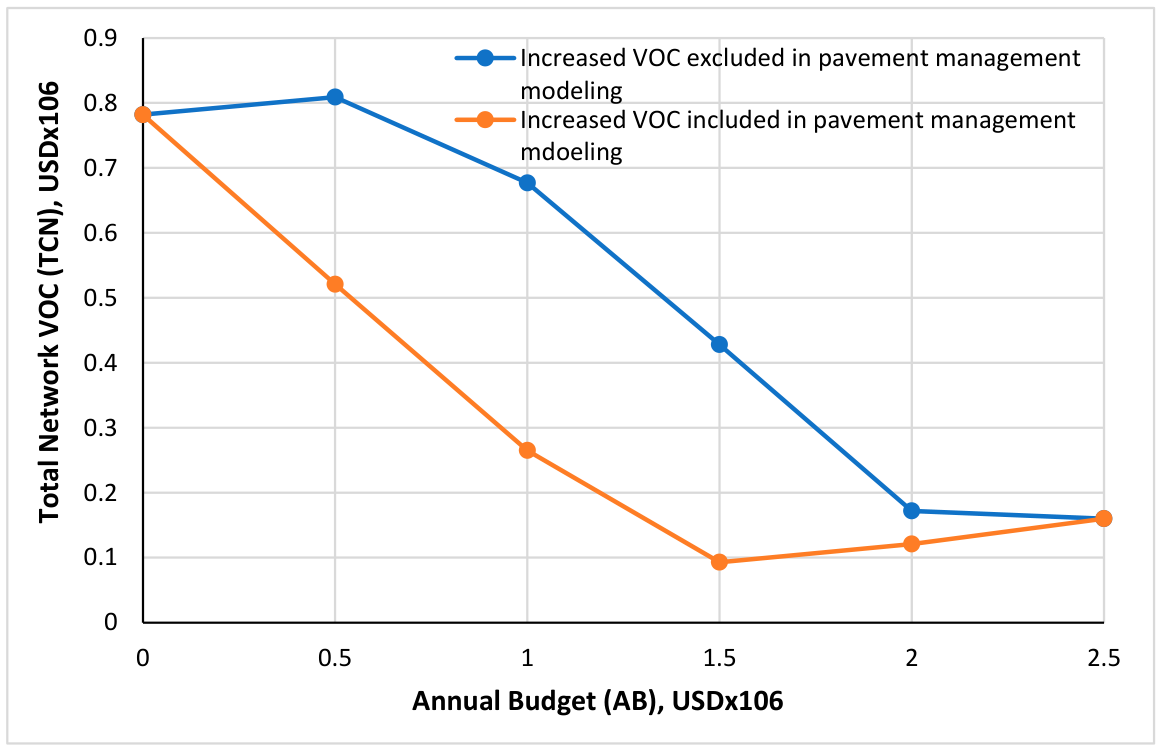
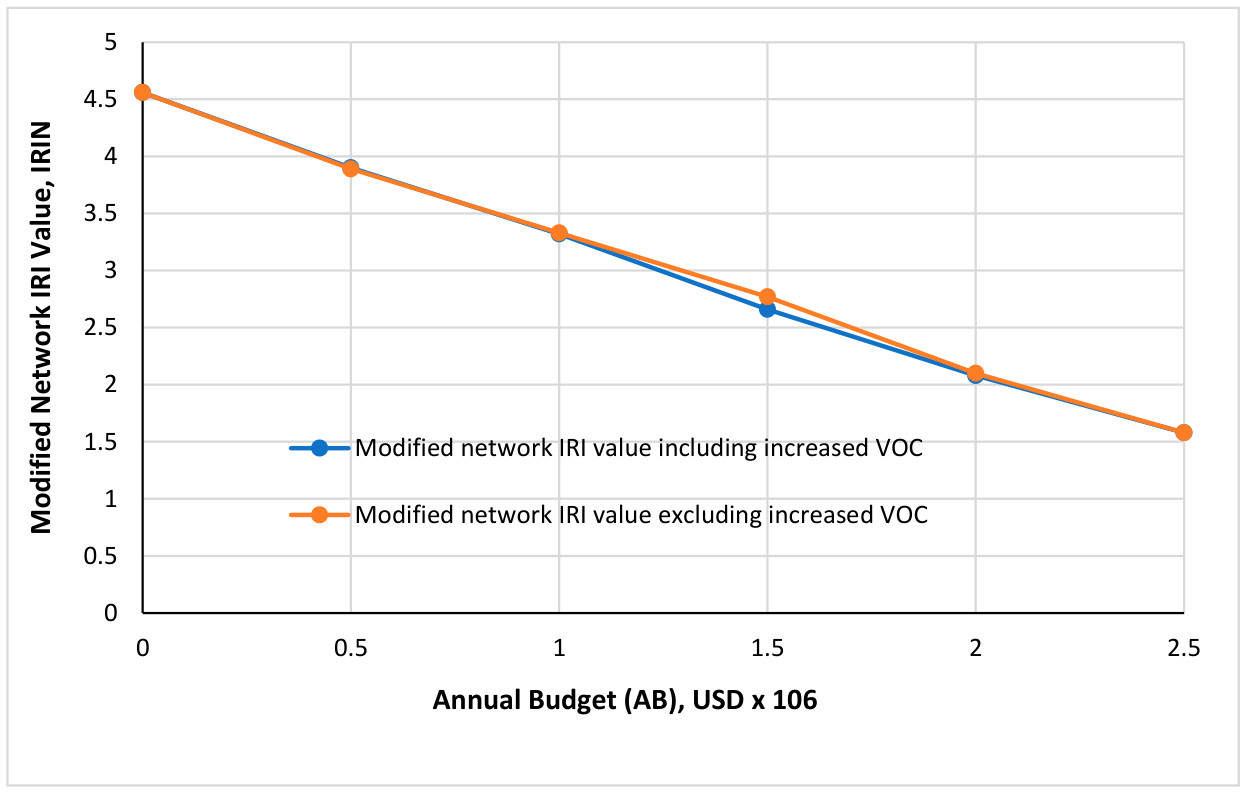
Similarly, Table 5 provides sample optimal solutions obtained with increased road user costs being incorporated in the proposed PMM. The optimal solutions are derived from solving the linear model presented in Equation (6), but the selection of optimal variables is based on the net cost-effectiveness ratio, NCEi, as stated in Equation (8). Table 1 indicates that class 6 has the lowest NCEi value, which is associated with the highest DCi. Class 5 follows with the second-lowest NCEi and the second-highest DCi, a pattern that persists in class 4. Therefore, the optimal solutions provided in Table 5 demonstrate that prioritization of rehabilitation variables is assigned to class 6, followed by class 5, and then class 4. This trend nearly reverses the approach presented in Table 3, thus facilitating the early elimination of elevated VOC levels resulting from severely degraded pavements. The optimal modified network IRI values, I R I N , indicated by Table 5 closely resemble the corresponding values in Table 3, as depicted in Figure 4.
Table 6 presents the increased road user costs, LC( X i ) and DC( X i ), resulting from the inclusion of the corresponding cost units in the derivation of the optimal rehabilitation plans detailed in Table 5. Table 6 indicates that the DC values are significantly lower than those presented in Table 4. The full selection of pavements in classes (4–6) has been achieved at an annual budget of about $1.5 million, in contrast to $2.5 million for the sample results provided in Table 4. However, the LC values closely resemble those presented in Table 4, implying that LC cannot be reduced with an increase in the annual budget. Consequently, the primary savings in road user costs are attributed to the reduction in elevated VOC associated with driving on severely damaged pavements. Figure 5 depicts the correlation between the allocated annual budget, AB, and the total network increased user cost, TCN. The maximum TCN saving of $0.411 million corresponds to an optimal annual budget of $1.0 million, taking into account both lane closures and severely deteriorated pavements. Therefore, the optimal rehabilitation plan outlined in Table 5 for a $1.0 million annual budget is superior to the corresponding one provided in Table 3 in terms of VOC savings. It has also yielded a higher modified average network IRI value, IRIN.
Based on the sample results presented, it can be concluded that the inclusion of increased VOC has provided superior optimal rehabilitation plans, thereby reducing road user costs while improving pavement conditions without additional costs for highway agencies. The optimal annual budget should be calculated considering the increased VOC due to both lane closures and badly damaged pavements, as illustrated in Figure 5. The sample results suggest that major rehabilitation efforts should be directed towards pavements with the worst conditions to avoid increased VOC caused by severely deteriorated pavements; however, this does not imply that highway agencies should postpone major rehabilitation until pavements are in advanced states of deterioration. Provided that sufficient funding is available, timely rehabilitation actions should be carried out to prevent reaching severely deteriorated pavements. Several advanced pavement management models have been developed to provide the optimal timing for implementing rehabilitation works [39,40,41,42,43,44].

5. Validation Using HDM-4 Model and NCHRP Report 720 Model [38]

The key contribution of this study is the integration of increased VOC into pavement management models, necessitating validation of its estimate. In particular, the increased proportionality factor, PF(i), used in Equation (3) to assess the elevated VOC due to pavement deterioration can be validated by established models, such as the HDM-4 model and NCHRP Report 720 Model [38]. The validation utilizing the HDM-4 model was conducted through two approaches.
The first approach is a simplified version of the original HDM-4 model with minimal data inputs. The supplied input data includes fuel prices ($0.85/liter for gasoline and $0.95/liter for diesel), vehicle distribution percentages (70% passenger cars, 15% light trucks, 10% heavy trucks, and 5% buses), along with their corresponding VOC multipliers (1, 1.15, 2.2, and 1.8, respectively). Also, the six pavement classes are provided alongside their associated average IRI values. The base VOC rate is specified as ($0.18/veh·km), which is equivalent to the VOC rate (UCo) of ($180/1000 veh·km) used in the case study presented earlier. Table 7 presents the estimated VOC attributed to pavement deterioration, computed mainly based on the average class IRI value. The increase in VOC is computed with class 1 as the reference (base) class. Essentially, the percentage of increase in VOC is the proportionality factor, PF(i). These VOC increase percentages are generally higher than the PF(i) utilized in the sample presentation for classes 4–6. Nonetheless, they are lower than those assessed in prior studies, with VOC rise ranging from 27 to 45% for deteriorated pavements [3].
The second approach employed is founded on the original HDM-4 Road User Cost model (HDM-4 RUC) Version 5. The HDM-4 RUC is an Excel-based model designed to estimate the road user cost for various vehicle types, road conditions, vehicle speeds, fuel consumption, and road geometry. The IRI serves as the pavement condition indicator. The calculated road user cost includes VOCs, passenger time costs, and costs associated with emissions and accidents. The data requirements are very extensive, with about 400 input items that need to be provided. For this sample presentation, the class IRI values are provided; however, most of the necessary input data remains unchanged, according to the default values specified in the Excel sheet. Table 8 presents the VOC component along with the percentage rise in VOC. The VOCs are slightly lower than the corresponding values in Table 7, although the proportionality factors (i.e., VOC increases) are higher for classes 4–6. The calculated VOC increase percentages are lower than the maximum VOC increase estimated in previous studies, including the study by [3], which reported a VOC increase ranging from 27 to 45%.
Additionally, the increased proportionality factor, PF(i), employed in Equation (3) to calculate the increased VOC due to pavement deterioration can be validated using the NCHRP Report 720 Model [38]. An increase in roughness of around 1 m/km IRI correlates with a 2–3% rise in VOC, contingent upon traffic speed and vehicle classification. Therefore, the increase in VOC for pavement classes 4, 5, and 6 is determined as 10.51–15.81%, 14.54–21.81%, and 21.7–32.55%, respectively. This further verifies that the PF(i) values utilized in the case study are lower than those calculated using the NCHRP Report 720 Model [38].
The use of higher PF(i) values, derived from either the simplified or original HDM-4 model or the NCHRP Report 720 Model, in the proposed pavement management model is expected to result in increased network VOC savings, as demonstrated in the subsequent section. Hence, this underscores the significance of incorporating the VOC into pavement management models for scheduling rehabilitation activities.

6. Sensitivity Analysis

The impact of key input parameters on the increased VOC has been investigated using three different sensitivity analyses. The results associated with the three analyses were compared to the results obtained from the base case presented earlier. The first sensitivity analysis entailed modifying the increased VOC proportionality factors, PF(i), from (0.05, 0.10, 0.15) to (0.10, 0.15, 0.20), with other input data remaining the same. The results provided in Table 9 demonstrate that the net savings in total network VOC, ΔTCN, have increased relative to the corresponding values for the base case. The maximum savings remain associated with a one-million annual budget, having risen from $0.411 million to $0.721 million. The pavement network IRI values, IRIN, tend to be higher with the inclusion of increased VOCs; however, they remain comparable to those of the base scenario. It can be concluded that increasing the proportionality factors has resulted in higher network savings, as expected.
The second sensitivity analysis involved increasing the ADT from 12,000 to 18,000 vpd, resulting in an average hourly volume (AHV) of 1200 vph. The increase in ADT is predicted to coincide with a 20% rise in rehabilitation cost rates (RCi). Table 10 indicates that the maximum network VOC savings, ΔTCN, have increased from $0.411 million to $0.673 million, which again corresponds to the case of a one-million annual budget. A 50% rise in ADT and a 20% increase in rehabilitation cost rates have led to a 63.75% increase in the maximum network VOC savings. A direct relationship between ADT and ΔTCN is generally expected. The average network IRI values, IRIN, are higher with the inclusion of increased VOC.
The third sensitivity analysis entails increasing the relevant VOC rates (UCS, UCI, UCO) by 20%. The sample results associated with this analysis are presented in Table 11. The maximum cost savings, ΔTCN, have increased from $0.411 million to $0.490 million, based on a one-million annual budget. A 20% rise in VOC rates has resulted in about a 19.2% increase in the maximum network VOC savings, indicating a direct correlation between VOC rates and network VOC savings. Similarly, the average network IRI values are higher when VOC is included.
The results from the three sensitivity analyses indicate that the main input parameters (PF(i), ADT, RCi, VOC rates) are directly correlated with the expected network VOC savings when increased VOC is incorporated into the analysis. The inclusion of VOC has also led to an improvement in the average network IRI value.

7. Limitations of VOC Estimation

The proposed models for estimating the increased VOC due to work-zone lane closures and pavement deterioration include some limitations. The relevant cost rates should be estimated to reflect the traffic composition, which typically includes passenger cars, light trucks, heavy trucks, buses, and other vehicles, each with different fuel types and consumption levels. The elevated VOC rates employed in the sample presentation, considering work-zone closures, were derived from the 1977 edition of the AASHTO Red Book; nevertheless, numerous modifications concerning vehicle types, weights, and fuel types and efficiency have occurred since then. Therefore, it is recommended to seek updated models/procedures for estimating the necessary VOC rates, such as the HDM-4 and NCHRP Report 720 models.
The proposed model for calculating the increased VOC due to lane closure is only applicable to two-lane rural highways, where traffic from each direction will experience deceleration, idling, and acceleration. If a shoulder is designated as an emergency travel lane, the sole increase in VOC results from the speed reduction incurred while traversing the work zone. However, the proposed model for estimating the increased VOC due to pavement deterioration applies to all highway types. The proposed models for increased highway user costs have only focused on vehicle operating cost components, neglecting additional costs such as travel time, accident costs, and environmental implications.
The main conclusion drawn from the sample presentation is that the inclusion of increased VOCs has provided superior optimal solutions at no additional costs for highway agencies. It must be emphasized that this conclusion is only relevant to the case study presented in this paper and may differ when applied to other case studies. However, it is expected that this conclusion will prevail as long as the increased VOCs are substantial, which is mostly dependent on traffic volumes (ADT) and relevant VOC rates as required by Equations (1) and (3).

8. Conclusions and Recommendations

The proposed simplified PMM has been used to provide optimal pavement rehabilitation plans for variable annual budget values, considering a single time horizon of one year. The optimal solutions obtained from the linear PMM program are directly dependent on the proposed cost-effectiveness ratios, prioritizing the rehabilitation variables with the lowest CEi and NCEi values for selection. The optimal solutions, when excluding the increased VOC, are associated with substantially higher VOC increases resulting from travel on severely deteriorated pavements. Allocating a $2.5 million annual budget is necessary to eliminate this increased VOC component while disregarding the added VOC. In contrast, the optimal solutions, in the case of including the elevated VOC, are associated with considerably lower increased VOC due to severely deteriorated pavements. An annual budget of $1.5 million is required to eradicate this increased VOC element. Essentially, the optimization process has shifted the rehabilitation funding towards the poor/bad pavements to mitigate the increased VOC resulting from badly damaged pavements. The optimal solutions correspond to higher modified average network IRI values, I R I N , when increased VOC is included. The optimal rehabilitation plan is the one associated with the maximum savings in the total network VOC. It is the plan associated with a $1.0 million annual budget, as it has yielded a maximum VOC saving of $0.411 million.
Therefore, it can be inferred from the presented case study that the inclusion of increased VOC has provided superior optimal solutions without incurring more expenses for highway agencies. It is recommended that highway agencies consider integrating the increased VOC as suggested in this study. The data required to estimate the relevant increased VOC is readily available to highway agencies, including the three key user cost units (i.e., UCS, UCI, UCO), which can be assessed utilizing published procedures based on local market pricing. The proposed simplified PMM has been formulated as a function of the IRI because the IRI has gained international recognition. Nevertheless, the IRI may be replaced by other widely used performance indicators such as the PSI and PCI. In this case, the optimization modeling requires maximizing, in lieu of minimizing, the objective function formulated as the sum of two components: the current average network PSI/PCI rating and the improvement gain in the average network PSI/PCI value.
The proposed models for estimating the increased VOC due to lane closures and severely deteriorated pavements can be incorporated in any pavement management model in a way analogous to that demonstrated in this paper. In particular, the optimization problem must be solved to account for the elevated VOC due to deteriorated pavements that are not chosen for rehabilitation. The case study examined a singular time frame, but advanced pavement management models are typically designed to yield a long-term M&R schedule for an extended analysis period. The same procedure applied to a single year can be employed for subsequent future years, wherein the output of one year serves as the input for the following year, especially in terms of the pavement proportions (Pi) and the expected average class IRI values ( I R I ¯ i   ) across various classes. The increased VOC rates should be adjusted for each year to reflect changes in traffic volumes and vehicle types and percentages. Also, it requires accounting for the increased pavement rehabilitation cost rates due to inflation. Internationally recognized models such as the HDM-4 and NCHRP Report 720 can be utilized to estimate the relevant VOC rates.

Author Contributions

Conceptualization, K.A.A.; Methodology, K.A.A. and M.S.Y.; Software, M.S.Y. and K.A.A.; Validation, K.A.A. and M.S.Y.; Formal analysis, K.A.A. and M.S.Y.; Resources, M.S.Y. and K.A.A., Data curation, K.A.A.; Writing—original draft, K.A.A.; Writing—review & editing, K.A.A. and M.S.Y.; Project administration, K.A.A. All authors have read and agreed to the published version of the manuscript.

Funding

This research received no external funding.

Data Availability Statement

The data that support the findings of this study are available from the corresponding author upon reasonable request.

Conflicts of Interest

The authors report that there are no competing interest to declare.

References

  1. Abaza, K.A.; Murad, M.M. Dynamic probabilistic approach for long-term pavement restoration program with added user cost. Transp. Res. Rec. 2007, 1990, 48–56. [Google Scholar] [CrossRef]
  2. Islam, S.; Buttlar, W.G. Effect of pavement roughness on user costs. Transp. Res. Rec. 2012, 2285, 47–55. [Google Scholar] [CrossRef]
  3. Ahmed, A.; Bai, Q.; Lavrenz, S.; Labi, S. Estimating the marginal cost of pavement damage by highway users on the basis of practical schedules for pavement maintenance, rehabilitation and reconstruction. Struct. Infrastruct. Eng. 2015, 11, 1069–1082. [Google Scholar] [CrossRef]
  4. Guan, X.; Zhang, H.; Du, X.; Zhang, X.; Sun, M.; Bi, Y. Optimization for asphalt pavement maintenance plans at network level: Integrating maintenance funds, pavement performance, road users, and environment. Appl. Sci. 2023, 13, 8842. [Google Scholar] [CrossRef]
  5. Jiang, X.; Adeli, H. Freeway work zone traffic delay and cost optimization model. J. Transp. Eng. 2003, 129, 230–241. [Google Scholar] [CrossRef]
  6. Choi, J. Road User Costs for highway construction projects involving a lane closure. Sustainability 2020, 12, 3084. [Google Scholar] [CrossRef]
  7. Tiwari, A.; Ansari, M.T.; Cook, A.; Hedden, J.; Ogundipe, T.; Ortlieb, J.; Nunez, T.; Roy, A.; Turben, T.; Braham, A. Comparative life-cycle cost analysis of flexible and rigid pavement: A case study of four Arkansas roadway sections. Int. J. Pavement Eng. 2025, 26, 2489044. [Google Scholar] [CrossRef]
  8. Abdelmohsen, A.Z.; El-Rayes, K. Optimal trade-offs between construction cost and traffic delay for highway work zones. J. Constr. Eng. Manag. 2016, 142, 05016004. [Google Scholar] [CrossRef]
  9. Chien, S.; Tang, Y.; Schonfeld, P. Optimizing work zones for two-lane highway maintenance projects. J. Transp. Eng. 2002, 128, 145–155. [Google Scholar] [CrossRef]
  10. Yin, Y.; Choi, K.; Lee, Y.C.; Jeong, H.D.; Liu, X. Determining the most economical work zone lengths for rural highway rehabilitation projects. J. Manag. Eng. 2023, 39, 06022002. [Google Scholar] [CrossRef]
  11. Abaza, K.A.; Murad, M.M. Pavement rehabilitation project ranking approach using probabilistic long-term performance indicators. Transp. Res. Rec. 2010, 2153, 3–12. [Google Scholar] [CrossRef]
  12. Jorge, D.; Ferreira, A. Road network pavement maintenance optimization using the HDM-4 pavement performance prediction models. Int. J. Pavement Eng. 2012, 13, 39–51. [Google Scholar] [CrossRef]
  13. Hankach, P.; Lorino, T.; Gastineau, P. A constraint-based, efficiency optimisation approach to network-level pavement maintenance management. Struct. Infrastruct. Eng. 2019, 15, 1450–1467. [Google Scholar] [CrossRef]
  14. Xin, J.; Frangopol, D.M.; Akiyama, M.; Zhang, L.; Pei, J. Life-cycle performance, design, maintenance, optimization, and decision-making of asphalt pavement under uncertainty: A review. Struct. Infrastruct. Eng. 2026, 22, 358–386. [Google Scholar]
  15. Khavandi Khiavi, A.; Mohammadi, H. Multi-objective optimization in pavement management system using NSGA-II method. J. Transp. Eng. Part B Pavements 2018, 144, 04018016. [Google Scholar] [CrossRef]
  16. Abaza, K.A.; Ferreira, A. An optimal stochastic decision-making model incorporating pavement maintenance and rehabilitation works. Road Mater. Pavement Des. 2026, 27, 501–520. [Google Scholar] [CrossRef]
  17. Abed, A.; Thom, N.; Neves, L. Probabilistic prediction of asphalt pavement performance. Road Mater. Pavement Des. 2019, 20, S247–S264. [Google Scholar] [CrossRef]
  18. Abaza, K.A. Empirical-Markovian approach for estimating the flexible pavement structural capacity: Caltrans method as a case study. Int. J. Transp. Sci. Technol. 2021, 10, 156–166. [Google Scholar] [CrossRef]
  19. Fuentes, L.; Camargo, R.; Arellana, J.; Velosa, C.; Martinez, G. Modelling pavement serviceability of urban roads using deterministic and probabilistic approaches. Int. J. Pavement Eng. 2021, 22, 77–86. [Google Scholar]
  20. Ali, A.A.; Milad, A.; Hussein, A.; Yusoff, N.I.M.; Heneash, U. Predicting pavement condition index based on the utilization of machine learning techniques: A case study. J. Road. Eng. 2023, 3, 266–278. [Google Scholar] [CrossRef]
  21. Yamany, M.S.; Abraham, D.M.; Nantung, T.E.; Labi, S.; Abaza, K.A. Probabilistic Modeling of Pavement Performance Using Markov Chains: A Critical Review. Int. J. Pavement Eng. 2025, 26, 2548321. [Google Scholar] [CrossRef]
  22. Hong, S.; Cho, J.; Yu, K.; Sohn, D.; Kim, I. State-Dependent Asphalt Pavement Deterioration Modeling via Noise-Filtered Reaction Signatures: A Data-Driven Framework Using Korea Highway Pavement Management System (K-HPMS) Data. Infrastructures 2026, 11, 15. [Google Scholar] [CrossRef]
  23. Saha, P.; Ksaibati, K. A risk-based optimisation methodology for pavement management system of county roads. Int. J. Pavement Eng. 2016, 17, 913–923. [Google Scholar]
  24. Dalla Rosa, F.; Liu, L.; Gharaibeh, N.G. IRI prediction model for use in network-level pavement management systems. J. Transp. Eng. Part B Pavements 2017, 143, 04017001. [Google Scholar] [CrossRef]
  25. Miah, M.T.; Oh, E.; Chai, G.; Bell, P. An overview of the airport pavement management systems (APMS). Int. J. Pavement Res. Technol. 2020, 13, 581–590. [Google Scholar] [CrossRef]
  26. Issa, A.; Sammaneh, H.; Abaza, K. Modeling pavement condition index using cascade architecture: Classical and neural network methods. Iran. J. Sci. Technol. Trans. Civ. Eng. 2022, 46, 483–495. [Google Scholar]
  27. Abaza, K.A.; Assi, N.A. IRI data used in optimum pavement rehabilitation models for developing countries: Palestine as a case study. Int. J. Civ. Eng. 2024, 22, 2343–2359. [Google Scholar] [CrossRef]
  28. Dewan, S.A.; Smith, R.E. Estimating IRI from pavement distresses to calculate vehicle operating costs for the cities and counties of San Francisco Bay area. Transp. Res. Rec. J. Transp. Res. Board 2002, 1816, 65–72. [Google Scholar] [CrossRef]
  29. Elhadidy, A.A.; El-Badawy, S.M.; Elbeltagi, E.E. A simplified pavement condition index regression model for pavement evaluation. Int. J. Pavement Eng. 2021, 22, 643–652. [Google Scholar]
  30. Adeli, S.; Najafi Moghaddam Gilani, V.; Kashani Novin, M.; Motesharei, E.; Salehfard, R. Development of a Relationship between Pavement Condition Index and International Roughness Index in Rural Road Network. Adv. Civ. Eng. 2021, 2021, 6635820. [Google Scholar] [CrossRef]
  31. American Association of State Highway and Transportation Officials (AASHTO). A Manual on User Benefit Analysis of Highway and Bus-Transit Improvements, 1977; American Association of State Highway and Transportation Officials: Washington, DC, USA, 1978. [Google Scholar]
  32. Anderson, D.G.; Curry, D.A.; Pozdena, R.J. User Benefit Analysis for Highway and Bus Transit Improvements; Final Report NCHRP Project 2–12; Stanford Research Institute: Menlo Park, CA, USA, 1977. [Google Scholar]
  33. Nariendra, P.W.; Lestiani, M.E. Calibration of HDM-4 Model for Fuel Consumption in Heavy-Duty Trucks: Integration of Telematics, Engine Speed, and Aerodynamics. Automot. Exp. 2025, 8, 109–121. [Google Scholar] [CrossRef]
  34. Anand, S.; Gaur, A.; Hussain, S. Pavement deterioration modelling for urban and rural roads using HDM-4. Int. J. Pavement Res. Technol. 2025, 18, 493–515. [Google Scholar]
  35. Zaabar, I.; Chatti, K. Estimating Vehicle Operating Costs Caused by Pavement Surface Conditions. Transp. Res. Rec. J. Transp. Res. Board 2014, 2455, 63–76. [Google Scholar] [CrossRef]
  36. Pasha, A.; Mansourian, A.; Ravanshadnia, M. Evaluation of work zone road user cost of pavements based on rehabilitation strategy approach. J. Transp. Eng. Part B Pavements 2021, 147, 04021015. [Google Scholar] [CrossRef]
  37. Kerali, H.G.R. Highway Development and Management (HDM-4). In Overview of HDM-4; World Road Association (PIARC): Paris, France; World Bank: Washington, DC, USA, 2000; Volume 1. [Google Scholar]
  38. Chatti, K.; Zaabar, I. Estimating the effects of pavement condition on vehicle operating costs (NCHRP Report 720). In Transportation Research Board, National Research Council; National Academies Press: Washington, DC, USA, 2012. [Google Scholar] [CrossRef] [PubMed]
  39. Deshpande, V.P.; Damnjanovic, I.D.; Gardoni, P. Reliability-based optimization models for scheduling pavement rehabilitation. Comput.-Aided Civ. Infrastruct. Eng. 2010, 25, 227–237. [Google Scholar] [CrossRef]
  40. Donev, V.; Hoffmann, M. Optimization of pavement maintenance and rehabilitation activities, timing and work zones for short survey sections and multiple distress types. Int. J. Pavement Eng. 2020, 21, 583–607. [Google Scholar]
  41. Abaza, K.A. A novel life-cycle analysis approach using pavement performance curves with cost and performance considerations. Int. J. Sustain. Eng. 2024, 17, 778–792. [Google Scholar] [CrossRef]
  42. Xiao, F.; Chen, X.; Yang, S.; Cheng, J. Bi-objective pavement maintenance and rehabilitation optimization decision-making model incorporating the construction length of preventive maintenance projects. Struct. Infrastruct. Eng. 2025, 21, 24–38. [Google Scholar]
  43. Huang, M.; Dong, Q.; Ni, F.; Wang, L. LCA and LCCA based multi-objective optimization of pavement maintenance. J. Clean. Prod. 2021, 283, 124583. [Google Scholar] [CrossRef]
  44. Orabi, J.; Shatila, W. Life cycle assessment and life cycle cost analysis for airfield pavement: A review article. Innov. Infrastruct. Solut. 2024, 9, 195. [Google Scholar] [CrossRef]
Figure 1. Pavement rehabilitation work zone for a two-lane rural highway.
Infrastructures 11 00238 g001
Figure 2. Idling cost unit as a function of vehicle holding time.
Infrastructures 11 00238 g002
Figure 3. Stopping cost unit as a function of vehicle approach speed.
Infrastructures 11 00238 g003
Figure 4. Modified average network IRI value as a function of allocated annual budget.
Infrastructures 11 00238 g004
Figure 5. Total network cost as a function of allocated annual budget.
Infrastructures 11 00238 g005
Table 1. Sample IRI statistics for investigated sample pavement network.
StatisticPavement ClassesTotal
Class 1
(IRI = 0–2)
Class 2 (IRI = 2–4)Class 3
(IRI = 4–6)
Class 4
(IRI = 6–8)
Class 5
(IRI = 8–10)
Class 6 IRI > 10
Ni15264952222096651466410,840
Pi0.1410.4570.2050.0890.0470.0611.00
I R I ¯ i   (m/km)1.632.944.886.908.9012.48----- a
LCi (USD/m2)-----0.830.831.661.664.15-----
DCi (USD/m2)-----0010.9421.9032.84-----
CEi-----5.153.864.695.064.79-----
Priority ranking-----51243-----
NCEi-----5.584.083.002.502.29-----
Notes: IRI is measured in m/km; a Not applicable.
Table 2. Definition of various pavement classes and applicable rehabilitation plans.
Class i IRI Range
(m/km)
Rehabilitation Strategy Rehab. Variable Cost Unit (RCi)
USD/m2
NSi
10–2------ a----------------
22–42 cm HMA plain overlayX2101
34–63 cm HMA plain overlayX3151
46–8Cold milling of 3 cm and placement of new HMAX4272
58–10Cold milling of 5 cm and placement of new HMAX5402
6>10Removal of existing asphalt surface, adding aggregate leveling course, and placement of 10 cm new HMA X6555
a Not applicable.
Table 3. Sample optimal rehabilitation plans with increased VOC neglected.
Annual Budget (USD × 106)Optimal Solutions
X 2 X 3 X 4 X 5 X 6 I R I N (m/km)
0.0000004.56
0.500.1710003.90
1.000.2050.076003.32
1.500.2050.08900.0402.78
2.000.2050.0890.0350.0612.26
2.50.2100.2050.0890.0470.0611.76
Table 4. Sample total network cost when increased VOC is neglected in the proposed PMM.
Annual Budget (USD × 106)Increased VOC TypeIncreased VOC for the ith Optimal Rehabilitation Variable, USD × 106 Total Costs
(LC and DC)
Total Network VOC (TCN)
X 2 X 3 X 4 X 5 X 6
0.0LC( X i )
DC( X i )
0.000
0.000
0.000
0.000
0.000
0.190
0.000
0.201
0.000
0.391
0.000
0.782
0.782
0.5LC( X i )
DC( X i )
0.000
0.000
0.028
0.000
0.000
0.190
0.000
0.200
0.000
0.391
0.028
0.781
0.809
1.0LC( X i )
DC( X i )
0.000
0.000
0.033
0.000
0.025
0.028
0.000
0.200
0.000
0.391
0.058
0.619
0.677
1.5LC( X i )
DC( X i )
0.000
0.000
0.033
0.000
0.029
0.000
0.000
0.200
0.032
0.134
0.094
0.334
0.428
2.0LC( X i )
DC( X i )
0.000
0.000
0.033
0.000
0.029
0.000
0.011
0.051
0.049
0.000
0.122
0.052
0.172
2.5LC( X i )
DC( X i )
0.034
0.000
0.033
0.000
0.029
0.000
0.015
0.000
0.049
0.000
0.160
0.000
0.160
Table 5. Sample optimal rehabilitation plans with increased VOC incorporated.
Annual Budget (USD × 106)Optimal Solutions
X 2 X 3 X 4 X 5 X 6 I R I N (m/km)
0.0000004.56
0.500000.0464.02
1.00000.0440.0613.51
1.500.0030.0890.0470.0612.95
2.000.1740.0890.0470.0612.29
2.50.2100.2050.0890.0470.0611.76
Table 6. Sample total network cost when increased VOC is incorporated in the proposed PMM.
Annual Budget (USD × 106)Increased VOC TypeIncreased VOC for the ith Optimal Rehabilitation Variable, USD × 106 Total Costs
(LC and DC)
Total Network VOC (TCN)
X 2 X 3 X 4 X 5 X 6
0.0LC( X i )
DC( X i )
0.000
0.000
0.000
0.000
0.000
0.190
0.000
0.201
0.000
0.391
0.000
0.781
0.782
0.5LC( X i )
DC( X i )
0.000
0.000
0.000
0.000
0.000
0.190
0.000
0.200
0.037
0.096
0.037
0.486
0.523
1.0LC( X i )
DC( X i )
0.000
0.000
0.000
0.000
0.000
0.190
0.014
0.013
0.049
0.000
0.063
0.203
0.266
1.5LC( X i )
DC( X i )
0.000
0.000
0.000
0.000
0.029
0.000
0.015
0.000
0.049
0.000
0.093
0.000
0.093
2.0LC( X i )
DC( X i )
0.000
0.000
0.028
0.000
0.029
0.000
0.015
0.000
0.049
0.000
0.121
0.000
0.121
2.5LC( X i )
DC( X i )
0.034
0.000
0.033
0.000
0.029
0.000
0.015
0.000
0.049
0.000
0.160
0.000
0.160
Table 7. Sample VOC output data using a simplified version of the HDM-4 model.
Class
Number
Class
Average IRI
Class
Proportion (Pi)
VOC ($/veh·km)VOC Increase (%)
11.630.1410.2160
22.940.4570.2233.22
34.880.2050.2338.00
46.90.0890.24412.97
58.90.0470.25517.89
612.480.0610.27426.70
Table 8. Sample VOC output data using the original version of the HDM-4 model.
Class
Number
Class
Average IRI
Class
Proportion (Pi)
VOC ($/veh·km)VOC Increase (%)
11.630.1410.1670
22.940.4570.1680.60
34.880.2050.1807.78
46.90.0890.19114.37
58.90.0470.20422.16
612.480.0610.23339.52
Table 9. Sample results associated with increased VOC proportionality factors, PF(i).
Annual Budget (USD × 106)Total Network VOC (TCN), USD × 106
0.51.01.52.02.5
Increased VOC excluded1.4611.1670.6740.6680.632
Increased VOC included0.8170.4460.0930.1210.160
ΔTCN0.6440.7210.5810.5470.472
IRIN (VOC excluded)3.903.322.782.261.76
IRIN (VOC included)4.043.492.952.291.76
Table 10. Sample results associated with increased ADT and RCi.
Annual Budget (USD × 106)Total Network VOC (TCN), USD × 106
0.51.01.52.02.5
Increased VOC excluded1.2071.1020.8380.5120.194
Increased VOC included0.8460.4290.2630.1540.188
ΔTCN0.3610.6730.5750.3580.006
IRIN (VOC excluded)4.013.503.052.602.17
IRIN (VOC included)4.113.683.232.732.18
Table 11. Sample results associated with increased VOC rates (UCS, UCI, UCO).
Annual Budget (USD × 106)Total Network VOC (TCN), USD × 106
0.51.01.52.02.5
Increased VOC excluded0.9710.8080.5080.2000.186
Increased VOC included0.6250.3180.1060.1390.186
ΔTCN0.3460.4900.4020.0610.00
IRIN (VOC excluded)3.893.322.792.261.76
IRIN (VOC included)4.023.512.952.291.76
Disclaimer/Publisher’s Note: The statements, opinions and data contained in all publications are solely those of the individual author(s) and contributor(s) and not of MDPI and/or the editor(s). MDPI and/or the editor(s) disclaim responsibility for any injury to people or property resulting from any ideas, methods, instructions or products referred to in the content.