


Abstract
The deflection of prestressed (pretensioned) concrete members strengthened with FRP requires a comprehensive evaluation. An extensive parametric study is performed using a rigorous analysis procedure based on a trilinear moment-curvature approach. There are 8100 pretensioned concrete beams analyzed by varying the cross-section dimensions, span length-to-depth ratio, shear span-to-span ratio, concrete compressive strength, prestressing reinforcement ratio, FRP strengthening ratio and FRP material properties. It was determined that the normalized effective moment of inertia at first yielding is statistically correlated with the normalized cracked moment of inertia, with an almost-perfect regression (R2 = 0.9886). It was further found that when postulating the inverse of the effective moment of inertia in terms of a parabolic function of the beam maximum moment, the deflections of the cracked beam agree closely with experimental deflections. Boundary conditions for that equation are applied at the cracking and prestress-yielding points. Ultimately, it was realized that the immediate deflection predictions based on the modified beam effective moment of inertia expression proposed yield reliable deflection estimates for cracked prestressed members externally strengthened with FRP, compared with experimental results and other analytical predictions.
1. Introduction
Serviceability behavior, particularly deflection, is a critical aspect of the performance of prestressed, pretensioned, concrete (PC) members. The response is governed by the interaction of cracking, nonlinear stiffness degradation, and time-dependent effects, including creep, shrinkage, and relaxation. In PC members, these effects are further influenced by the amount of pretensioning, which introduces initial camber and modifies stress and strain distributions throughout the loading history. Externally strengthening PC flexural members with FRP further complicates stiffness prediction.
The early work of Dan E. Branson [1,2] established a practical framework for deflection analysis for reinforced concrete flexural members based on an effective stiffness representation that accounts for the transition between uncracked and cracked behavior. While widely used in design practice, this approach represents stiffness in an averaged sense and does not explicitly describe the evolution of sectional response along the member. Subsequent developments introduced more refined descriptions of behavior through time-dependent effects and sectional analysis. Tadros et al. [3] demonstrated the importance of coupling prestress loss, creep, and shrinkage with curvature-based formulations, while early experimental studies identified creep as a dominant contributor to long-term deformation [4].
At service load levels, partially PC members often crack. Current code provisions recognize this behavior, although the prediction of deflection in cracked PC members remains uncertain [5,6,7]. Various analytical approaches have been proposed, including partially cracked section analysis, effective stiffness formulations, and simplified bilinear representations of response [8,9,10]. However, these approaches are generally based on global stiffness assumptions and do not fully capture the variation in stiffness and curvature along the member.
More recent work has emphasized the importance of describing behavior in terms of sectional response and curvature. Moment–curvature-based formulations provide a consistent representation of stiffness evolution, particularly in the presence of cracking and partial prestressing [7]. Similarly, the work of Antoine E. Naaman [11] and Ghali and Favre [12] demonstrated that mechanics-based approaches provide a more rational basis for describing deformation than do simplified stiffness-interpolation methods, thus inspiring further plausible developments along these lines.
The integration of the curvature distribution along the shear span to obtain accurate deflection expressions for reinforced concrete members strengthened with FRP was first introduced at the turn of this century [13]. Charkas et al. [14] introduced a trilinear moment-curvature method that integrated the curvature distribution to develop closed-form detection expressions for the post-cracking and post-yielding stages of loading. This work was followed by another study that introduced the concept of correlating the member’s effective moment of inertia at first yielding with the cracking moment of inertia and the member’s effective moment of inertia at the ultimate capacity with the ultimate moment-curvature values at the critical section [15]. That development facilitated more reliable deflection computations based on simple design-oriented variables, such as the cracked moment of inertia and the ultimate sectional moment-curvature values [15].
Building on that work, Kramer and Rasheed [16] developed analytical expressions for the load–deflection behavior of straight-strand PC girders strengthened with externally bonded FRP. They adapted the trilinear moment–curvature formulation, demonstrating that simplified mechanics-based approaches can accurately capture both sectional response and short-term deflection behavior. This latter work was further extended to analyze PC girders with harped strands externally strengthened with FRP [17]. Although these investigations established the accuracy and versatility of trilinear moment-curvature analysis for PC-FRP members, they relied on detailed sectional analyses and analytical or numerical integration procedures that are not well-suited for routine design applications.
The primary contribution of the present study is the development of a design-oriented procedure. Based on an extensive parametric study of 8100 PC-FRP beams utilizing the rigorous trilinear approach, the design-oriented procedure was realized. The study establishes a closed-form relationship for the moment of inertia at the first prestressing steel yielding, Iey, and incorporates this parameter into a modified effective moment-of-inertia expression, thereby permitting direct calculation of immediate deflections using conventional beam theory. The proposed methodology was further evaluated against experimental results and was shown to accurately predict the short-term deflection response of rectangular PC-FRP members with straight strands.
ACI PRC-440.2-23 focuses on maintaining elastic behavior under service load conditions without improving the immediate deflection calculation procedure beyond Branson or Bischoff equations [18]. Despite the inherent complexities of calculating the deflection of progressively cracking non-prestressed and partially PC flexural members externally strengthened with FRP (PC-FRP), a reliable method for design engineers to compute immediate deflections is needed.
The novelty of the present study addresses this gap by translating the rigor of previously developed trilinear moment–curvature formulations into a practical design procedure, introducing a design-oriented model that closely captures the post-cracking response of experimentally tested and analytically predicted members. In doing so, this model provides a unified mechanics-based framework that captures the behavior of PC-FRP members while maintaining computational efficiency suitable for practical design and assessment applications.
It is worth noting that the effectiveness of externally bonded FRP systems is influenced by bond quality, anchorage detailing, fabrication procedures, and environmental conditions, as highlighted in recent studies on FRP anchorage systems [19,20]. These factors are out of the scope of this paper.
2. Rigorous Deflection Computation
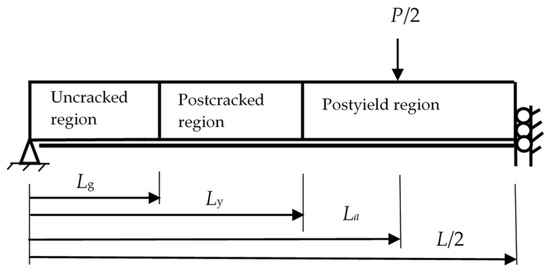
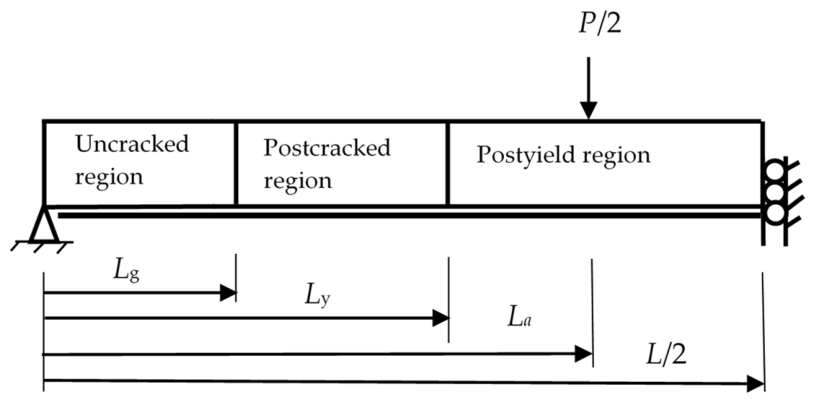
Kramer and Rasheed’s paper [16] developed an analytical framework to predict the full load-deflection behavior of PC-FRP by replacing fully nonlinear sectional analysis with an idealized trilinear moment-curvature relationship. The analytical solution demonstrated that simplified mechanics-based formulations could accurately capture the nonlinear stiffness gradient associated with cracking and yielding while remaining suitable for practical design computations. The study also showed that simplified closed-form deflection expressions could yield results comparable to rigorous nonlinear analysis while significantly reducing computational complexity, thereby providing a rational basis for, or improving, traditional effective-moment approaches derived from Branson’s effective-moment-of-inertia equation for PRC-FRP members. This simplification divides the response into three physically meaningful regions: uncracked, postcracked, and postyield, as shown in Figure 1, where Lg is the distance from support to location of cracking moment, Ly is the distance from support to location of yielding moment, La is the shear span—distance from support to point of loading in four-point bending, L is the span length, and P is the applied load.
Figure 1.
Beam elevation indicating the three unique stiffness regions.
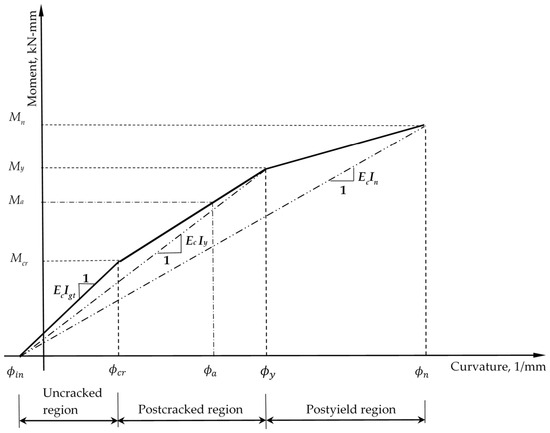
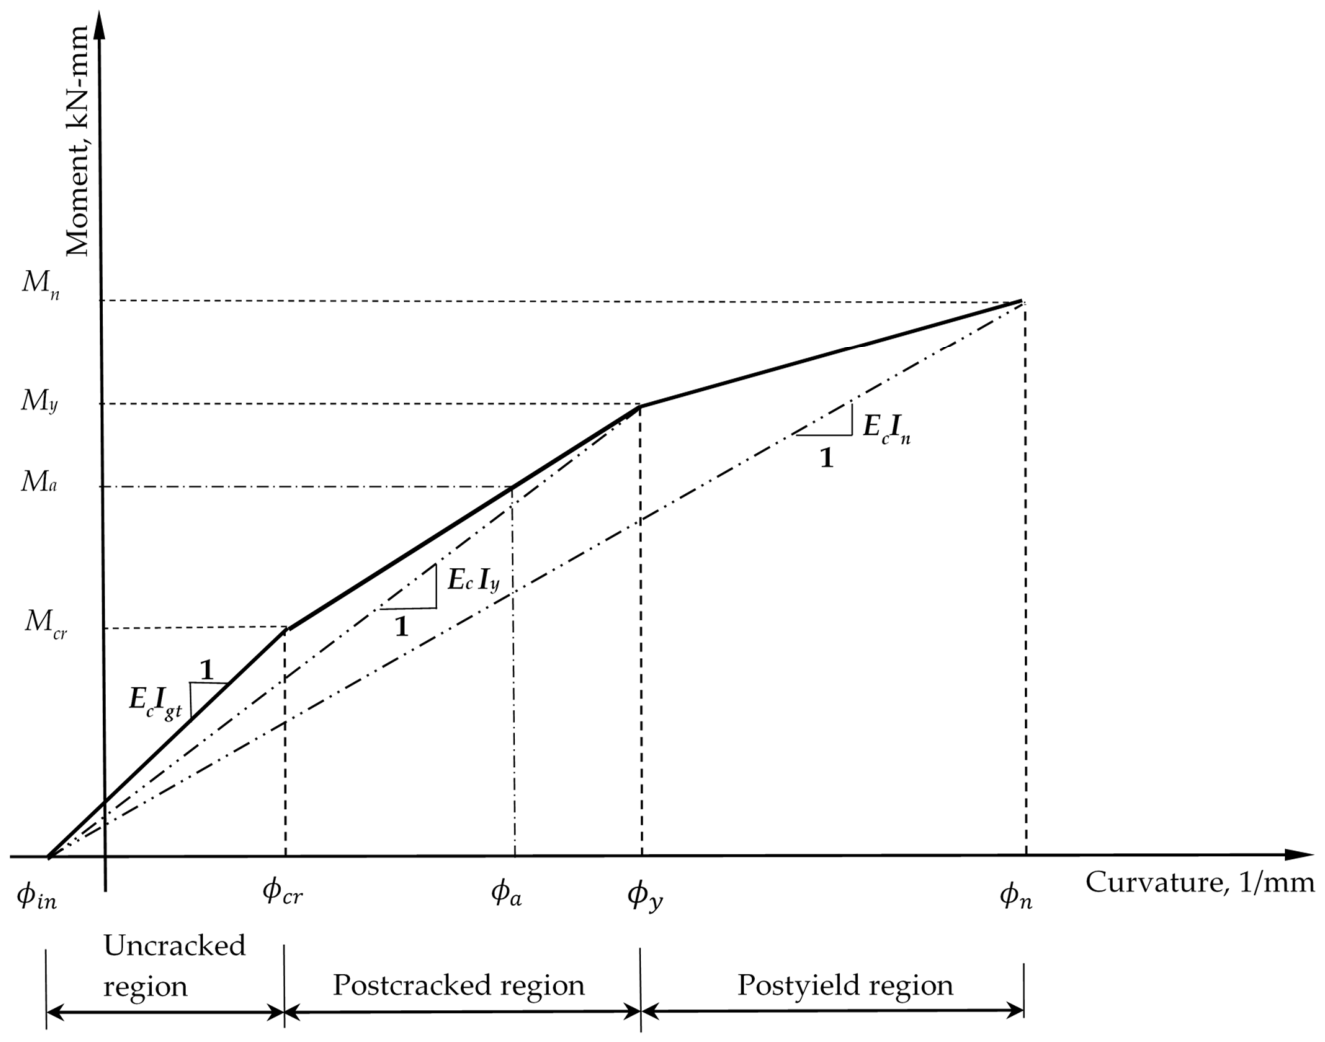
These three regions are defined by four key feature points, as shown in Figure 2: (1) initial point (Min = 0, ϕin), (2) cracking point (Mcr, ϕcr), (3) yielding point (My, ϕy), and (4) ultimate point (Mn, ϕn), where Min is the moment at zero applied dead and live loads, ϕin is the initial first curvature, Mcr is the cracking moment, ϕcr is the curvature at cracking, My is the moment at the first yielding, ϕy is the curvature at first yielding, Mn is the nominal ultimate moment, ϕn is the curvature corresponding to the ultimate moment of the section. The slope of the line in the uncracked region is equal to EcIgt, the slope in the postcracked region is equal to EcIy, and the slope in the postyield region is equal to EcIn, where Ec is the concrete modulus of elasticity, Igt is the gross transformed moment of inertia of the section, Iy is the effective section moment of inertia at first yielding, and In is the reduced effective moment of inertia associated with the ultimate moment capacity.
Figure 2.
Trilinear moment-curvature behavior of PC beams externally strengthened with FRP.
The trilinear approximation is constructed through sectional equilibrium and strain compatibility, capturing stiffness degradation as cracking initiates and propagates, and as nonlinear material behavior develops. Using the moment-area method, Kramer and Rasheed [16] derived closed-form expressions for midspan deflection by integrating curvature over three distinct regions. Additionally, a comparison with both experimental and numerical results showed that this idealization closely matched the true response, particularly in presenting the transition between stiffness regimes while remaining computationally efficient.
2.1. Deflection Equations for PC-FRP Under 4-Point Bending
By summing the deflection contributions of the three unique regions, the general deflection solution can be obtained.
where Δmidspan is the midspan deflection, δ1 is the uncracked region’s deflection influence, δ2 is the postcracked region’s deflection influence, δ3 is the postyield region’s deflection influence, x is the distance from the support, ϕun(x) is the curvature within the uncracked region, ϕcr-y(x) is the curvature within the postcracked region, ϕy-n(x) is the curvature within the postyield region, Lg is the distance from the support to the cracking moment section and bounds the uncracked region, Ly is the distance from the support to the first yielding moment section, and L is the total span length of the member.
Uncracked region: The uncracked region is bounded by the initial curvature and the curvature at cracking. As shown in Figure 2, the curvature is represented by a solid line connecting the initial curvature to the curvature corresponding to the applied maximum moment, extending to the mid-span of the beam. When the four-point bending load equals P/2, as shown in Figure 1, then the applied moment at the load application, Ma, equals PLa/2 and P/2 = Ma/La. The uncracked stage produces a midspan deflection shown in Equation (2):
where P is the total applied load, La is the length from the support to the load application point, ϕa(x) is the applied moment curvature, and ϕin is the initial curvature.
Postcracked region: In the postcracked region, Lg equals two times the cracking moment divided by the total applied load. Refer to Figure 1 and Figure 2. The beam deflection is given by Equation (3) when the applied moment, Ma = PLa/2, is less than or equal to the first yielding moment, My. This identity may be used to obtain the beam’s effective moment of inertia within the post-cracked loading range.
where ϕy is the first yielding curvature, and ϕcr is the curvature at the cracking moment section.
The post-yielding deflection expression is not addressed in this study, as the focus is on the post-cracking loading range. However, post-yielding is presented in detail in the earlier related work [16].
2.2. PC-FRP Effective Girder Moment of Inertia Expression After Cracking
Rasheed and Dinno [21] developed a beam finite element model that accurately captured the nonlinear response of reinforced concrete members up to failure. The stiffness distribution of this model was postulated to vary parabolically along the shear span. Based on earlier results, the authors herein adopted a similar parabolic relationship between the beam’s inverse effective moment of inertia (1/Ie) in terms of the maximum applied moment (Ma).
Applying the two extreme moment boundary conditions at concrete cracking and prestressing steel first yielding to Equation (4), the following two simultaneous equations are written in terms of the unknown two coefficients (a1 and a2):
where Ma is the maximum applied moment at midspan, and Mcr is the cracked moment, My is the moment at prestressing steel first yield, Ie is the effective girder moment of inertia, Igt is the gross transformed moment of inertia, and Iey is the effective girder moment of inertia at first yield of the prestressing strands. Arranging Equations (5) and (6) into a matrix form:
Solving for the constants in Equation (7) by inverting the moment coefficient matrix and multiplying it by the right-hand side:
Equation (8) leads to the following expressions for each one of the unknown constants:
Substituting Equations (9) and (10) into Equation (4):
Rearranging the variables in Equation (11), the inverse effective girder moment of inertia after cracking equation becomes:
By renaming the fractional variables in Equation (12), the following compact formula is obtained:
where , , and . In the next section, a detailed parametric study is performed to statistically correlate to for easy determination in design calculations. The parametric study included many beams solved using the rigorous analytical approach for prestressed beams without mild steel (Section 2.1). Therefore, the equation holds accurately in that class of beams without mild tensile steel. However, it is important to note here that for cases of mild tensile steel included, the yielding of mild steel is expected to take place prior to the yielding of the prestressing strands. In this case, the effective moment of inertia is expected to reduce further due to the reduced effective modulus of the mild steel. The authors observed in cases like these that the accuracy of the prediction is maintained by replacing with , in lieu of performing a complete nonlinear analysis to extract the effective modulus of elasticity of mild steel at the level of yielding of the prestressing strand, as shown in Equation (14):
3. Scope and Methodology of the Parametric Investigation
By comparing an extensive range of experimental results with rigorous analytical computations, the authors realized that the deflection is best recovered when a combination of Igt (the gross moment of inertia) and Iey is used rather than Igt and Icr. From earlier research, the authors noted that Iey could be accurately correlated with Icr in reinforced concrete beams, thereby making predictions feasible [22]. By generating a very large data set of 8100 beams, the authors accurately capture the correlation between Iey and Icr for PC beams with straight strands and no mild tensile steel that are externally strengthened with carbon fiber-reinforced polymers (PC-FRP), achieving an excellent statistical measure (R2 = 0.9886) as described herein.
3.1. PC-FRP Parametric Investigation Variables
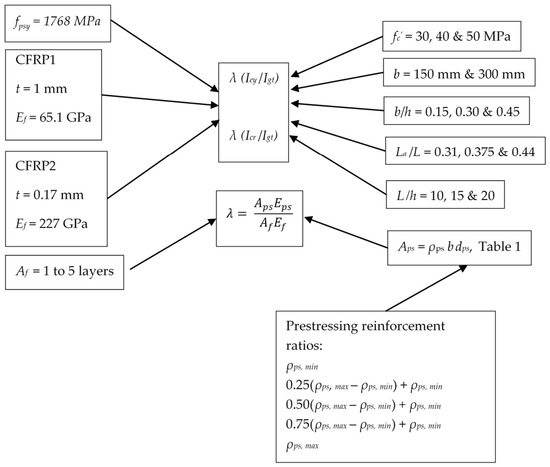
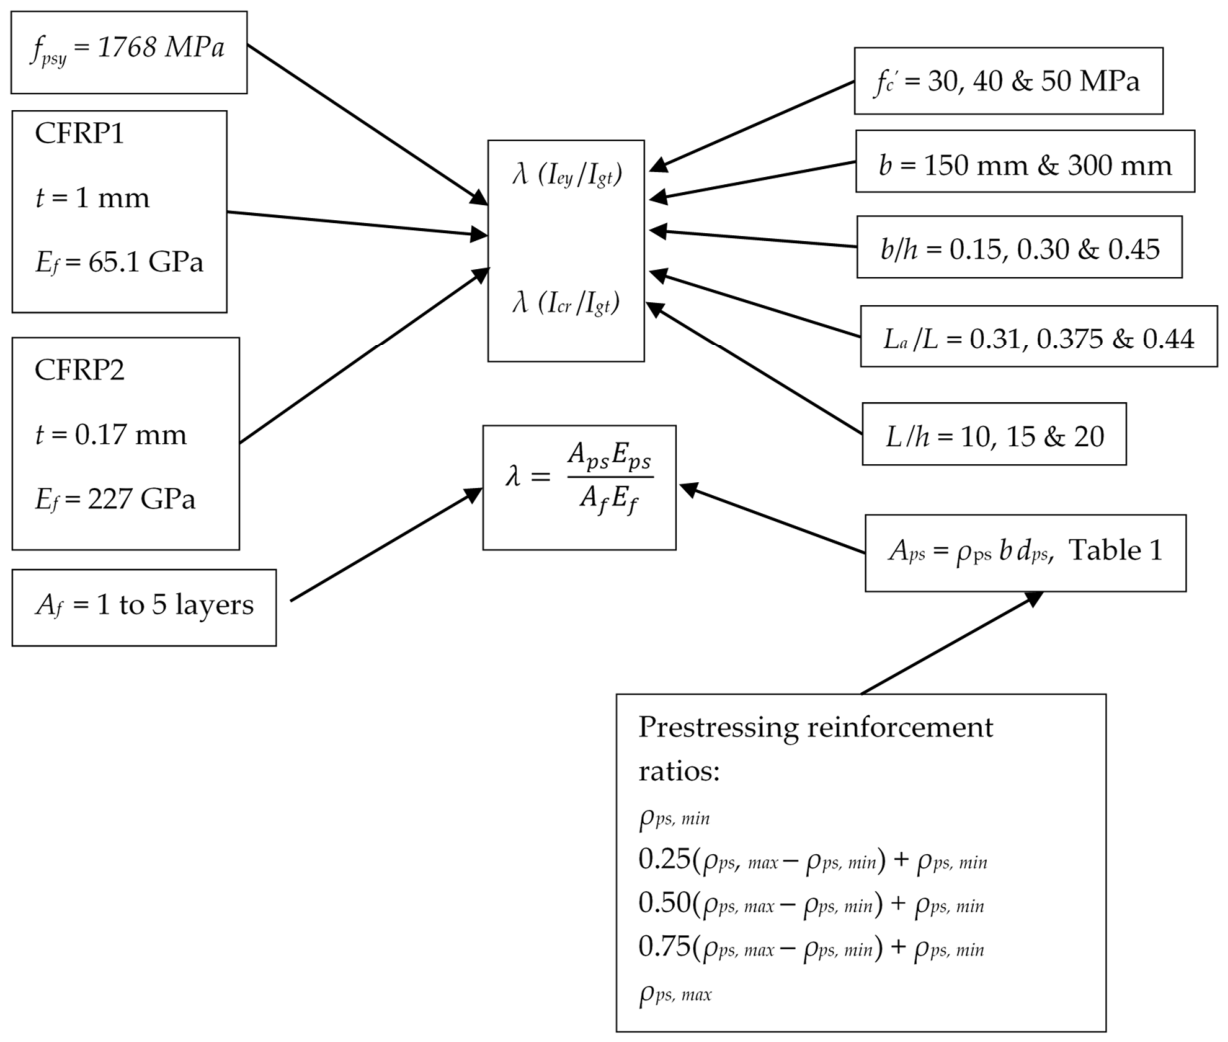
8100 beams were analyzed to establish simple relationships for evaluating the effective beam moment of inertia at first yielding with FRP, Iey, based on its sectional properties. The wide range of geometric and material properties examined is described in the subsequent paragraphs and shown in Figure 3.
Figure 3.
Variation in the parametric study for PC-FRP beams.
The variables in Figure 3 are as follows. The variable fpsy is the nominal yielding tensile strength in the prestressing steel reinforcement corresponding to 1% strain, t is the thickness of the FRP sheet applied, Ef is the tensile modulus of elasticity of FRP, Af is the total effective area of FRP external reinforcement, f′c is the 28-day compressive strength of the concrete, b is the width of the beam, h is the height of the beam, La is the shear span of the beam, L is the total span of the beam, Aps is the area of the prestressing steel in tension, ρps is the prestressing reinforcement ratio of the beam, dps is the effective depth of the prestressing steel from the extreme fiber in compression to the centroid of the strands, and Eps is the modulus of elasticity of the prestressing steel.
3.1.1. Geometric Parameters
Six rectangular PC beam sizes were selected to examine the influence of section geometry on cracking behavior, transformed section properties, and effective moment of inertia. Two beam widths (b), 150 mm and 300 mm, represent laboratory-scale and larger rectangular PC members, respectively. Beam widths near 150 mm are commonly reported in experimental investigations of FRP-externally strengthened reinforced concrete beams, whereas a 300 mm width extends the study to larger practical bridge and building PC members. The selected width-to-depth ratios of the unstrengthened beam (b/h) equal 0.15, 0.30, and 0.45, were used to represent very slender, moderately slender, and relatively wide rectangular PC sections. The intermediate and upper ratios are consistent with many rectangular PC beam specimens reported in FRP-strengthening literature. While the lowest ratio is not intended to represent typical compact rectangular laboratory specimens, it provides a lower-bound slender section case relevant to deep PC members [23]. The span-to-depth ratios (L/h) of 10, 15, and 20 were selected to cover short, intermediate, and moderately slender flexural members, resulting in spans (L) from 3330 mm to 40,000 mm. These values encompass the range commonly used for prestressed concrete beams and experimental flexural investigations, while permitting evaluation of stiffness behavior over a broad range of member slenderness. The shear span-to-span ratios of 0.31, 0.375, and 0.44 provide a range of four-point bending configurations with constant moment regions ranging from a typical one-third ratio to close to a three-point loading configuration. Similar loading arrangements have been used in experimental studies of PC-FRP to promote flexural behavior within a controlled, constant-moment region. Collectively, these parameters were elected to provide a broad but structured representation of prestressed concrete member geometries and loading arrangements relevant to CFRP flexural strengthening. Therefore, shear span-to-span ratios of 0.31, 0.375, and 0.44 are examined.
3.1.2. Material Parameters
Many prestressed bridge girders currently being strengthened with FRP were originally constructed between 1960 and 1990, which used concrete strengths between 28 and 41 MPa, and occasionally 48 MPa. Current precast plants routinely use 31–55 MPa for release strength and 41–69 MPa for 28-day strength. Therefore, this study uses 30 MPa, 40 MPa, and 50 MPa for the minimum concrete compressive strengths at 28 days (fc′) [23,24].
The centroids of the fully bonded, straight, pretensioned prestressing strands are located 75 mm from the bottom of the unstrengthened PC beam. This value is consistent with strand locations commonly used in laboratory-scale and practical PC members, where the strand centroids are typically positioned approximately 50 to 125 mm from the tension face to satisfy cover, spacing, and development length requirements. Maintaining a constant strand location throughout the study isolates the influence of section geometry and reinforcement parameters while allowing pretension eccentricity to vary naturally with the beam depth.
The prestressing strands were assumed to be ASTM A416/A416M Grade 270 (Grade 1860) low-relaxation seven-wire strands, which are commonly used in PC construction [25]. Conservatively, mild reinforcement is excluded from the parametric investigation to avoid increasing the size of the parametric study beyond practical limits.
Since glass FRP exhibits premature creep rupture, two types of carbon FRP (CFRP) are studied: SikaWrap ® Hex 103C carbon fiber sheet (Sika Corporation, Lyndhurst, NJ, USA) and M-Brace ® CF130 carbon fiber sheet (BASF Corporation, Beachwood, OH, USA). The SikaWrap Hex 103C sheet has a thickness of 1 mm, a tensile elastic modulus (Ef) of 65.1 GPa, and a tensile strength (ffu) of 717 MPa based on the laminate area. M-Brace CF130 has a thickness of 0.17 mm, with an Ef of 227 GPa and ffu of 3800 MPa based on the net fiber area. The selected materials differ substantially in elastic modulus, thickness, and tensile strength, thereby producing a broad range of CFRP stiffness contributions while maintaining commercially available strengthening systems. Consequently, the resulting analytical database encompasses both lower-stiffness and higher-stiffness CFRP strengthening configurations that may be encountered in practical rehabilitation projects.
3.1.3. Range of Prestressing and CFRP Reinforcement Ratios
Using the minimum and maximum steel reinforcement ratios explained in the next two subsections and given by Equations (24) and (28), respectively, the prestressing reinforcement ratio is varied in this parametric study from the specified ACI 319-25 minimum (ρps, min) and maximum (ρps, max), five times. This is achieved by adding a percentage of the difference between the minimum and maximum reinforcement ratio to the minimum reinforcement ratio in one-quarter increments: ρps, min, 0.25(ρps, max − ρps, min) + ρps, min, 0.50(ρps, max − ρps, min) + ρps, min, 0.75(ρps, max − ρps, min) + ρps, min, and ρps, max. The lower-bond prestressing ratio produces limited precompression and may not provide sufficient flexural strength beyond cracking—this is similar to a fully pretensioned member that is strengthened for higher load-carrying capacity. The intermediate values represent typical pretensioned building, parking, and bridge-type members. The upper values represent heavily prestressed members approaching practical limits governed by service stress limits, transfer stresses, strand spacing, development length, and ductility considerations. Refer to Table 1 and subsequent subsections for more information on the minimum and maximum prestressing reinforcement ratios implemented, as well as the range of the CFRP reinforcement ratios applied.
Table 1.
Prestressing and CFRP reinforcement ratio ranges.
Minimum Prestressing Reinforcement Ratio
The prestressing reinforcement ratio is determined by the area of prestressing reinforcement (Aps) divided by the beam width, which is multiplied by the effective depth of prestress from the extreme fiber in compression (Aps/bdps). The prestressing reinforcement ratio (ρps) varies between its minimum and maximum values specified in ACI CODE 319-25 and AASHTO LRFD [6,24]. The minimum area of prestressed steel strands, conforming to ASTM A416 [25], is determined by ACI CODE 319-25 requirements for beams with bonded prestressed reinforcement, where the Aps needs to be adequate to develop a factored load at least 1.2 times the cracking load calculated on the basis of fr equal to 0.62√f′c [6,25].
AASHTO LRFD uses a higher modulus of rupture value for minimum steel requirements, as the upper-bound value is justified for the strength limit state [24]. The PC flexural members examined in this parametric study are strengthened with FRP. Most PC-FRP members were originally designed to be fully pretensioned, not to crack. Since these members are being strengthened, it is assumed they will crack under new, upgraded live-loading conditions. Therefore, the lower bound for the modulus of rupture is justified.
The minimum prestressing steel per ACI 319-25 is derived for a rectangular compression stress block by setting the nominal moment capacity, Mn, equal to the 120% of the cracking moment, Mcr, as shown in Equation (15).
where ρps,min is the minimum prestressing steel ratio.
The aforementioned cracking moment is equal to the modulus of rupture times the section modulus plus the moment caused by the compressive stress in the concrete due to the effective prestress forces after allowance for all prestress losses and initial prestressing moment, as shown in Equation (16).
where Sbt is the bottom gross transformed section modulus of the section including reinforcing steel and FRP, Pe is the equivalent prestressed force, e is the distance from the center of gravity (cgc) of the section to the centroid of prestressed strands and is positive when below the cgc, Igt is the gross transformed moment of inertia of the section including reinforcing steel and FRP, Agt is the gross transformed area of the section including reinforcing steel and FRP, and cb is the distance from the center of gravity of the section to the extreme bottom fiber of the concrete.
Setting the nominal moment equal to 120 percent of the cracking moment, Equation (17) is derived.
where Aps is the area of prestressing steel, fps is the prestressing stress after losses, dps is the depth of centroid of prestressing steel from the extreme compression fiber, and β1 is the factor relating the depth of the equivalent rectangular compressive stress block to the depth of the neutral axis, cn is the depth of the neutral axis measured from the extreme compression fiber at ultimate, and cb is the depth of the neutral axis measured from the bottom to the geometric centroid of the section.
A rectangular compression block, width equal to b, with the centroid located at , is used. Equating the internal compression and tension forces by assuming a concrete crushing failure mode, Equation (18) is obtained.
Based on strain compatibility and the nonlinear strand stress–strain curve, the prestressing stress, fps, is equal to:
where fpu is the ultimate tensile strength of prestressing steel, ε1 is the strain in the prestress strands due to initial tension after losses, and ε2 is the strain in the strands due to initial eccentricity (decompression strain).
Using β1, as specified by ACI CODE 319-25 and manipulating Equation (18), the neutral axis, cn, can be defined as:
Substituting Equation (20) into Equation (17), the nominal moment equal to 120% of the cracking moment equation can be written as:
Simplifying Equation (21), rearranging into standard quadratic format, squaring the prestressing ratio, dividing by 1/f′c d2ps b, and rewriting in terms of normalized prestressing reinforcement index, ω, and the dimensionless parameter, R, yields the generalized minimum prestressing steel reinforcement ratio is obtained in Equation (22).
where
Using the quadratic formula, the generalized minimum prestressing steel reinforcement ratio can be readily determined.
For this parametric study, the strain ɛ3 in the prestress strands due to strain compatibility is estimated to equal 0.027 by assuming cn 0.1dps, as given in Equation (25).
It is widely accepted that ɛ1 + ɛ2 0.005–0.006, making the total strain 0.032–0.033. This strain results in fps = 1860 MPa, which is used in Equation (24).
Maximum Prestressing Reinforcement Ratio
ACI CODE-318-25 defines tension-controlled members as elements with a minimum extreme-fiber tension equal to the steel’s yield strain plus the concrete’s usable strain, ɛty + 0.003 [5]. Assuming a yielding strain of 0.002 (for 414 MPa steel) to determine the net prestressing steel strain, a value of 0.005 for the extreme fiber in tension is used to determine the maximum prestressing steel. By means of strain compatibility with the usable concrete-strain equal to 0.003 and the net tensile strain in prestressing strands equal to 0.005, the maximum prestressing steel reinforcement ratio can be determined. Using similar triangles of the strains above and below the neutral axis, an expression is derived to calculate the depth of the neutral axis, c.
where εty is the assumed strain in the extreme fiber in tension at yield of mild steel.
The c/dps ratio is frequently used to determine whether a section is tension-controlled, where c is the distance from the extreme compression fiber to the neutral axis. When ɛty plus 0.003 equals 0.005, the lowest location of the neutral axis depth for a tension-controlled section is c/dps = 3/8. The corresponding depth of the equivalent stress block, amax, is:
where Aps,max is the amount of prestressing steel necessary to have a net extreme fiber in tension strain equal to 0.005.
Substituting ρps,maxbwdps for Aps,max in Equation (27), then rearranging, the maximum reinforcement ratio, ρps,max, value is obtained by Equation (28). Since all the prestressing steel is taken at one depth, 75 mm from the bottom of the unstrengthened PC beam, for this parametric study, the depth of prestressing steel to the extreme fiber in tension ratio equals 1 when using one layer of prestressing or lumping all prestressing strands in one location for the maximum prestressing steel ratio derivation.
Range of CFRP Reinforcement Ratio
The CFRP reinforcement ratio, ρf, is varied in this study, as indicated in Table 2. The area of CFRP is determined by the section’s equilibrium, with predetermined neutral-axis locations varying in increments of 1/100 of the unstrengthened beam’s height (depth) (e.g., 0.26 h to 0.33 h). The CFRP reinforcement ratios were selected to represent practical levels of externally bonded strengthening for PC flexural members. Because PC beams already contain high-strength internal prestressing reinforcement, externally bonded CFRP is typically used as supplemental flexural reinforcement rather than as the primary tensile reinforcement. Consequently, practical CFRP reinforcement ratios are relatively small compared with internal steel ratios. The lower CFRP ratios represent light strengthening used to restore or modestly increase flexural capacity and post-cracking stiffness, while the intermediate ratios represent typical CFRP strengthening levels reported in experimental studies of PC beams. The upper ratios represent heavily strengthened members and were included to evaluate the limiting influence of CFRP stiffness on the behavior of cracked sections and the effective moment of inertia. Since the deflection response is governed by the axial stiffness contribution of the CFRP, both ρf and ρfEf are considered important parameters in the study.
Table 2.
Range of neutral axis locations for various prestressing steel reinforcement ratios.
The layers of CFRP for the PC-FRP strengthened members are limited to one to five layers for this study. A maximum of five layers is used for constructability and economic reasons. A minimum width of 50 mm for a single CFRP layer is used since such a small CFRP sheet area makes an insignificant contribution to flexure. Two approaches of applying the layers of CFRP are examined: (1) CFRP placed only on the bottom of the beam with a maximum width of the beam, and (2) CFRP placed on the bottom of the web of the beam with a maximum wrap up the sides of 0.167 h, where h is the total height of the unstrengthened PC member. This wrap height varied from 56 mm to 334 mm, depending on the beam height examined. As the wrap length increases, it becomes less effective at resisting moment, thereby strengthening the flexural member; hence, the use of 0.167 h. Full-size layers were used for all layers except the last one, and only what was required for equilibrium was used, as long as its width was at least 50 mm.
As mentioned previously, the area of CFRP is calculated by the section equilibrium at first yield, which is controlled by yielding of the prestressing steel in tension, intermediate crack-induced debonding or rupture of the CFRP, or concrete crushing in compression prior to yielding of the prestressing steel. Full-beam-width or full-wrapped-width layers, depending on the strengthening approach, are used except for the outer layer, whose width varies to meet equilibrium requirements.
Yield Strain of Prestressing Steel
Additional considerations when calculating the section’s equilibrium include the prestressing steel’s yield strain, ɛps, and the initial substrate strain, ɛbi. Because the stress–strain curve for prestressing steel lacks a distinct yield point, the strain in prestressing steel is taken as 0.01, as depicted by the PCI Design Handbook [23]. When determining the effective CFRP strain at prestressing steel yielding, ɛfe, the initial substrate strain used in the parametric study was set to 0.0006. This value is consistent with ACI PRC-440.2-23 [18] strengthening procedures and is conservative for PC girders strengthened under dead load plus some sustained live load. Since CFRP materials are linear elastic until failure, the strain in the CFRP will dictate the stress developed therein. The strain developed in the CFRP at the prestressing steel yield is governed by either the CFRP rupture point or the CFRP debonding point from the substrate. In the case of high prestressing reinforcement ratios, ρmax, concrete crushing occurs before CFRP rupture or CFRP debonding.
3.2. PC-FRP Parametric Study: Effective Moment of Inertia at First Prestressing Yielding
In order to recover a statistically reliable expression for the effective beam moment of inertia at first yielding (Iey) in terms of the cracking moment of inertia (Icr), the results generated from 8100 data points were normalized by the Igt on both axes, as done by Rasheed et al. [22] for reinforced concrete beams.
3.2.1. Normalizing by Gross Transformed Moment of Inertia
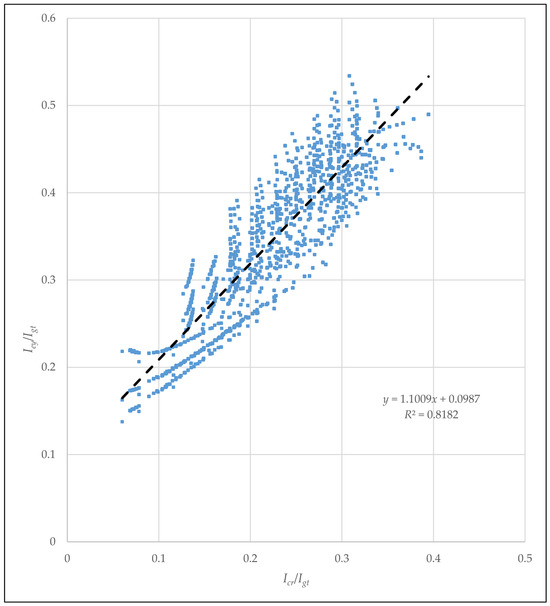
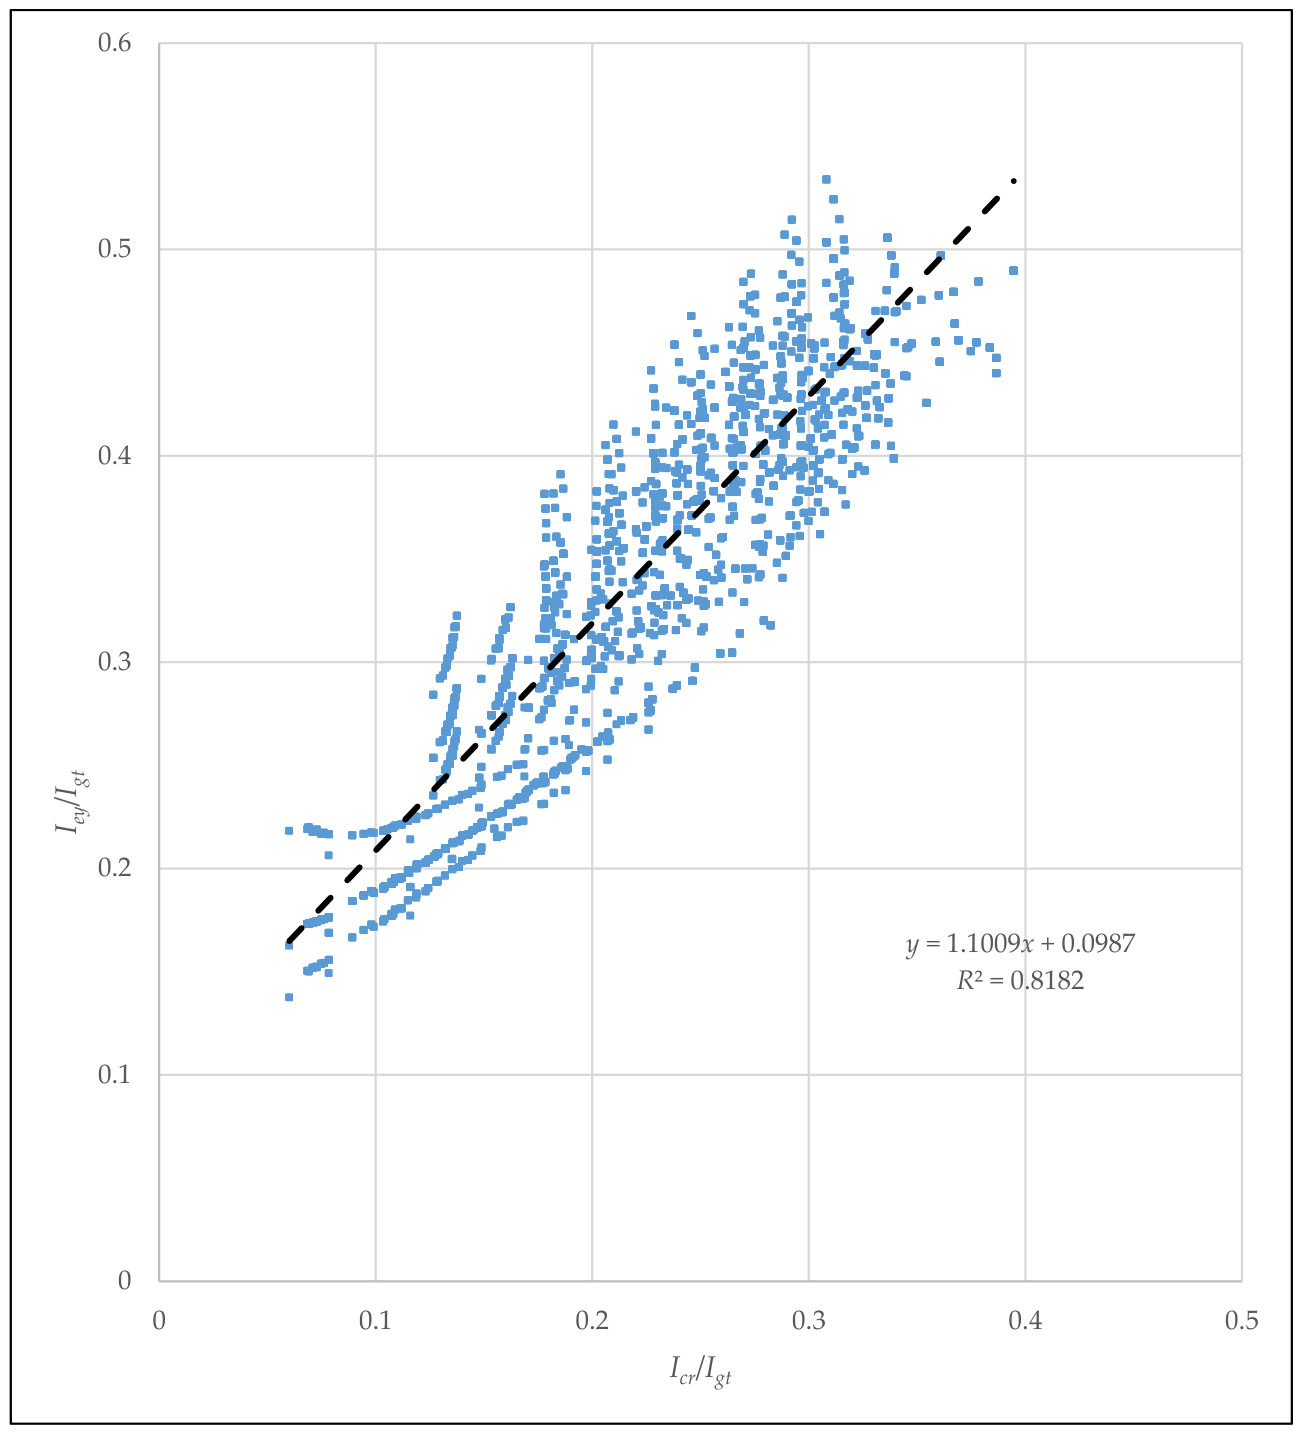
Figure 4 indicates Iey versus Icr normalized by Igt for rectangular PC-FRP sections strengthened with SikaWrap Hex 103C (CFRP1), M-Brace CF130 (CFRP2), as well as for La/L equal to 0.31, 0.375, and 0.44. This figure indicates that the beam effective moment of inertia at first yielding, Iey, does not correlate well with the cracked transformed moment of inertia, Icr, for all PC-FRP flexural members studied (R2 = 0.8182). The black dashed line represents the best-fit linear regression of the analytical data. For PC-FRP members with a minimum prestressing reinforcement ratio, this normalization parameter may work well; however, as the prestressing reinforcement ratio increases, the scatter magnifies. Additionally, the shear-span-to-span ratio impacts the scatter. Equations (29) or (30) indicate that the normalized effective beam moment of inertia at first yield produces a weak correlation with the normalized cracked moment of inertia.
Figure 4.
Correlation between the normalized effective moment of inertia at first prestressing steel yielding, Iey/Igt, and the normalized cracked moment of inertia, Icr/Igt, for the 8,100 analytically generated PC-FRP beams strengthened with one to five CFRP layers. All blue markers represent individual beam analyses. The variation in blue shading or size of marker results solely from overlapping markers and does not indicate different data categories, while the black dashed line denotes the least-squares linear regression used to calibrate the proposed effective moment of inertia model.
Since the scatter is unacceptable and the linear correlation is far from being satisfactory, other normalization parameters are examined.
3.2.2. Normalizing by 1/(λIgt)
The axial stiffness of the prestressing reinforcement to that of the CFRP reinforcement is a physical parameter for normalizing the beam moment of inertia at first prestressing steel yielding.
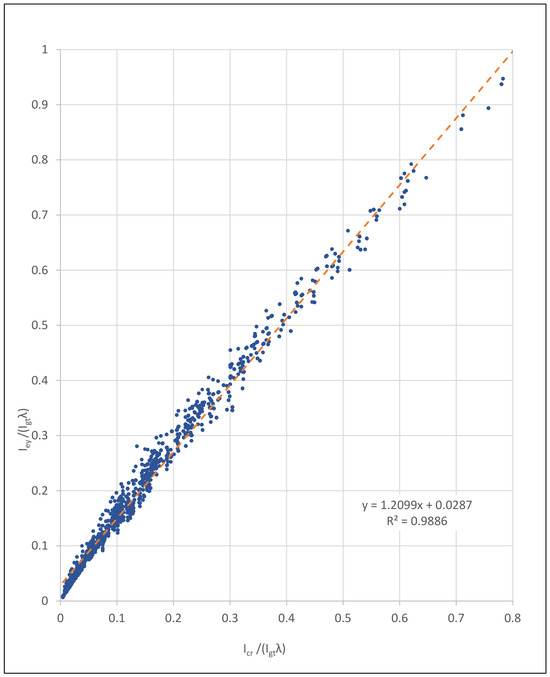
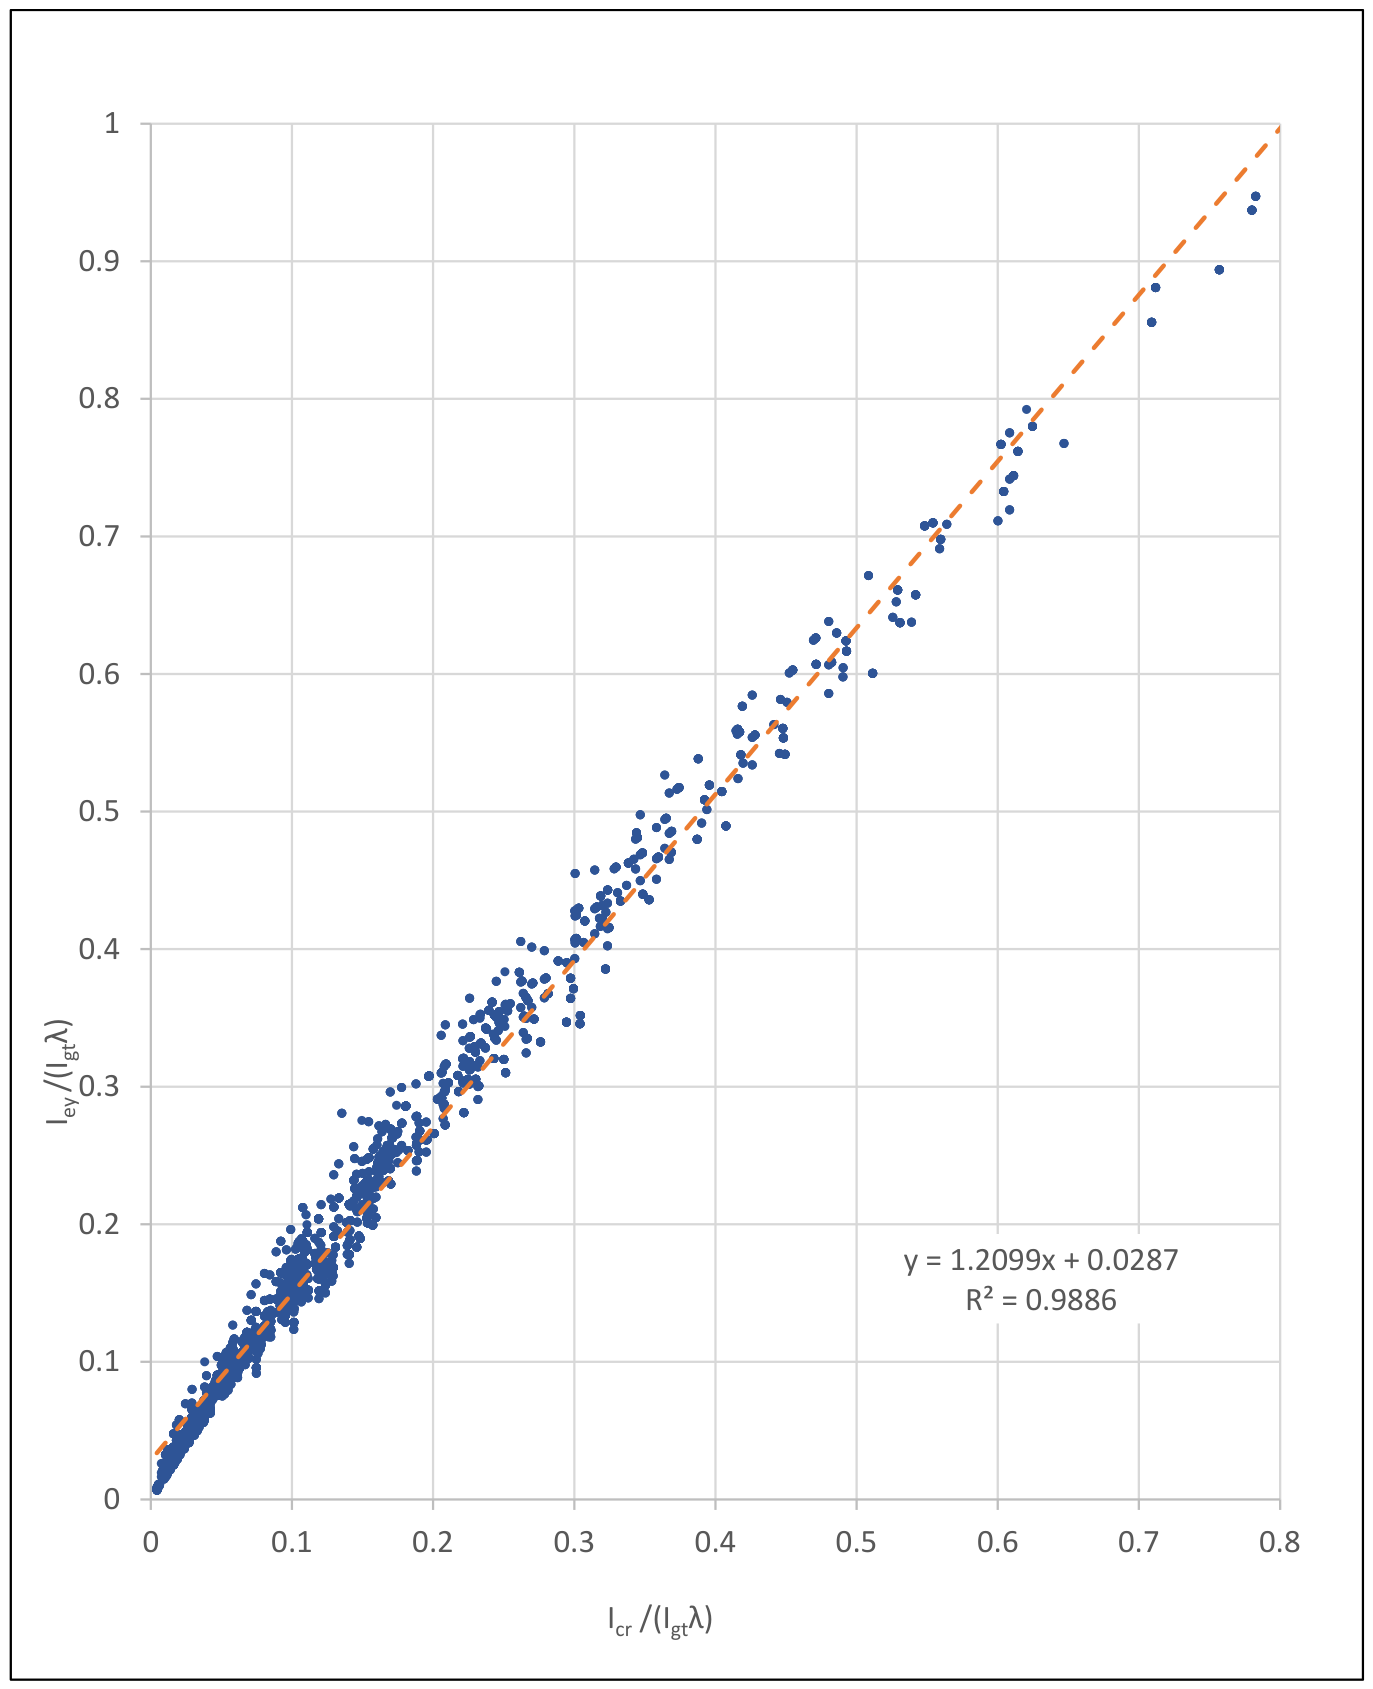
where ApsEps and AfEf represent the axial stiffness of the prestressing steel and CFRP reinforcement, respectively. Following concrete cracking, the tensile force carried by each reinforcement system is somewhat proportional to its axial stiffness under strain compatibility conditions. Consequently, λ directly quantifies the relative contribution of the prestressing steel and CFRP to the distribution of forces in both. A small value of λ indicates that the CFRP provides a relatively large proportion of the tensile stiffness. Under strain compatibility, this reduces the rate at which stress develops in the prestressing steel, thereby delaying the onset of prestressing steel yielding to a higher applied moment. This behavior is reflected in Equation (33), where smaller values of λ correspond to a lower intercept and, consequently, a smaller value of the moment of inertia at first prestressing steel yielding Iey. Conversely, larger values of λ indicate that the prestressing steel dominates the tensile stiffness of the cracked section, causing the prestressing steel to reach yielding at a lower applied moment and resulting in a larger predicted value of Iey. When combined with the gross transformed moment of inertia, Igt, this parameter was found to provide an excellent basis for characterizing the moment of inertia at first yielding. As shown in Figure 5, an excellent linear correlation was obtained (R2 = 0.9886), indicating that the relative axial stiffness of the strengthened member. All blue markers represent individual beam analyses. The variation in blue shading or size of marker results solely from overlapping markers and does not indicate different data categories, while the orange dashed line denotes the least-squares linear regression used to calibrate the proposed effective moment of inertia model.
Figure 5.
Relationship between the normalized effective moment of inertia at first prestressing steel yielding, Iey/(Igtλ), and the normalized cracked moment of inertia, Icr/(Igtλ), for 8,100 analytical PC-FRP beam models. Each blue marker represents an individual beam analysis, while the orange dashed line represents the least-squares linear regression through the analytical data.
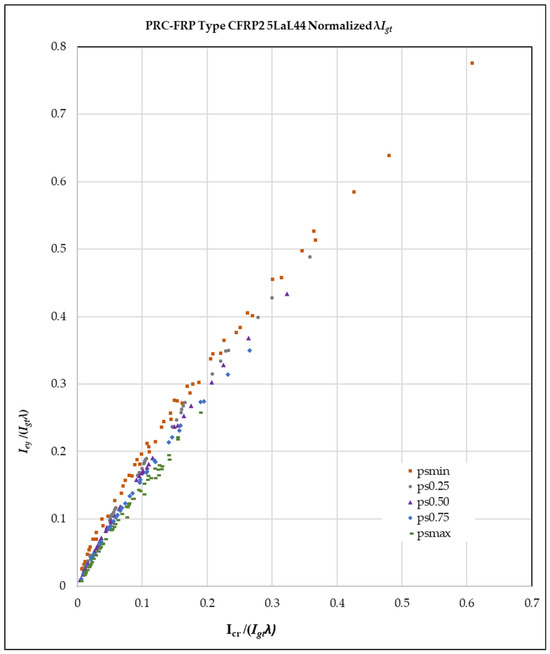
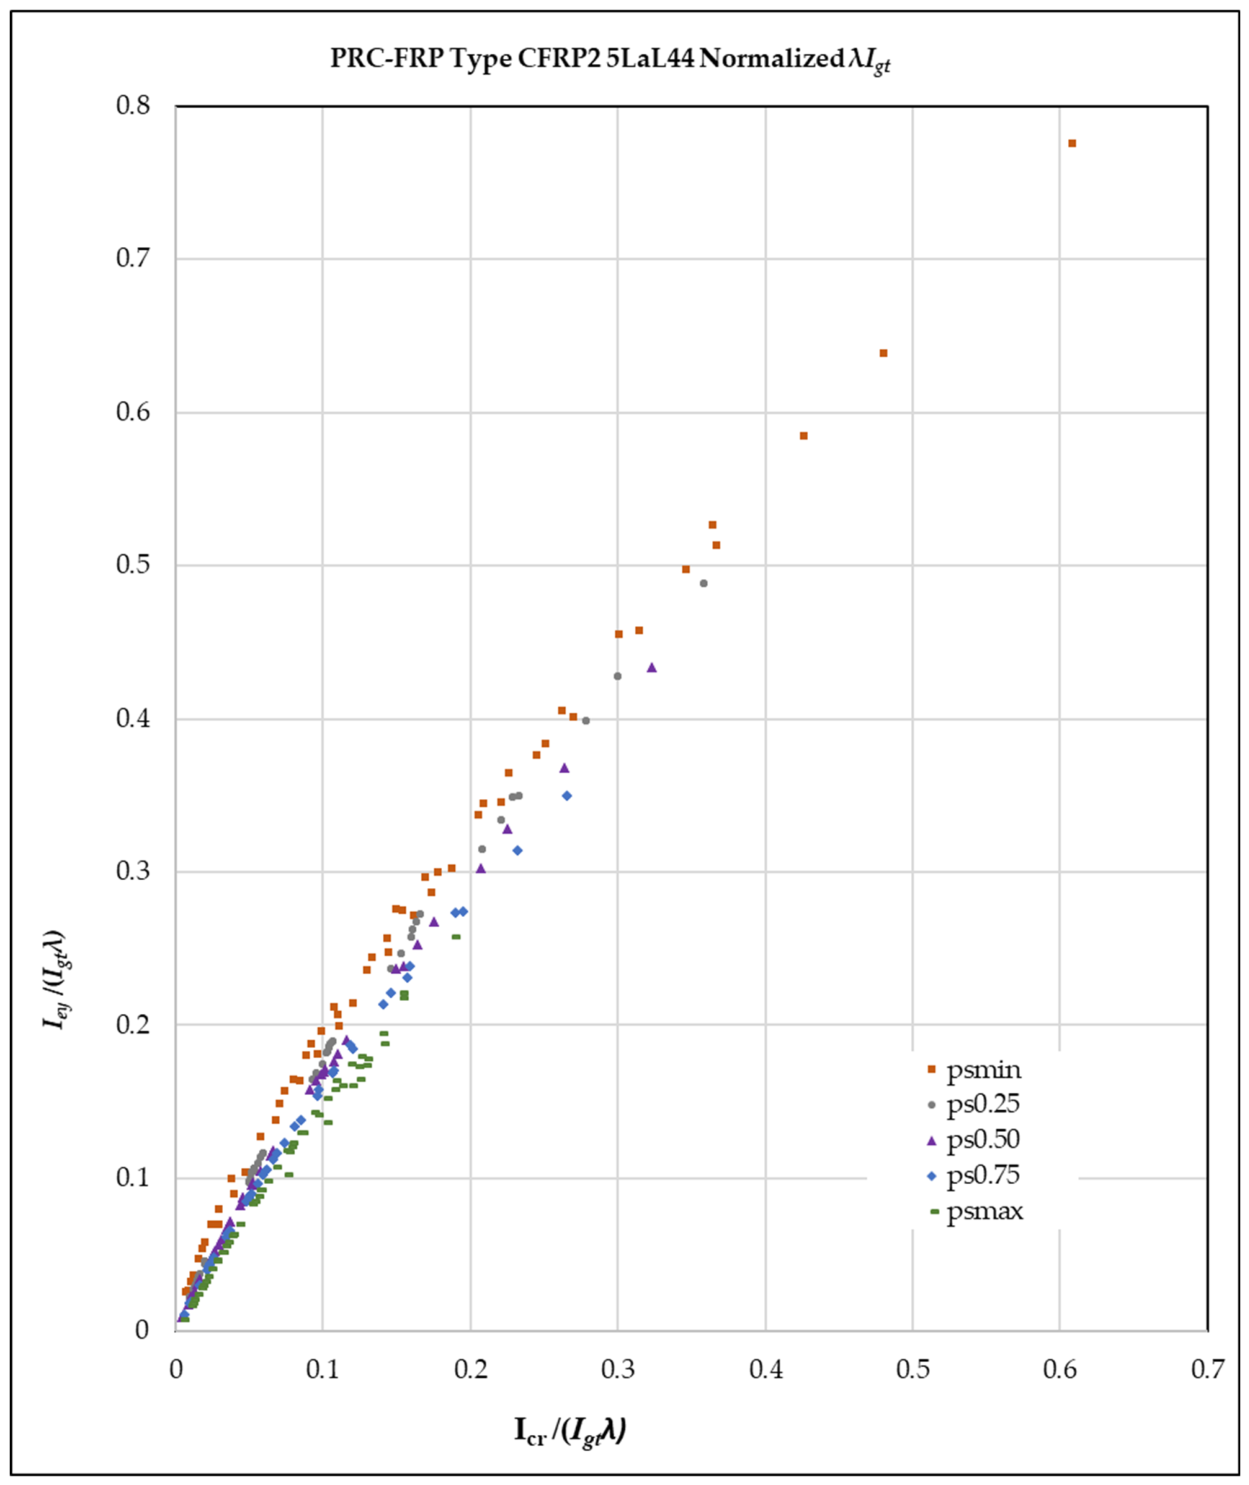
Figure 5 illustrates the relationship between the normalized effective moment of inertia at first prestressing steel yielding, Iey/(λIgt), and the normalized cracking moment of inertia, Icr/(λIgt), for rectangular PC-FRP beams strengthened with SikaWrap Hex 103C (CFRP1) and M-Brace CF130 (CFRP2) for La/L equal to 0.31, 0.375, and 0.44. Figure 6 presents a representative subset of the analytical database for rectangular PC-FRP member strengthened with up to five layers of CFRP Type 2, with a shear-span-to-span ratio of 0.44. Various prestressing steel reinforcement ratios are indicated: ρps, min = orange square, 0.25 ρps, min = gray circle, 0.50 ρps, min = purple triangle, 0.75 ρps, min = blue diamond, and ρps, max = green dash. The data points in Figure 6 indicate that lower prestressing reinforcement ratios have steeper linearized slopes, whereas higher prestressing reinforcement ratios produce shallower linearized slopes. The other La/L ratios and CFRP material type indicate similar outcomes.
Figure 6.
Variations in the Iey versus Icr relationship normalized by λIgt for CFRP2 material type and La/L = 0.44.
Despite the excellent R2 value, there will be variation between the Iey of the actual data points and the Iey from Equation (32). That variation was calculated for the entire 8100 data points, and the absolute average percentage error was 11.6% while the most extreme actual percentage error ranged between 46% and −79%. This captures the anticipated variations in Iey extracted from the parametric study to put the reader into perspective.
4. Comparison of the State-of-the-Art Ie Equations
A comparison of different procedures for calculating the effective moment of inertia used to determine instantaneous deflections of pretensioned PC-FRP strengthened rectangular beams is presented herein. Three different sets of effective moment-of-inertia equations are examined for deflections within service limits (from post-cracking to prestressing steel yielding).
The first set of equations is Branson’s equation, used by ACI CODE-319-25 [6] with PCI Handbook [23] modifications recommended by Branson and Trost [26] for prestressing and used by ACI GUIDE-440-23 [18]. This set of equations (Equations (34) and (35)) computes the beam effective moment of inertia after cracking (Ie) as follows. Equation (35) is a variation in Equation (16) presented earlier, with the distance from the geometric centroid to the extreme fiber in tension, yt, equal to cb, the distance from the center of gravity of the section to the extreme bottom fiber of the concrete.
The second set of equations is developed for prestressed concrete beams [27].
where is the cracking moment modification factor defined by Equation 24.2.3.9d [7,28]. The factor accounts for the relative contribution of prestressing and nonprestressed tension reinforcement (mild steel) to the cracking response and simplifies to unity if mild steel is absent or is negligible.
The third set of equations is introduced in this paper for beams with straight strands and externally strengthened with FRP, either without tensile mild steel (Equation (13)) or with tensile mild steel (Equation (14)), where Iey is given by Equation (33), which was extracted from the parametric study above [28].
5. Comparison to Experiments
5.1. PC-FRP Experimental Database
The availability of published deflection tests for externally bonded FRP-strengthened PC beams is considerably more limited than for conventionally reinforced concrete beams externally strengthened with FRP. Thus, the validation against experimental results is limited. The experimental database used to validate and compare the equations, listed in Section 4, is compiled from the limited published literature and is shown in Table 3. The database consists of six beams: four from a PhD dissertation by Jun Y. Cha [29] and two from a journal paper by Larson et al. [30]. Cha’s beams have a rectangular cross-section, while Larson’s beams have a T cross-section. It is relevant to mention here that Cha’s and Larson’s beams contained tensile mild steel.
Table 3.
PC-FRP beam database collected from literature.
5.2. PC-FRP Experimental Database—Cha (2001)
To verify the parametric study response, a fully nonlinear analysis of the same rectangular beam strengthened with CFRP is performed using test results from beams tested by Cha [29], who examined six pretensioned, straight-strand, bonded PC rectangular beams. Of the six beams tested, B1 and B4 were the control beams, unstrengthened, while the remaining beams (B2, B3, B5, and B6) were strengthened with a single CFRP sheet type and are used in this study. The beams were tested in four-point bending with a clear span of 3000 mm and a shear span of 1000 mm. A Forney testing machine was used with load applied in increments of 4.45 kN prior to cracking and 2.22 kN after the cracking load was reached. Deflections were measured using mechanical dial gauges with 76 mm travel and 0.0254 mm reading accuracy, mounted at the longitudinal centerline of the beam at midspan and at each loading point. The beams were strengthened by applying CFRP to the surface of the flipped beams and curing for at least 2 weeks [29].
All beams were reinforced with bonded prestressing strands conforming to ASTM A416 and non-prestressed reinforcement conforming to ASTM A616. The prestressing steel was a seven-wire strand with a nominal diameter of 10 mm and an ultimate strength of 1862 MPa. One prestressing tendon, located 190 mm from the top surface, was used, and prestressing was applied using a single-wire hydraulic Freyssinet jack operated by a hand pump. The two non-prestressed steel bars had a 10 mm diameter with a specified yield strength of 414 MPa. The two No. 10 M bars were placed 215 mm from the extreme compression fiber [29].
Cha B2 and Cha B3 had a concrete compressive strength of 35 MPa and were strengthened with two and three layers of 0.11 mm-thick CFRP, 140 mm wide, respectively. Cha B5 and Cha B6 had a concrete compressive strength of 70 MPa and were strengthened with 0.11 mm-thick CFRP layers, 140 mm wide, applied in two and three layers, respectively. The effective prestress forces for Cha B2, Cha B3, Cha B5, and Cha B6 beams were given as: 55.6 kN, 59.7 kN, 60.6 kN, and 62.2 kN, respectively. Load, midspan deflection, and strains were recorded as the beams were loaded to failure. Cha B2, Cha B3, Cha B5, and Cha B6 failure modes are debonding of the carbon composite, crushing of concrete, rupture of the CFRP plate, and debonding of the CFRP plate, respectively [29].
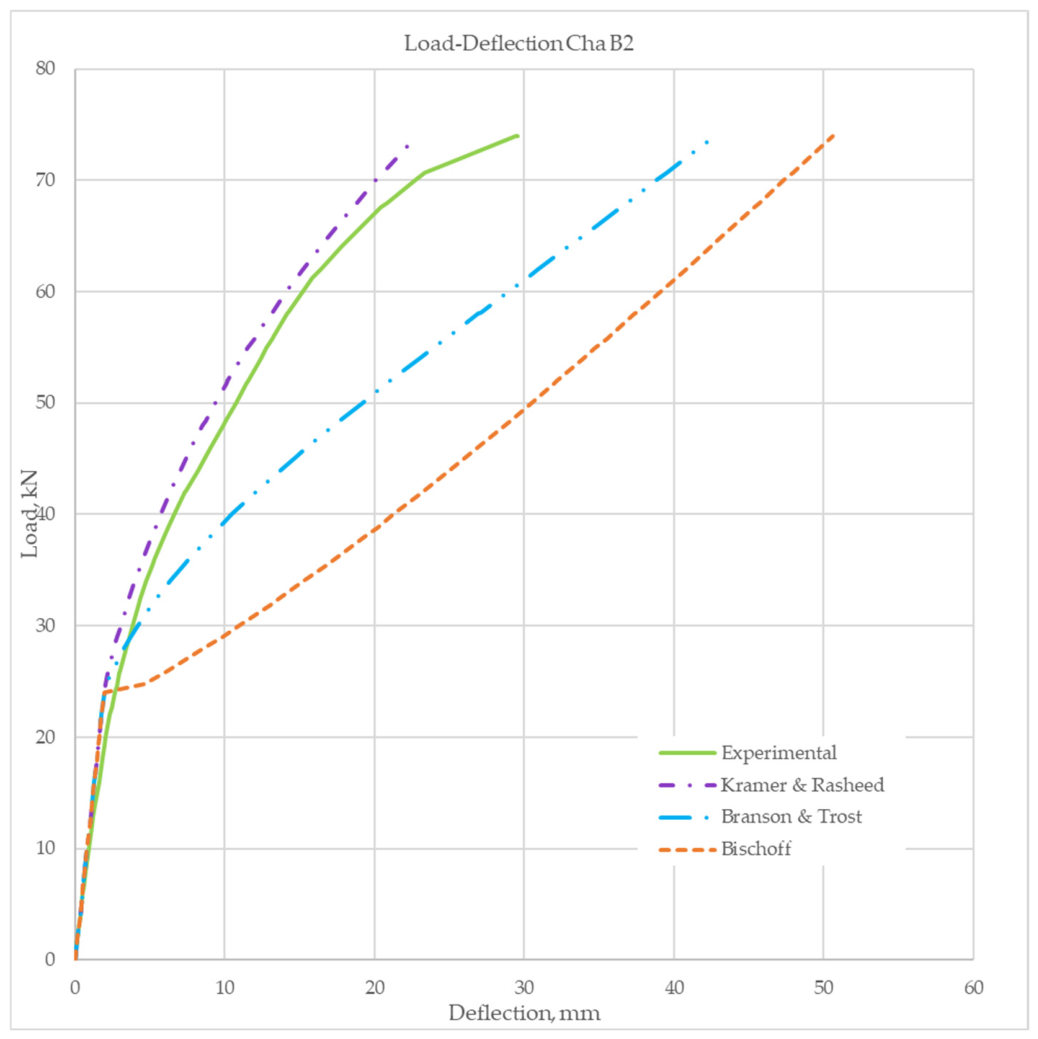
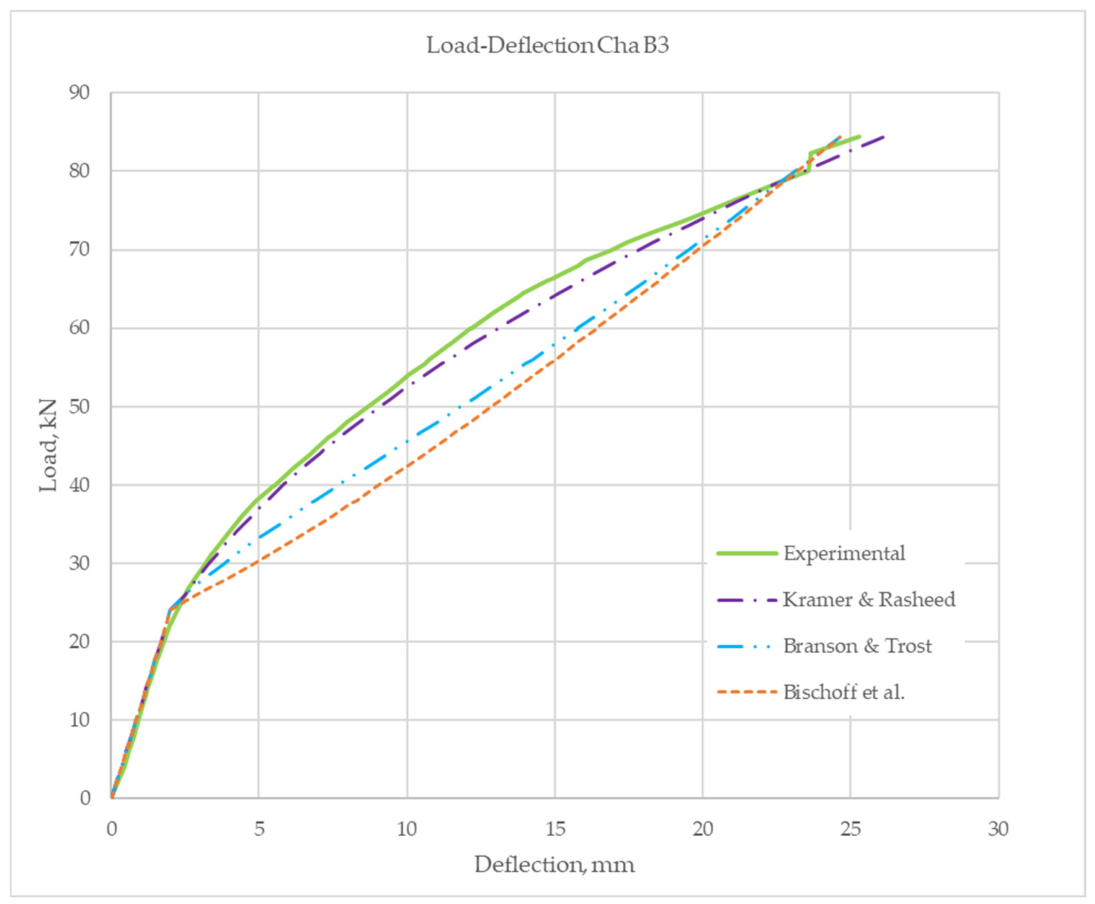
The four beam results, B2, B3, B5, and B6, were examined and are presented. When calculating the effective moment of inertia, mild steel was neglected because it was excluded from the parametric study, and most prestressed members contain only a small amount of mild steel. The experimental load-deflection responses of these beams were digitized, and the post-cracking behavior was compared with the predictions of three sets of equations: set 1—Equations (34) and (35) (Branson & Trost); set 2—Equations (36) and (37) (Bischoff et al.) [27]; and set 3—Equations (14) and (33) (Kramer & Rasheed).
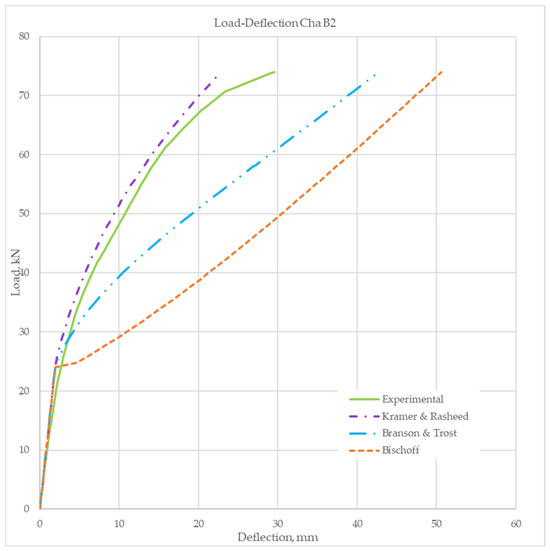
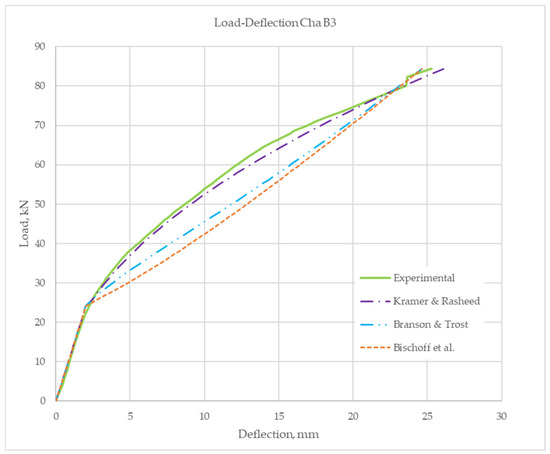
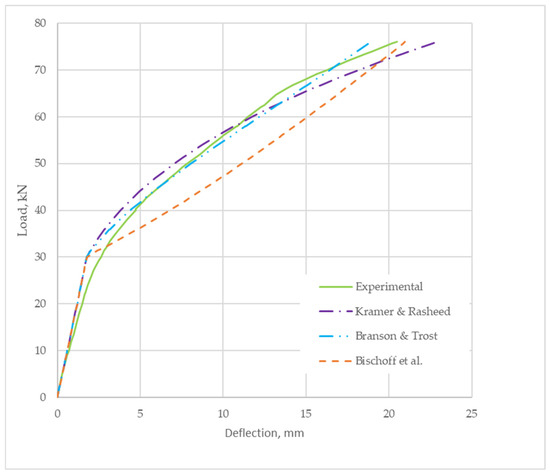
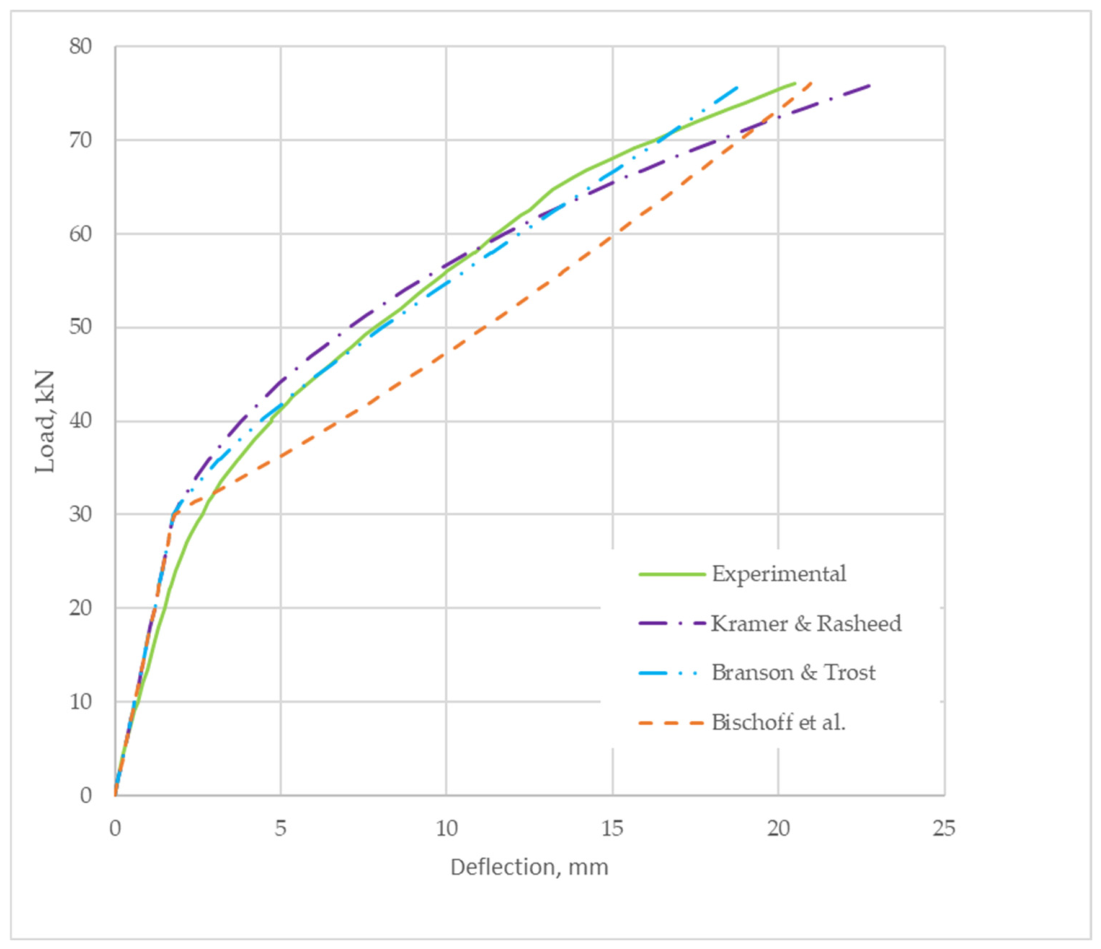
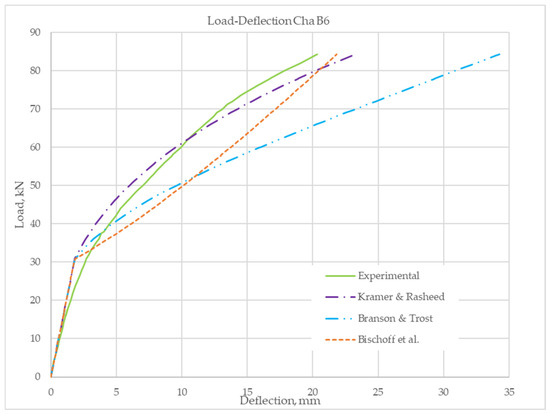
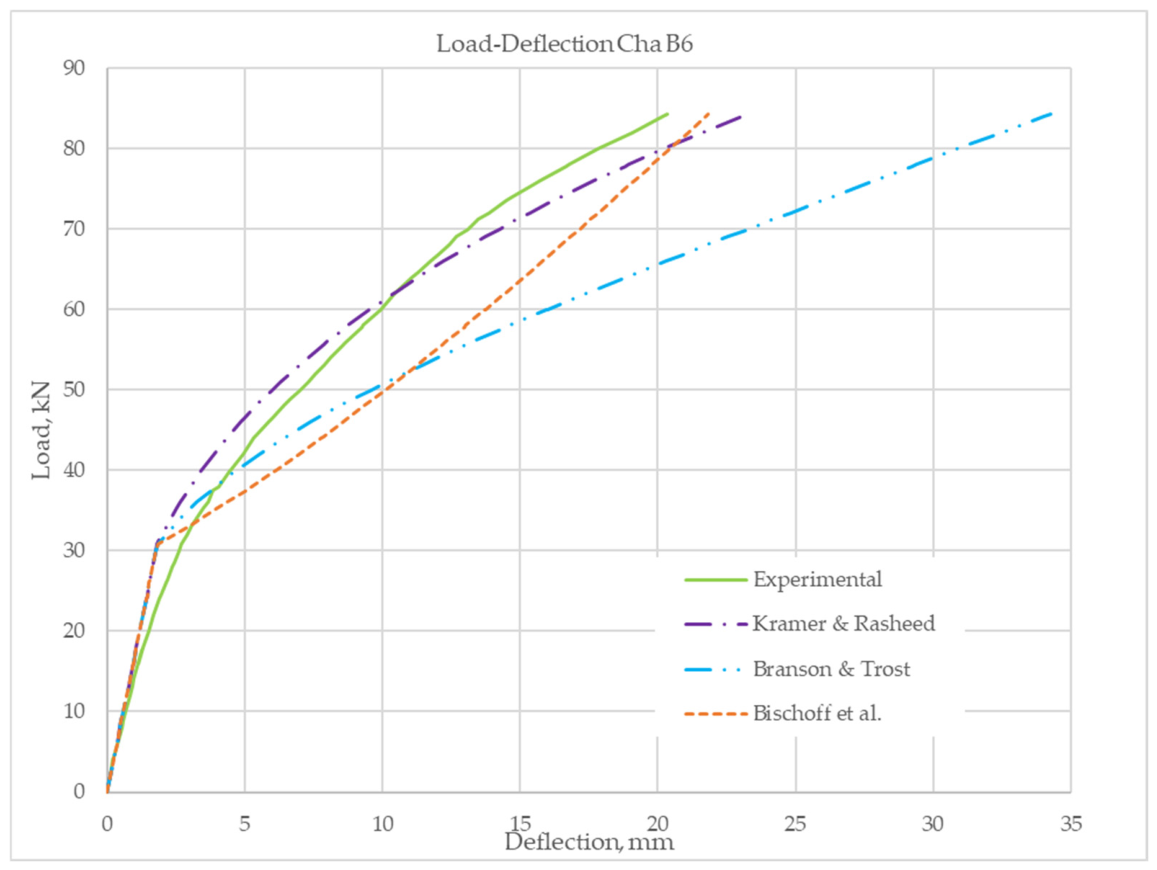
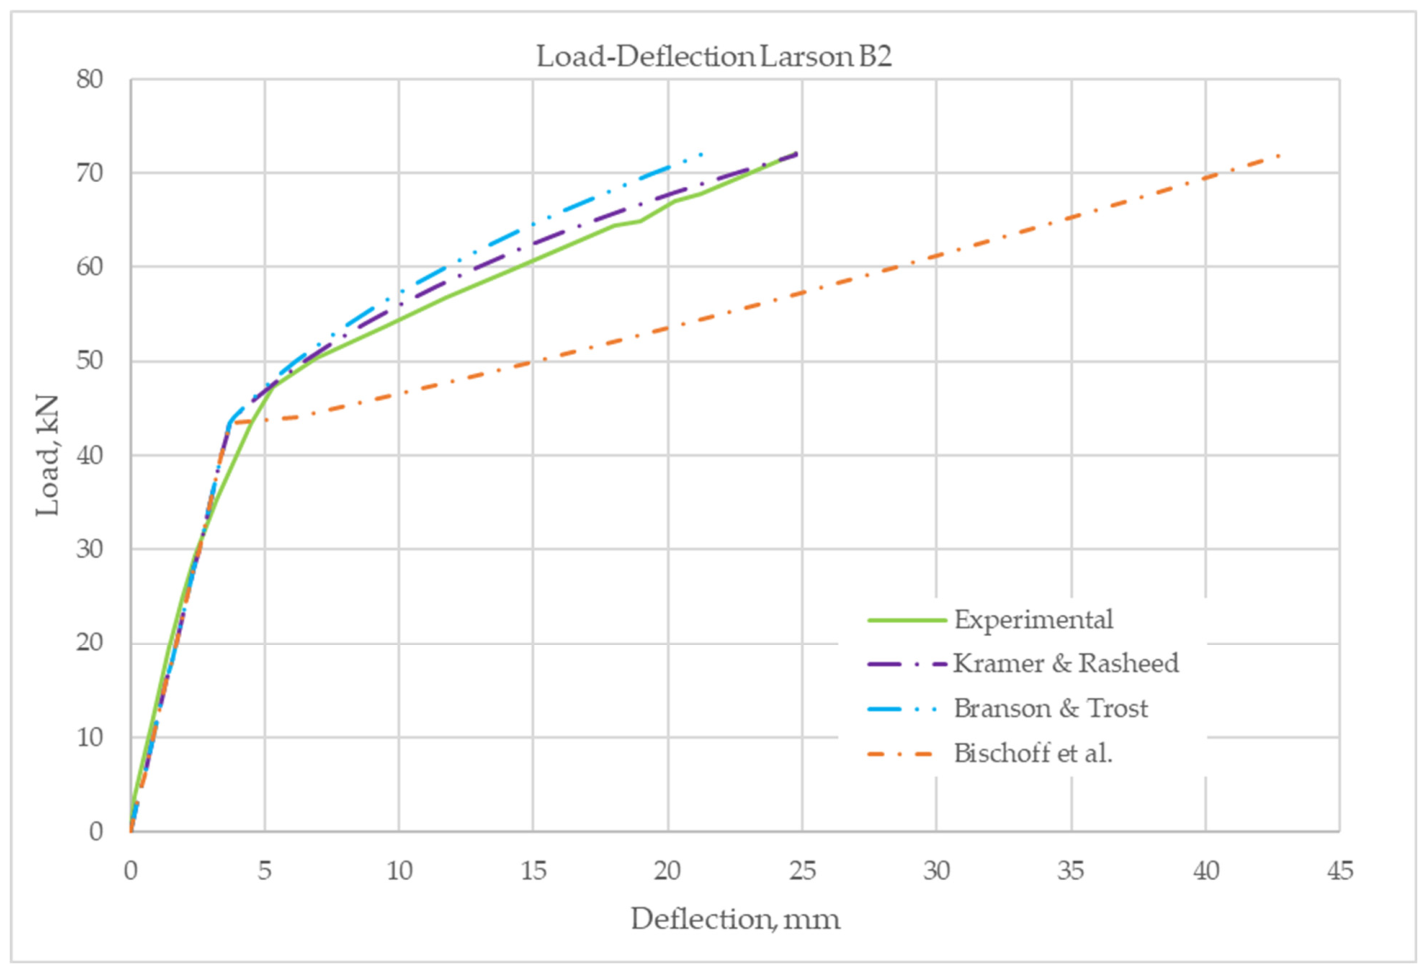
Figure 7, Figure 8, Figure 9, and Figure 10 show the load-deflection responses for the three sets of equations and the analytical predictions obtained using the methods presented. The experimental data are shown in the solid green line. The first set of equations is indicated by the blue long-dashed, two-dot line and labeled ‘Branson & Trost’ [26]. The second set of equations is shown as a medium-dashed, orange line labeled ‘Bischoff et al.’ [27]. The third set, indicated by a long-dashed and a short-dashed purple line, is from this study and is hence labeled ‘Kramer & Rasheed’. Kramer and Rasheed’s set of effective moment of inertia equations most closely matches the load-deflection behavior of the experimental Cha beams.
Figure 7.
Cha B2 [29] beam comparison of the effective moment of inertia equations for PC-FRP beams.
Figure 8.
Cha B3 [29] beam comparison of the effective moment of inertia equations for PC-FRP beams.
Figure 9.
Cha B5 [29] beam comparison of the effective moment of inertia equations for PC-FRP beams.
Figure 10.
Cha B6 [29] beam comparison of the effective moment of inertia equations for PC-FRP beams.
Table 4 summarizes the MAPE values for the three deflection-prediction approaches (sets of equations used to calculate the effective moment of inertia), using the mean absolute percentage error (MAPE) between the experimental and predicted deflections. For each experimental beam, the percentage error was calculated at each measured load increment from the onset of concrete cracking to the first yielding of the prestressing steel. The reported MAPE therefore represents the average prediction error over the entire post-cracking response, providing a more comprehensive assessment of the proposed methodology. The proposed formulation produced the lowest average MAPE of 12% compared with 35% and 66% for the other two methods, Table 4. The improved accuracy of the proposed formulation is attributed to incorporating the moment of inertia of the first prestressing steel yielding, Iey, as a governing boundary condition. In addition to using a more representative flexural stiffness distribution across the shear span (parabolic flexibility variation). By explicitly accounting for the reduction in flexural stiffness between cracking and prestressing steel yielding, the proposed equation more closely reproduces the experimentally observed load-deflection response than formulations based solely on the gross- and cracking-section properties.
Table 4.
MAPE (%) for predicted deflections of rectangular PC-FRP beams.
5.3. PRC-FRP Experimental Database—Larson et al. (2005)
To further verify the parametric study response, a fully nonlinear analysis of PC-FRP T-beams is performed using test results from beams tested by Larson et al. [30], in which five pretensioned, bonded PC T-girders were examined. The beams were cast at a prestressed concrete plant. Of the five beams tested, Beam 1 was the control beam, unstrengthened; the remaining beams (Beams 2–5) were strengthened with CFRP sheets. Static tests were performed on Beams 2 and 4 (Larson B2 and Larson B4 in Table 3); fatigue tests were performed on Beams 3 and 5. Therefore, Beam 2 (Larson B2) and Beam 4 (Larson B4) are used for this study. The girders were tested in four-point bending with a clear span of 4880 mm and a shear span of 1830 mm. The tests were conducted in monotonic, load control with a load rate of 2.2 kN/min. Midspan deflections were measured using two linear variable displacement transducers (LVDTs) mounted on either side of the flange. The average reading was reported. Before strengthening the girders, they were loaded to moments past their midspan cracking. The T-beams were strengthened with CFRP by flipping the girders onto their flanges and supporting them at a minimum of three locations along their span while the CFRP was applied and cured [30].
Larson B2 and B4 consisted of a flange width of 457 mm; flange thickness of 102.6 mm; tapered web width starting at 152.4 mm at the flange junction down to a width of 102.6 mm at the bottom; and an overall depth of 355.6 mm. The 28-day concrete strength, as determined by standard cylinder testing, was 48.6 MPa. The beams were reinforced with prestressing strands and mild reinforcement. The beams were reinforced with bonded prestressing strands conforming to ASTM A416 and non-prestressed reinforcement conforming to ASTM A616. The prestressed steel was a seven-wire strand with a nominal diameter of 10 mm and an ultimate strength of 1862 MPa. Two prestressing tendons, one located 305 mm and the other 254 mm from the top surface, were used. Four layers of mild D4-welded compression steel wire were used longitudinally at depths of 32, 76, 102, and 178 mm from the top to hold the shear stirrups and flange reinforcement in place [30].
It is important to note here that Equations (32) or (33) were established based on an extensive parametric study for rectangular sections. Therefore, it is not expected to apply directly to T-sections. To prove that, the deflections at the first yield of the prestressing steel for B2 and B4, obtained from the experimental data, are used to extract the corresponding Iey for these two sections, which are strengthened differently, to compare against the Iey developed for rectangular sections. By comparing the ratio of the Iey of the T-section to the rectangular section, a conclusion may be drawn on the necessity of establishing a second parametric study for T-sections.
Larson B2 was strengthened to achieve an average strand stress of 124 MPa under service live-load conditions. This was achieved with one layer of CFRP flexural wrap extending 57 mm up the bottom of the web sides, and transverse external stirrups were formed from a single layer of 130 mm-wide sheet at 305 mm on-center spacing. Load, midspan deflection, and strains were recorded while loading Larson B2 beam to failure. The load-deflection response of the beam is provided to verify the trilinear analytical moment-curvature response. Larson B2 beam failed by CFRP rupture [30].
Figure 11 compares the load-deflection response of the experimental Larson B2 to the three prediction methods. The experimental curve (green solid line) shows the reduction in stiffness from first yield to cracking. The Kramer and Rasheed model (purple, long-dash-dot line) closely tracks the experimental behavior throughout the loading range. After cracking, the predicted stiffness reduction closely matches the measured response, with the analytical curve remaining nearly coincident with experimental data up to yield. This indicates that the Kramer and Rasheed model accurately represents the post-cracking behavior. The Branson and Trost prediction (blue dashed-double-dot line) also follows the general trend of the experimental response, but is consistently slightly stiffer after cracking, and overestimates the effective flexural stiffness. The Bischoff et al. model (orange, short-dashed line) behaves very differently from the other methods. After the initial crack forms, the curve becomes much flatter, indicating a substantial reduction in predicted stiffness. As a result, the method predicts significantly larger deflections for a given load.
Figure 11.
Larson et al. B2 [30] beam comparison of the effective moment of inertia equations for PC-FRP beams.
It is evident that Iey for this T-section is higher than the Iey for rectangular sections (Equation (33)) by a factor of 2.13. By examining the Iey of the T-section in the next beam, which differs by the CFRP strengthening area only, we can simply conclude that a direct extension to Equation (33) may be proposed if the factor for beam B4 is comparable to 2.13. Otherwise, a separate parametric study for T-sections is needed.
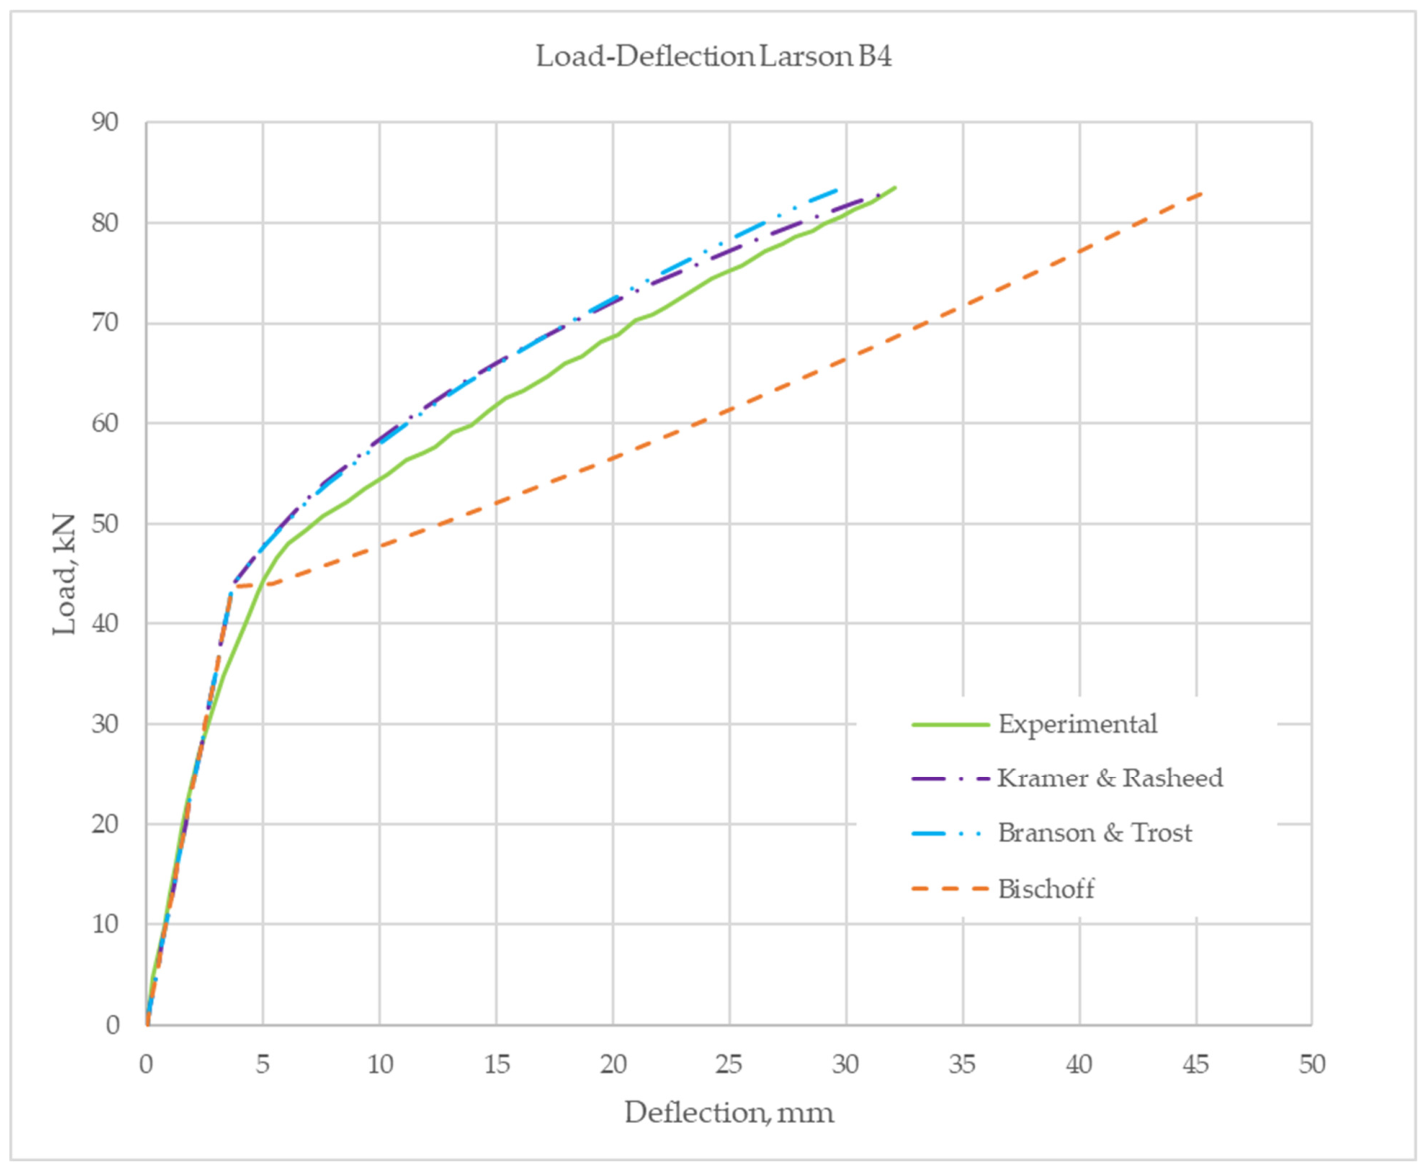
Larson B4 beam was strengthened to have a 248 MPa average stand stress range design. This was achieved with two layers of flexural CFRP, bonded to the bottom of the web and wrapped 13 mm up the sides for the first layer and 76 mm for the second. Transverse external stirrups were made of a single layer of 130 mm-wide sheet at 305 mm on-center spacing. Load, midspan deflection, and strains were recorded as the beam was loaded to failure. The beam’s load-deflection response is provided to verify the trilinear analytical moment-curvature response. Larson B4 beam failed by CFRP rupture.
Figure 12 compares the load-deflection response of the experimental Larson B4 with that of the three prediction methods. When the PC T-beams with straight strands are externally strengthened with a larger amount of CFRP, the general behavior of the three models remained similar. Both the Kramer and Rasheed and Branson and Trost models continue to capture the overall nonlinear response well, although the Branson and Trost model again predicted a stiffer response. The Kramer and Rasheed model captured the additional stiffness provided by the CRFP. In contrast, the Bischoff et al. model continued to predict substantially larger deflections after cracking.
Figure 12.
Larson et al. B4 [30] beam comparison of the effective moment of inertia equations for PC-FRP beams.
It is evident that Iey for this T-section is also higher than the Iey for a rectangular section (Equation (33)) by a factor of 1.46. Therefore, it is clear that a constant blanket factor cannot simply multiply Iey in Equation (33) since there are two factors that need to be adjusted. Therefore, if the two T-beams (B2 and B4) are used simultaneously to extract the two factors in the Iey equation, an approximate modified Iey equation for T-sections may be proposed as follows.
A wider parametric study is needed to verify the accuracy of Equation (38), which was derived from only two experimental data points and thus provides only rough guidance to the reader. It is worth mentioning that the two T-beams, Larson B2 and Larson B4, were experimentally cracked prior to loading them through the post-cracking region. This caused the load deflection curve to show lower deviation from linearity compared to the prediction curves. If this would be corrected for the three prediction methods, it would improve the relevance of these three curves with respect to the experimental curve.
5.4. Step-by-Step Calculation Procedure
To apply the procedure, the designer first determines the cracked-transformed moment of inertia, Icr, and the gross-transformed moment of inertia, Igt, using conventional section analysis. Next, the moment of inertia at first prestressing steel yielding, Iey, is calculated using the relationships developed herein. The effective moment of inertia, Ie, is then obtained from the proposed equation using Igt, Iey, and the applied moment level. Finally, the calculated value of Ie is substituted into the conventional elastic beam deflection equations to determine the member’s immediate deflection. Thus, the proposed procedure can be implemented using familiar design calculations without requiring detailed moment-curvature analysis.
6. Conclusions
Serviceability, particularly deflection control, is a critical consideration in the strengthening of PC members. The use of high-strength materials often leads to more slender structural elements, increasing susceptibility to excessive deflections—especially after cracking, which significantly reduces member stiffness. Accurate prediction of deflection remains challenging due to variability in material properties (e.g., concrete modulus of elasticity), time-dependent effects (creep and shrinkage), and environmental influences. As such, deflection calculations should be interpreted as estimates, and analytical approaches must strike a balance between rigor and practicality.
This study presents a simplified yet rational method for estimating instantaneous deflection in PC-FRP with straight strands. The general method can be applied to any member shape, but Iey has been calibrated for rectangular sections. Therefore, generating an Iey equation calibrated for other sections is recommended for future work. The approach is based on a trilinear moment–curvature relationship, which has been shown to accurately capture the structural response through comparisons with both numerical models and experimental data.
A comprehensive parametric study involving 8100 simulations on rectangular sections further evaluates the sensitivity of flexural stiffness to key variables, including the prestressing ratio, CFRP reinforcement ratio, material moduli, section geometry, and cracking behavior. Building on these findings, a generalized design procedure is introduced using an alternative formulation of the effective moment of inertia. This approach incorporates the relative stiffness and area contributions of prestressing steel and CFRP, as well as the influence of tension stiffening through the ratio of cracking moment to applied moment (Mcr/Ma), cracking moment to yielding moment (Mcr/My), and applied moment to yielding moment (Ma/My). Adjustments to these ratios, alongside consideration of the effective moment of inertia at yielding-to-gross transformed moment of inertia, enable improved prediction of post-cracking deflection behavior.
Validation is performed on four rectangular, experimentally tested PC-FRP beams, all subjected to four-point bending and strengthened with varying CFRP layers. The proposed method demonstrates strong agreement with observed load–deflection behavior across a wide range of material properties, including concrete compressive strengths from 35 to 70 MPa and prestressing steel with an ultimate strength of 1862 MPa. The effective Iey equation established for rectangular sections is further scrutinized by comparing it with two T-beams strengthened with different levels of CFRP. This Iey equation was shown to be inadequate for T-sections and was therefore adjusted to accommodate a different geometry.
It should be noted that the experimental validation database used in this study comprises only six PC-FRP beams. Although these specimens were selected from the available literature for their completeness of reported data, they do not encompass the full range of structural configurations considered in the parametric investigation. Consequently, the experimental program serves as an initial validation of the proposed methodology rather than a comprehensive verification of all examined parameter combinations. Additional experimental data would be beneficial for further assessing the robustness and general applicability of the proposed model.
Overall, the proposed method provides a practical and accurate approach for estimating short-term deflections of CFRP-strengthened pretensioned bonded PC flexural members with straight strands in four-point bending. Comparisons with experimental results demonstrated that the method captures the stiffness transition from uncracked to cracked behavior while remaining sufficiently simple for design applications.
Author Contributions
K.W.K.: validation; formal analysis; resources; data curation; writing—original draft preparation. H.A.R.: conceptualization, methodology, investigation, writing—review and editing, supervision, project administration. All authors have read and agreed to the published version of the manuscript.
Funding
This research received no external funding.
Data Availability Statement
Data are available from the author on reasonable request.
Conflicts of Interest
The authors declare no conflicts of interest.
Abbreviations and Symbols
The following abbreviations and symbols/notations are used in this manuscript:
| Abbreviations | |
| ACI | American Concrete Institute |
| CFRP | Carbon fiber-reinforced polymer |
| cgc | Center of gravity |
| FRP | Fiber-reinforced polymer |
| PC | Prestressed (pretensioned) reinforced concrete |
| Symbols | |
| Af | Total effective area of FRP external reinforcement |
| Agt | Gross transformed moment of inertia of section including |
| Aps | Area of prestressing steel in tension |
| Aps,max | Maximum area of prestressing steel to have a net extreme fiber in tension strain equal to 0.005 |
| amax | Depth of equivalent stress block corresponding to the maximum prestressing steel necessary to have a net extreme fiber in tension strain equal to 0.005 |
| a1 | Coefficient 1 |
| a2 | Coefficient 2 |
| b | Width of beam |
| bf | Flange width of beam for T-section |
| bw | Web width of beam for T-section; bw = b for rectangular section |
| c | Distance from extreme compression fiber to the neutral axis |
| cb | Distance from the center of gravity of the section to the extreme bottom fiber of the concrete |
| cn | Depth of the neutral axis measured from the extreme compression fiber at ultimate moment |
| cy | Depth of the neutral axis measured from the extreme compression fiber at first yield of prestressing steel |
| df | Effective depth of the CFRP reinforcement from the extreme fiber in compression to the centroid of the CFRP |
| dps | Effective depth of the prestressing steel from the extreme fiber in compression to the centroid of the strands |
| Ec | Concrete modulus of elasticity |
| Ef | Tensile modulus of elasticity of CFRP |
| Eps | Modulus of elasticity of the prestressing steel |
| EcIgt | Slope of the line in the uncracked region |
| EcIn | Slope of the line in the postyield region |
| EcIy | Slope of the line in the postcracked region |
| e | distance from the center of gravity of the section to the extreme bottom fiber of the concrete |
| f′c | 28-day specified concrete compressive strength |
| ff | Tensile stress in CFRP |
| ffu | Ultimate tensile stress |
| fpe | Average axial compressive stress in the transformed section resulting from the effective prestressing force |
| fps | Prestressing steel reinforcement stress |
| fpsy | Nominal yielding tensile strength in the prestressing steel reinforcement corresponding to 1% strain |
| fr | Modulus of rupture |
| GPa | Giga Pascal |
| h | Height of beam |
| ht | Height (thickness) of flange for T-section |
| Icr | Cracking moment of inertia (transformed) |
| Ie | Effective moment of inertia |
| Iey | Effective girder moment of inertia at first yielding of prestress strands |
| Igt | Gross transformed moment of inertia |
| kN | Kilo Newton |
| L | Clear span length of the member |
| La | Shear span, distance from support to point of loading in four-point bending |
| Lg | Distance from support to location of cracking moment section and bounds the uncracked region |
| Ly | Distance from support to location of first yielding moment of prestressing steel |
| M | Moment |
| MPa | Mega Pascal |
| Ma | Maximum applied moment at the load application (midspan for four-point bending) |
| Mcr | Cracking moment |
| Min | Moment at zero applied dead and live loads, initial moment due to prestressing |
| Mn | Nominal ultimate moment |
| My | Moment at the first yielding of prestressing steel |
| mm | Millimeters |
| P | Total applied load |
| Pe | Equivalent prestressed force |
| R | Dimensionless parameter combining concrete cracking moment, effective prestressing, and sectional properties |
| R2 | Coefficient of determination, proportion of variance in y explained by x |
| Sbot | Bottom gross transformed section modulus |
| t | Thickness of FRP sheet applied |
| Ratio of cracking moment to maximum applied moment | |
| Factor relating the depth of the equivalent rectangular compressive stress block to the depth of the neutral axis | |
| Ratio of maximum applied moment to moment at the first yielding of prestressing steel | |
| Δmidspan | Midspan deflection |
| Uncracked region’s midspan deflection influence | |
| Postcracked region’s midspan deflection influence | |
| Postyield region’s midspan deflection influence | |
| ɛbi | Initial substrate strain |
| εps | Yield strain of prestressing steel at first yield corresponding to 1% strain |
| εty | Yield strain of steel |
| ε1 | Strain in the prestress strands due to initial tension after losses |
| ε2 | Strain in the strands due to initial eccentricity (decompression strain) |
| ε3 | Incremental prestressing steel strain due to external loading, determined from strain compatibility |
| λ | Ratio of the axial stiffness of prestressing steel and CFRP reinforcement |
| λcr | Cracking moment modification factor accounting for the relative proportions of prestressing and nonprestressed (mild) reinforcement |
| Ratio of cracking moment to moment at the first yielding of prestressing steel | |
| ρf | CFRP reinforcement ratio |
| ρps | Prestressing steel reinforcement ratio |
| ρps, max | Maximum prestressing steel reinforcement ratio |
| ρps, min | Minimum prestressing steel reinforcement ratio |
| ρs | Mild tension steel reinforcement ratio |
| ϕa | Applied moment curvature |
| ϕcr | Curvature at cracking |
| ϕcr-y(x) | Curvature within the postcracked region |
| ϕin | Initial first curvature |
| ϕn | Curvature corresponding to the ultimate moment of the section |
| ϕun(x) | Curvature within the uncracked region |
| ϕy | Curvature corresponding to first yielding of prestressing steel |
| ϕy-n(x) | Curvature within the postyield region |
| ω | Normalized prestressing reinforcement index; represents the mechanical amount of prestressing reinforcement relative to the concrete |
References
- Branson, D.E. Report No. 7, Instantaneous and Time-Dependent Deflections of Simple and Continuous Reinforced Concrete Beams; Alabama Highway Research Report; Bureau of Public Roads: Alexandria, VA, USA, 1963. [Google Scholar]
- Branson, D.E. Instantaneous and Time-Dependent Deflections of Simple and Continuous Reinforced Concrete Beams, Part I; Alabama Highway Department: Auburn, MA, USA, 1965. [Google Scholar]
- Tadros, M.K.; Ghali, A.; Meyer, A.W. Prestressed Loss and Deflection of Precast Concrete Members. PCI J. 1985, 30, 114–141. [Google Scholar] [CrossRef] [Scilit]
- Corely, W.G.; Sozen, M.; Siess, C.P. Time-Dependent Deflections of Prestressed Concrete Beams; National Academy of Sciences-National Research Council: Washington, DC, USA, 1961. [Google Scholar]
- ACI Committee 318, ACI CODE 318-25; Building Code Requirements for Structural Concrete and Commentary. American Concrete Institute: Farmington Hills, MI, USA, 2025.
- C. 319, ACI/PCI CODE 319-25; Structural Precast Concrete—Code Requirements and Commentary. American Concrete Institute and Precast/Prestressed Concrete Institute: Farmington Hills, MI, USA, 2025.
- Nasreddine, W.; Obeidah, A.; Bischoff, P.H.; Nassif, H. Assessment of deflection prediction models for cracked prestressed concrete beams. ACI Struct. J. 2023, 120, 167–179. [Google Scholar] [CrossRef] [Scilit]
- ACI Committee 435; Control of deflection in concrete structures (ACI 435R-95). American Concrete Institute: Farmington Hills, MI, USA, 1995.
- Prescast/Prestressed Concrete Institute (PCI). PCI Design Handbook: Precast and Prestressed Concrete, 8th ed.; PCI: Chicago, IL, USA, 2017. [Google Scholar]
- Mast, R.F. Deflection of prestressed concrete members. PCI J. 1998, 43, 92–101. [Google Scholar]
- Naaman, E. Time-dependent deflection of prestressed beams by the pressure-line method. PCI J. 1983, 28, 60–85. [Google Scholar] [CrossRef] [Scilit]
- Ghali, A.; Favre, R. Concrete Structures: Stresses and Deformations; Chapman and Hall: London, UK, 1986; p. 352. [Google Scholar]
- Hawileh, R.A.; Rasheed, H.A.; Abadalla, J.A.; Al-Tamimi, A.K. Behavior of reinforced concrete beams strengthened with externally bonded FRP systems. Mater. Des. 2015, 65, 872–881. [Google Scholar]
- Charkas, H.; Rasheed, H.A.; Melhem, H. Rigorous Procedure for Calculating Deflections of Fiber-Reinforced Polymer-Strengthened Reinforced Concrete Beams. ACI Struct. J. 2003, 100, 529–539. [Google Scholar]
- El-Maaddawy, T. Flexural behavior of prestressed concrete beams strengthened with externally bonded FRP laminates. Compos. Struct. 2013, 95, 346. [Google Scholar]
- Kramer, K.W.; Rasheed, H.A. Analyitical Load Deflection Behavior of Prestressed Concrete Girders Strengthened with FRP. ACI SP J. 2018, 16 327, 13.1–13.20. [Google Scholar] [CrossRef] [Scilit]
- Kramer, K.W.; Rasheed, H.A. Innovative Analytical Solution for Prestressed Concrete Flexural Members with Harped Strands Strengthened Externally with FRP. In Proceedings of the12th International Conference on FRP Composites in Civil Engineering (CICE 2025), Lisbon, Portugal, 14–16 July 2025; Springer: Cham, Switzerland, 2026; Volume 2, pp. 594–604. [Google Scholar]
- ACI PRC-440.2-23; Design and Construction of Externally Bonded FRP Systems for Strengthening Concrete Structures. ACI: Farmington Hills, MI, USA, 2023; p. 109.
- Khorasani, M.; Muciaccia, G.; Consiglio, A.N.; Mostofinejad, D. Evaluating the behavior and bond properties of FRP spike anchors under confined conditions and elevated temperature. Compos. Struct. 2023, 322, 117407. [Google Scholar] [CrossRef] [Scilit]
- Zaki, M.A.; Rasheed, H.A. Impact of efficiency and practicality of CFRP anchor installation techniques on the performance of RC beams strengthened with CFRP sheets. Can. J. Cvil Eng. 2019, 46, 796–809. [Google Scholar] [CrossRef] [Scilit]
- Rasheed, H.A.; Dinno, K.S. An improved nonlinear analysis of reinforced concrete frames. Comput. Struct. 1994, 53, 625–636. [Google Scholar] [CrossRef] [Scilit]
- Rasheed, H.A.; Charkas, H.; Melhem, H. Simplified Nonlinear Analysis of Strengthened Concrete Beams Based on a Rigorous Approach. J. Struct. Eng. 2004, 130, 1087–1096. [Google Scholar] [CrossRef] [Scilit]
- Prescast/Ptrestressed Concrete Institute (PCI). PCI Design Handbook: Precast and Prestressed Concrete, 9th ed.; PCI: Chicago, IL, USA, 2025. [Google Scholar]
- American Association of State Highway and Transportation Officials (AASHTO). AASHTO LRFD Bridge Design Specifications, 10th ed.; AASHTO: Washington, DC, USA, 2024. [Google Scholar]
- American Society for Testing and Materials. ASTM A416/A416M-25; Standard Specification for Low-Relaxation, Seven-Wire Steel Strand for Prestressed Concrete. ASTM: West Conshohocken, PA, USA, 2025.
- Branson, D.E.; Trost, H. Unified Procedures for Predicting Centroidal Axis Location of Partially Cracked Nonprestressed and Prestressed Concrete Members. ACI J. 1982, 79, 119–130. [Google Scholar]
- Bischoff, P.H.; Nasreddine, W.; Nassif, H. Computing Deflections Using ACI CODE-318-19 and Beyond, Part 5. Concr. Int. 2025, 47, 35–41. [Google Scholar] [CrossRef] [Scilit]
- Kramer, K.W. Load-Deflection Response of Prestressed Concrete Beams Strengthened with FRP: A Comprehensive Perspective; Kansas State University: Manhattan, KS, USA, 2020. [Google Scholar]
- Cha, J.Y. Analysis of Prestressed Concrete Beams Strengthened with Carbon Fiber Composites; The State University of New Jersey: New Brunswick, NJ, USA, 2001. [Google Scholar]
- Larson, K.H.; Peterman, R.J.; Rasheed, H.A. Strength–fatigue behavior of fiber-reinforced polymer strengthened prestressed concrete T-beams. J. Compos. Constr. 2005, 9, 313–326. [Google Scholar] [CrossRef] [Scilit]

Disclaimer/Publisher’s Note: The statements, opinions and data contained in all publications are solely those of the individual author(s) and contributor(s) and not of MDPI and/or the editor(s). MDPI and/or the editor(s) disclaim responsibility for any injury to people or property resulting from any ideas, methods, instructions or products referred to in the content. |
© 2026 by the authors. Licensee MDPI, Basel, Switzerland. This article is an open access article distributed under the terms and conditions of the Creative Commons Attribution (CC BY) license.