


Abstract
Pavement damages along the Qinghai–Xizang Highway (QXH) in permafrost regions are jointly controlled by geographical and engineering factors, leading to higher damage rates than in non-permafrost regions. However, the overall development trend of these damages and the spatial–temporal patterns have not been systematically quantified. To analyze the spatial distribution of different pavement damages, reveal the spatial–temporal associations, and analyze the spatial heterogeneity of the driving factors, three field surveys were conducted in 2014, 2019 and 2024, with records of seven major pavement damages. Statistical analyses were used to examine the relationships among single and co-occurring damages. Then, a novel geographical model, combining a graph convolutional network with multi-scale geographically weighted regression (GCN-MGWR), was further developed to treat the QXH as a linear geographic unit and to assess the spatial heterogeneity and relative contribution of different influencing factors. The results show that the mean pavement damage ratios in permafrost regions during the three surveys are 4.21%, 6.82%, and 4.74%, respectively, with crack-type damages (transverse, longitudinal, and block cracking) exhibiting the highest occurrence rates. The three strongest pairs of correlations are transverse and longitudinal cracking (0.584), transverse and block cracking (0.570), and waving and rutting (0.622). The primary factors influencing crack-type damages are embankment thickness, mean annual ground surface temperature (MAGST), elevation and existing damages. Transverse and longitudinal cracking show a pronounced increase with rising MAGST, and embankment thickness below 1 m or above 4 m significantly contribute to the development of both crack types (SHAP > 0.5). Overall, the evolution of crack-type damages has shifted from being primarily controlled by geographical factors to being controlled by the combined influence of engineering and geographical factors during 2014–2024. The factor contributions identified by the GCN-MGWR model provide quantitative support for the regional adaptive design and specific maintenance of roadway in permafrost regions.
1. Introduction
The Qinghai–Xizang Highway (QXH) is a major transportation route connecting Qinghai Province and Xizang Autonomous Region in China, with a total length of 1937 km [1]. It is not only the highest and longest asphalt highway in the world, but also traverses through permafrost, island permafrost, and seasonal frozen soil regions [2]. The natural condition along the QXH is poor, with large temperature fluctuation, strong radiation, and little precipitation. These special geographical factors have a significant impact on the pavement performance along the highway [3]. Since its operation in 1954, the strong heat-absorbing effect of the asphalt pavement and the closed asphalt structural system have disrupted the hydrothermal balance and moisture migration conditions within the QXH, causing related damage problems to become increasingly pronounced [4,5]. The QXH has undergone four large-scale renovations and numerous repairs, consuming a large amount of financial resources [6]. Along the QXH, engineering distress is divided into pavement damage and embankment distress. These various types of distress are interrelated and mutual [7], which are closely related to permafrost conditions, as well as geographical factors, pavement materials, and construction technology [8]. Therefore, defining the spatial distribution of different pavement damages and the mutual interactions along the QXH with geographical factors is crucial for elucidating formation mechanisms and clarifying development patterns.
The occurrence rate of pavement damages in permafrost regions is markedly higher than that in other regions [9]. This is mainly attributed to the special properties of warm and high-ice-content frozen soil, such as low strength, high temperature sensitivity, and high compressibility [10]. In addition, embankment thickness is closely associated with pavement damages: both lower and higher embankment designs may aggravate the development of pavement damages, and embankment deformation in particular has become a trigger for pavement cracking [11]. Therefore, an in-depth understanding of the development and evolution of pavement cracking is crucial for formulating effective mitigation and control measures. Existing studies have preliminarily revealed the overall distribution patterns of pavement damages and their main influencing factors. Based on field investigations, researchers have documented in detail the types, occurrence, and spatial distribution of pavement damages along the QXH [12,13] and have further examined the causative mechanisms, development characteristics, and temporal evolution [14]. Furthermore, scholars have proposed targeted engineering prevention and control measures, along with related recommendations, which have laid a solid basis for a more scientific and objective understanding of pavement damages along the QXH [15,16]. However, the damage problems along the QXH are not confined to the pavement itself; the complex engineering geological conditions along the highway are also closely linked to pavement damages [17,18]. In addition, the formation of pavement damages in high-altitude regions is closely tied to geographical factors. These areas are typically characterized by harsh weather and heavy temperature variations, so the pavement is subjected to pronounced freezing–thawing cycles [19].
Multiple types of pavement damage pose a direct threat to the operation of the QXH. Due to the lack of long-term monitoring data, there is no systematic research on the spatial distribution of types of pavement damage and how these different types affect each other. Furthermore, the coupling mechanisms of types of pavement damage and the driving factors have not yet been quantified. As a result, it is difficult to determine the macro-space spatial heterogeneity of influencing factors and to establish quantitative relationships. To address these gaps, we focus on the formation and evolution of pavement damage along the QXH. We conducted three field surveys over the past decade: in 2014, 2019, and 2024. The 465 km permafrost section along the QXH and the associated geographical and engineering factors were treated as an integrated spatial system. We used this to derive the spatial distribution of pavement damage and compare the damage intensity, evolution, and relationships of types of damage across the different survey years. We developed a geographical model (GCN-MGWR) to analyze adjacency dependencies along the QXH, as well as spatial differentiation in relation to geographical and engineering factors. The model connects the observed phenomena to their underlying mechanisms and, ultimately, to engineering applications. Based on the damage observations, we systematically characterized the spatiotemporal evolution of pavement damage and the spatial heterogeneity of key geographical factors over the past decade. Our study provides a scientific basis for the zoned adaptive design of planned projects and differentiated maintenance policies for existing infrastructure.
2. Study Area
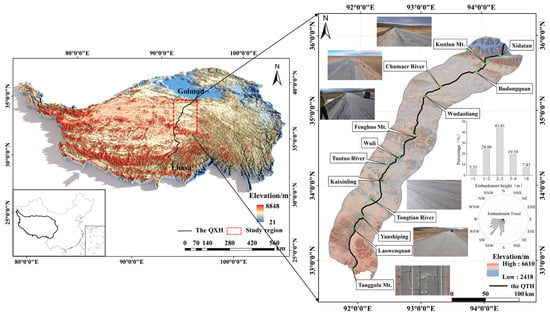
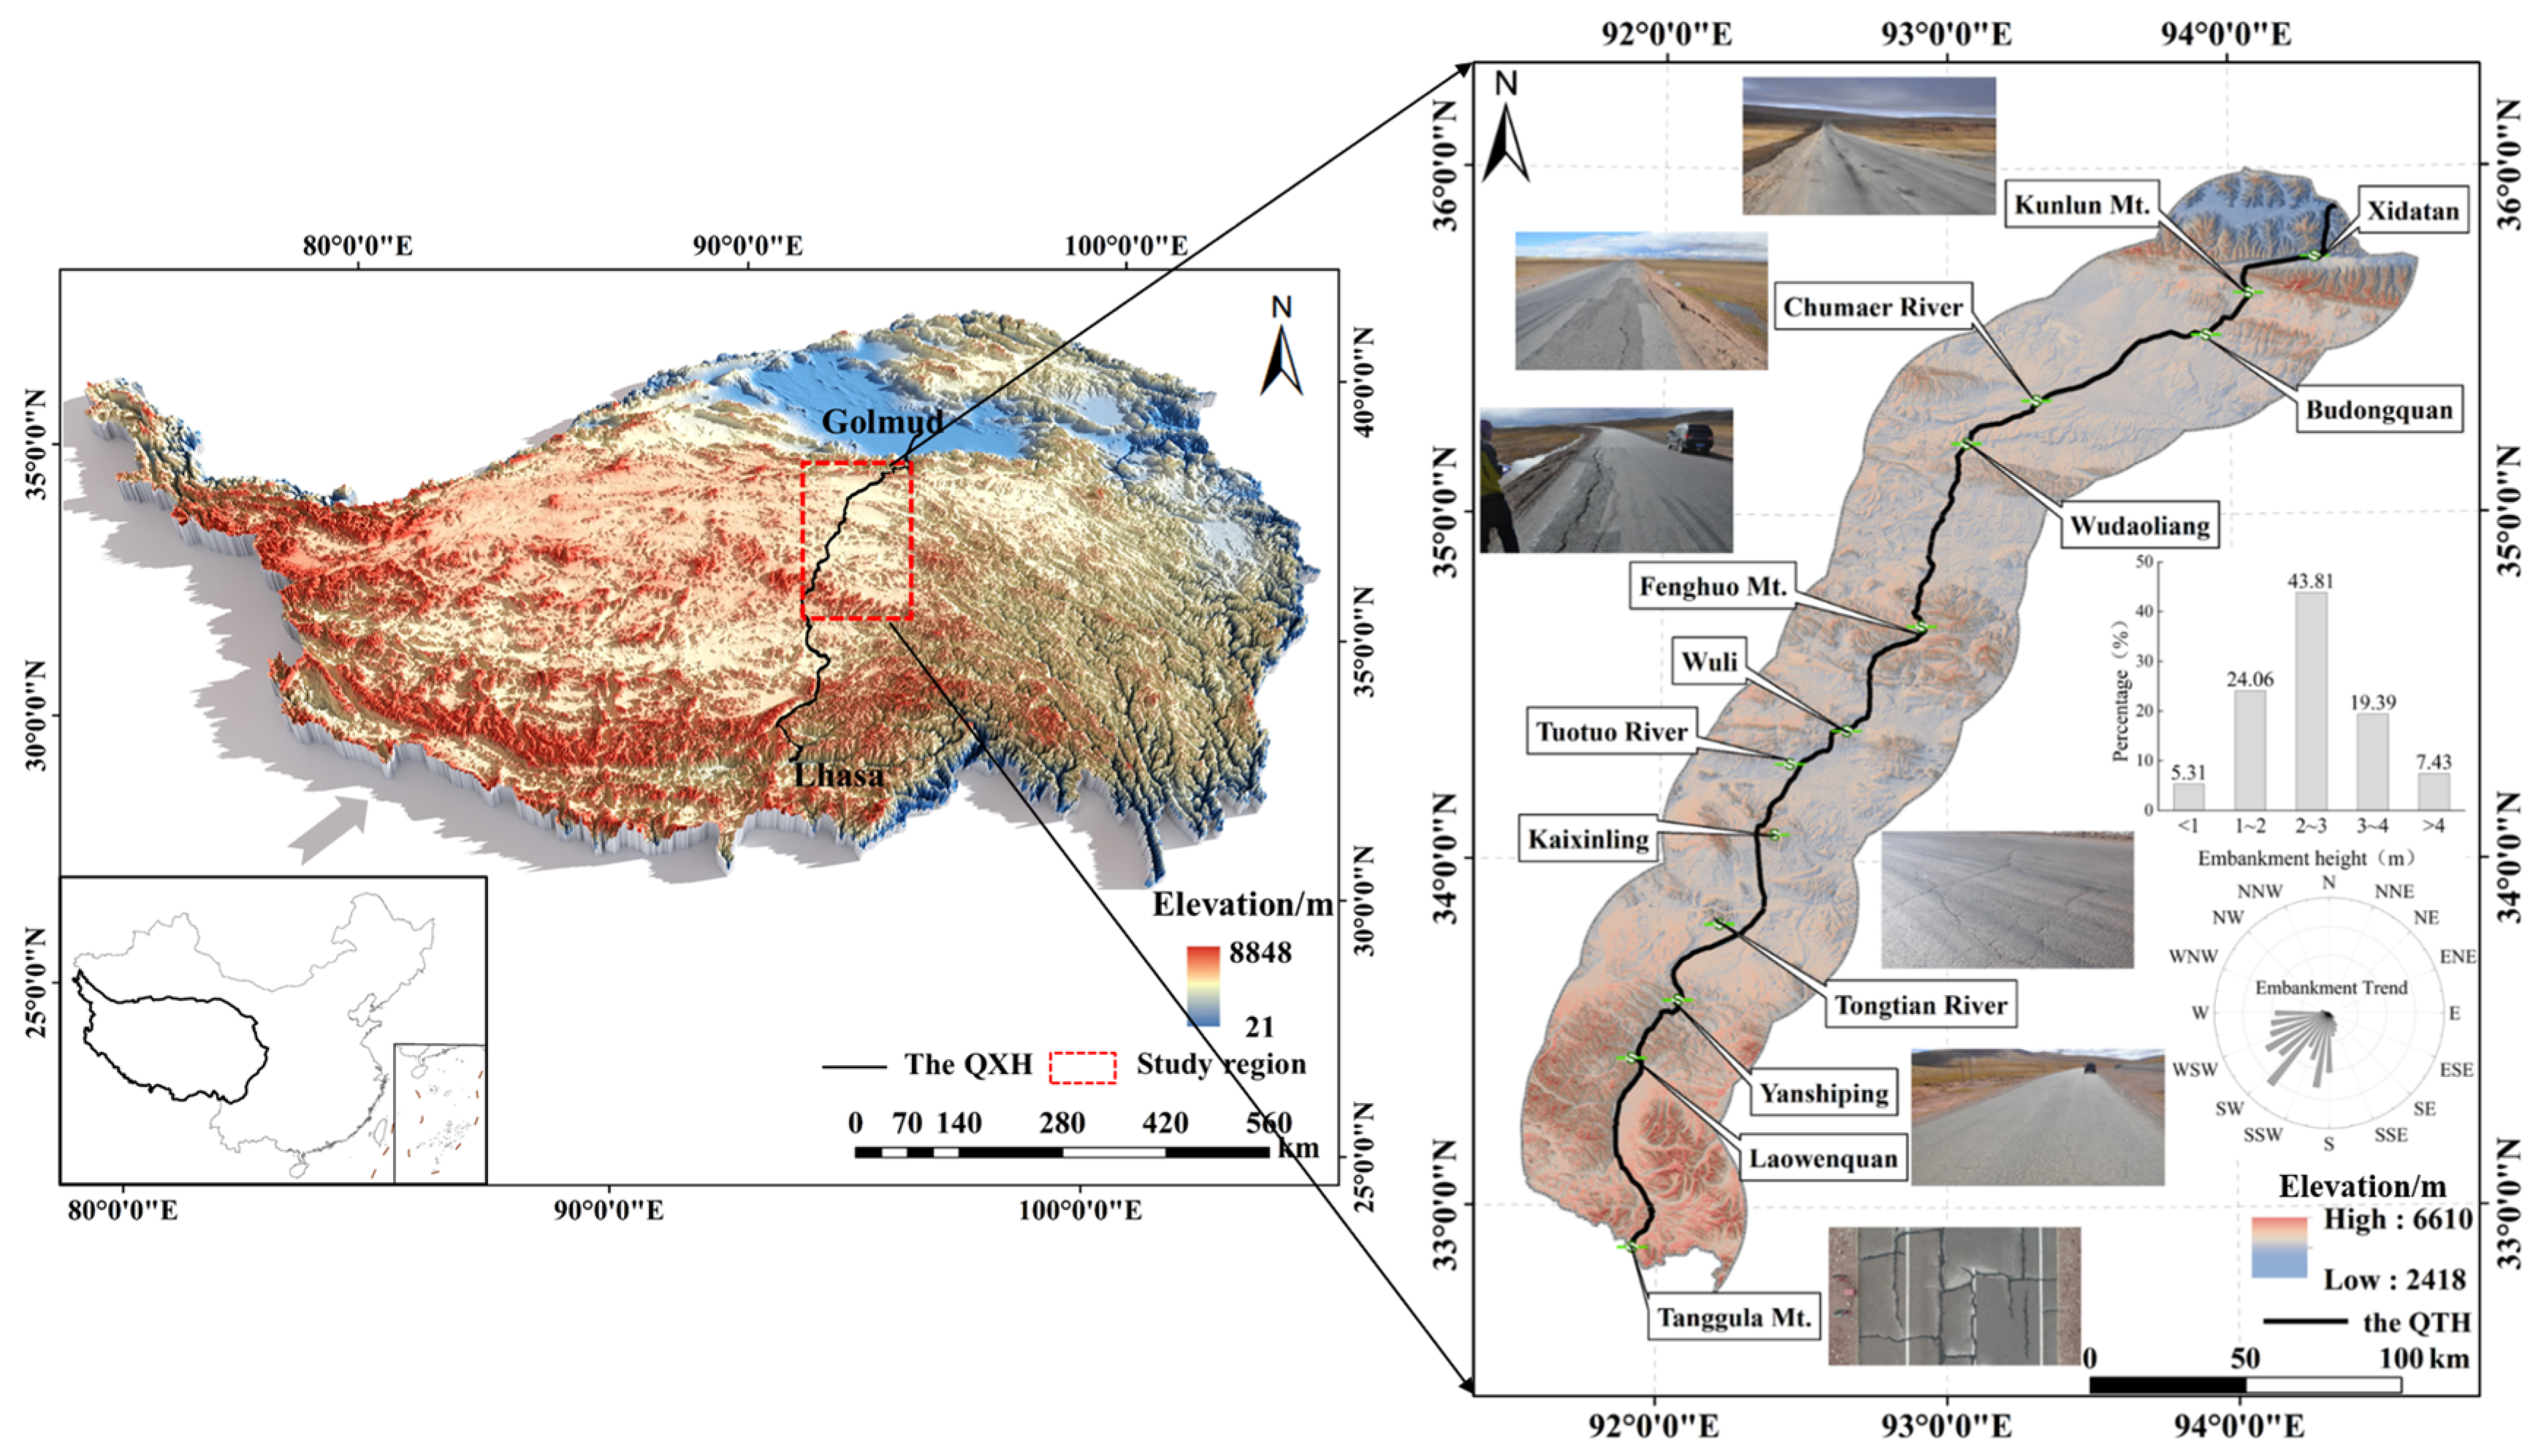
This study focuses on the permafrost section of the QXH between Xidatan and Tanggula Mountain (Figure 1). The average elevation along this highway exceeds 4700 m, and the terrain is highly irregular with pronounced relief. The QXH experiences low air temperatures and large temperature variations, with a mean annual temperature of only −4.1 °C and an extreme minimum temperature down to −45 °C. The permafrost layer is approximately 80–200 m thick, while the active layer is 2–4 m thick and varies with the seasons [12,20]. Owing to the strong thermal sensitivity of frozen soil, freezing and thawing cycles induce marked changes in its mechanical properties. These changes lead to pavement deformation, frost heave, and differential settlement. These in turn directly undermine the durability and stability of embankments and consequently degrade the traffic capacity and operational safety of the highway [21].
Figure 1.
Schematic of the study area.
3. Research Methods and Data
3.1. Data Sources
Data on pavement damage and embankment thickness for the studied region were obtained through on-site investigations. Elevation and slope were sourced from digital elevation models (DEMs). Mean annual surface temperature was acquired from the International Science Data Mirror Site of the Computer Network Information Center of the Chinese Academy of Sciences (http://www.gscloud.cn). Vegetation coverage data were obtained from Moderate Resolution Imaging Spectroradiometer (MODIS) 250 m resolution normalized difference vegetation index (NDVI) products from the same source. Embankment trend data were derived from road vector maps (https://www.cnic.cn/).
In addition to the quantitative data collected on pavement damage, embankment thickness, and environmental variables, traffic loading is considered as a background operational factor. While continuous traffic-volume data were not systematically recorded, the observed patterns of pavement damage along the highway implicitly reflect the effects of repeated vehicle loading, particularly in sections with concentrated cracking, rutting, or waving. Therefore, the analysis in this study focuses on the spatial effects of geographical, engineering, and pre-existing damage factors that can be consistently characterized along the entire 465 km permafrost section.
3.2. Research Methods
3.2.1. Classification of Pavement Damage
Field investigations were conducted in August 2014, August 2019, and August 2024 to assess pavement damage along the QXH from Xidatan to Tanggula Mountain. The same 465 km permafrost section was surveyed in all three years and divided into 465 one-kilometer units for statistical analysis and modeling, with no missing road sections. The samples from the three surveys were matched by mileage, and the original records were checked to exclude obvious recording errors while retaining all valid field-observed damage records. Based on the Chinese highway industry standard Evaluation Standards for Highway Technical Conditions (JTG 5210-2018) (Ministry of Transport of the People’s Republic of China, 2018) [22], seven types of pavement damage were identified: transverse cracking (TC), longitudinal cracking (LC), block cracking (BC), alligator cracking (AC), waving, patching, and rutting; the same damage identification criteria, survey scale, and recording method were adopted in the three surveys. The damage extent was recorded for each kilometer as the affected length within that unit (m/km), ensuring comparability among the three survey years.
To account for the influence of pavement conditions on damage development, pavement conditions were classified as follows: (1) excellent: smooth pavement with no damage and intact curbs (best condition); (2) good: minor pavement and curb damage (relatively good condition); (3) medium: cracked pavement, aging asphalt, damaged curbs (relatively poor condition); (4) poor: severely damaged pavement, significant settlement deformation, missing curbs (very poor condition). Additionally, we conducted a quantitative analysis of the correlations among different types of damage based on their statistical proportions. To reflect the distribution of pavement damage across different years, the pavement damage rate (DR) is calculated using the following formula:
where denotes the investigation area of the i-th type of pavement damage (m2); A represents the actual surveyed area of the pavement section (m2); and signifies the weight or conversion coefficient for the i-th type of pavement damage, taken from the Evaluation Standards for Highway Technical Conditions (JTG 5210-2018) (Ministry of Transport of the People’s Republic of China, 2018) [22].
3.2.2. Selection of Influencing Factors for Pavement Damage
We followed Dou et al.’s (2002) [23] classification of factors influencing the thermal stability of permafrost embankments and selected six key factors related to engineering conditions and geographical elements: embankment thickness, elevation, mean annual ground surface temperature, slope, embankment trend, and vegetation coverage. Mean annual ground surface temperature directly reflects the thermal state of the permafrost layer. Embankment thickness affects both the thermal and mechanical conditions of the roadbed: a higher embankment can provide better thermal protection for underlying permafrost but may also enhance transverse differential deformation under sunny–shady slope effects, which can be associated with the development of LC. Embankment trend and slope further influence pavement damage because unfavorable combinations may strengthen sunny–shady slope effects and induce uneven thermal and deformation conditions. Vegetation helps regulate ground surface temperature by reducing direct solar radiation, thereby damping temperature fluctuations and promoting the long-term stability of permafrost.
3.2.3. GCN-MGWR Geographical Model
To simultaneously capture the spatial heterogeneity of pavement damage in permafrost regions and the along-route dependence, this study integrates a multi-scale geographically weighted regression (MGWR) local varying coefficient framework into a graph convolutional network (GCN). The GCN is used to model the adjacency relationships between pavement by aggregating multi-hop information on damage, engineering and geographical factors over the graph, yielding node embeddings that incorporate topological constraints. MGWR then assigns a variable-specific bandwidth to each predictor, thereby representing the multi-scale spatial effects of different factors. In this way, the model preserves the interpretability of regression while enhancing the representation of both inter-segment influences and differences in the effective spatial scales of explanatory variables.
In the GCN model, the study domain consists of a set of road sections discretized by mileage units {1, …, n}. An undirected graph is constructed by treating each segment as a node and connecting adjacent or consecutively arranged segments with edges. The adjacency matrix A can be defined either as a binary topology (1 for adjacent segments) or as a distance-weighted kernel similarity. It can be expressed as follows:
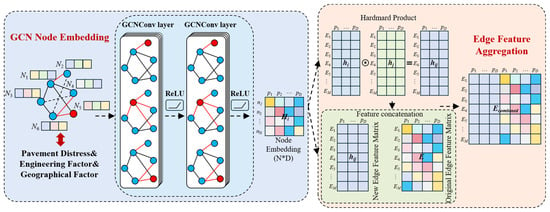
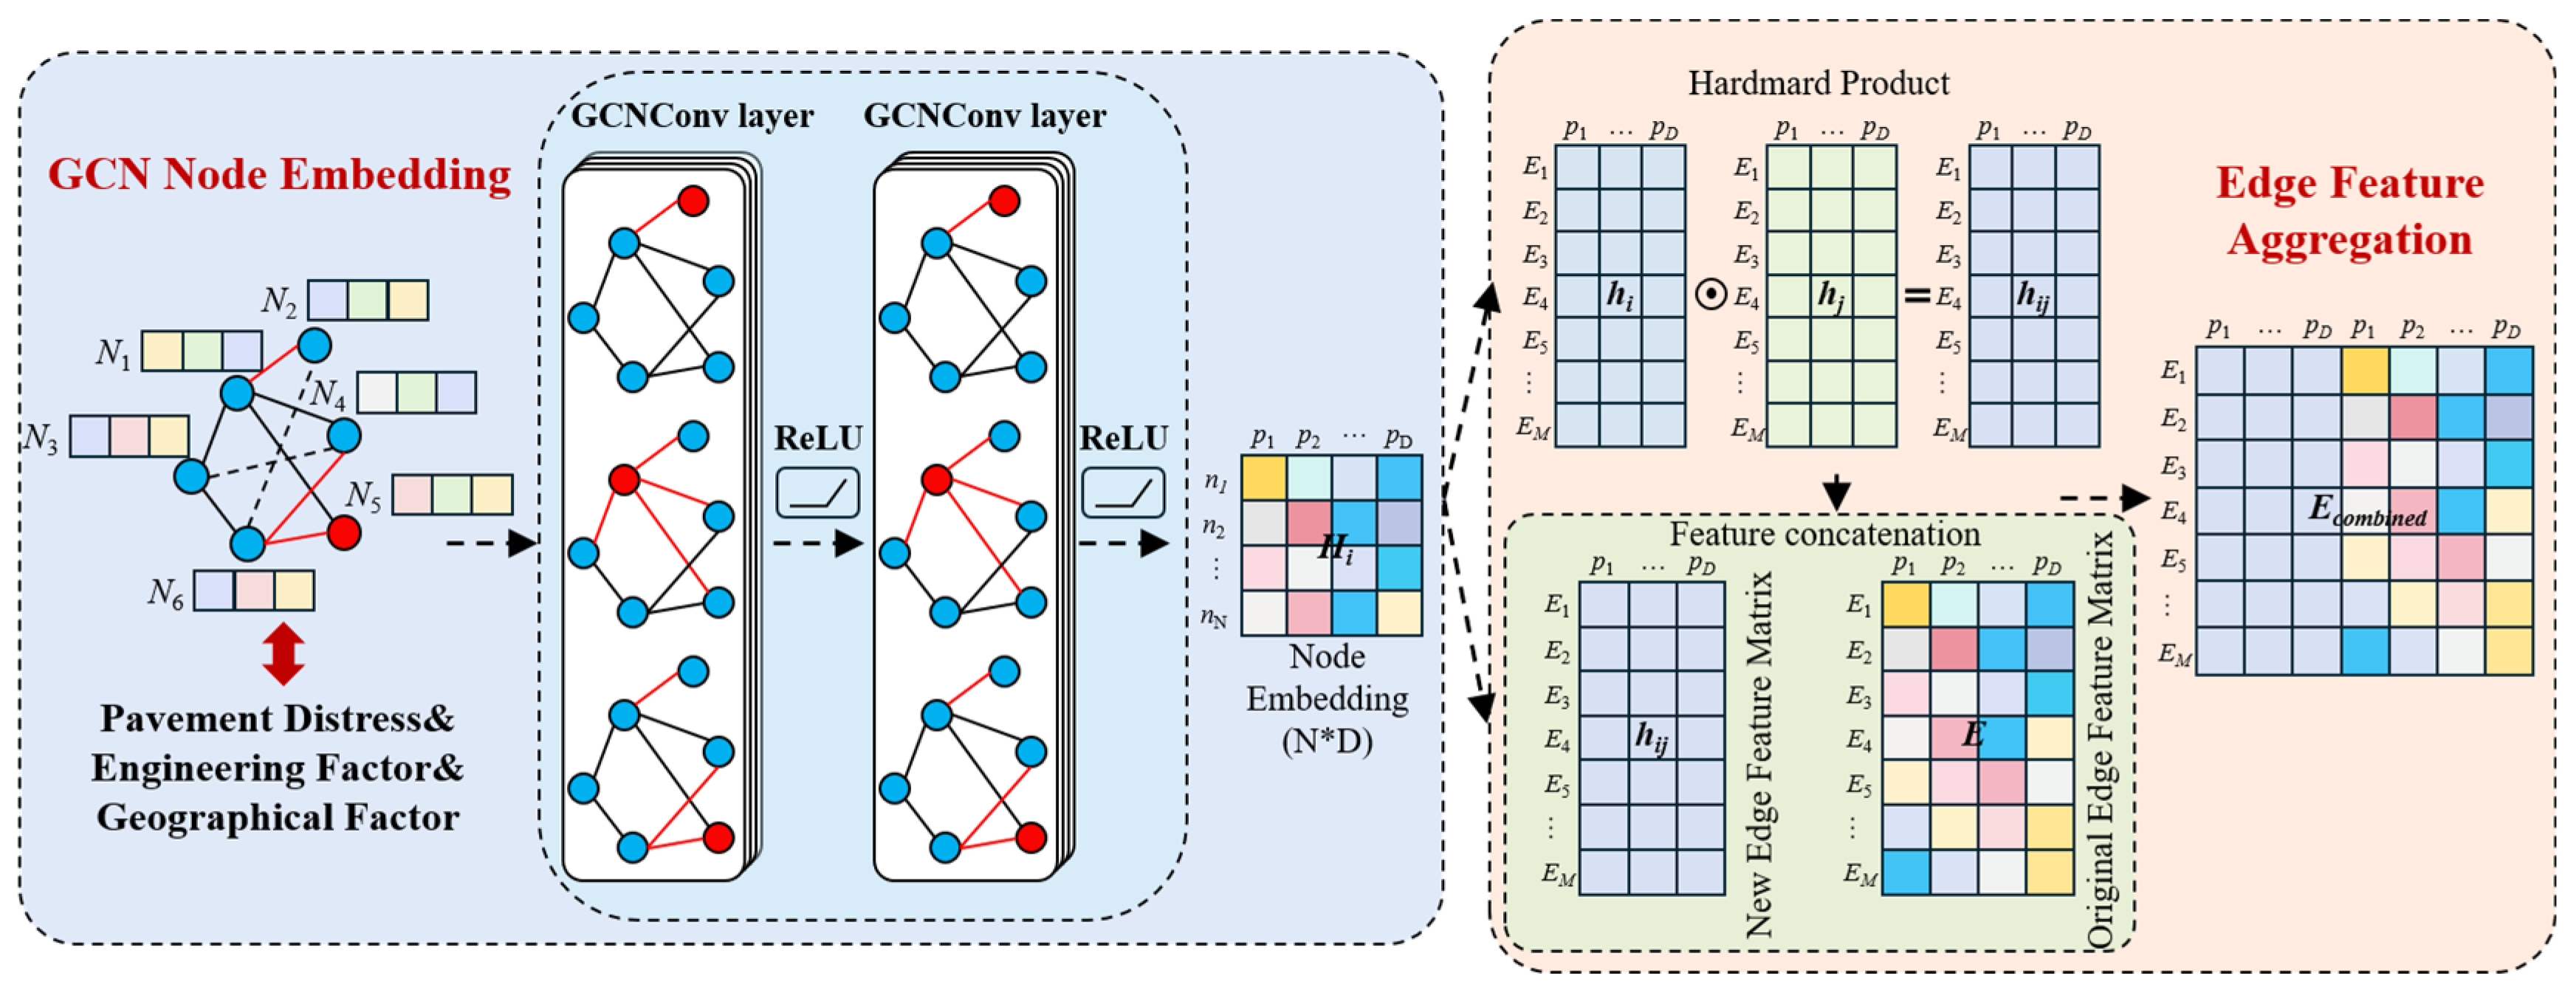
where denotes the along-route distance, is the spatial decay scale, and represents connectivity. To avoid degree-related bias in the graph, symmetric normalization is applied: , . Let denote the initial node features, including engineering, geographical and damage attributes. After passing through L layers of graph convolution, the node features are aggregated to obtain topology-enhanced representations, updated feature vectors for each individual node (Figure 2), which can be expressed as
where is the nonlinear activation function (ReLU), is the degree matrix, and denotes the learnable weight matrix of the l-th layer; the final output is . To improve consistency with the damage indicators, the GCN is trained in a lightly supervised manner with weight decay and early stopping to obtain stable embeddings. In the subsequent model fusion stage, only is retained as the node-level enhanced feature matrix, without altering the form of the regression model.
Figure 2.
Feature Construction in GCN Model.
Geographically weighted regression (GWR) is a local regression technique with spatially varying parameters that is used to investigate how regression relationships change over space [24]. However, classical GWR typically assigns a single bandwidth to all explanatory variables, which can lead to over- or under-smoothing when the underlying processes operate at multiple spatial scales. Multi-scale geographically weighted regression (MGWR) extends GWR by allowing each factor to operate at its own spatial scale through a multi-bandwidth framework, so that an optimal bandwidth and coefficient are estimated separately for each variable, thereby capturing both local and regional effects [25]. By explicitly modeling the spatial non-stationarity in the relationships among variables, this component helps to elucidate how different factors operate across scales and levels of spatial granularity [26]. Its general form can be written as
where is the dependent variable at location i; is the regression coefficient of the k-th explanatory variable under its own bandwidth; denotes the geographic coordinates of location i; (k = 1, 2, …, m) are the observed values of the explanatory variables at location i; and is the residual term.
As a local modeling approach, MGWR can simultaneously characterize spatial heterogeneity and more accurately identify the dominant spatial scale and effect strength of each variable. It assigns an independent bandwidth to each explanatory variable, using a kernel-based weight matrix, performs local weighted least squares estimation within a back-fitting framework. For variable k at location , the weight matrix is given by
where denotes the kernel function, typically specified as a Gaussian or bi-square kernel, and is defined as the along-route path distance so as to reflect the propagation characteristics of features along the highway corridor.
The GCN-MGWR model is implemented using a feature-enhancement strategy. To make the model settings more explicit and reproducible, the key parameter settings for graph construction, GCN training, feature fusion, and MGWR estimation are summarized in Table 1. First, the original feature matrix and adjacency matrix are fed into the GCN to obtain a node-enhanced feature matrix. On this basis, an augmented design matrix is constructed, so that road network topology and multi-hop neighborhood information are explicitly injected into the regression without altering the MGWR estimation form. This approach allows neighborhood-aggregated structural differences to be reflected in the coefficient fields, while variable-specific bandwidths reveal the operative spatial scales of different factors. After the GCN-MGWR model was fitted, SHAP analysis was further applied as a post hoc interpretation tool to quantify the marginal contribution of each explanatory factor to the predicted pavement damage. Therefore, the SHAP values used in this study were derived from the fitted GCN-MGWR outputs and served to interpret the factor contributions and response patterns identified by the model, as expressed by
where is the augmented design matrix, which serves as the input feature set for MGWR and is used to estimate location-dependent coefficients; denotes column-wise concatenation of features; is the original feature matrix; and is the node-enhanced feature matrix.
Table 1.
Key parameter settings of the GCN-MGWR model.
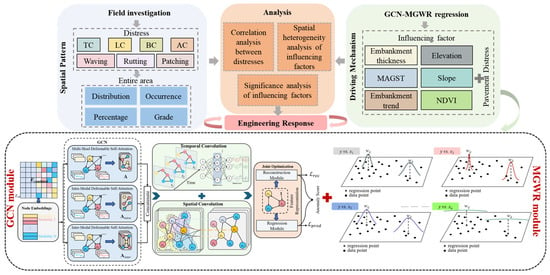
As shown in Figure 3, the GCN-MGWR framework was adopted to analyze both the evolution of pavement damage and the spatial heterogeneity of geographical and engineering factors. First, we analyzed the spatiotemporal distribution of pavement damage along the permafrost sections of the QXH over the past decade, together with the correlations among different types of damage. Second, a multi-scale spatial regression model was employed to quantify the influence of each geographical and engineering factor on each type of damage. Finally, these results were integrated with pavement condition grades to delineate priority treatment classes and zoned management units, illustrating the utility of geographical spatial analysis for the maintenance and management of pavement damage in permafrost regions.
Figure 3.
Research method (TC: transverse cracking, LC: longitudinal cracking, BC: block cracking, AC: alligator cracking).
4. Research Results
4.1. Distribution Characteristics of Pavement Damage on the QXH
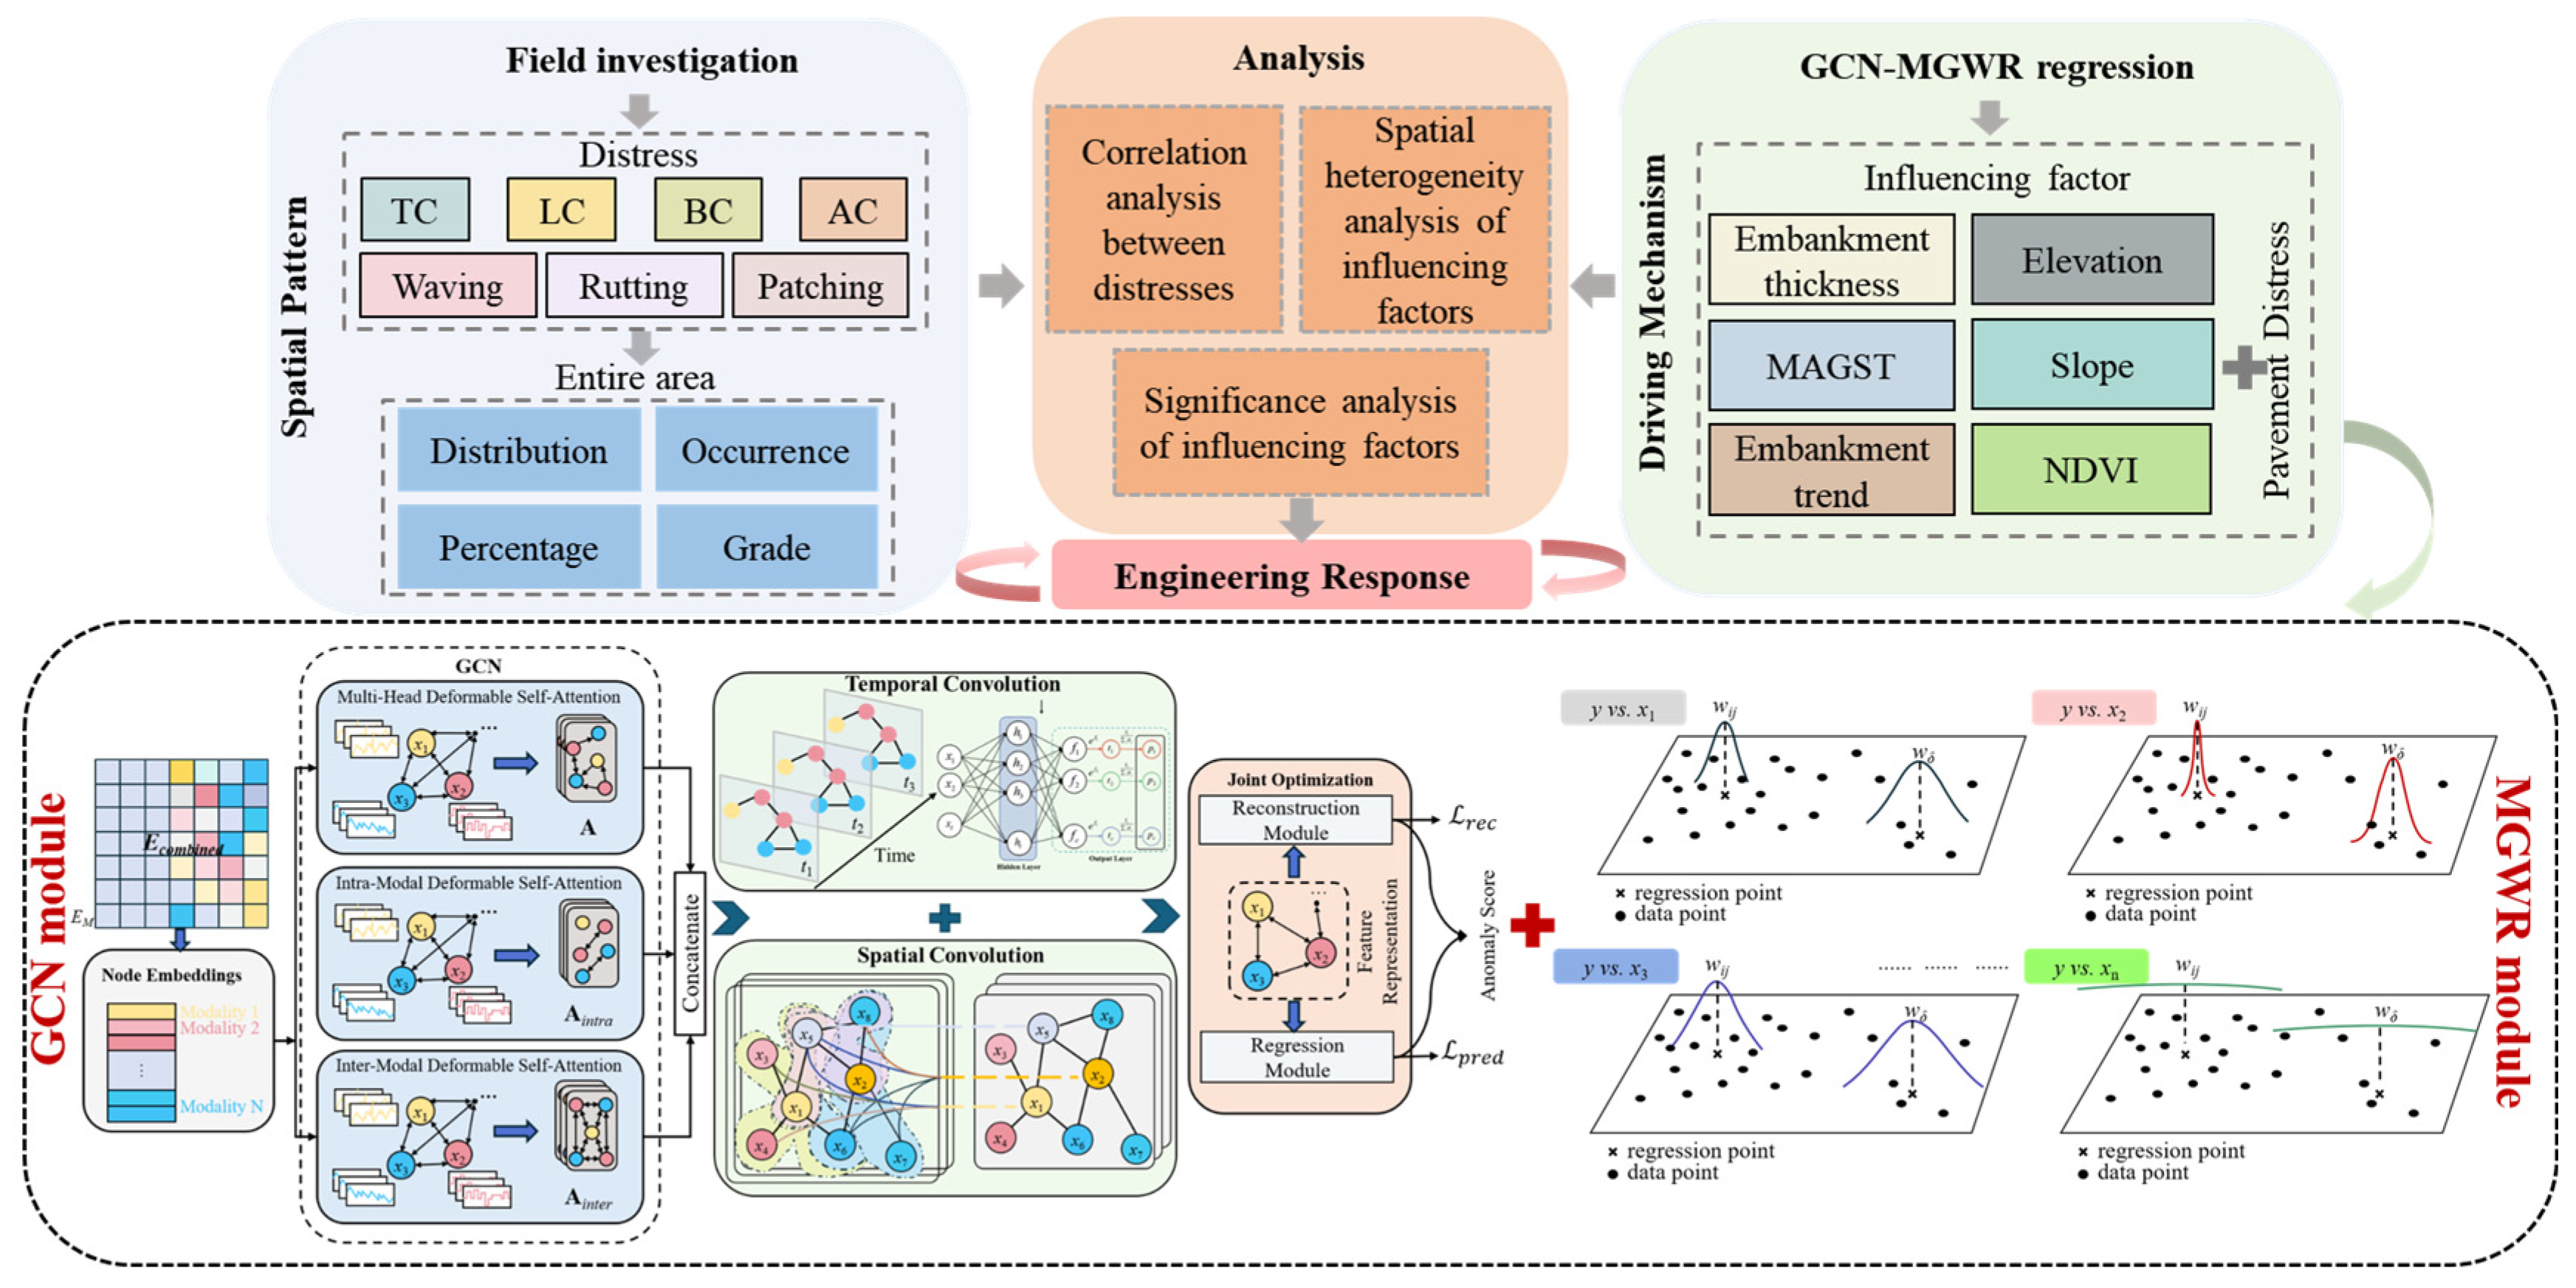
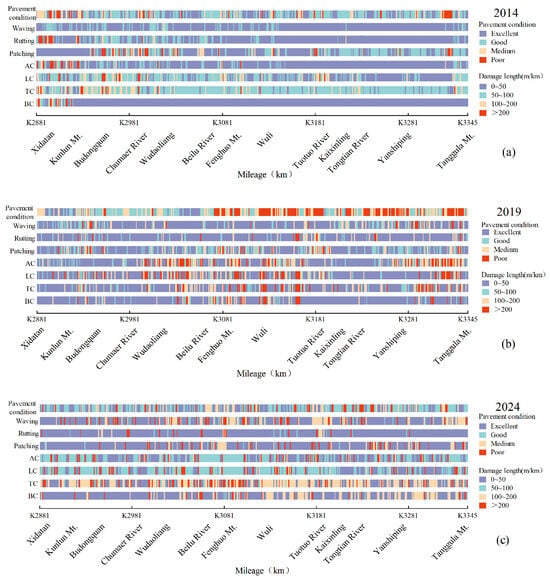
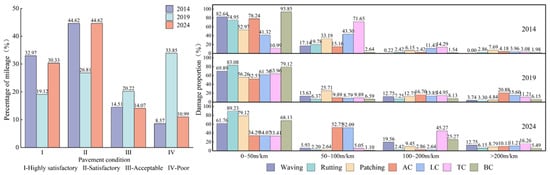
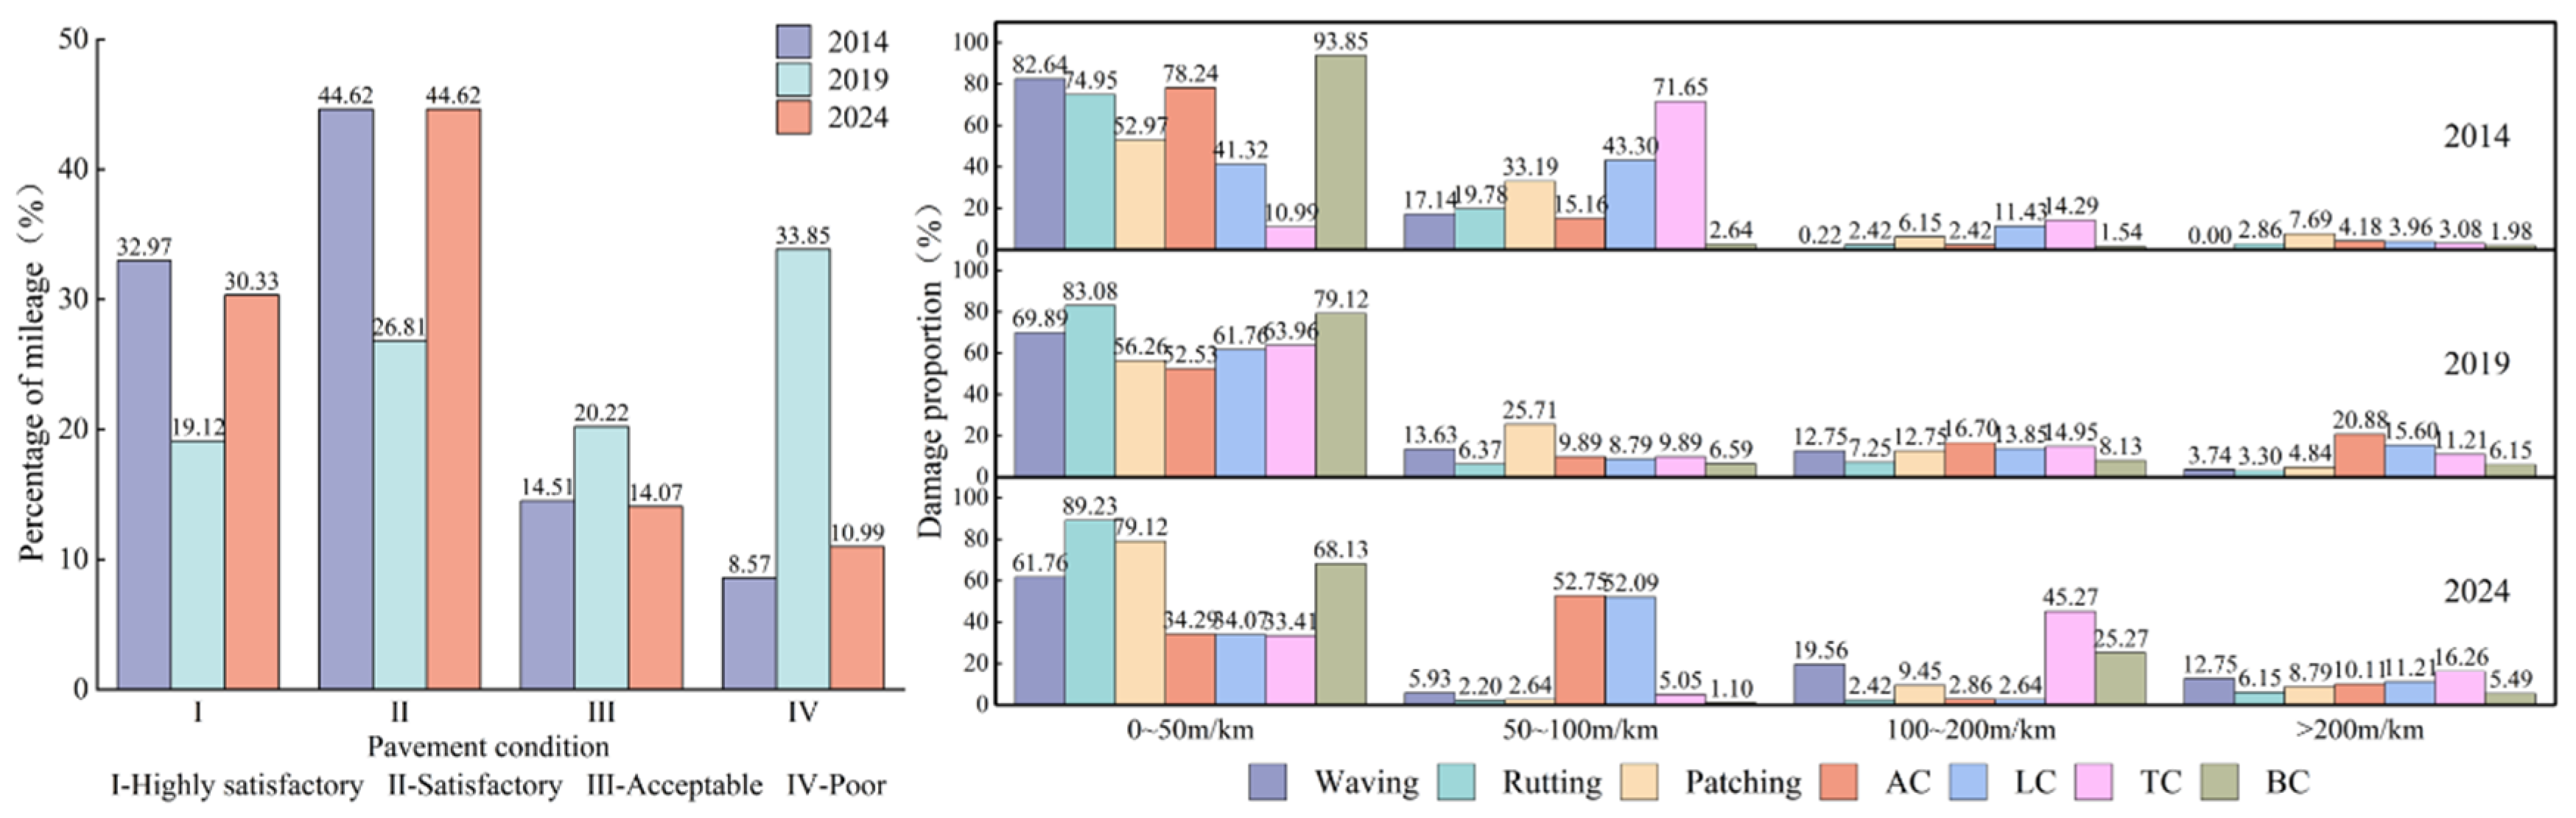
In the statistical results shown in Figure 4 and Figure 5, the three datasets exhibit pronounced temporal and spatial differences, reflecting variations in rehabilitation and maintenance along the QXH over the past decade. The total length of excellent-grade pavement in 2014, 2019, and 2024 was 153 km, 89 km, and 141 km, accounting for 32.97%, 19.12%, and 30.33%, respectively. In 2014, excellent-grade sections were mainly located between Wudaoliang and Wuli. In 2019, they were concentrated between Xidatan and Budongquan and between Wudaoliang and Fenghuoshan. In 2024, they were primarily distributed between Wudaoliang and Fenghuo Mountain and between Wuli and Tuotuohe.
Figure 4.
Pavement damage distribution ((a) 2014, (b) 2019, (c) 2024, TC: transverse cracking, LC: longitudinal cracking, BC: block cracking, AC: alligator cracking).
Figure 5.
Proportion of pavement damage classification (TC: transverse cracking, LC: longitudinal cracking, BC: block cracking, AC: alligator cracking).
In the graded statistics of pavement damage severity (Figure 5), the per-kilometer affected length of the seven major types of damage in 2014, 2019, and 2024 was mostly concentrated in the 0–50 m/km and 50–100 m/km intervals. In 2014, the proportion of damage within these intervals was the highest, and most damage was concentrated between Xidatan and Chumaer River. In 2019, the share of some damage within the 0–50 m/km interval increased. However, compared with 2014, the overall damage situation worsened, with crack-type damage becoming particularly prominent. By 2024, the impact of TC, BC, and similar crack-type damage intensified further relative to 2019, whereas the severity of the other types of damage decreased.
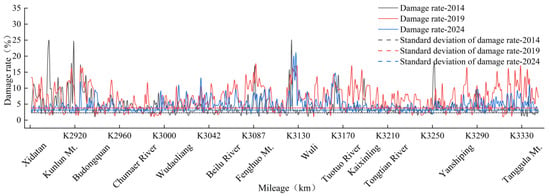
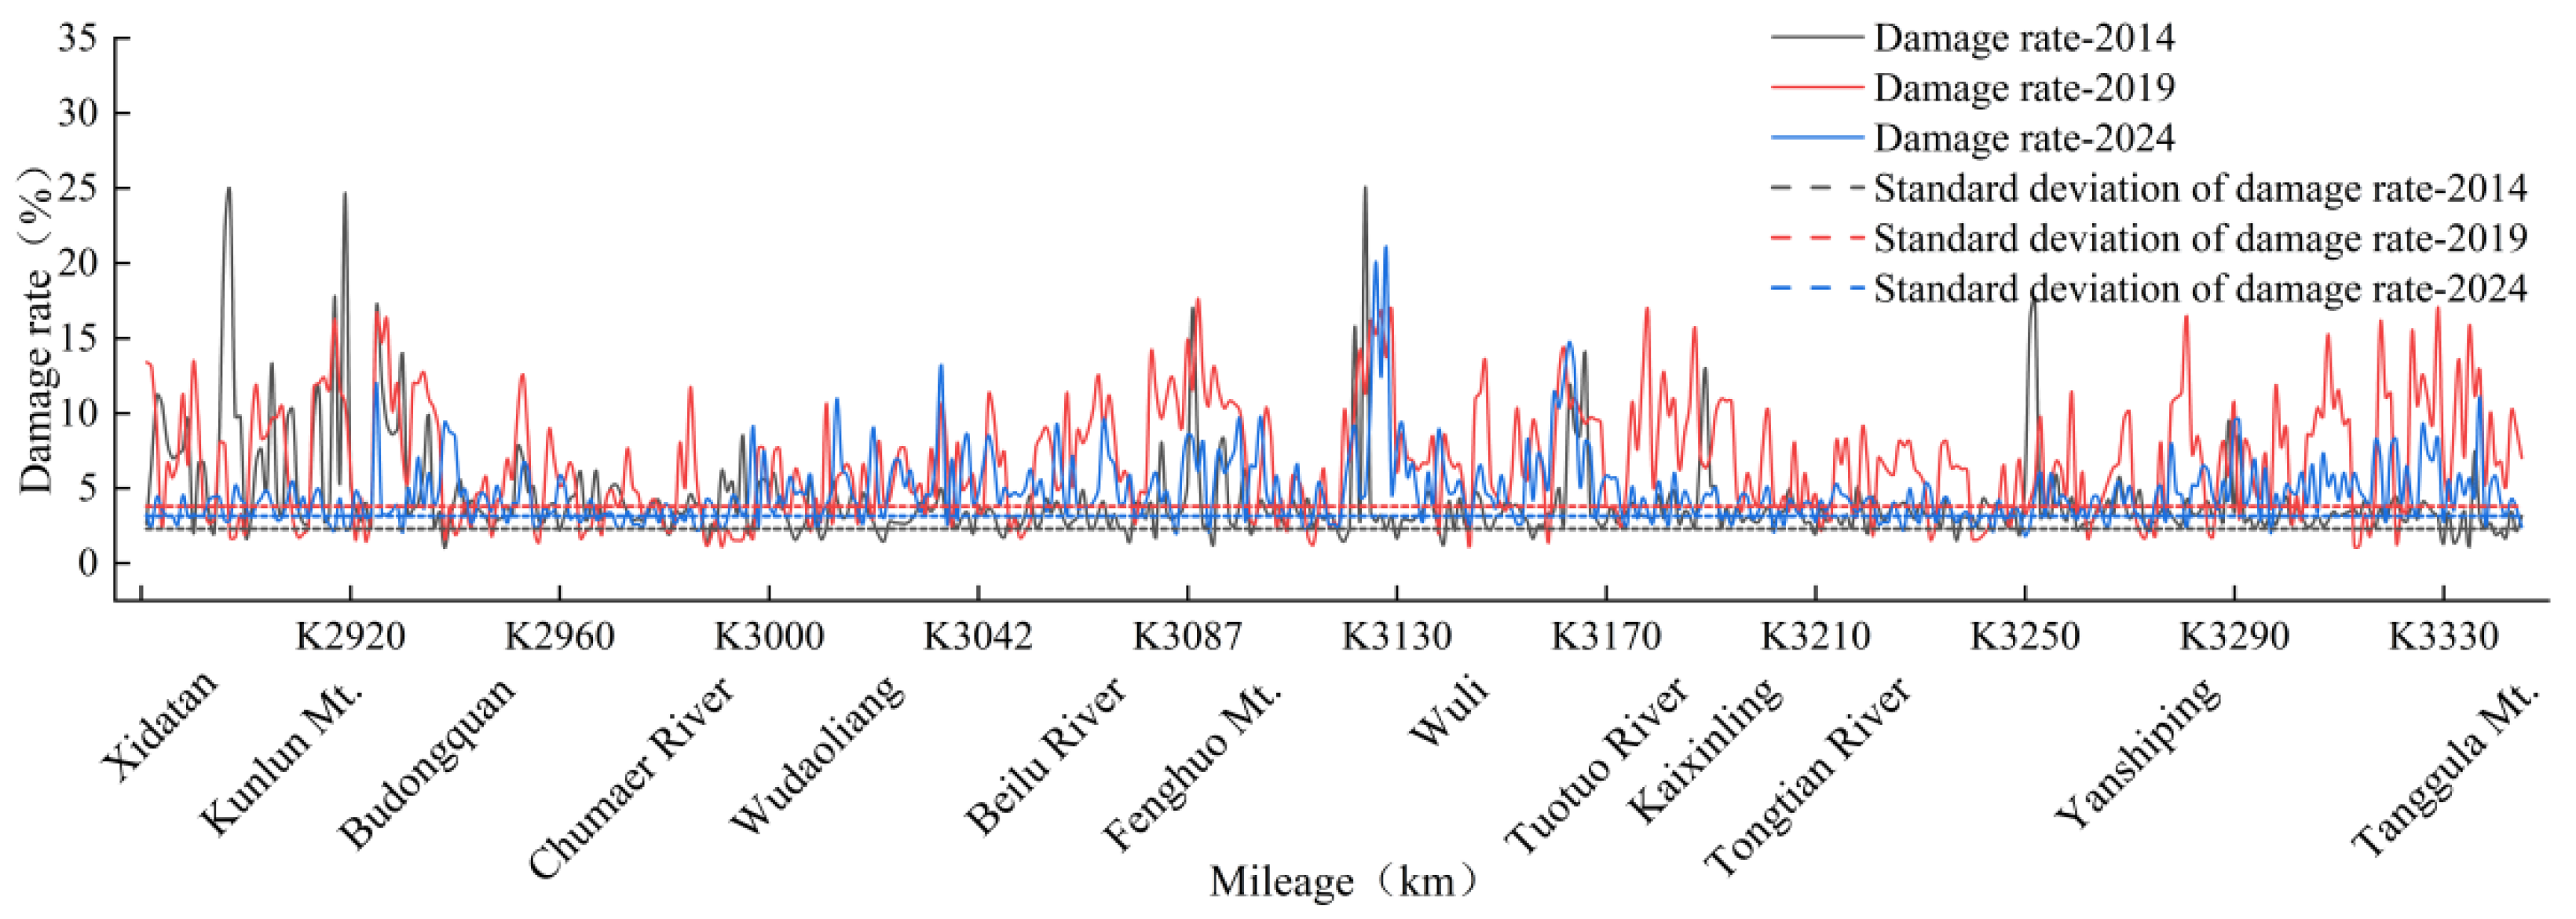
The pavement damage ratios along the QXH are shown in Figure 6. The mean damage ratios in 2014, 2019, and 2024 were 4.21%, 6.82%, and 4.74%, with standard deviations of 2.31%, 3.79% and 3.13%, respectively. Relative to 2014, both the mean and standard deviation increased in 2019, indicating the development of more severe damage over a larger area. In 2024, the mean and standard deviation declined, suggesting reduced variation in the damage ratio and a weaker contrast in damage severity between sections. This decrease may be partially attributed to maintenance, repair, or local pavement renewal activities carried out after 2019, which mitigated the severity of damage in some sections. Nonetheless, the 2024 mean remained higher than in 2014, and the level of dispersion was non-negligible, indicating that natural processes such as permafrost degradation, freeze–thaw cycles, and the propagation of existing cracks continued to influence pavement performance.
Figure 6.
Pavement damage rate distribution.
4.2. Interrelationships Among Types of Pavement Damage Along the QXH
4.2.1. Correlation Analysis Among Single Damage
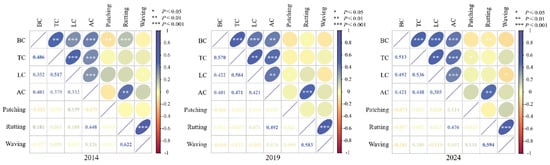
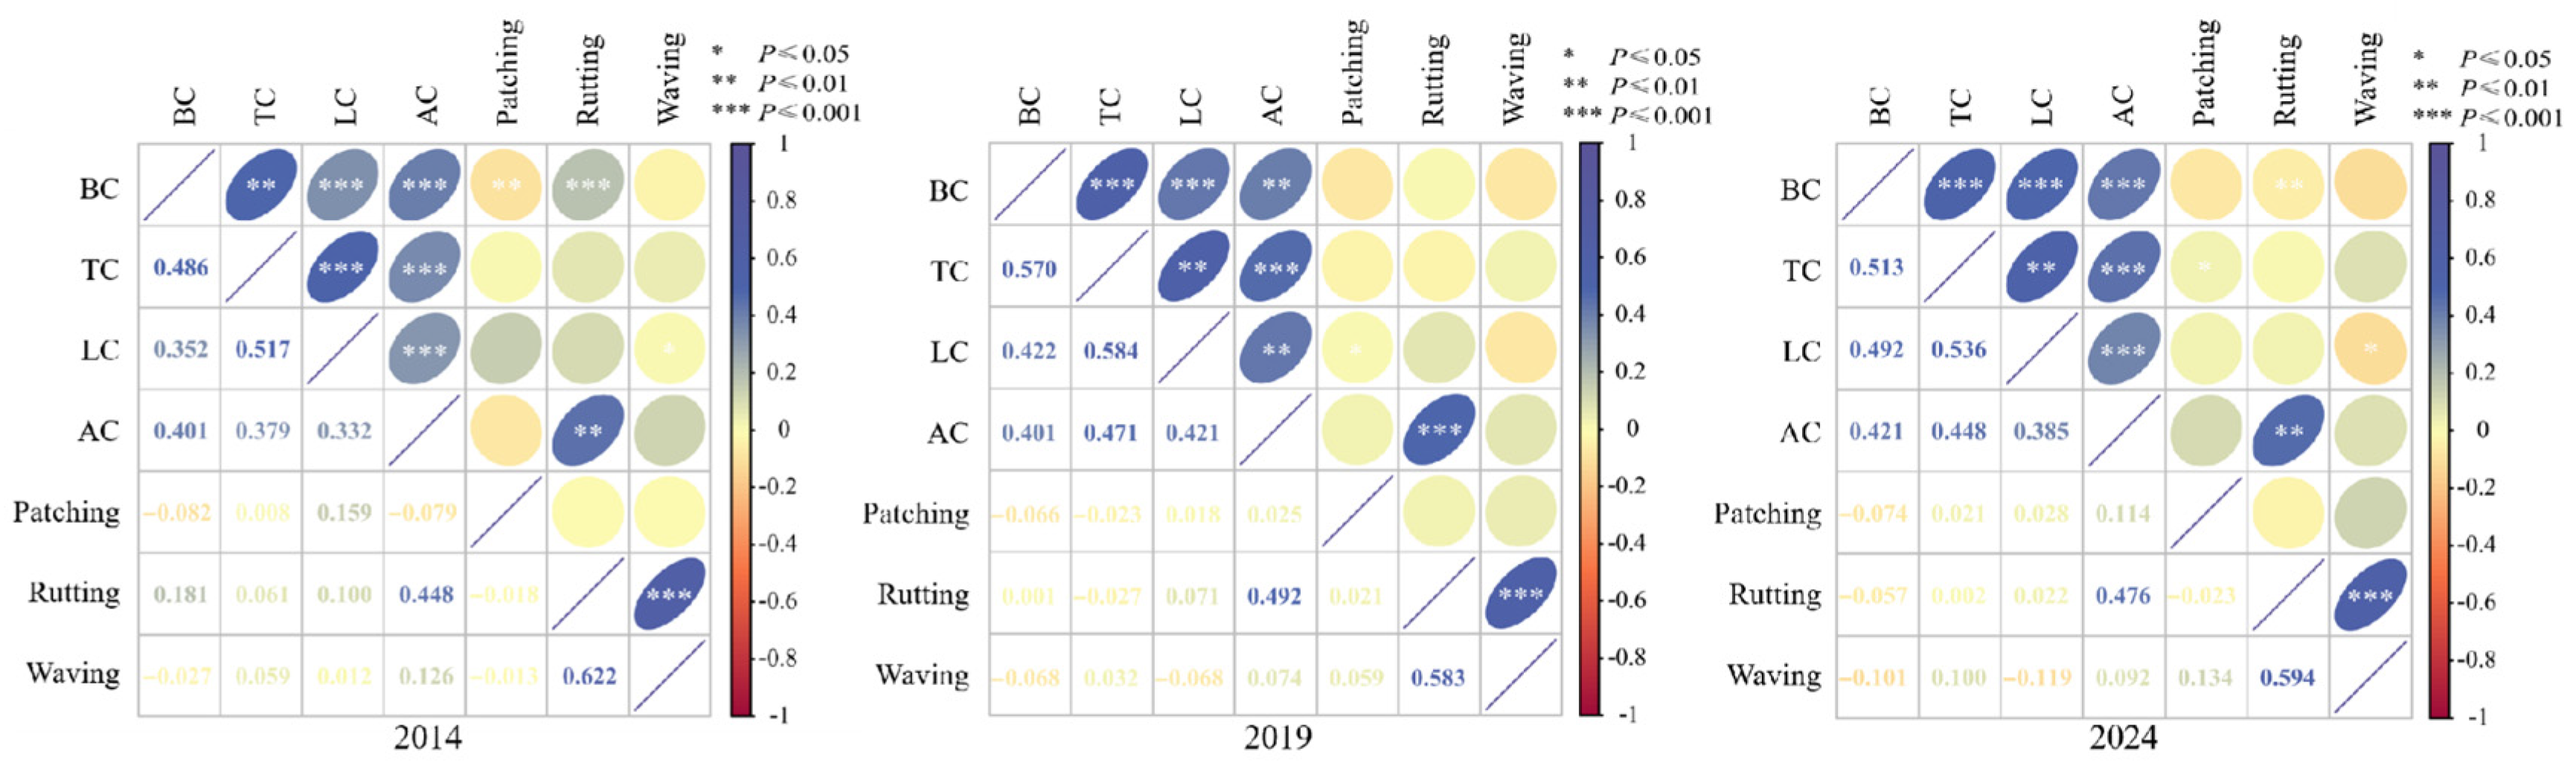
The correlations among different pavement damage types are shown in Figure 7. The strongest associations occurred between waving and rutting, TC and LC, and BC and TC. The corresponding correlation coefficients in 2014 were 0.622, 0.517, and 0.486; in 2019, they were 0.583, 0.584, and 0.570; and in 2024, they were 0.594, 0.536, and 0.513, respectively. Across the three surveys, the correlation between waving and rutting remained consistently high, indicating a stable co-occurrence pattern between these two deformation-related damages. The relatively strong correlations between TC and LC and between BC and TC suggest that crack-type damages tended to occur in spatially coupled patterns along the QXH. The correlations between LC and BC and between AC and BC increased over time, indicating that the relationships among different crack-type damages became more pronounced during long-term pavement deterioration. Overall, the evolution of inter-damage correlations reflects the progressive coupling of pavement damage types under the combined influence of permafrost-related deformation, freeze–thaw processes, asphalt aging, and possible traffic loading.
Figure 7.
Correlation matrix between single damage (TC: transverse cracking, LC: longitudinal cracking, BC: block cracking, AC: alligator cracking).
4.2.2. Interrelationships Among Multiple Types of Damage
Our analysis of pavement damage patterns along the QXH indicated that different types of damage exhibited clear interdependence and coexistence. The occurrence of one type frequently initiated the formation and growth of others, leading to an intertwined evolution. Through mutual interaction and reinforcement among different damages, the affected extent of pavement damage expanded, the overall damage rate increased, and the physical properties of the pavement deteriorated, thereby degrading the service condition of the highway. As crack-type damage (TC, LC, BC, and AC) constituted the dominant damage category, our subsequent analysis focused on its relationship with other types of damage.
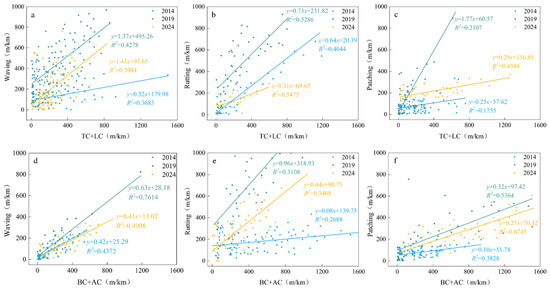
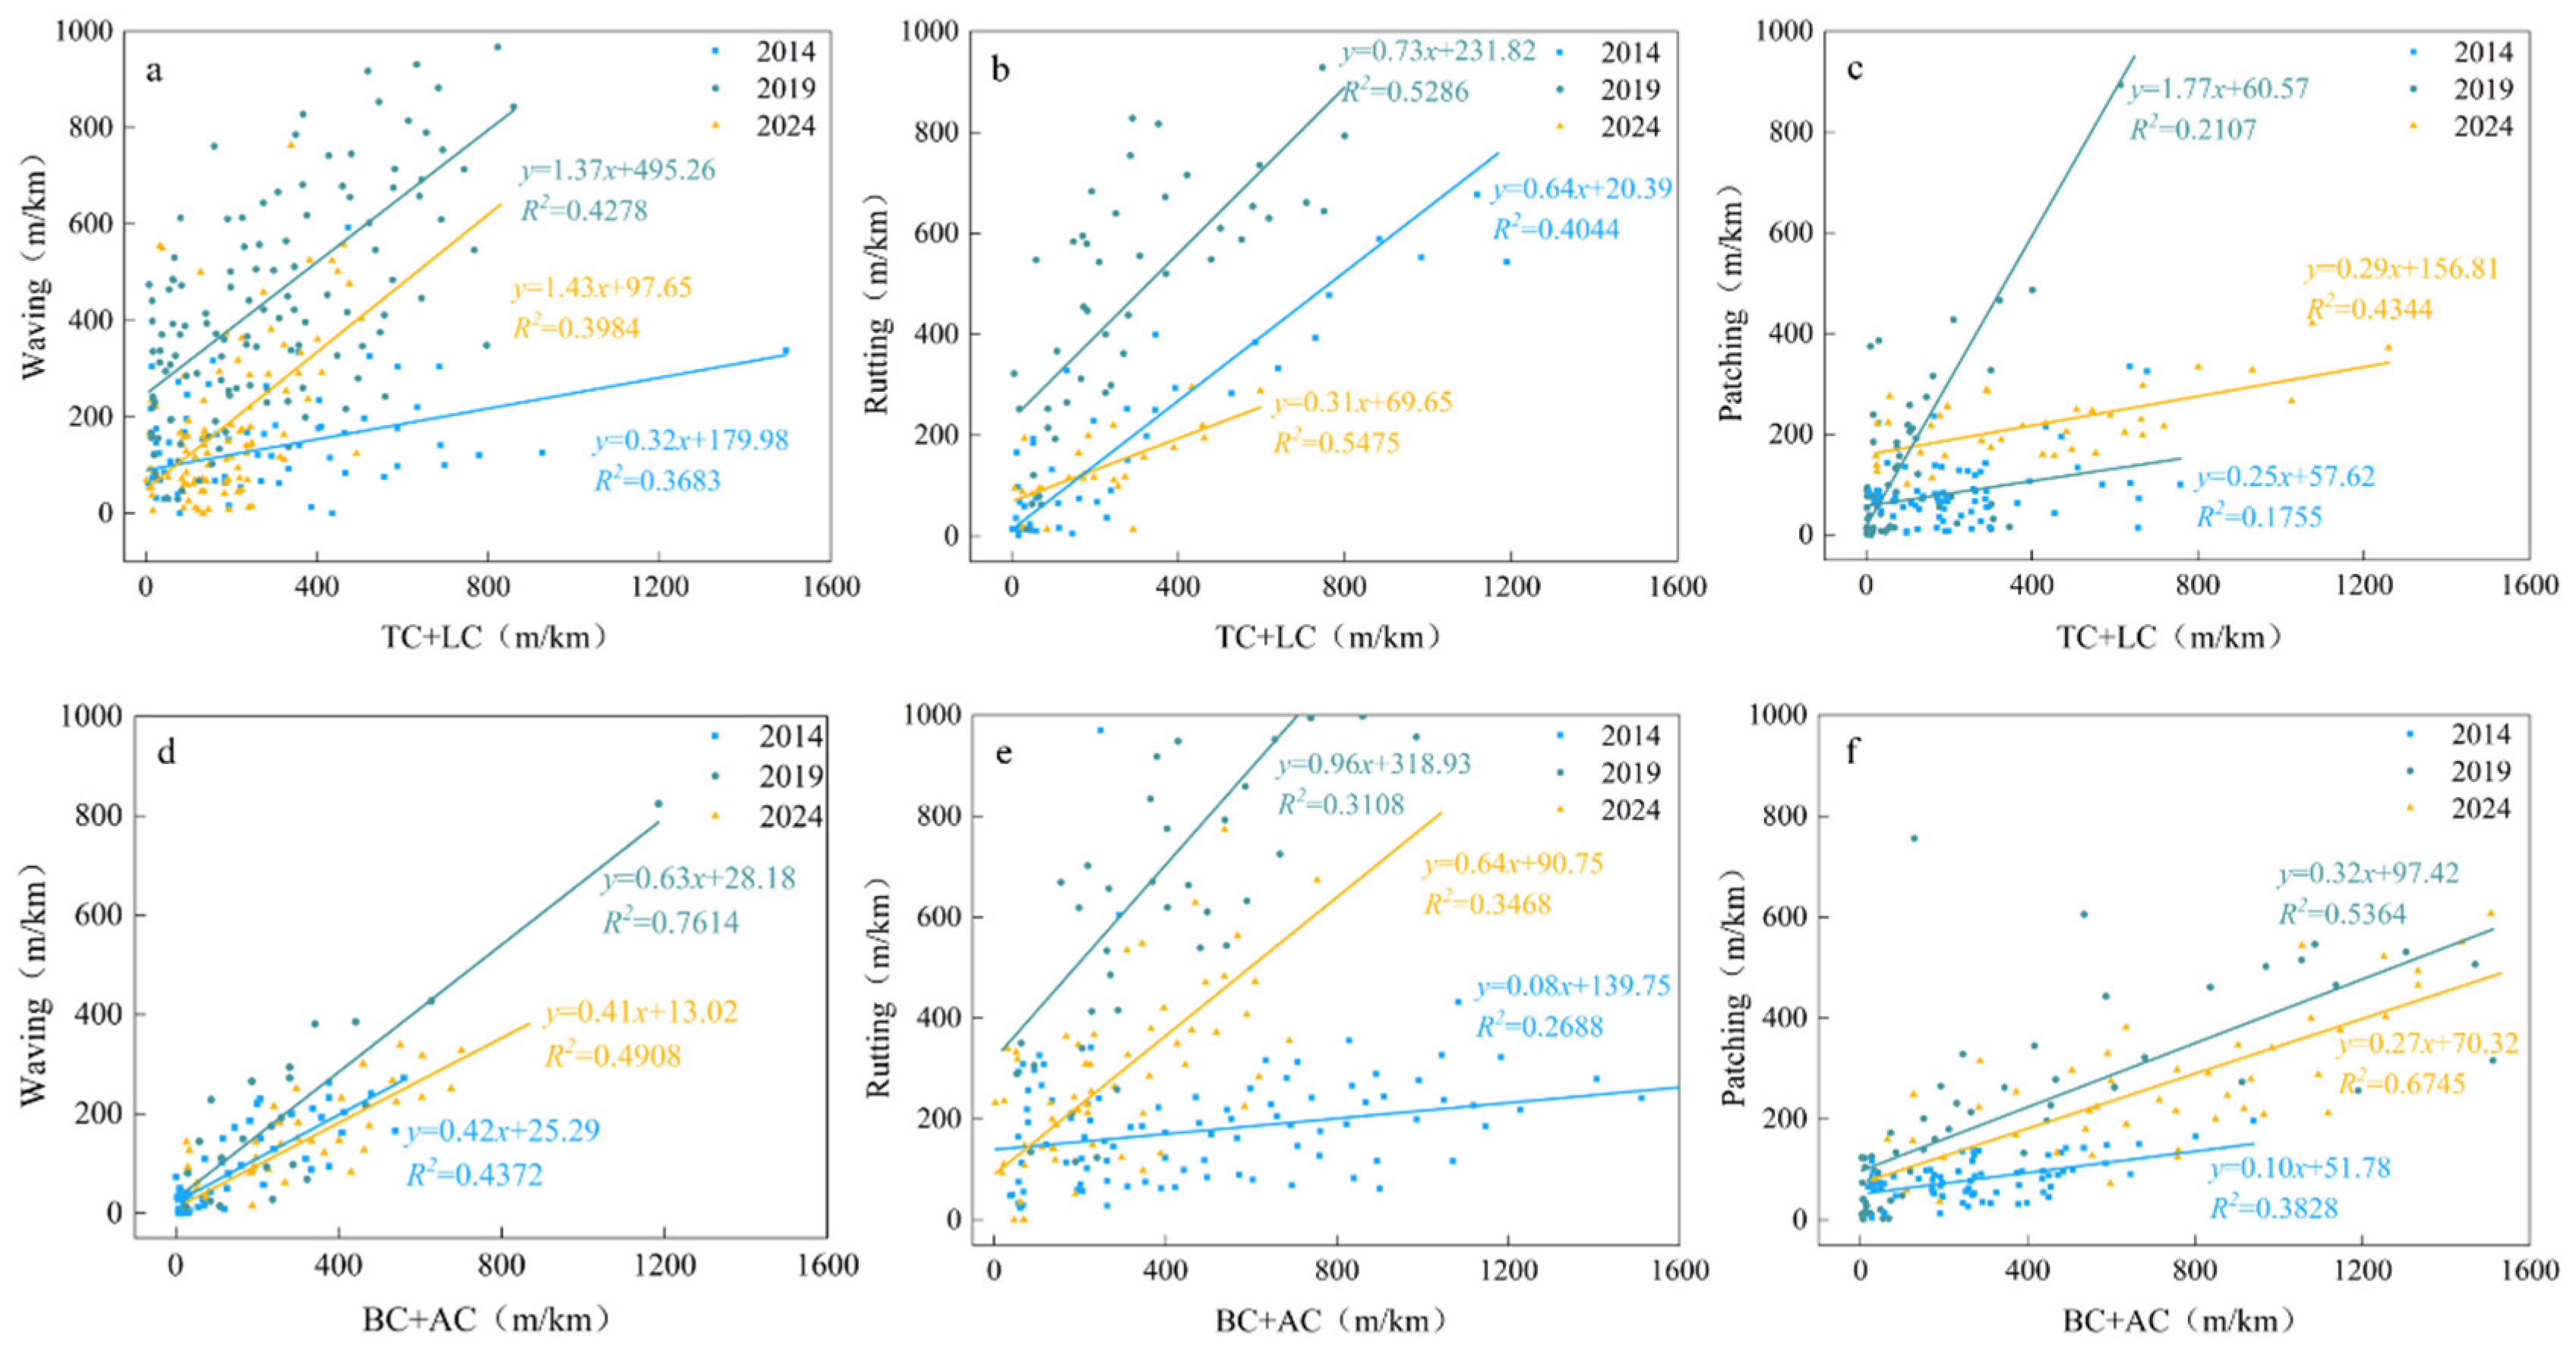
As shown in Figure 8, regression analysis was performed to examine the relationships between crack-type damage and other types of pavement damage. Overall, crack-type damage exhibited positive correlations with other types, but both the correlation strength and regression slopes differed substantially. Under the combined influence of subgrade settlement induced by freezing–thawing cycles in permafrost and asphalt aging, the combined indices of “TC + LC” and “AC + BC” were consistently highly correlated with waving in all three surveys, and the correlations with patching increased over time. Variations in the slope reflect how combinations of crack-type damage affect the range of waving, rutting, and patching. The overall slopes in 2014 and 2024 were similar, suggesting a broadly stable level of coupling among damage types in these two years. Slopes in 2019 are systematically steeper, indicating that waving, rutting, and patching were sensitive to changes in crack-type damage during this period.
Figure 8.
Fitting relationship of multiple damage development (TC: transverse cracking, LC: longitudinal cracking, BC: block cracking, AC: alligator cracking) (a) waving versus TC + LC; (b) rutting versus TC + LC; (c) patching versus TC + LC; (d) waving versus BC + AC; (e) rutting versus BC + AC; and (f) patching versus BC + AC.
4.3. Analysis of Spatial Patterns of Pavement Damage Driving Factors
Multi-Factor Spatial Heterogeneity Analysis
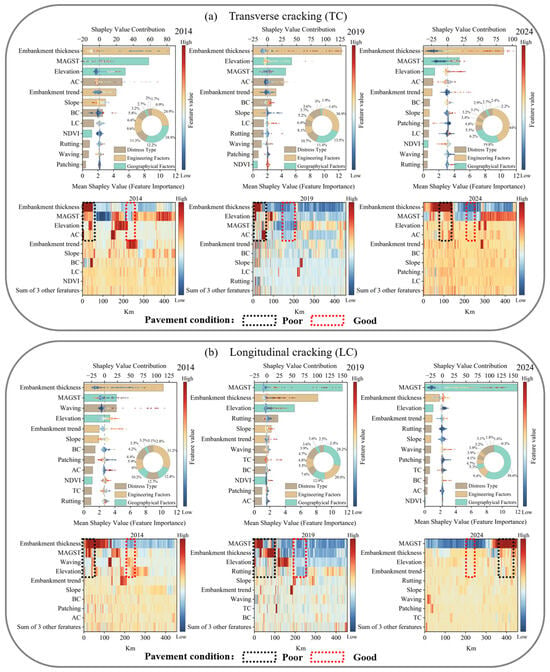
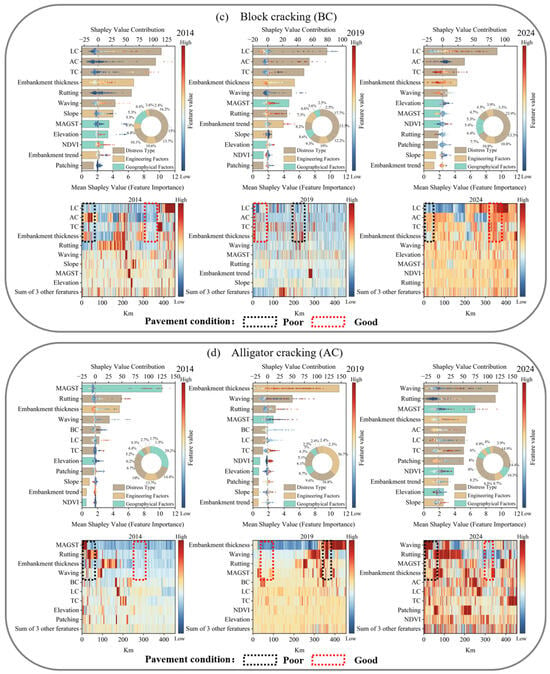
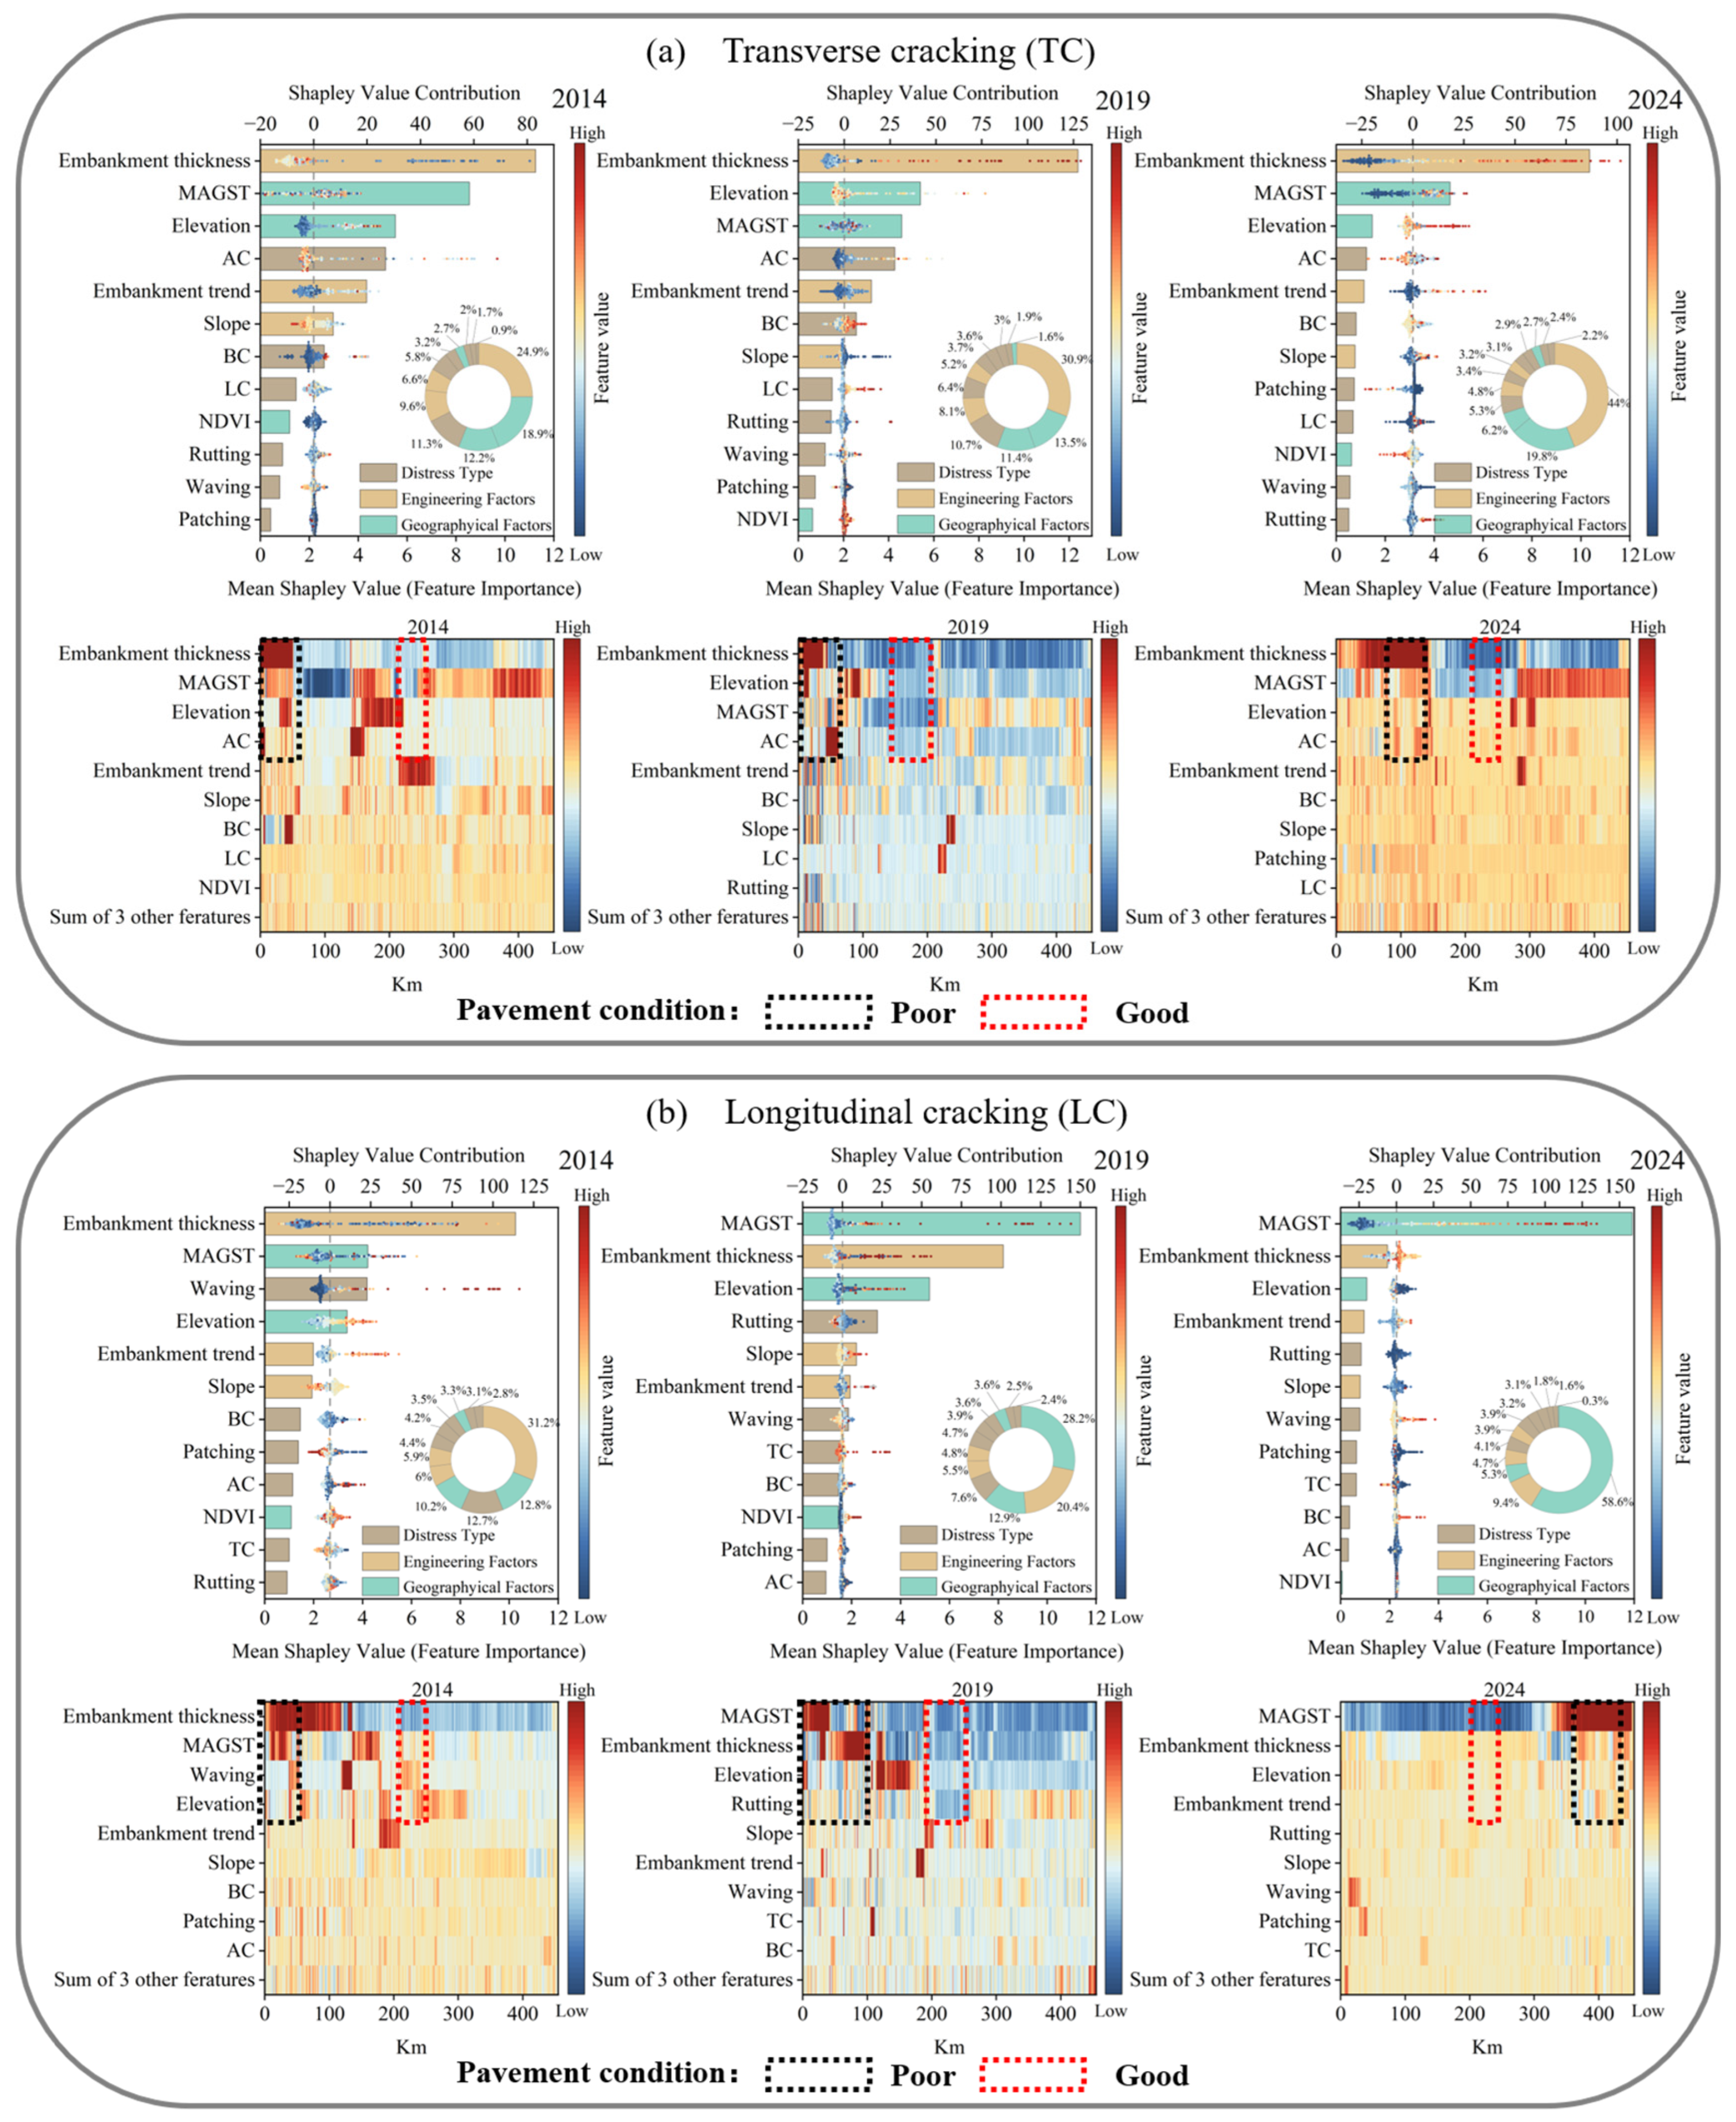
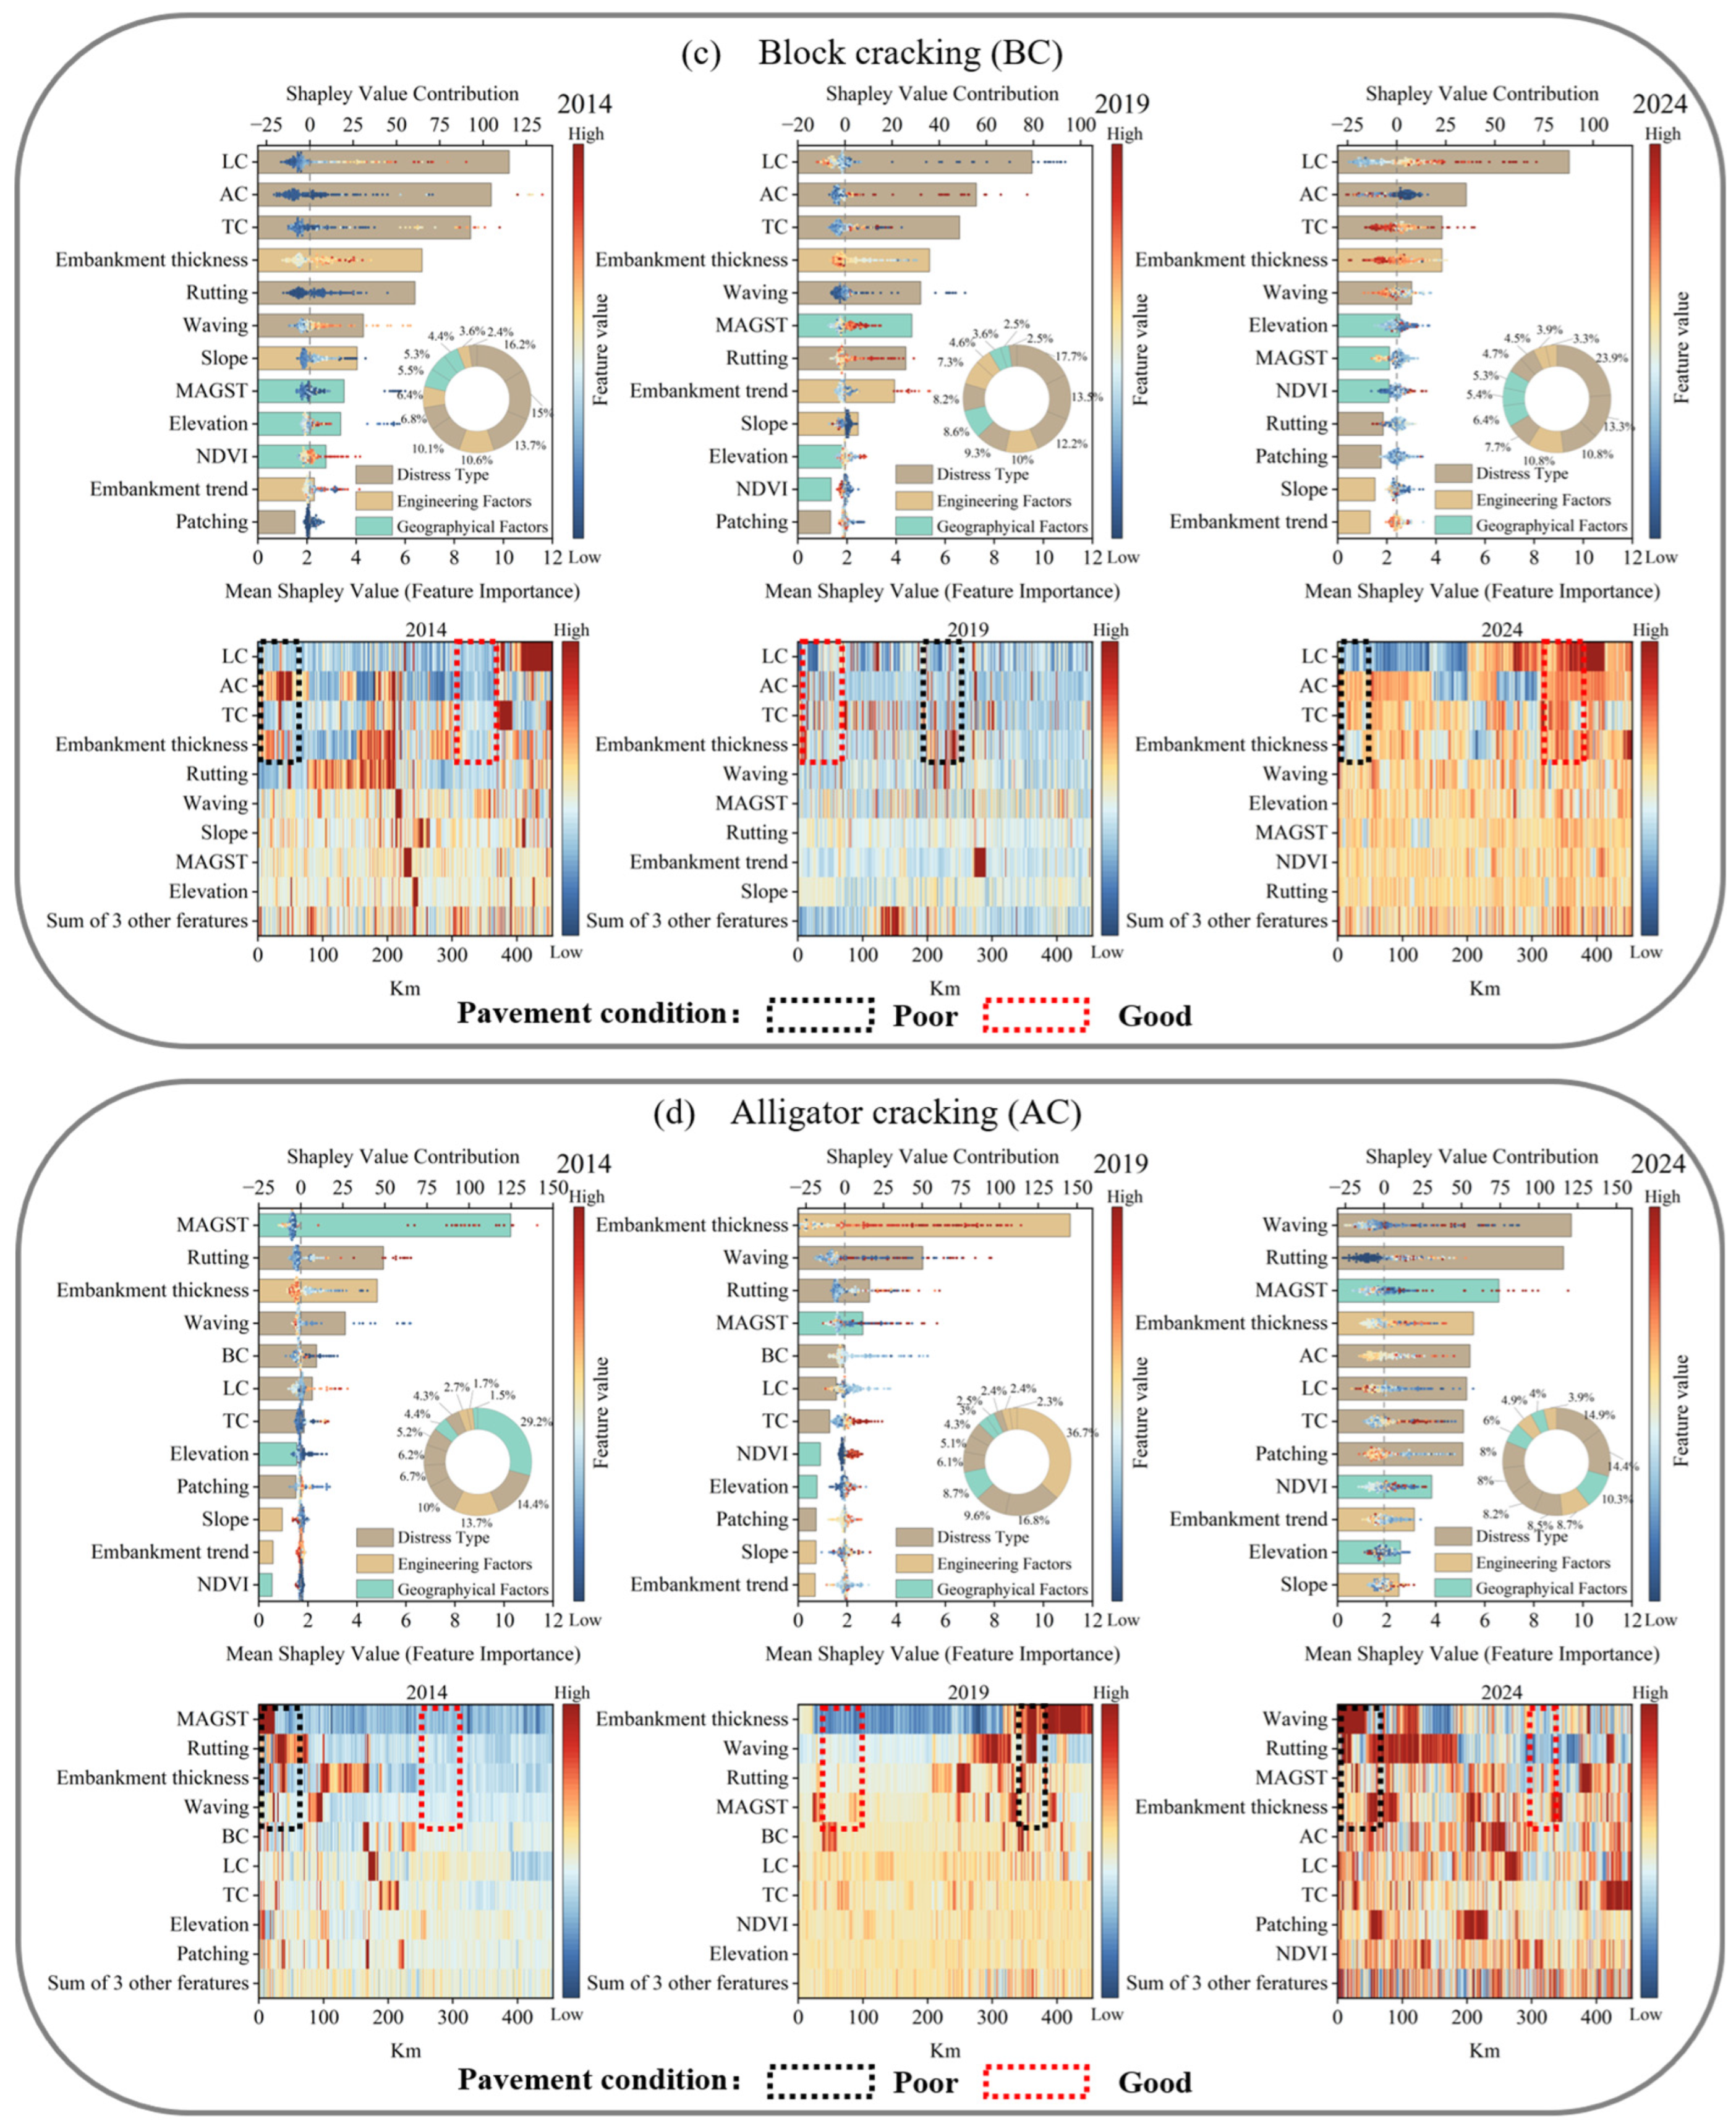
Figure 9 presents the GCN-MGWR results for factors influencing crack-type damage. The upper panel shows the relative contribution of three groups of factors—geographical factors, engineering factors, and pre-existing damage—to the development of crack-type damage. The lower panel illustrates the along-route spatial variability of the influencing factors, with mileage on the horizontal axis, major factors on the vertical axis, and a blue-to-red color scale denoting increasing contribution to crack-type damage. Viewing the figure horizontally, we can identify sections dominated by geographical, engineering, or pre-existing damage controls, whereas a vertical comparison reveals the principal control on that section. Taken together, the two panels delineate the differential contributions of individual factors to crack development and their spatial distribution patterns along the QXH.
Figure 9.
Dominant factor contributions and spatial distribution of crack-type damages based on the GCN-MGWR model (TC: transverse cracking, LC: longitudinal cracking, BC: block cracking, AC: alligator cracking).
The results from the surveys in 2014, 2019, and 2024 indicate that the evolution of crack-type damage has undergone an overall shift from being dominated by geographical factors to being controlled by both engineering and geographical factors. In 2014, geographical factors contributed the most, with crack-type damage mainly controlled by MAGST and embankment thickness. Sections with relatively low embankment thickness and strong temperature fluctuations were more prone to TC. In that year, most sections had good pavement conditions, with only a few sections in poor conditions. Sections with poor pavement conditions closely coincide with where MAGST, embankment thickness, and related factors exhibit high contributions. In 2019, the contribution of engineering factors increased markedly, although crack-type damage was still mainly controlled by MAGST and embankment thickness. Sections with relatively low embankment thickness and large embankment width exhibited concentrated stress and a higher incidence of TC [27]. LC is more sensitive to the sunny–shady slope effect and the associated transverse differential deformation, with differential settlement and structural deformation acting as key mechanisms [28]. At the same time, sections with poor pavement conditions increased significantly along the highway and showed strong spatial coincidence with continuous sections where MAGST and embankment thickness made major contributions to TC, LC, BC, and AC. By 2024, the contributions of the three factor groups were more balanced, and the overall spatial pattern was relatively stable. BC emerged as the combined result of geographical factors and pre-existing cracks, whereas AC was controlled by engineering and geographical factors and concentrated along sections with aged pavement, degraded material properties, and insufficient base strength [29]. Although maintenance interventions improved the overall condition of the pavement, there were still several local sections in poor condition.
5. Discussion
In permafrost regions, the most common pavement damages are cracking damages, whose primary causes are closely related to geographical factors and engineering conditions. In the study, elevations are mostly above 4000 m, with strong solar radiation and large temperature ranges that accelerate asphalt aging and the occurrence of cracks [30]. After resurfacing, early-stage damage tends to be relatively simple. However, over time, the occurrence of one type of pavement damage often becomes a trigger for the initiation and development of other types. Through the complex interactions among different damages, a dynamic and progressively aggravating process forms. Different damages intertwine and mutually reinforce each other, accelerating the deterioration of pavement and leading to a marked increase in the overall rate of damage. For example, once TC and LC develop, BC is likely to appear, and as BC continues to evolve, AC tends to form as well. This not only intensifies the physical deterioration of the pavement, but also degrades pavement conditions, including key indicators such as surface evenness, structural strength, and skid resistance [31,32]. It should be noted that other factors, such as traffic volume, embankment thickness variations, and maintenance frequency, may also influence pavement damage; however, due to the lack of systematically available data, their effects are not included as quantitative variables and are instead partially reflected in the observed spatial patterns of pavement deterioration.
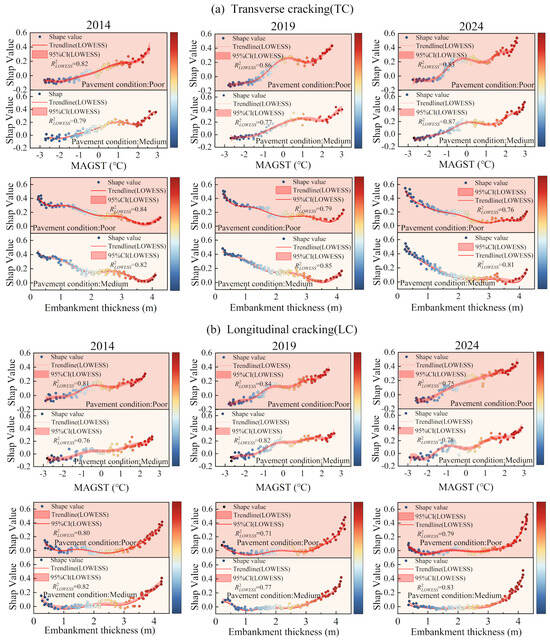
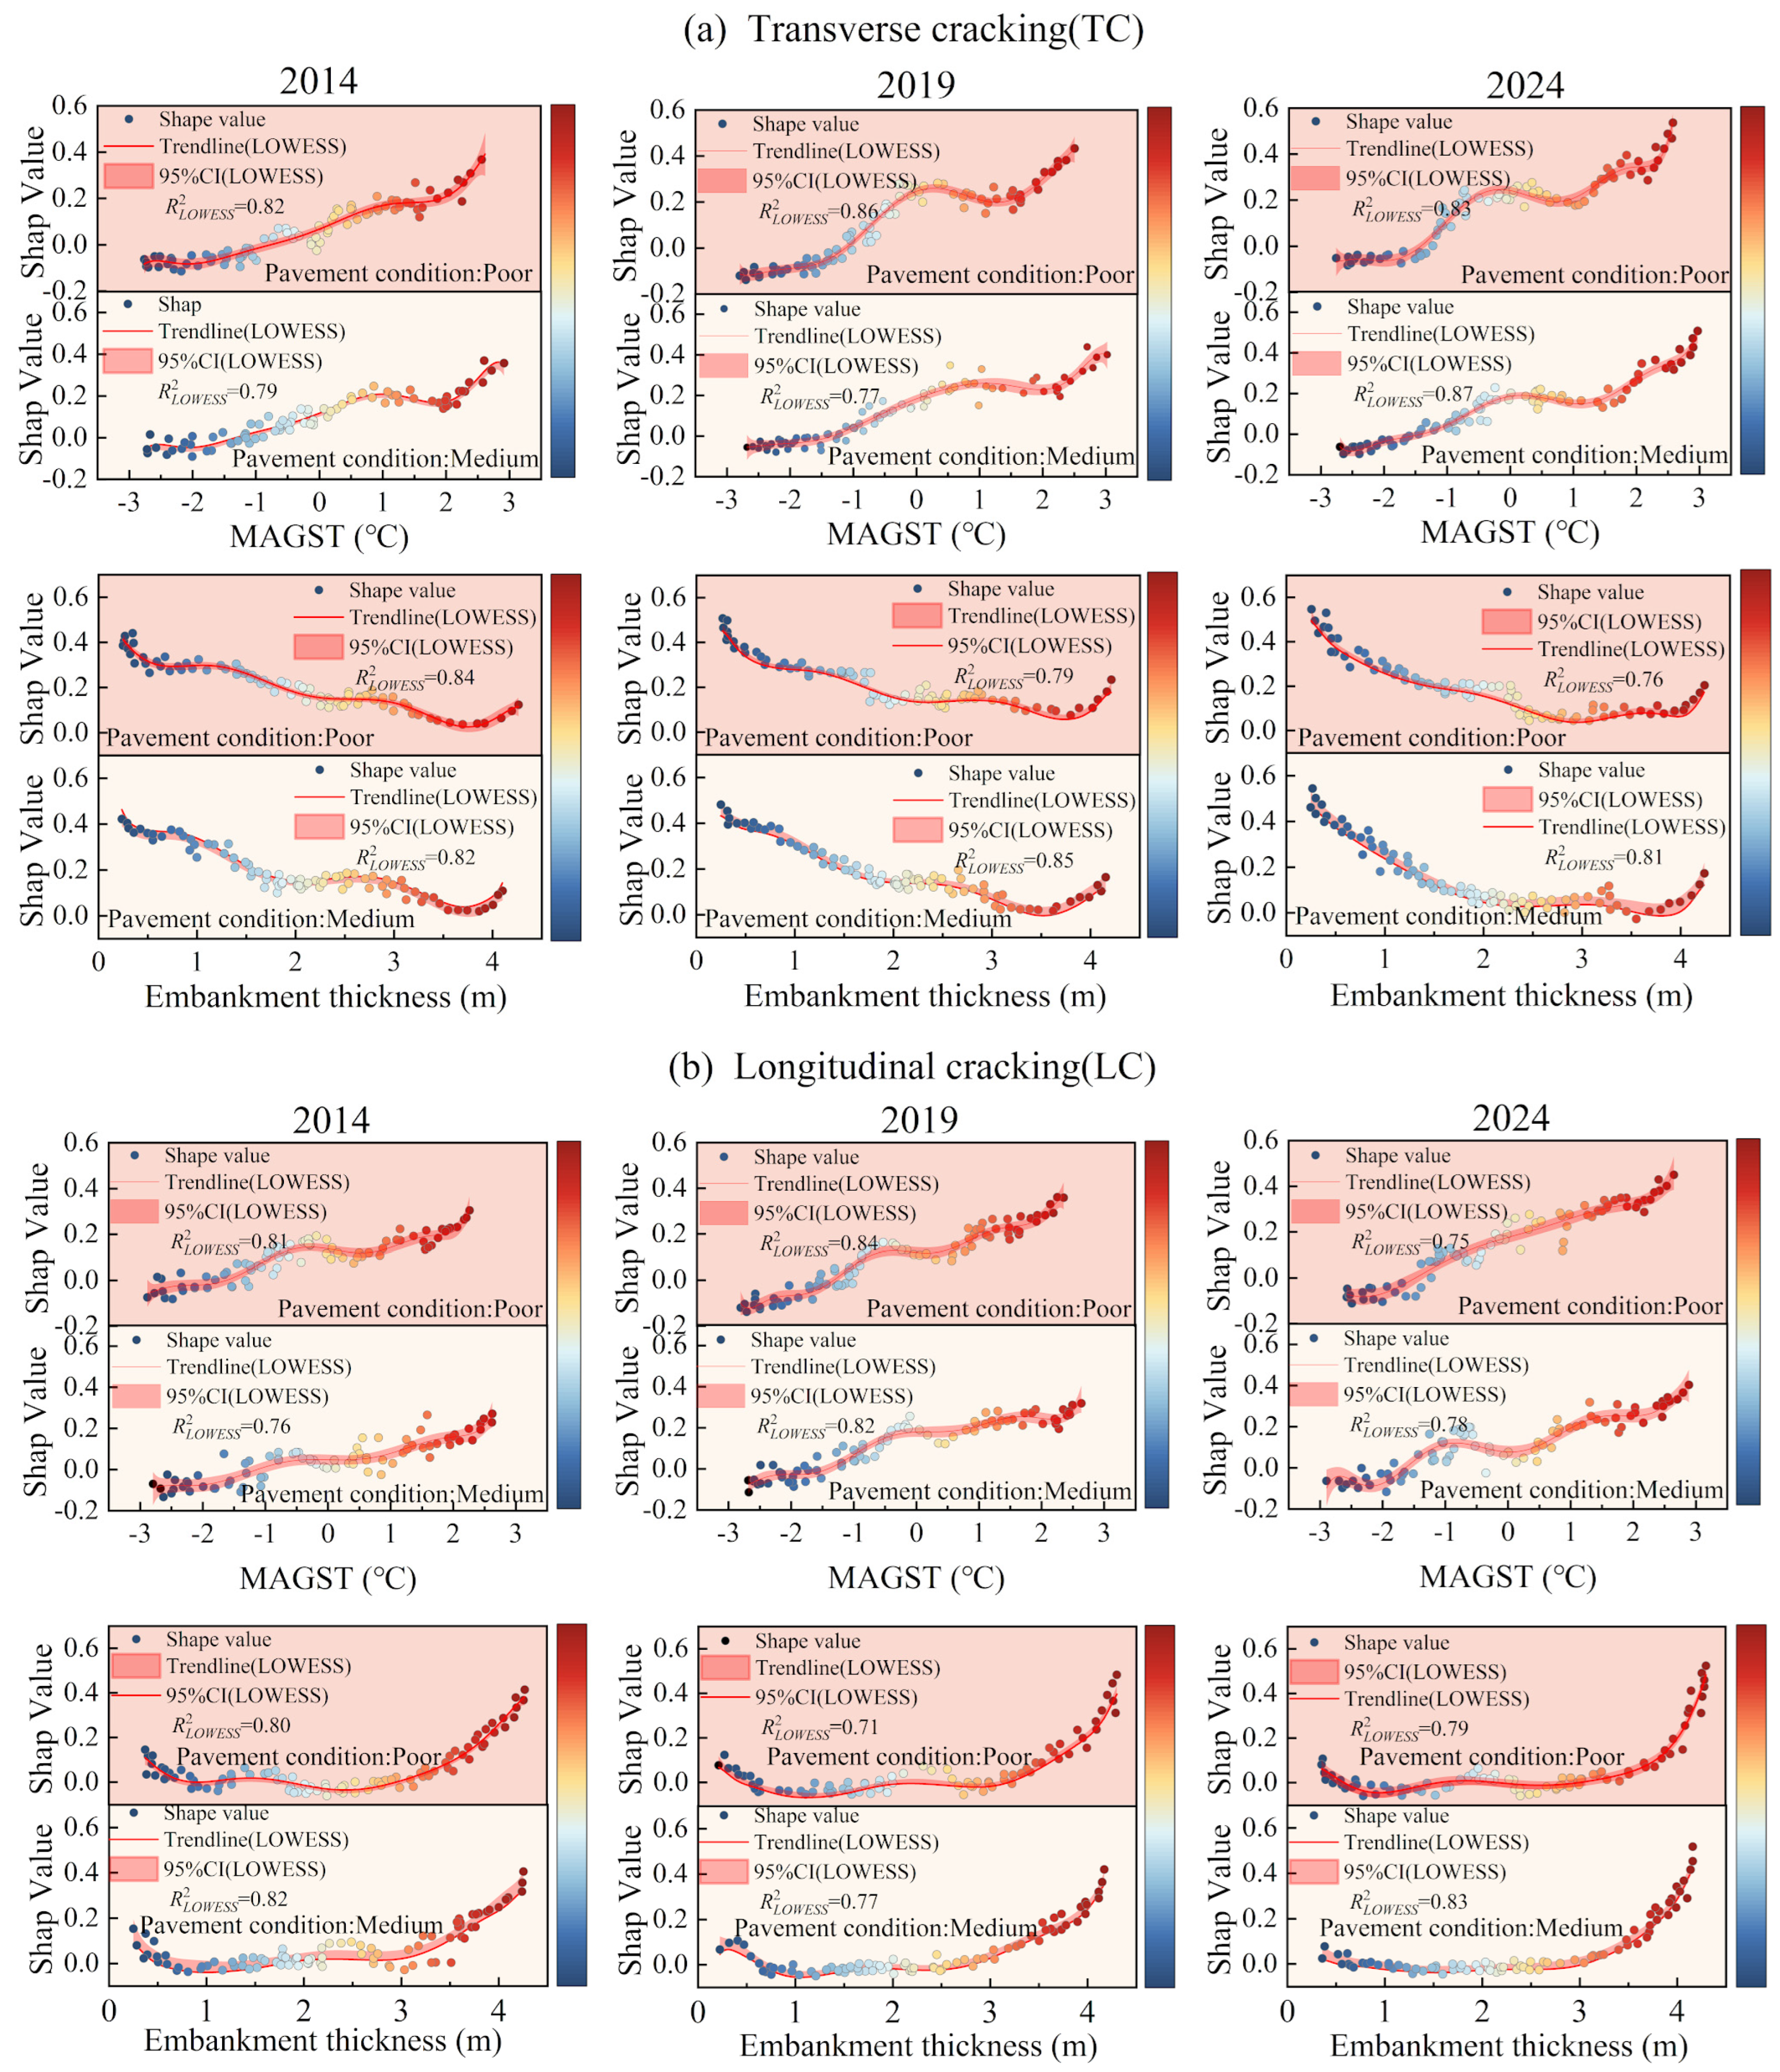
The GCN-MGWR model results showed that among the selected geographical and engineering factors, MAGST and embankment thickness consistently made the largest contributions to crack-type damage. Accordingly, Figure 10 plots the local response curves of two crack types under moderate and poor pavement conditions. For MAGST, TC and LC exhibited broadly similar response patterns across the three surveys, but with different magnitudes. For TC, SHAP values increased with increased MAGST, and the values of poor conditions were always higher than those of moderate conditions. The inflection value was approximately −1.5 °C. Below −1.5 °C, MAGST had almost no effect on crack development, whereas in the positive temperature range, its contribution remains high. This pattern indicates that once permafrost starts to degrade under warming, freezing–thawing cycles and thermal expansion and contraction more readily promote the development of TC. The response curve for LC followed a similar trend, but the increase with warming was more pronounced in 2019 and 2024, suggesting that in sections where transverse uneven deformation was already present, warming not only induced additional settlement but also amplified existing LC. The responses to embankment thickness differed between TC and LC. For TC, SHAP values generally decreased as embankment thickness increased, with a faster decline in poor pavement conditions. When the embankment was lower than about 1.5 m, the contribution was relatively high. A lower embankment more easily transmits frost heave and thaw settlement to the pavement and thus promotes TC. The pattern of LC was the opposite of that of TC in both moderate and poor pavement conditions from 2014 to 2024. SHAP values were lowest at an embankment thickness of about 2.0 m and then increased markedly when exceeding 3.0 m, with the strongest rise in high embankment sections in 2019 and 2024. Due to steeper side slopes and stronger sunny–shady slope contrasts, high embankments induce transverse differential settlement, consequently generating LC.
Figure 10.
Single-factor dominance and spatially weighted regression map of crack-type damages.
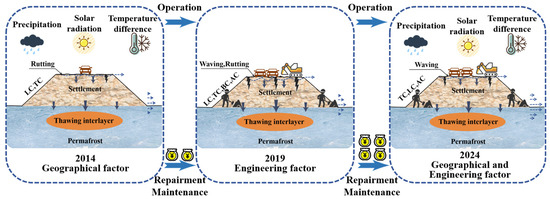
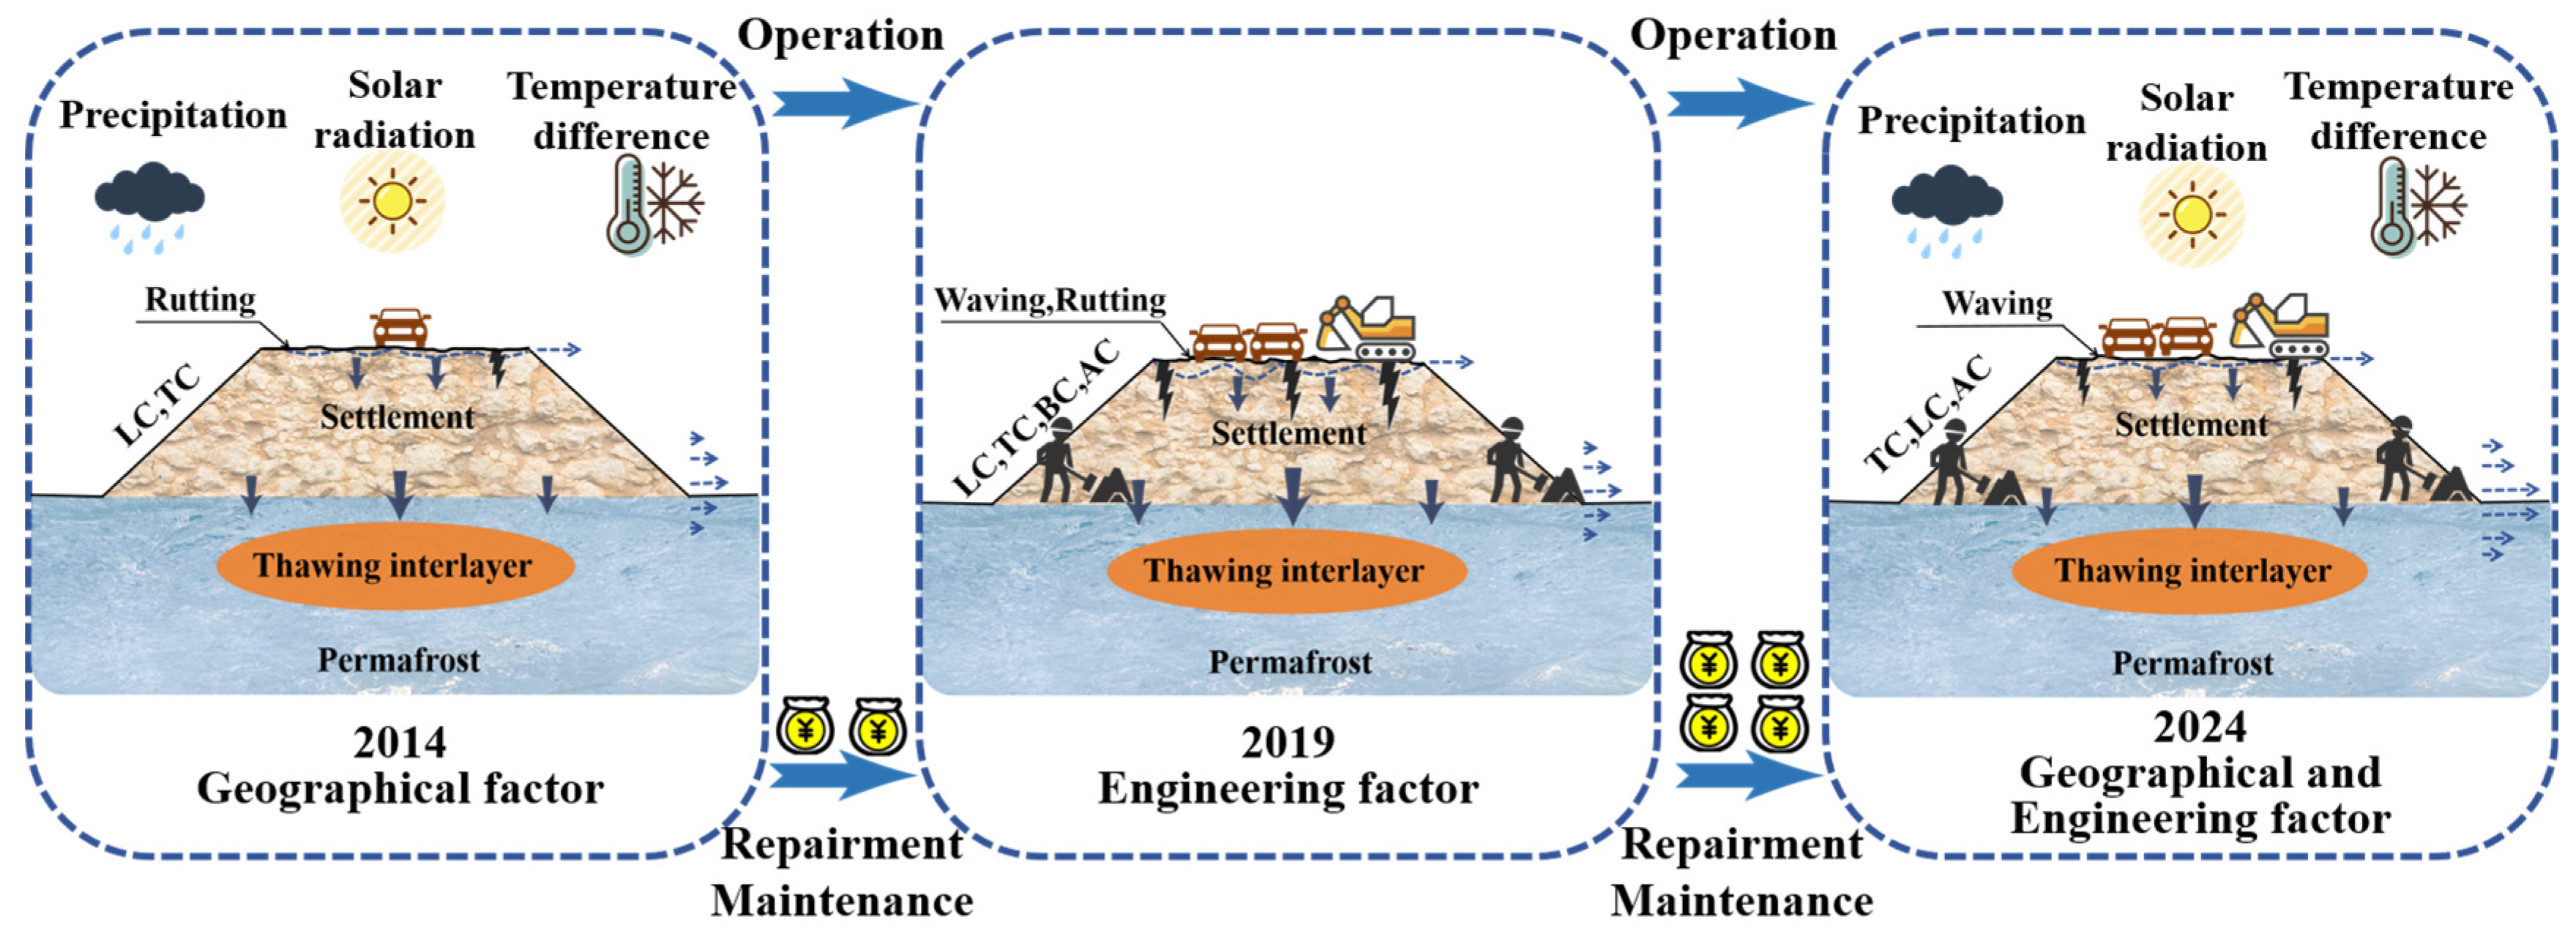
By integrating the three field surveys with the geographical modeling results, the characteristics of crack-type damage along the permafrost sections of the QXH can be summarized at multiple levels (Figure 11). At the temporal scale, crack-type damage evolved from being governed mainly by geographical factors to being driven by the coupling of geographical and engineering controls. At the spatial scale, crack-type damage along the QXH formed an alternating pattern of sections that could be classified as zones dominated by geographical factors, zones dominated by engineering factors, and zones where pre-existing damages were particularly prominent. In terms of the evolution of damage, geographical factors determined whether a road section was prone to damage under thermal, hydrological, and mechanical forcing. Engineering factors governed the manifestation of damage, and pre-existing cracks affected the scale of further damage. The GCN-MGWR model elevates these patterns into an interpretable spatial driving mechanism, forming a complete chain from the distribution of damage to inter-damage associations, geographical process modeling, and regional management.
Figure 11.
Alterations in the impact of geographical and engineering factors on pavement damages in QXH.
6. Conclusions
Based on field investigations, this study obtained data for seven types of pavement damage along a 465 km permafrost section along the QXH. The spatial–temporal relationship among different damage were examined by statistical analysis and correlation analysis. Six key factors affecting the development of pavement damage were then selected under different conditions, and the GCN-MGWR model was applied to analyze the spatial heterogeneity and contribution of each factor to the evolution of each damage. The main findings are as follows:
- (1)
- The three surveys show that the mean pavement damage rate in 2014, 2019 and 2024 remains within the range of 4–7%, with standard deviations between 2% and 4%. Crackings (TC, LC, BC and AC) consistently dominate and display significant positive correlations with deformation damage such as waving and rutting, indicating that cracking is a trigger to other damage and exacerbate subsequent development. Furthermore, the correlations among damage evolve from locally coupled relations to a pattern characterized by the co-evolution of multiple damage, providing a factual basis for subsequent analyses of multi-factor driving mechanisms.
- (2)
- From a geographical perspective, pavement damages are controlled by multiple factors and processes that are not adequately captured by traditional single-factor, single-scale engineering statistical approaches. The GCN aggregates information along adjacency links and represents damages as a continuous spatial process along the highway. The MGWR configures independent bandwidths to various influence factors, implementing spatially weighted regression with one scale per factor to quantitatively identify the scale and coefficient of different factors at different locations. The model reveals a layered control structure in which geographical factors delineate vulnerable sections, engineering conditions determine the forms of damage, and pre-existing damages determine evolutionary pathways. The GCN-MGWR demonstrates the application of a geographical model to explain the effects of different controlling factors when diagnosing damage.
- (3)
- Pavement damages in permafrost regions of the QXH are dominated by crackings that influence the development of waving and other deformation damage. MAGST and embankment thickness are the most significant geographical and engineering factors. Higher MAGST is associated with greater contributions to crack-type damage, revealing that permafrost degradation driven by warming promotes crack development. The contribution of embankment thickness decreases and then increases with height, reaching its minimum at 2–3 m, implying that either lower or higher embankment thickness are more prone to damage initiation and development. With increasing operation time, the control of crack-type damages shifts from being dominated by geographical factors to reflecting the combined influence of geographical factors, engineering conditions, and pre-existing cracks. Different groups of factors were dominant in different sections along the highway. Therefore, future planning, design, and maintenance of the QXH should incorporate these factors and adopt rigorous measures to ensure the operational safety, service reliability, and long-term sustainability of the highway.
Author Contributions
L.L.: Writing-review & editing, Investigation, Supervision, Conceptualization. C.Y.: Writing-review & editing, Methodology, Conceptualization, Software. M.C.: Funding acquisition, Supervision, Conceptualization, Data curation. S.W.: Methodology, Supervision, Investigation. All authors have read and agreed to the published version of the manuscript.
Funding
This work was supported by the Open Project of National Cryosphere Desert Data Center (E01Z790201), the Tibet Autonomous Region Science and Technology Key R&D (No. XZ202401ZY0040), the Foundation of the State Key Laboratory of Cryosphere Science and Frozen Soil Engineering (Nos. SKLFSE-ZQ-202303, CSFSE-ZZ-2406 and SKLFSE-ZY-20), the University First-Class Discipline Construction Project of Ningxia (NXYLXK2021A03). We also thanked the editor and anonymous reviewers for very helpful comments that improved the quality of the manuscript significantly.
Data Availability Statement
Data will be made available on request.
Conflicts of Interest
The authors declare that they have no known competing financial interests or personal relationships that could have appeared to influence the work reported in this paper.
References
- Peng, H.; Ma, W.; Mu, Y.H.; Jin, L.; Yuan, K. Degradation characteristics of permafrost under the effect of climate warming and engineering disturbance along the Qinghai-Tibet Highway. Nat. Hazards 2015, 75, 2589–2605. [Google Scholar] [CrossRef] [Scilit]
- Guo, L.M.; Wang, G.X.; Song, C.L.; Sun, S.Q.; Li, J.L.; Li, K.; Ma, J.P. Ground thermal regime changes caused by integrated warming, wetting, and greening in permafrost regions of the Qinghai-Tibetan Plateau. Catena 2025, 249, 108658. [Google Scholar] [CrossRef] [Scilit]
- Jiang, G.L.; Wang, L.Y.; Yun, H.B.; Gao, S.R.; Wu, Q.B. Thermal influences of road engineering on permafrost underneath different surface condition in the Qinghai-Tibet Plateau. Cold Reg. Sci. Technol. 2019, 173, 103028. [Google Scholar] [CrossRef] [Scilit]
- Song, Y.; Jin, L.; Peng, H.; Liu, H.Y. Development of thermal and deformation stability of Qinghai-Tibet Highway under sunny-shady slope effect in southern Tanglha region in recent decade. Soils Found. 2020, 60, 342–355. [Google Scholar] [CrossRef] [Scilit]
- Hafizyar, R.P.; Karimi, S.D.; Wardak, R.A. Study on asphalt pavement distress: A case study in Turkish Republic of Northern Cyprus. Sustain. Struct. Mater. 2020, 3, 37–45. [Google Scholar]
- Chai, M.T.; Mu, Y.H.; Zhang, J.M.; Ma, W.; Liu, G.; Chen, J.B. Characteristics of asphalt pavement damage in degrading permafrost regions: Case study of the Qinghai–Tibet highway. J. Cold Reg. Eng. 2018, 32, 05018003. [Google Scholar] [CrossRef] [Scilit]
- Peng, H.; Ma, W.; Mu, Y.H.; Jin, L.; Zhu, D.P. Analysis of disease investigation and long-term deformation characteristics of common fill embankment of the Qinghai-Tibet Highway, Rock and Soil Mechanics. Rock Soil Mech. 2015, 36, 2049–2056. (In Chinese) [Google Scholar] [CrossRef]
- Wu, Q.B.; Zhu, Y.L.; Liu, Y.Z. Assessment model of thermal thawing sensibility of permafrost under engineering activity. Chin. J. Geotech. Eng. 2001, 23, 731–735. (In Chinese) [Google Scholar]
- Cheng, G.D.; Wu, T.H. Responses of permafrost to climate change and their geographyical significance, Qinghai-Tibet Plateau. J. Geophys. Res. Earth Surf. 2007, 112, F02S03. [Google Scholar] [CrossRef] [Scilit]
- Chai, M.T.; Li, G.Y.; Ma, W.; Chen, D.; Du, Q.S.; Zhou, Y.; Qi, S.S.; Tang, L.Y.; Jia, H.L. Damage characteristics of the Qinghai-Tibet Highway in permafrost regions based on UAV imagery. Int. J. Pavement Eng. 2022, 24, 1–12. [Google Scholar] [CrossRef] [Scilit]
- Wang, Y.X.; Dou, M.J.; Hu, C.S. Study on critiacl thickness of sbugrade in permafrost area. China Civ. Eng. J. 2003, 36, 94–98. [Google Scholar]
- Wen, Z.; Sheng, Y.; Ma, W.; Wu, Q.B.; Fang, J.H.; Huang, B.; Xu, A.H.; Li, H.Q. Ground Temperature and Deformation laws of highway embankments in degenerative permafrost regions. Chin. J. Rock. Mech. Eng. 2009, 28, 1477–1483. [Google Scholar]
- Zhao, R.M.; Wang, S.J.; Huang, X.M.; Ma, T.; Chen, J.B.; Luo, H.Y. Research on the deformation and damage process of crushed-rock highway embankment in permafrost areas. Comput. Part. Mech. 2024, 11, 2443–2464. [Google Scholar] [CrossRef] [Scilit]
- Li, D.Q.; Zhang, K.; Tong, G.Q.; Ming, F.; Huang, X. Analysis on Cooling Effect of Crushed-Rocks Embankment of Qinghai-Tibet High-Grade Road. Model. Simul. Eng. 2015, 2015, 1–8. [Google Scholar] [CrossRef] [Scilit]
- Chen, J.B.; Wang, S.J.; Zhang, J.Z.; Ma, W. Formation and mechanism of high subgrade diseases of Qingha-i Tibet highway. J. Chang. Univ. (Nat. Ural. Sci. Ed.) 2008, 28, 30–35. [Google Scholar] [CrossRef]
- Abdualmtalab, A.; Heena, D.; Kamal, H.; Amgad, H. Modeling Pavement Performance Indices in Harsh Climate Regions. J. Transp. Eng. 2021, 147, 04021049. [Google Scholar] [CrossRef] [Scilit]
- Tai, B.W.; Wu, Q.B.; Yue, Z.R.; Xu, H.B. Thermal and deformation characteristics of novel anti-freeze-thaw embankments in permafrost and seasonal frozen ground regions of China. Cold Reg. Sci. Technol. 2021, 189, 103331. [Google Scholar] [CrossRef] [Scilit]
- Dong, Y.H.; Chen, J.B.; Yuan, K.; Jin, L.; Zhu, D.P.; Zhang, H.J.; Peng, H. A field embankment test along the Gonghe-Yushu Expressway in the permafrost regions of the Qinghai-Tibet Plateau. Cold Reg. Sci. Technol. 2020, 170, 102941. [Google Scholar] [CrossRef] [Scilit]
- Quan, L.; Tian, B.; Niu, K.M.; Li, S.L. Field observation and analysis on thermal effects of wide asphalt pavement-embankment structure in high-altitude permafrost region. China Civ. Eng. J. 2019, 52, 111–119. [Google Scholar] [CrossRef]
- Ji, Y.Y.; Wang, Q.; Song, X.L.; Ruan, X.R.; Liu, J.J.; Zhang, W.; Wang, P.C.; Xie, C.Y.; Tang, H.J.; Liu, F.P.; et al. Study on Dynamic Changes of Vegetation in Permafrost Region of Qinghai-Tibet Plateau—Take the Area along Qinghai-Tibet Highway as an Example. Environ. Resour. Ecol. J. 2022, 6, 31–36. [Google Scholar] [CrossRef] [Scilit]
- Luo, L.H.; Ma, W.; Zhuang, Y.L.; Zhang, Y.N.; Yi, S.H.; Xu, J.W.; Long, Y.P.; Ma, D.; Zhang, Z.Q. The impacts of climate change and human activities on alpine vegetation and permafrost in the Qinghai-Tibet Engineering Corridor. Ecol. Indic. 2018, 93, 24–35. [Google Scholar] [CrossRef] [Scilit]
- JTG 5210-2018; Evaluation Standards for Highway Technical Conditions. People’s Communications Press: Beijing, China, 2018. (In Chinese)
- Dou, M.J.; Hu, C.S.; He, Z.W.; Zhang, Y.Q. Distributing Regularities of Subgrade Diseases in Permafrost Section of the Qinghai-Tibetan Highway. J. Glaciol. Geocryol. 2002, 6, 780–784. [Google Scholar]
- Wang, L.H.; Li, Y.C.; Gan, Y.S.; Zhao, L.; Fan, L.; Qin, W.; Ding, L. Reconstructing high-resolution gridded precipitation data in the southwest China highland canyon area using an improved (MGWR) downscaling method. Sci. Total Environ. 2024, 948, 174866. [Google Scholar] [CrossRef] [Scilit]
- Yin, P.Q. Spatial-Temporal Patterns and Characteristics Analysis of the Development of Specialized, Fined, Peculiar, Innovative Small and Medium-sized Enterprises in Jiangsu Province based on MGWR Model. Econ. Soc. Humanit. 2024, 1, 120–127. [Google Scholar] [CrossRef] [Scilit]
- Zhao, J.; Guo, F.; Zhang, H.C.; Dong, J. Mechanisms of non-stationary influence of urban form on the diurnal thermal environment based on machine learning and MGWR analysis. Sustain. Cities Soc. 2024, 101, 105194. [Google Scholar] [CrossRef] [Scilit]
- Ma, R.; Li, Y.M.; Cheng, P.F.; Chen, X.L.; Cheng, A. Low-Temperature Cracking and Improvement Methods for Asphalt Pavement in Cold Regions: A Review. Buildings 2024, 14, 3802. [Google Scholar] [CrossRef] [Scilit]
- Zhang, C.; Wang, H.N.; You, Z.P.; Ma, B. Sensitivity analysis of longitudinal cracking on asphalt pavement using MEPDG in permafrost region. J. Traffic Transp. Eng. (Engl. Ed.) 2015, 2, 40–47. [Google Scholar] [CrossRef] [Scilit]
- Cui, P.D.; Xiao, Y.; Fang, M.J.; Chen, Z.W.; Yi, M.W.; Li, M.L. Residual Fatigue Properties of Asphalt Pavement after Long-Term Field Service. Materials 2018, 11, 892. [Google Scholar] [CrossRef] [Scilit] [PubMed]
- Li, M.; Zhi, X.L.; Tian, L.; Ren, S.B. Study on New Treatment Technology of Subgrade Longitudinal Crack in Qinghai-Tibet Highway. Adv. Mater. Res. 2013, 671–674, 1183–1188. [Google Scholar] [CrossRef] [Scilit]
- Wang, S.J.; Jin, L.; Mu, K.; Dong, Y.H.; Chen, D.G.; Peng, H. The Temporal Effect of Distress Developments of Frozen Embankments in the Permafrost Regions along the Qinghai-Tibet Highway. J. Test. Eval. 2019, 47, 3059–3079. [Google Scholar] [CrossRef] [Scilit]
- Xia, X.; Han, D.D.; Zhao, Y.l.; Xie, Y.C.; Zhou, Z.Y.; Wang, J.M. Investigation of asphalt pavement crack propagation based on micromechanical finite element: A case study. Case Stud. Constr. Mater. 2023, 19, e02247. [Google Scholar] [CrossRef] [Scilit]

Disclaimer/Publisher’s Note: The statements, opinions and data contained in all publications are solely those of the individual author(s) and contributor(s) and not of MDPI and/or the editor(s). MDPI and/or the editor(s) disclaim responsibility for any injury to people or property resulting from any ideas, methods, instructions or products referred to in the content. |
© 2026 by the authors. Licensee MDPI, Basel, Switzerland. This article is an open access article distributed under the terms and conditions of the Creative Commons Attribution (CC BY) license.