


Abstract
This study tested quarter-scale adobe masonry walls under monotonic in-plane loading, considering the effect of water content at the foundation–wall interface, fiber type, and openings (i.e., door, window). Seven walls were constructed with unstabilized adobe bricks containing either cut straw or sisal fibers and mud mortar. Gravimetric water content (wb) at the foundation–wall interface (i.e., wall base) varied by test wall, ranging from 2.4 to 4.9% by dry mass. The walls were instrumented to measure in-plane and out-of-plane displacements and vertical deflections during the load tests. Greater water contents at and near the wall base shifted cracking toward the lower courses and along the foundation–wall interface; however, the peak load capacity did not vary significantly with wb but was strongly influenced by crack trajectory, including whether cracking diverted into the foundation or propagated rapidly along the foundation–wall interface. Peak loads ranged from 1928 N (433 lb) to 6517 N (1465 lb). Fiber type influenced deformation behavior of the walls, with sisal-brick walls generally developing larger vertical deflections and, in some instances, larger peak in-plane displacements than straw-brick walls. Window and door openings altered crack initiation and propagation by concentrating cracking at opening corners and producing segmented mechanisms, increasing in-plane displacements in some cases, but still sustaining comparatively large peak loads.
1. Introduction
Earthen construction, including adobe masonry, has been used in dwellings and other structures by diverse cultures throughout the world for millennia [1,2,3]. Adobe masonry is a construction material with a rich history, with its origins traceable to ancient civilizations, documented as early as 5000 before present (BP) in the American continent [1]. Adobe remains an important traditional construction technique because it relies on locally available materials and is commonly associated with low-cost construction, low embodied energy, and reduced environmental impact compared with conventional construction materials [4,5,6,7,8]. The primary constituents of adobe bricks are soils containing clay, silt, and sand fractions, and often natural plant fibers, and construction techniques and skills are frequently passed down through generations. At the end of the service life of adobe masonry buildings, unstabilized adobe may be returned to the ground, further emphasizing its sustainable characteristics [4,9].
Adobe masonry offers advantages over alternative construction methods, notably in terms of thermal and acoustic performance [8,10,11,12,13,14]. The large thermal mass and favorable thermal coefficient of adobe walls enable them to absorb heat during the day and release it at night, thereby moderating indoor temperatures and reducing reliance on artificial heating and cooling systems [8,15]. Similarly, the material’s inherent large density provides excellent soundproofing properties [11]. Despite these benefits, public perception of adobe construction remains polarized. In many regions, it is regarded either as a low-cost option for economically disadvantaged communities or as an artisanal, luxury material for sustainable homes. Such perceptions can obscure adobe’s broader potential as a practical, efficient, and scalable solution for environmentally responsible housing across socioeconomic levels [7,16].
Nonetheless, adobe masonry is not without vulnerabilities. Its substantial mass and low tensile strength render it susceptible to damage under extreme loading conditions, such as those induced by seismic activity [17,18,19,20]. Consequently, adobe masonry structures in earthquake-prone regions are at particular risk, as historical records attest to numerous instances of failure during seismic events [21]. Openings in walls, such as those for windows and doors, further exacerbate these vulnerabilities by creating localized stress concentrations [22,23,24]. Addressing these vulnerabilities requires not only preservation, restoration, and rehabilitation to safeguard cultural and architectural legacies, but also careful design and execution of new construction to ensure durability and structural integrity.
The structural behavior of adobe masonry subjected to seismic loading is influenced by several factors, including water content at the foundation–wall interface, the presence of openings, and the inherent heterogeneous nature of the adobe material [22,25,26,27,28]. New numerical approaches have been developed to understand and predict crack propagation patterns and mechanical behavior of masonry structures, including adobe masonry, at the global and micro scales [24,27,28,29,30,31]. Testing adobe masonry at full or reduced scale under cyclic or quasi-static loading conditions is complex and requires significant resources, but experimental results of tests on adobe masonry walls [20,32,33] are essential for calibration and validation of numerical models, development of construction and restoration methods, and improvement of building codes for adobe masonry.
Prior research has also studied the physical and mechanical properties of adobe material with plant fibers [34,35,36,37,38]. Some gaps remain in understanding the effects of water content and the potential for enhancement of mechanical properties through the incorporation of different natural fibers. Straw fibers, for example, are commonly added to adobe bricks to reduce shrinkage cracking during drying and improve workability, yet their impact on lateral load resistance of adobe walls remains insufficiently studied. The addition of sisal fibers to unstabilized and stabilized adobe bricks have been found to enhance the compressive, flexural, and shear strength of the adobe material, and the increase can be significant, depending on variables such as fiber-soil ratio, fiber length, fiber properties, and fiber-soil bond strength [39,40,41]. The addition of fibers with tensile properties may reduce the required compression area for a given axial load. Recurrent observations of experimental studies on adobe bricks with sisal fibers are that the fibers may provide ductile behavior (or toughness) to the soil-fiber composite compared with adobe without fibers and that there are optimal fiber-soil content ratios and fiber length which favor strong fiber-soil bonding and fiber pullout resistance [39,41,42,43,44]. Sisal fibers can also help delay crack propagation in specimens under tensile loading [40].
This paper presents and discusses the results of monotonic in-plane load tests conducted on seven scaled adobe walls. The test specimens incorporated adobe bricks containing either straw or sisal fibers and included configurations with an opening to simulate either a window or a door. This study tested the hypothesis that brick fiber type, localized wetting at the foundation–wall interface, and presence of openings interact to control strength and mechanical response under in-plane (lateral) loading. It was expected that sisal fibers would increase brick-mortar interlock and produce either larger peak loads or greater stiffness than walls with straw bricks. In moisture-conditioned walls (i.e., slightly wet at the base), it was expected that cracking would initiate and propagate along the foundation–wall interface, facilitating sliding along these cracks. For walls with a window or door opening, it was expected that crack paths would preferentially initiate, or culminate, at the corners of the opening, creating multi-crack mechanisms and promoting segmented rocking/sliding behavior.
2. Materials and Methods
The experimental program consisted of monotonic in-plane (lateral) load tests on seven quarter-scale adobe masonry walls. The length, height, and thickness of the walls were 1.524 m, 0.762 m, and 0.064 m (5.0 ft, 2.5 ft, and 2.5 in.), respectively, representing a quarter-scale model of a typical full-scale adobe wall used in residential construction in the southwestern region of the United States of America. Adopting a 1:4 geometric scale ratio allowed testing of multiple wall configurations while capturing the governing in-plane failure mechanisms. The test conditions included walls constructed with unstabilized adobe bricks containing either straw or sisal fibers, walls with or without an opening (window or door), and walls with different water content at the foundation–wall interface. The wall models were instrumented to monitor in-plane and out-of-plane deformations and vertical deflections. Table 1 summarizes the main test parameters and wall naming. Drift ratios were calculated by dividing the top in-plane displacements of the wall at a given stage of the load test by the wall height.
Table 1.
Test conditions and gravimetric water content of the walls.
2.1. Adobe Bricks and Mortar
The adobe soil mixture was composed of natural sandy silty clay (73.4%), poorly graded sand (26.2%), and plant fibers (0.34% cut straw or sisal, up to 25 mm = 1 in. long) (herein material percentages are by dry mass). The soil and fiber materials were mixed manually with a gravimetric water content of w = 21%. To promote uniformity, the sand and natural sandy silty clay were stored separately prior to mixing. The natural sandy silty clay was placed in buckets and moistened one day before mixing to allow water to penetrate the soil aggregates. When mixing, the prewetted soil and dry sand were combined in a wheelbarrow with fibers (straw or sisal) and mixed thoroughly using a hoe. The remaining water needed to reach the target gravimetric water content was added, and the mixture was thoroughly mixed manually with the hoe, with motions alternating diagonally and front-to-back until uniform consistency was achieved. The bricks were formed by compacting the adobe mud manually with a closed fist in wooden molds and were sun-dried outdoors for at least one week under ambient outdoor conditions before constructing the wall. The preparation was consistent with adobe practice in which sun-dried bricks are generally allowed to dry for about one to two weeks before use in construction [45]. The wall bricks were quarter-scale, and their length, width, and height were 89 mm, 64 mm, and 25 mm (3.5 in., 2.5 in., and 1 in.), respectively. The length, width, and height of the footing bricks were 127 mm, 89 mm, and 25 mm (5.0 in., 3.5 in., and 1.0 in.), respectively. The construction of each wall model required 340 wall bricks and 34 footing bricks. The mechanical properties of the quarter-scale bricks used in the wall tests were characterized in a separate experimental program [46], using the same adobe mixture and a gravimetric water content at mixing w = 21%. At the time of testing (breaking), the average gravimetric water content of these bricks was w = 2.0%, with individual values ranging from 1.4 to 2.7% [46]. The corresponding dry densities ranged from 1.93 to 2.14 g/cm3 (120–134 lb/ft3), and the brick compressive strength fc ranged from 3.5 to 5.0 MPa (510–725 lb/in.2), with an average of approximately 4 MPa (580 lb/in.2) [46]. These gravimetric water contents and brick properties provided the baseline unit-level parameters for the wall tests, for which the gravimetric water contents at testing are provided in Table 1. The mud mortar was the same adobe soil mixture as the bricks, with no fibers and w = 23%.
2.2. Wall Foundation
The wall foundation was composed of soil and footing bricks. The foundation soil that supported the footing and wall was the same adobe soil mixture used for making the bricks but with no fibers, and mixed with w = 19%. The wet adobe soil was placed in layers and compacted by hand using a wooden hoe in a wooden box with internal length, width, and depth of 2.13 m, 0.23 m, and 0.28 m (84 in., 9 in., and 11 in.), respectively. The wooden form was anchored to the strong floor of the laboratory. Two courses of footing bricks were laid embedded into the soil in a running bond pattern with joints up to 10 mm (0.375 in.) wide. Each row used 16 bricks and a half-brick at an end. The top row of the footing was leveled with the surface of the foundation soil. The foundation represented an adobe brick footing, which is common in traditional adobe construction. An adobe footing allows moisture from the ground to penetrate the wall by capillary rise.
2.3. Wall Construction
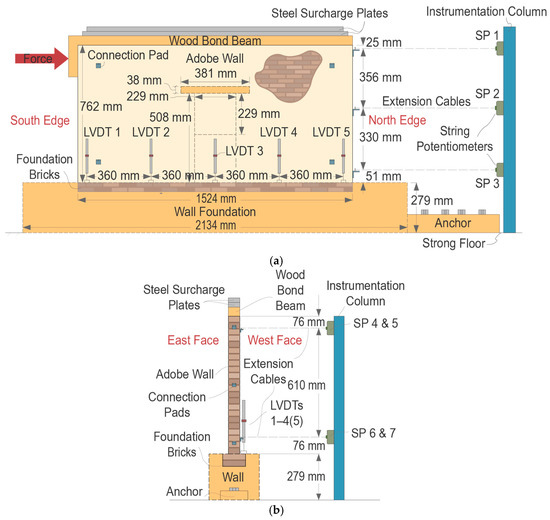
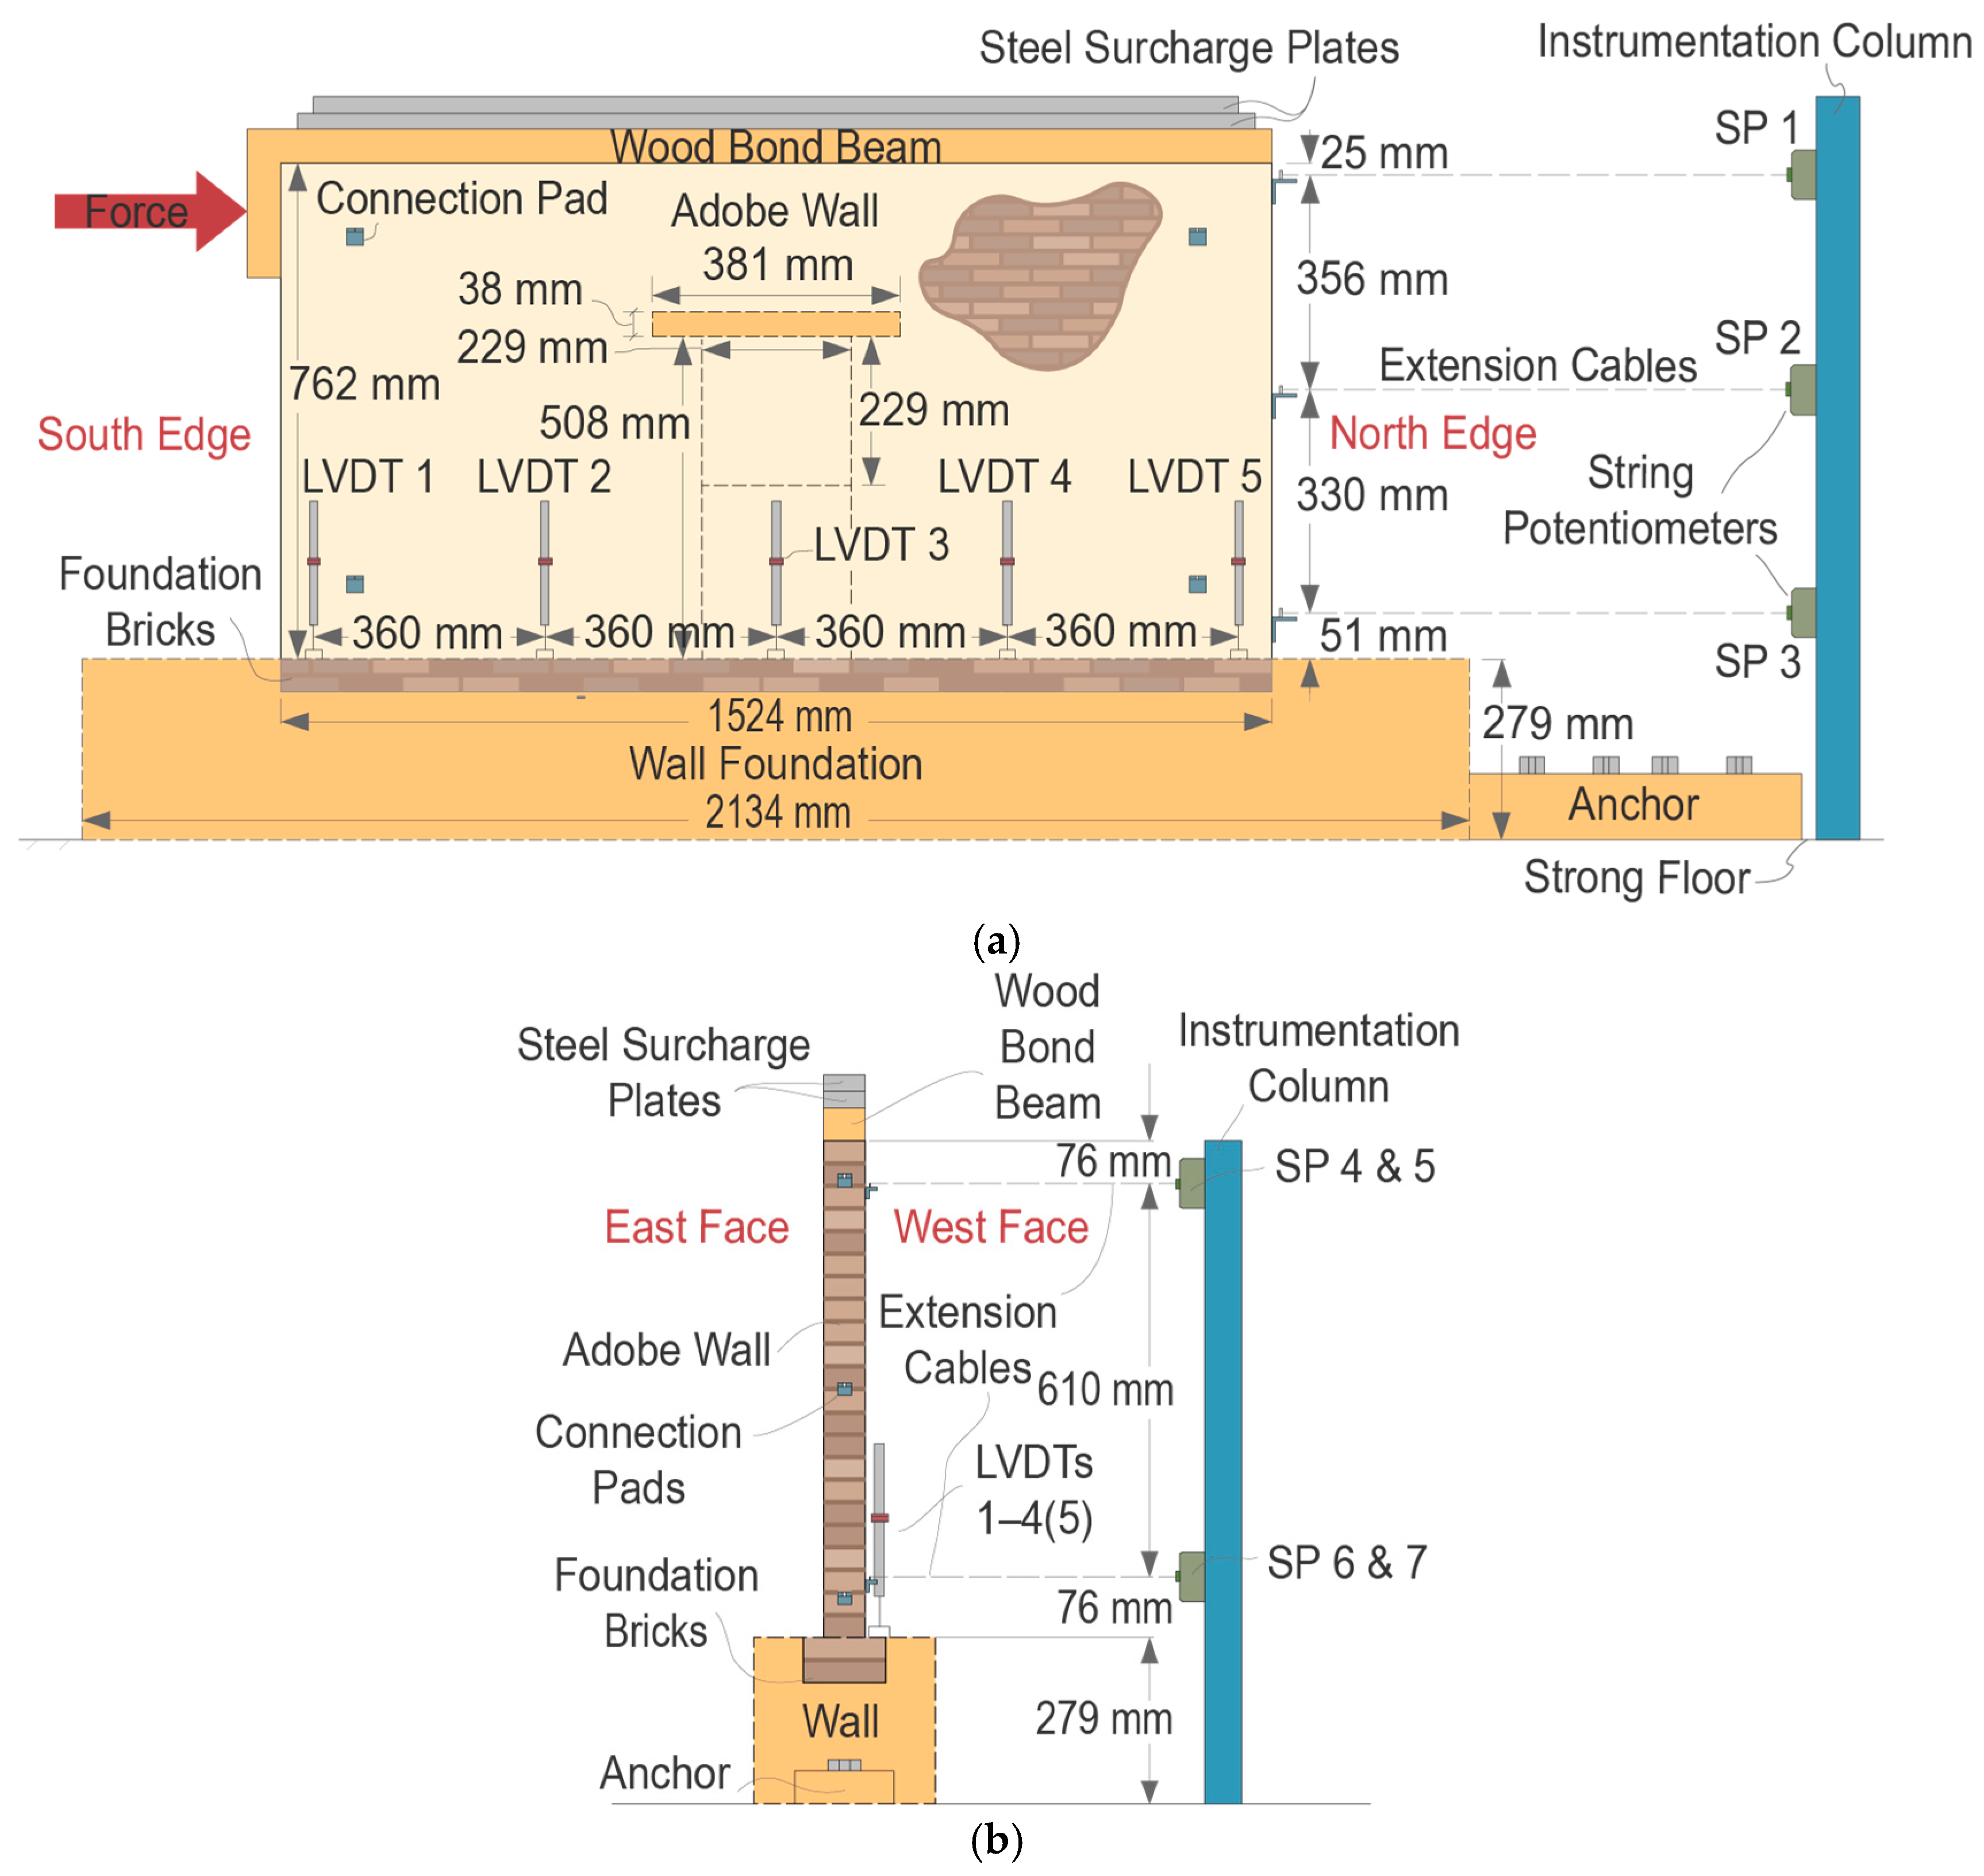
Wall bricks were laid in a running bond pattern. A half-brick was used at one end of each row, alternating sides in each row of bricks. The walls were constructed in stages in the laboratory. No more than eight brick courses were placed in 24 h to prevent out-of-plane deformation and bulging of the wall while the mud mortar was significantly wet and soft. When the wall included an opening, a wooden lintel was installed on top of the door or window. The length, width, and thickness of the lintel were 381 mm, 64 mm, and 38 mm (15 in., 2.5 in., and 1.5 in.), respectively. The opening was in the center of the wall. The window was a 229 mm (9 in.) square opening, and the door had a height and width of 508 mm and 229 mm (20 in. and 9 in.), respectively.
An L-shaped wooden bond beam was installed on the top of each wall to prevent localized crushing at the point of application of the in-plane load and to simulate a distributed load transfer similar to a roof diaphragm. Although this detail is not typical of traditional adobe construction, it was introduced to facilitate laboratory testing and provide a more controlled and repeatable load transfer mechanism. To secure the bond beam, six holes (diameter: 19 mm = 0.75 in., length: 127 mm = 5 in.) were drilled into the top of the wall, spaced at 229 mm (9 in.). These holes aligned with pre-drilled holes through the wooden bond beam. Steel dowels [diameter: 10 mm (0.375 in.), length: 152 mm (6 in.)] and cement mortar with a maximum aggregate size of 5 mm (0.19 in.) were installed in the holes to create a connection between the bond beam and the adobe wall.
After completion, the walls were allowed to air-dry in the laboratory for approximately 1–3 weeks before load testing, with at least one week of drying until the mortar appeared as dry as the bricks by visual inspection [32]. Throughout the construction and drying period, the temperature and ambient relative humidity in the laboratory were maintained at 21–24 °C (70–75 °F) and 25–35%, respectively.
2.4. Instrumentation and Test Setup
The instrumentation and test setup are shown in Figure 1. The test setup included the wall and foundation, two instrumentation columns, a bond beam, steel surcharge plates, an anchor, and a reaction column. The instrumentation consisted of displacement transducers, a hydraulic jack and pump, a load cell, and a data acquisition system for real-time recording and monitoring of the test. In-plane loading was applied using a 267-kN (30-short ton) hydraulic jack with a 152 mm (6 in.) stroke, operated manually with a hydraulic hand pump. Accordingly, the loading was displacement-controlled with an average displacement rate across the seven wall tests of approximately 0.97 mm/min (0.038 in./min) with 0.35 mm/min (0.014 in./min) standard deviation. The load cell was placed between the reaction column and the hydraulic jack (Figure 1a). Two steel plates with a total weight of 672 N (151 lb) were secured to the wood bond beam to represent a distributed roof load of 438 N/m (2.5 lb/in.) along the wall. The wood bond beam on top of the wall was used to distribute the weight of these steel plates that acted only as a constant vertical surcharge (i.e., roof load) and were not used to distribute the lateral load from the hydraulic jack.
Figure 1.
In-plane test schematic: (a) front view; (b) side view.
Loading was stopped when a shear crack, or shear cracks in the window and door wall specimens, propagated through the mortar joints along the wall length with no further increase in load-carrying capacity. For data interpretation, the ultimate point (U) and associated lateral load capacity of each wall were defined as the point on the descending branch where the lateral load had decreased to 80% of the peak load P, corresponding to 20% post-peak strength reduction, consistent with common force-deformation practices used in nonlinear seismic assessment procedures, including FEMA-type methodologies [47,48]. Although the ultimate point was used for capacity and drift calculations, loading was typically continued beyond the ultimate load point to observe additional response; therefore, the plotted load–displacement histories extend past the 20% post-peak strength reduction point. The softening point (S) was identified from the SP 1 load–displacement response as the first load, after a prescribed drift offset of 0.05% from the origin, at which the tangent stiffness dropped below 70% of the reference maximum tangent stiffness for at least ten consecutive data points; the drift offset was introduced to exclude the earliest local stiffness reduction associated with initial crack formation. The initial stiffness at 50% of the load at softening (0.5S) was calculated as the secant stiffness from the origin to the load corresponding to 0.5S. For Wall 5, this secant stiffness was evaluated at 75% of the load at softening (0.75S) instead of 50% to keep the corresponding displacement within the reliable measurement range of SP 1, while still characterizing the pre-softening slope of the wall response. To enable comparisons among walls at a common pre-peak deformation level, a secant stiffness at 0.10% drift was also calculated as the ratio of load to SP 1 displacement at a drift ratio of 0.10%, which lies within the pre-peak range for all wall specimens, including Wall 1. The post-peak drift ratio U/P was defined as the ratio of the drift at U to the drift at P.
The four sides of the walls were labeled as follows. The south edge was the wall end where the in-plane force was applied, and the north edge was the wall end nearer to the in-plane instrumentation column (Figure 1a). The east face was the wall surface shown in Figure 1a, and the west face was behind.
In-plane and out-of-plane displacements were measured with seven string potentiometers (SPs), also known as cable-extension transducers. Vertical deflections were measured with linear variable displacement transducers (LVDTs) equally spaced and attached with wooden connection pads glued to the wall surface (see Figure 1). The walls had four LVDTs, except for Wall 6, which had five LVDTs. LVDT 1 was the closest to the south edge. Three SPs measured in-plane wall displacements and were mounted on an instrumentation column approximately 0.915 m (3 ft) from the north edge of the wall; SP 1 was 25 mm (1 in.) from the wall top, SP 2 was 381 mm (15 in.) from the wall top (at mid-height), and SP 3 was 51 mm (2 in.) from the wall bottom (Figure 1a). SP 4 through SP 7 measured out-of-plane displacements and were mounted on a second instrumentation column oriented parallel to the wall. SPs 4–7 were connected to the wall face near each wall corner, at 76 mm (3 in.) from either the north or south edge and top or bottom of the wall (Figure 1b). The LVDTs and SPs 4–7 were mounted on or connected to the east face of Walls 2, 4, 5, and 6 and to the west face of Walls 1, 3, and 7 (Figure 1). In-plane displacement (SPs 1–3) was considered positive when the wall moved toward the north edge side. Out-of-plane displacement (SPs 4–7) was considered positive when the wall moved toward the east edge side. Vertical deflection was considered positive when the wall moved up.
2.5. Water Content of the Walls
The gravimetric water content of the adobe bricks in the air-dry condition (in the laboratory) was approximately 1–3%. The water content at and near the foundation–wall interface of Walls 3, 4, and 5 was slightly increased before loading to assess the effect of moisture on the wall behavior. To increase wb, once the wall had dried following construction, water was sprayed evenly on the surface of the east and west faces of the bottom 102 mm (4 in.) area, twice a day for at least three days prior to load testing. During the moisture conditioning stage, wet towels were kept on the floor near the foundation box, and the wall and towels were covered with a plastic sheet to maintain a humid environment. At the end of the load tests, water content was determined for 12 samples from the wall top, middle, bottom (foundation–wall interface area), and the foundation (footing bricks and foundation soil). Two additional adobe walls (Walls 8 and 9) were constructed and collapsed during moisture conditioning because of the relatively large wb (ranging from 8.4% to 17.1%) at the bottom of the wall, causing excessive bulging and instability under self-weight due to the significant reduction in compressive strength of the adobe within this wb range [28,38,46].
3. Results
For each wall, the results are presented in plots of applied load versus in-plane displacement, in-plane displacement in relation to wall height at given load increments, and vertical deflection versus length along the wall at given load increments, and in a summary of in-plane displacement, out-of-plane displacement, and vertical deflection data at different load stages (Table 2).
Table 2.
Load, displacement, and vertical deflection of the adobe walls at three load test stages: softening (S), peak load (P), and ultimate point (U).
3.1. Wall 1: Bricks with Straw and wb = 2.7%
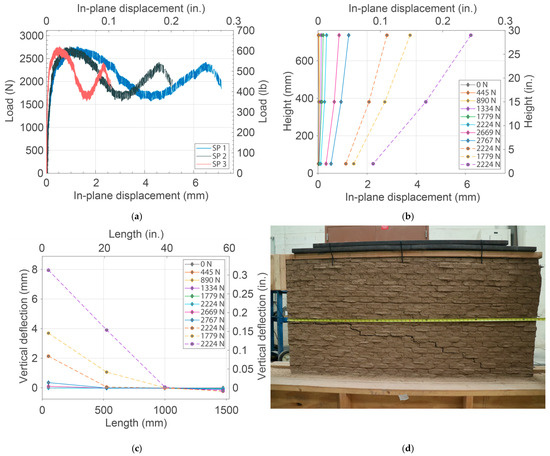
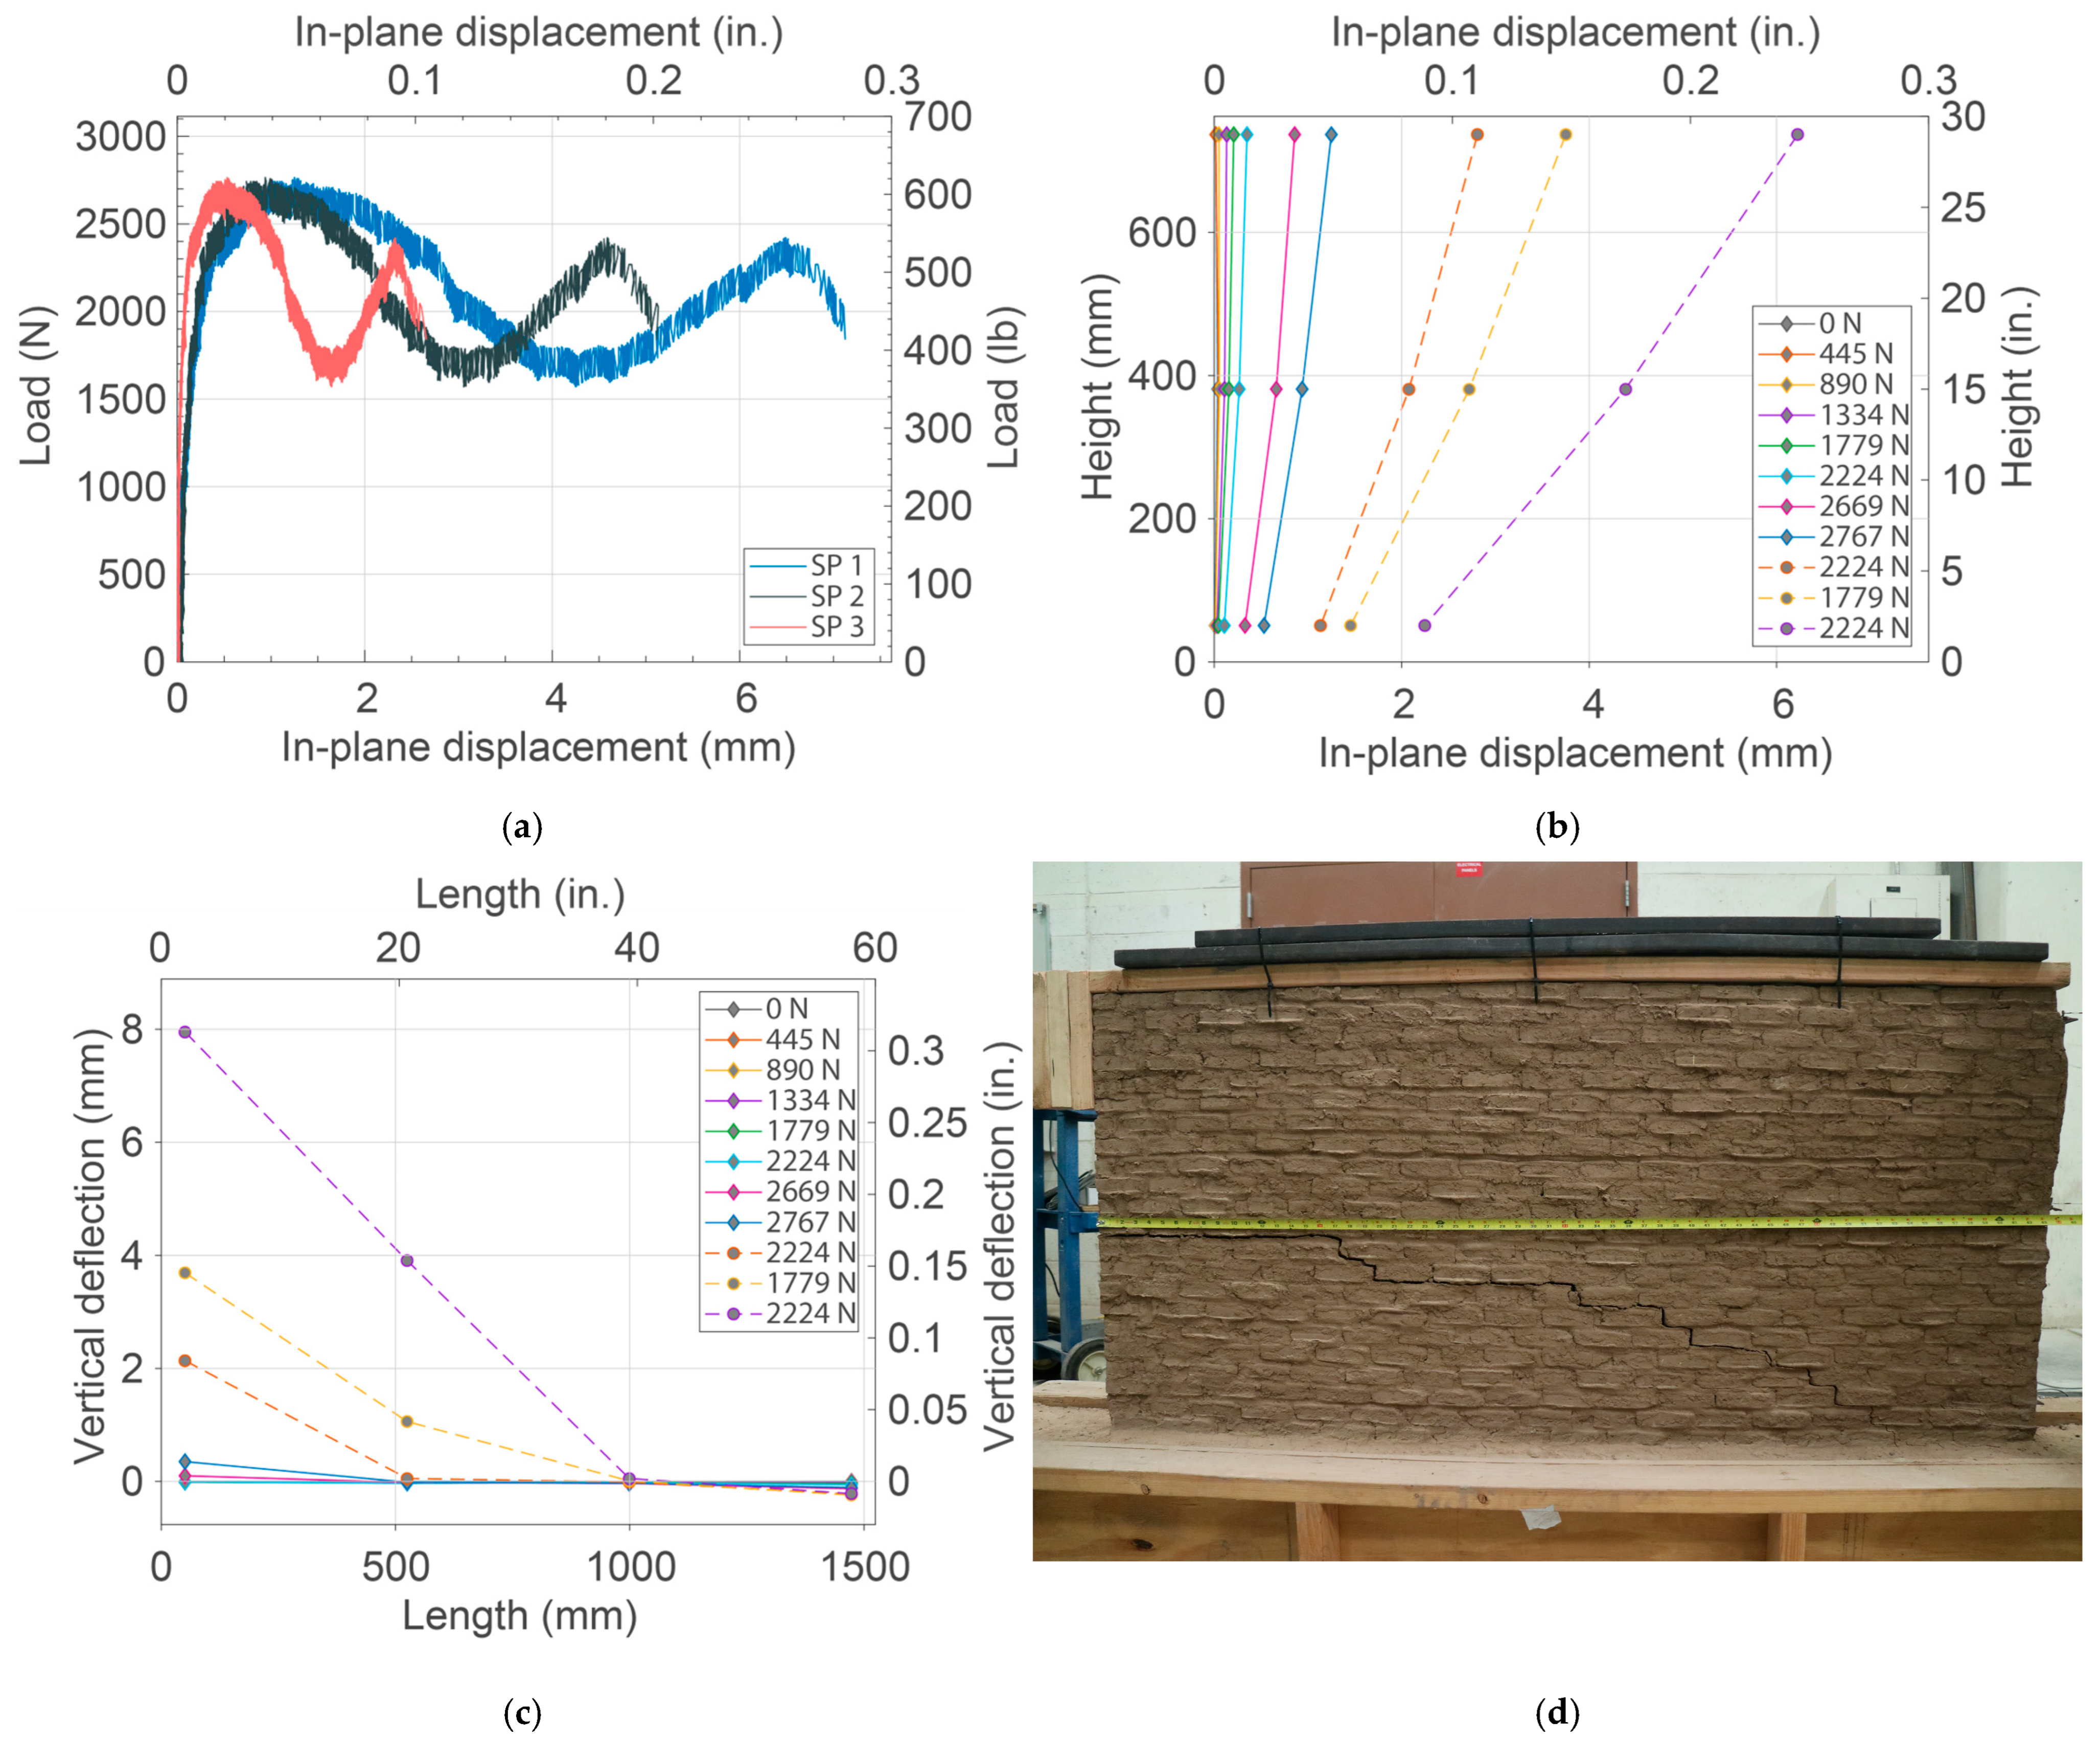
Wall 1 was constructed with adobe bricks containing straw and was load-tested with an average gravimetric water content at the bottom of the wall (wb) of 2.7% (air-dry). The results of the in-plane loading test on Wall 1 are shown in Figure 2. Wall 1 displayed rocking behavior prior to peak load. The in-plane stiffness of the wall was reduced when a crack formed between the first and second courses at 890 N (200 lb) and continued to propagate through the mortar joints to the footing. Wall 1 reached a peak load of 2767 N (622 lb), at which a second crack initiated at about mid-height on the south edge and propagated downward to the foundation near the north bottom corner (Figure 2d). The wall continued to have rocking behavior post-peak load as observed in the differences in in-plane displacement between the top (SP 1) and bottom (SP 3) of the wall before and after the peak load (Figure 2a,b). Vertical deflections show uplift at the south edge (LVDT 1), extending over 1143 mm (45 in.) towards the center of the wall, and compression at the north edge (LVDT 4), with a neutral axis compression depth of 381 mm (15 in.) from the north edge (Figure 2c). In Figure 2c and in similar graphs presented herein, zero length in the horizontal axis corresponds to the south edge. In Table 2, the out-of-plane data corresponds to westward tilt, with the north top corner (SP 4) displacing farther than the south top corner (SP 5). These observations confirm that Wall 1 failed by progressive rocking.
Figure 2.
Adobe Wall 1 (bricks with straw, wb = 2.7%): (a) load versus in-plane displacement, (b) in-plane displacement at three wall heights at different load increments, (c) vertical deflection along the wall length at different load increments, and (d) wall (east face) at the end of the load test.
3.2. Wall 2: Bricks with Sisal Fibers and wb = 2.6%
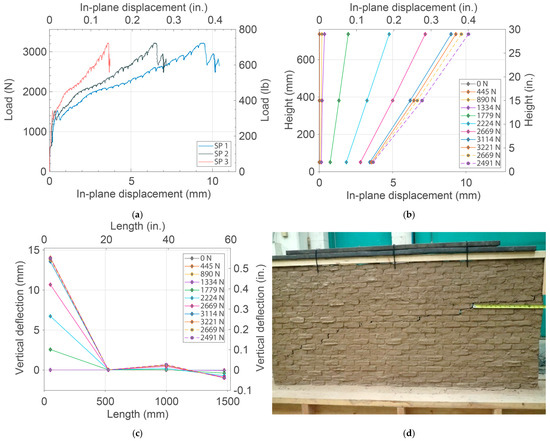
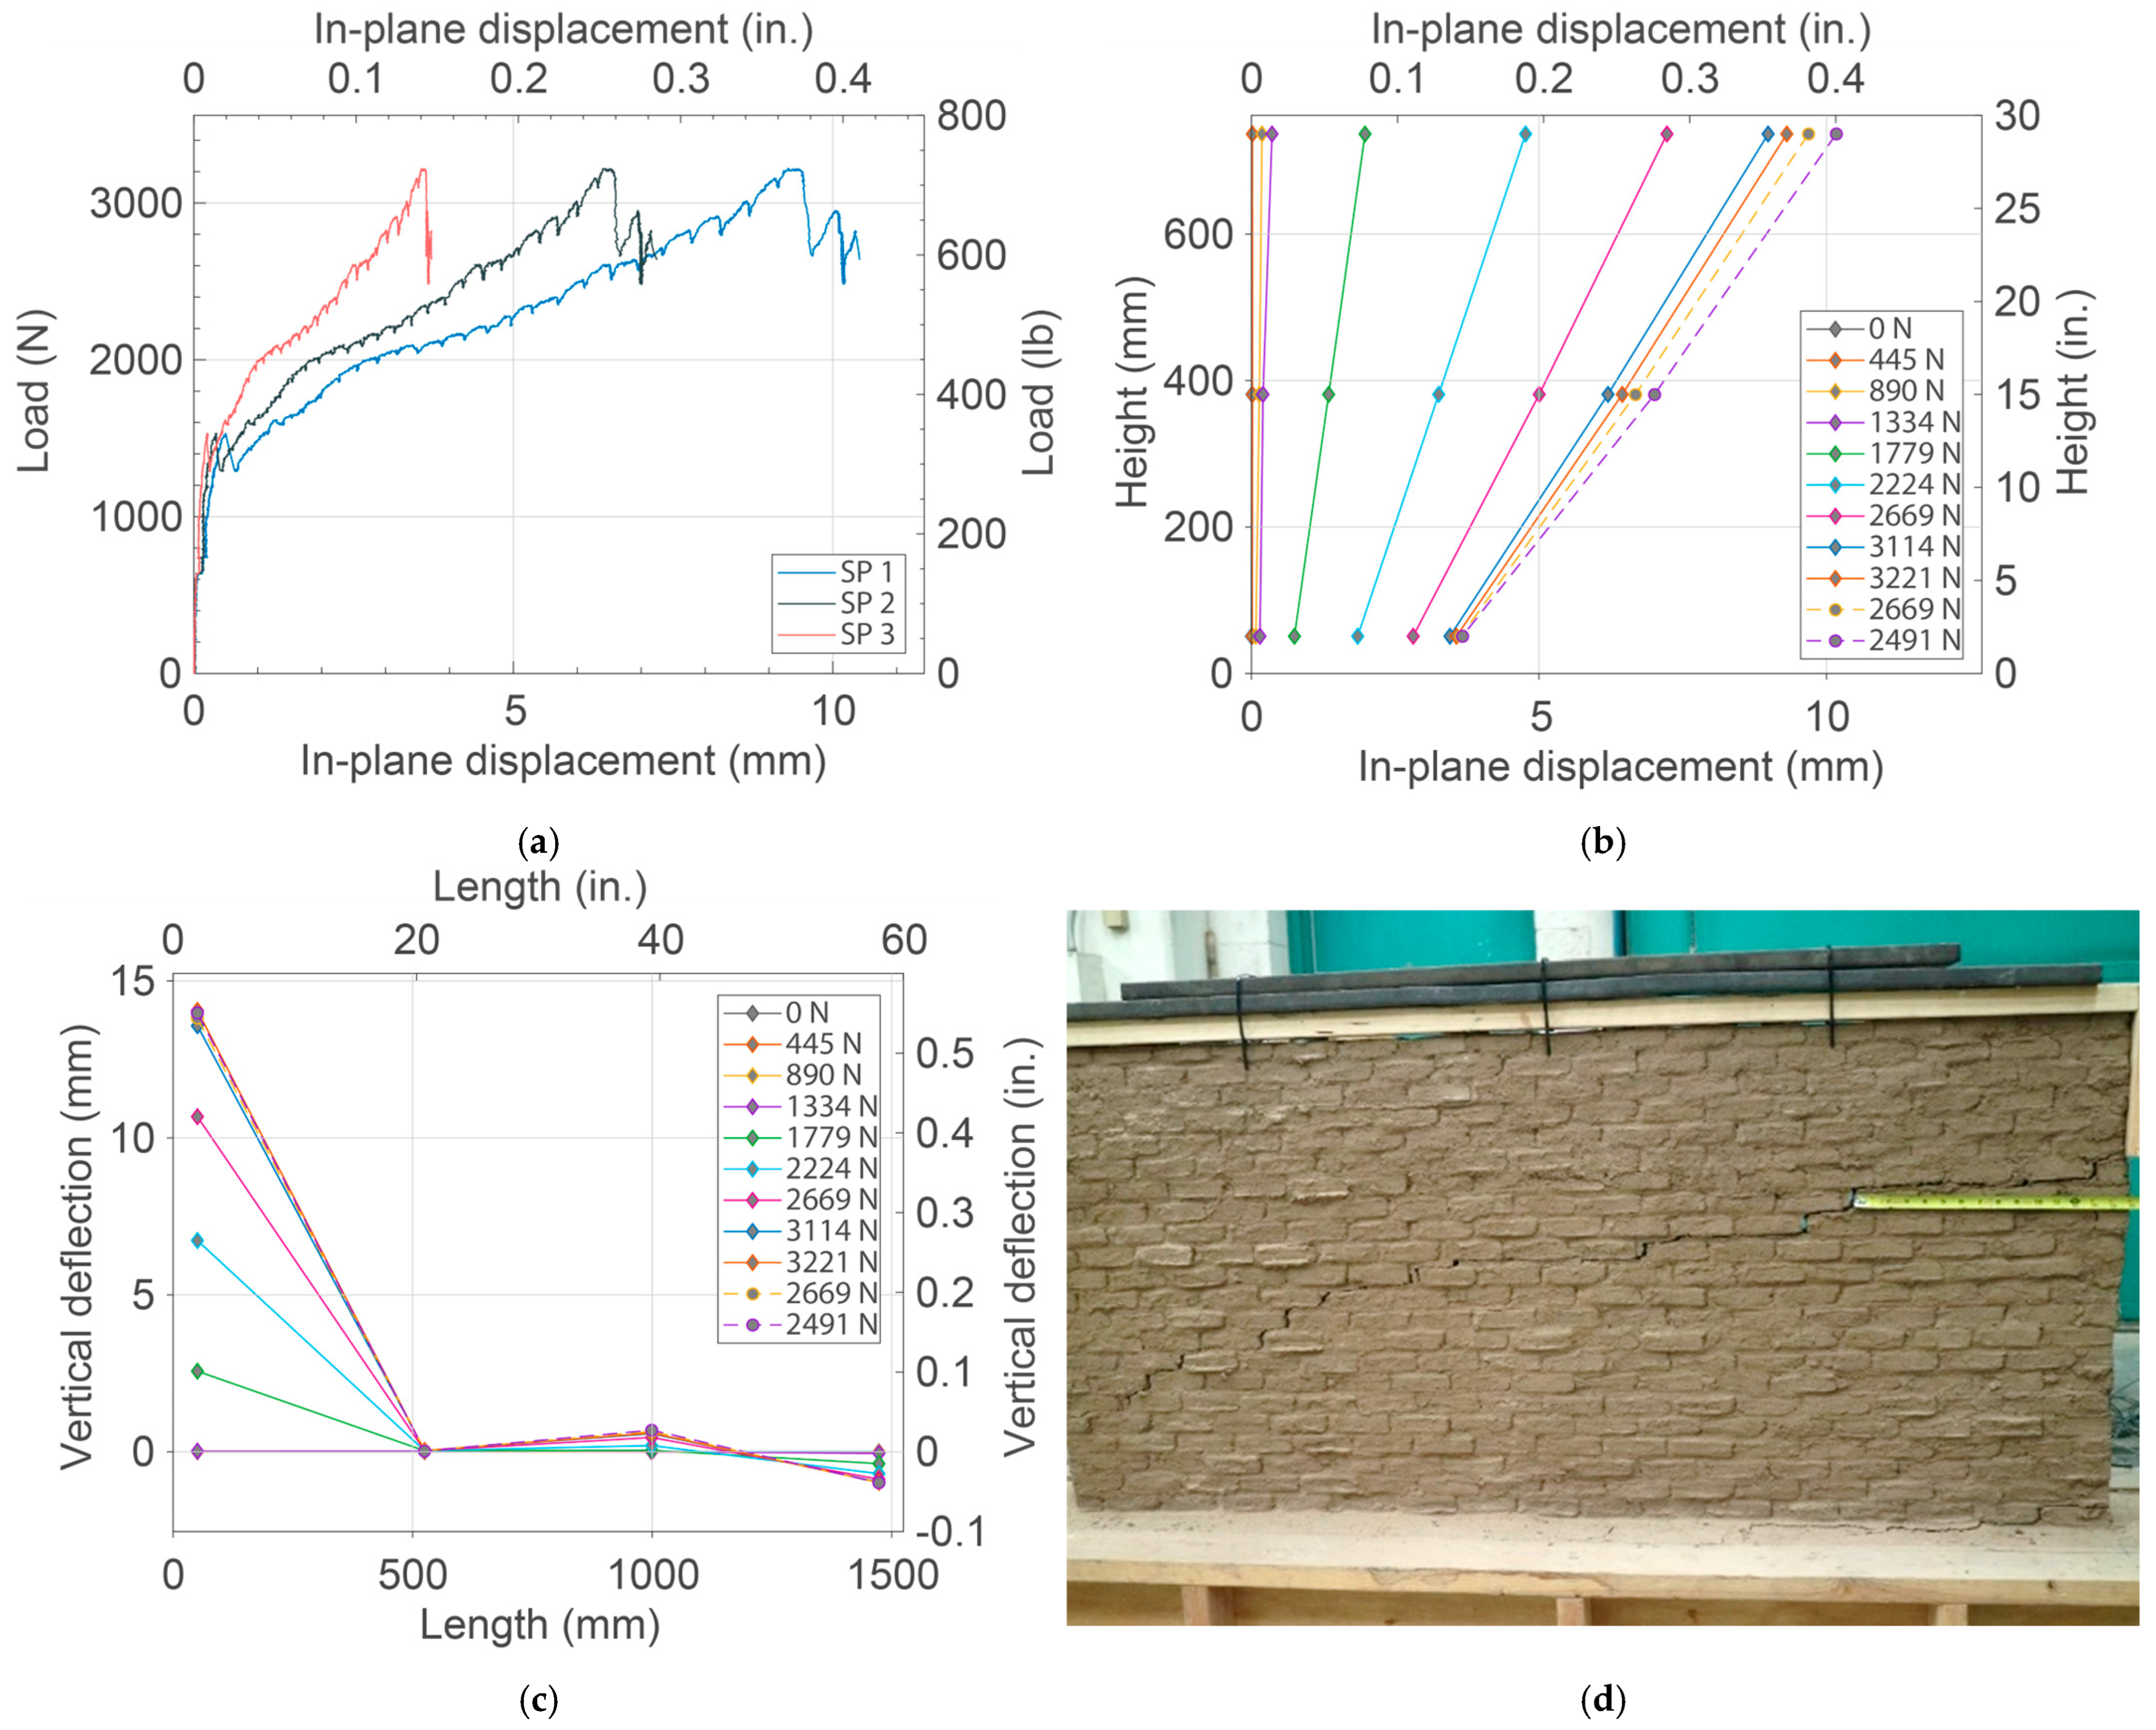
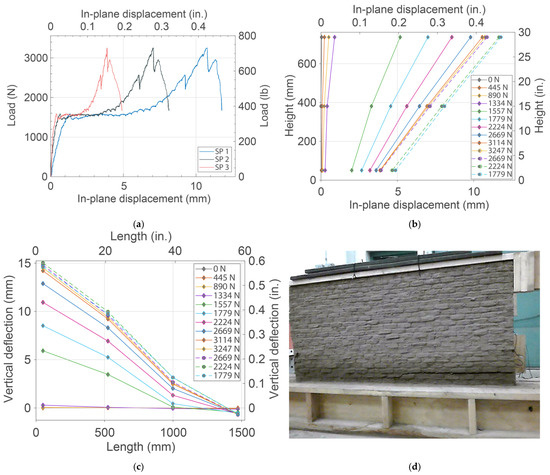
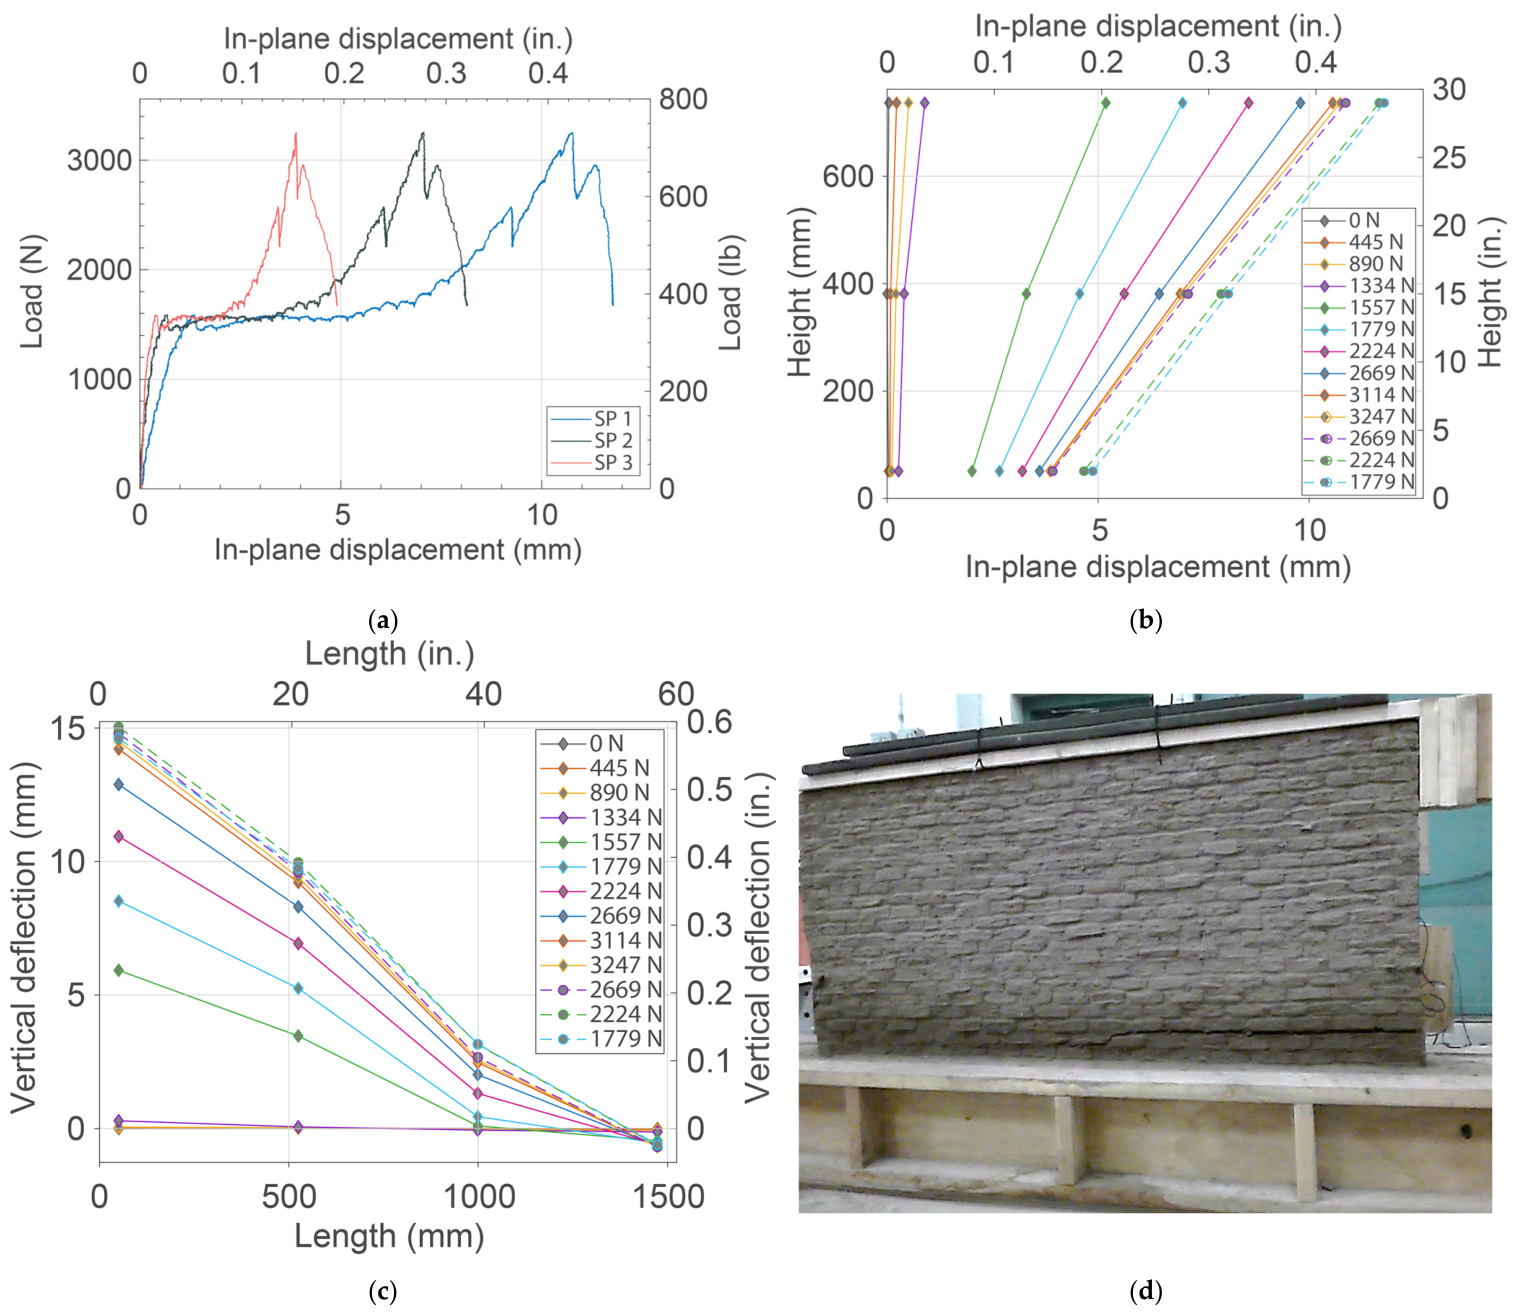
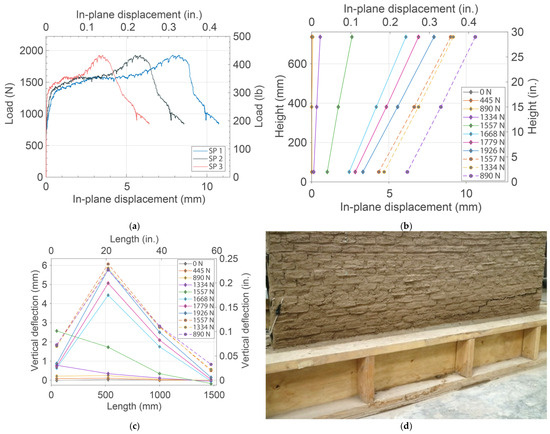
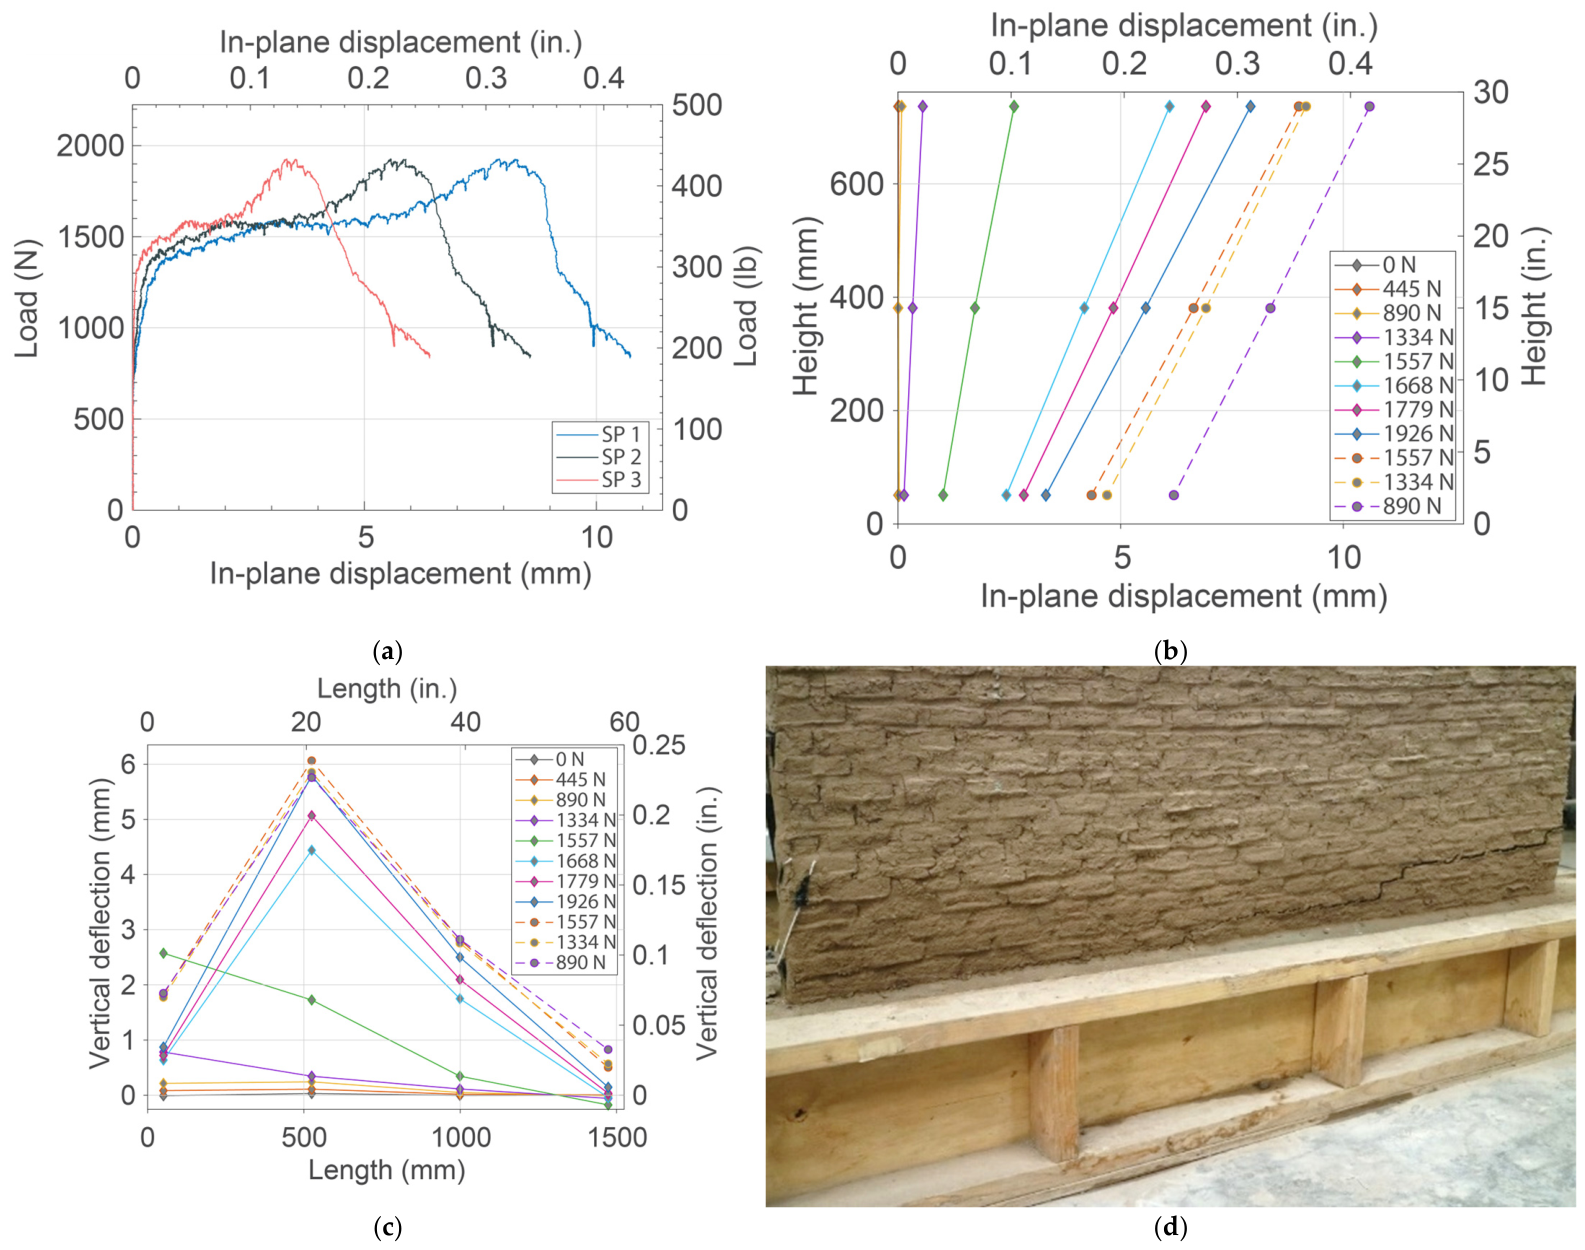
Wall 2 was constructed with adobe bricks containing sisal fibers and was load-tested with wb = 2.6% (air-dry). The results of the in-plane loading test on Wall 2 are shown in Figure 3. Initial cracking developed at 667 N (150 lb) in the first course from the bottom of the wall, propagated one brick length, and then extended to the foundation–wall interface (Figure 3d), reducing the in-plane stiffness of the wall. Shortly after the load reached 1557 N (350 lb), a drop of 222 N (50 lb) occurred due to the development of a second crack that formed near the tip of the shorter side of the bond beam (Figure 3d); the load continued to increase until reaching a peak load of 3221 N (724 lb) (Figure 3a).
Figure 3.
Adobe Wall 2 (bricks with sisal, wb = 2.6%): (a) load versus in-plane displacement, (b) in-plane displacement at three wall heights at different load increments, (c) vertical deflection along the wall length at different load increments, and (d) wall (west face) at the end of the load test.
Evidence of rocking included increasingly greater in-plane displacement of the top (SP 1) compared with the base (SP 3) of the wall (Figure 3a,b). Vertical deflections show uplift at the south edge (LVDT 1) and compression at the north edge (LVDT 4), with a neutral axis compressive depth of 381 mm (15 in.) from the north edge (Figure 3c). Wall 2 displayed slight eastward tilting, with the north top corner (SP 4) moving farther out of plane than the south top corner (SP 5). After the peak load, the capacity decreased quickly by 26% to 2450 N (550 lb) when the second crack that formed near the tip of the shorter side of the bond beam propagated through the mortar joints toward the north bottom corner over the length of the wall (Figure 3d). This crack initiated in-plane sliding along the bed joints. Post-peak in-plane displacement of 1.3 mm (0.05 in.) was measured at the top (SP 1) and mid-height (SP 2) of the wall, whereas the bottom sensor (SP 3), which was located below the sliding crack, did not show significant increase in displacement after the peak load (Figure 3b). These observations indicate a transition from rocking to friction-controlled sliding.
3.3. Wall 3: Bricks with Straw and wb = 4.8%
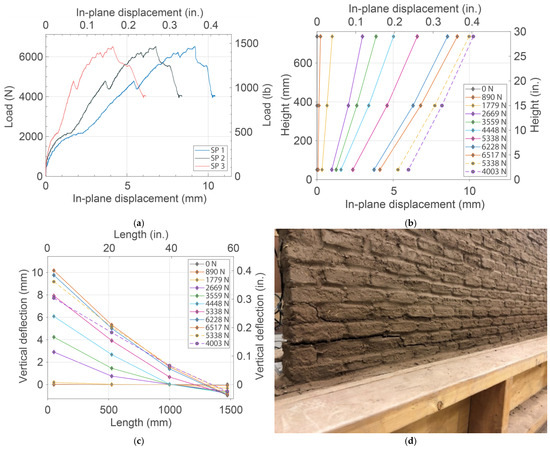
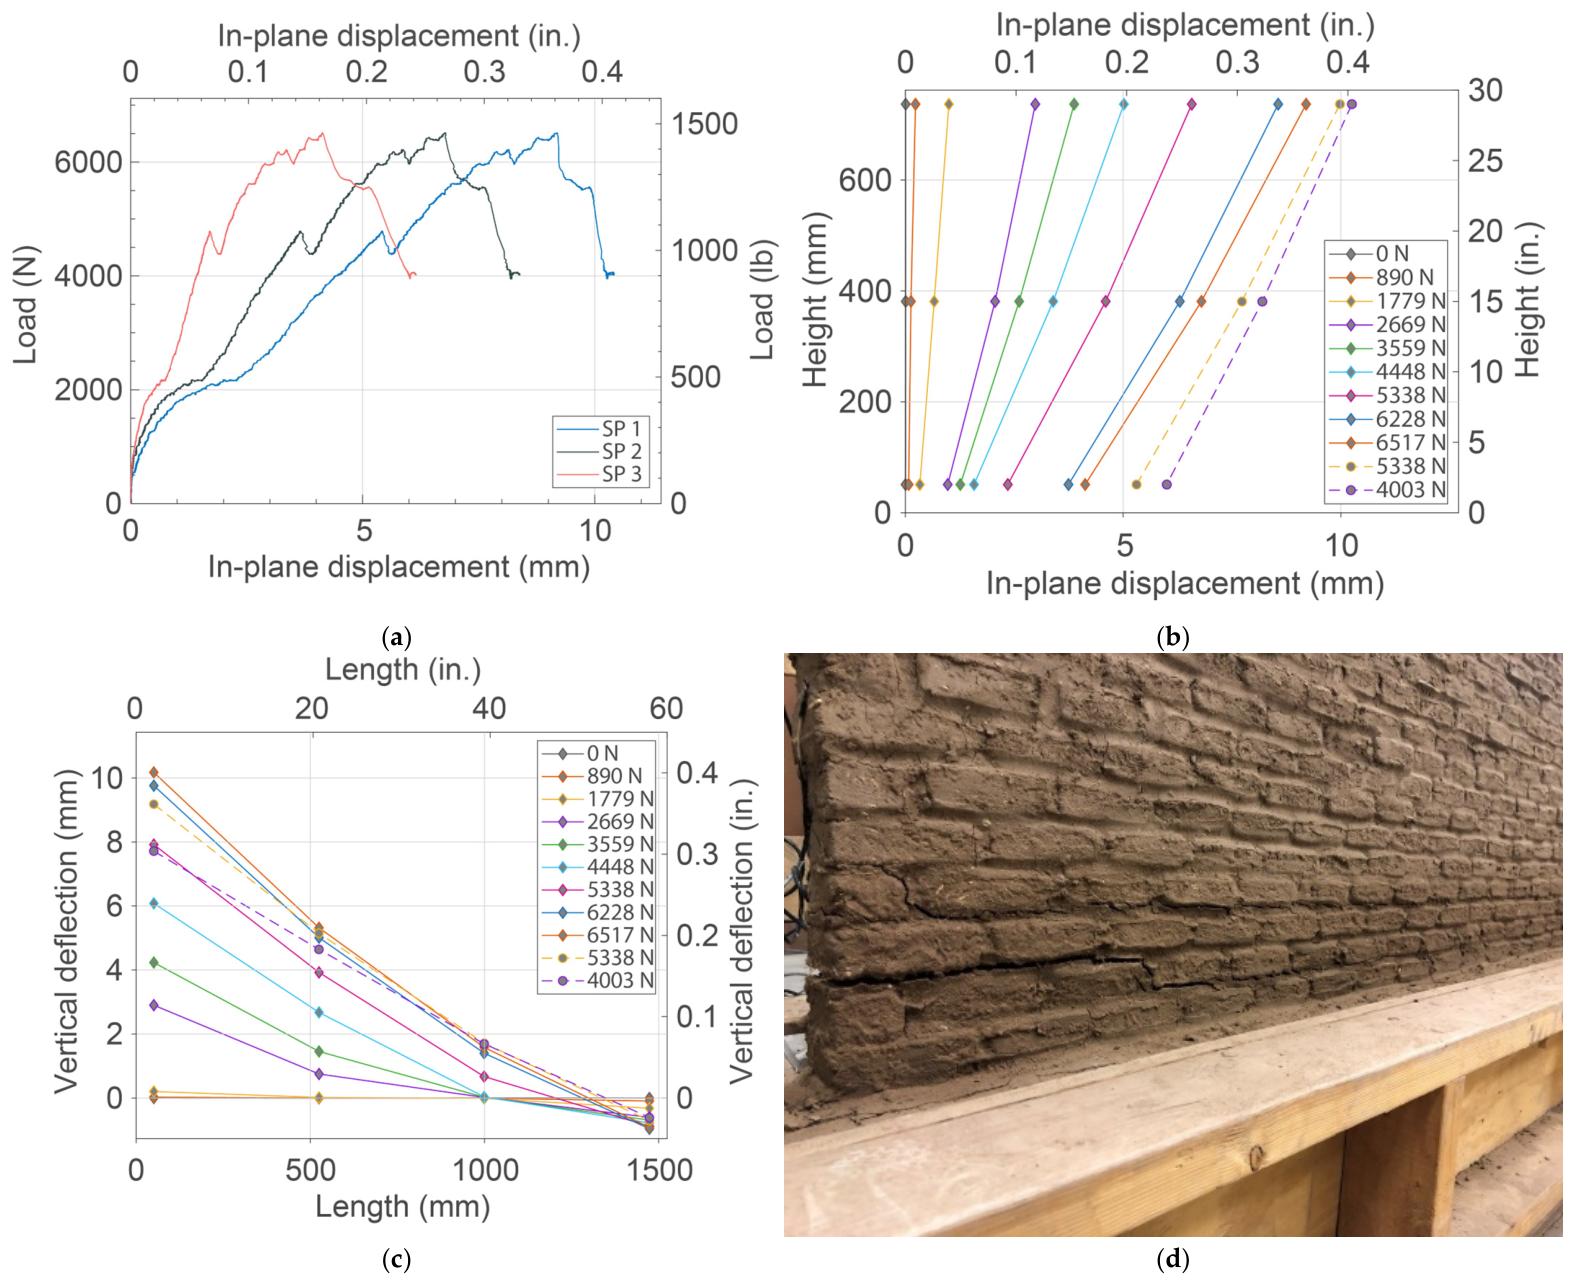
Wall 3 was constructed with adobe bricks containing straw and was load-tested with wb = 4.8% (moisture-conditioned). The results of the in-plane loading test on Wall 3 are shown in Figure 4. Wall 3 exhibited the largest peak load of all the walls tested. Cracking began at 667 N (150 lb) between the second and third courses from the bottom at the south edge and propagated along the mortar joint for about 254 mm (10 in.) before shifting downward to the lower joints (see Figure 4d).
Figure 4.
Adobe Wall 3 (bricks with straw, wb = 4.8%): (a) load versus in-plane displacement, (b) in-plane displacement at three heights at different load increments, (c) vertical deflection along the wall length at different load increments, and (d) wall (east face) at the end of the load test.
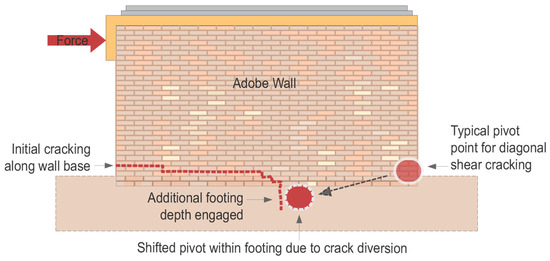
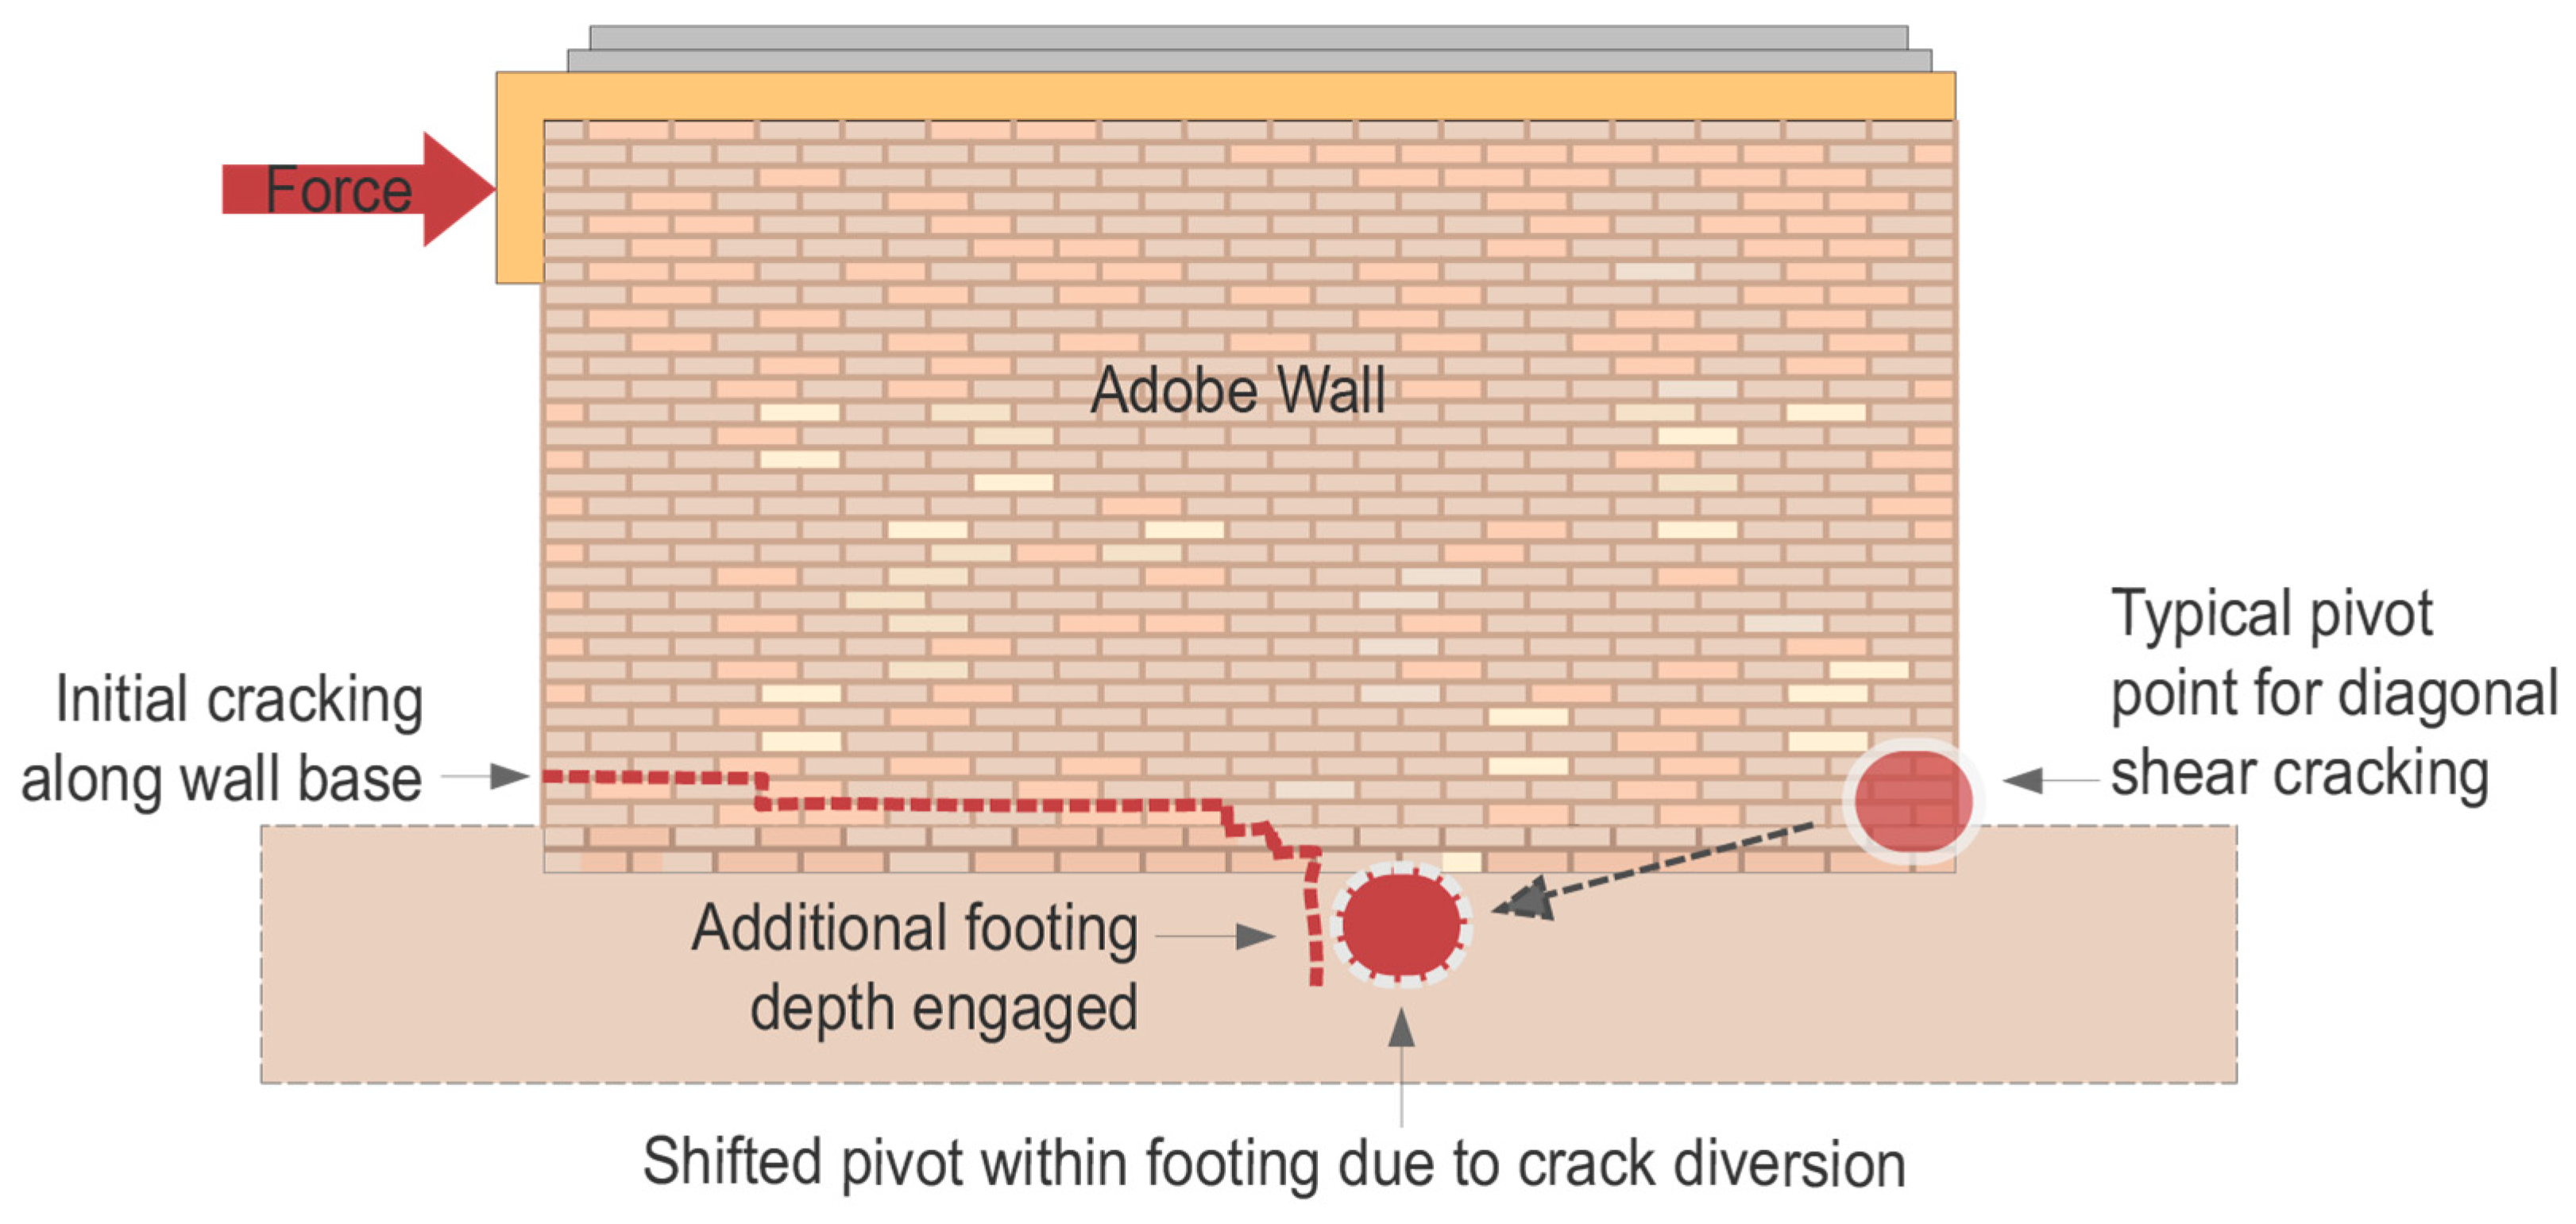
As the crack widened, the loading rate progressively decreased to approximately 2224 N (500 lb) (Figure 4a). The crack advanced gradually and eventually reached the footing. The crack then propagated into the footing, interrupting the otherwise continuous foundation–wall interface cracking path and creating a temporary mechanical interlock (shear-key-type engagement). This diversion of the crack into the footing shifted the rocking pivot and associated compression toe inward and downward from the wall toe into the engaged footing region, thereby engaging part of footing in resisting the applied load. At this stage, the wall regained stiffness and continued resisting additional load. As a result, Wall 3 reached a peak load of 6517 N (1465 lb). The duration of this mechanical interlock appeared specimen-specific, likely influenced by local heterogeneity and interface variability. Ultimately, failure was governed by the development of a secondary crack in the fourth course from the bottom of the wall at the south edge, which propagated predominantly horizontally along the third course from the bottom and then turned downward at approximately 3.5 brick lengths from the north edge, extending to the north bottom edge of the wall (Figure 4d). This behavior is illustrated schematically in Figure 5, which shows the diversion of the base crack into the footing, the additional footing depth engaged in compression, and the shift in the rocking pivot from the typical toe location to a new point within the footing.
Figure 5.
Crack diversion into footing and shifted rocking pivot.
Prior to the peak load, rocking dominated, indicated by increasingly greater in-plane displacement of the top (SP 1) compared with the bottom (SP 3) of the wall as the load test progressed (Figure 4a,b), uplift at the south edge (LVDT 1), and compression at the north edge (LVDT 4) (Figure 4c). In Figure 4c, the distribution of uplift and compression shows that the neutral axis was initially at 508 mm (20 in.) from the north edge and progressively moved to 127 mm (5 in.) from the north edge as the load increased. After the peak load, in-plane displacement of approximately 1.3 mm (0.05 in.) across SP 1, SP 2, and SP 3 indicated sliding of the wall along the failure crack (Figure 4a,b). Out-of-plane displacements were minimal compared with the other walls tested. Wall 3 experienced the smallest out-of-plane displacements at peak load from the solid walls (i.e., walls without openings) and had only minor differences between displacement of the top north and south corners. Vertical deflections showed compression at the north edge, initiating approximately at 334 N (75 lb), and uplift at the south edge starting later at approximately 890 N (200 lb) (Figure 4c). The greater strength of Wall 3 was likely the result of a more favorable crack trajectory. The primary crack did not extend entirely through the foundation–wall interface; at about mid-length, it extended into the footing region. This change in crack trajectory temporarily prevented crack propagation from continuing along the foundation–wall interface toward the north edge, shifted the rocking point from the original compression toe to the engaged footing region, and produced a mechanical interlock that enabled Wall 3 to sustain the greatest peak load among all walls tested.
3.4. Wall 4: Bricks with Sisal Fibers and wb = 4.9%
Wall 4 was constructed with adobe bricks containing sisal fibers and was load-tested with wb = 4.9% (moisture-conditioned). The results of the in-plane loading test on Wall 4 are shown in Figure 6. Wall 4 showed rocking behavior prior to the peak load. Cracking started at the second course near the south bottom corner at 222 N (50 lb) and continued propagating through the second course. At a load of 1061 N (360 lb), the second-course crack extended into the footing at about mid-length of the wall, which also created a mechanical interlock that enabled additional resistance as the wall reached a peak strength of 3257 N (732 lb) (Figure 6a). The peak load of Wall 4 was approximately half of the peak load of Wall 3. Wall 4 began to lose capacity when the crack propagated through the foundation–wall interface starting near the center of the wall to the north edge. This happened faster and at a lower load resistance than the similar behavior observed in Wall 3, attributed to least favorable crack trajectory. Evidence of rocking before the peak load included increasingly greater in-plane displacement of the top (SP 1) compared with the bottom (SP 3) of the wall (Figure 6a,b), uplift at the south edge (LVDT 1), and compression at the north edge (LVDT 4) (Figure 6c). The distribution of uplift and compression shows that the neutral axis was initially at 254 mm (10 in.) from the north edge and moved to 127 mm (5 in.) from the north edge as the applied load increased (Figure 6c).
Figure 6.
Adobe Wall 4 (bricks with sisal, wb = 4.9%): (a) load versus in-plane displacement, (b) in-plane displacement at three wall heights at different load increments, (c) vertical deflection along the wall length at different load increments, and (d) wall (west face) at end of the load test.
After the peak load, in-plane displacement of approximately 1.0 mm (0.04 in.) across SP 1, SP 2, and SP 3 indicated a transition to sliding along the crack (Figure 6a,b). Out-of-plane displacements indicated that the north top corner (SP 4) moved toward the west side and the south top corner (SP 5) moved toward the east side, with larger movement at the north top corner. The vertical deflection of Wall 4 at peak load was 14.5 mm (0.57 in.), which was the greatest vertical deflection recorded among all the walls tested and was attributed to a temporary mechanical interlock developing as cracking diverted into the footing, changing the point about which rocking was occurring.
3.5. Wall 5: Bricks with Sisal Fibers and wb = 4.6%
Wall 5 was constructed with adobe bricks containing sisal fibers and was load-tested with wb = 4.6% (moisture-conditioned). The results of the in-plane load test on Wall 5 are shown in Figure 7. Wall 5 reached the lowest peak load of all walls tested. Cracking began at 756 N (170 lb) in the fourth course and propagated downward and horizontally through the lower courses until reaching the footing (Figure 7d). During crack propagation, in-plane displacement occurred while the load increased at a small or negligible rate (i.e., plateau in the load versus in-plane displacement curves in Figure 7a), which was similar to the load curves of Wall 4 but at a lower capacity because the crack widening limited the resistance of Wall 5. The peak load was reached at 1928 N (433 lb), after which rapid crack propagation through the foundation–wall interface prevented the development of a mechanical interlock. Unlike Walls 3 and 4, which benefitted from mechanical interlock resistance, major cracks that developed in Wall 5 propagated quickly, facilitating failure.
Figure 7.
Adobe Wall 5 (bricks with sisal, wb = 4.6%): (a) load versus in-plane displacement, (b) in-plane displacement at three wall heights at different load increments, (c) vertical deflection along the wall length at different load increments, and (d) wall (west face) at the end of the load test.
The behavior of Wall 5 prior to the peak load was dominated by rocking as shown by greater in-plane displacements at the top (SP 1) compared with the bottom (SP 3) of the wall (Figure 7b), uplift at the south edge (LVDT 1) and at 525 mm (20.7 in.) from the south edge (LVDT 2), and compression at the north edge (LVDT 4) (Figure 7c). The neutral axis was initially at 254 mm (10 in.) from the north edge. As the load increased, the neutral axis moved progressively toward the north edge, eventually reaching it (Figure 7c). Because sliding along the governing crack caused small relative movements between the wall surface and the LVDT mounting pads, all vertical deflection readings were affected to some extent, particularly at LVDT 4, so the apparent migration of the neutral axis to the wall edge reflects a relative movement of the LVDTs rather than a shift in the compression region outside of the wall. After the peak load and until the end of the load test, in-plane displacements at the top, middle, and bottom of Wall 5 were approximately the same (shown by nearly parallel lines in Figure 7b from the peak load), and the capacity of the wall progressively decreased (Figure 7a), which indicated sliding along the ultimate crack. The out-of-plane displacements were the greatest among all the walls tested, 6.73 mm (0.26 in.) at peak load, with a gradual eastward tilt and comparable out-of-plane displacements at the north and south top corners. Vertical deflections showed continued uplift at the south edge and at 1050 mm (41.3 in.) from the south edge (LVDT 3) (Figure 7c). The relatively low strength and large out-of-plane deformations of Wall 5 were caused by the rapid crack propagation and the absence of an effective (sustained) mechanical interlock.
3.6. Wall 6: Bricks with Straw, wb = 2.8%, and Window
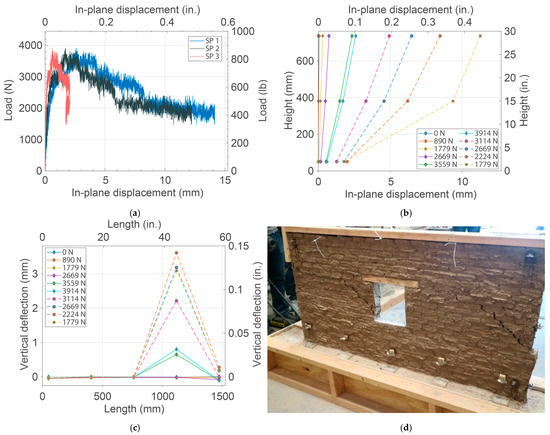
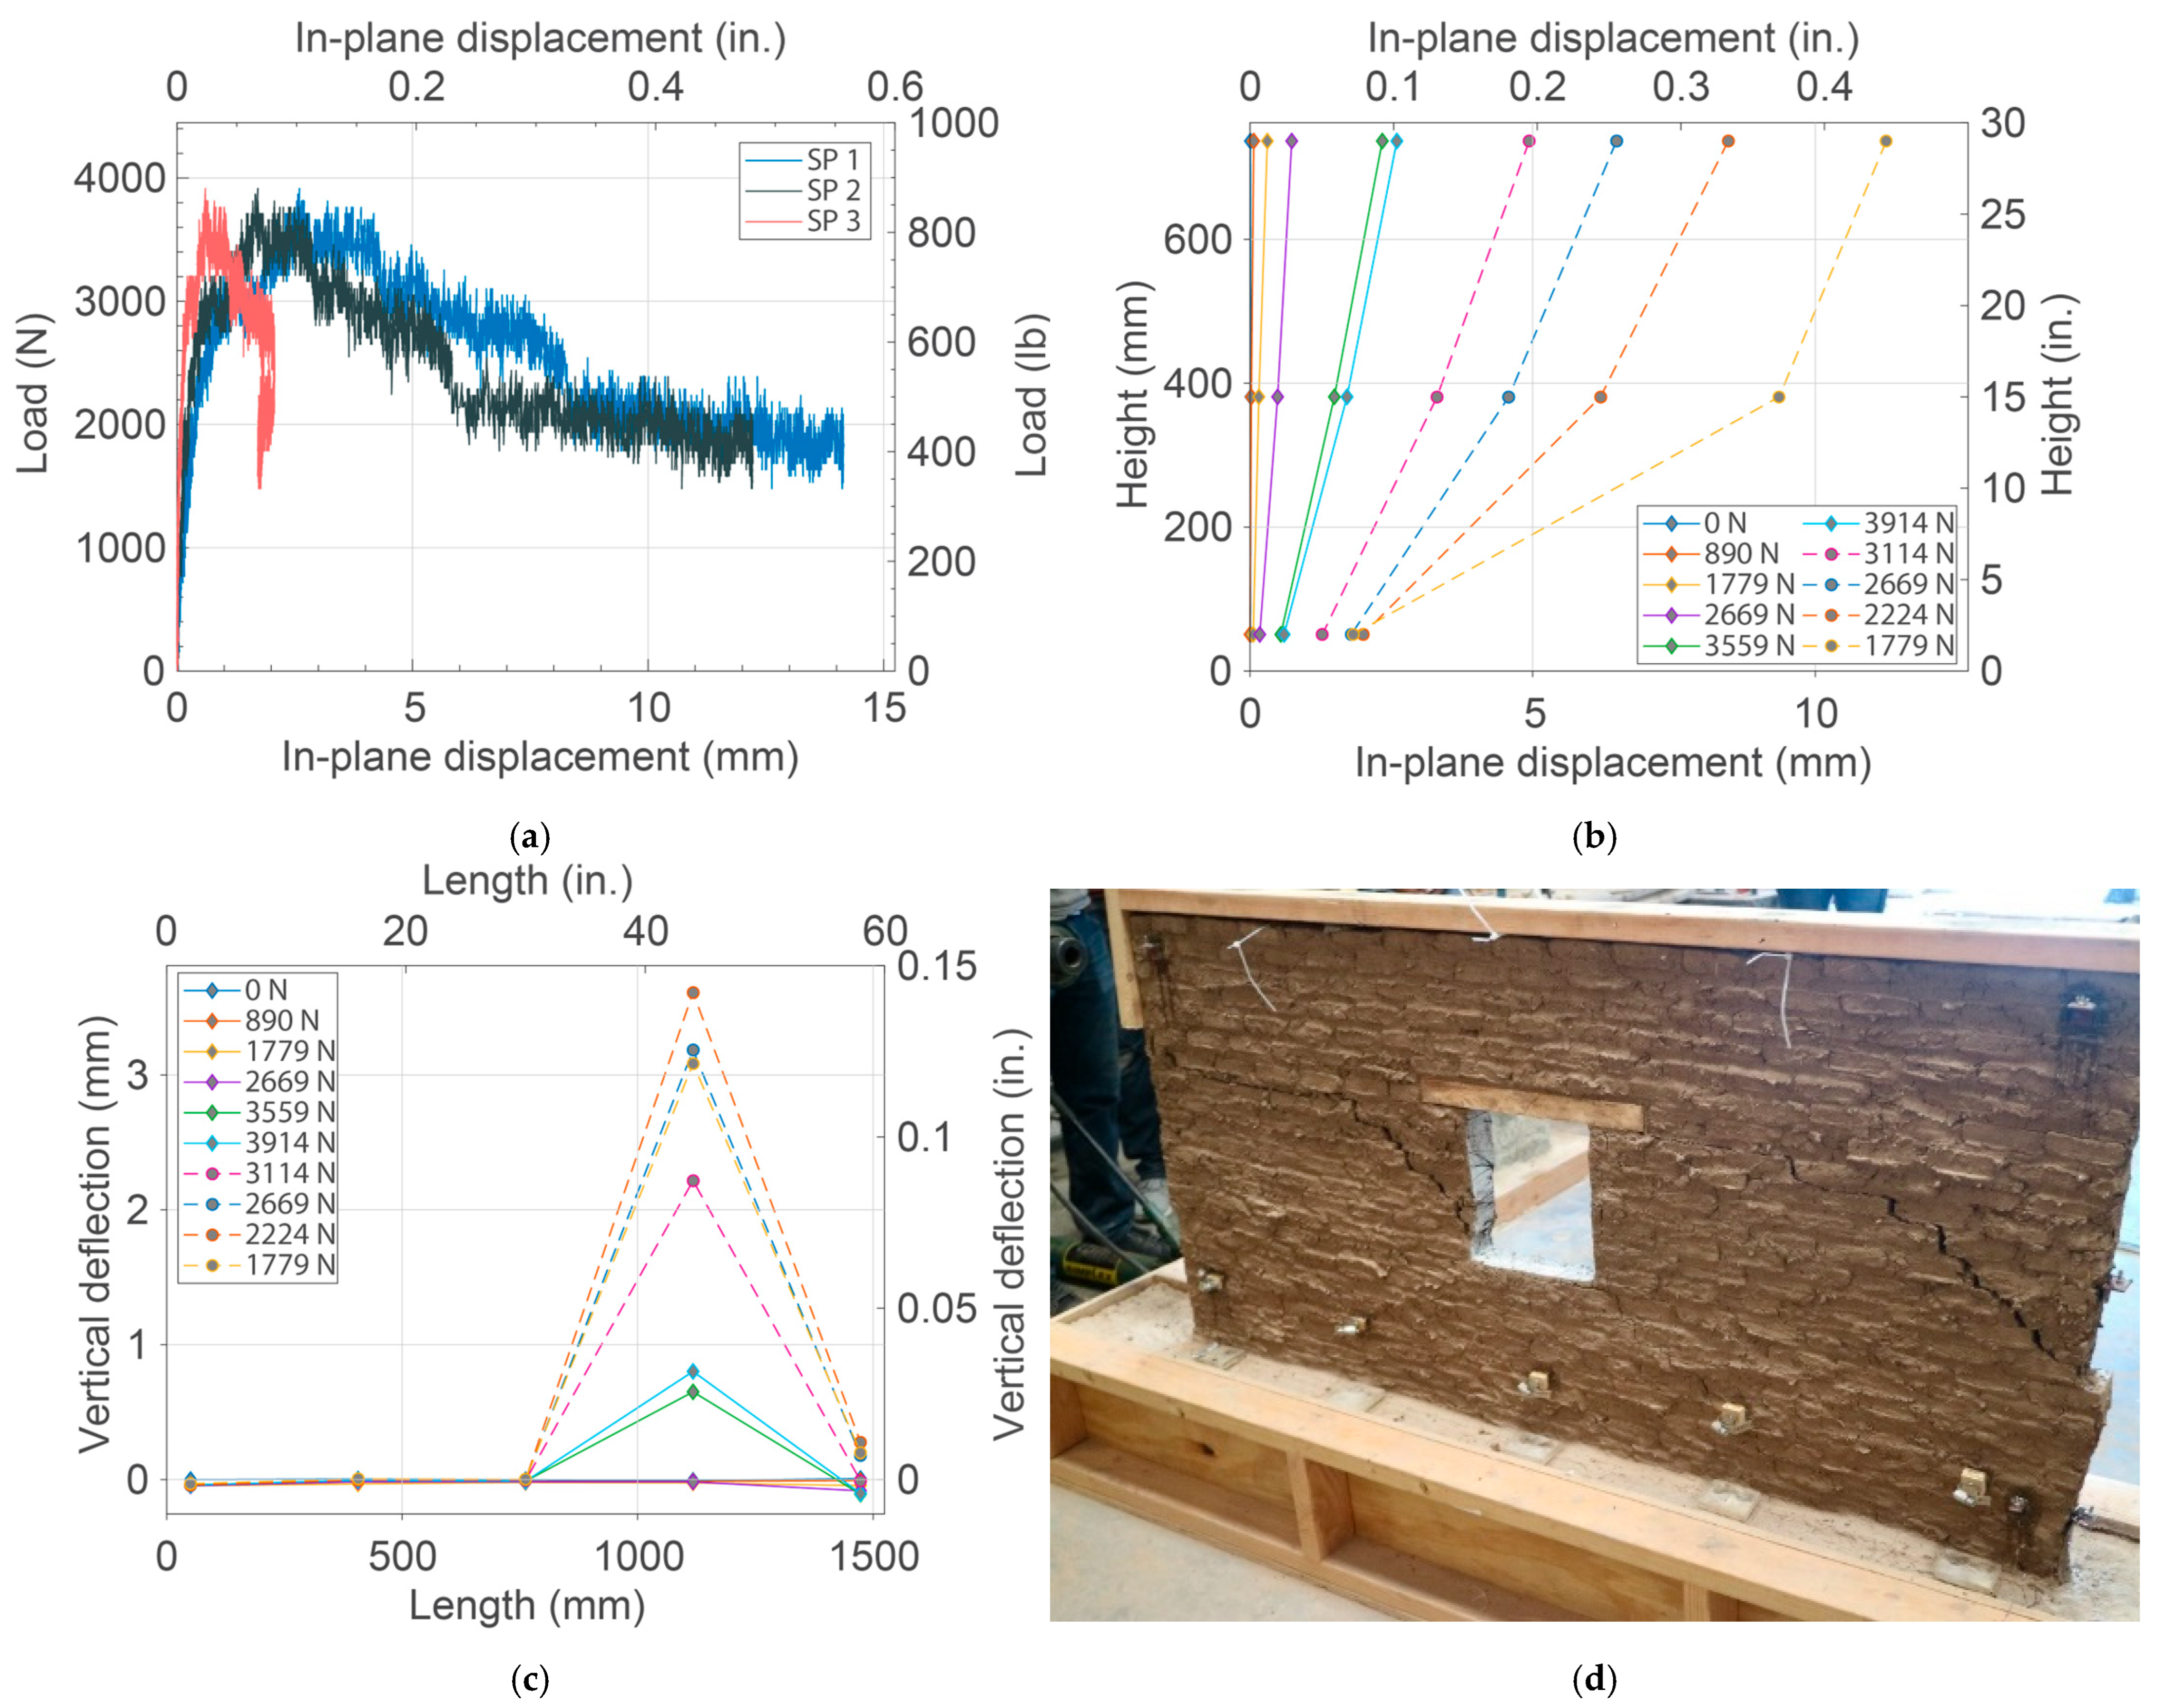
Wall 6 was constructed with adobe bricks containing straw and was load-tested with wb = 2.8% (air-dry). Wall 6 included a central window opening that strongly influenced its behavior. Cracking began at 801 N (180 lb) near the tip of the L-shape bond beam (south edge) and propagated downward to the south bottom corner of the window (Figure 8d).
Figure 8.
Adobe Wall 6 (bricks with straw, wb = 2.8%, and window): (a) load versus in-plane displacement, (b) in-plane displacement at three wall heights at different load increments, (c) vertical deflection along the wall length at different load increments, and (d) wall (east face) at the end of the load test.
A second crack initiated at the north bottom corner of the window and extended toward the north bottom corner of the wall, ending at approximately 127 mm (5 in.) from the north edge. These cracks engaged the opening and did not span the full wall length. At the peak load of 3919 N (881 lb), a final crack developed at the north top corner of the window and propagated downward to the eighth course at the north edge, defining the failure mechanism together with the initial crack extending from the wooden bond beam to the south bottom corner of the window (Figure 8d). Evidence of rocking behavior before the peak load included larger in-plane displacements at the top of the wall (SP 1) than at the bottom (SP 3) (Figure 8a,b), uplift at 406 mm (16 in.) from the north edge (LVDT 4), and compression at the north edge (LVDT 5) (Figure 8c). Because of the window opening, Wall 6 separated into two parts (north and south) due to crack propagation, and only the north portion had significant vertical deflection. The neutral axis was initially at 76 mm (3 in.) from the north edge. As the load increased, the neutral axis shifted gradually until reaching the north edge (Figure 8c). After the peak load, sliding dominated along the cracks formed from the wooden bond beam to the south bottom corner of the window and from the north top corner of the window down to the eighth course at the north edge, as reflected by relatively uniform in-plane displacement trends along the height in the upper sensors (SP 1 and SP 2) and comparable incremental displacement changes at these locations, with the bottom sensor response (SP3) being less representative due to the crack terminating above the bottom instrumentation. (Figure 8d).
Out-of-plane displacements indicated a gradual westward tilt of Wall 6; SP 4 at the north top corner moved farther than SP 5 at the south top corner. Vertical deflections showed a distinct behavior near the window opening, i.e., continuous uplift at the three-quarters point (LVDT 4) and eventually uplift at the north edge (LVDT 5), which initially was in compression, then uplifted after the peak load as the final crack formed (Figure 8c). Overall, the main cracks of Wall 6 started or ended at the window corners rather than extending through the full length of the wall, creating a failure mode related to the opening. Having a low wb, the wall showed a brittle behavior. The peak strength of Wall 6 was slightly larger than other walls without openings (Wall 1, Wall 2, Wall 4, and Wall 5) but was not the largest one.
3.7. Wall 7: Bricks with Straw, wb = 2.4%, and Door
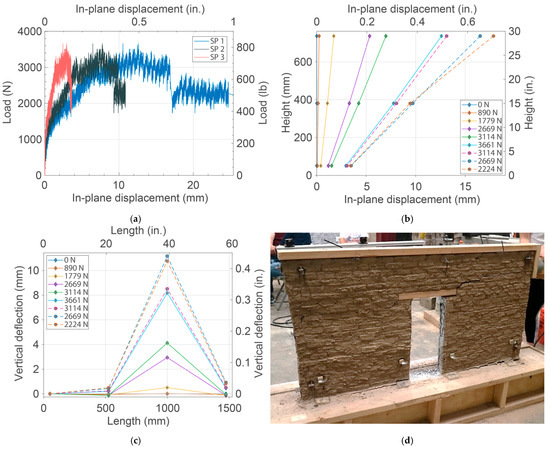
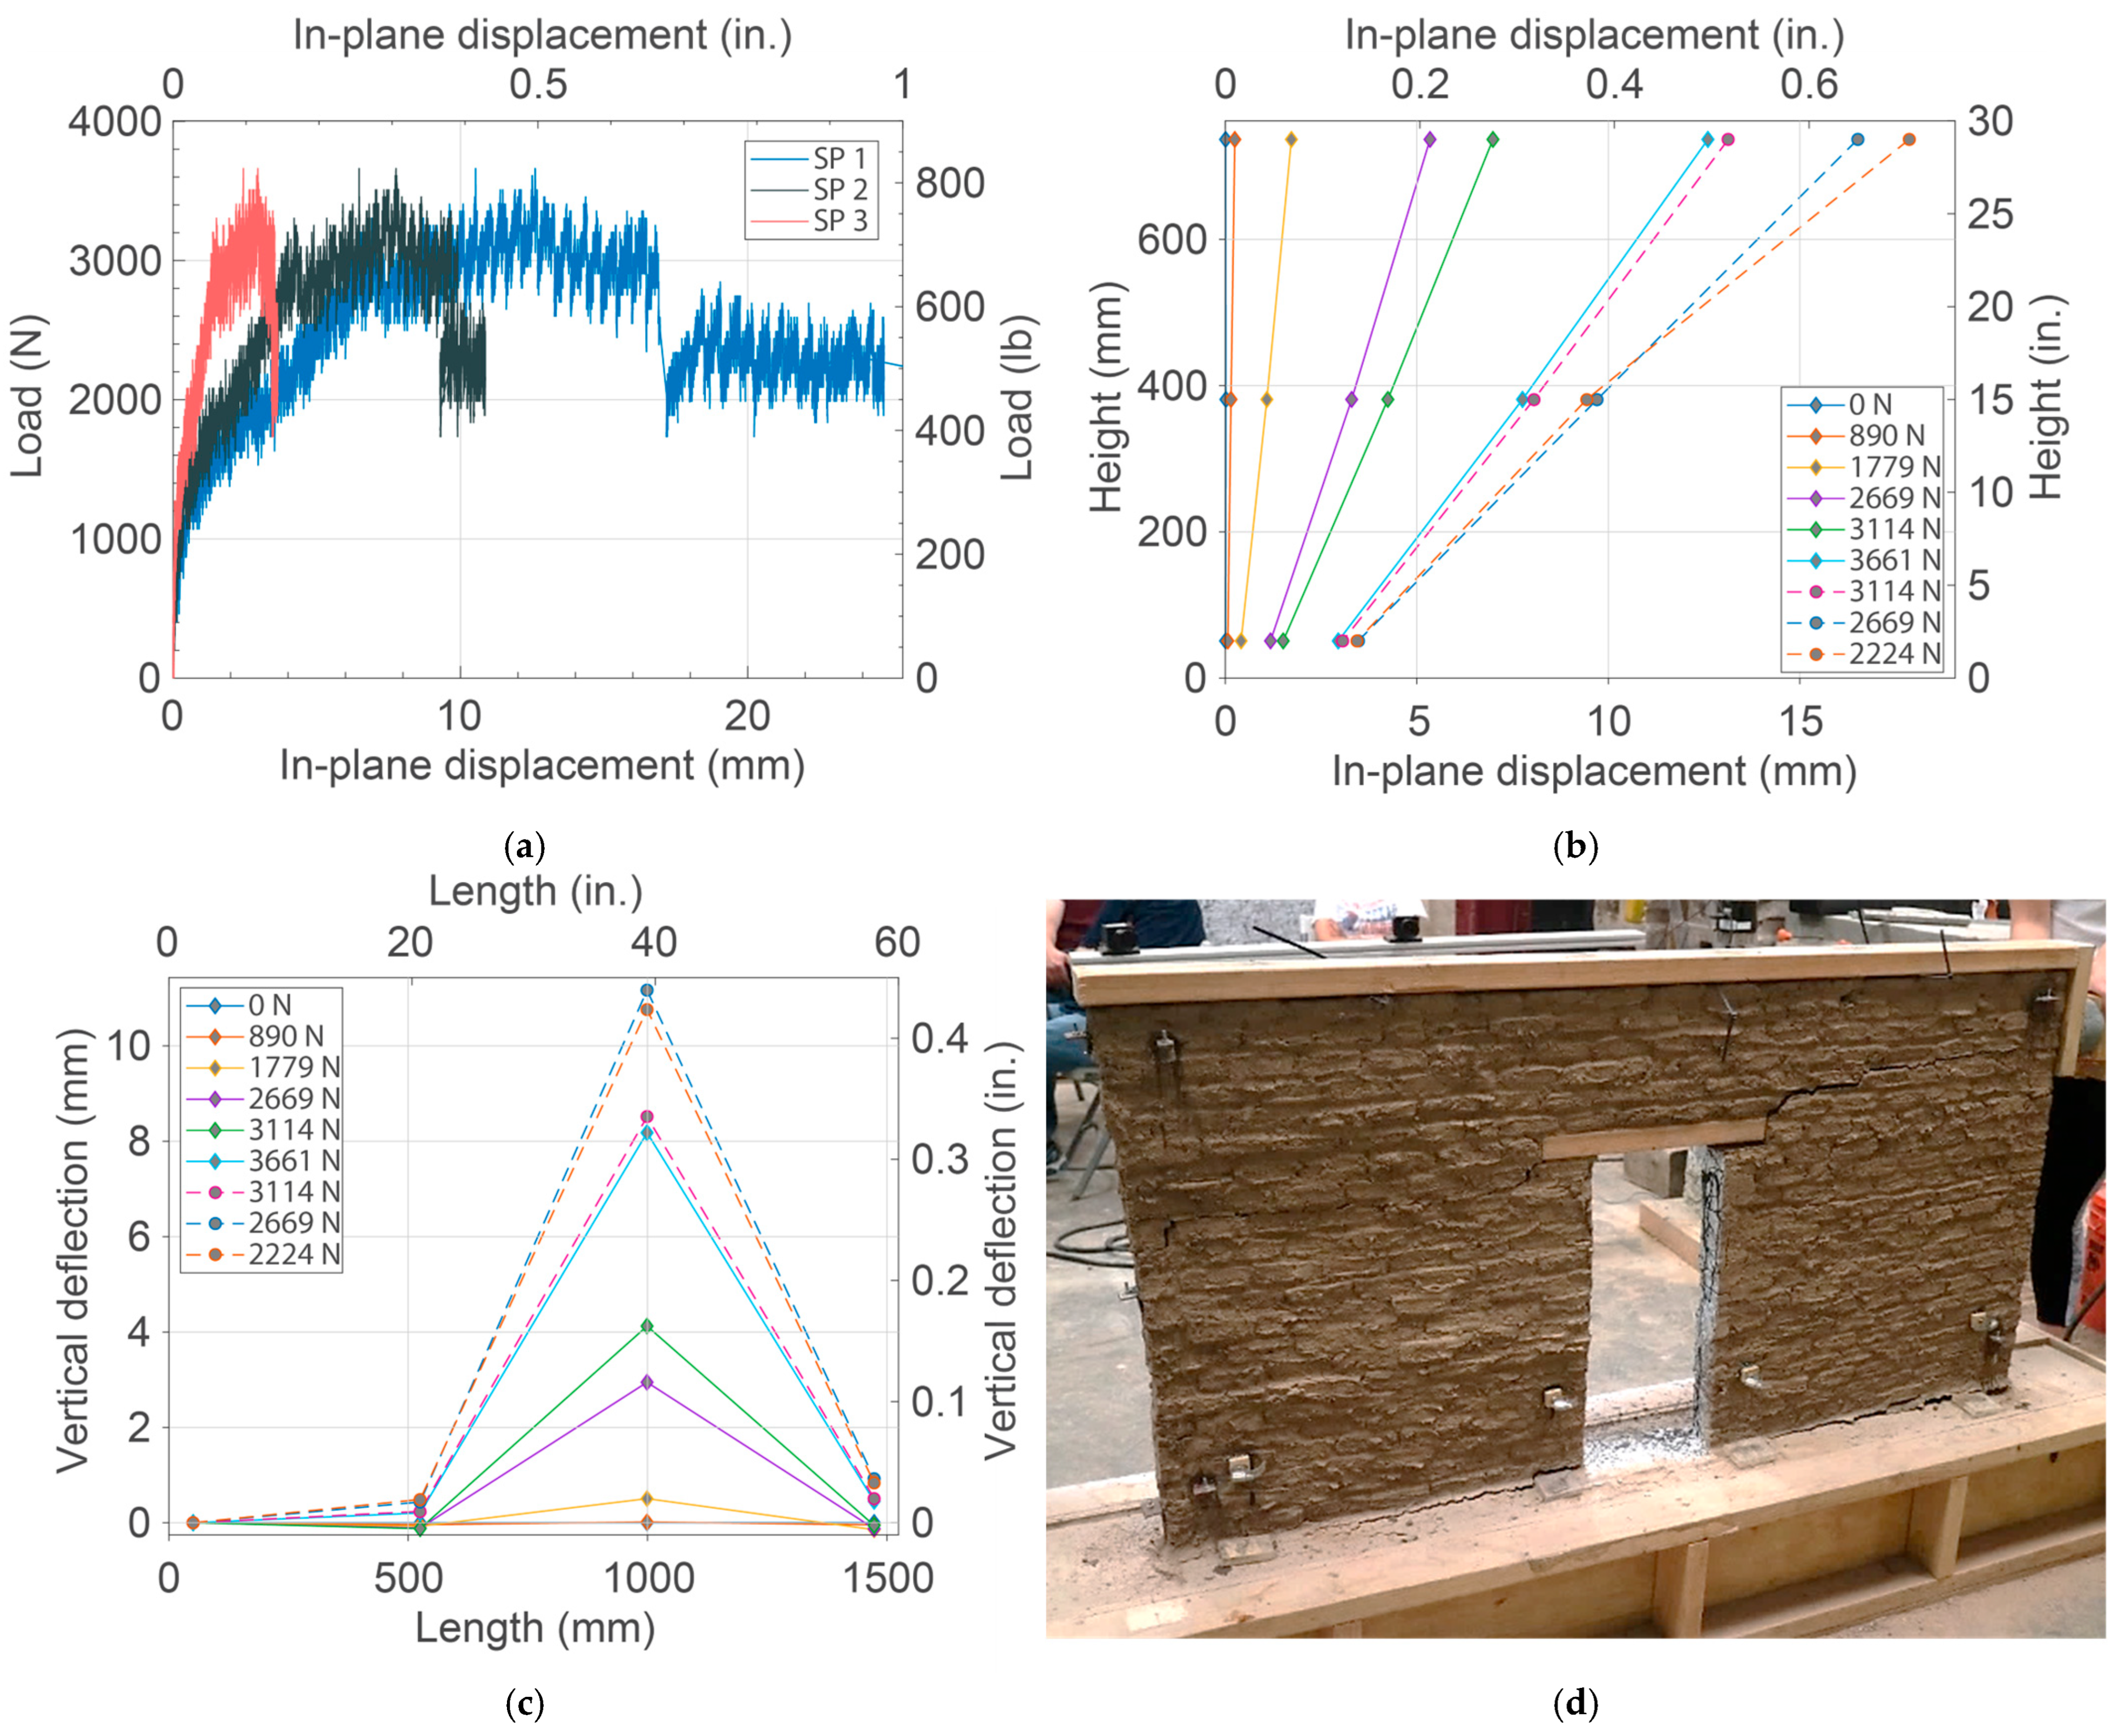
Wall 7 was constructed with adobe bricks containing straw and was load-tested with wb = 2.4% (air-dry). Wall 7 included a door opening in the center that strongly influenced its behavior in terms of cracking and load path along the wall section. Cracking initiated at approximately 667 N (150 lb) near the shorter side of the L-shape bond beam (south edge), one course above the tip of the wood bond beam and extended downward to the south top corner of the door (Figure 9d). As loading continued, additional cracking developed at the lower portion of the wall: cracks initiated at the bottom south corner of the wall and at the bottom north corner of the door and progressed along the foundation–wall interface.
Figure 9.
Adobe Wall 7 (bricks with straw, wb = 2.4%, and door): (a) load versus in-plane displacement, (b) in-plane displacement at three wall heights at different load increments, (c) vertical deflection along the wall length at different load increments, and (d) wall (west face) at the end of the load test.
As the cracks propagated along the foundation–wall interface, they divided Wall 7 into two rocking segments (namely, north and south segments), causing a different overturning behavior compared with the walls without a door opening. Wall 7 then reached a peak load of approximately 3664 N (824 lb), and shortly before the base cracks fully traversed the foundation–wall interface, a fourth crack initiated at the top north corner of the door and propagated horizontally toward the north edge, approximately one course above SP 2. Prior to the peak load, rocking was evidenced by greater displacement at the top and mid-height of the wall (SP 1 and SP 2) than at the base (SP 3) (Figure 9a,b), uplift at the bottom south edge and at the bottom north corner of the door (LVDT 1—measured manually as LVDT 1 stopped measuring during testing—and LVDT 3), and compression at the bottom south corner of the door and the bottom north edge (LVDT 2 and LVDT 4).
Because major cracks engaged the door opening, the behavior of Wall 7 was defined by the displacements of two distinct wall segments. In the north segment, the neutral axis was initially located approximately 127 mm (5 in.) from the north edge. As the load increased, the neutral axis shifted gradually until reaching the north edge (Figure 9c). In addition, the south edge experienced substantial uplift towards the end of the load test that was not captured by the LVDT 1 but was physically measured at the end of the test to be approximately 16.5 mm (0.65 in.) (Figure 9d). Thus, both segments experienced uplift at their bottom corners (indicated by arrows in Figure 9d). Following the peak load of 3664 N (824 lb) and the development of the fourth crack (Figure 9d), the behavior transitioned from rocking to sliding. Wall 7 slid along the top cracks of the wall, indicated by increasing in-plane displacement at the top of the wall (SP 1), while mid-height and bottom in-plane displacements remained nearly constant (SP 2 and SP 3) as the fourth crack was located completely above SP 2 (Figure 9a,b).
Wall 7 experienced the largest out-of-plane displacements of all tested walls. The top north corner (SP 4) and top south corner (SP 5) of the wall moved toward the west side. Vertical deflections also highlight the effect of the door opening: uplift occurred at the bottom south edge of the wall and at the bottom north corner of the door and continued along the foundation–wall interface, whereas compression occurred at the bottom south corner of the door and at the bottom north edge of the wall (Figure 9c). The door opening created two rocking points instead of one, affecting the load path and crack formation, and enabled Wall 7 to sustain a peak load comparable to that of Wall 6. However, this failure mode led to much larger in-plane displacements than any of the other walls tested.
4. Discussion
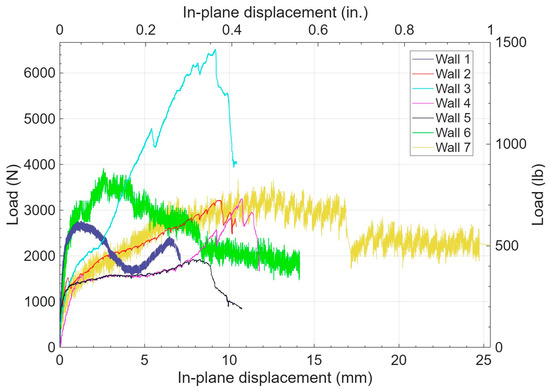
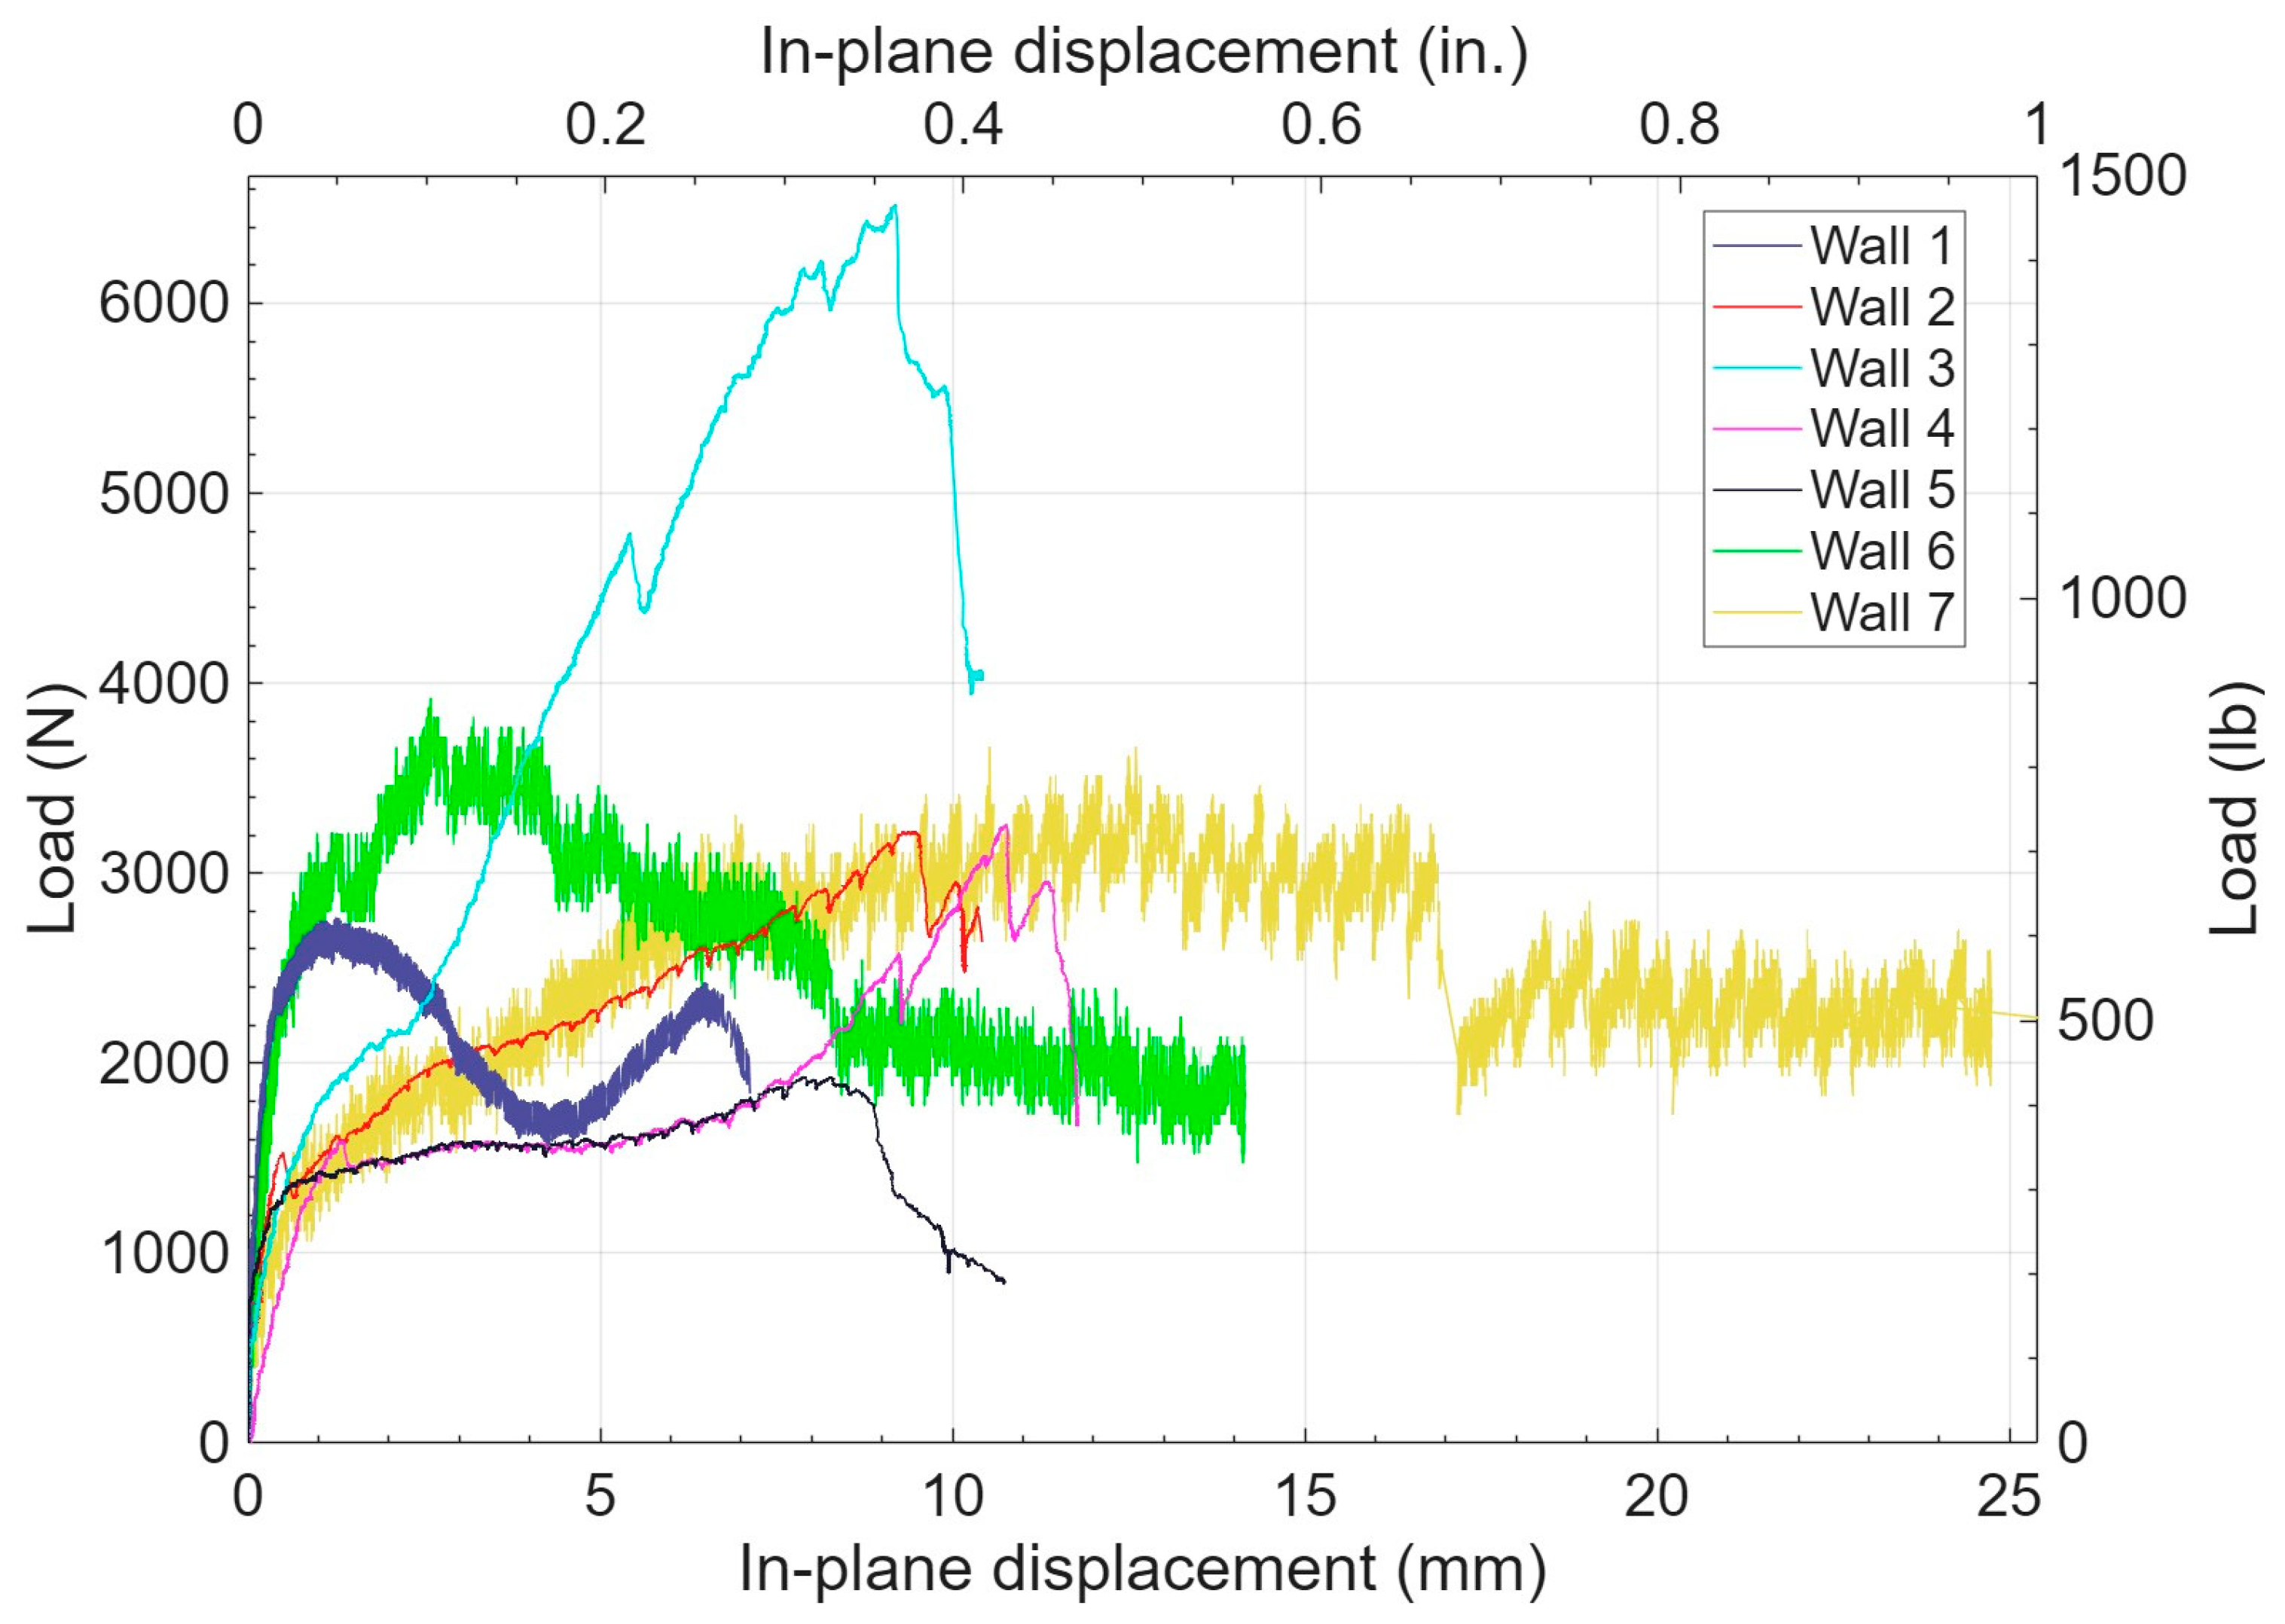
Figure 10 shows the load versus in-plane displacement measured at the top (SP 1) of all adobe walls and allows a comparison of the stiffness, strength, and post-peak response for the different wall conditions (i.e., fiber type, wb, and opening). To quantify these differences at consistent response points, Table 2 summarizes the loads, displacements, and vertical deflections at softening, peak load, and ultimate point. In addition to the displacement-based summary in Table 2, Table 3 compiles initial and secant stiffness values, softening and peak loads, and the corresponding drift ratios at peak and at the ultimate point U, together with the post-peak drift ratio U/P for each wall.
Figure 10.
Load versus in-plane displacement (measured by SP 1) for all the adobe walls.
Table 3.
Stiffness, softening, strength, and drift parameters derived from the load–displacement responses measured at the top of the wall (SP 1).
Table 2 shows that no consistent trend was observed for fiber type (straw versus sisal), moisture conditioning of the foundation–wall interface, or wall openings across the test results. For the air-dry walls with no openings, Wall 2 (sisal, wb = 2.6%) reached a larger peak load of 3221 N (724 lb) (Figure 3) than Wall 1 (straw, wb = 2.7%), which had a peak load of 2767 N (622 lb) (Figure 2), and did so at a greater in-plane displacement at peak (9.31 mm [0.37 in.] versus 1.25 mm [0.05 in.] for Wall 1), indicating that the sisal-brick wall sustained more deformation when compared with the straw-brick wall. The vertical deflection further differentiated these two walls: Wall 2 developed larger peak vertical deflection (14.1 mm [0.55 in.]) than Wall 1 (0.35 mm [0.01 in.]), which is another indicator of a more deformative response, but it also implies greater damage and reduced serviceability. Within this subset, Wall 1 exhibited the smallest in-plane deformation at peak load, whereas Wall 7 had the largest deformation at peak among all walls, highlighting the range of displacements captured in the test matrix. Across the full set of walls, the drift ratios at softening had similar values, except for Wall 4, indicating that most wall specimens began to soften at comparable top displacements.
For the moisture-conditioned walls without openings (Walls 3–5), cracking consistently engaged the moisture-conditioned foundation–wall interface region, confirming that the wetting reduced the strength in these areas (i.e., water sprayed over the bottom 102 mm [4 in.] region prior to testing). However, the results also show that peak strength was governed by the crack trajectory, particularly whether the dominant crack path diverted into the footing region, thereby interrupting the otherwise continuous foundation–wall interface cracking/sliding plane and producing a temporary mechanical interlock (shear-key-type engagement) or propagated rapidly through the foundation–wall interface. Wall 3 (straw, wb = 4.8%) initiated cracking near the south edge, with the crack advancing along mortar joints before reaching the footing region and extending into it. This diversion shifted the rocking pivot inward and downward into the engaged footing region and allowed a depth of the footing to resist the applied load, which enabled additional resistance and led to the greatest peak load of 6517 N (1465 lb) (Figure 4 and Figure 5). Failure occurred later when a secondary crack developed above the footing crack and propagated toward the north bottom edge. In Wall 4 (sisal, wb = 4.9%), cracking began near the south bottom corner and similarly extended into the footing at about mid-length, enabling a mechanical interlock and a peak load of 3257 N (732 lb) (Figure 6). Wall 4 began losing capacity when the crack propagated through the foundation–wall interface, starting near the center toward the north edge, providing lower load resistance compared with Wall 3, attributed to a less favorable crack trajectory. In contrast, Wall 5 (sisal, wb = 4.6%) reached the lowest peak load (1928 N [433 lb]) (Figure 7) because cracking initiated and advanced through lower courses to the footing, after which rapid crack propagation through the foundation–wall interface prevented development of a strong mechanical interlock and facilitated failure. The distinction among Walls 3–5 was that wetting the lower portion of the wall promoted cracking in lower courses and at the foundation–wall interface, whereas capacity depended on whether the crack path temporarily interrupted a continuous interface crack plane by diverting into the footing as observed in Wall 3 and to a moderate extent in Wall 4, rather than the foundation–wall interface crack propagation observed in Wall 5.
Walls with openings showed that geometry modifies crack trajectory towards discontinuities and eventually enables segmented mechanisms. Wall 6 (straw, wb = 2.8%, window) developed cracking that started and terminated at window corners, effectively separating the wall into top and bottom portions and producing a failure mode tied to the opening rather than a single full-length crack; despite this, its peak load (3919 N [881 lb]) (Figure 8) exceeded all wall cases with the exception of Wall 3 (see Table 2), whereas its out-of-plane displacements at peak remained minimal, supporting that the opening primarily controlled crack localization. Wall 7 (straw, wb = 2.4%, door) presented the largest in-plane displacement (12.60 mm [0.50 in.]) at a peak load of 3664 N (824 lb) (Figure 9), which underscored the influence of a door opening on the displacement sustained at peak. Crack formation divided Wall 7 into two rocking segments that ultimately ceased to rock when a fourth crack at the top north corner of the door extended to the north edge of the wall.
Table 4 shows drift ratios (calculated by dividing the top in-plane displacements at a given stage of loading by the wall height) at softening (S), at peak load (P), and at the ultimate point (U). Drift ratios provide a normalized basis for comparing in-plane displacement relative to wall height. Except for Wall 4, the drift ratios at softening reported in Table 4 are of similar magnitude, indicating that, regardless of load level, most walls began to soften at comparable top displacements. Moreover, the post-peak drift ratio U/P from Table 3 was similar for most walls, with Walls 1 and 6 standing out for sustaining relatively larger additional drift after a 20% loss in strength.
Table 4.
Drift ratios (%) at three load stages.
An exception was Wall 7, which incorporated a door opening and developed the largest drift values at peak load and ultimate point of all wall specimens. The response of Wall 7 highlights the significant influence of openings on deformation mechanisms and overall deformability. Within the bounds of this test matrix, the compiled responses in Table 3 indicate that adding sisal fibers, increasing water content, or introducing a door opening did not substantially change peak load attained but tended to increase deformations when compared with solid or window walls composed of dry bricks containing straw fibers.
Limitations and Scope of Inference
This experimental program evaluated a single wall specimen per parameter combination, so the observed differences in stiffness, strength, and drift capacity cannot be uniquely attributed to fiber type, water content at the wall base, or the presence and configuration of openings. The data are informative for understanding the behaviors observed within this specific test matrix, but the lack of replication and non-factorial experimental matrix preclude statistical assessment of main effects and interactions. In several cases, crack trajectory and local heterogeneity at the foundation–wall interface governed the failure mode and peak load resistance, indicating that material variability can produce different behaviors even under nominally similar conditions. Consequently, the results should be interpreted as indicative of possible response modes and mechanisms rather than as generalizable trends for all adobe walls with similar nominal properties. A larger sample size, with multiple walls tested per condition, would be required to begin identifying robust trends within each parameter subset and to more confidently isolate the influence of fiber type, water content, and openings.
5. Conclusions
This study investigated the structural response of quarter-scale adobe masonry walls under monotonic in-plane loading, focusing on the influence of water content (wb) of the lower portion of the wall, fiber type in the bricks (straw versus sisal), and the presence of openings (window or door). Seven walls were tested within wb = 2.4–4.9%, and additional wall models, moisture-conditioned to much greater water contents, collapsed before their load tests, indicating an upper bound of wb for stability under self-weight for the tested configuration.
(i) Moisture conditioning of the lower portion of the wall consistently led to cracking in lower courses and along the wall–foundation interface for Walls 3–5. However, the results demonstrated that peak strength in the moisture-conditioned walls was governed primarily by crack trajectory, particularly whether the dominant crack path diverted into the footing, interrupting the otherwise continuous foundation–wall interface cracking plane and producing a temporary shear-key-type mechanical interlock, or propagated rapidly through the foundation–wall interface. Wall 3 (straw, wb = 4.8%) reached the greatest peak load of 6517 N (1465 lb) as the crack diverted into the footing, shifting the rocking pivot inward and downward into the engaged footing region and allowing a depth of the footing to participate in resisting load (Figure 4 and Figure 5). In contrast, Wall 5 (sisal, wb = 4.6%) reached the lowest peak load of 1928 N (433 lb) due to rapid crack propagation along the foundation–wall interface and the absence of a sustained mechanical interlock effect. Wall 4 (sisal, wb = 4.9%) also exhibited a diversion of the cracks into the footing, but cracking returned more rapidly to the foundation–wall interface as loading continued, resulting in a lower peak load of 3257 N (732 lb), and lower sustained resistance than Wall 3.
(ii) The wall response reflected combined effects of fiber type, higher water content in the lower portion of the wall, and openings rather than a single displacement trend. Comparing the air-dry walls without openings, Wall 2 (sisal, wb = 2.6%) reached a greater peak load than Wall 1 (straw, wb = 2.7%) and did so at a much larger in-plane displacement at peak [9.31 mm (0.37 in.) versus 1.25 mm (0.05 in.)), with substantially larger peak vertical deflection (14.06 mm (0.55 in.) versus 0.35 mm (0.01 in.)]. When responses were compared on a normalized basis (drift ratios), the moisture-conditioned walls (Walls 3–5) generally showed larger drift at the start of load softening and at peak load than the air-dry walls (Walls 1, 2, and 6), whereas Wall 7 (door opening) exhibited the largest end-of-test drift, highlighting the influence of openings on deformability.
(iii) Initial stiffness varied across the test matrix, with Wall 1 being the stiffest wall, followed by Walls 2 and 3, and Wall 4 exhibiting the lowest initial stiffness. Among the moisture-conditioned walls, Wall 4 also showed the closest agreement between its initial and secant stiffness values, yet its peak load was comparable to that of Wall 2. Wall 2 was initially stiffer than Wall 4, but both walls showed similar secant stiffness at 0.10% drift, indicating that their lateral stiffness under small drift demands was ultimately of similar magnitude. Secant stiffness values tended to be similar across most walls, with the notable exception of Walls 1 and 6, which were similar to each other but higher than those of the remaining specimens. Walls with openings showed no clear sign of the initial or secant stiffness being affected by the different geometry of the walls (i.e., present of an opening) when compared with the other walls in the test matrix.
(iv) Initial cracking occurred at relatively low loads when compared with attained peak loads across the test matrix (approximately 222–890 N [50–200 lb]), indicating that early stiffness reductions were common regardless of the fiber type. Specifically, cracking initiated at 890 N (200 lb) (Wall 1), 667 N (150 lb) (Wall 2), 667 N (150 lb) (Wall 3), 222 N (50 lb) (Wall 4), 756 N (170 lb) (Wall 5), 801 N (180 lb) (Wall 6), and approximately 667 N (150 lb) (Wall 7). For the moisture-conditioned walls (Walls 3–5), cracking consistently engaged the lower portion of the wall, which had the larger wb, confirming that wetting influenced where cracking localized; nevertheless, whether cracks diverted into the footing or propagated through the interface controlled how much resistance was sustained after stiffness loss began. For walls with an opening, cracks commonly initiated and/or terminated at the corners of the opening, demonstrating that discontinuities strongly influenced crack localization and the evolving mechanism.
(v) Across the tests, walls exhibited rocking-dominated behavior prior to peak load and transitioned toward sliding along major cracks after peak. This transition was evident in the air-dry walls without openings (e.g., progressive rocking transitioning to sliding of Walls 1 and 2) and in the door-opening wall (transitioning from rocking to sliding after the peak of Wall 7). In the moisture-conditioned walls, the governing mechanism depended on whether a mechanical interlock developed (Walls 3–4) or whether rapid interface propagation limited resistance and promoted earlier loss of capacity (Wall 5).
(vi) Openings significantly modified crack trajectories and produced segmented mechanisms. Wall 6 (window) developed cracks that engaged window corners and did not span the full wall length; its peak load was 3919 N (881 lb), exceeding the peak loads of 2767–3221 N (622–724 lb) of air-dry walls without openings. Wall 7 (door) developed cracking along the foundation–wall interface that divided the wall into two rocking segments and reached a peak load of approximately 3664 N (824 lb); this mechanism enabled a peak load comparable with Wall 6 but resulted in much larger in-plane displacement.
(vii) The results indicated that fiber type contributed to response differences, but its influence was intertwined with higher wb and geometry. Comparing the air-dry wall without openings, the sisal-brick wall (Wall 2) achieved greater peak load and substantially larger in-plane and vertical deflections at peak than the straw-brick wall (Wall 1), suggesting greater deformation tolerance for Wall 2 under those specific conditions. For moisture-conditioned walls and walls with openings, crack trajectory (including mechanical interlock effects) and geometric discontinuities primarily governed peak strength and mechanism development.
(viii) Adobe masonry behaved as a variable material system in which modest changes in wb condition and the resulting crack trajectory produced large differences in peak load [e.g., 1928–6517 N (433–1465 lb) across the moisture-conditioned walls]. The collapse of additional wall models during moisture conditioning at wb = 8.4–17.1% further suggests a practical moisture threshold beyond which stability under self-weight becomes problematic for this wall test configuration and wall thickness. Overall, the findings emphasize the importance of understanding the vulnerabilities that moisture creates at and near the foundation–wall interface and the strong role of crack path control (including potential footing engagement) and openings in shaping strength, deformability, and failure mechanisms within the tested range.
The findings provide an understanding of the structural behavior of reinforced adobe walls under various conditions. The intricate interplay of water content, fiber type, and structural openings influences the load-carrying capacity, displacement behavior, cracking patterns, and failure mechanisms. This research underscores the importance of moisture management, careful consideration of materials such as fiber type, and the impact of openings on structural performance. While the variability observed across the walls tested highlights the challenges of working with inherently heterogeneous materials like adobe, it also gives more information about the material that could eventually be used to enhance building codes. However, because only one wall was tested for each parameter combination, these results should be viewed as indicative of possible response modes rather than as broadly generalizable trends. Future experimental research should investigate the influence of water content thresholds on wall behavior, considering variations in water content and accounting for outliers to improve predictions of structural performance. In addition, out-of-plane load testing of similar wall setups would help understand adobe’s behavior and performance thresholds in the out-of-plane direction. Investigating the influence of different bond-beam-to-wall connections in this type of experimental testing could offer insights into how load distribution may be affected. Finally, testing walls with openings at varying locations and incorporating fibers like straw and sisal in the fabrication of the bricks would allow a deeper understanding of how fiber type and the presence of openings interact to influence structural behavior. This research serves as information for more resilient and sustainable construction practices by providing comprehensive data to inform future design solutions.
Author Contributions
Conceptualization, E.D., B.D.W. and P.B.; methodology, E.D., B.D.W., P.B., M.J.M. and B.K.B.; formal analysis, E.D., B.D.W. and P.B.; writing—original draft preparation, E.D.; writing—review and editing, E.D., B.D.W. and P.B.; funding acquisition, B.D.W. and P.B. All authors have read and agreed to the published version of the manuscript.
Funding
This material is based upon work supported in part by the National Science Foundation (NSF) under NSF Cooperative Agreement Number EEC-1449501. Any opinions, findings, conclusions, or recommendations expressed in this material are those of the authors, and do not necessarily reflect those of the NSF.
Data Availability Statement
The raw data supporting the conclusions of this article will be made available by the authors on request.
Acknowledgments
The help provided by New Mexico State University student assistants Andres Alvarez, Eduardo Gonzalez, Enrique Mendoza-Comaduran, and Jacobo Valenzuela-Sanchez with material preparation, wall model construction, and test setup is greatly appreciated.
Conflicts of Interest
The authors declare no conflicts of interest. The funding agency had no role in the design of the study; collection, analyses, or interpretation of data; writing of the manuscript; and decision to publish the results.
Abbreviations
The following abbreviations are used in this manuscript:
| BP | Before present |
| LVDT | Linear variable displacement transducer |
| P | Peak load |
| S | Softening |
| SP | String potentiometer |
| U | Ultimate point |
| U/P | Post-peak drift ratio |
References
- Mauricio, A.C.; Grieseler, R.; Heller, A.R.; Kelley, A.R.; Rumiche, F.; Sandweiss, D.H.; Viveen, W. The earliest adobe monumental architecture in the Americas. Proc. Natl. Acad. Sci. USA 2021, 118, e2102941118. [Google Scholar] [CrossRef] [Scilit]
- Șeitan, T.; Grămescu, A.M. Traditional methods and techniques used for earthen buildings. Ovidius Univ. Ann. Constanța. Ser. Civ. Eng. 2021, 23, 98–106. [Google Scholar] [CrossRef] [Scilit]
- Maduabum, A. An insight into the history of earthen architecture. Int. Res. J. Mod. Eng. Technol. Sci. 2024, 6, 2369–2382. [Google Scholar]
- Illampas, R.; Ioannou, I.; Charmpis, D.C. Adobe: An environmentally friendly construction material. WIT Trans. Ecol. Environ. 2009, 120, 245–256. [Google Scholar] [CrossRef] [Scilit]
- Obafemi, A.P.O.; Kurt, S. Environmental impacts of adobe as a building material: The north Cyprus traditional building case. Case Stud. Constr. Mater. 2016, 4, 32–41. [Google Scholar] [CrossRef] [Scilit]
- Ige, O.; Danso, H. Physico-mechanical and thermal gravimetric analysis of adobe masonry units reinforced with plantain pseudo-stem fibres for sustainable construction. Constr. Build. Mater. 2021, 273, 121686. [Google Scholar] [CrossRef] [Scilit]
- Costa, C.; Cerqueira, Á.; Rocha, F.; Velosa, A. The sustainability of adobe construction: Past to future. Int. J. Archit. Herit. 2019, 13, 639–647. [Google Scholar] [CrossRef] [Scilit]
- Asdrubali, F.; Grazieschi, G.; Roncone, M.; Thiebat, F.; Carbonaro, C. Sustainability of building materials: Embodied energy and embodied carbon of masonry. Energies 2023, 16, 1846. [Google Scholar] [CrossRef] [Scilit]
- Christoforou, E.; Illampas, R.; Ioannou, I.; Charmpis, D.C. Cradle-to-site life cycle assessment (LCA) of adobe bricks. J. Clean. Prod. 2016, 112, 443–452. [Google Scholar] [CrossRef] [Scilit]
- Binici, H.; Aksogan, O.; Bakbak, D.; Kaplan, H.; Isik, B. Sound insulation of fibre reinforced mud brick walls. Constr. Build. Mater. 2009, 23, 1035–1041. [Google Scholar] [CrossRef] [Scilit]
- Januševičius, T.; Mažuolis, J.; Butkus, D. Sound reduction in samples of environmentally friendly building materials and their compositions. Appl. Acoust. 2016, 113, 132–136. [Google Scholar] [CrossRef] [Scilit]
- Zonno, G.; Aguilar, R.; Boroschek, R.; Lourenço, P.B. Experimental analysis of the thermohygrometric effects on the dynamic behavior of adobe systems. Constr. Build. Mater. 2019, 208, 158–174. [Google Scholar] [CrossRef] [Scilit]
- Pérez-Sánchez, J.F.; Chavez-Vega, F.R.; Calvillo-Villcaña, M.E.; Suárez-Domínguez, K.; Estrada Castro, K.E.; Luna-Domínguez, J.H.; Gallegos-Vilella, R. Thermal conductivity prediction and comfort in adobe housing in Tamaulipas. Cogent Eng. 2022, 9, 2109321. [Google Scholar] [CrossRef] [Scilit]
- Heracleous, C.; Panagiotou, R.; Ioannou, I.; Michael, A.; Philokyprou, M. Hygrothermal performance monitoring and thermal comfort evaluation in adobe masonry. SSRN Electron. J. 2025. [Google Scholar] [CrossRef] [Scilit]
- Villón Prieto, C.R.; Villón Prieto, R.D.; Guerra Fernández, R.M.d.C.; Sialer Alarcón, A.J.; Calderón Cueva, R.M. Adobe with eucalyptus fibers optimizing the mechanical and thermal properties in houses in Galindo. J. Int. Crisis Risk Commun. Res. 2024, 7, 1118–1128. Available online: https://jicrcr.com/index.php/jicrcr/article/view/526/341 (accessed on 15 February 2026).
- Mileto, C.; Vegas López-Manzanares, F. Earthen architectural heritage in the international context: Values, threats, conservation principles and strategies. J. Cult. Herit. Manag. Sustain. Dev. 2022, 12, 192–205. [Google Scholar] [CrossRef] [Scilit]
- Morris, H.; Walker, R.; Drupsteen, T. Observations of the performance of earth buildings following the September 2010 Darfield earthquake. Bull. N. Z. Soc. Earthq. Eng. 2010, 43, 393–403. [Google Scholar] [CrossRef] [Scilit]
- Morris, H.; Walker, R. Observations of the performance of earth buildings following the February 2011 Christchurch earthquake. Bull. N. Z. Soc. Earthq. Eng. 2011, 44, 358–367. [Google Scholar] [CrossRef] [Scilit]
- Momin, S.; Lovon, H.; Silva, V.; Ferreira, T.M.; Vicente, R. Seismic vulnerability assessment of Portuguese adobe buildings. Buildings 2021, 11, 200. [Google Scholar] [CrossRef] [Scilit]
- Illampas, R.; Silva, R.A.; Charmpis, D.C.; Lourenço, P.B.; Ioannou, I. Validation of the repair effectiveness of clay-based grout injections by lateral load testing of an adobe model building. Constr. Build. Mater. 2017, 153, 174–184. [Google Scholar] [CrossRef] [Scilit]
- Tolles, E.L.; Kimbro, E.E.; Webster, F.A.; Ginell, W.S. Survey of Damage to Historic Adobe Buildings After the January 1994 Northridge Earthquake; Getty Conservation Institute: Los Angeles, CA, USA, 1996. [Google Scholar]
- Tarque Ruíz, N.; Camata, G.; Spacone, E.; Varum, H.; Blondet, M. Elastic and inelastic parameters for representing the seismic in-plane behaviour of adobe walls. In Terra 2012: XI Conferencia Internacional Sobre el Estudio y Conservación del Patrimonio Arquitectónico de Tierra; Pontificia Universidad Católica del Perú: Lima, Peru, 2012. [Google Scholar]
- Preciado, A.; Sperbeck, S.T. Failure analysis and performance of compact and slender carved stone URM walls under compression and seismic loading by the FEM approach. Eng. Fail. Anal. 2019, 96, 508–524. [Google Scholar] [CrossRef] [Scilit]
- Pingano, N.; Milani, G. Simple interface element equipped with thickness for the non-linear static heterogeneous analysis of masonry walls in-plane loaded: Implementation and validation. Eng. Struct. 2026, 351, 122056. [Google Scholar] [CrossRef] [Scilit]
- Camacho-Tauta, J.; Uribe-Kaffure, C.; Ramos-Cañón, A. Mechanical deterioration by weathering of the adobe from the Tausa Chapel (Colombia). TecnoLógicas 2023, 26, e2733. [Google Scholar] [CrossRef] [Scilit]
- Silveira, D.; Varum, H.; Costa, A.; Pereira, H.; Sarchi, L.; Monteiro, R. Seismic behavior of two Portuguese adobe buildings: Part I–In-plane cyclic testing of a full-scale adobe wall. Int. J. Archit. Herit. 2018, 12, 922–935. [Google Scholar] [CrossRef] [Scilit]
- Al Aqtash, U.; Bandini, P.; Cooper, S.L. Numerical approach to model the effect of moisture in adobe masonry walls subjected to in-plane loading. Int. J. Archit. Herit. 2017, 11, 805–815. [Google Scholar] [CrossRef] [Scilit]
- Al Aqtash, U.; Bandini, P.; Cooper, S.L. Lateral strength of traditional adobe walls affected by moisture: A numerical parametric study. Int. J. Archit. Herit. 2022, 16, 1432–1449. [Google Scholar] [CrossRef] [Scilit]
- Al Aqtash, U.; Bandini, P. Influence of Wall Thickness and Water Content on the Out-of-Plane Stability of Adobe Walls. Infrastructures 2020, 5, 78. [Google Scholar] [CrossRef] [Scilit]
- Mascolo, I.; Gesualdo, A.; Olivieri, C.; Fortunato, A. On blocks detection in unilateral masonry-like structures: A rigid-elastic displacement approach. Int. J. Mason. Res. Innov. 2022, 7, 395–405. [Google Scholar] [CrossRef] [Scilit]
- Fabbrocino, F.; Olivieri, C.; Luciano, R.; Vaiano, G.; Maddaloni, G.; Iannuzzo, A. Seismic performance of historic masonry buildings: A comparative analysis of equivalent frame and block-based methods. Alex. Eng. J. 2024, 109, 359–375. [Google Scholar] [CrossRef] [Scilit]
- Weldon, B.D.; Bandini, P.; McGinnis, M.J.; Dávila, E.; García Vera, D.I. Laboratory study on the strength behaviour of two laterally loaded adobe walls. Infrastructures 2019, 4, 1. [Google Scholar] [CrossRef] [Scilit]
- Dávila, E.; Weldon, B.D.; Bandini, P.; McGinnis, M.J.; Gangone, M.V. Performance of scaled adobe masonry walls under the effects of moisture and monotonic in-plane loading. In Structural Analysis of Historical Constructions. SAHC 2025—Vol. 2; Saloustros, S., Beyer, K., Eds.; RILEM Bookseries; Springer: Cham, Switzerland, 2026; Volume 68, Available online: https://link.springer.com/book/10.1007/978-3-032-16767-5 (accessed on 23 April 2026).
- Piani, T.; Weerheijm, J.; Peroni, M.; Koene, L.; Krabbenborg, D.; Solomos, G.; Sluys, L.J. Dynamic behaviour of adobe bricks in compression: The role of fibres and water content at various loading rates. Constr. Build. Mater. 2020, 230, 117038. [Google Scholar] [CrossRef] [Scilit]
- Araya-Letelier, G.; Concha-Riedel, J.; Antico, F.C.; Valdés, C.; Cáceres, G. Influence of natural fiber dosage and length on adobe mixes damage-mechanical behavior. Constr. Build. Mater. 2018, 174, 645–655. [Google Scholar] [CrossRef] [Scilit]
- Jové-Sandoval, F.; Barbero-Barrera, M.M.; Flores Medina, N. Assessment of the mechanical performance of three varieties of pine needles as natural reinforcement of adobe. Constr. Build. Mater. 2018, 187, 205–213. [Google Scholar] [CrossRef] [Scilit]
- Abdulla, K.F.; Cunningham, L.S.; Gillie, M. Experimental study on the mechanical properties of straw fiber–reinforced adobe masonry. J. Mater. Civ. Eng. 2020, 32. [Google Scholar] [CrossRef] [Scilit]
- Al Aqtash, U.; Bandini, P. Prediction of unsaturated shear strength of an adobe soil from the soil-water characteristic curve. Constr. Build. Mater. 2015, 98, 892–899. [Google Scholar] [CrossRef] [Scilit]
- Morel, J.C.; Ghavami, K.; Mesbah, A. Theoretical and experimental analysis of composite soil blocks reinforced with sisal fibres subjected to shear. Mason. Int. 2000, 13, 54–62. [Google Scholar]
- Mesbah, A.; Morel, J.C.; Walker, P.; Ghavami, K. Development of a direct tensile test for compacted earth blocks reinforced with natural fibers. J. Mater. Civ. Eng. 2004, 16. [Google Scholar] [CrossRef] [Scilit]
- Kasie, Y.M.; Mogne, A.Y. Improvement of mechanical properties of adobe brick reinforced with sisal fiber. Build. Mater. Struct. 2025, 5, 69. [Google Scholar] [CrossRef] [Scilit]
- Kafodya, I.; Okonta, F.; Kloukinas, P. Role of fiber inclusion in adobe masonry construction. J. Build. Eng. 2019, 26, 100904. [Google Scholar] [CrossRef] [Scilit]
- Oliver, M.; Gharbi, Z.E. Sisal fiber reinforced soil block masonry. In Proceedings of the 4th International Masonry Conference; West, H.W.H., Ed.; British Masonry Society: London, UK, 1995; Volume 1, pp. 55–58. [Google Scholar]
- Ghavami, K.; Toledo Filho, R.D.; Barbosa, N.P. Behaviour of composite soil reinforced with natural fibres. Cem. Concr. Compos. 1999, 21, 39–48. [Google Scholar] [CrossRef] [Scilit]
- Smith, E.W. Adobe Bricks in New Mexico; Circular 188; New Mexico Bureau of Mines and Mineral Resources: Socorro, NM, USA, 1982. [Google Scholar]
- Gebremariam, T.B. Experimental Evaluation of the Effect of Moisture on Adobe Material Strength and Wall Behavior Under Lateral Loads. Master’s Thesis, Department of Civil Engineering, New Mexico State University, Las Cruces, NM, USA, 2017. [Google Scholar]
- Federal Emergency Management Agency. Prestandard and Commentary for the Seismic Rehabilitation of Buildings; FEMA 356; Federal Emergency Management Agency: Washington, DC, USA, 2000.
- Federal Emergency Management Agency. Improvement of Nonlinear Static Seismic Analysis Procedures; FEMA 440; Federal Emergency Management Agency: Washington, DC, USA, 2005.

Disclaimer/Publisher’s Note: The statements, opinions and data contained in all publications are solely those of the individual author(s) and contributor(s) and not of MDPI and/or the editor(s). MDPI and/or the editor(s) disclaim responsibility for any injury to people or property resulting from any ideas, methods, instructions or products referred to in the content. |
© 2026 by the authors. Licensee MDPI, Basel, Switzerland. This article is an open access article distributed under the terms and conditions of the Creative Commons Attribution (CC BY) license.