


Abstract
Highway–rail grade crossings (HRGCs) are locations where roadways and railway tracks intersect at the same level. Due to the shared level of travel and the substantial mass disparity between trains and highway users, collisions at these crossings tend to be catastrophic. As a result, HRGC crashes represent a major public safety concern in the United States. While previous studies have evaluated contributing factors to crash severity, there has been limited focus on the role of highway users’ action and its influence on crash severity. This study aims to examine all relevant factors, with a particular focus on highway user actions. The dataset, sourced from the Federal Railroad Administration’s database, includes data from six states between 2013 and 2022, specifically addressing severity and contributing factors. The proportional analysis highlights that highway user actions such as “went around the gate”, “did not stop”, and “stopped on the crossing” dominantly contribute to crash severity. A multinomial logistic regression was employed to identify significant determinants of crash severity. Odds ratio analysis reveals that “went around the gate” significantly increases the risk of fatal injuries across all six states, with odds ratios ranging from 3.45 in California to 4.55 in Georgia. The findings provide data-driven insights that can support the development of targeted safety countermeasures and intelligent traffic management strategies to enhance safety at HRGCs.
1. Introduction
Highway railroad grade crossings (HRGCs) are points where different modes of transportation, like trains, vehicles, motorcycles, bicyclists, and pedestrians, use the same junction [1]. Grade crossings are highly susceptible to severe collisions between road users and trains, often leading to catastrophic accidents and substantial economic costs. Additionally, these incidents can cause traffic delays, impacting both rail and roadway networks. These crossings pose a higher risk of crashes, and their severity is influenced by several different factors. The Federal Railway Administration (FRA) [2] reports that 2192 railroad accidents occurred at public and private road crossings in 2023, resulting in 247 fatal and 766 non-fatal injuries (see the Supplementary Materials).
Modern highway–rail grade crossings (HRGCs) are increasingly evolving as integral components of intelligent transportation systems (ITSs). Emerging technologies now incorporate artificial intelligence and advanced sensor networks to enhance crossing safety. In particular, deep learning methods enable the autonomous detection of hazardous situations, while camera-based monitoring systems identify risky road user behaviors in real time [3]. These AI-driven approaches support data-driven safety improvements and proactive risk mitigation. In parallel, connected vehicle applications provide timely warnings to approaching drivers, further reducing crash risk [4]. Together, these technologies represent the future of HRGC safety management. Nevertheless, effective implementation of such systems requires a clear understanding of human behavior patterns. Behavioral analysis is therefore essential to inform technology deployment and maximize its safety benefits.
Studies indicate that the fatality risk in train–vehicle collisions is 20 times higher than in vehicle–vehicle collisions, with key contributing factors at HRGCs including misinterpretation of warning signals, distracted driving, deliberate disregard for crossing warnings, and poor judgment of train speed [5].
In 2023, Operation Lifesaver identified 25 U.S. states with the highest number of collisions at HRGCs. Texas led with 246 crashes, including 16 fatalities and 77 non-fatal injuries. California and Georgia followed with 172 and 135 crashes, respectively. In contrast, Wisconsin, Minnesota, and New Jersey reported significantly fewer collisions, with 36, 35, and 35 crashes, respectively [6]. This study focuses on states with both high and low crash frequencies to examine the impact of highway user actions and other dominant factors on crash severity. Crash severity is classified in three categories, property damage only (PDO), injury, and fatal injury [7]. Evaluating the effect of highway user actions on HRGC crash severity provides safety metrics that can support transportation decision-making in defining or refining regulations—such as traffic laws—and aid in improving crossing safety design. Safety issues and severity risks can be greatly reduced by addressing the most frequent user actions.
The majority of previous studies on crash severity have overlooked highway user or driver behavior, highlighting the need to address drivers’ attitudes and reduce violations at HRGCs [8]. The novelty of this study lies in its emphasis on highway user actions as the primary determinant of crash severity, an aspect that has received limited attention in the existing literature. This contribution is further strengthened by a state-level comparative analysis across six geographically diverse states representing both high- and low-frequency crash environments. Using a decade of Federal Railroad Administration crash records, this study provides the first systematic behavioral analysis of crash severity at this geographic scale. Various factors including temperature, train speed, user age, year of incident, gender, and highway user actions are evaluated using multinomial logistic regression. A multinomial logistic regression model is developed to evaluate the effect of various crash factors on crash severity. This model is chosen because its structure and classified output align well with the nature of crash severity, which includes three outcome categories: “no injury”, “non-fatal injury”, and “fatal injury”. The results reveal that highway user action is the most important contributor among all key factors influencing crash severity. The findings will inform policymakers, transportation agencies, and other stakeholders in developing more effective regulations, safer infrastructure design, and targeted safety programs.
The rest of the paper is organized as follows. The literature review presents the theoretical background and identifies research gaps related to highway user actions and crash severity at highway–rail grade crossings. The methodology section describes the analytical framework and model selection rationale. This is followed by the data section, which introduces the study dataset and summarizes the variables used in the analysis. The results section presents the key findings, highlighting the influence of highway user behavior and other contributing factors on crash severity. Finally, the conclusion summarizes the main outcomes of the study and discusses their practical and policy implications.
2. Literature Review
2.1. Risk Factors at HRGCs
Studies on highway–rail grade crossing safety have evolved significantly over several decades. Early studies established critical factors influencing collision risk. For instance, Edwin H. Farr (1987) [9] identified traffic volume, train frequency, and crossing protection type as primary contributors to HRGC crashes. In 1997, Gitelman & Hakkert [10] expanded the risk assessment framework by incorporating environmental variables such as visibility conditions and roadway geometry. In the early 2000s, a study analyzed accident frequency and severity at HRGCs, revealing that time of day, vehicle and train speed, driver age, road geometry, traffic volume, and weather conditions significantly contributed to collision occurrence [11]. This study was further expanded by Hao and Daniel, who found strong associations between injury severity outcomes and variables, including time of day, driver age, and weather conditions [12]. Therefore, HRGC accident trends over time have been thoroughly investigated. Peak collisions were observed during morning hours (6:00–9:00 a.m.), evening hours (4:00–7:00 p.m.), and mid-afternoon periods (12:00–3:00 p.m.) [13]. The observed temporal patterns also align with seasonal trends, as crash rates increase in winter months, likely due to reduce daylight, poor visibility, and harsh weather conditions [1]. Visibility and speed-related factors have also garnered significant attention. Studies show that limited visibility, inclement weather, and vehicle or train speeds exceeding average thresholds substantially increase crash probability [14]. These parameters have also been investigated in the context of infrastructure characteristics, with results indicating that crossing angle [15] and approach gradient further increased crash likelihood under poor visibility conditions [16].
2.2. Vehicle Type and Driver Behavior
Various vehicle categories exhibit distinct risk profiles at HRGCs. Drivers of heavy trucks have a higher risk of fatal crashes because of their longer crossing times [17,18]. Driver fatigue and traffic flow conditions also contribute to fatal truck-involved crashes at HRGCs [19]. The study highlighted how truck scheduling practices and hours-of-service regulations intersect with crossing safety. Furthermore, one study found that aggressive young drivers sustain more severe injuries, particularly during morning peak hours [20]. A more recent study has expanded this understanding by incorporating driver distraction metrics, finding that smartphone use near crossings has become a leading contributor to risk-taking behavior, especially among younger drivers [21].
For pedestrians at HRGCs, poor visibility and inadequate warning systems are the major contributors to injuries in rural areas [22]. Additionally, pedestrian crossing infrastructure, lighting conditions, and train horn audibility collectively influence pedestrian safety outcomes, with vulnerability among elderly pedestrians and those with mobility impairments [23]. Moreover, the physical configuration of crossings also affects risk profiles. For example, studies show that more rail tracks increase vehicle–train collision risk due to extended crossing times [24]. Thus, crossing width, approach gradient, and sight distance triangles are interrelated factors that collectively determine overall risk exposure.
2.3. Safety Countermeasures and Interventions
Traffic controls at HRGCs generally fall into passive and active approaches. Passive countermeasures include pavement signs and road markings positioned upstream, downstream, and within critical zones [25]. Their cost–benefit analysis demonstrated the effectiveness of these relatively inexpensive interventions for low-volume crossings. Numerous studies have shown that active warning systems are superior to other types of warning systems [26]. A study found that devices such as bells, flashing lights, and gates significantly reduce collision rates by alerting road users to approaching trains [27]. This study was expanded by determining relative effectiveness of diverse active warning configurations, revealing that four-quadrant gate systems yielded the highest risk reduction [28]. Stop signs at railroad crossings also contributed to accident reduction, though compliance rates varied significantly by location and traffic volume. Adding audible devices to the crossing gates and flashing lights can reduce the chance of PDO, injury, and fatal crashes by 49%, 52%, and 50%, respectively [29]. It was found that adding retroreflective materials to existing warning devices improved their effectiveness during nighttime and adverse weather conditions without requiring significant infrastructure investment [30]. The latest study integrated the AHP-HI model with the competing risk model, which helps improve safety decision-making and guide targeted infrastructure investments [18].
Beyond conventional warning systems, recent studies have examined signal preemption as a cost-effective alternative to grade separation in urban environments. Microsimulation-based analyses indicate that signal preemption reduces vehicle queue spillback into track areas, lowering the risk of vehicles becoming trapped on the tracks while also reducing traffic delays [31]. These findings support extending preemption implementation beyond the 61 m threshold specified in the MUTCD to intersections influenced by queues from railway level crossings. At the policy and technology levels, federal safety initiatives and emerging tools such as connected vehicle warnings and artificial intelligence-based video analytics have further enhanced driver awareness and real-time violation detection at highway–rail grade crossings [3,32].
Despite existing studies, some U.S. states remain particularly exposed to high numbers of fatal and non-fatal injuries at HRGCs. It is imperative to emphasize the role of user actions and their impact on crash severity. This research addresses a gap by incorporating key factors previously overlooked in severity analysis. While most studies utilize multinomial regression to examine significant factors contributing to HRGC crash severity, this study specifically analyzes distracted behaviors in terms of highway user actions alongside other influencing parameters.
3. Methodology
The authors selected the multinomial logistic regression model over machine learning alternatives due to its ability to provide interpretable results through odds ratios. The model yields odds ratios (Exp(B)), which offer a direct interpretation of how a unit change in an independent variable affects the relative odds of choosing one outcome over a reference category. Additionally, the model allows for the calculation of marginal effects, which shows how a change in a predictor variable influences the predicted probability of each possible outcome. Unlike machine learning models, which often lack transparency and generalizability in small or imbalanced datasets [33], these statistical outputs from multinomial logistic regression make it easier to compare the impact of variables across categories and to communicate findings in a policy-relevant, interpretable manner providing clear understanding to readers how human actions impacts on severity among the actions themselves and among other contributors. MLR offers a reliable, statistically sound approach that aligns with the goals of behavioral safety research focus of this study.
Although crash severity outcomes (PDO, Injury, Fatal Injury) are ordinal in nature, multinomial logistic regression (MLR) was employed to allow flexible estimation of category-specific effects and direct interpretation of odds ratios. Since MLR relies on the independence of irrelevant alternatives (IIA) assumption, the Hausman–McFadden test was conducted for each state-specific model. For all states, the null hypothesis of IIA is not rejected. Exclude fatal χ2 (10) = 0.00, p = 1.000; exclude injury χ2 (10) = 0.00, p = 1.000), indicating no evidence of IIA violation. These results support the suitability of the multinomial framework for the state-level crash severity analyses. Furthermore, MLR assumes a linear relationship between continuous predictors and the log-odds of each outcome category, an assumption that was formally evaluated as described in Table 1.
Table 1.
AIC-based functional form test for continuous predictors across six states.
To examine the functional form sensitivity of continuous predictors, quadratic terms for user age, train speed, and temperature were introduced for each of the six state-level models and model fit was compared using the Akaike Information Criterion (AIC). Across all six states, the linear model consistently produced lower AIC values than the augmented quadratic model, with ΔAIC values ranging from +147.88 (New Jersey) to +570.79 (Texas), as summarized in Table 1. In every case, the quadratic terms did not improve model fit, confirming that the linear functional form is adequate and consistent across all six states. The modest effect sizes observed for temperature and train speed therefore reflect genuine associations rather than model misspecification.
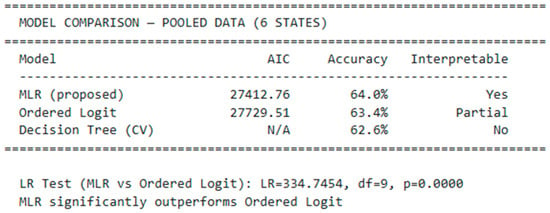
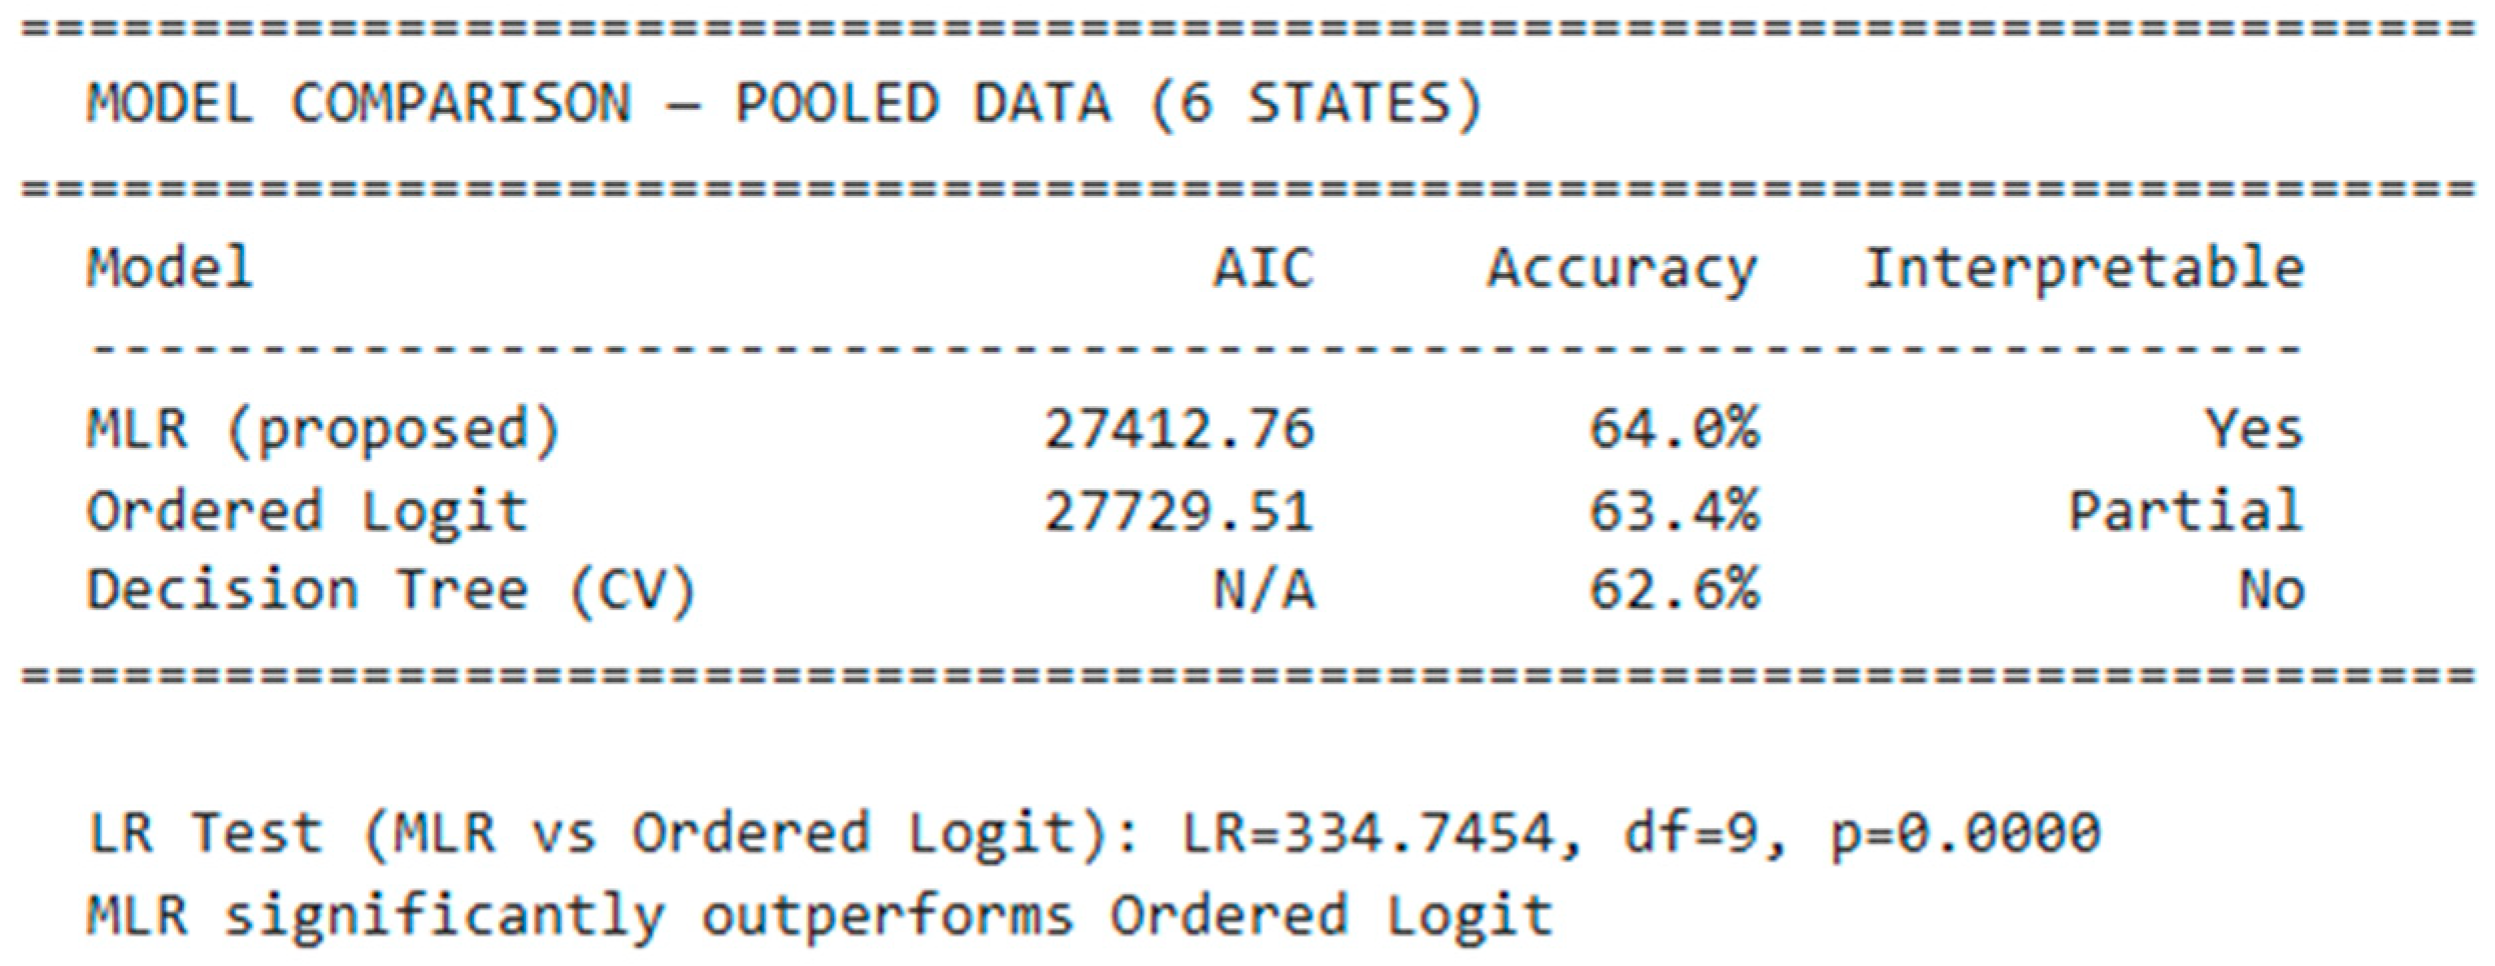
To evaluate model selection, MLR was compared against ordered logistic regression and a decision tree classifier using pooled data across all six states. MLR achieved the lowest AIC (27,412.76) and highest classification accuracy (64.0%), outperforming both ordered logistic regression (AIC = 27,729.51, accuracy = 63.4%) and the decision tree (cross-validated accuracy = 62.6%). The superiority of MLR over ordered logistic regression was further confirmed by a likelihood ratio test (LR = 334.75, df = 9, p < 0.001) shown in Figure 1. While the decision tree is a machine learning alternative, it does not provide the coefficient-level behavioral interpretation required for state-level odds ratios and marginal effects that directly support the policy recommendations of this study. MLR is therefore retained as the primary modeling framework on both statistical and practical grounds.
Figure 1.
Comparative model performance: multinomial logistic regression, ordered logistic regression, and decision tree classifier using pooled data across six states.
MLR is well recognized technique for modeling dependent variables such as crash severity, having three distinct outcomes “property damage only”, “injury”, and “fatal injury”. This method allows a simultaneous inclusion of both continuous (e.g., train speed, temperature, user age) and categorical variables (e.g., gender, highway user actions), making it well-suited for analyzing the combined influence of highway user actions and environmental factors.
To address the proportional severity outcomes, a multinomial logistic regression (MLR) model is proposed to examine the effects of highway user actions along with other key crash factors, including user age, temperature, train speed, gender, and weather conditions.
Multinomial Logistic Regression Model
Considering as the set of contributors and j = 0, 1, and 2 representing crash severity levels of “no injury”, “non-fatal injury”, and “fatal injury”, respectively, the proposed MLR model is given by Equation (1):
where
- Y: The categorical dependent variable representing crash severity.
- X: A vector of contributors.
- : The intercept for outcome j, capturing the baseline log-odds of observing crash severity level j when all independent variables are zero.
- : The regression coefficient for predictor corresponding to outcome j, representing the change in the log-odds of severity level j versus the reference (no injury) per one-unit increase in .
- : The predicted probability of a crash resulting in severity level j given the covariate values.
Note that Equation (1) assumes j = 0 as the reference category.
Odds Ratios
For category j vs. the base category (0), the log-odds is:
Change in log odd when predicator , increases by one unit for outcome j is:
: is the coefficient associated with predictor for outcome j.
Taking the exponential of the coefficient gives the odds ratio, which represents multiplicative change in the odds of outcome j versus outcome 0 when increases by one unit:
Odds ratios provides clear insights into how each predictor impacts the likelihood of various crash outcomes relative to a reference category.
Marginal Effect
The marginal effect on continuous variable on the probability of outcome is
where
The is the coefficient of for category ;
the is the predicted probability of outcome l.
This shows how a small change in shifts the predicted probability of choosing category , accounting for the impact across all outcomes. It shows how different driver actions (highway user actions) are associated with distinct patterns of crash severity outcomes , while controlling for other factors in the model.
4. Data Introduction
The study dataset includes a decade of HRGC crash records from six states from 2013 to 2022. This dataset was compiled by combining the accident/incident data from the Federal Railroad Administration (FRA) database with the vehicle miles traveled (VMT) data from the National Highway Traffic Safety Administration (NHTSA) database. The accident/incident dataset contains HRGC crash records along with accident attributes such as crash severity, environmental conditions, vehicle characteristics, and human actions prior to the accidents. The VMT data are used to calculate grade crossing accident rates. Across the six study states, the dataset comprises 6296 crash records, of which 1061 (16.9%) resulted in fatal injury, 2893 (45.9%) in non-fatal injury, and 2342 (37.2%) in property damage only. State-level fatal injury proportions range from 9.0% in Texas to 29.6% in California, reflecting the naturally imbalanced severity distribution inherent to highway–rail grade crossing crash data. A summary of the study dataset is provided in Table 2.
Table 2.
Summary of dataset sources and key attributes.
In this research, both proportional analysis and (MLR) model analysis were used to determine the relationship between HUAs and crash severity. Such analyses first highlight user attributes that are most frequently associated with severe outcomes, followed by a detailed assessment of certain HUAs which increase the likelihood of injury. The Results section presents detailed findings from both analysis across six U.S. states.
5. Analysis and Results
5.1. Descriptive Statistical Analysis/Proportional Analysis of Highway User Actions
In this study, accident rates are estimated for the top three states and bottom three states regarding their crash frequency (Table 3). According to FRA records, the states with the highest crash frequencies were Texas, California, and Georgia, while Wisconsin, Minnesota, and New Jersey had the lowest crash frequencies, respectively. The accident rate was calculated by dividing the number of a state’s collisions by the mean VMT of that state. The results indicate that Georgia had the highest average accident rate between 2013 and 2022, followed by Texas and Minnesota.
Table 3.
Accident rate (2013–2022).
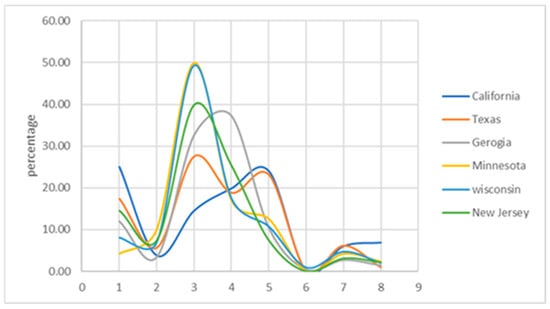
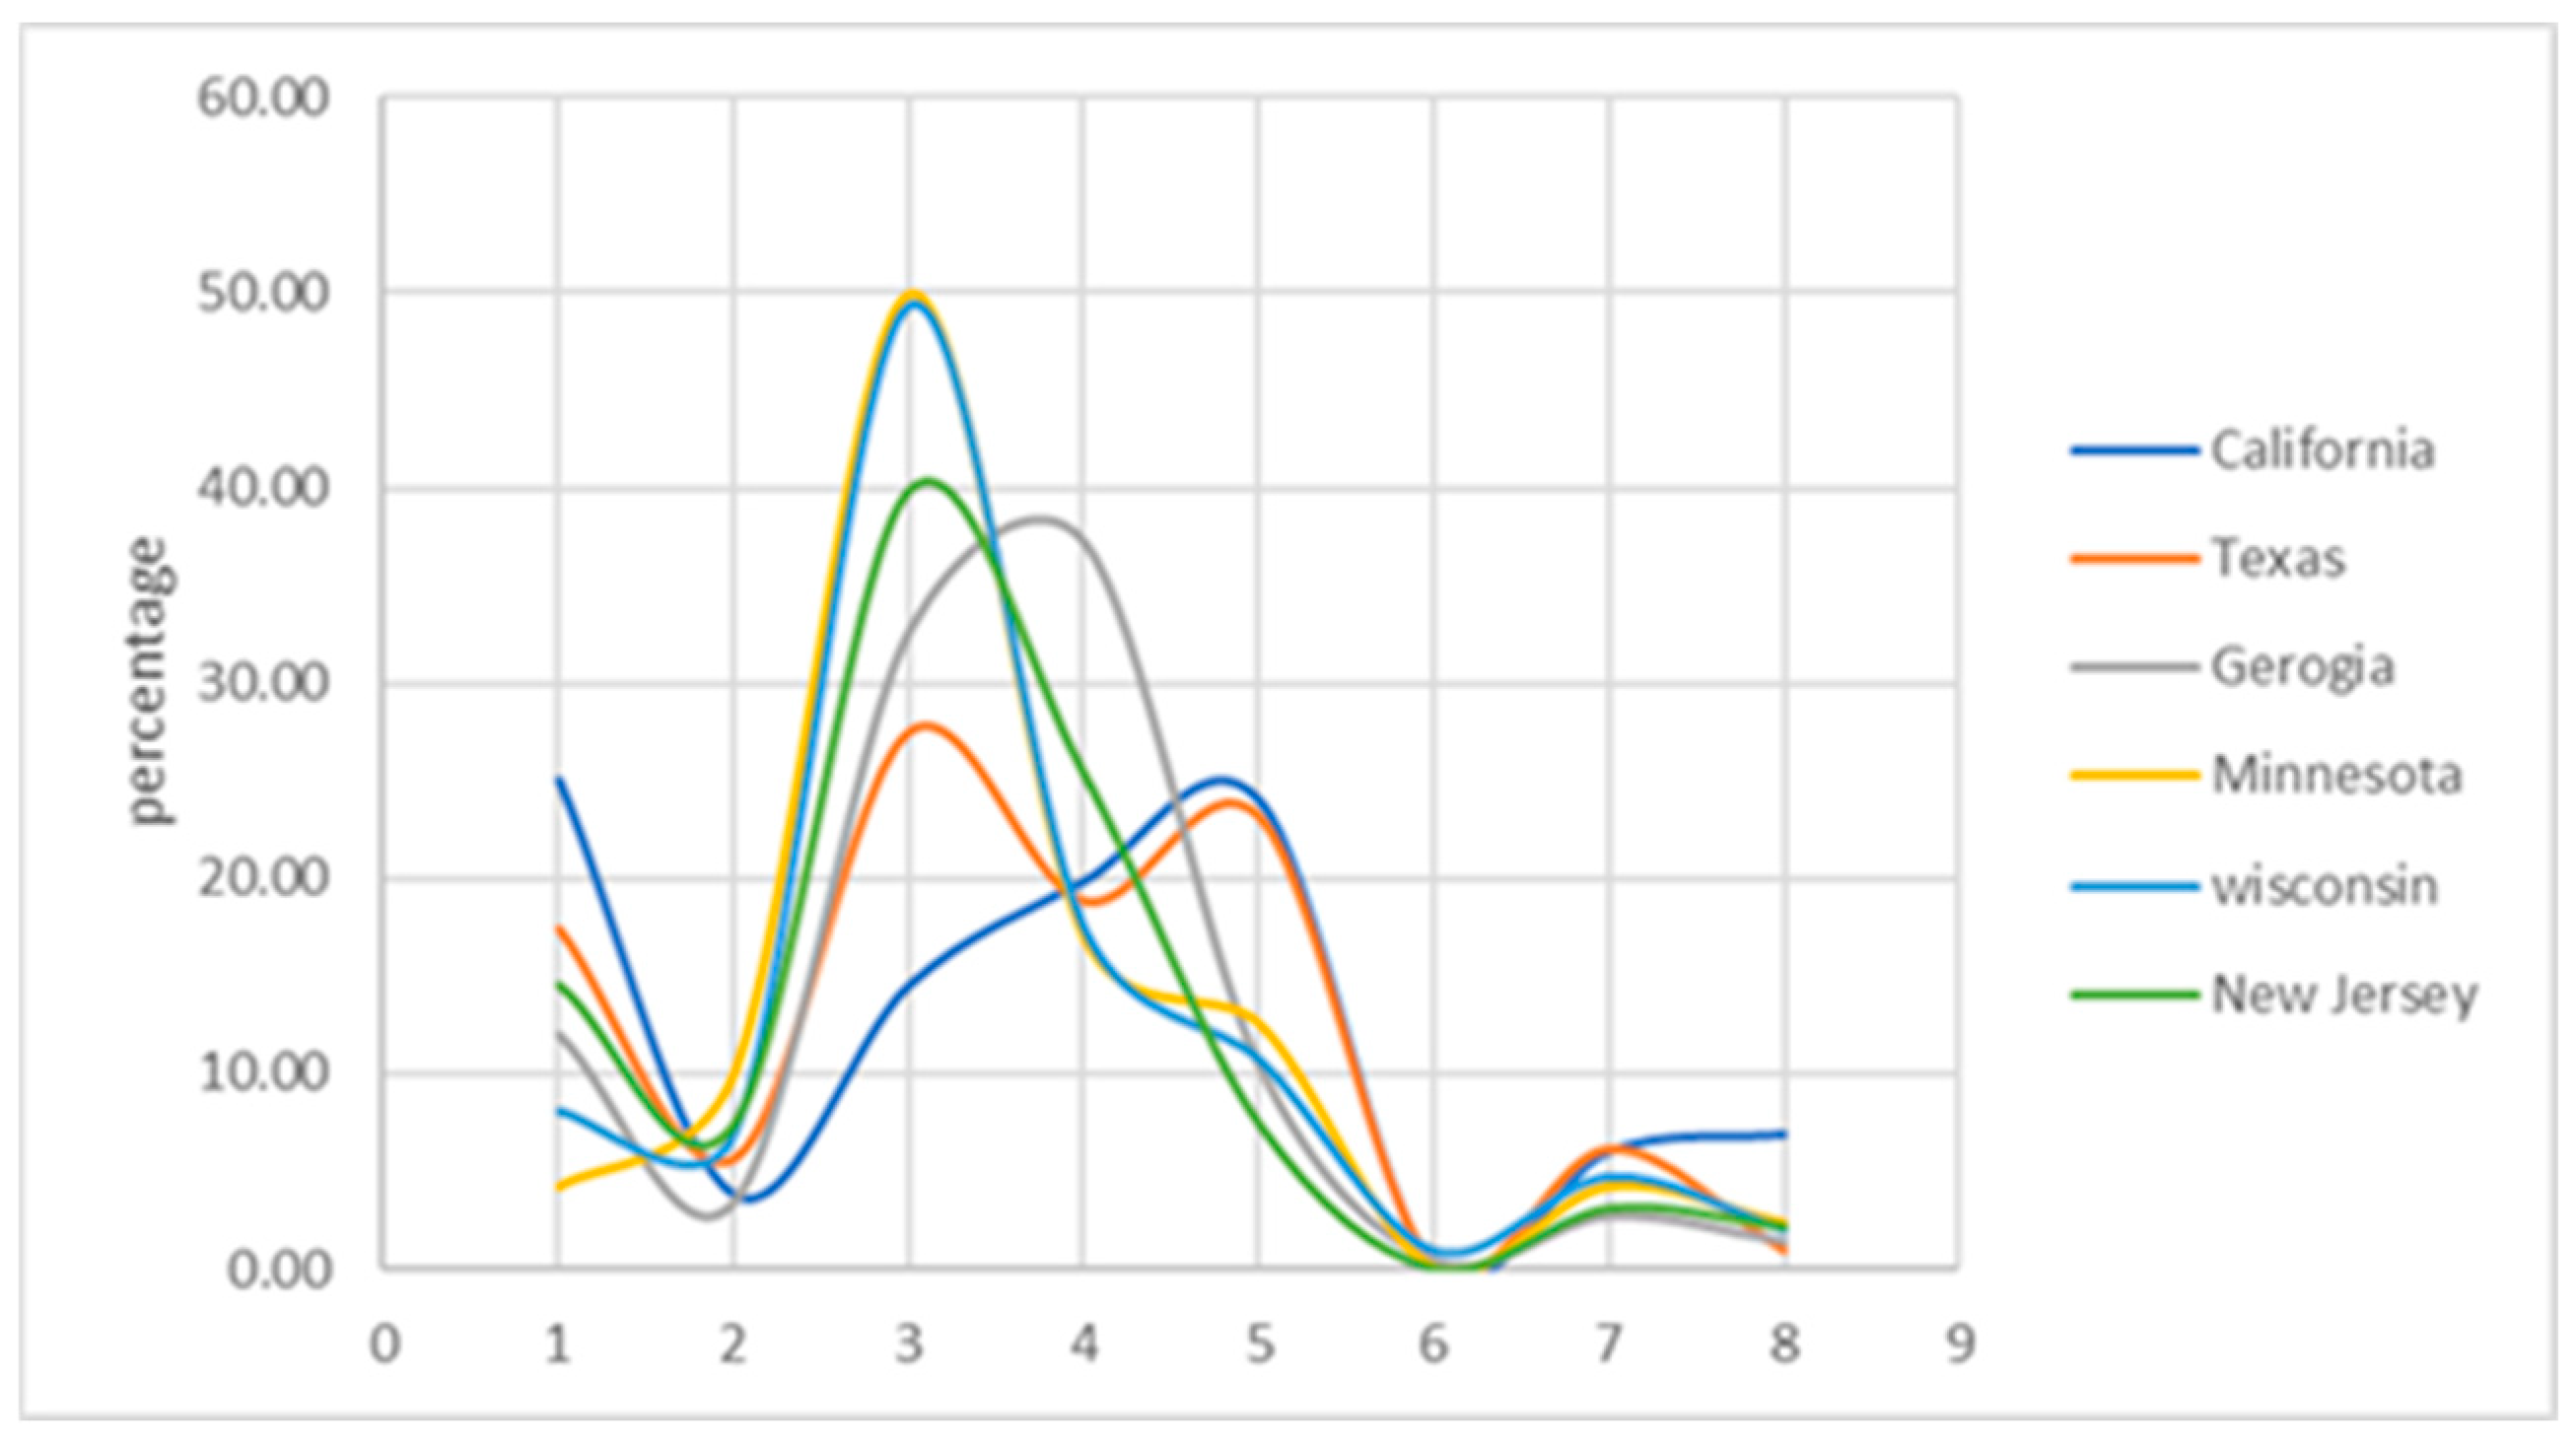
According to the FRA, highway user actions are categorized into eight distinct types, as outlined in Table 4. Among these, Actions 1, 3, and 4 were identified as contributing to a higher number of crashes across the six study states (Figure 2). Actions 1, 3, and 4 reflect various forms of irresponsible actions at HRGCs. Action 1, “Went around the gate”, indicates a blatant disregard for established safety protocols. Action 3, “Did not stop”, highlights negligence and a lack of situational awareness, signaling risky action. Action 4, “Stopped on crossing”, poses an immediate danger by obstructing the crossing and increasing the likelihood of accidents [19].
Table 4.
Highway user action at HRGCs.
Figure 2.
Number of collision and highway user actions (2013–2022).
Table 5 quantifies the actual crash counts by severity, whereas Table 6 contextualizes these findings as proportional impacts to facilitate state-level comparisons of collision frequency and severity. Table 6 shows that Georgia has the highest impacts from the perspective of collisions, accident rates, and severity from the three road user actions, Actions 1, 3, and 4. The proportions all exceed 80%, followed by the other states. Texas and California recorded lower impacts from the three actions compared with the other four states, but the values remain significantly high. This suggests that these actions are critical in all six states due to their impacts on crash frequency and crash severities. This indicates a constituent relationship between accident rates for Actions 1, 3, and 4 with severity.
Table 5.
Severity distribution for highway user Actions 1, 3, and 4.
Table 6.
Percentage of collision, accident rate, and severity for Actions 1, 3, and 4.
The accident rate for Actions 1, 3, and 4 correlates with the proportion of severity, as the state rankings follow a similar pattern, as shown in Table 7. This confirms that states exhibiting higher irresponsible actions related to Actions 1, 3, and 4 are experiencing greater severity impacts.
Table 7.
State ranking by accident rates and severity.
5.2. Multinomial Logistic Regression Analysis
Table 8 summarizes the significance of various predictors on crash severity outcomes across six states. The variables considered—temperature, train speed, user age, highway user action, year of accident, and gender—reflect factors that can influence human actions at HRGCs. Overall, all factors emerged as influential factors in determining the severity of HRGC crashes.
Table 8.
Model fitting criteria.
Table 9 shows the impact of HUAs on crash severity at HRGCs. Severity levels were classified as “0” (property damage only), “1” (injury), and “2” (fatal injury), with “0” as the reference category. HUA 7 (“Went through the gate”) was selected as the reference category as it represents the most rule-compliant crossing actions, providing a behaviorally meaningful baseline against which all other highway user actions are compared. HUA 6 (Went around/through temporary barricade) was excluded due to negligible frequency across all states, which precludes reliable parameter estimation. HUA 8 (Suicide attempt) was excluded as it represents an intentionally distinct action mechanism not comparable to unintentional traffic violations; its disproportionately high fatality concentration in California further confirms its action distinctiveness from other HUA categories. SPPS is used to do multinomial logistic regression, with regression coefficients represented by B, and the odd ratio marked by Exp(B), indicating how likely a crash outcome changes relative to reference category. A value greater than 1 indicates greater risk, whereas lower values showed reduced risk in comparison to the reference category.
Table 9.
Parameter estimates of a model.
The action of “going around the gate”, HUA 1, is consistently associated with increased odds of higher severity, especially severity 2, with Exp(B) often above 3 across all six states analyzed. Odds ratios for fatal injuries ranged from 3.45 in California to 4.55 in Georgia. The findings suggest that users who engage in this action are over three to four times more likely to be involved in an injury crash compared with those who proceed through the gate legally.
“Stopped and then Proceeded”, HUA 2, show modestly increased odds among all the states. “did not stop”, HUA 3, has mixed odds but tends to show slight increases in odds in severity for all states except for CA. Additionally, the actions of “stopped and then proceeded” and “did not stop” are linked to an increased risk of fatal injury in several states, particularly in Texas, Georgia, and Wisconsin. In contrast, the action of “stopping on the crossing”, HUA 4, and “other”, HUA 5—actions not classified within the eight main action categories—are generally associated with lower risk levels. HUA 4 and HUA 5 often have significantly negative coefficients, especially for severity 1, suggesting reduced risk compared to HUA 7, “went through the gate”, at 0.
Another notable finding is that the coefficient for most predictors is larger in terms of absolute values for severity 2 compared with severity 1, suggesting stronger associations for severity 2. Overall, the actions of “going around the gate” and “not stopping” consistently pose the greatest danger, underscoring the need for targeted safety interventions and stricter enforcement at highway–rail grade crossings.
For other contributors, the models result also reveal interesting findings. Temperature and train speed both have positive coefficients across all states and severity levels, suggesting higher temperature and speed are associated with increased severity likelihood. Relative smaller Exp(B) values, around 1, indicate the impact is likely modest but consistent. User age is also positively associated with severity in all models, indicating that older users are slightly more likely to experience higher severity outcomes. Variable year has mostly negative coefficients, meaning more recent years are associated with lower severity for most states. However, TX and NJ for fatal injury show positive association. Being female is associated with a higher risk of severity in all states and models; odds ratios range from about 1.3 to 2, indicating a moderate effect.
Table 10 presents a qualitative comparative summary of odds ratio magnitudes across states and severity levels. All reported values are statistically significant at p < 0.05, as established in Table 9. It illustrates that injury risk based on gender indicates that females are more affected than males, with the highest impact observed in Texas and Minnesota across both severities 1 and 2. HUA “1” was strongly associated with increased fatal injury risk in Georgia, New Jersey, and Texas, while California and Georgia showed higher susceptibility to non-fatal injuries. HUA “3” also posed a major fatal injury risk in Texas and Georgia, with milder non-fatal injury risk in Georgia and California. Higher train speed and older age slightly increase the risk for both severities 1 and 2, while the impact of high temperature was negligible across all states.
Table 10.
Comparative risk assessment by severity and state-level predictors.
In multinomial logistic regression, marginal effects represent the predicted probabilities of each outcome (J = 0, 1, and 2) for different levels of the predictor variable, such as highway user action. Table 11 illustrates how the likelihood of each outcome changes when a specific highway user action occurs, while keeping all other variables in the model constant. RStudio 4.50 was used to evaluate marginal effects; such analysis reveals substantial state-level variations in how identical highway user actions (HUAs) translate to different crash severity probabilities. HUA 1 shows a dramatic geographic difference in fatal injury probability, observed at 0.43 in Minnesota and 0.42 in California versus only 0.08 in Texas and 0.11 in Georgia. This indicates that the same driving action carries significantly different risks depending on state context. For HUA 4, marginal effects consistently favor property damage-only (PDO) outcomes across all states (0.67–0.85), suggesting this action has a similar safety profile regardless of location.
Table 11.
Marginal effects of highway user actions on crash severity probabilities by state.
State-specific differences in marginal effects have an imperative implication for safety policies, as they assist in evaluating HUA that are strongly linked to severe crash outcomes in each state. For instance, California and Minnesota should prioritize addressing HUA 1 due to its high fatality risk, while Wisconsin may focus on reducing non-fatal injuries linked to the same action. New Jersey’s low fatality rates for certain HUAs suggest practices that could benefit other states.
The marginal effects reported in Table 11 are computed at the means of all continuous predictors (marginal effects at the means, MEM) and represent conditional predicted probabilities for each severity outcome given a specific HUA, not unconditional population-level fatal rates. It is imperative to address the varying risk factors across states to implement effective safety strategies at highway–rail grade crossings. Table 12 shows scientifically derived countermeasure actions informed by state-level patterns in crash severity and user action.
Table 12.
Countermeasure actions based on state-level risk factor.
This study adopted a two-stage analytical framework to evaluate the relationship between highway user actions (HUAs) and crash severity at HRGCs. The initial phase involved a descriptive analysis, which enabled the identification of states with the highest accident rates and severity outcomes. Georgia, Texas, and Minnesota emerged as high-risk states, with a disproportionate share of fatal and non-fatal injuries linked to three critical HUAs such as “went around the gates” (HUA 1), “did not stop” (HUA 3), and “stopped on crossing” (HUA 4). This ranking revealed a clear pattern of behavioral irresponsibility correlating with increased crash frequency and severity. To validate these findings, a multinomial logistic regression (MLR) model was applied, incorporating predictors such as train speed, temperature, user age, gender, and HUAs. The MLR results confirmed the earlier marginal analysis, with HUA 1 and HUA 3 consistently exhibiting significantly higher odds of severe outcomes, particularly fatal injuries with Exp(B) values exceeding 3.0 in several states. This alignment between descriptive trends and inferential modeling not only strengthens the validity of the identified risk actions but also highlights the critical need for targeted enforcement and public education campaigns focused on these specific user actions.
The human action patterns identified in this study have direct implications for the deployment of intelligent transportation systems at highway–rail grade crossings (HRGCs). AI-based surveillance systems can be strategically designed to target the high-risk actions revealed by the analysis. In particular, deep learning models can be trained to detect “went-around-gate” violations [3], which were associated with the highest odds ratios for fatal injuries. Camera systems installed at crossings enable continuous, real-time monitoring of such prohibited actions, and the consistently high odds ratios for HUA 1 (ranging from 3.45 to 4.55) further justify investment in automated detection technologies. In addition to surveillance, connected vehicle technologies provide complementary safety mechanisms. Vehicle-to-Train (V2T) communication systems can issue warnings to drivers approaching active crossings [34], potentially reducing “did not stop” violations. Moreover, cooperative ITS solutions that integrate GPS and DSRC technologies [4] allow warnings to be delivered directly to in-vehicle interfaces. Overall, the action insights from this study can inform the design, content, and timing of warning messages, thereby enhancing the effectiveness of intelligent safety interventions at HRGCs.
By integrating both proportional insights and statistical validation with emerging intelligent technologies, this study provides a robust framework for prioritizing policy, enforcement, and engineering interventions at HRGCs.
6. Conclusions
This study provides a comprehensive analysis of crash severity at highway–rail grade crossings by focusing on critical user actions and environmental factors influencing collision outcomes. Using data from six U.S. states over a 10-year period, the study identifies three dominant user actions, “going around the gate”, “failing to stop”, and “stopping on the crossing”, as primary contributors to crash severity. The following were the key findings:
- (1)
- HUA “1” (Went around the gate) stands out as a major risk factor, especially for more severe outcomes, with a fatal injury risk three to five times higher compared to reference HUA “7” (Went through the gate). Marginal effects analysis further reveals dramatic state-level variations, with HUA 1 showing a 43% probability of fatal injury in Minnesota versus only 8% in Texas.
- (2)
- HUA “2” (Stopped and then proceeded) and HUA “3” (Did not stop) also increased fatal injury risk, especially in Texas, Georgia, and Wisconsin. Despite high odds ratios, their marginal effects on fatal injury probability remain relatively low in some states (e.g., near 0% for HUA 2 in New Jersey).
- (3)
- HUA “3” was additionally high-risk in Minnesota, with marginal effects showing a 6% probability of fatal injury.
- (4)
- HUA “4” (Stopped on the crossing) demonstrates consistently high marginal effects for property damage only outcomes across all states (67–85%), suggesting this action typically results in less severe crashes regardless of location.
- (5)
- In terms of gender, females were more affected than males.
- (6)
- Higher train speed and older age slightly increase the risk factor, in terms of both injury and fatal injury.
- (7)
- Higher temperatures showed minimal influence on severity outcomes.
Moreover, the study underlines the significance of incorporating behavioral insights into risk assessment models for HRGC safety in transportation management. Policy measures, including stricter penalties for crossing violations and increased public safety campaigns, should complement these technological interventions to promote compliance and behavioral change. The findings also suggest that a collaborative approach involving federal agencies, state departments, and private rail operators is essential for deploying effective countermeasures and ensuring a safer multimodal transportation network.
This study has certain limitations that offer opportunities for future research. First, the analysis relies on historical crash data, which may not fully capture near-miss incidents or evolving driver actions influenced by emerging technologies such as autonomous vehicles. Second, while the study incorporates key environmental and behavioral variables, other unobserved factors, such as driver distraction, fatigue, or socioeconomic influences, may further explain crash severity variations. Future research should explore the integration of real-time traffic data, machine vision systems, and naturalistic driving studies to enhance the understanding of user action at HRGCs. Expanding the scope to include different geographic regions, such as rural versus urban crossings, can provide a more granular assessment of risk factors. By addressing these gaps, future studies can refine predictive safety models and support the development of next-generation HRGC safety strategies. Additionally, formally testing state-level coefficient differences using pooled models with interaction terms or Wald tests could validate observed geographic heterogeneity. Addressing these gaps will help refine predictive safety models and guide next-generation HRGC safety strategies.
Supplementary Materials
The following supporting information can be downloaded at https://data.transportation.gov/Railroads/Highway-Rail-Grade-Crossing-Incident-Data-Form-57-/7wn6-i5b9/about_data (accessed on 1 January 2026).
Author Contributions
Conceptualization, I.B.; methodology, I.B. and A.K.; formal analysis, I.B., A.A. and A.K.; writing—original draft preparation, I.B.; writing—review and editing, A.A. and P.L.; supervision, P.L. and A.K. All authors have read and agreed to the published version of the manuscript.
Funding
This research received no external funding.
Data Availability Statement
The data used in this study is publicly available from the Federal Railroad Administration (FRA) database online. https://data.transportation.gov/Railroads/Highway-Rail-Grade-Crossing-Incident-Data-Form-57-/7wn6-i5b9/about_data, accessed on 1 January 2026.
Conflicts of Interest
The authors declare no conflicts of interest.
References
- Kutela, B.; Kidando, E.; Kitali, A.E.; Mwende, S.; Langa, N.; Novat, N. Exploring pre-crash gate violations behaviors of drivers at highway-rail grade crossings using a mixed multinomial logit model. Int. J. Inj. Control Saf. Promot. 2022, 29, 226–238. [Google Scholar] [CrossRef] [Scilit]
- Highway-Rail Grade Crossing Accident Data (Form 57). 2024. Available online: https://data.transportation.gov/Railroads/Highway-Rail-Grade-Crossing-Incident-Data-Form-57-/7wn6-i5b9/about_data (accessed on 17 November 2024).
- Zaman, A.; Huang, Z.; Li, W.; Qin, H.; Kang, D.; Liu, X. Artificial Intelligence-Aided Grade Crossing Safety Violation Detection Methodology and a Case Study in New Jersey. Transp. Res. Rec. J. Transp. Res. Board 2023, 2677, 688–706. [Google Scholar] [CrossRef] [Scilit]
- Lu, M. (Ed.) Cooperative Intelligent Transport Systems: Towards High-Level Automated Driving; Institution of Engineering and Technology: Stevenage, UK, 2019. [Google Scholar]
- Badshah, I.; Ali, A.; Lu, P. Risky User Behavior at Highway–Rail Grade Crossings: A Systematic Literature Review with Empirical Insights. Appl. Sci. 2025, 15, 12021. [Google Scholar] [CrossRef] [Scilit]
- Operation LifeSaver. Highway-Rail Grade Crossing Collisions—Top 25 States. Available online: https://oli.org/about-us (accessed on 15 August 2024).
- Haleem, K.; Gan, A. Contributing factors of crash injury severity at public highway-railroad grade crossings in the U.S. J. Saf. Res. 2015, 53, 23–29. [Google Scholar] [CrossRef] [Scilit]
- Khattak, A.J.; Farooq, M.U.; Farhan, A. Motor Vehicle Drivers’ Knowledge of Safely Traversing Highway-Rail Grade Crossings. Transp. Res. Rec. J. Transp. Res. Board 2024, 2678, 604–621. [Google Scholar] [CrossRef] [Scilit]
- Farr, E.H. Rail-Highway Crossing Resource Allocation Procedure—User’s Guide. 1987. Available online: https://rosap.ntl.bts.gov/view/dot/10496 (accessed on 1 January 2026).
- Gitelman, V.; Hakkert, A.S. The evaluation of road-rail crossing safety with limited accident statistics. Accid. Anal. Prev. 1997, 29, 171–179. [Google Scholar] [CrossRef] [Scilit] [PubMed]
- Oh, J.T. Development of severity models for vehicle accident injuries for signalized intersections in rural areas. KSCE J. Civ. Eng. 2006, 10, 219–225. [Google Scholar] [CrossRef] [Scilit]
- Hao, W.; Daniel, J. Motor vehicle driver injury severity study under various traffic control at highway-rail grade crossings in the United States. J. Saf. Res. 2014, 51, 41–48. [Google Scholar] [CrossRef] [Scilit]
- Liu, J.; Bartnik, B.; Richards, S.H.; Khattak, A.J. Driver behavior at highway–rail grade crossings with passive traffic controls: A driving simulator study. J. Transp. Saf. Secur. 2016, 8, 37–55. [Google Scholar] [CrossRef] [Scilit]
- Li, Z.; Li, Y.; Liu, P.; Wang, W.; Xu, C. Development of a variable speed limit strategy to reduce secondary collision risks during inclement weathers. Accid. Anal. Prev. 2014, 72, 134–145. [Google Scholar] [CrossRef] [Scilit]
- Keramati, A.; Lu, P.; Tolliver, D.; Wang, X. Geometric effect analysis of highway-rail grade crossing safety performance. Accid. Anal. Prev. 2020, 138, 105470. [Google Scholar] [CrossRef] [Scilit]
- Li, B.; Afkhami, P.; Khayamim, R.; Elmi, Z.; Moses, R.; Sobanjo, J.; Ozguven, E.E.; Dulebenets, M.A. A holistic optimization-based approach for sustainable selection of level crossings for closure with safety, economic, and environmental considerations. Reliab. Eng. Syst. Saf. 2024, 249, 110197. [Google Scholar] [CrossRef] [Scilit]
- Yeh, M.; Multer, J. Driver Behavior at Highway-Railroad Grade Crossings: A Literature Review from 1990–2006; Federal Railroad Administration: Washington, DC, USA, 2008. [Google Scholar] [CrossRef] [Scilit]
- Keramati, A.; Lu, P.; Moatari-Kazerouni, A. Evaluating crash severity at highway-rail grade crossings using an analytic hierarchy process-based hazard index model. Accid. Anal. Prev. 2025, 211, 107918. [Google Scholar] [CrossRef] [Scilit] [PubMed]
- Khan, W.A.; Khattak, A.J. Injury Severity of Truck Drivers in Crashes at Highway-Rail Grade Crossings in the United States. Transp. Res. Rec. J. Transp. Res. Board 2018, 2672, 38–47. [Google Scholar] [CrossRef] [Scilit]
- Khattak, A.; Luo, Z. Pedestrian and Bicyclist Violations at Highway–Rail Grade Crossings. Transp. Res. Rec. J. Transp. Res. Board 2011, 2250, 76–82. [Google Scholar] [CrossRef] [Scilit]
- Memeh, E.; Ali, Y.; Rubio, F.J.; Hancock, C.; Haque, M.M. Gap acceptance behaviour and crash risks of mobile phone distracted young drivers at roundabouts: A random parameters survival model. Accid. Anal. Prev. 2024, 206, 107720. [Google Scholar] [CrossRef] [Scilit]
- Se, C.; Champahom, T.; Laphrom, W.; Jomnonkwao, S.; Ratanavaraha, V. Analysis of factors influencing crash injury severities at highway–rail grade crossings accommodating for unobserved heterogeneity. Front. Built Environ. 2023, 9, 1255762. [Google Scholar] [CrossRef] [Scilit]
- Adlakha, D.; Krishna, M.; Woolrych, R.; Ellis, G. Neighbourhood Supports for Active Ageing in Urban India. Psychol. Dev. Soc. 2020, 32, 254–277. [Google Scholar] [CrossRef] [Scilit]
- Das, S.; Kong, X.; Lavrenz, S.M.; Wu, L.; Jalayer, M. Fatal crashes at highway rail grade crossings: A U.S. based study. Int. J. Transp. Sci. Technol. 2022, 11, 107–117. [Google Scholar] [CrossRef] [Scilit]
- Saccomanno, F.F.; Park, P.Y.-J.; Fu, L. Estimating countermeasure effects for reducing collisions at highway–railway grade crossings. Accid. Anal. Prev. 2007, 39, 406–416. [Google Scholar] [CrossRef] [Scilit]
- Keramati, A.; Lu, P.; Ren, Y.; Tolliver, D.; Ai, C. Investigating the effectiveness of safety countermeasures at highway-rail at-grade crossings using a competing risk model. J. Saf. Res. 2021, 78, 251–261. [Google Scholar] [CrossRef] [Scilit]
- Raub, R.A. Examination of Highway-Rail Grade Crossing Collisions Over 10 Years in Seven Midwestern States. 2006. Available online: https://www.proquest.com/scholarly-journals/examination-highway-rail-grade-crossing/docview/224885660/se-2 (accessed on 1 January 2026).
- Ogden, B.D.; Kimley-Horn and Associates, Inc.; Chelsey Cooper, Kimley-Horn and Associates, Inc. Highway-Rail Crossing Handbook, 3rd ed.; Federal Railroad Administration: Washington, DC, USA, 2025. Available online: https://railroads.dot.gov/elibrary/highway-rail-crossing-handbook-3rd-edition (accessed on 1 January 2026).
- Keramati, A.; Lu, P.; Iranitalab, A.; Pan, D.; Huang, Y. A crash severity analysis at highway-rail grade crossings: The random survival forest method. Accid. Anal. Prev. 2020, 144, 105683. [Google Scholar] [CrossRef] [Scilit] [PubMed]
- Zhang, F.; Xie, Y.; Zhao, X.; He, Y.; Pei, J.; Xing, Y.; Wang, S.; Zhang, J. Aluminate Long Afterglow Luminescent Materials in Road Marking Field Research Progress and Development: A Review. Buildings 2024, 14, 2152. [Google Scholar] [CrossRef] [Scilit]
- Anagnostopoulos, A. Assessing Safety and Infrastructure Design at Railway Level Crossings Through Microsimulation Analysis. Future Transp. 2025, 5, 24. [Google Scholar] [CrossRef] [Scilit]
- Abdelkader, G.; Elgazzar, K.; Khamis, A. Connected Vehicles: Technology Review, State of the Art, Challenges and Opportunities. Sensors 2021, 21, 7712. [Google Scholar] [CrossRef] [Scilit]
- Jui, T.D.; Rivas, P. Fairness issues, current approaches, and challenges in machine learning models. Int. J. Mach. Learn. Cybern. 2024, 15, 3095–3125. [Google Scholar] [CrossRef] [Scilit]
- Choi, J.; Marojevic, V.; Sharma, A.; Zewede, B.; Nealy, R.; Anderson, C.R.; Withers, J.; Dietrich, C.B. Measurement and Configuration of DSRC Radios for Vehicle-to-Train (V2T) Safety-Critical Communications. IEEE Wirel. Commun. Lett. 2018, 7, 428–431. [Google Scholar] [CrossRef] [Scilit]

Disclaimer/Publisher’s Note: The statements, opinions and data contained in all publications are solely those of the individual author(s) and contributor(s) and not of MDPI and/or the editor(s). MDPI and/or the editor(s) disclaim responsibility for any injury to people or property resulting from any ideas, methods, instructions or products referred to in the content. |
© 2026 by the authors. Licensee MDPI, Basel, Switzerland. This article is an open access article distributed under the terms and conditions of the Creative Commons Attribution (CC BY) license.