Article

Effect of Structural Parameters on Pantograph–Catenary Interaction Performance in High-Speed Railways

1
National Engineering Research Center of System Technology for High-Speed Railway and Urban Rail Transit, China Academy of Railway Sciences Corporation Ltd., Beijing 100081, China
2
School of Electrical Engineering, Southwest Jiaotong University, Chengdu 610031, China
3
Sichuan Development International Commercial Spaceport Co., Ltd., Chengdu 610000, China
*
Author to whom correspondence should be addressed.
Infrastructures 2026, 11(3), 88; https://doi.org/10.3390/infrastructures11030088
Submission received: 6 February 2026 / Revised: 28 February 2026 / Accepted: 5 March 2026 / Published: 9 March 2026
(This article belongs to the Special Issue Smart Transportation Infrastructure: Optimization and Development)

Abstract

With the rapid development of high-speed railways, the dynamic performance of the pantograph–catenary system plays a crucial role in ensuring the safe and stable operation of trains. This study investigates the effect of the structural parameters of the pantograph–catenary system to achieve good dynamic interaction performance under high-speed conditions. A finite element model of the catenary system, incorporating nonlinear cable and truss elements, and a lumped mass model of the pantograph are developed. The penalty function method is employed to simulate the pantograph–catenary interaction. A total of 2187 dynamic simulations are performed, with seven variables—pantograph parameters, span length, contact wire tension, messenger wire tension, number of droppers, stitch wire length, and stitch wire tension. The comprehensive effect of these parameters is evaluated based on dynamic performance indicators, such as pantograph–catenary contact force, pantograph head lift, and support point lift. The results indicate that increasing the number of droppers, contact wire tension, and messenger wire tension enhances dynamic performance, while an increase in span length negatively affects performance. Stitch wire tension has little to no effect.

1. Introduction

The pantograph–catenary system enables power transmission through dynamic contact, with its structural design ensuring a stable power supply to meet the efficiency requirements of high-speed train traction [1,2,3]. As a key component of the high-speed railway’s alternating current electrification network, the reliability of the pantograph–catenary system directly impacts the train’s operational performance [4,5,6].
China’s high-speed railway network, covering 45,000 km, is the largest and most developed in the world. Some of these lines are designed for speeds up to 380 km/h. However, the high-speed pantograph–catenary system still faces challenges, such as unstable current collection, arcing, and excessive wear, due to the complex external environment during high-speed operation [7,8]. Identifying the key parameters of the pantograph–catenary system that affect current collection quality is essential for optimization and adjustment [9,10].
The dynamic performance of the pantograph–catenary system is paramount for ensuring stable current collection in high-speed railway operations. This performance is inherently governed by a complex interplay of multiple parameters—such as pantograph characteristics (mass, stiffness, damping, and static uplift force), catenary design (span length, contact wire and messenger wire tensions, dropper number and spacing, pre-sag, and structure height), and even contact wire irregularity [11]. Critically, these parameters interact in highly nonlinear ways [12,13], suggesting that the system’s behavior cannot be fully understood by examining parameters in isolation. Early research efforts naturally focused on elucidating the influence of individual parameters to establish foundational understanding. For instance, studies by Pombo et al. [14] and Zhou et al. [15] primarily investigated the effects of specific pantograph components (head mass/stiffness, frame damping, and static uplift force) on contact force and collector uplift using numerical simulation approaches. Similarly, investigations into catenary parameters often employed univariate analysis, such as examining the impact of dropper spacing [16], pre-sag [17], contact wire tension/pre-tension [18,19], or structure height and span [12], through simulations or targeted experiments. While these studies provided valuable insights into the role of singular factors, they inherently fell short of capturing the coupled dynamics arising from simultaneous variations in multiple parameters. Recognizing this limitation, subsequent research began exploring the combined effects of parameter subsets or proposing optimization strategies for specific configure ations. Cho et al. [17] integrated pre-sag considerations with dynamic interaction analysis, validated by field tests. Wu et al. [20] presented a multi-parameter co-optimization scheme for dual-strip pantographs across speeds, demonstrating performance gains. Wang et al. [21] analyzed mass distribution effects within a multi-body pantograph model. Furthermore, the influence of contact wire irregularity, a critical excitation source, was investigated through simulations and experiments [18,19], leading to proposals for modeling its power spectral density [22]. This shift toward considering parameter interactions marked significant progress; however, these studies often remained confined to specific pantograph types and limited parameter combinations, or they addressed coupling effects indirectly through optimization rather than explicit sensitivity and coupling mechanism analysis. Consequently, despite the substantial body of work on individual parameters and emerging efforts on specific combinations, a systematic investigation into the global coupling effects and relative sensitivities of the comprehensive set of key system design parameters is still notably absent. The complex, nonlinear interdependencies highlighted initially [12,13] demand methodologies capable of holistically evaluating how simultaneous variations across pantograph and catenary parameters collectively drive system dynamics [23]. As operational speeds continue to escalate, this gap becomes increasingly critical, rendering traditional single-parameter or narrowly scoped multi-parameter design criteria potentially inadequate. There is thus a pressing need for more robust frameworks capable of precise dynamic performance evaluation and optimization that explicitly account for the full spectrum of parameter interactions.
This study conducts multivariable dynamic simulations of the pantograph–catenary system to thoroughly investigate the influence mechanisms and coupling characteristic of structural parameters on dynamic performance. We analyze the trends in dynamic performance across multiple parameters, including pantograph characteristics, span length, contact wire tension, messenger wire tension, stitch wire tension, and the number of droppers. The optimal pantograph–catenary coupling performance for a speed of 350 km/h is also identified. The main contributions of this work are summarized as follows:
(1)
A comprehensive exploration of the global coupling mechanisms among seven critical structural parameters is conducted, transcending the traditional univariate or narrowly scoped multi-parameter analysis paradigms prevalent in the existing literature.
(2)
Through an extensive simulation campaign comprising 2187 independent cases, the nonlinear interdependencies governing pantograph–catenary dynamic behavior at 350 km/h are elucidated.
(3)
The relative sensitivities of these parameters are explicitly quantified, establishing a robust scientific framework for the optimal matching and design of high-speed pantograph–catenary systems.

2. Pantograph–Catenary Finite Element Model

The pantograph–catenary system, consisting of the pantograph mounted on the train’s roof and the overhead catenary, is crucial to the operation of high-speed railways. This section constructs a nonlinear catenary dynamic model using the finite element method. The lumped mass model is used to describe the dynamic characteristics of the pantograph. A dynamic coupling model of the pantograph–catenary system is established.

2.1. Catenary Model

The catenary serves as the medium for transmitting electrical power from the traction substation to the high-speed train [24]. Its structure is complex, consisting of components such as the contact wire, messenger wire, dropper, and steady arm. The catenary model is developed using the finite element method (FEM). Fixed supports are treated as lumped masses, while the contact wires and messenger wires are modeled using nonlinear cable elements that incorporate both axial tension and bending stiffness [25,26]. Unlike the idealized theory of a perfectly flexible cable, this model accounts for the bending resistance of the physical wires, which significantly influences the wave propagation and dynamic contact force at high speeds. The droppers connecting the contact wire and messenger wire are modeled as a nonlinear truss element [27,28]. Considering dropper slackness, these components can only function in traction conditions and exhibit no resistance to compressive forces.
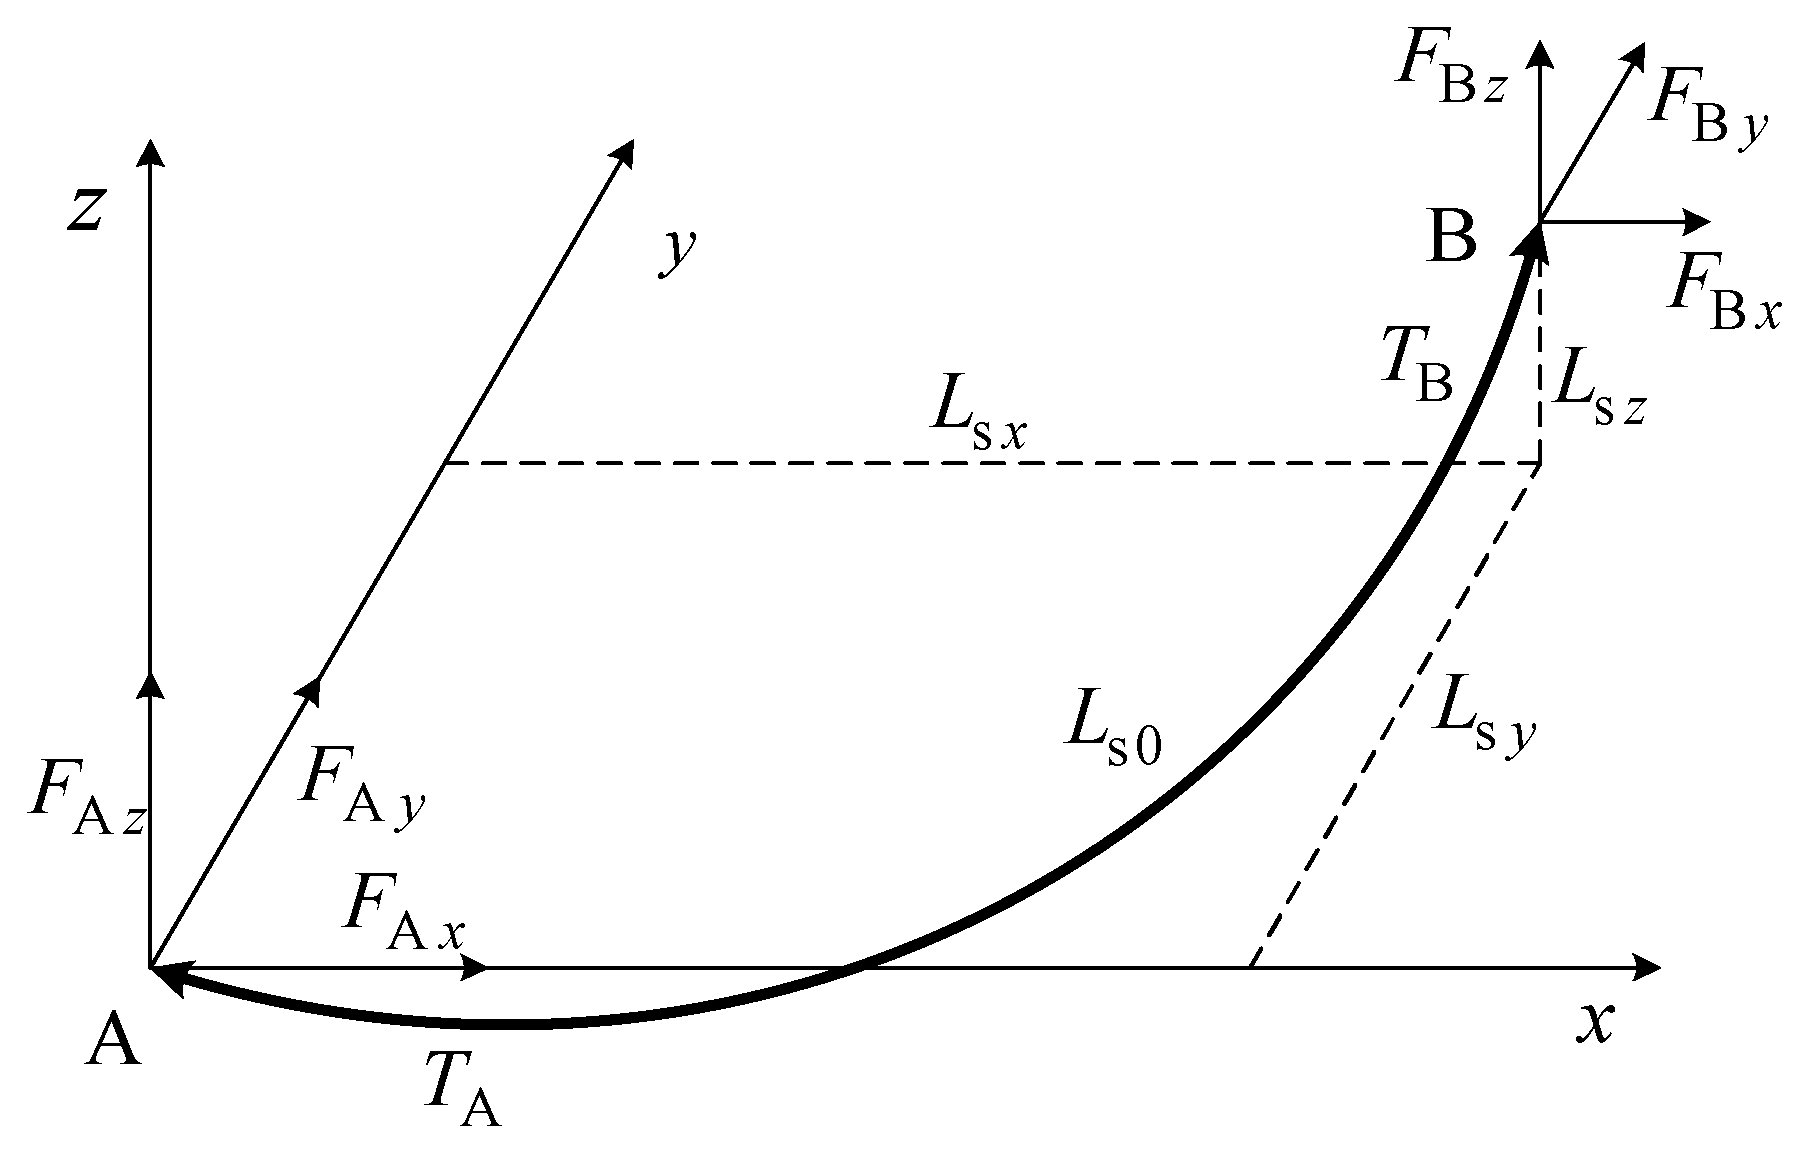
To establish the mechanical equations for the nonlinear messenger wire, the force analysis is conducted on the cable element between points A and B, as shown in Figure 1. The tensions at the two ends of the cable element, denoted as T A and T B , are decomposed along the coordinate axes into components F A x , F A y , and F A z ; and F B x , F B y , and F B z , respectively. The lengths L s x , L s y , and L s z represent the relative distances of the cable element in the x, y, and z directions, while L s 0 represents the initial length of the cable element. The relative distance relationship equation is given by the following:
L s x = F A x L s 0 E A F A x w [ ln ( F B x 2 + F B y 2 + F B z 2 + F B z ) ln ( F A x 2 + F A y 2 + F A z 2 + F A z ) ] L s y = F A y L s 0 E A + F A y w [ ln ( F B x 2 + F B y 2 + F B z 2 + F B z ) ln ( F A x 2 + F A y 2 + F A z 2 + F A z ) ] L s z = F A z L s 0 E A + w L s 0 2 2 E A + 1 w [ F B x 2 + F B y 2 + F B z 2 F A x 2 + F A y 2 + F A z 2 ]
where E , A , and w represent the elastic modulus, cross-sectional area, and self-weight of the cable element, respectively. Based on the mechanical equilibrium, the force relationship at the two ends is obtained as follows:
F A x = F B x F A y = F B y F A z = F B z
Substituting the above equation into Equation (1), the relationship is converted into a function of distance and the force components at point A as follows:
L s x L s y L s x = f 1 ( F A x , F A y , F A z , I s 0 ) f 2 ( F A x , F A y , F A z , L s 0 ) f g ( F A x , F A y , F A z , L s 0 )
Differentiating both ends, we obtain the following:
d L s x d L s y d L s z = f 1 F A x , f 1 F A , y , f 1 F A z f 2 F A x , f 2 F A , y , f 2 F A z f 3 F A x , f 3 F A , y , f 3 F A z d F A z d F A y d F A z + f 1 L s 0 f 2 L s 0 f 3 L s 0 d L s 0
For the differential equations, the solution is obtained by specifying either the initial element length or the initial element tension. When the initial element length is given, the initial component force at endpoint A is derived as follows:
F A x = w L s 0 x 2 τ F A y = w L s 0 y 2 τ F A z = w 2 ( L s 0 L s 0 z cosh τ sinh τ )
where τ is defined as follows:
t = 3 ( L 10 2 L 10 z 2 L 10 x 2 + L 10 y 2 1 ) L s 0 2 > L s 0 x 2 + L s 0 y 2 + L s 0 z 2   0.2 I s 0 2 I s 0 x 2 + I s 0 y 2 + L s 0 z 2   10 6 I s 0 x 2 + I s 0 y 2 = 0
When specifying the initial element tension as the boundary condition, the resulting force component at point A becomes as follows:
F A x = L s x 0 T 0 L s 0 F A y = L s y 0 T 0 L x 0 F A z = L s z 0 T 0 L s 0 L s 0 = L s x 2 + L s y 2 + L s z 2
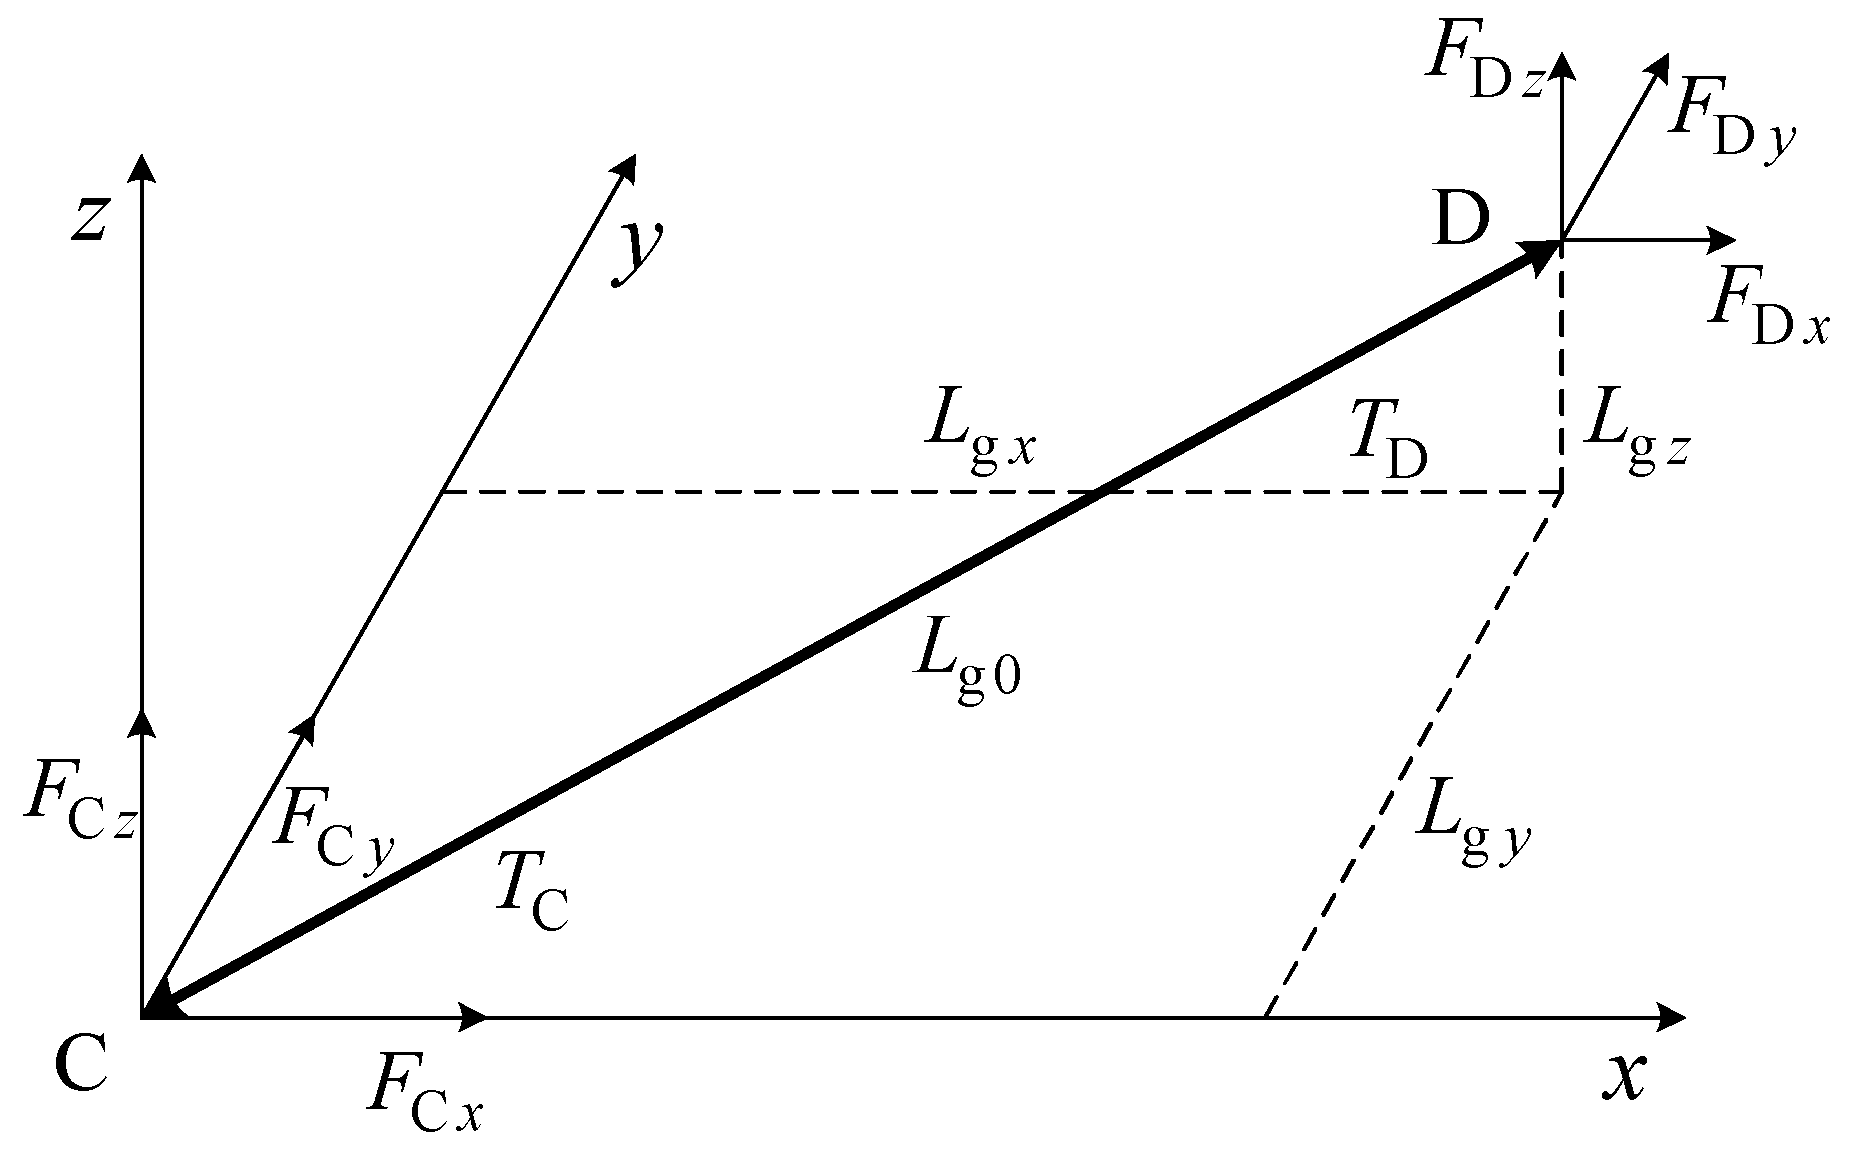
The structure of the nonlinear truss element is shown in Figure 2. Points C and D represent the two ends of the element, while F C x , F C y , F C z , F D x , F D y , and F D z are the force components at the endpoints. L g x , L g y , and L g z represent the relative distances between the two endpoints along each coordinate axis. L g 0 denotes the initial length of the truss element. Therefore, the mechanical relationship of the nonlinear truss element is expressed as follows:
F C x = E g A g ( L g x L g 0 ) I g 0 F C y = E g A g ( L g y L g 0 ) I g 0 F C z = E g A g ( L g z L g 0 ) L g 0
where E g represents the Young’s modulus, and A g is the cross-sectional area of the truss element. When the effective length, L g , is equal to or greater than the initial length, L g 0 , the dropper is in traction state with E g A g equal to a large value. Otherwise, the dropper is in slack state, with the value being 0. The increment relationship of the above equation is obtained as follows:
d F Cx d F Cy d F Cz = F Cx L gx F Cx L gy F Cx L gx F Cy L gz F Cz L gy F Cy L gy F Cz L gx F Cz L gy F Cz L gz d L g z d L g y d L g z + F Cx L gx F Cx L gy F Cz L gz d L g 0
The dynamic equation of the pantograph–catenary finite element model is expressed as follows:
M C X ¨ C + C C X ˙ C + K C X C = F C
where M C , K C , and C C represent the lumped mass, equivalent stiffness, and equivalent damping matrices of the catenary model, respectively. X ¨ C , X ˙ C , and X C represent the acceleration, velocity, and displacement matrices of the nodes in the finite element discretization of the catenary, respectively. F C is the external force matrix acting on the catenary [29]. The initial state of the catenary, including the natural sag of the wires, is determined using a static shape-finding method based on the analytical expressions of the nonlinear cable elements. By considering the self-weight and the target pre-tension, the Newton–Raphson algorithm is employed to iteratively solve the global equilibrium equations.

2.2. Pantograph Model and Pantograph–Catenary Coupling

In pantograph–catenary dynamics, the lumped mass model is the most commonly used model for the pantograph. This model represents various components of the pantograph, such as the pantograph head and frame, as lumped masses, which are coupled via spring forces, frictional forces, and damping. The dynamic parameters, including mass, stiffness, and damping, are determined through vibration testing on a test bench [28].
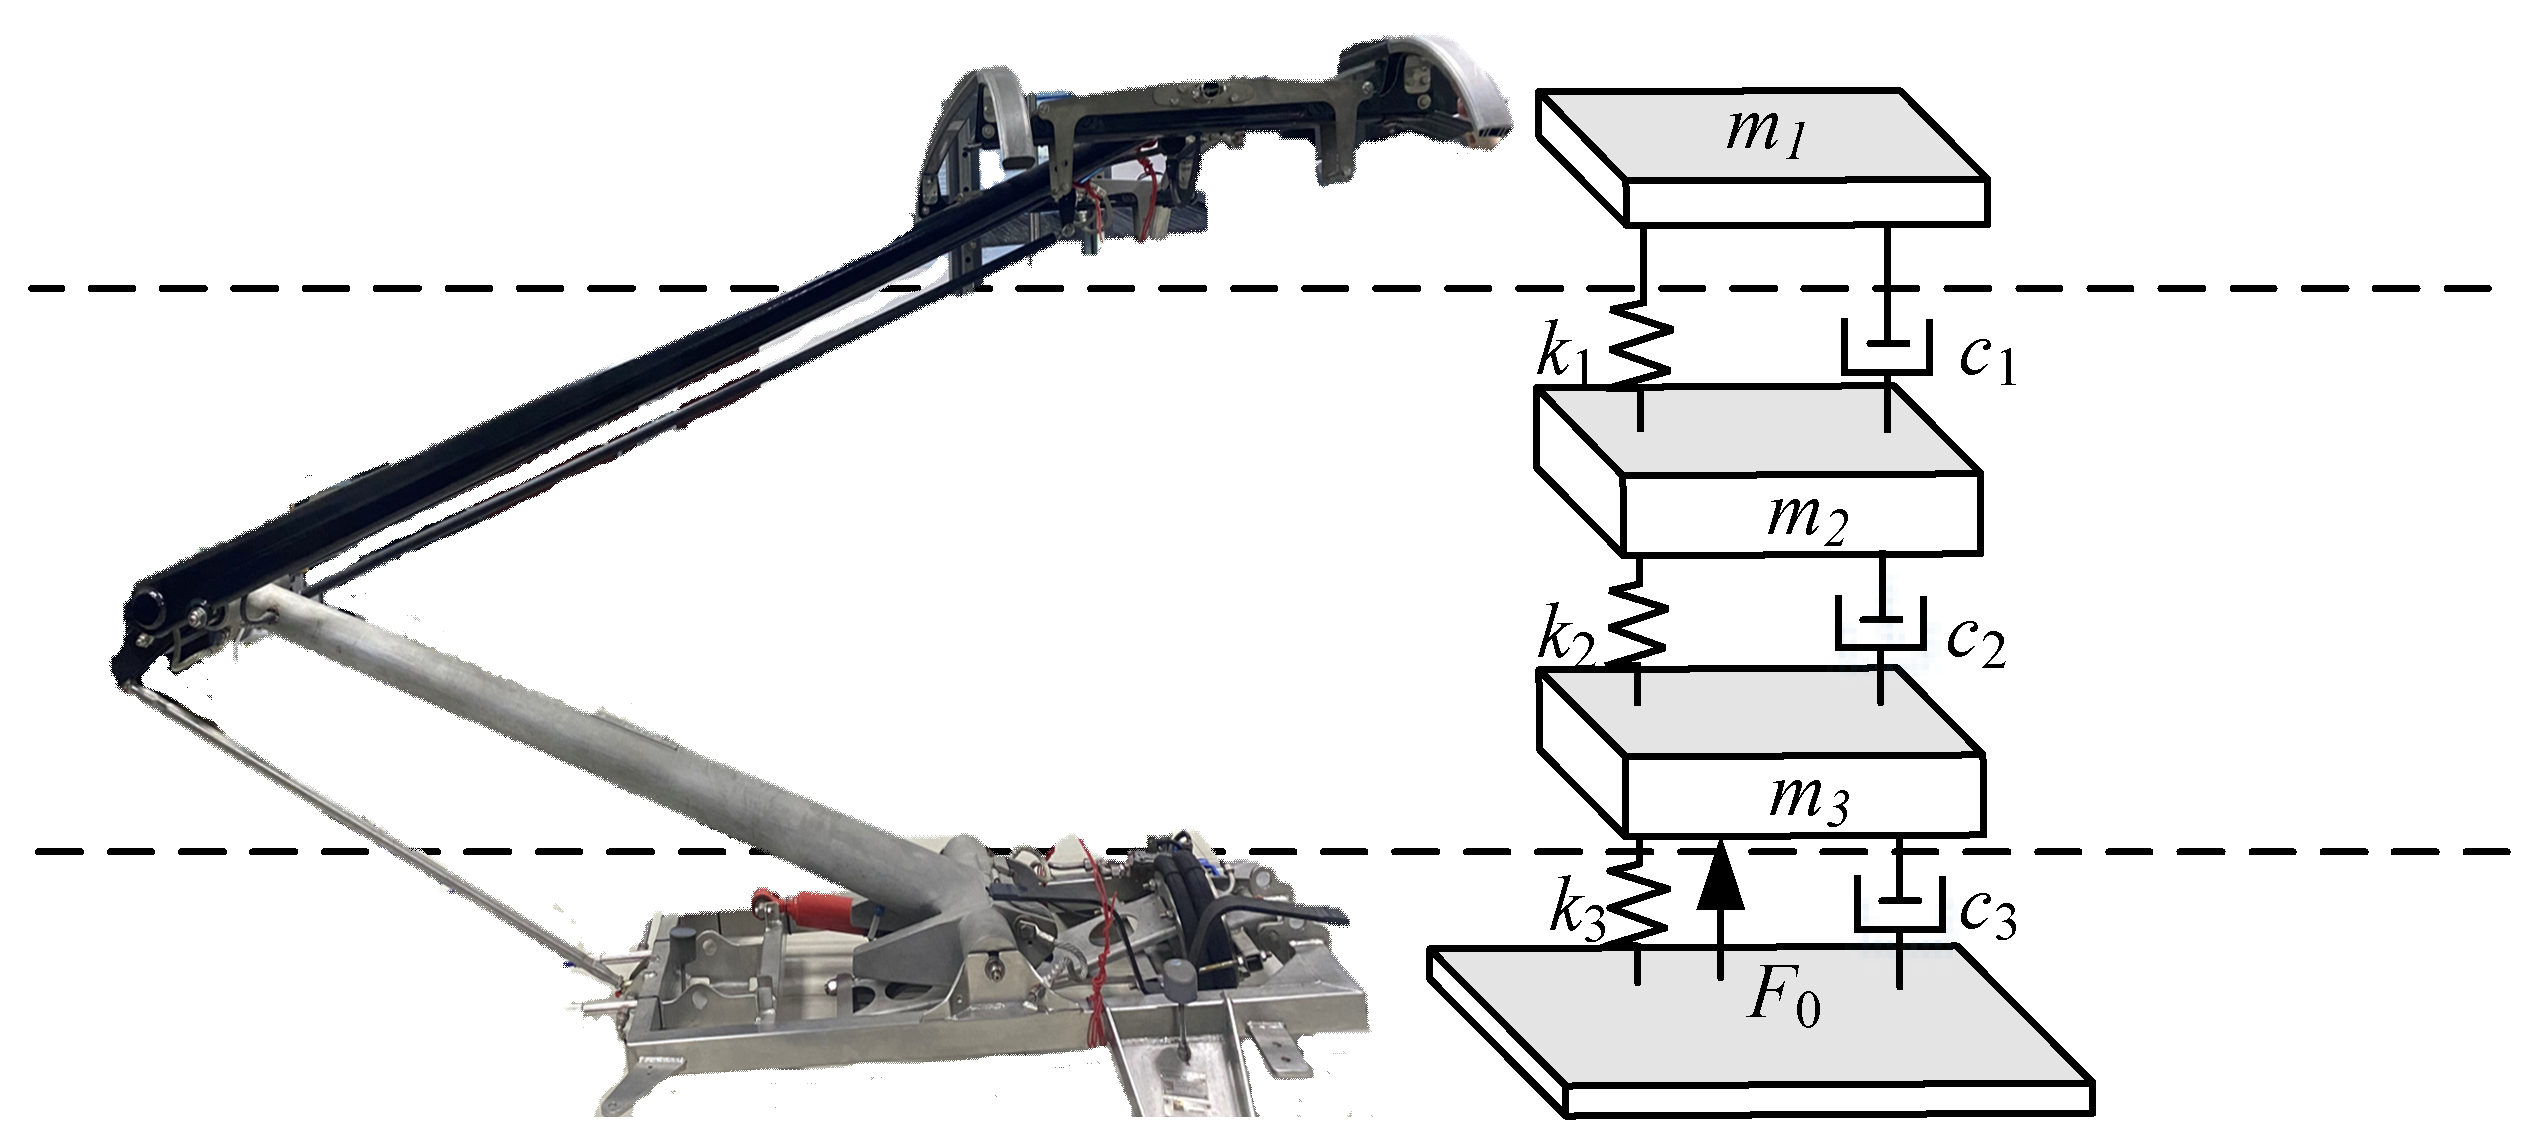
The pantograph model used in this study is a three-mass lumped mass model, which offers higher accuracy compared to the two-mass and single-mass models. The structure is illustrated in Figure 3. The three-mass lumped model simplifies the pantograph dynamics by abstracting inertial properties into three discrete masses (m1, m2, and m3). k1, k2, and k3 represent the equivalent stiffness between the pantograph head, the frame, and the base. Similarly, c1, c2, and c3 represent the equivalent damping between these respective structures. F 0 represents the static lifting force on the pantograph structure generated by airbag pressurization during train operation. Each of the lumped masses is connected by specified stiffness and damping spring elements.
The three-mass lumped mass model of the pantograph can be considered a vertical three-degree-of-freedom (DOF) vibration system, and its dynamic model can be expressed as follows:
m 1 x 1 · · + c 1 ( x 1 · x 2 · ) + k 1 ( x 1 x 2 ) = F c m 2 x 2 · · + c 1 ( x 2 · x 1 · ) + c 2 ( x 2 · x 3 · ) + k 1 ( x 2 x 1 ) + k 2 ( x 2 x 3 ) = 0 m 3 x 3 · · + c 2 ( x 3 · x 2 · ) + c 3 x 3 · + k 2 ( x 3 x 2 ) + k 3 x 3 = F 0
where x 1 · · , x 1 · , and x 1 represent the vertical acceleration, vertical velocity, and vertical displacement of the pantograph head in the pantograph model, respectively. Similarly, x 2 · · , x 2 · , and x 2 represent the vertical acceleration, vertical velocity, and vertical displacement of the upper frame of the pantograph model, while x 3 · · , x 3 · , and x 3 represent the vertical acceleration, vertical velocity, and vertical displacement of the lower frame of the pantograph model. F c represents the contact force between the pantograph and the catenary.
After establishing the finite element model of the catenary system and the dynamic model of the pantograph, it is necessary to couple both models into a pantograph–catenary coupling dynamic model using a contact algorithm [30,31]. In this work, the most widely used penalty function contact algorithm is selected for the coupling computation. By introducing virtual spring elements between the contact and the contacted elements, and assigning a certain contact stiffness to the spring element, it is assumed that under external excitation, the two contacting bodies form a certain relative displacement. This allows the establishment of a relationship between the contact force, contact stiffness, and penetration displacement. The penalty function method can be expressed as follows:
F c = k s ( x 1 x c )     x 1 x c                 0                       x 1 < x c
where x c   represents the vertical displacement of the contact wire at the contact point, and k s is the contact stiffness between the contact wire and the pantograph head, obtained through experiments.

2.3. Model Validation Against Field Measurements

To ensure the accuracy of the proposed finite element model, validation was conducted using field-measured data from the Fuzhou–Xiamen High-Speed Railway. The test section utilized a catenary with a 45 m span length, 30 kN contact wire tension, and 21 kN messenger wire tension, operating at speeds of 350 km/h. Following the validation protocols of EN 50318 [32], the contact force signals were low-pass-filtered at 20 Hz. As shown in Table 1, the comparison between simulated and measured contact force standard deviations shows a deviation of less than 3%, confirming the model’s robustness within the high-tension and short-span design space analyzed in this study.

3. Comprehensive Effect of Pantograph–Catenary Parameters

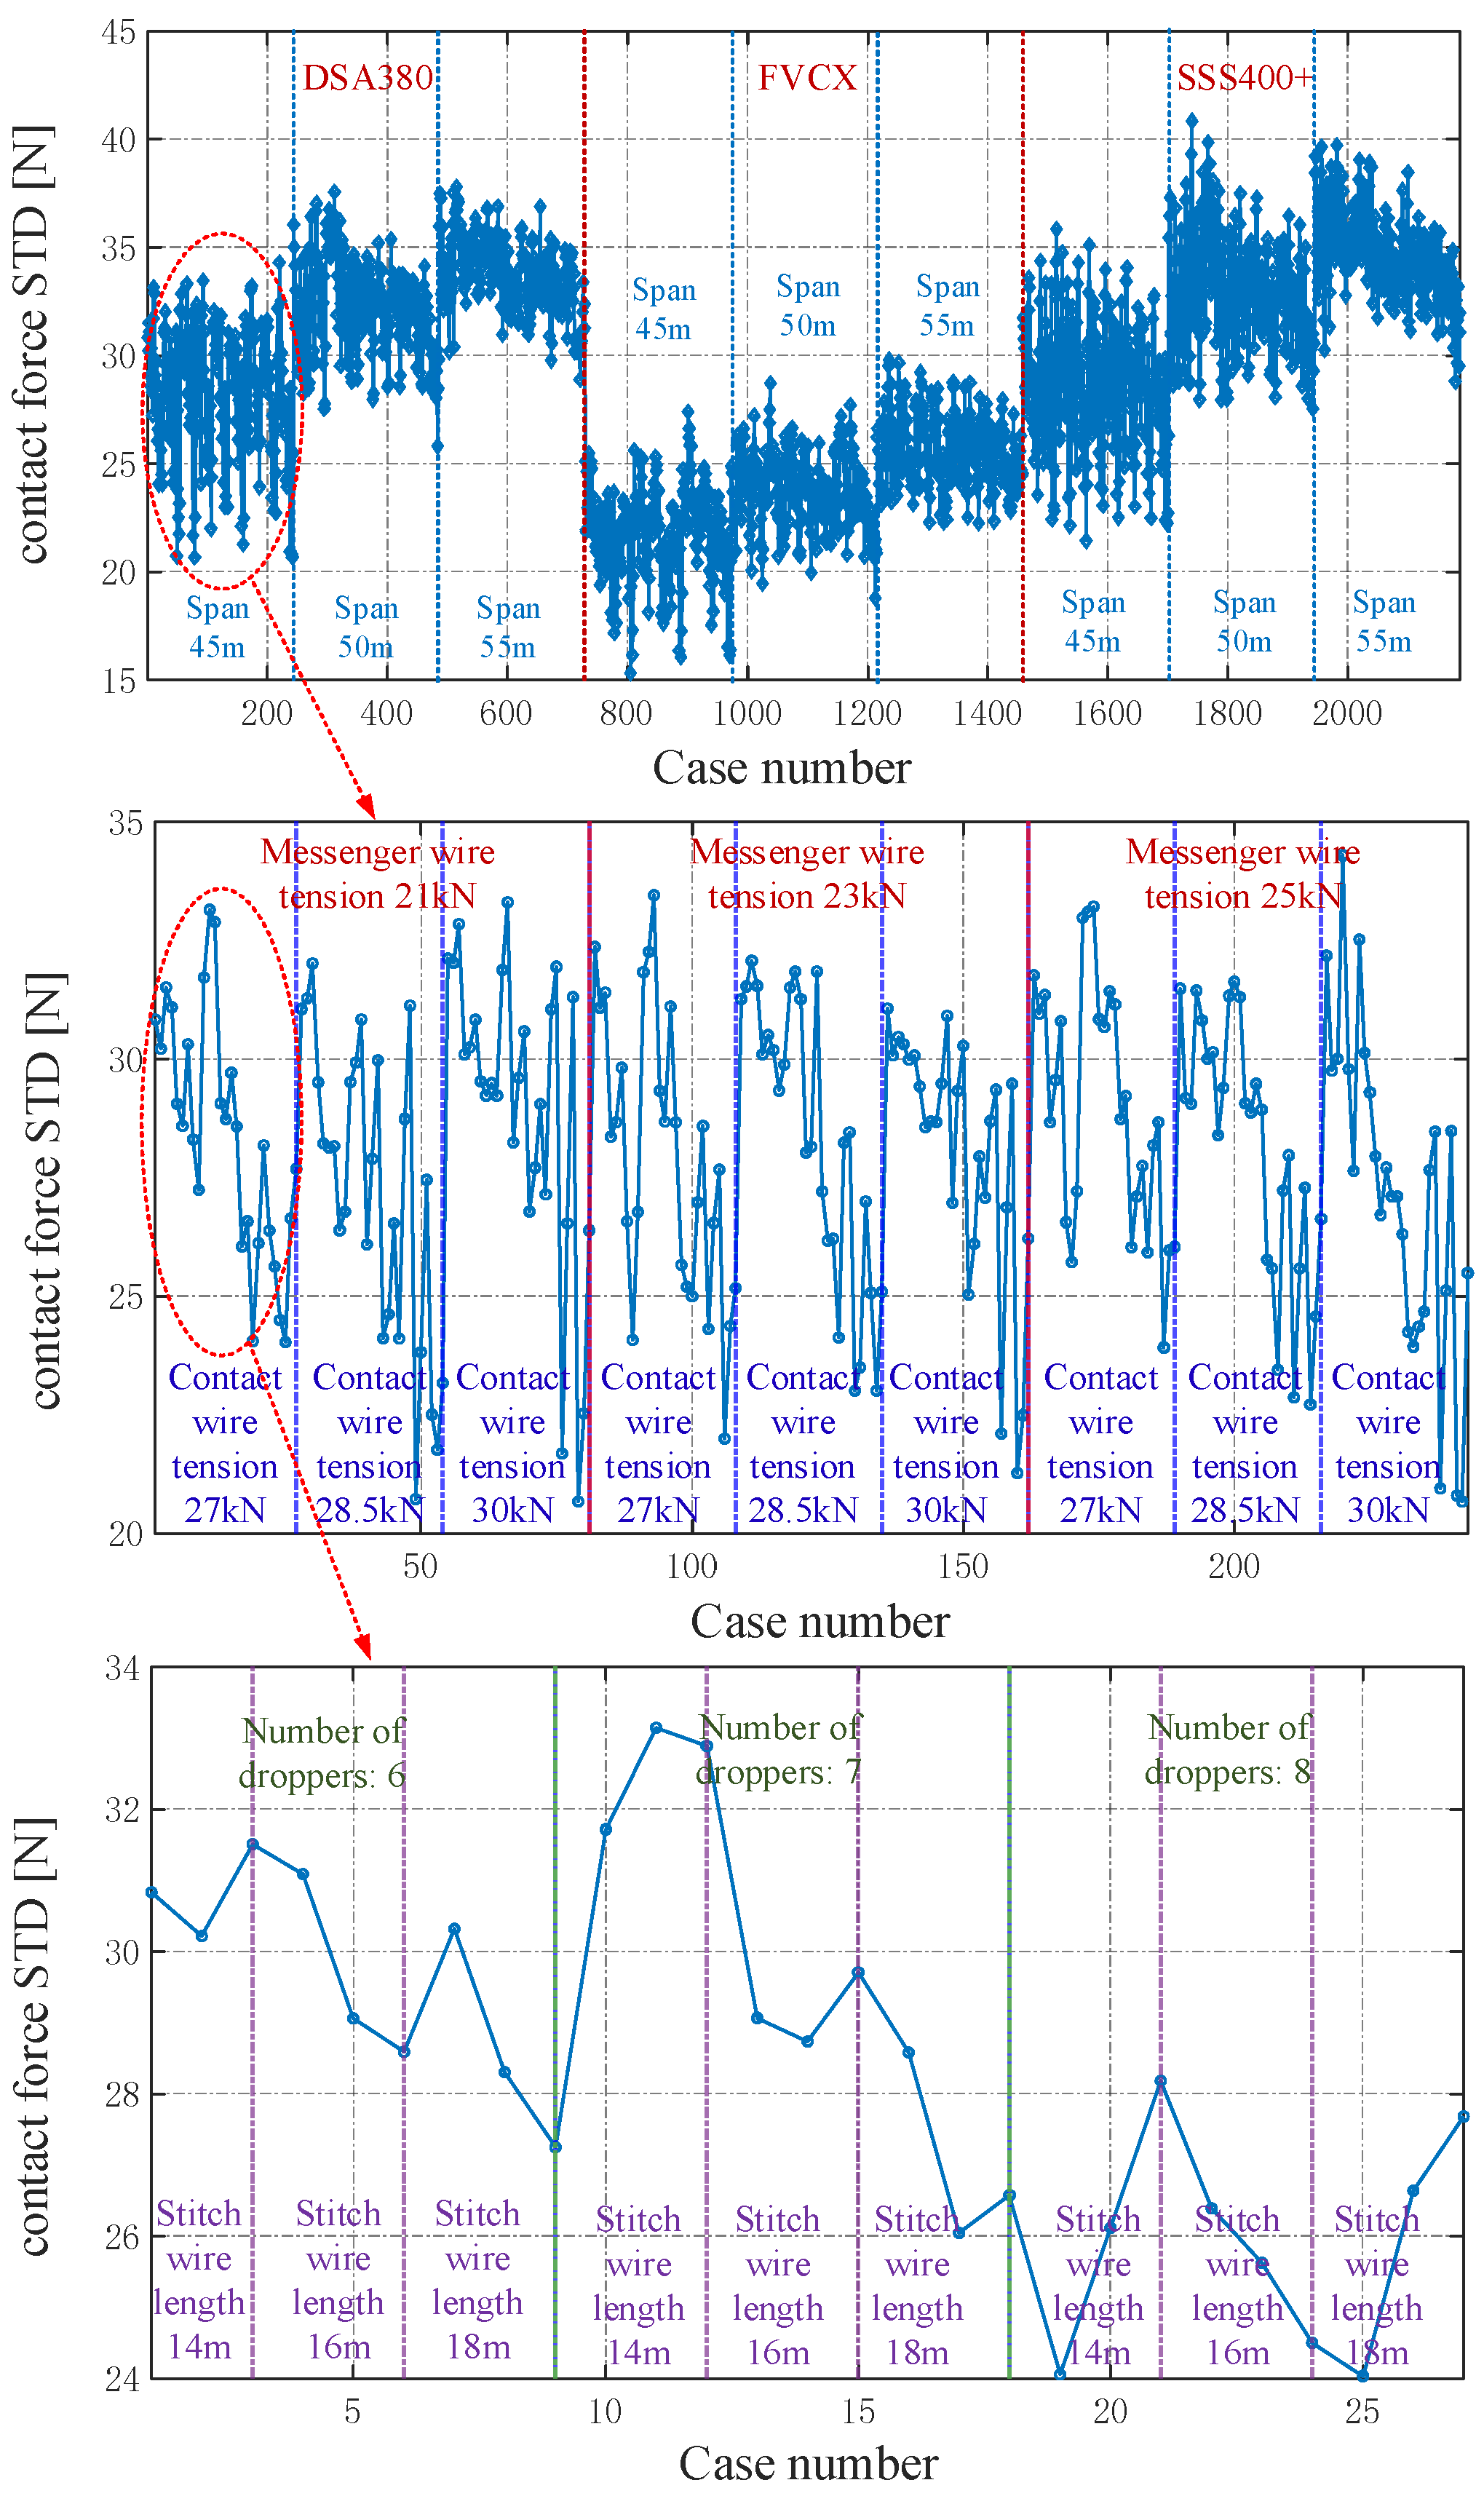
In this section, the comprehensive effect of pantograph–catenary system structural parameters on dynamic performance is explored. Seven system structural parameters are designed as variables: pantograph model, catenary span length, messenger wire tension, contact wire tension, number of droppers, stitch wire length, and stitch wire tension. The values of these parameters are listed in Table 2. These parameters are grouped into pantograph parameters, catenary shape parameters, and catenary tension parameters for analysis. A total of 2187 dynamic performance simulations are conducted at a speed of 350 km/h. Case numbers encode nested parameter variations: pantograph type (every 729 cases)–span length (every 243 cases)–messenger tension (every 81 cases)–contact tension (every 27 cases)–number of droppers (every nine cases)–stitch wire length (every three cases)–stitch wire tension (every one case). According to the European standard EN50367 [33], the standard deviation of the pantograph–catenary contact force is used as the primary evaluation metric for dynamic performance. Additionally, the effects of the system parameters on the maximum and minimum contact forces, maximum pantograph head lift, and maximum lift at the support point are considered. It is noteworthy that, according to EN 50318 [32], the contact force used for analysis is low-pass-filtered within the range of 0–20 Hz.
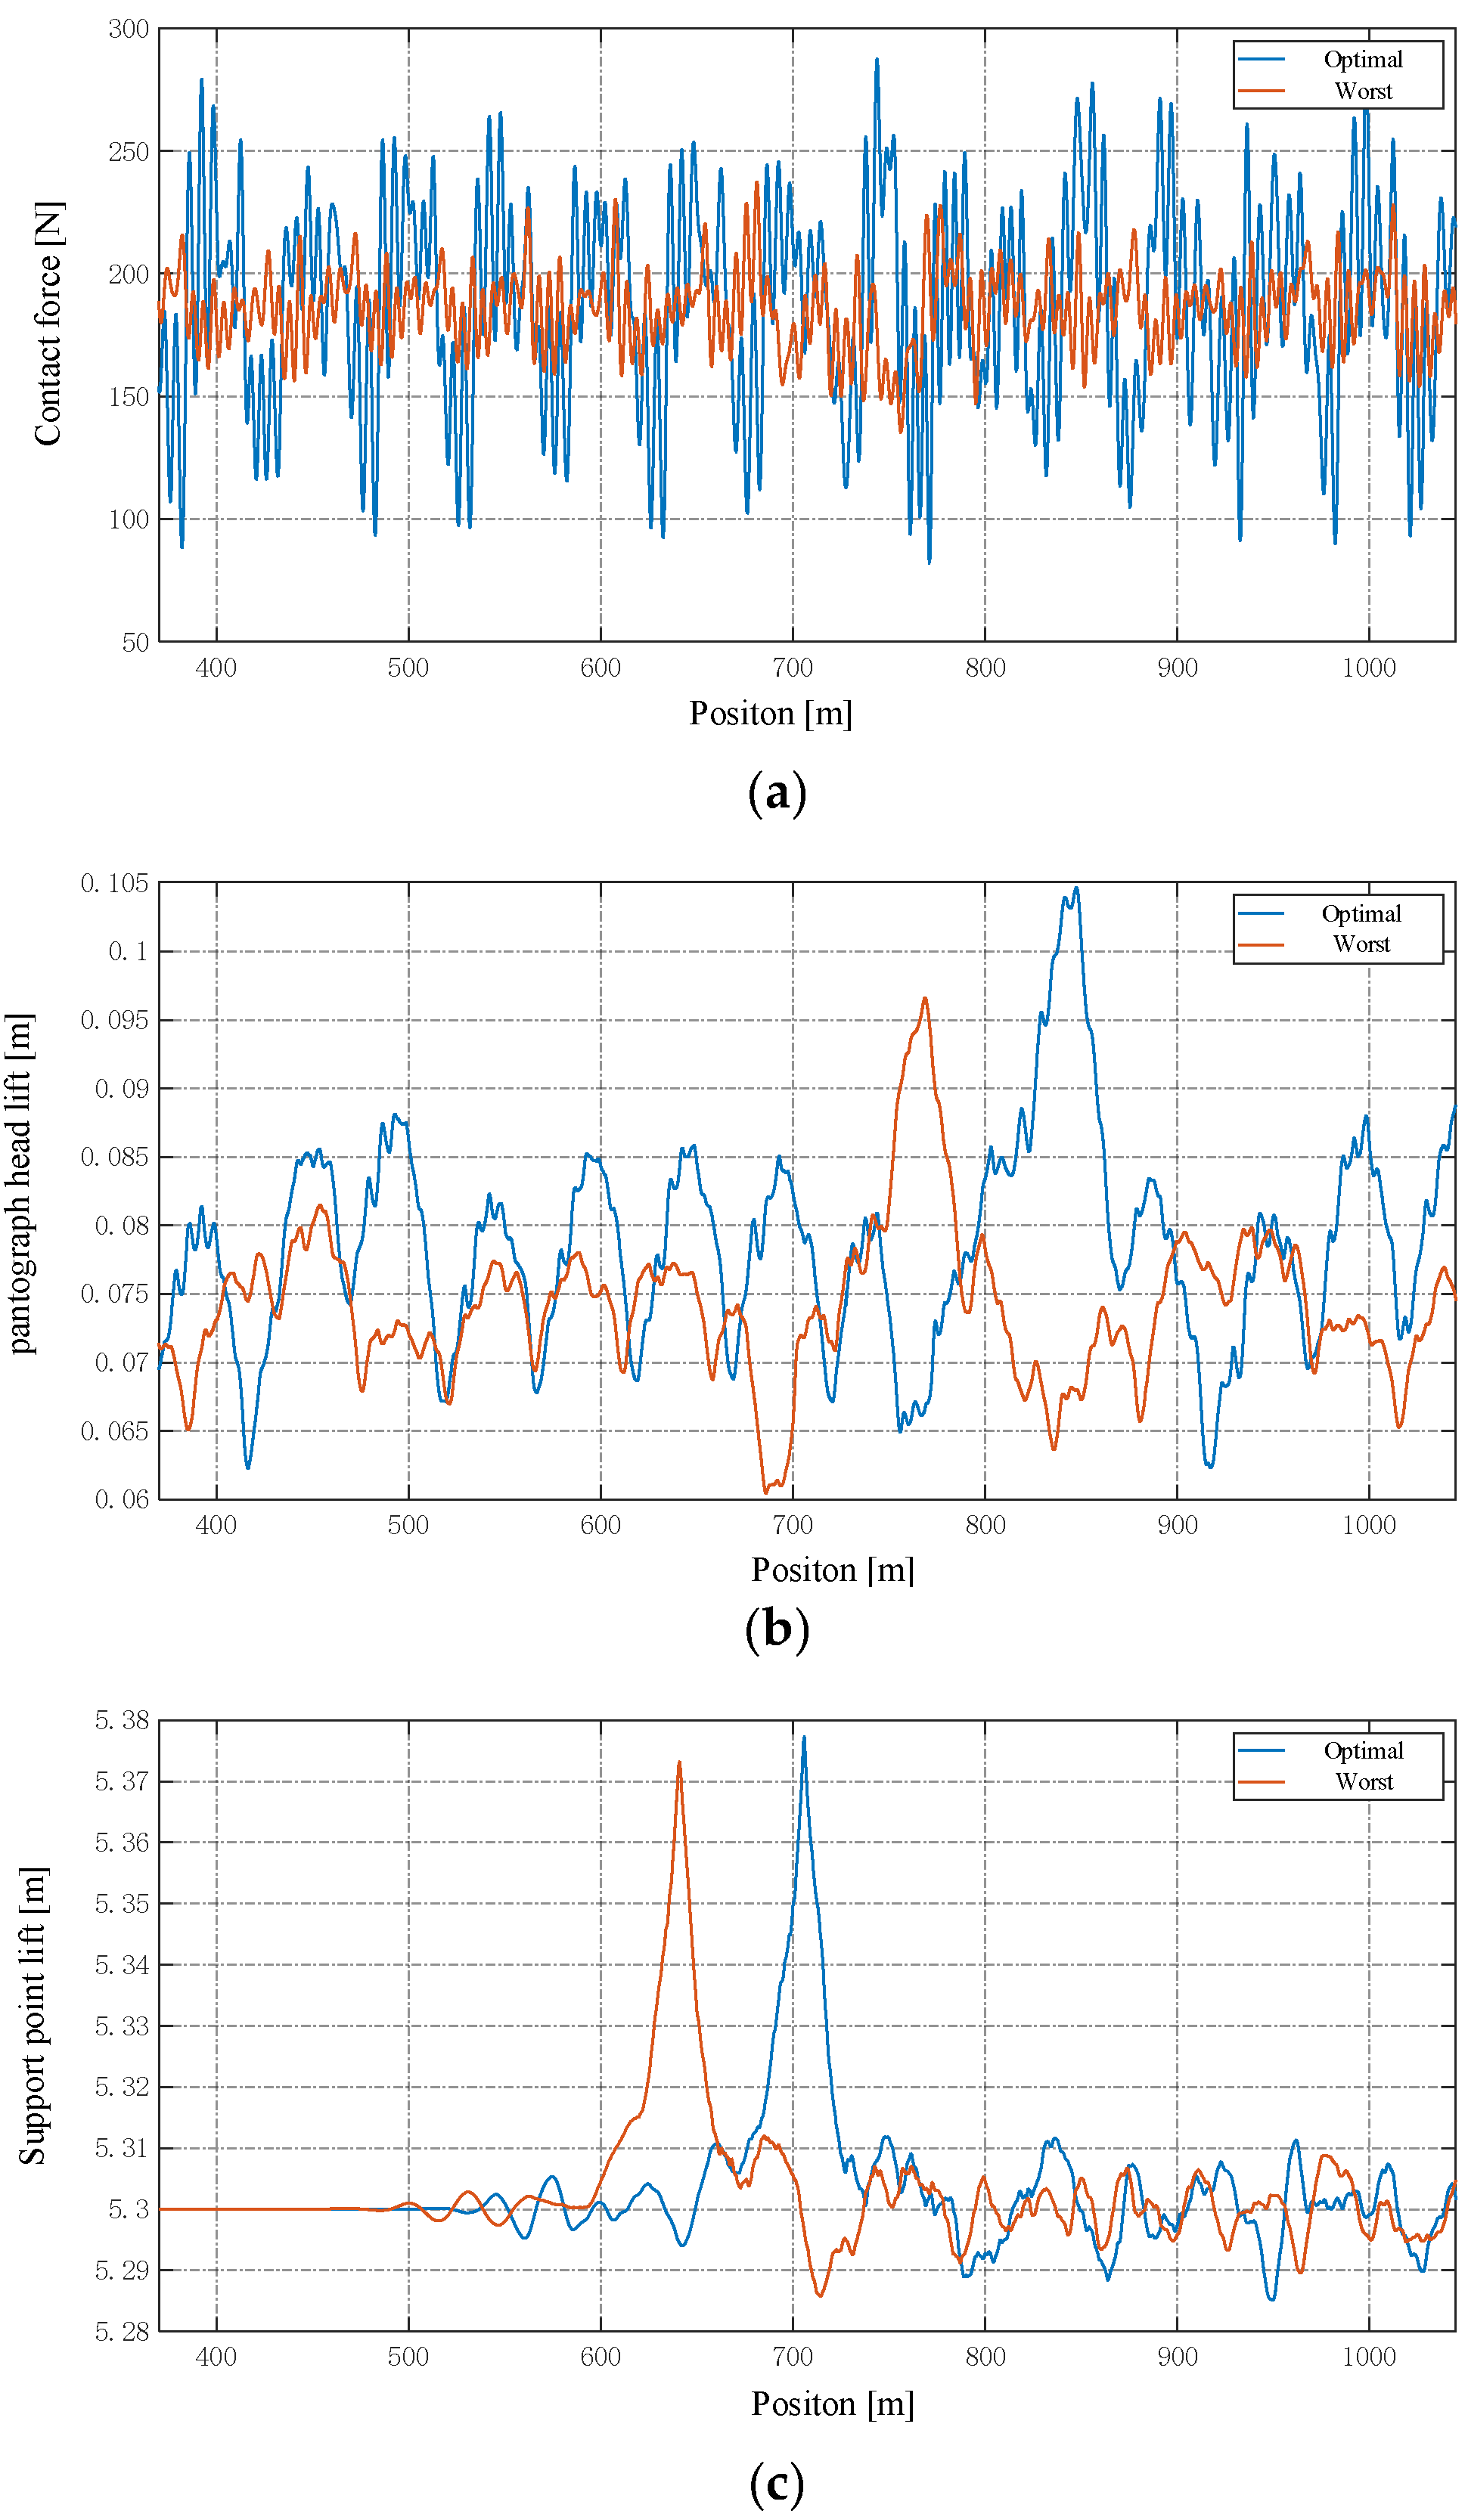
Figure 4 shows the standard deviation of the contact force for all pantograph–catenary parameter cases. Within the simulated parameter combinations, the cases with the highest and lowest contact force standard deviations represent the extremes of dynamic performance observed in our dataset. The corresponding pantograph–catenary parameter cases for these conditions are listed in Table 3. These results demonstrate that distinct pantograph–catenary parameter configurations exert significantly divergent influences on system dynamics. Notably, the structural parameters for both the optimal and worst operating conditions are not always at the boundary values, and even the messenger wire tension remains unchanged. This suggests that the effect of pantograph–catenary system parameters on dynamic performance is not entirely linear, and a specific coupling relationship exists between these parameters. A comparison of key dynamic performance indicators for the optimal and worst operating conditions, including contact force, pantograph head lift (PHL), and support point lift (SPL), is presented in Figure 5. The results clearly demonstrate the significant effect of structural parameters on pantograph–catenary performance. The following sections will explore in detail how different parameters affect the dynamic performance of the pantograph–catenary system.
A full-factorial ANOVA across all catenary parameter combinations (as shown in Table 4) quantitatively identifies span length as the primary structural parameter driving the pantograph–catenary dynamic response within the investigated sampling range, yielding a contribution rate of 40.27%. Statistical analysis further illustrates certain parameter interactions, most notably the coupling between span length and dropper number (4.54% contribution), as well as between contact wire tension and messenger wire tension (3.14% contribution). These interactions elucidate why the optimal configuration (Case 805) does not merely represent a linear superposition of the optimal boundary values for each parameter. Due to nonlinear coupling effects, specific tension matching at certain span lengths yields superior dynamic performance, causing the global optimum to shift away from the linear extrema associated with individual parameters.

4. Effect of Pantograph Parameters

Using the previously described simulation model and parameter settings, the simulation results of three different pantograph models during single pantograph operation at 350 km/h are compared. All pantographs in the simulation are modeled as single-strip pantographs. Three widely used pantographs in high-speed railways are selected as comparative research subjects. The equivalent parameters of their lumped mass models are obtained through bench testing measurements. The equivalent parameters of the three pantograph models are listed in Table 5, where Pantograph 1, Pantograph 2, and Pantograph 3 represent the DSA380, FVCX, and SSS400+, respectively. The analysis section is selected between supports 9 and 30. To better visualize the impact of different pantograph types on pantograph–catenary dynamic performance, we analyzed all metrics using box plots. A box plot is a standardized method for displaying data distribution based on a five-number summary: the minimum, Q min ; first quartile, Q 1 ; median, third quartile, Q 3 ; and maximum, Q max . Typically, the minimum and maximum values are calculated using the following equations [34,35]:
Q max = Q 3 + 1.5 × I Q R
Q min = Q 1 1.5 × I Q R
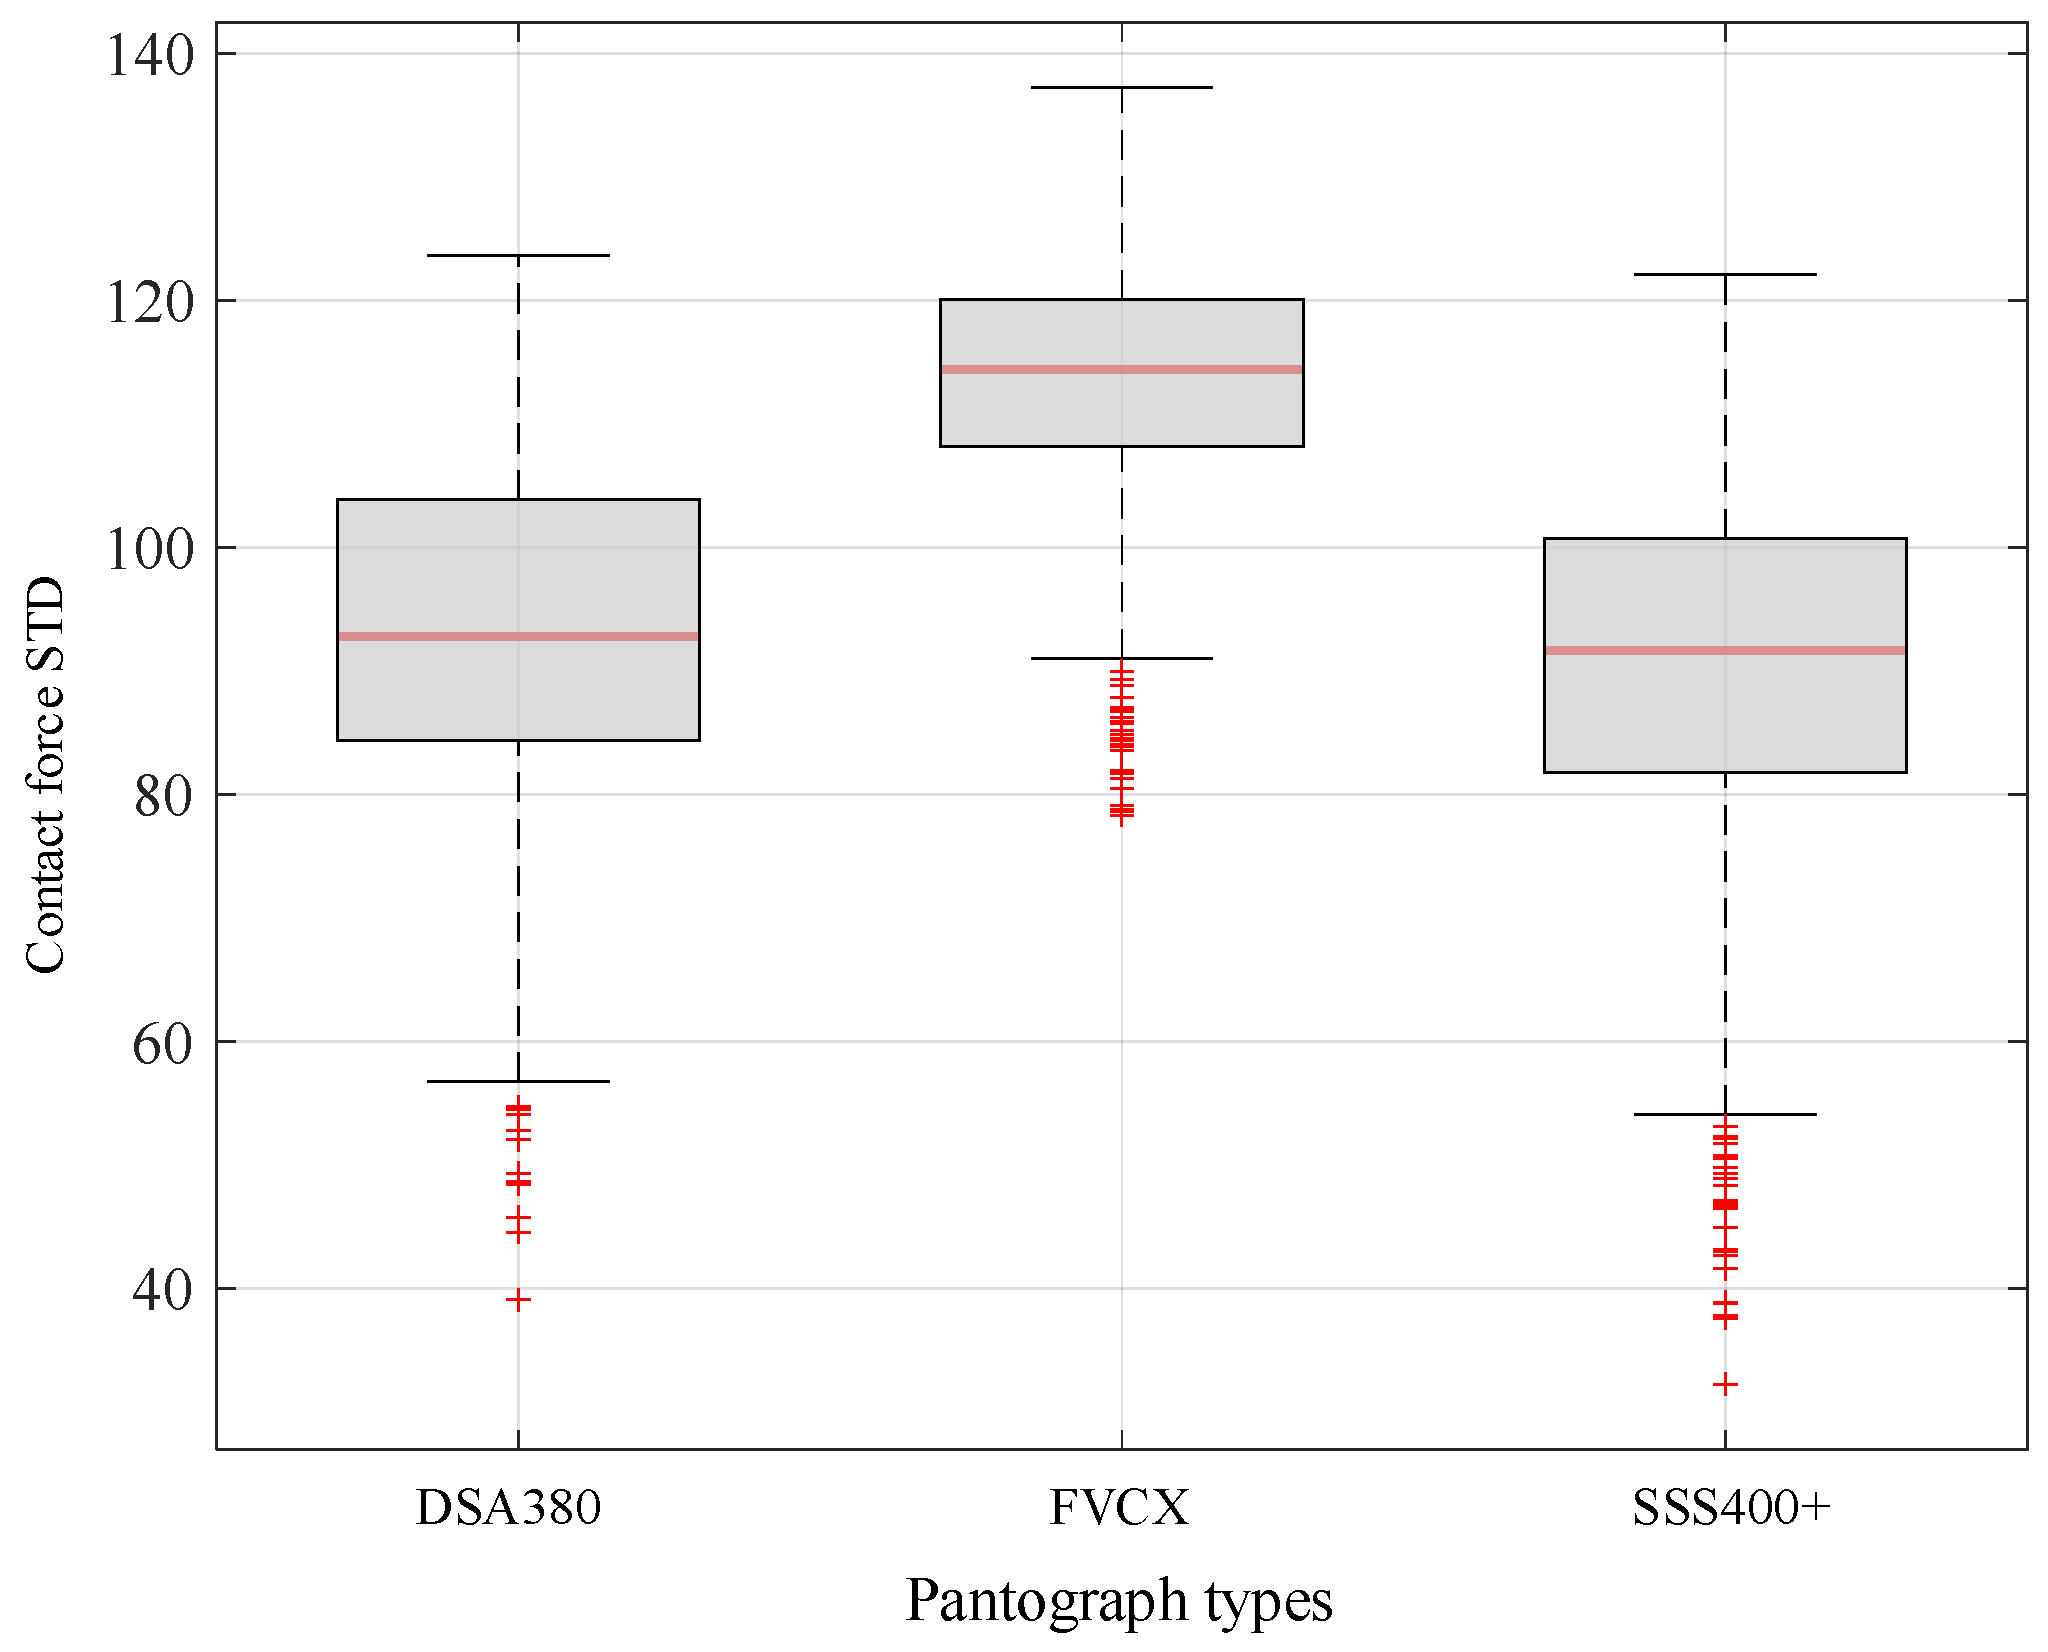
where the Interquartile Range (IQR) spans from the 25th percentile to the 75th percentile. Data points outside the range are considered outliers and are denoted by red ‘+’ symbols. Figure 6 presents the box plots of the standard deviation of pantograph–catenary contact force corresponding to the different pantograph types. It is observed that the FVCX pantograph exhibits a lower contact force standard deviation, while the DSA380 and SSS400+ pantographs show similar contact force standard deviations. This suggests that the dynamic performance of the FVCX pantograph is significantly superior to the other two models.
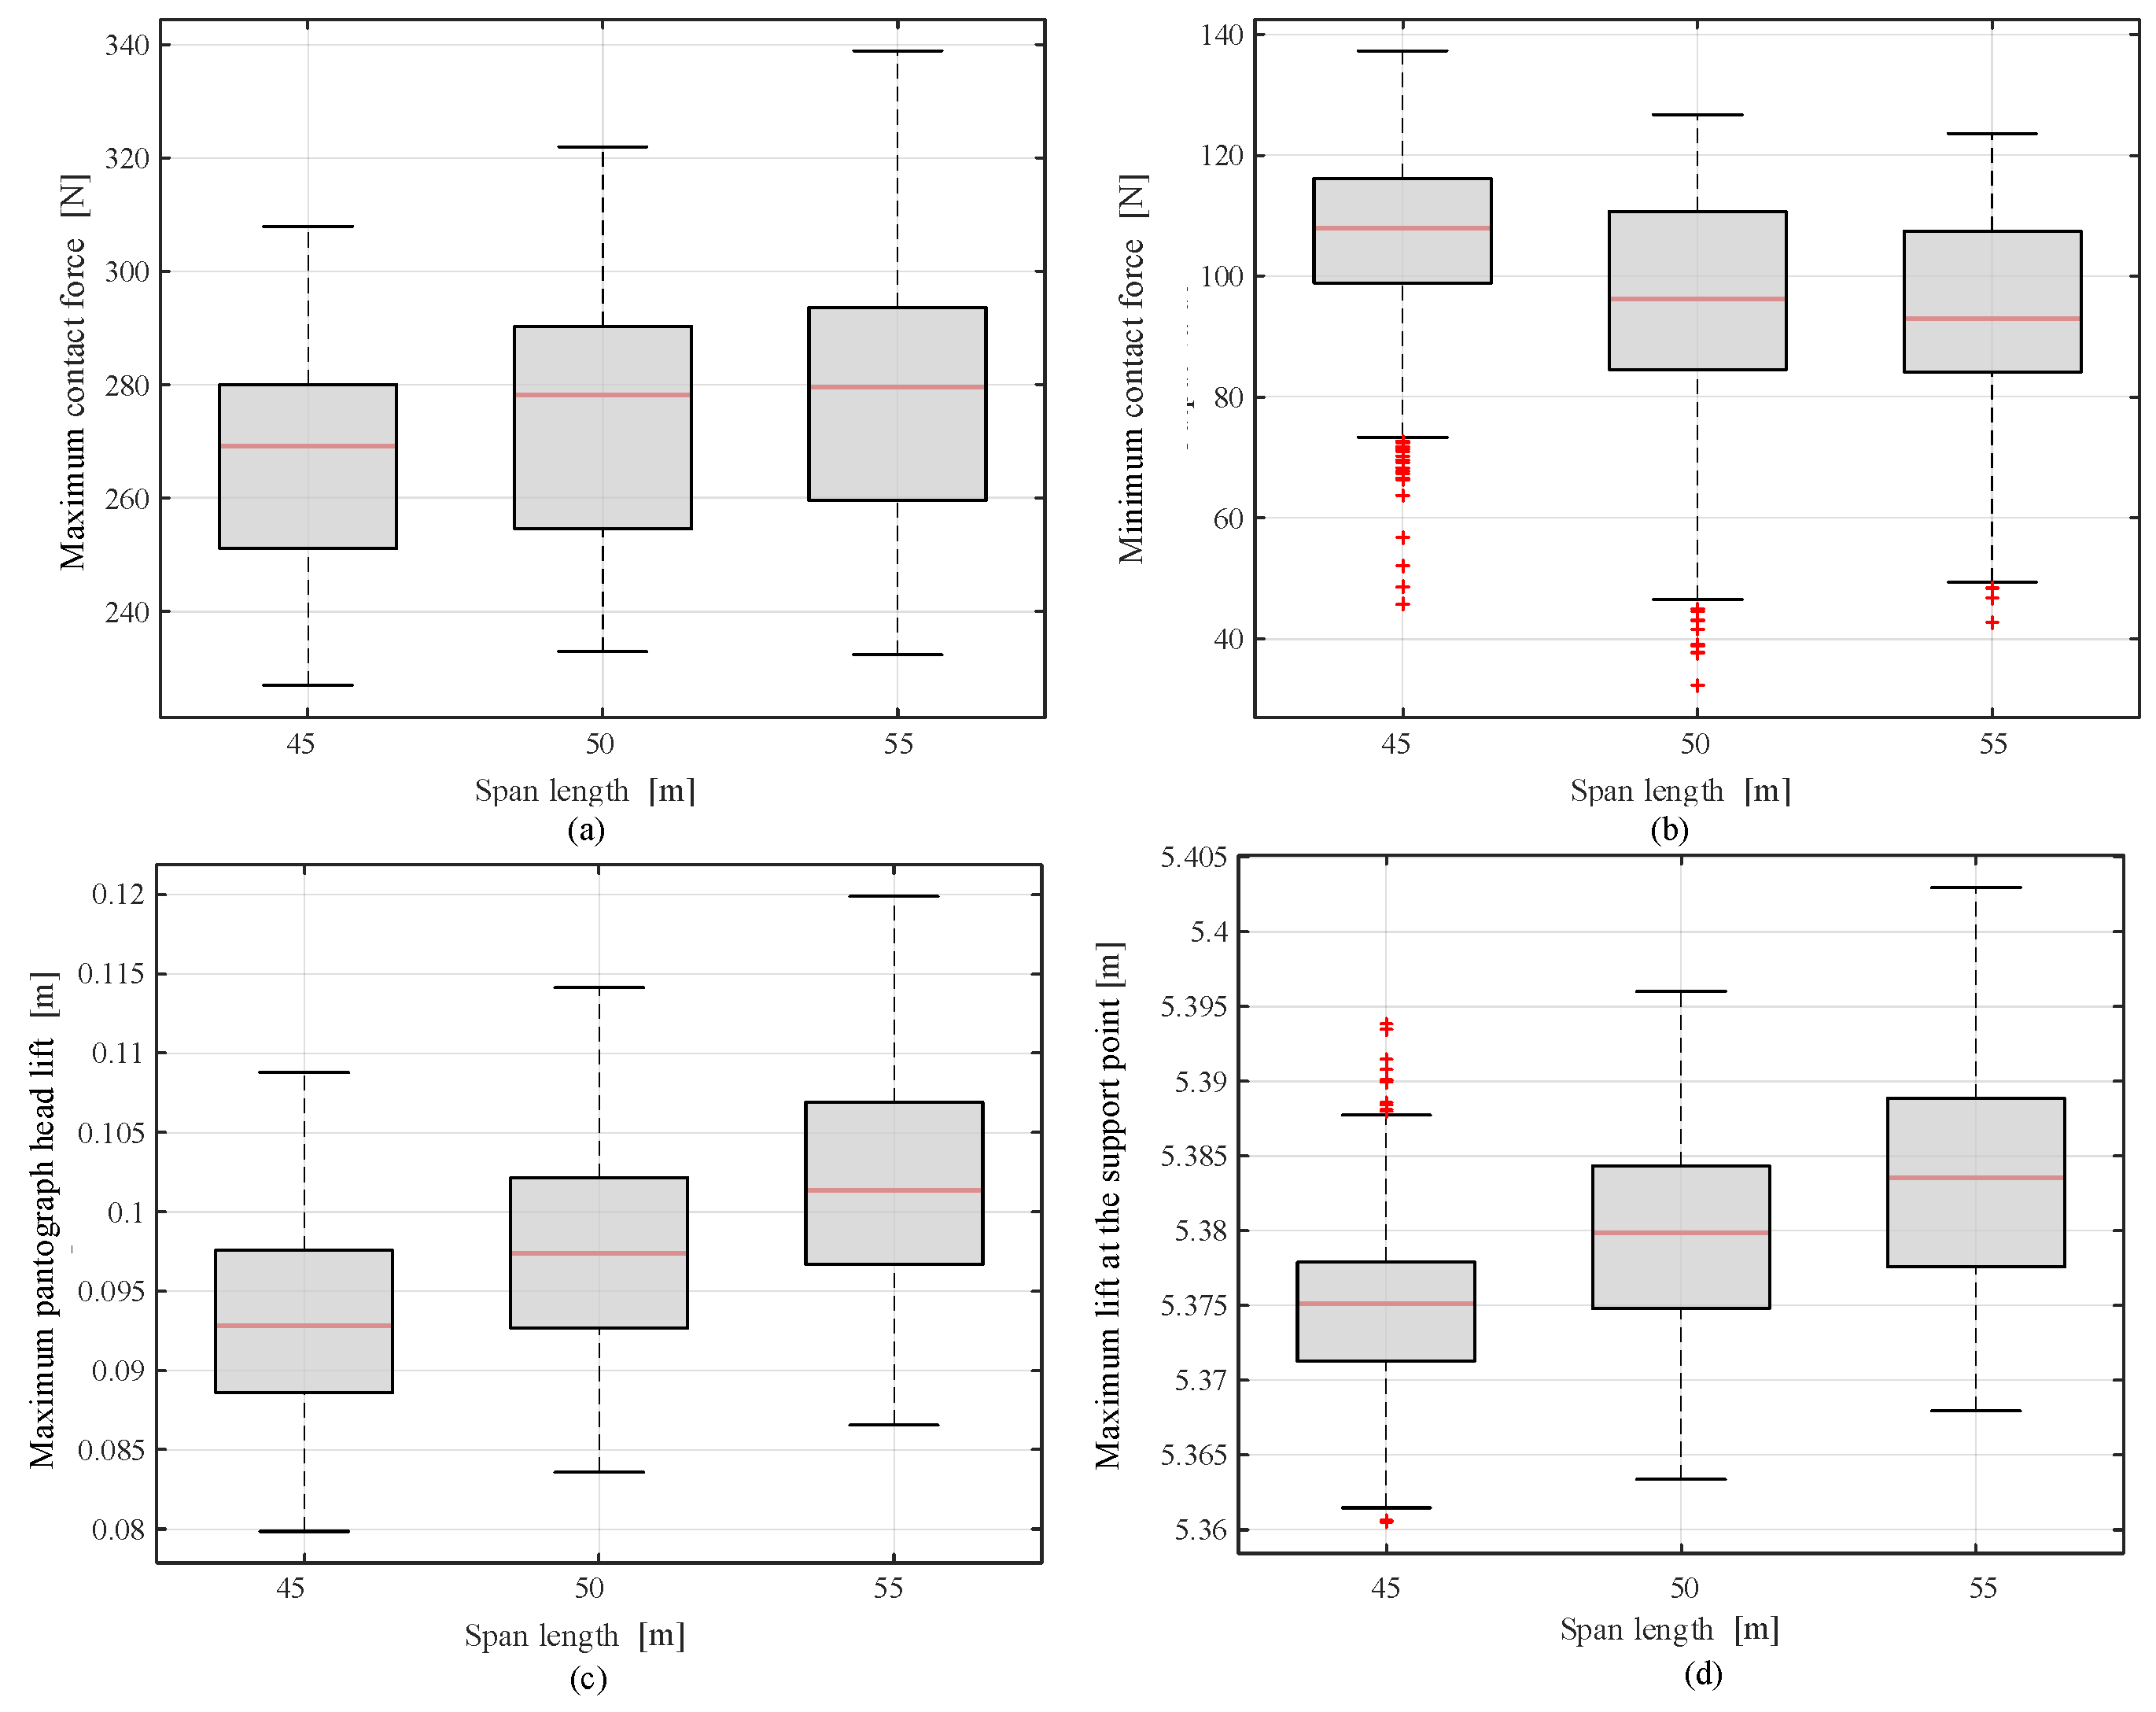
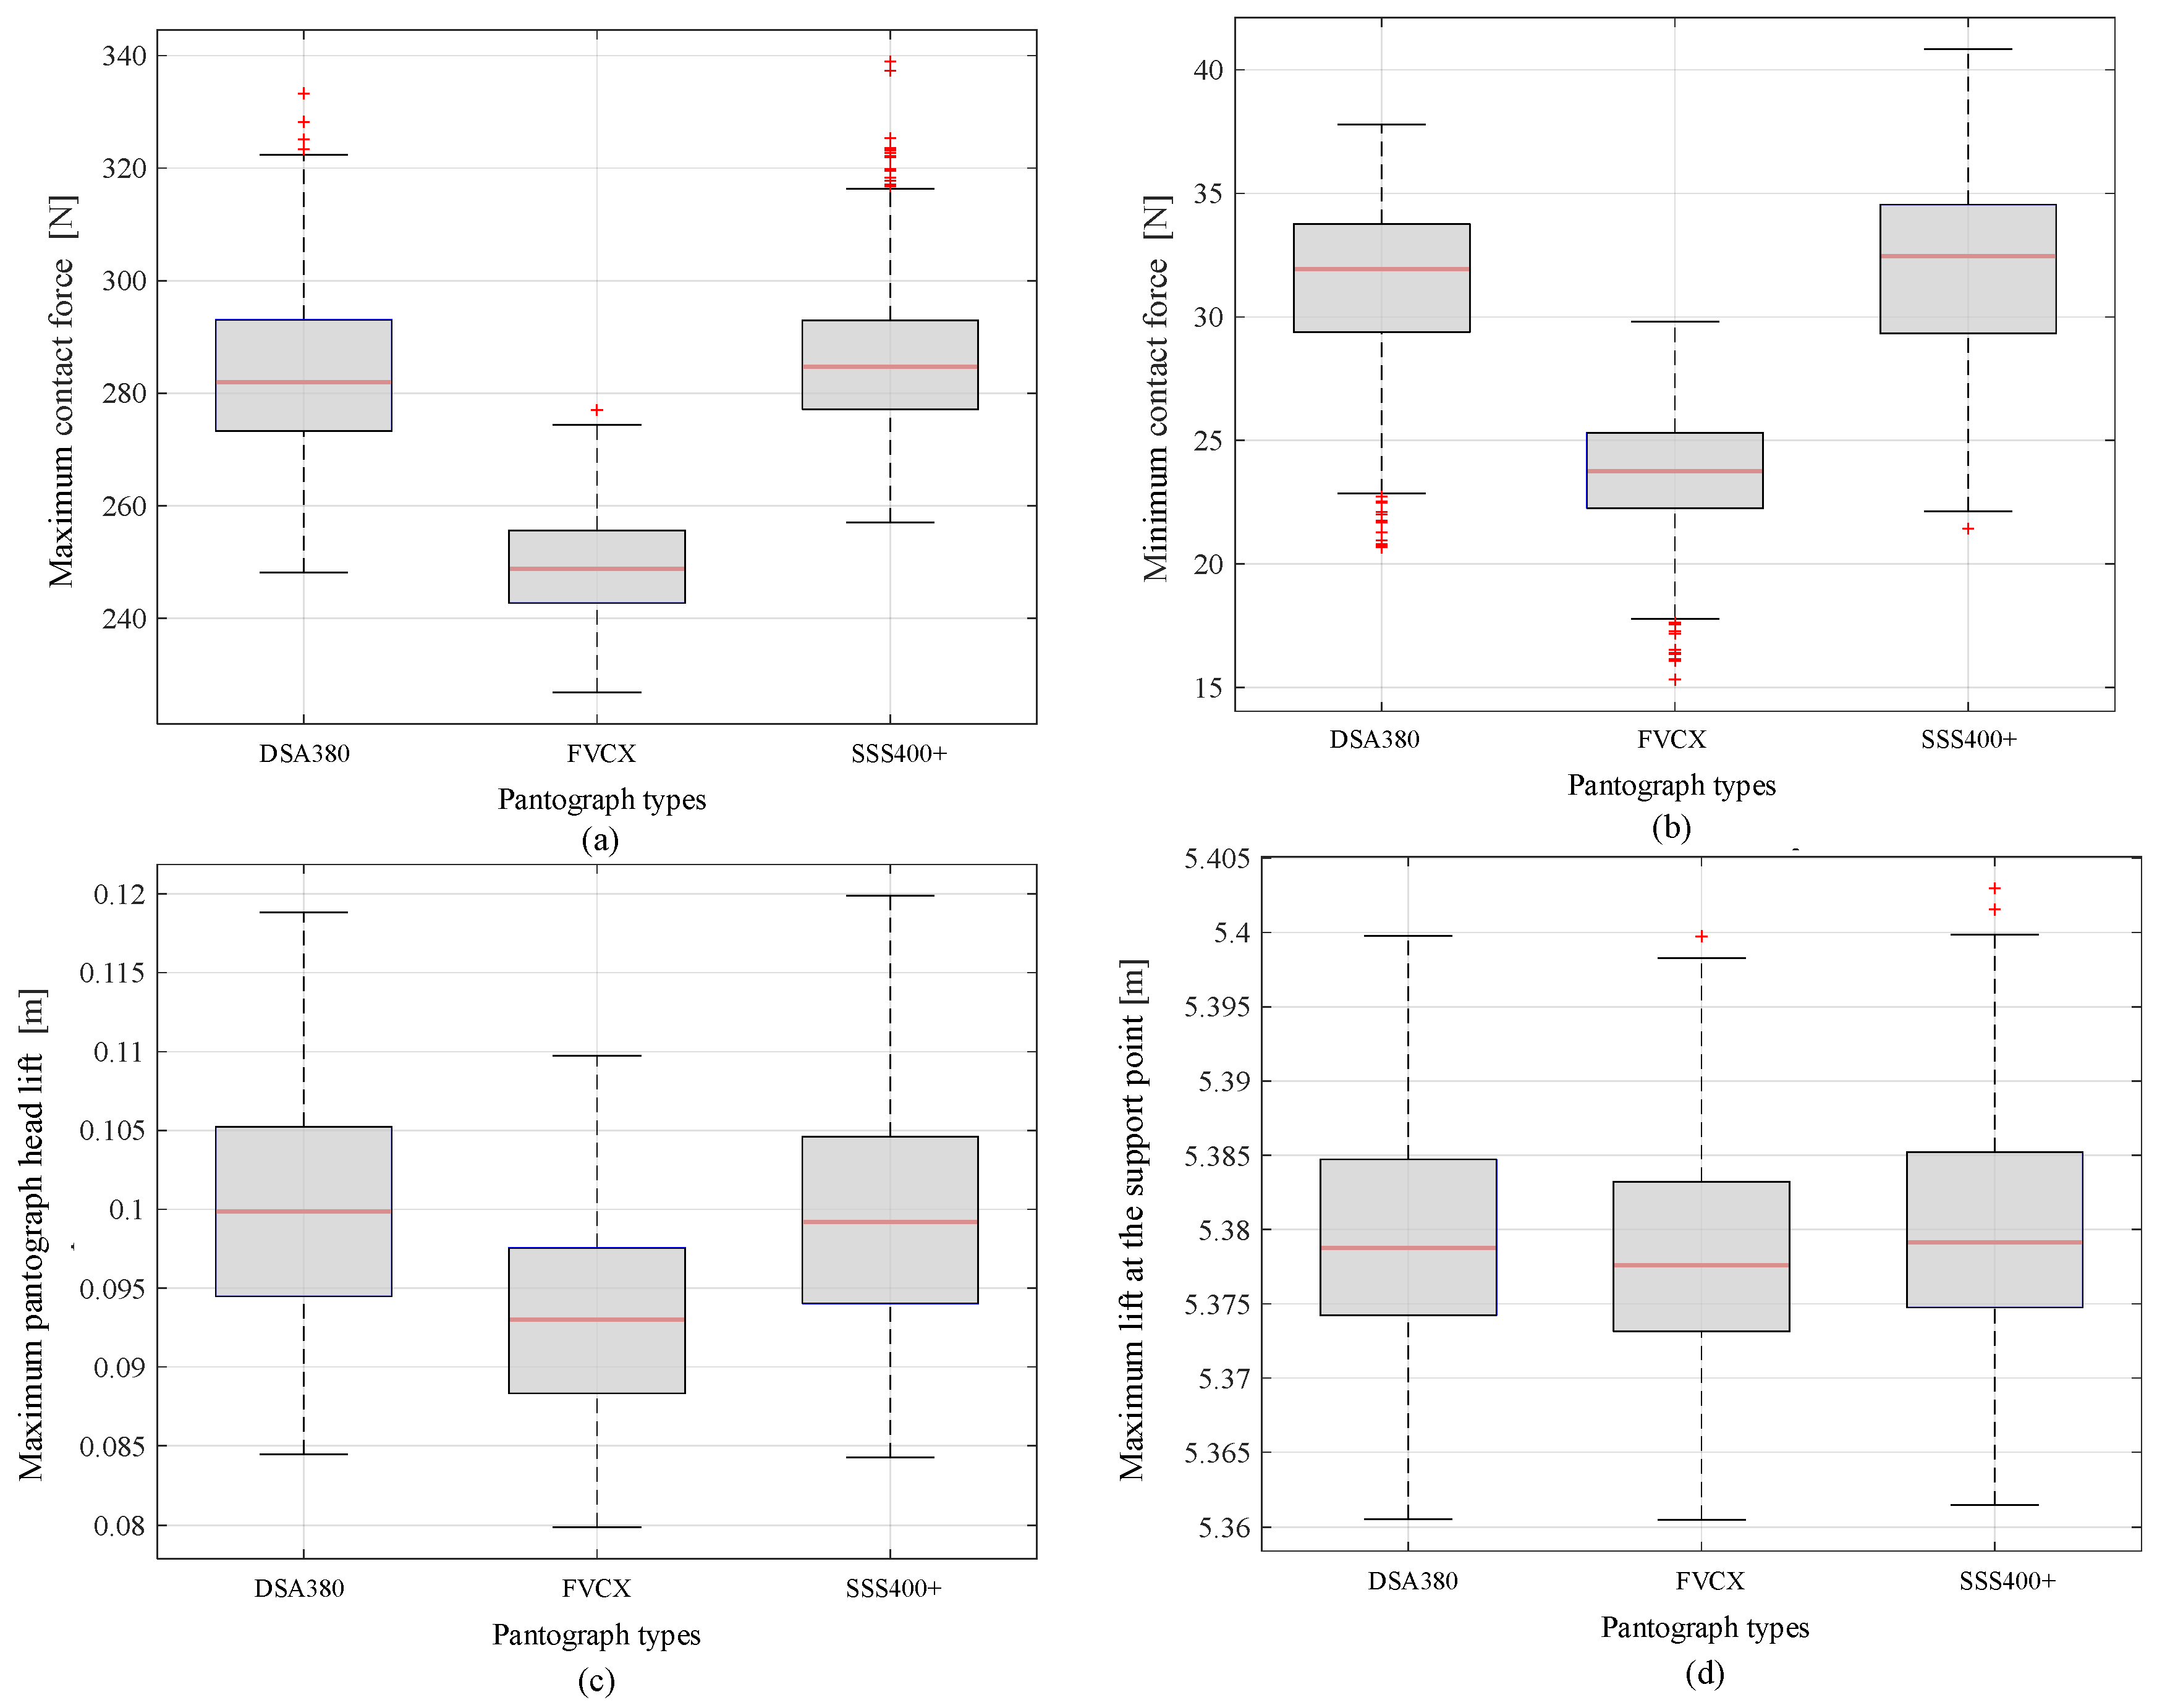
Further comparisons are conducted on other dynamic performance indicators of the three pantograph models, analyzing the effect of the pantograph model on the maximum and minimum contact forces, maximum PHL, and maximum SPL. The results are presented in Figure 7.
From Figure 7a,b, it can be seen that, compared to the other two pantograph models, the FVCX pantograph has a smaller maximum contact force and a larger minimum contact force, indicating a smaller fluctuation range in contact force. This further confirms the superior dynamic performance of the FVCX pantograph. Additionally, from Figure 7c, it can be seen that the maximum PHL induced by the FVCX pantograph is significantly lower. The statistical metrics of comprehensive dynamic performance for three pantograph types are systematically presented in Table 6. The results demonstrate that the FVCX pantograph maintains superior performance across all evaluation criteria, while the DSA380 and SSS400+ pantographs exhibit comparable dynamic characteristics.
The superior dynamic performance of the FVCX pantograph can be attributed to its optimized lumped mass distribution. Mechanically, the head mass (m1) is the decisive factor for high-speed interaction; the FVCX’s notably lower m1 grants it superior follow-up capability compared to the DSA380 and SSS400+. This allows the collector strip to maintain closer contact with the wire during high-frequency excitations. Additionally, the significantly higher lower frame damping (c3) of the FVCX provides more effective vibration attenuation for the entire structure. In contrast, the variations in stiffness and other mass components among the three models have a secondary effect on the global dynamic stability at 350 km/h.

5. Effect of Catenary Shape Parameters

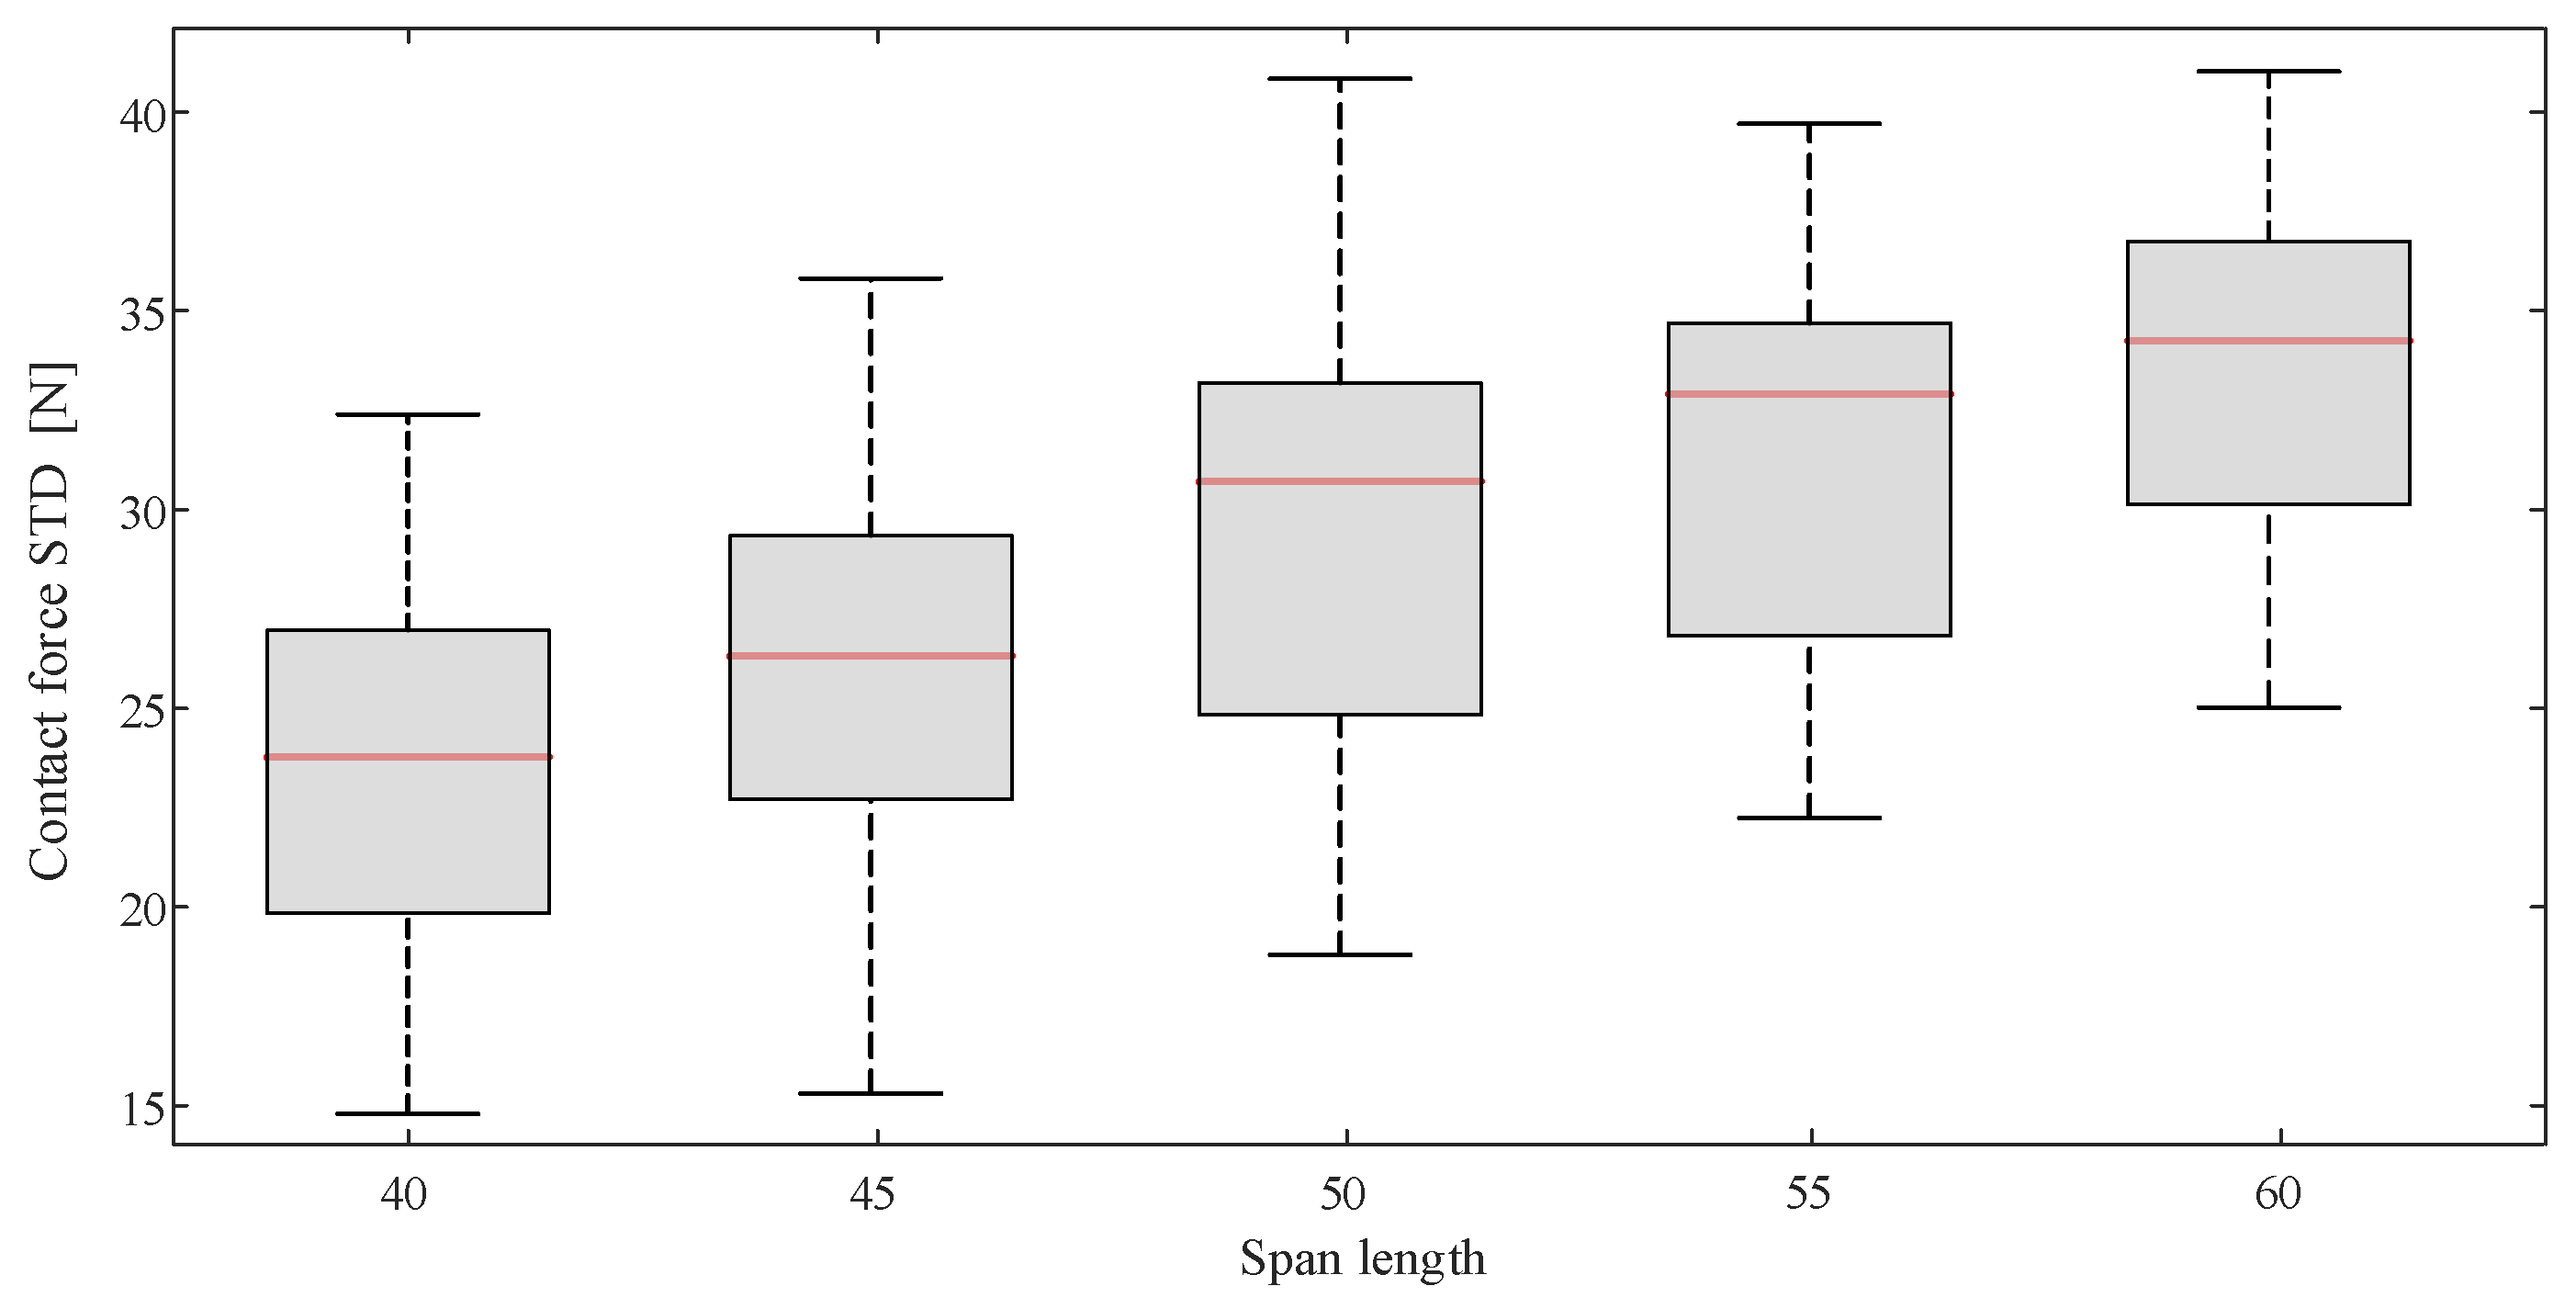
In this part, the effect of three catenary shape parameters—catenary span, number of droppers, and stitch wire length—on dynamic performance is investigated. First, the effect of catenary span length on pantograph–catenary dynamic performance is discussed. Numerical simulations are performed for pantograph–catenary dynamic performance at a speed of 350 km/h for different catenary spans. To better observe the impact of different parameters on current collection quality, we expanded the range of selected parameters (generally considered to have significant influence) to include five distinct values during our analysis of contact force standard deviation. The box plot for contact force STD of the three different spans is shown in Figure 8.
It can be observed that the standard deviation of the pantograph–catenary contact force generally increases with span length. Dynamic performance with a span length of 45 m is significantly better than that of the 50 m and 55 m spans. The mean contact force standard deviations for the three span conditions are measured at 26.08, 29.56, and 31.34 N. A 16.8% increase in contact force STD is observed as the span length increased from 45 m to 55 m. Overall, dynamic performance decreases as the span length increases. Further analysis of the PHL and SPL for different span lengths clarifies the effect of span on other dynamic performance indicators. Figure 9 shows the maximum PHL and maximum SPL for different spans. It is observed that, as the catenary span increases, both the maximum PHL and the maximum lift at the contact point significantly increase. This suggests that increasing the catenary span length leads to a deterioration in the dynamic performance of the pantograph–catenary system. As the span length increased from 45 m to 55 m, the average values of the maximum contact force, minimum contact force, maximum PHL, and maximum SPL exhibited respective variations of +4.1%, −13.9%, +8.5%, and +10.6%.
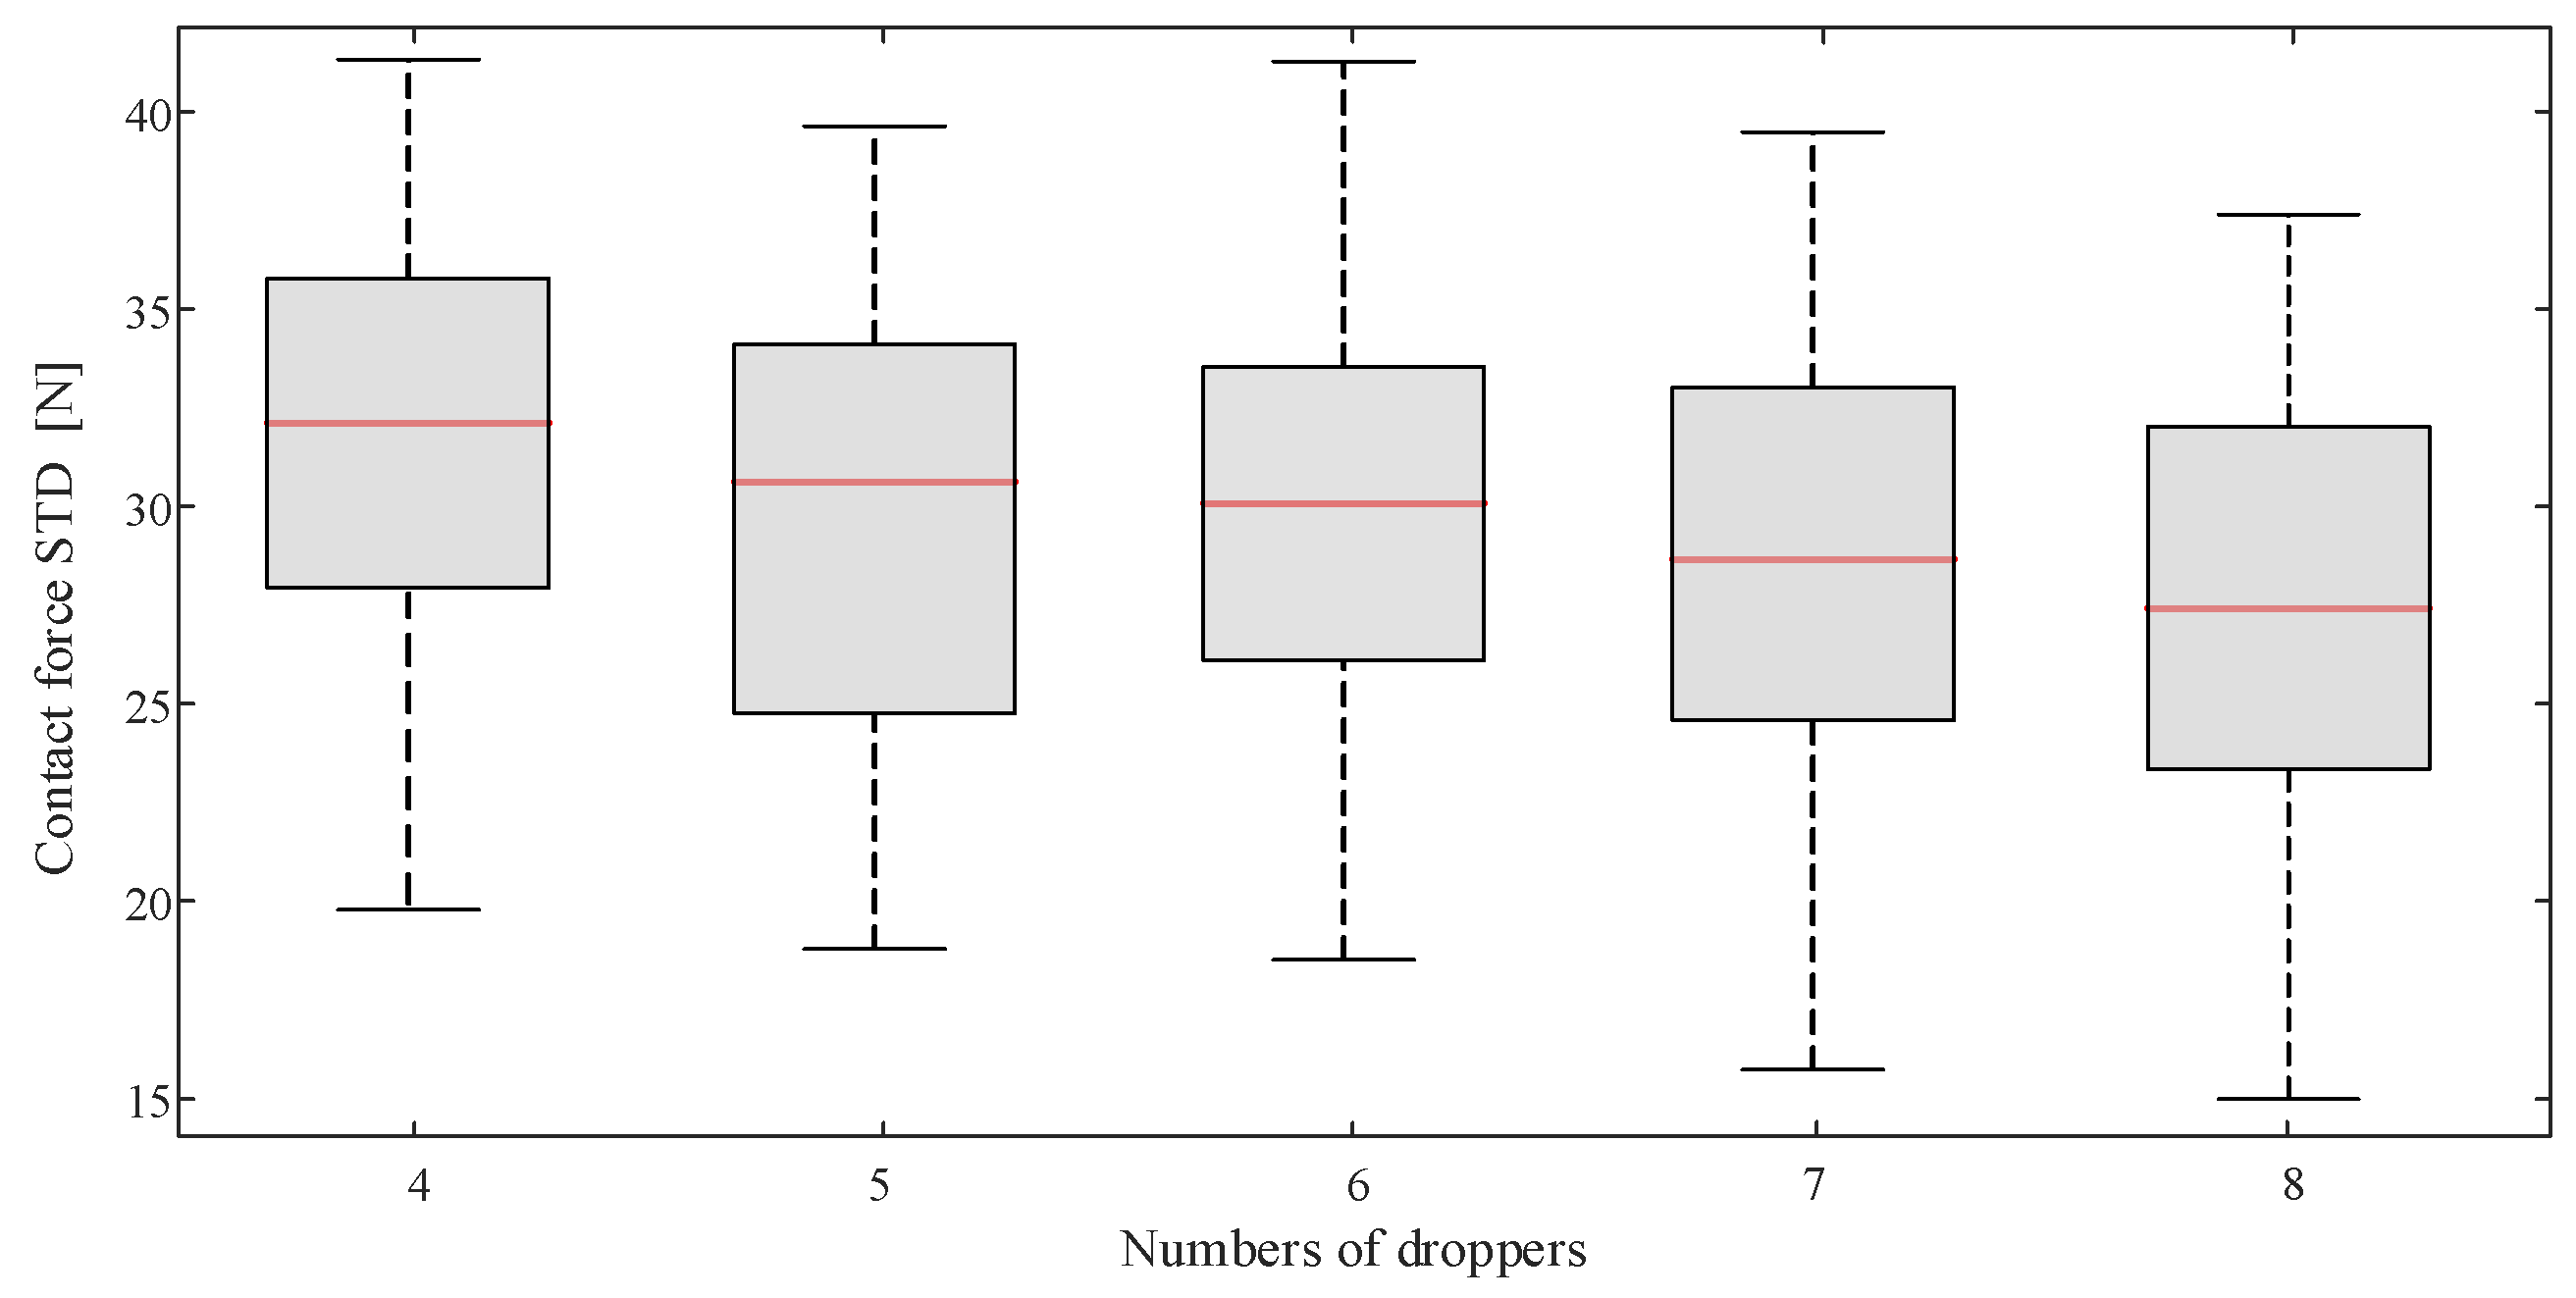
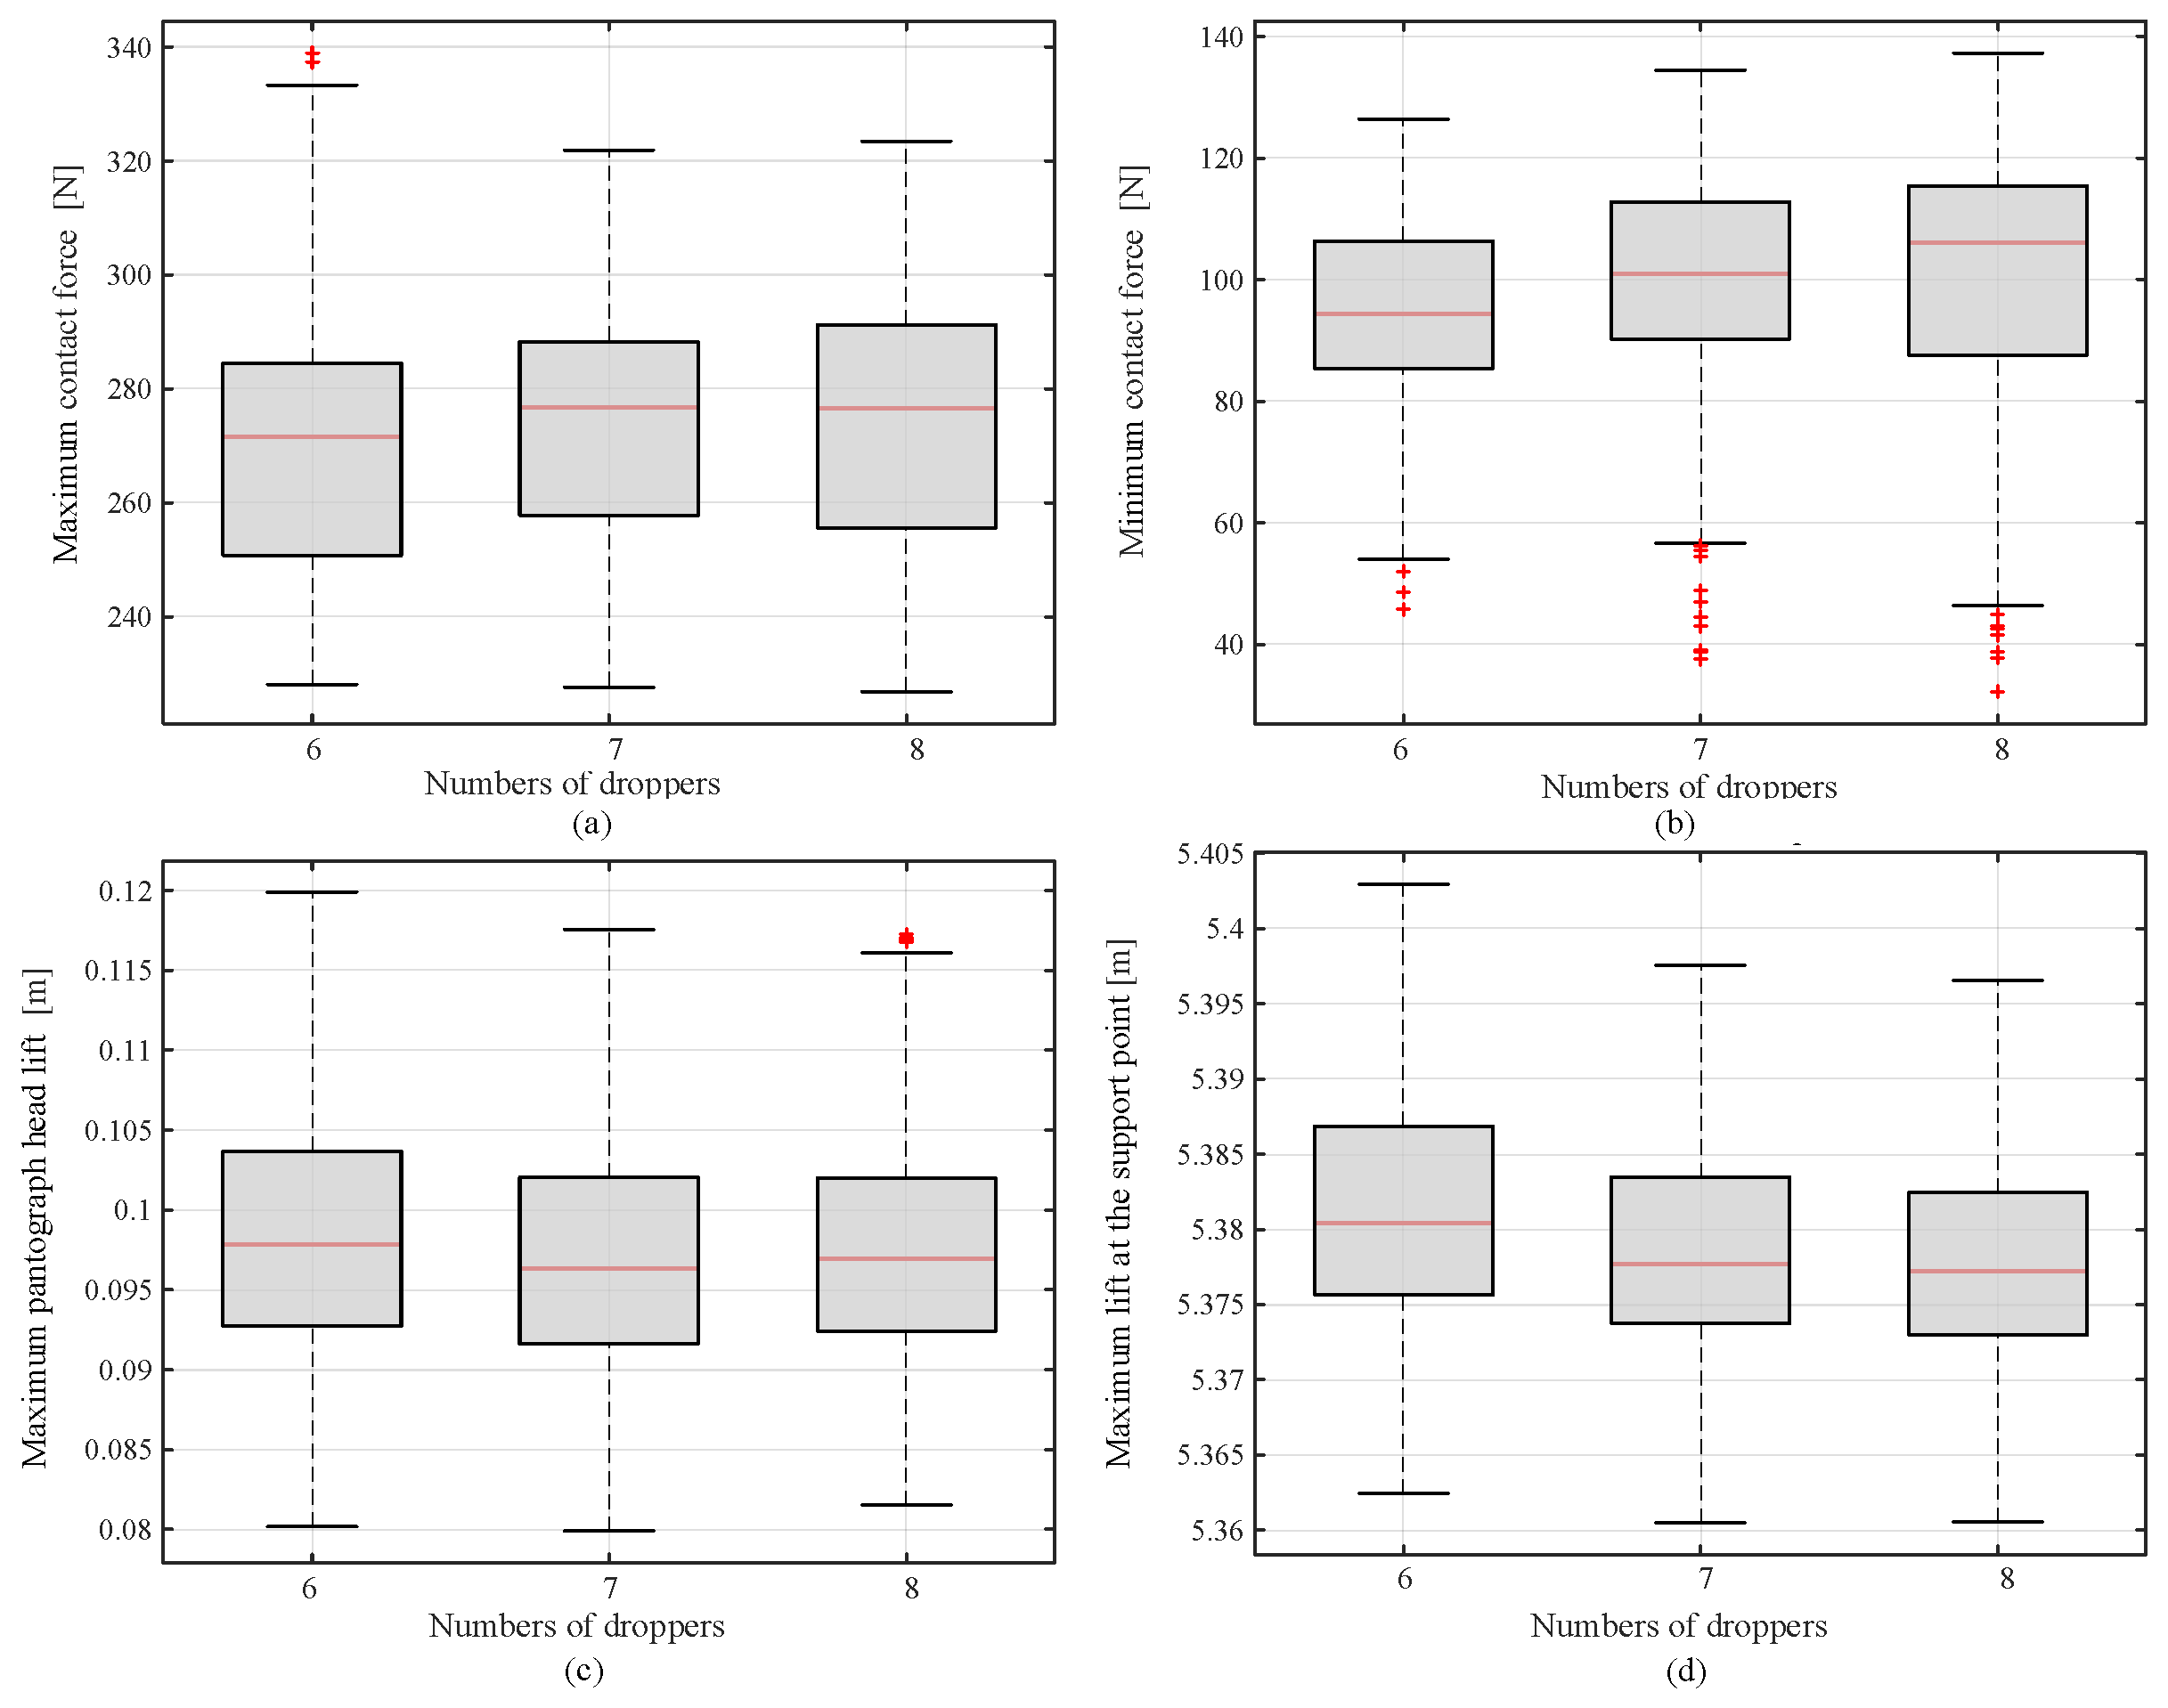
Next, the effect of the number of droppers on pantograph–catenary dynamic performance is analyzed. Numerical simulations of the pantograph–catenary system at a speed of 350 km/h are conducted for different numbers of droppers. Figure 10 shows the box plot of the contact force STD for the catenary system with three different numbers of droppers.
As the number of droppers increases, the standard deviation of the pantograph–catenary contact force generally shows a slight decreasing trend across all cases. An increase in dropper quantity from 6 to 8 produced a 3.9% reduction in the mean standard deviation of contact force. The contact force remains relatively consistent, suggesting that the number of droppers has a minimal effect on the dynamic performance of the pantograph–catenary system. More dynamic performance indicators for different numbers of droppers are presented in Figure 11. It is observed that the maximum PHL does not exhibit significant differences across different numbers of droppers. In certain parameter combinations, the maximum PHL with six droppers is lower than that with configurations having more droppers. Simultaneously, the maximum SPL decreases as the number of droppers increases. This suggests that an increase in the number of droppers benefits the dynamic performance of the pantograph–catenary system.
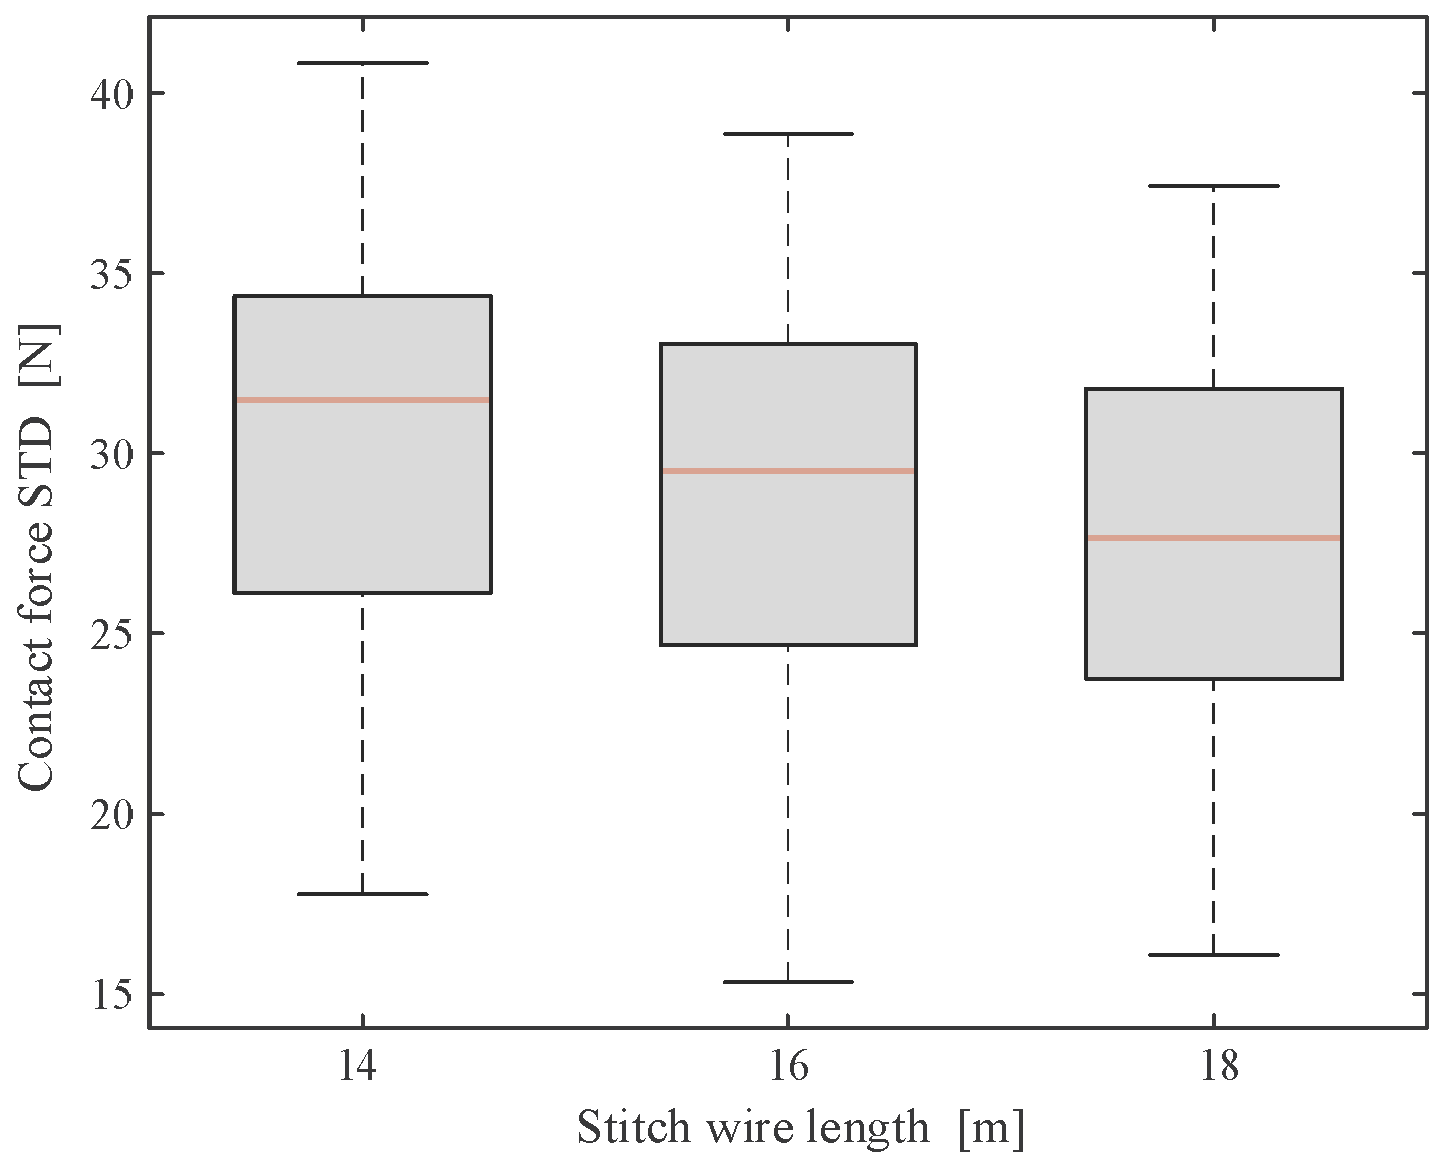
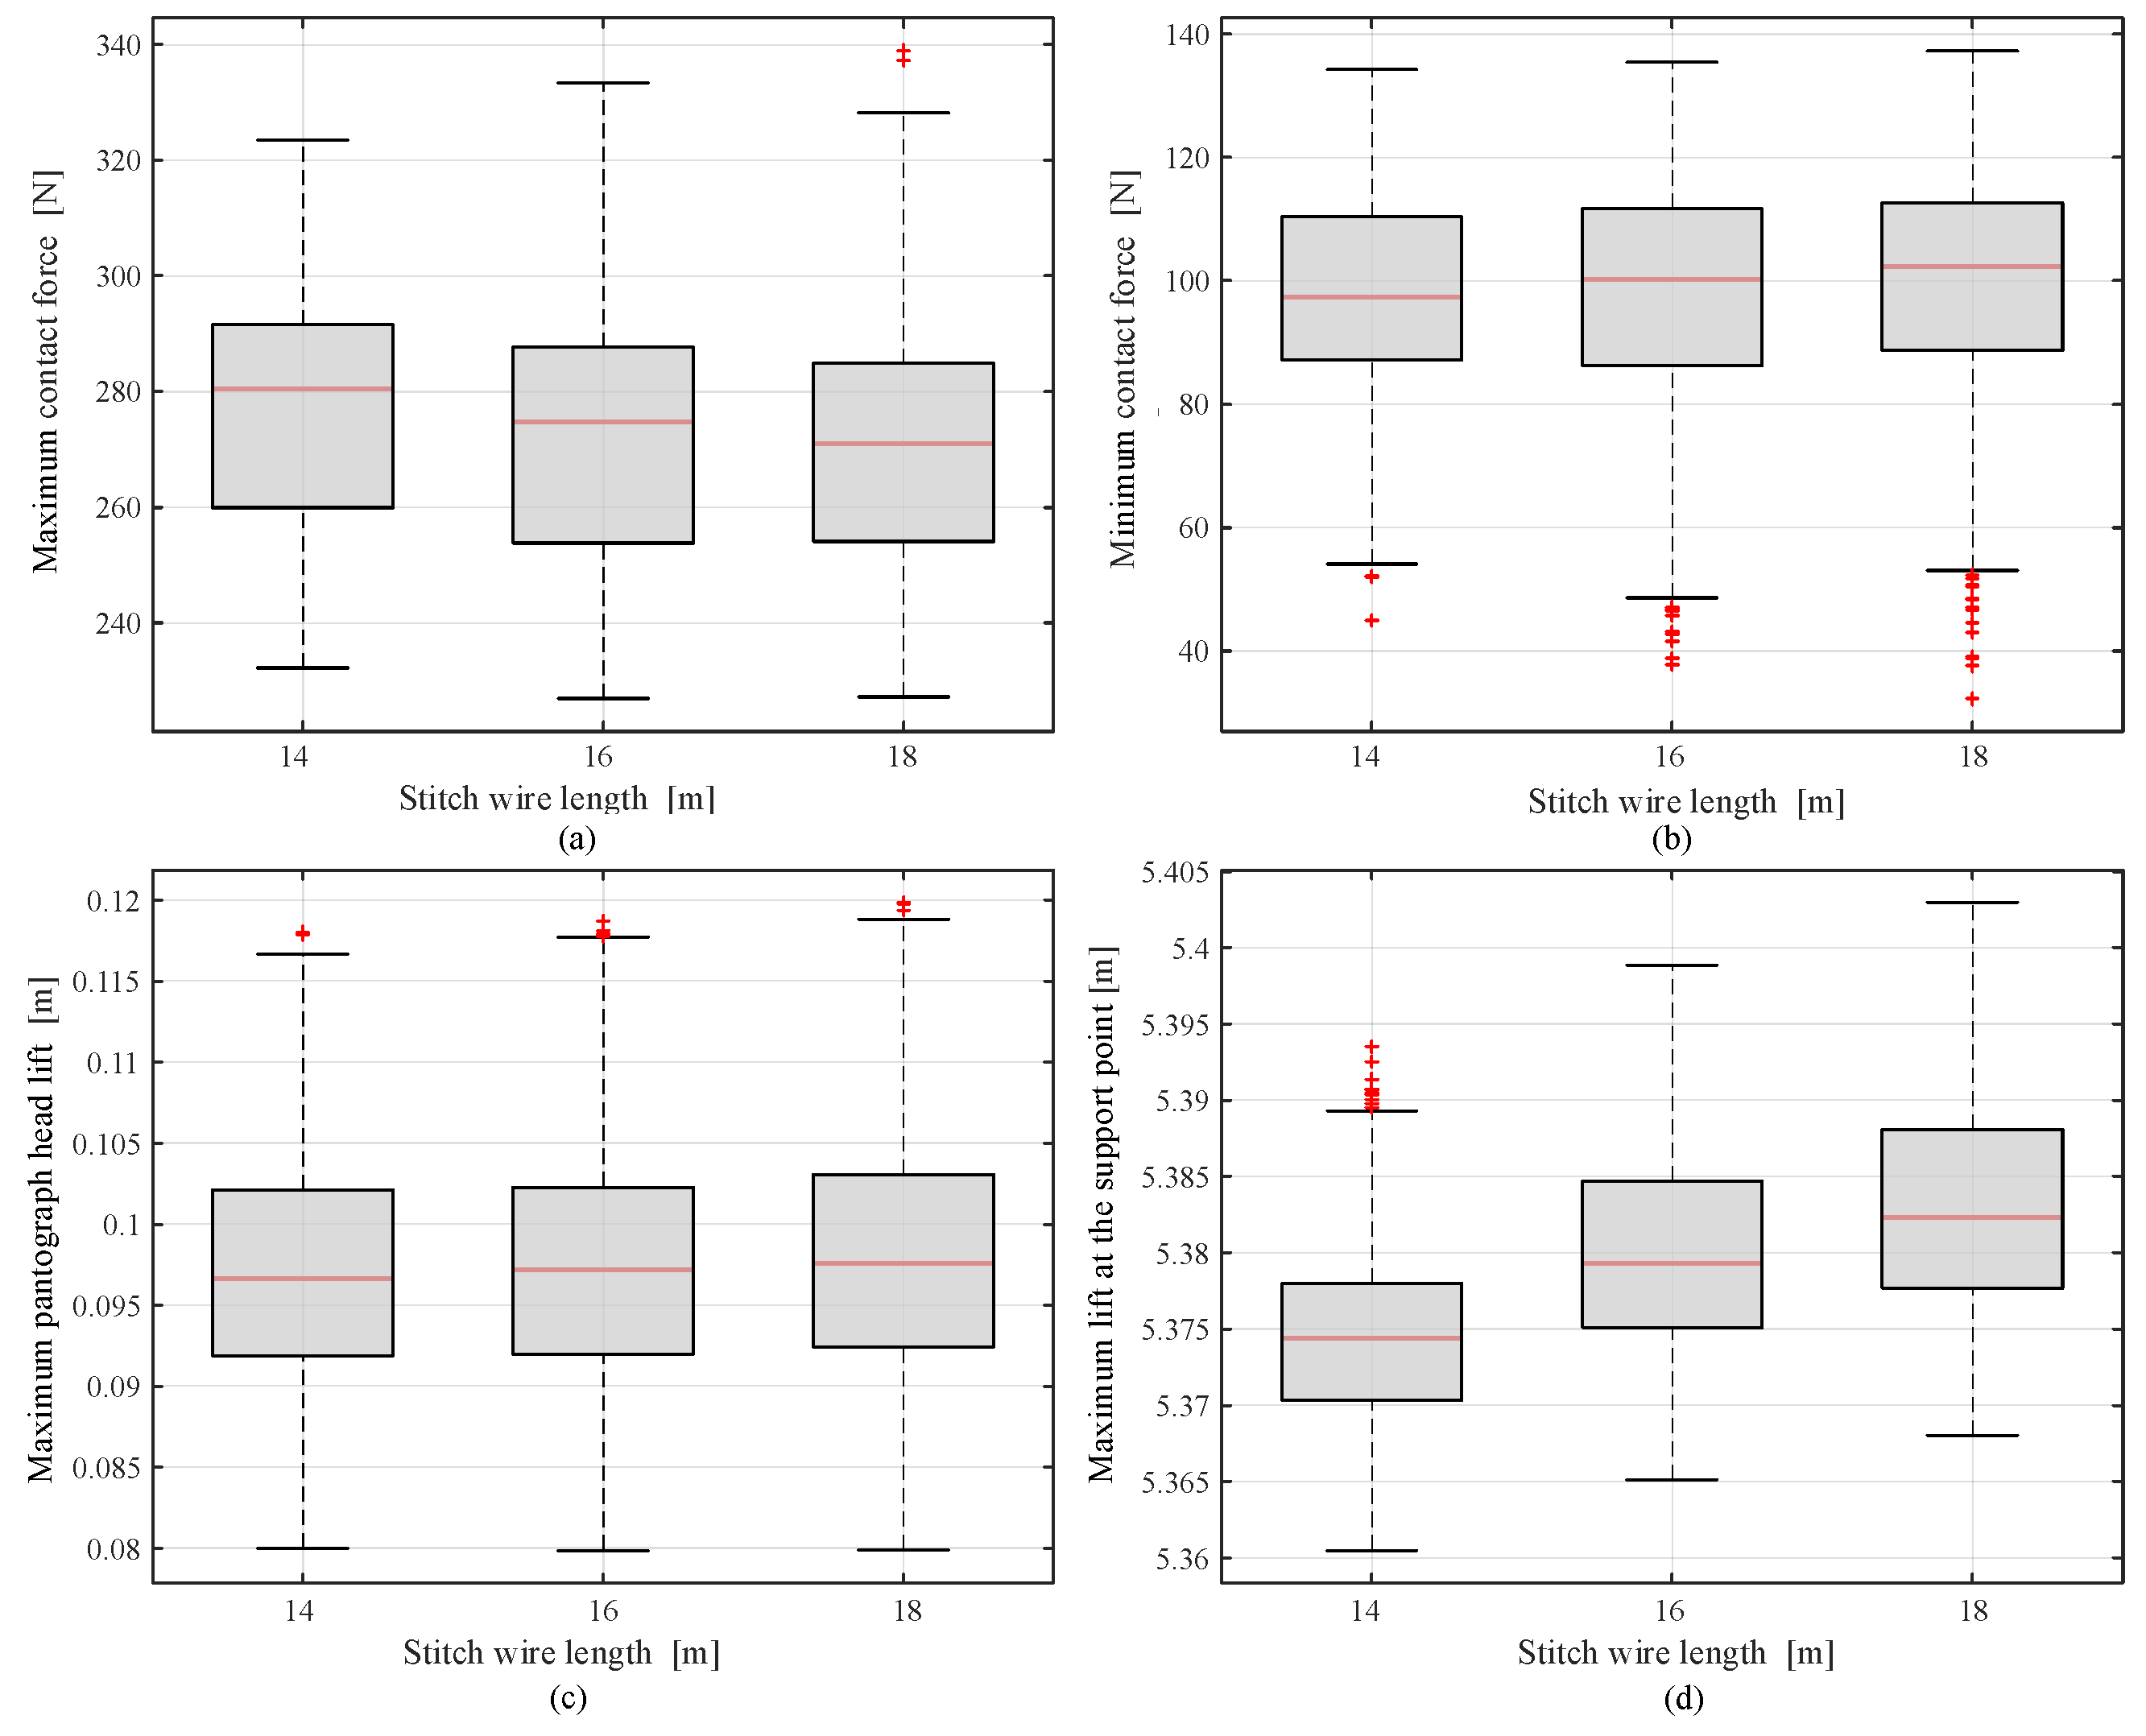
Finally, the effect of stitch wire length is discussed. Figure 12 shows the standard deviation of the contact force for different stitch wire lengths. As the stitch wire length increases, the standard deviation of the pantograph–catenary contact force generally decreases, which benefits the dynamic performance of the pantograph–catenary system. When the stitch wire length increased from 14 m to 18 m, the mean standard deviation of contact forces decreased by 10.2%. Figure 13 presents more dynamic performance indicators for different stitch wire lengths. The maximum PHL is similar across all configurations. However, the maximum SPL increases with stitch wire length, which adversely affects the dynamic performance of the pantograph–catenary system. The observed trade-off between STD and SPL regarding stitch wire length can be interpreted through the aspect of elasticity distribution. Increasing the stitch wire length enhances the elasticity uniformity of the catenary by smoothing the stiffness transition near the supports. This reduction in the hard-point effect is the primary reason for the decrease in contact force STD. Conversely, the increased length provides greater local vertical flexibility, which reduces the resistance of the support point to the upward force exerted by the pantograph, thereby leading to a higher maximum SPL. This interaction necessitates a careful balance in design to ensure both current collection quality and structural clearance.

6. Effect of Catenary Tension Parameters

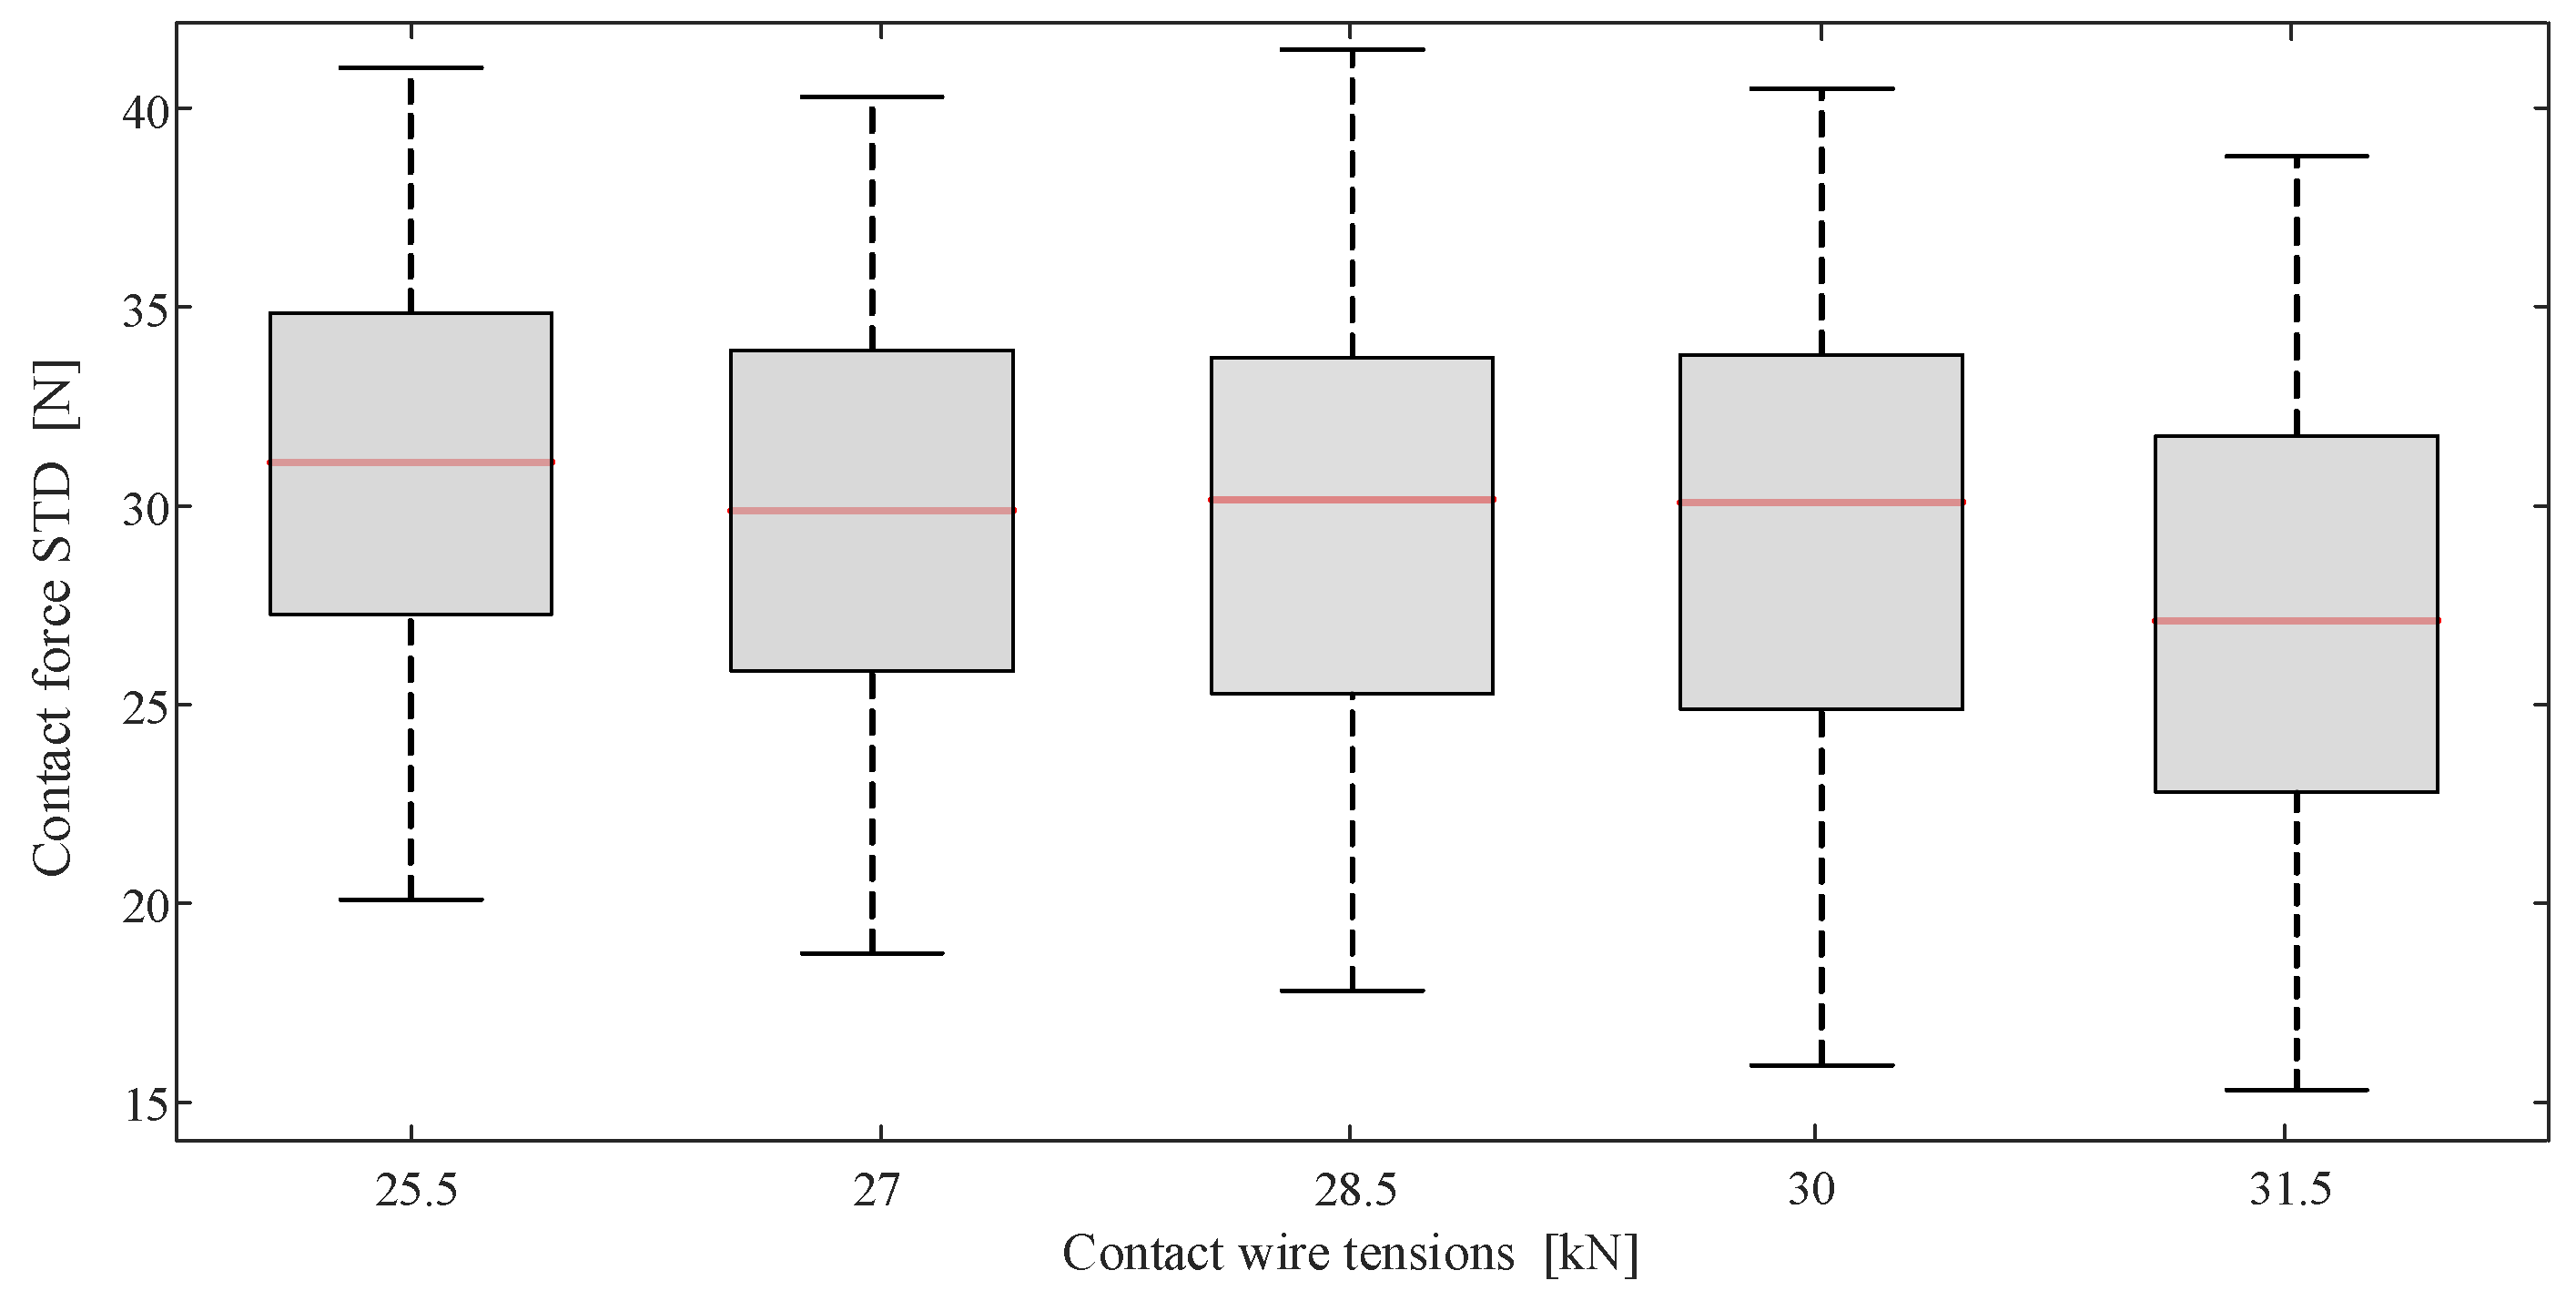
This section examines the effect of catenary tension parameters—contact wire tension, messenger wire tension, and stitch wire tension—on pantograph–catenary dynamic performance. First, the effect of contact wire tension is analyzed. Numerical simulations of pantograph–catenary dynamic performance at a speed of 350 km/h are conducted for different contact wire tensions. Figure 14 shows the box plots of the standard deviation of pantograph–catenary contact force corresponding to the different contact wire tensions.
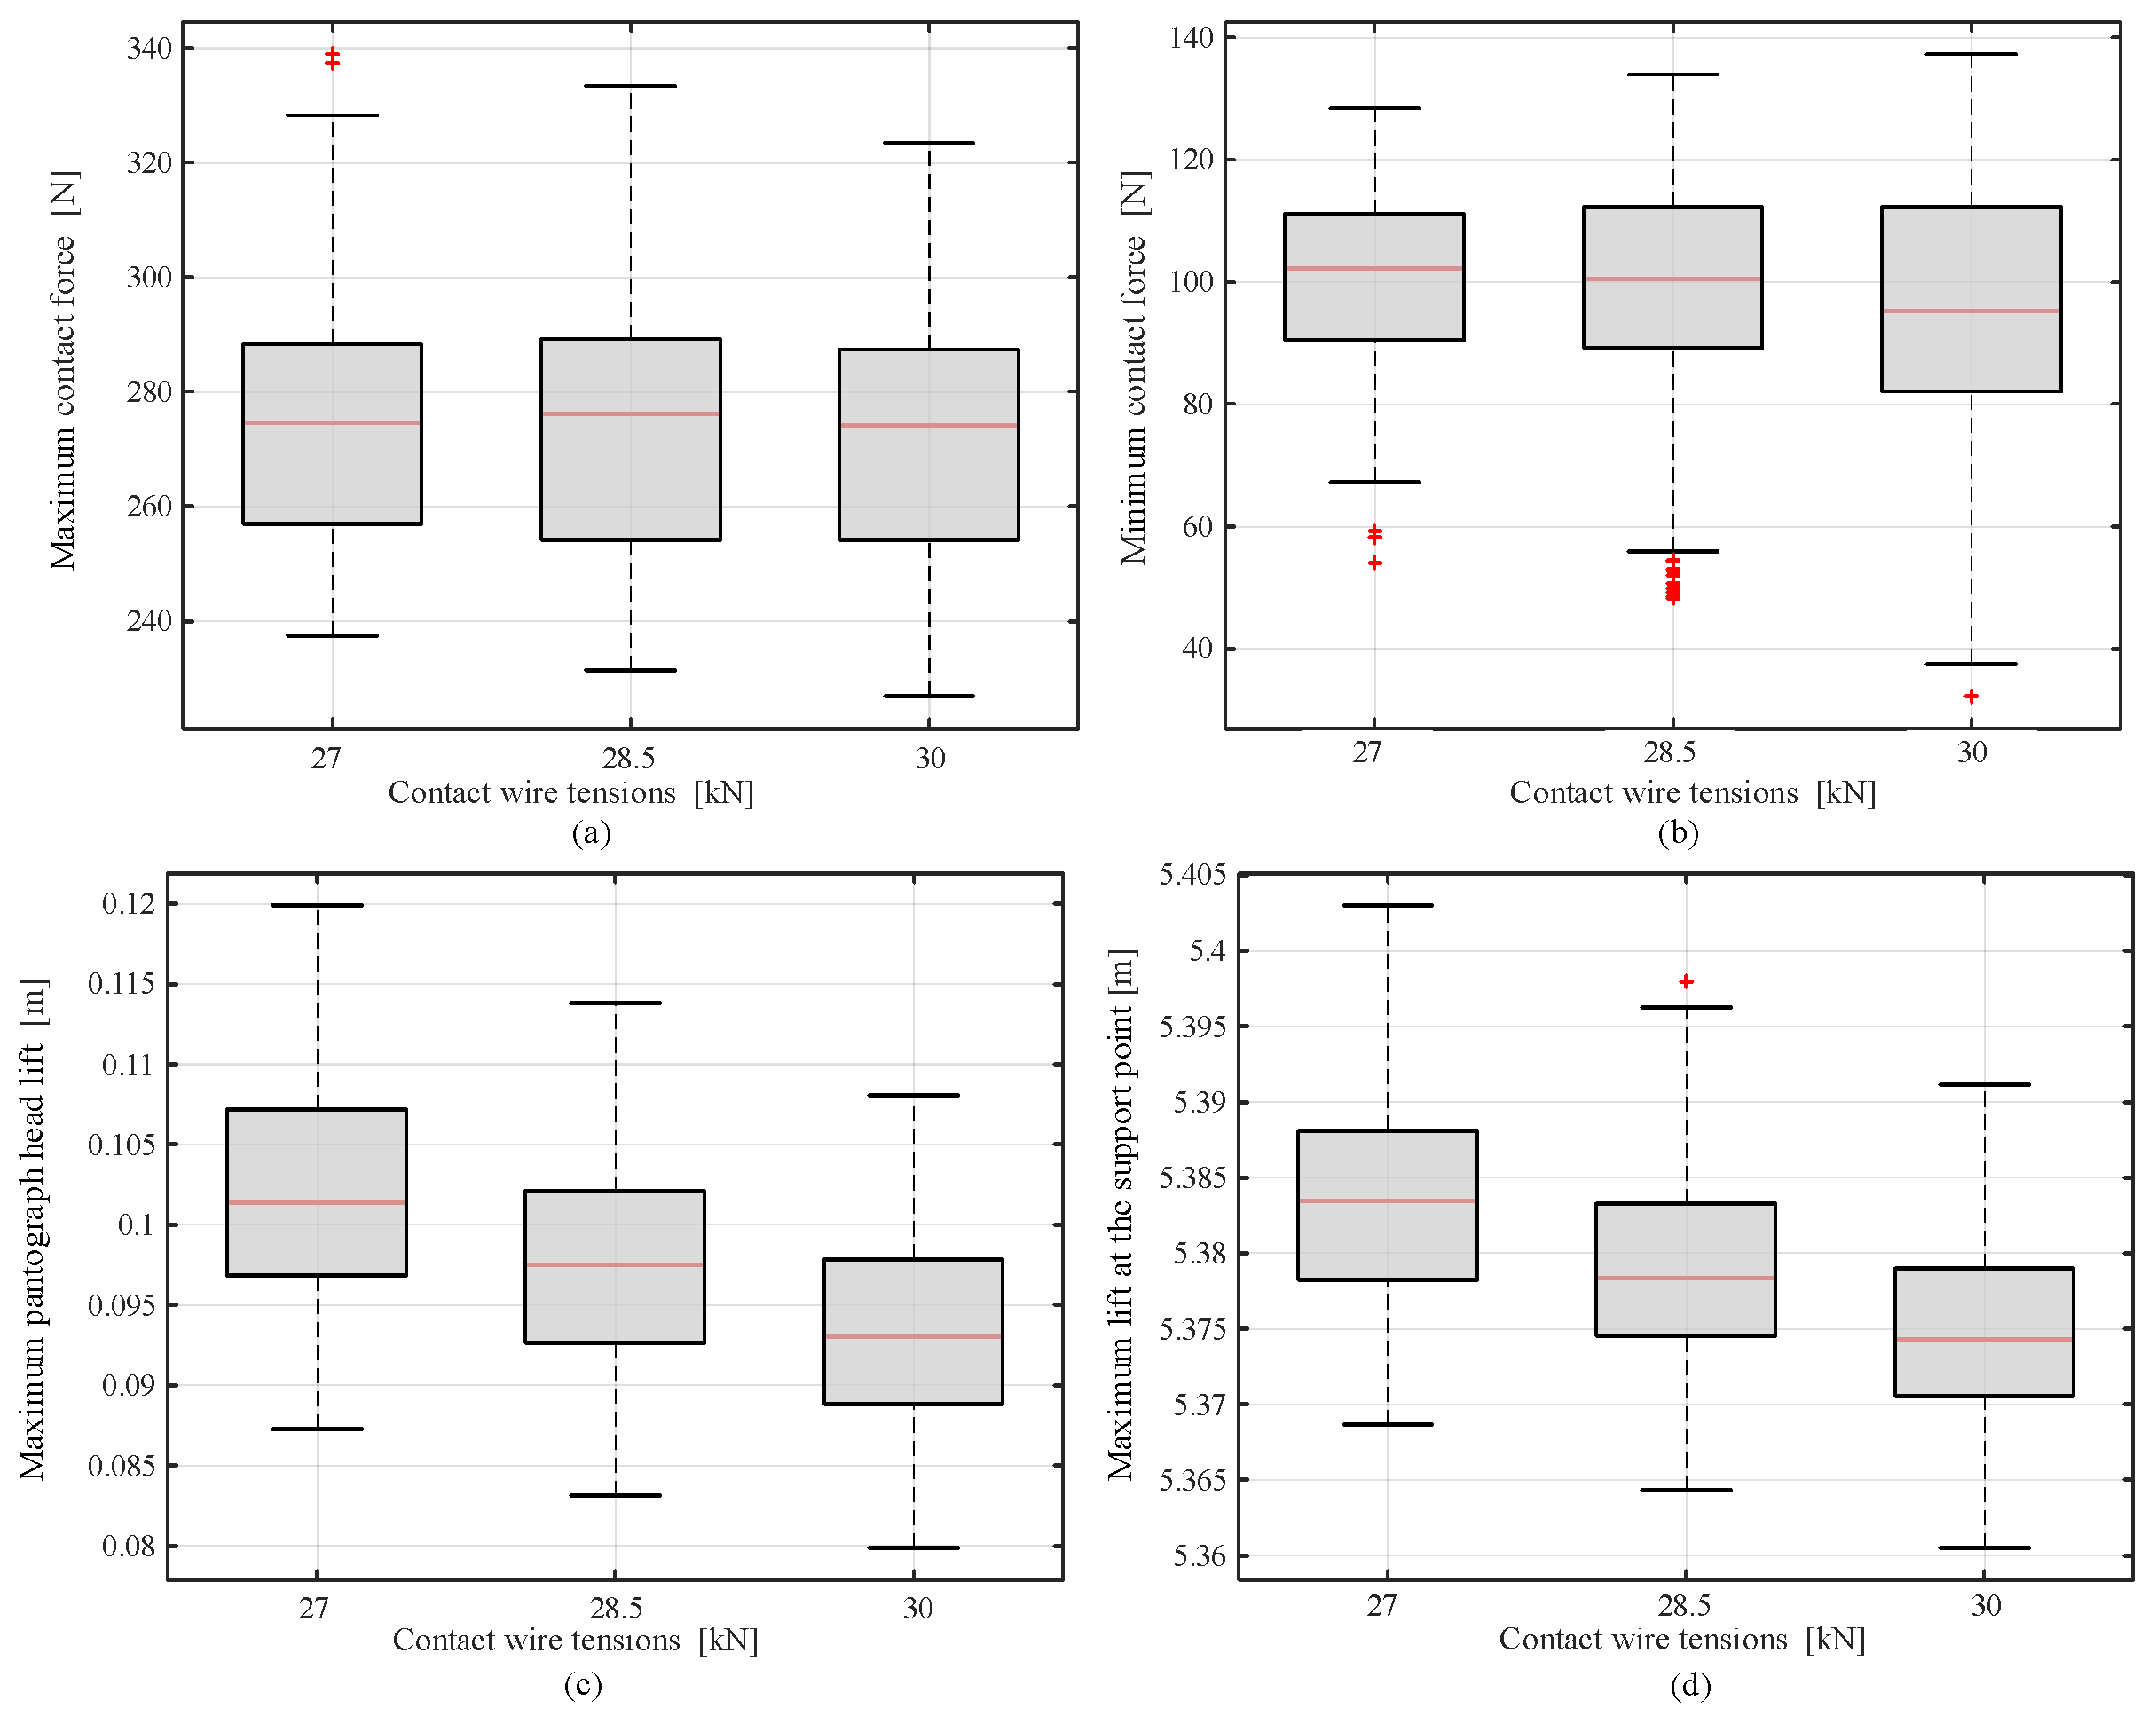
The effect of contact wire tension on pantograph–catenary dynamic performance is minimal. As the contact wire tension increased from 27 kN to 30 kN, the mean standard deviation of contact forces decreased by 3.5%. Current collection quality improves marginally with increasing contact wire tension. More dynamic performance indicators for different contact wire tensions are presented in Figure 15. It is observed that as contact wire tension increases, both the PHL and SPL decrease significantly across all operating conditions. Therefore, increasing contact wire tension benefits the dynamic performance of the pantograph–catenary system.
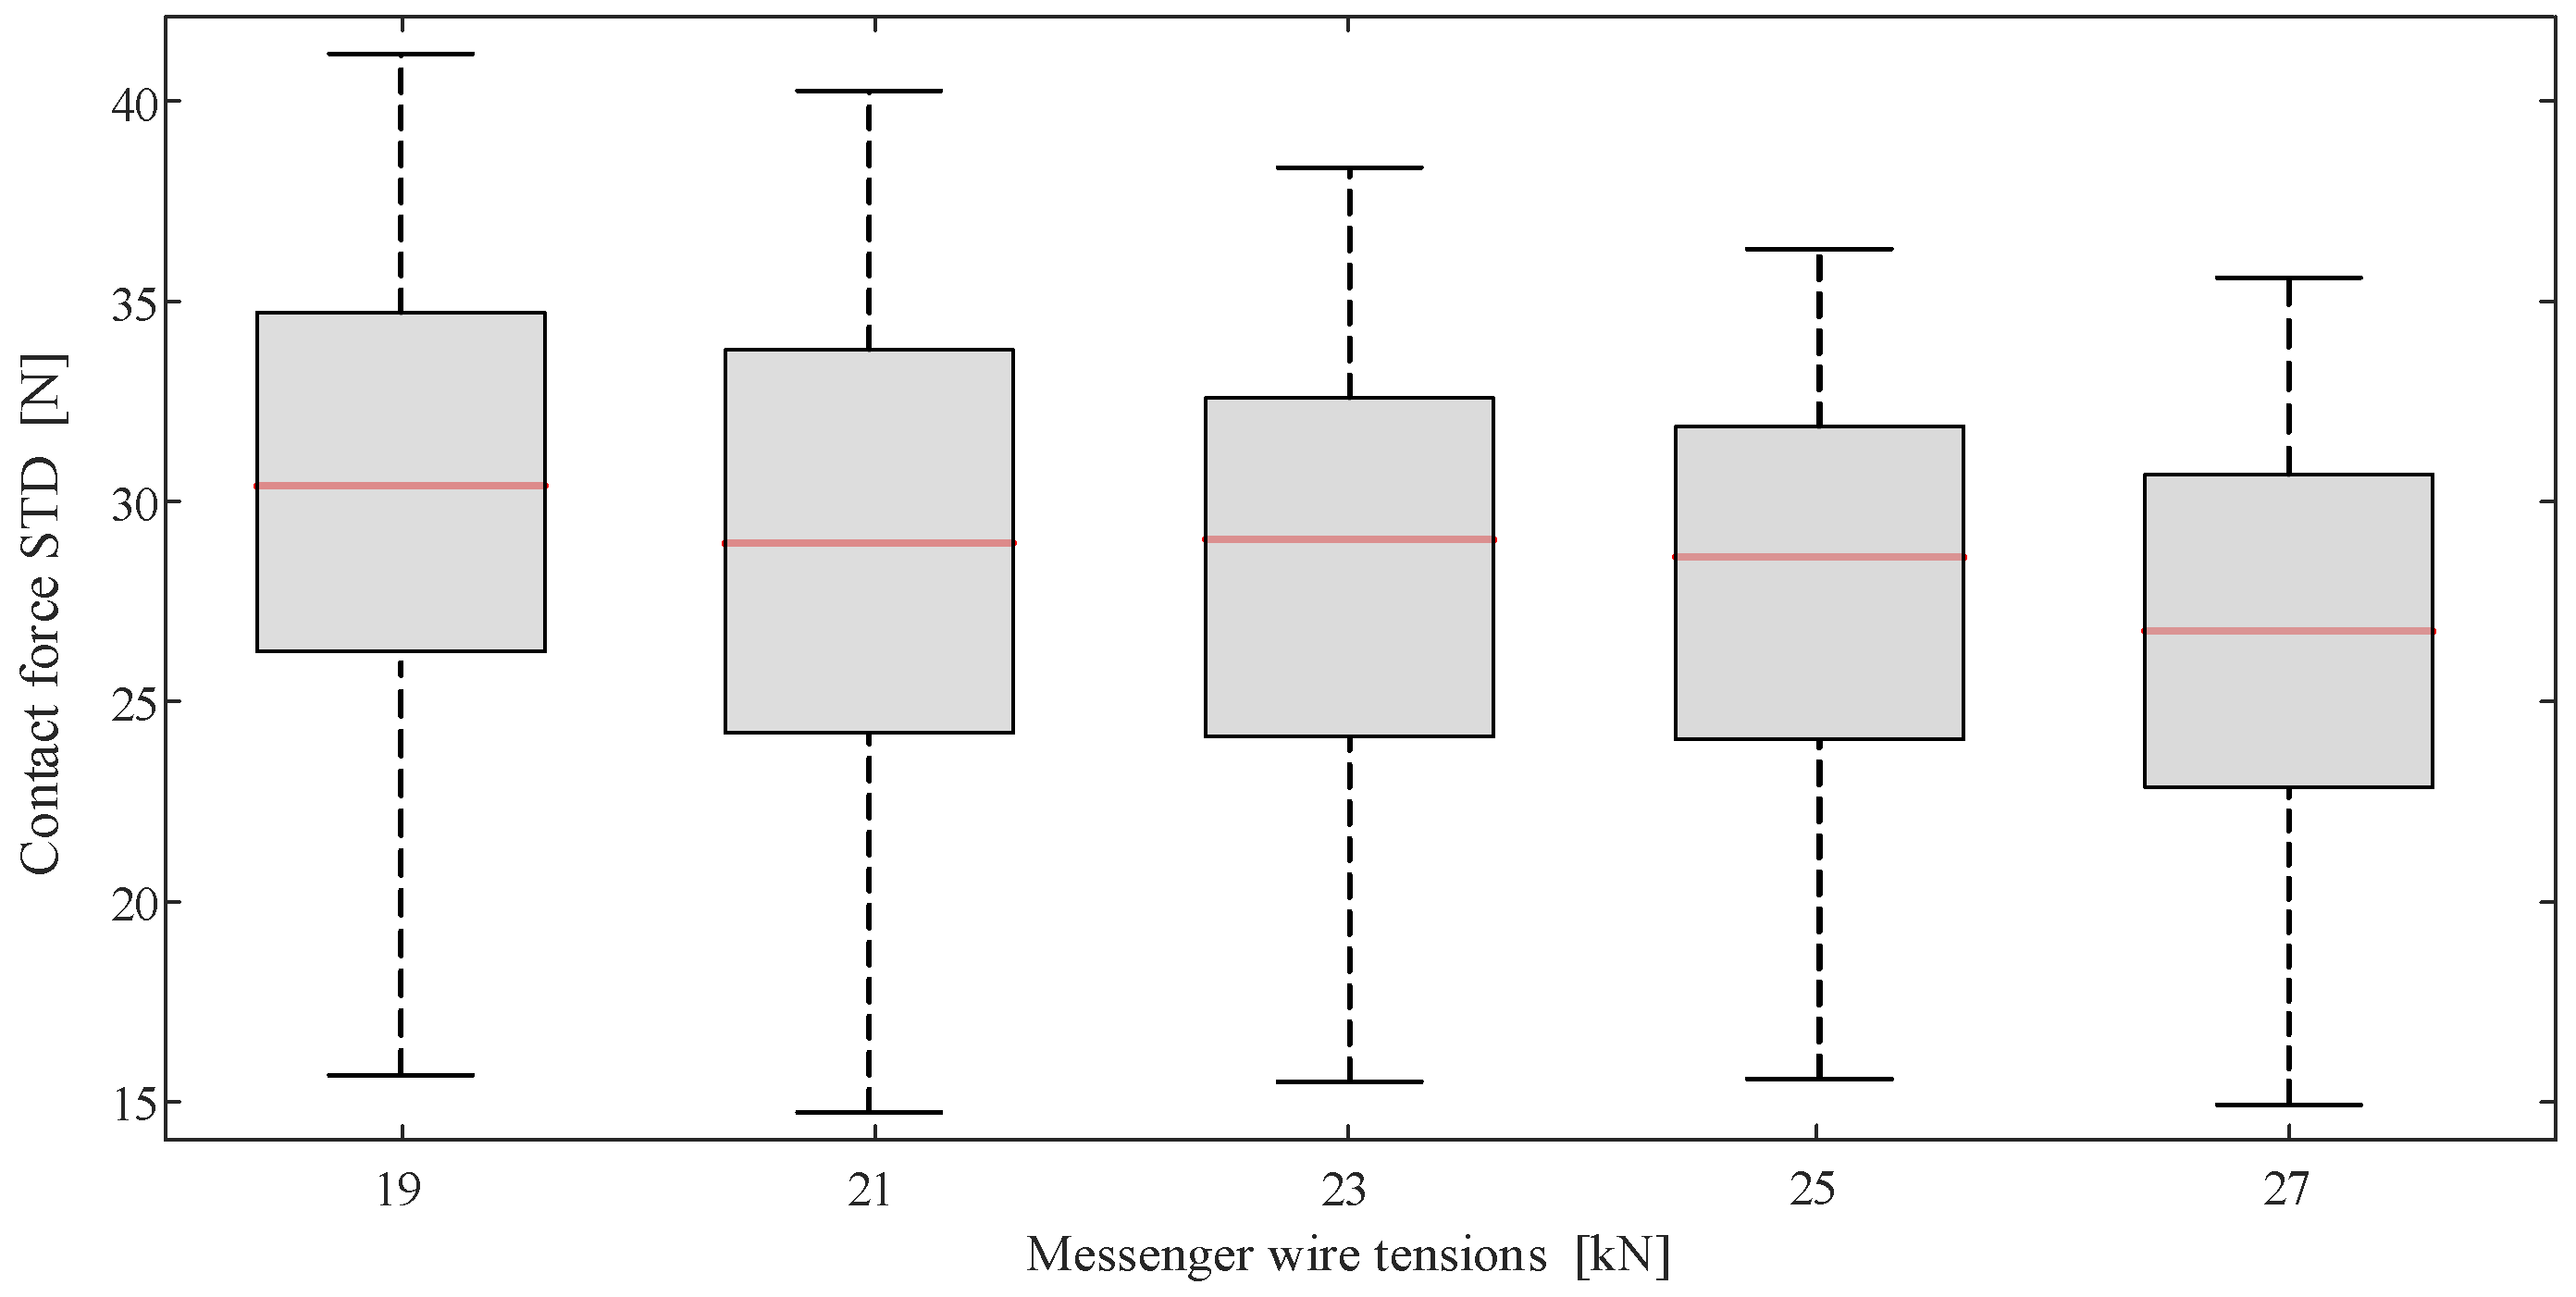
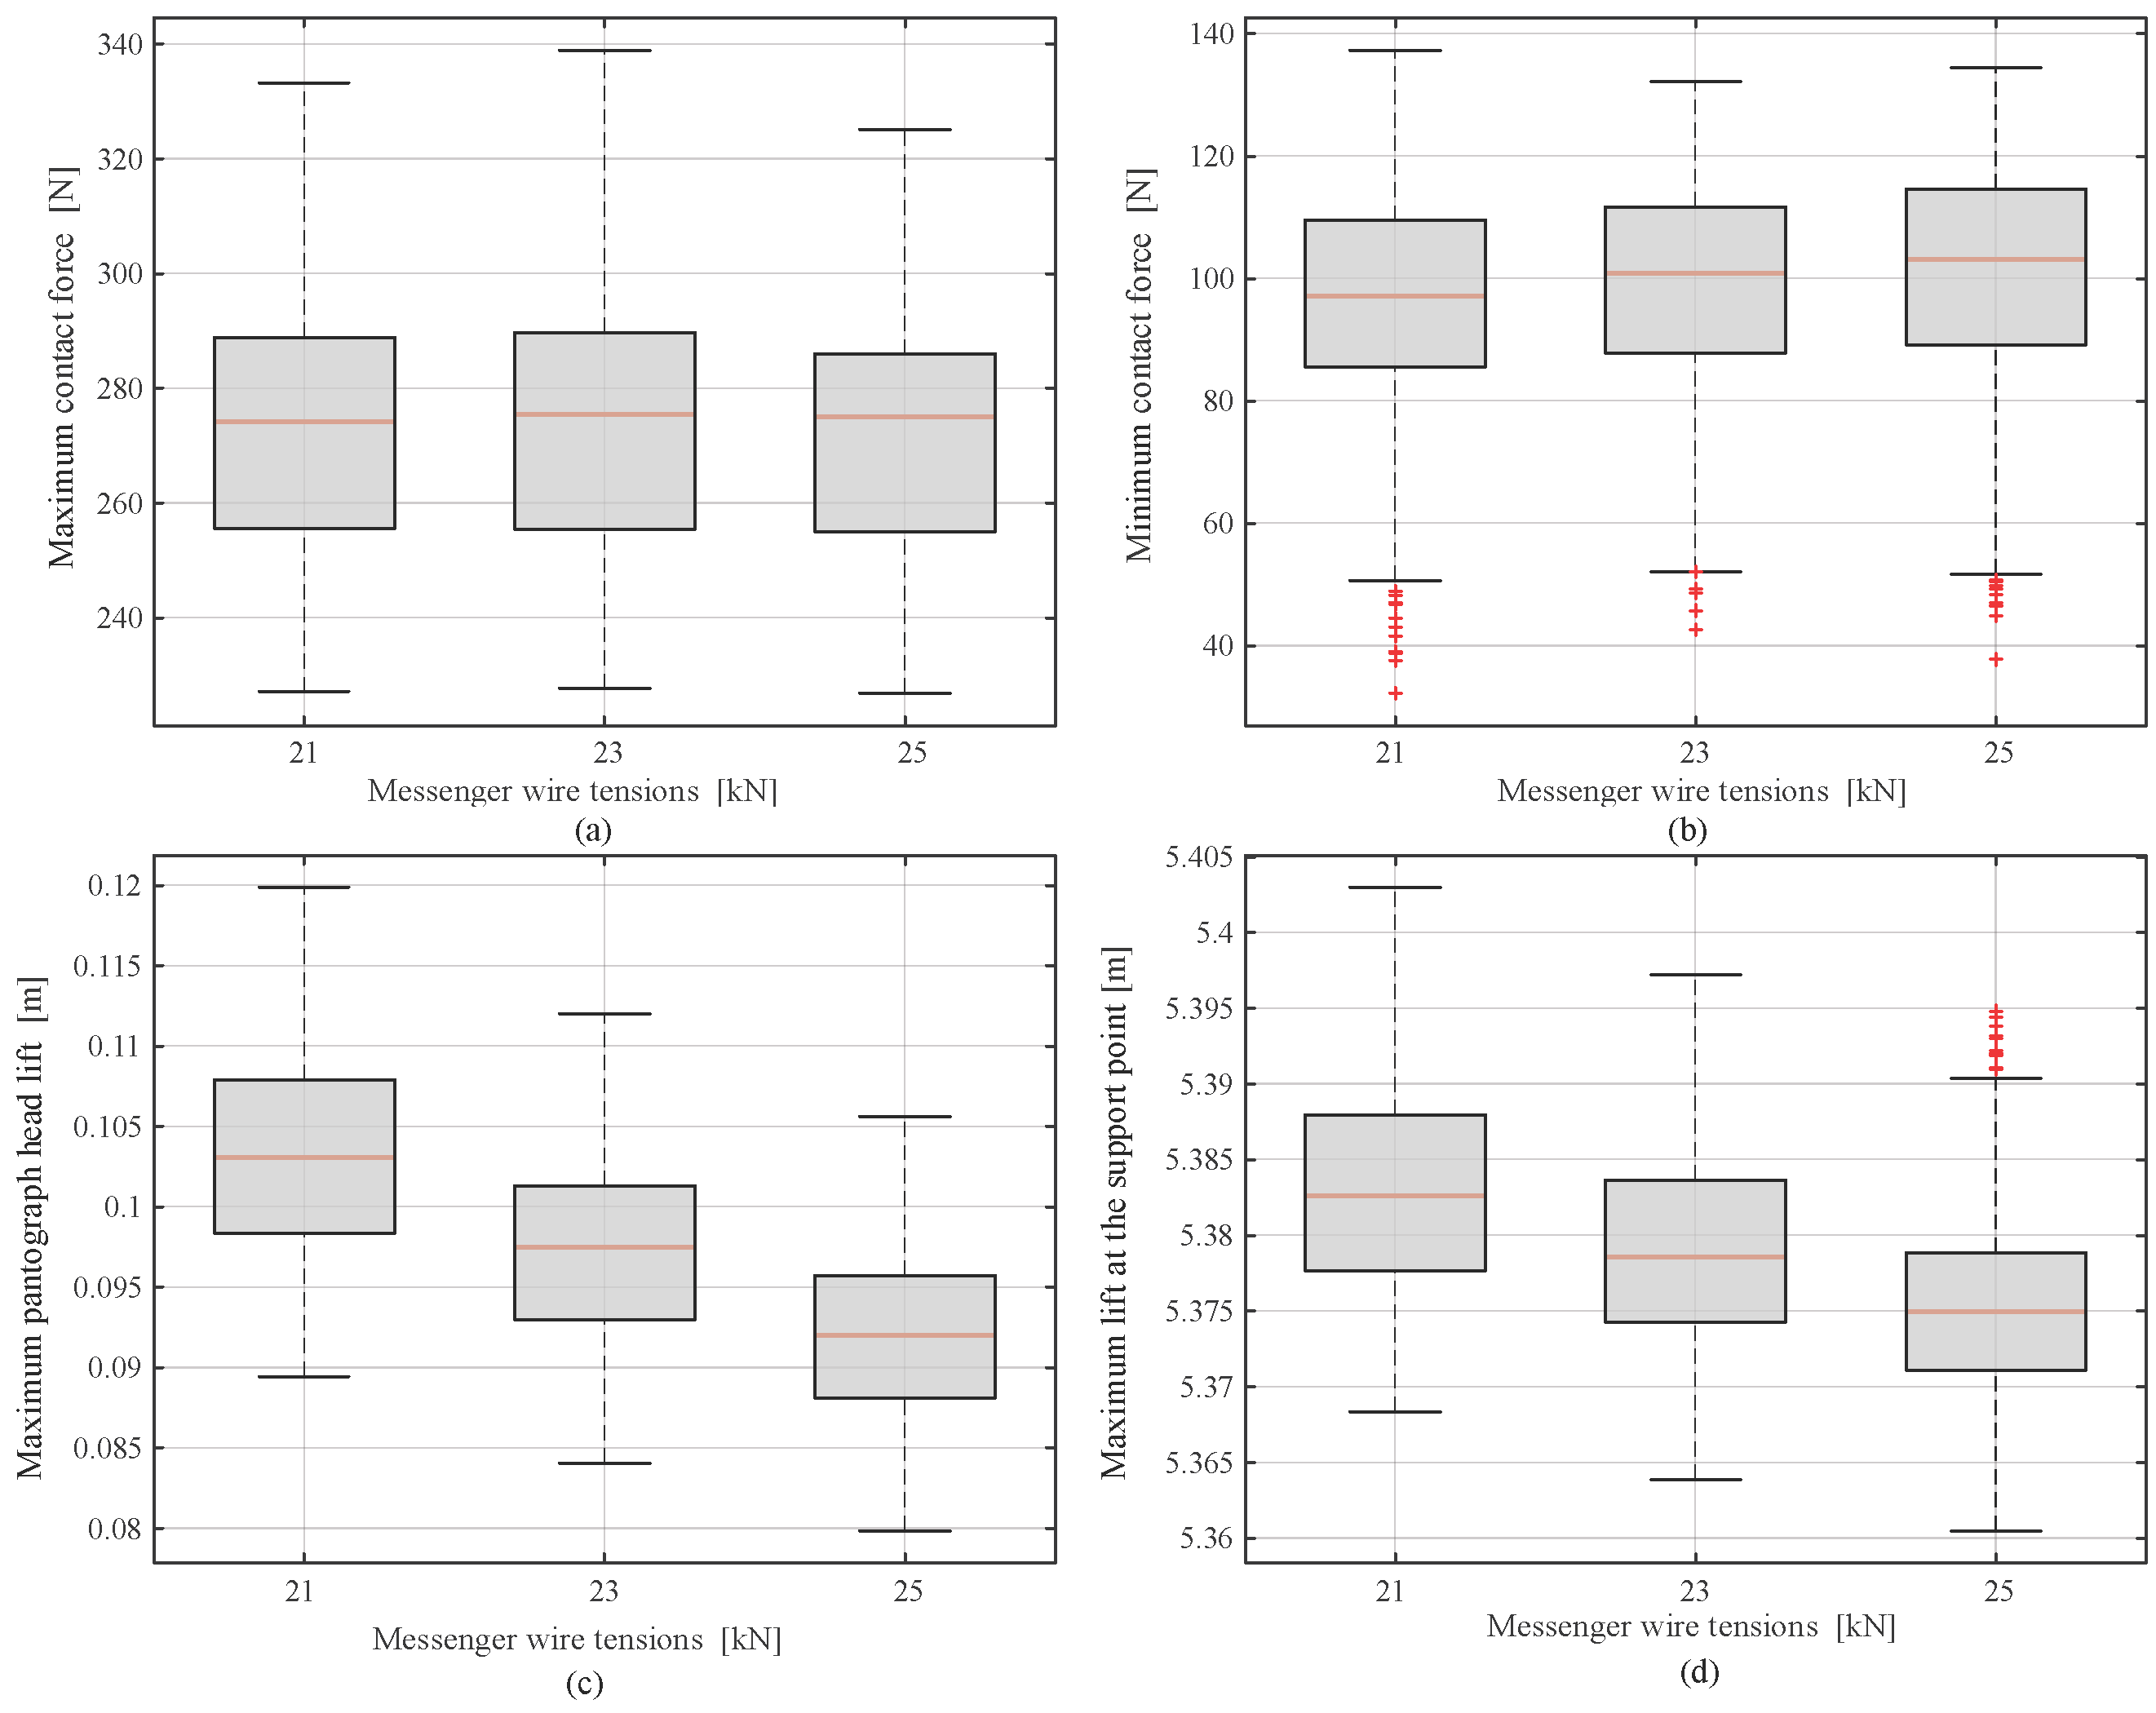
Next, we examine the effect of messenger wire tension. Figure 16 shows the box plots of the standard deviation of pantograph–catenary contact force corresponding to the different messenger wire tensions at 350 km/h. The effect of messenger wire tension on pantograph–catenary dynamic performance is minimal. When the messenger wire tension was increased from 21 kN to 25 kN, the mean standard deviation of contact forces decreased by 1.4%. The PHL and SPL for different messenger wire tensions are presented in Figure 17. It is observed that both the PHL and SPL decrease significantly across all operating conditions as messenger wire tension increases. Therefore, increasing messenger wire tension benefits the dynamic performance of the pantograph–catenary system.
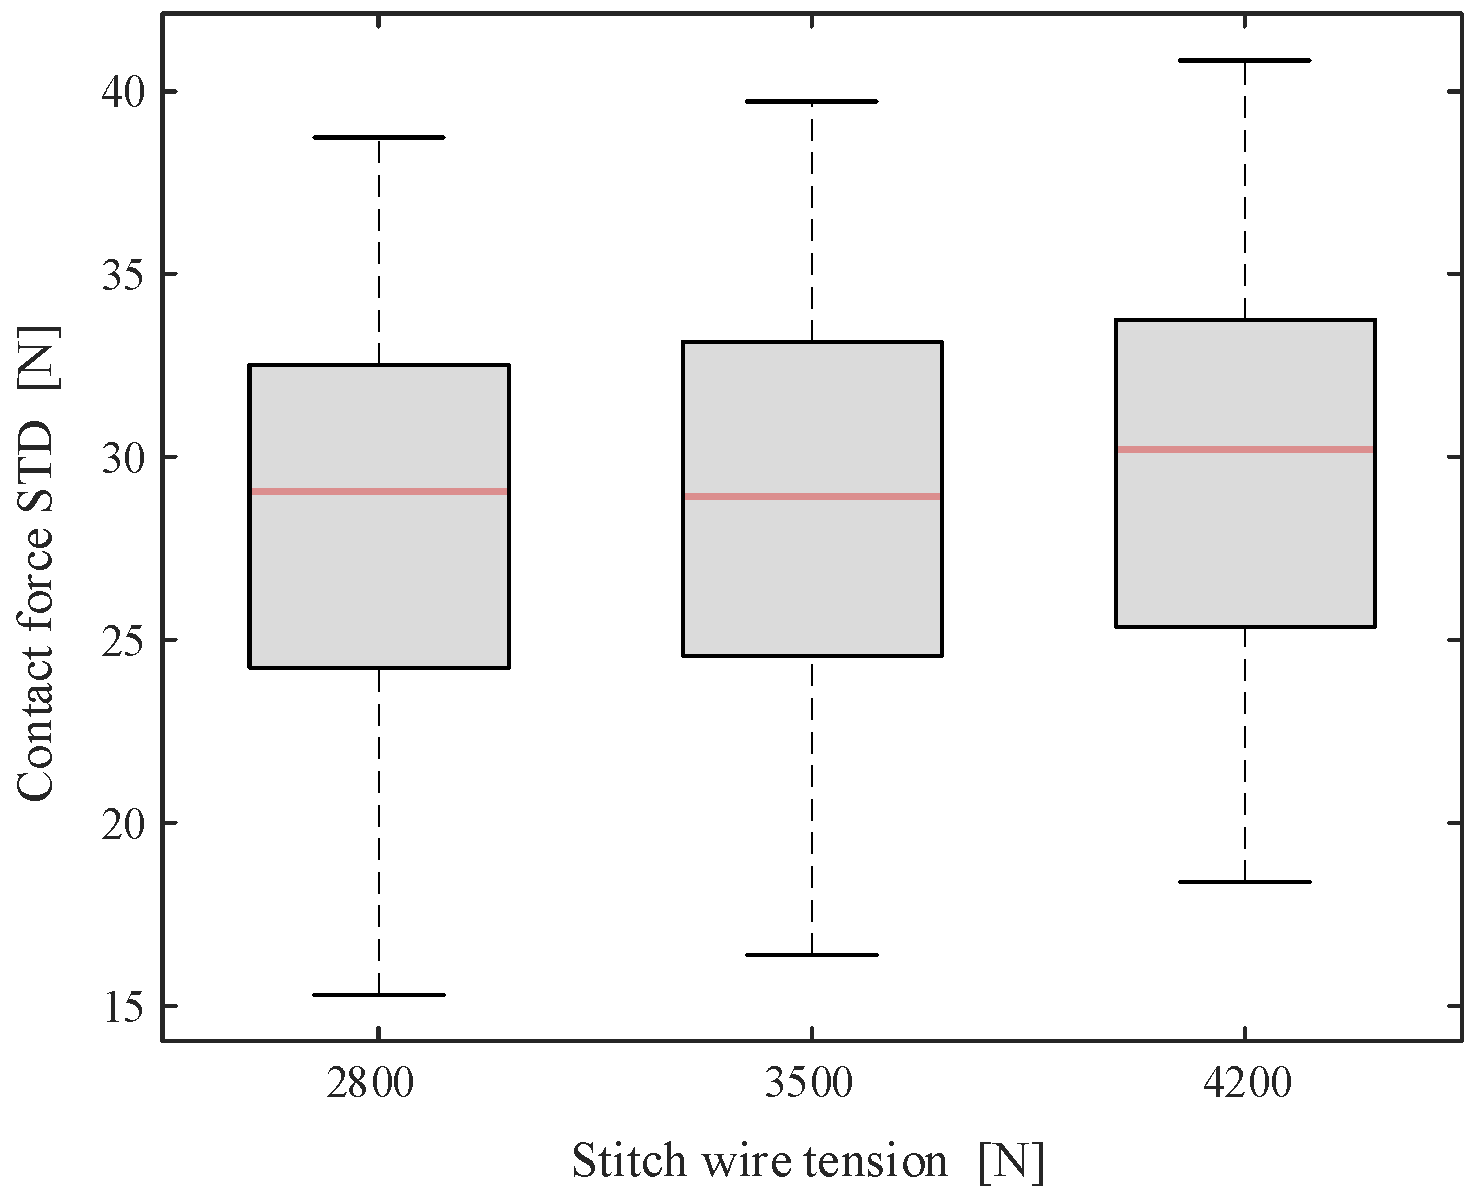
Finally, we examine the effect of stitch wire tension. Simulations are performed to obtain dynamic performance indicators for different stitch wire tensions at 350 km/h. Figure 18 shows the standard deviation of the pantograph–catenary contact force for each of the 729 operating conditions under varying stitch wire tensions.
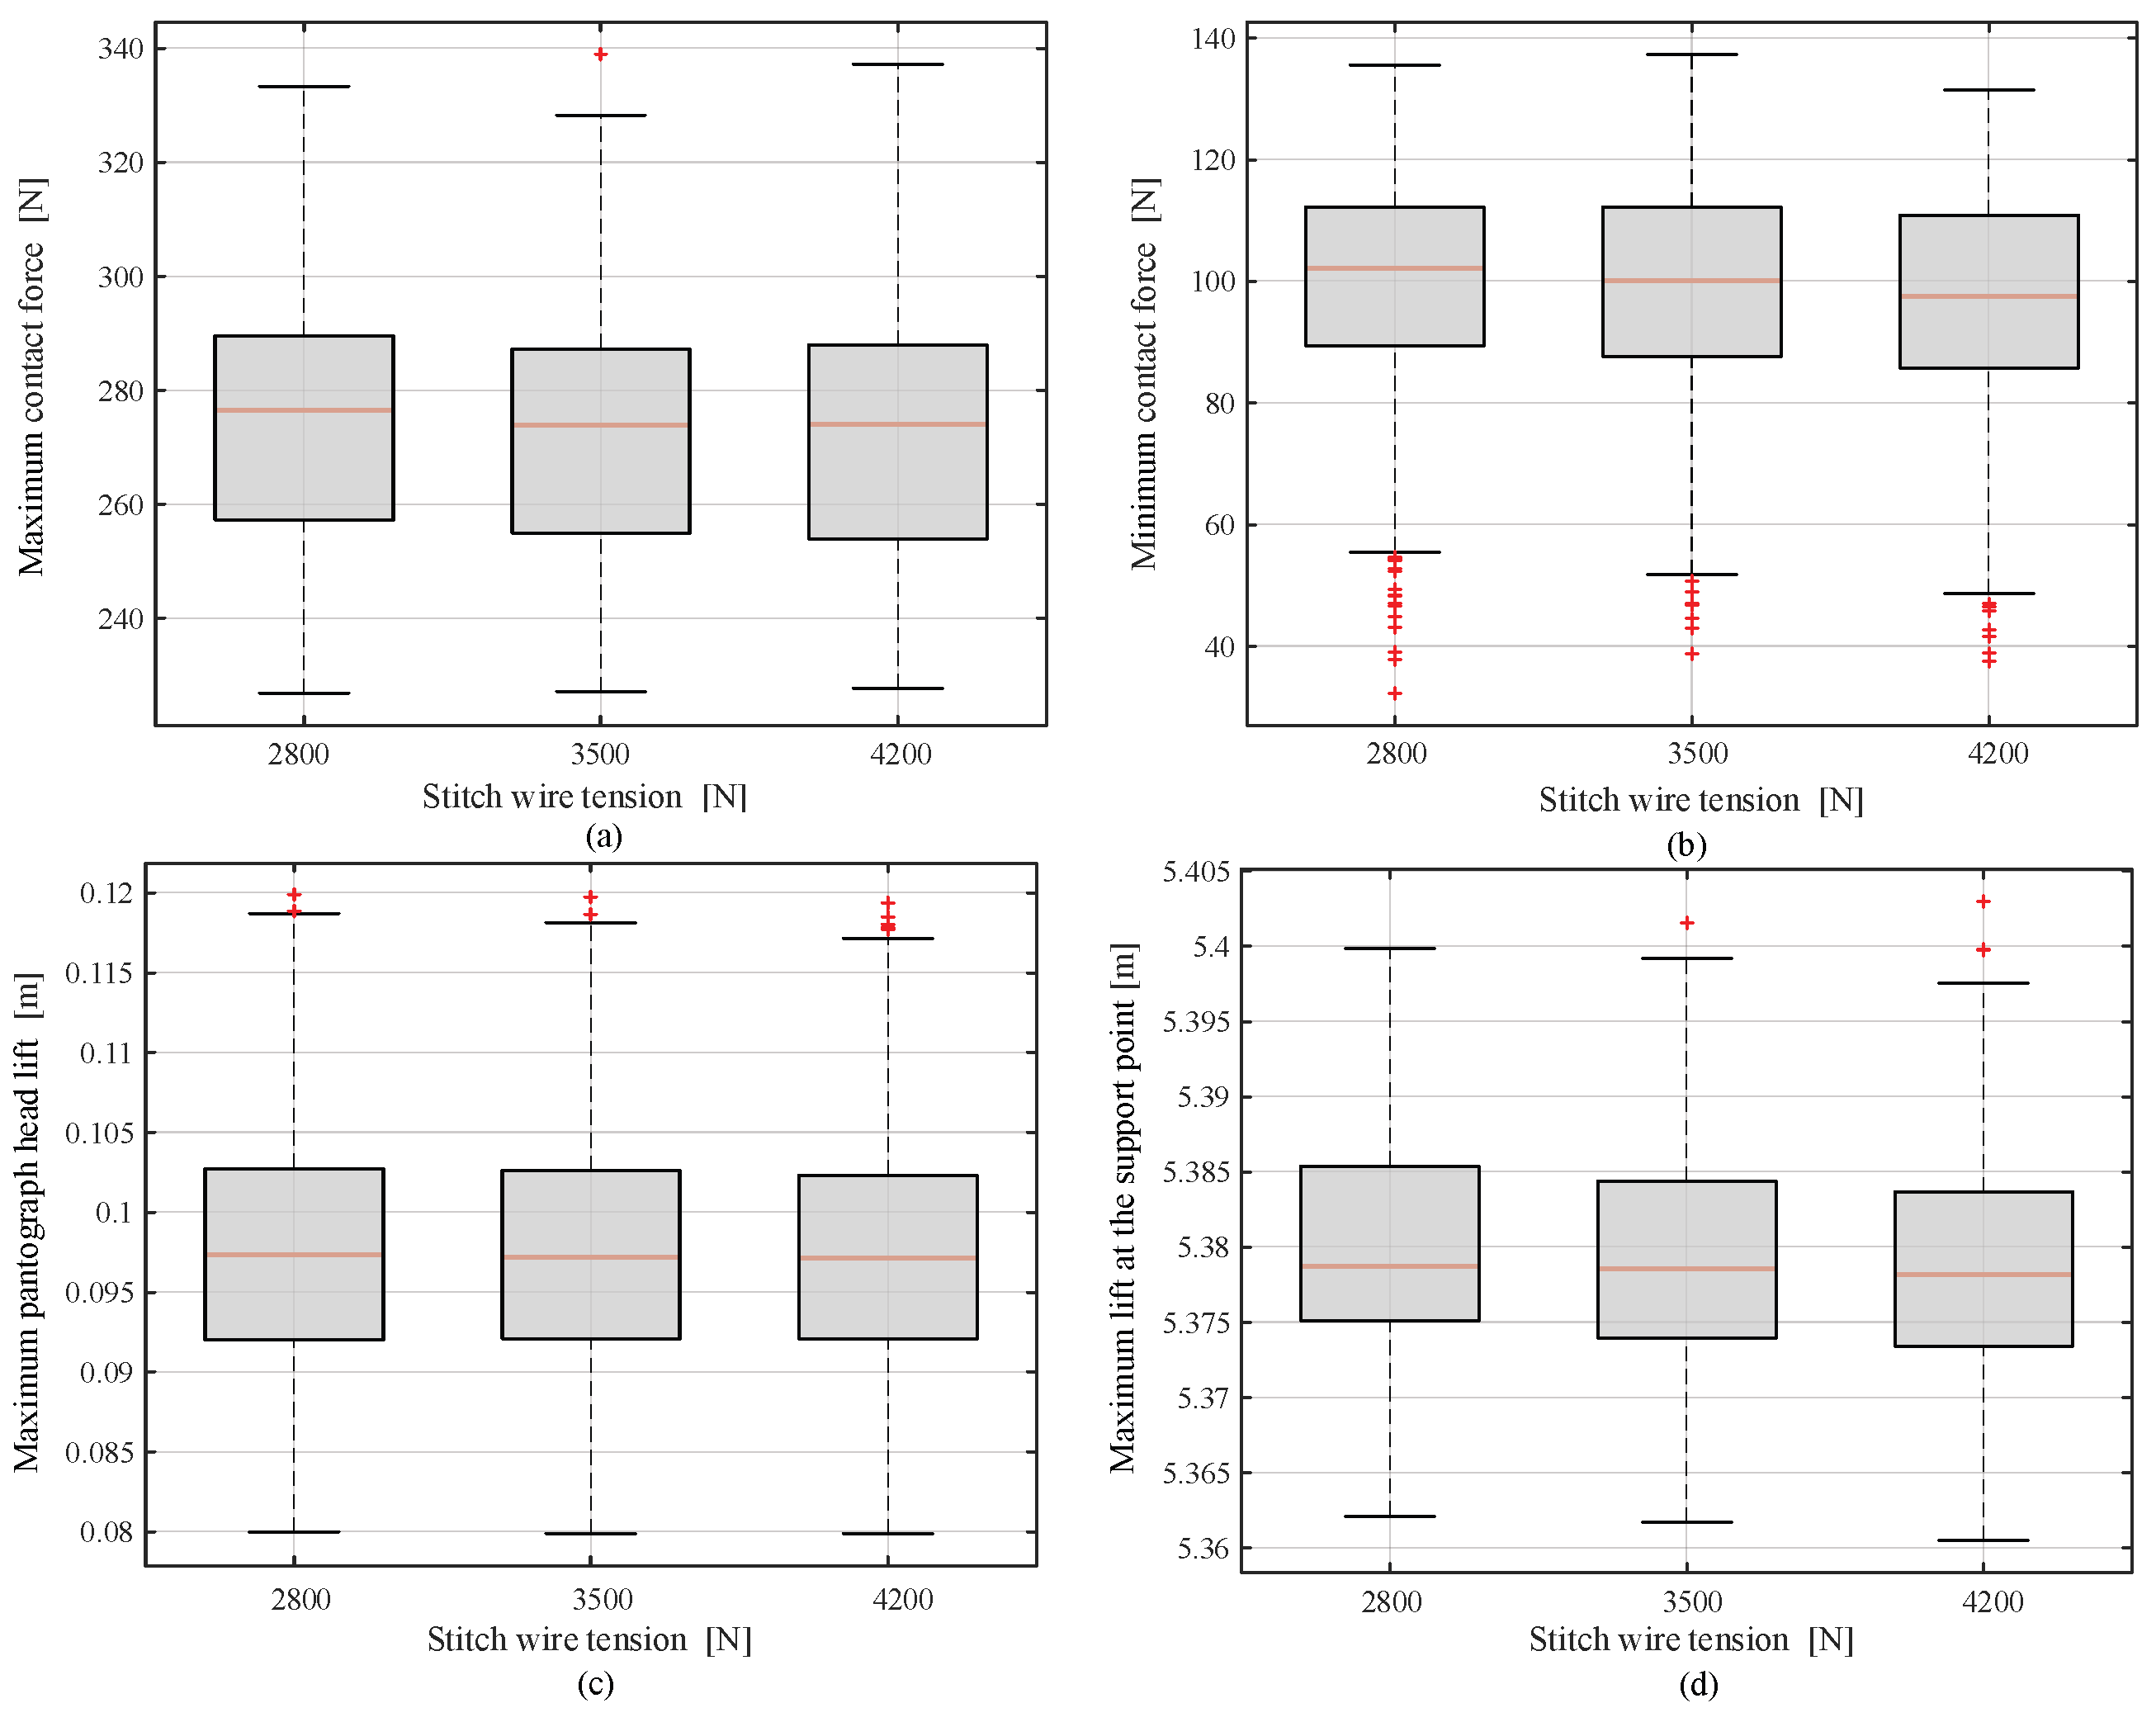
As stitch wire tension increases, the differences in the standard deviation of the pantograph–catenary contact force across all cases remain minimal, with no clear pattern observed. This suggests that stitch wire tension has little effect on the current collection quality of the pantograph–catenary system. Figure 19 presents the PHL and SPL for varying stitch wire tensions. No significant differences are observed in either the PHL or SPL across the different stitch wire tensions. Therefore, it can be concluded that stitch wire tension has a minimal effect on pantograph–catenary dynamic performance.
It should be noted that while this study primarily focuses on the 350 km/h operational condition, which represents the mainstream high-speed rail standard, the observed parameter effects exhibit strong consistency across different speed ranges. Internal verification conducted at 300 km/h and 380 km/h indicates that although the absolute sensitivity of indicators (e.g., the contact force STD) varies with speed, the directional influence of key parameters remains unchanged. For instance, the negative impact of increased span length and the beneficial effects of higher contact wire tension and dropper density are qualitatively consistent across 300 km/h to 380 km/h range. This confirms that the design insights derived at 350 km/h provide a reliable reference for broader high-speed rail applications.
While the individual sensitivity of certain tension parameters may appear low, their practical engineering value is substantial when operating at the frontiers of high-speed rail, such as the 400 km/h threshold. In these regimes, the margin for error according to EN 50367 is extremely narrow. Any reduction in contact force STD serves as a critical buffer against stochastic environmental excitations. Moreover, optimizing these parameters facilitates a more uniform elasticity distribution across the span, which is essential for suppressing arcing and localized wear, ultimately translating into lower life-cycle costs for infrastructure maintenance.

7. Conclusions

This study conducted a comprehensive evaluation of pantograph–catenary interaction through 2187 dynamic simulations at 350 km/h. The quantitative findings are summarized as follows:
(1)
The relationship between system parameters and dynamic performance is nonlinear. The identified optimal configuration utilizes the FVCX pantograph, a 45 m span, and a 30 kN contact wire tension, achieving a significantly lower contact force STD of 23.69 N compared to the worst-case scenario.
(2)
Span length is the most critical catenary shape parameter at 350 km/h. Increasing the span from 45 m to 55 m resulted in a 16.8% increase in the mean contact force STD. Furthermore, this variation led to a 13.9% decrease in the minimum contact force and respective increases of 8.5% and 10.6% in the maximum PHL and SPL.
(3)
Increasing contact wire tension from 27 kN to 30 kN improved current collection quality, evidenced by a 3.5% reduction in mean contact force STD. In comparison, increasing messenger wire tension from 21 kN to 25 kN yielded a more marginal improvement of 1.4%.
(4)
Increasing the number of droppers from six to eight produced a 3.9% reduction in mean STD. While increasing stitch wire length from 14 m to 18 m reduced the mean contact force STD by 10.2%, it simultaneously increased the maximum SPL, indicating a complex trade-off in structural optimization.
In practice, these findings offer practical guidance for railway engineers and system designers in selecting and optimizing key system parameters to achieve a better current collection quality. Additionally, the dynamic model developed here can be used as a reliable tool for evaluating the performance of various pantograph–catenary configurations in different operational conditions, providing an essential framework for future research and system improvements in high-speed rail networks.
It is noteworthy that although we initially aimed to consider a comprehensive set of pantograph–catenary system parameters affecting current collection quality, computational constraints necessitated the selection of seven representative parameters for systematic analysis. Subsequent studies will incorporate additional critical parameters, particularly those related to pre-sag characteristics, to enhance the completeness of the parameter space. Meanwhile, our conclusions are primarily applicable to speeds near 300 km/h, and future work will extend to multi-speed scenarios. Employing hardware-in-the-loop (HIL) simulation to validate our findings also represents a key future research direction. By coupling a virtual catenary model with a physical pantograph, this approach enables realistic measurement of pantograph–catenary contact forces under varying parameters, thereby bridging simulation and real-world conditions. Furthermore, this investigation intentionally excluded external interference factors, including contact wire irregularities and train-induced vibrations, to establish fundamental understanding. These realistic operational conditions will be specifically addressed in future research phases through advanced dynamic coupling models and field-validated simulations.

Author Contributions

Conceptualization, T.X. and X.W.; methodology, T.X. and X.W.; software, L.P., X.W. and Y.S.; validation, D.Z. and Q.Y.; formal analysis, L.P. and X.W.; investigation, T.X. and X.W.; resources, X.W. and Y.S.; data curation, X.W. and Y.S.; writing—original draft preparation, T.X. and X.W.; writing—review and editing, L.P. and Y.S.; visualization, X.W.; supervision, Y.S.; project administration, Y.S.; funding acquisition, T.X. and Y.S. All authors have read and agreed to the published version of the manuscript.

Funding

This research was funded by National Natural Science Foundation of China (U2468230, 52477129), Scientific and Technological Research and Development Program of China State Railway Group Co., Ltd. (L2025G002), China Academy of Railway Science (2024YJ281), Sichuan Science and Technology Program (No. 26GJHZ0421).

Institutional Review Board Statement

Not applicable.

Informed Consent Statement

Not applicable.

Data Availability Statement

The original contributions presented in this study are included in the article. Further inquiries can be directed to the corresponding author.

Conflicts of Interest

Authors Tong Xing, Like Pan and Qun Yu were employed by the company China Academy of Railway Sciences Corporation Ltd. Author Dehai Zhang was employed by the company Sichuan Development International Commercial Spaceport Co., Ltd. The remaining authors declare that the research was conducted in the absence of any commercial or financial relationships that could be construed as a potential conflict of interest.

References

  1. Bucca, G.; Collina, A.; Manigrasso, R.; Mapelli, F.; Tarsitano, D. Analysis of electrical interferences related to the current collection quality in pantograph–catenary interaction. Proc. Inst. Mech. Eng. Part F J. Rail Rapid Transit 2011, 225, 483–500. [Google Scholar] [CrossRef] [Scilit]
  2. Zuo, W.; Li, K. Electrification of urban road traffic: A reliability analysis of traction power supply for electric road systems. Transp. Saf. Environ. 2024, 6, tdae003. [Google Scholar] [CrossRef] [Scilit]
  3. Bruni, S.; Bucca, G.; Facchinetti, A.; Gregori, S.; Pombo, J. Recent developments on pantograph-overhead line interaction. Veh. Syst. Dyn. 2025, 63, 1358–1394. [Google Scholar] [CrossRef] [Scilit]
  4. Wang, H.; Song, Y.; Yang, H.; Liu, Z. Generalized Koopman Neural Operator for Data-Driven Modeling of Electric Railway Pantograph–Catenary Systems. IEEE Trans. Transp. Electrif. 2025, 11, 14100–14112. [Google Scholar] [CrossRef] [Scilit]
  5. Wang, X.; Song, Y.; Yang, H.; Wang, H.; Lu, B.; Liu, Z. A time-frequency dual-domain deep learning approach for high-speed pantograph-catenary dynamic performance prediction. Mech. Syst. Signal Process. 2025, 238, 113258. [Google Scholar] [CrossRef] [Scilit]
  6. Finner, L.; Poetsch, G.; Sarnes, B.; Kolbe, M. Program for catenary–pantograph analysis, PrOSA statement of methods and validation according EN 50318. Veh. Syst. Dyn. 2014, 53, 305–313. [Google Scholar] [CrossRef] [Scilit]
  7. Wang, X.; Song, Y.; Lu, B.; Wang, H.; Liu, Z. Assessment of Current Collection Performance of Rail Pantograph-Catenary Considering Long Suspension Bridges. IEEE Trans. Instrum. Meas. 2025, 74, 7500714. [Google Scholar] [CrossRef] [Scilit]
  8. Song, Y.; Liu, Z.; Gao, S. Current Collection Quality of High-Speed Rail Pantograph-Catenary Considering Geometry Deviation at 400 km/h and Above. IEEE Trans. Veh. Technol. 2024, 73, 14415–14424. [Google Scholar] [CrossRef] [Scilit]
  9. Bruni, S.; Ambrosio, J.; Carnicero, A.; Cho, Y.H.; Finner, L.; Ikeda, M.; Kwon, S.Y.; Massat, J.-P.; Stichel, S.; Tur, M.; et al. The results of the pantograph–catenary interaction benchmark. Veh. Syst. Dyn. 2014, 53, 412–435. [Google Scholar] [CrossRef] [Scilit]
  10. Song, Y.; Lu, X.; Yin, Y.; Liu, Y.; Liu, Z. Optimization of Railway Pantograph-Catenary Systems for Over 350 km/h Based on an Experimentally Validated Model. IEEE Trans. Ind. Inform. 2024, 20, 7654–7664. [Google Scholar] [CrossRef] [Scilit]
  11. Bruni, S.; Bucca, G.; Carnevale, M.; Collina, A.; Facchinetti, A. Pantograph–catenary interaction: Recent achievements and future research challenges. Int. J. Rail Transp. 2017, 6, 57–82. [Google Scholar] [CrossRef] [Scilit]
  12. Simarro, M.; Castillo, J.J.; Cabrera, J.A.; Postigo, S. Evaluation of the influence of the speed, preload and span length on the contact forces in the interaction between the pantograph and the overhead conductor rail. Eng. Struct. 2021, 243, 112678. [Google Scholar] [CrossRef] [Scilit]
  13. Zhang, J.; Yi, J.; Liu, W. Study of Time-Frequency Characteristics of Contact Force Signal and Parameter Sensitivity of Catenary of High-Speed Railway. IEEE Trans. Instrum. Meas. 2022, 71, 6500611. [Google Scholar] [CrossRef] [Scilit]
  14. Pombo, J.; Ambrósio, J. Influence of pantograph suspension characteristics on the contact quality with the catenary for high speed trains. Comput. Struct. 2012, 110–111, 32–42. [Google Scholar] [CrossRef] [Scilit]
  15. Zhou, N.; Zhang, W. Investigation on dynamic performance and parameter optimization design of pantograph and catenary system. Finite Elem. Anal. Des. 2011, 47, 288–295. [Google Scholar] [CrossRef] [Scilit]
  16. Yu, M.L.; Liu, W.Z.; Zhang, J.; Yan, C.Y. Influence of dropper spacing on quality of pantograph-catenary current collection. Appl. Mech. Mater. 2014, 654, 78–81. [Google Scholar] [CrossRef] [Scilit]
  17. Cho, Y.H.; Lee, K.; Park, Y.; Kang, B.; Kim, K.-N. Influence of contact wire pre-sag on the dynamics of pantograph–railway catenary. Int. J. Mech. Sci. 2010, 52, 1471–1490. [Google Scholar] [CrossRef] [Scilit]
  18. Zhang, W.; Liu, Y.; Mei, G. Evaluation of the coupled dynamical response of a pantograph—Catenary system: Contact force and stresses. Veh. Syst. Dyn. 2006, 44, 645–658. [Google Scholar] [CrossRef] [Scilit]
  19. Zhang, W. The development of China’s high-speed railway systems and a study of the dynamics of coupled systems in high-speed trains. Proc. Inst. Mech. Eng. Part F J. Rail Rapid Transit 2013, 228, 367–377. [Google Scholar] [CrossRef] [Scilit]
  20. Wu, M.; Xu, X.; Yan, Y.; Luo, Y.; Huang, S.; Wang, J. Multi-parameter joint optimization for double-strip high-speed pantographs to improve pantograph-catenary interaction quality. Acta Mech. Sin. 2022, 38, 521344. [Google Scholar] [CrossRef] [Scilit]
  21. Wang, J.; Mei, G.; Lu, L. Analysis of the pantograph’s mass distribution affecting the contact quality in high-speed railway. Int. J. Rail Transp. 2022, 11, 529–551. [Google Scholar] [CrossRef] [Scilit]
  22. Song, Y.; Liu, Z.; Rxnnquist, A.; Navik, P.; Liu, Z. Contact Wire Irregularity Stochastics and Effect on High-speed Railway Pantograph-Catenary Interactions. IEEE Trans. Instrum. Meas. 2020, 69, 8196–8206. [Google Scholar] [CrossRef] [Scilit]
  23. Bai, Y.; Zhang, J.; Liu, W.; Liu, X. Study on influence of contact wire design parameters on contact characteristics of pantograph-catenary. In Proceedings of the 2013 IEEE International Conference on Intelligent Rail Transportation Proceedings, Beijing, China, 30 August–1 September 2013; pp. 268–273. [Google Scholar]
  24. Wang, J.; Mei, G.; Lu, L. An improved full Fourier series method approaching the stitched catenary in high-speed railway. Int. J. Rail Transp. 2022, 12, 153–179. [Google Scholar] [CrossRef] [Scilit]
  25. Song, Y.; Liu, Z.; Wang, H.; Lu, X.; Zhang, J. Nonlinear modelling of high-speed catenary based on analytical expressions of cable and truss elements. Veh. Syst. Dyn. 2015, 53, 1455–1479. [Google Scholar] [CrossRef] [Scilit]
  26. Jimenez-Octavio, J.R.; Carnicero, A.; Sanchez-Rebollo, C.; Such, M. A moving mesh method to deal with cable structures subjected to moving loads and its application to the catenary–pantograph dynamic interaction. J. Sound Vib. 2015, 349, 216–229. [Google Scholar] [CrossRef] [Scilit]
  27. Gregori, S.; Tur, M.; Nadal, E.; Aguado, J.V.; Fuenmayor, F.J.; Chinesta, F. Fast simulation of the pantograph–catenary dynamic interaction. Finite Elem. Anal. Des. 2017, 129, 1–13. [Google Scholar] [CrossRef] [Scilit]
  28. Fomin, O.; Prokopenko, P.; Kara, S.; Píštěk, V.; Kučera, P. Study of the basic criteria of the pantograph and overhead line interaction in operating conditions. Results Eng. 2023, 19, 101336. [Google Scholar] [CrossRef] [Scilit]
  29. Nåvik, P.; Rønnquist, A.; Stichel, S. Identification of system damping in railway catenary wire systems from full-scale measurements. Eng. Struct. 2016, 113, 71–78. [Google Scholar] [CrossRef] [Scilit]
  30. Yao, Y.; Zou, D.; Zhou, N.; Mei, G.; Wang, J.; Zhang, W. A study on the mechanism of vehicle body vibration affecting the dynamic interaction in the pantograph–catenary system. Veh. Syst. Dyn. 2020, 59, 1335–1354. [Google Scholar] [CrossRef] [Scilit]
  31. Cho, Y.H. Numerical simulation of the dynamic responses of railway overhead contact lines to a moving pantograph, considering a nonlinear dropper. J. Sound Vib. 2008, 315, 433–454. [Google Scholar] [CrossRef] [Scilit]
  32. EN 50318:2018; Railway Applications—Current Collection Systems—Validation of Simulation of the Dynamic Interaction Between Pantograph and Overhead Contact Line. European Committee for Electrotechnical Standardization: Brussels, Belgium, 2018.
  33. EN 50367:2012/A1:2016; Railway Applications—Current Collection Systems—Technical Criteria for the Interaction B etween Pantograph and Overhead Line. European Committee for Electrotechnical Standardization: Brussels, Belgium, 2016.
  34. Yang, H.; Liu, Z.; Cui, H.; Ma, N.; Wang, H.; Zhang, C.; Song, Y. An Electrified Railway Catenary Component Anomaly Detection Frame Based on Invariant Normal Region Prototype with Segment Anything Model. IEEE Trans. Transp. Electrif. 2025, 12, 1391–1402. [Google Scholar] [CrossRef] [Scilit]
  35. Meng, X.; Xie, D.; Lin, H.; Lin, C.; Ge, X.; Liu, Z. Dissipativity-Based Multiport Stability Root-Cause Identification and Mitigation for Solid-State Transformers. IEEE Trans. Ind. Electron. 2026. Early access. [Google Scholar] [CrossRef] [Scilit]
Figure 1. Nonlinear cable element.
Infrastructures 11 00088 g001
Figure 2. Nonlinear truss element.
Infrastructures 11 00088 g002
Figure 3. Three-mass lumped mass pantograph model, dashed lines are used to demarcate the three sections: the collector head, the frame, and the base frame.
Infrastructures 11 00088 g003
Figure 4. The contact force standard deviation for all different pantograph–catenary parameters.
Infrastructures 11 00088 g004
Figure 5. Performance comparison between optimal and worst parameter case. (a) Contact force; (b) PHL; (c) SPL.
Infrastructures 11 00088 g005
Figure 6. The contact force standard deviation of three different pantographs.
Infrastructures 11 00088 g006
Figure 7. More dynamic performance indicators of three different pantographs. (a) Maximum contact force; (b) Minimum contact force; (c) Maximum PHL; (d) Maximum SPL.
Infrastructures 11 00088 g007
Figure 8. The contact force standard deviation of different span length.
Infrastructures 11 00088 g008
Figure 9. More dynamic performance indicators of three different span lengths. (a) Maximum contact force; (b) Minimum contact force; (c) Maximum PHL; (d) Maximum SPL.
Infrastructures 11 00088 g009
Figure 10. The contact force standard deviation of different numbers of droppers.
Infrastructures 11 00088 g010
Figure 11. More dynamic performance indicators of three different numbers of droppers. (a) Maximum contact force; (b) Minimum contact force; (c) Maximum PHL; (d) Maximum SPL.
Infrastructures 11 00088 g011
Figure 12. The contact force standard deviation of three different stitch wire lengths.
Infrastructures 11 00088 g012
Figure 13. More dynamic performance indicators of three different stitch wire lengths. (a) Maximum contact force; (b) Minimum contact force; (c) Maximum PHL; (d) Maximum SPL.
Infrastructures 11 00088 g013
Figure 14. The contact force standard deviation of different contact wire tensions.
Infrastructures 11 00088 g014
Figure 15. More dynamic performance indicators of three different contact wire tensions. (a) Maximum contact force; (b) Minimum contact force; (c) Maximum PHL; (d) Maximum SPL.
Infrastructures 11 00088 g015
Figure 16. The contact force standard deviation of different messenger wire tensions.
Infrastructures 11 00088 g016
Figure 17. More dynamic performance indicators of three different messenger wire tensions. (a) Maximum contact force; (b) Minimum contact force; (c) Maximum PHL; (d) Maximum SPL.
Infrastructures 11 00088 g017
Figure 18. The contact force standard deviation of three different stitch wire tensions.
Infrastructures 11 00088 g018
Figure 19. More dynamic performance indicators of three different stitch wire tensions. (a) Maximum contact force; (b) Minimum contact force; (c) Maximum PHL; (d) Maximum SPL.
Infrastructures 11 00088 g019
Table 1. Comparison of contact force statistics between simulation and measurement.
Model Simulation [N]Measured
Data [N]
ErrorThreshold
Maximum value258.51271−4.6%/
Mean value185.24185.5−0.26 N±2.5 N
Standard deviation27.37128.1−2.6%±20%
Table 2. Value range of pantograph–catenary system structural parameters.
Parameters
PantographDSA380, FVCX, SSS400+
Span length (m)45, 50, 55
Messenger wire tension (kN)21, 23, 25
Contact wire tension (kN)27, 28.5, 30
Number of droppers6, 7, 8
Stitch wire length (m)14, 16, 18
Stitch wire tension (N)2800, 3500, 4200
Table 3. Optimal and worst combinations of pantograph–catenary parameters.
ParametersCase NumberPantographSpan Length (m)Messenger Wire Tension (kN)Contact Wire Tension (kN)Number of DroppersStitch Wire Length (m)Stitch Wire Tension (N)
Optimal performance805FVCX4521308162800
Worst performance1740SSS400+502128.57144200
Table 4. Result of ANOVA across all catenary parameter combinations.
ParametersSpanTmwTcwDropNumStitchLStitchTSpan × Tmw
Contribution (%)40.275.127.057.927.261.890.91
ParametersSpan × TcwSpan × DropNumSpan × StitchLSpan × StitchTTmw × TcwTmw × DropNumTmw × StitchL
Contribution (%)0.324.542.230.323.140.200.29
ParametersTmw × StitchTTcw × DropNumTcw × StitchLTcw × StitchTDropNum × StitchLDropNum × StitchTStitchL × StitchT
Contribution (%)0.111.030.420.110.102.380.44
Table 5. Lumped mass parameters for the three pantograph models.
Pantograph 1Pantograph 2Pantograph 3
m17.1256.1
m269.9810.154
m35.8910.3
c10510
c2050
c370350120
k19430600010,400
k214,100897110,600
k30.10.50.1
Table 6. Average statistical indicators of dynamic performance for three different pantograph types.
Pantograph 1Pantograph 2Pantograph 3
Contact force STD31.3423.6931.94
Maximum contact force283.34249.54285.50
Minimum contact force92.71113.4489.58
Maximum PHL0.09990.09310.0996
Maximum SPL5.379445.378155.37988
Disclaimer/Publisher’s Note: The statements, opinions and data contained in all publications are solely those of the individual author(s) and contributor(s) and not of MDPI and/or the editor(s). MDPI and/or the editor(s) disclaim responsibility for any injury to people or property resulting from any ideas, methods, instructions or products referred to in the content.