Article

Bridge Health Monitoring and Assessment in Industry 5.0: Lessons Learned from Long-Term Real-Time Field Monitoring of Highway Bridges

1
School of Civil and Environmental Engineering, University of Connecticut, Storrs, CT 06269, USA
2
School of Computing, University of Connecticut, Storrs, CT 06269, USA
*
Author to whom correspondence should be addressed.
Infrastructures 2026, 11(2), 55; https://doi.org/10.3390/infrastructures11020055
Submission received: 8 December 2025 / Revised: 2 February 2026 / Accepted: 5 February 2026 / Published: 7 February 2026

Abstract

The rapid aging of bridges has increased interest in real-time, data-driven monitoring for predictive maintenance and safety management; however, practical deployment on in-service bridges remains limited. This paper presents lessons learned from long-term field deployment of real-time bridge joint monitoring systems on three in-service highway bridges and demonstrates how these insights can support the transition toward Industry 5.0. A unified framework is introduced to integrate key enabling technologies, including Internet of Things (IoT), digital twins, and artificial intelligence (AI), into a practical, human-centric monitoring architecture. Best practices for achieving durable, site-compliant, and cost-effective system design are summarized, with emphasis on sensor selection, wireless communication strategies, modular system development, and maintaining seamless operation. The development of a Docker-based analytics and visualization platform illustrates how interactive dashboards enhance human–machine collaboration and support informed decision-making. The role of advanced analytical tools, including digital twins, AI, and statistical modeling, in providing reliable structural assessments is highlighted, along with guidance on balancing cloud and edge computing for energy-efficient performance under constraints such as limited power, weather exposure, and site accessibility. Overall, the findings support the development of scalable, resilient, and human-centric real-time monitoring systems that advance data-driven decision-making and directly contribute to the realization of Industry 5.0 objectives in bridge health management.

1. Introduction

Maintaining public safety and operational continuity of highway bridges is becoming increasingly challenging for bridge management agencies due to the growing number of underperforming structures and limited funding [1]. In the USA alone, more than half of the bridges have been downgraded from good to poor or structurally fair condition, yet many continue to carry significant daily traffic; according to the ASCE estimate in 2025, structurally poor bridges were crossed 178 million times in a single day [2]. Managing these bridges with limited resources while ensuring safety and continuity is therefore a major challenge. Currently, agencies rely on regular inspections and condition assessments, with federal regulations mandating inspections of all bridges every two years [3]. These inspections are primarily visual [4], involving measurements, sound tests, and surveys for cracks, spalling, deformities, or corrosion, followed by a global structural rating that informs maintenance or rehabilitation decisions [4,5]. However, several studies [4,5,6] have highlighted that these conventional methods are time-consuming, costly, subject to inspector bias, prone to missing defects in visually inaccessible areas, and incapable of capturing time-varying issues such as crack propagation. Therefore, there was a clear need for more efficient and reliable approaches to evaluate bridge conditions.
The Federal Highway Administration (FHWA) of the U.S. Department of Transportation recently revised the National Bridge Inspection Standards (NBIS) [7], introducing a risk-based inspection schedule, stricter inspector qualifications, and support for data-driven monitoring. Complementary documents, including the Specifications for National Bridge Inventory (SNBI) [8] and the American Association of State Highway and Transportation Officials Manual for Bridge Element Inspection (AASHTO MBEI) [9], provide standardized element-level data collection, condition ratings, and decision matrices, while encouraging the use of supplementary technologies. These updates align with Industry 5.0 principles, which, in the context of bridge monitoring, can be defined as a human-centric and assistive technology paradigm in which interconnected sensors, digital twins, and intelligent analytics work collaboratively with engineers and infrastructure agencies to support safer, more sustainable, and resilient bridge management [10]. Industry 4.0 tools such as IoT, cloud computing, and AI can support interactive dashboards for bridge monitoring, improving inspection efficiency, enabling data-driven risk evaluation, and ultimately extending bridge life while maintaining public safety. Developing and deploying such integrated monitoring systems is therefore a key step toward implementing Industry 5.0 in bridge health management.
Real-time bridge monitoring systems offer a powerful means to support inspectors and agencies in achieving data-driven, predictive maintenance, enhancing the resilience, durability, and safety of aging infrastructure. Continuous monitoring and predictive analytics enable accurate estimation of structural condition, deterioration rate, and remaining service life, surpassing the reliability of periodic visual inspections [11]. Access to real-time condition data allows agencies to implement priority-based maintenance plans instead of fixed schedules, optimizing resource allocation and minimizing costly downtime [12]. By enabling early interventions, these systems help slow deterioration, extend service life, maintain operational continuity, prevent catastrophic failures, and ultimately improve public safety.
Despite its value, research and actual use in practice on in-service bridges of real-time bridge health monitoring technology remains limited. Prior studies have primarily focused on the development of real-time data-based structural assessment algorithms without considering ways to collect such data. For example, a CNN-based method was used to estimate bridge loss factors from vibration spectra and validated it using data from the Saigon Bridge [13]; however, it did not address how to collect or sustain real-time data in long-term applications. Another research [5] proposed a BIM-based framework that integrated real-time sensor data with script-generated finite element models for damage visualization, yet its validation relied on only three sensors and did not evaluate large-scale, resource-constrained deployments. Article [14] provided the development of an extended Kalman filter and statistical process control approach for real-time damage detection, validated through traditional on-site acquisition systems. Several studies [15,16,17,18,19] also assessed structural health monitoring algorithms using data collected in a lab using a direct wired connection. While informative, these approaches do not reflect the practical challenges of in-service bridge monitoring, where fully deployable real-time sensing and communication systems are essential.
The limited practical implementation and piecemeal development of real-time monitoring systems stem from the lack of a comprehensive framework to integrate all components into a fully deployable solution. The reliability-based management frameworks developed by Frangopol et al. [20,21,22] provided a way to connect monitoring data with performance assessment and optimization of inspection, maintenance, and repair under uncertainty and cost constraints [23] by updating time-variant reliability and deterioration models [23,24,25]. This framework successfully established the methods and models to embed structural monitoring data into the life-cycle management of bridges; however, the structured framework required to collect and process such data from the highway bridge network in a practical and cost-effective manner was still lacking.
Recently, the research team developed a low-cost real-time bridge monitoring system and monitored the expansion joints of three in-service bridges in Connecticut [26,27,28,29]. A survey of New England transportation agencies indicated that the high cost of existing monitoring systems was the primary barrier to implementing data-driven monitoring, and that the agencies believed bridge expansion joints could benefit most from long-term real-time monitoring. Based on the advised requirements set forth by the transportation agencies, a real-time expansion joint monitoring system capable of monitoring field bridges continuously was developed and validated by deploying it in a service bridge [28]. The system components were optimized for cost, power, and performance through a series of lab and field testing [28]. The developed system was successively expanded and used to monitor three in-service highway bridges in Connecticut. The longitudinal movements of the girder bridges, along with environmental factors, temperature, and humidity, were monitored on a long-term basis [26,27]. Different statistical and artificial intelligence (AI) based models were developed to evaluate the performance of expansion joints [26] and bearings [29] based on the collected data.
In this paper, the lessons learned from the long-term, real-time field monitoring of bridge expansion joints and their implications for achieving Industry 5.0 objectives are presented. A comprehensive framework for planning, system development, and field implementation of the monitoring system is first introduced. In subsequent sections, the overall architecture of the developed sensing system and lessons learned from the selection of sensors, communication systems, and analytical schemes are presented. An example analytical dashboard is presented, and its role in promoting human–machine collaboration is highlighted. The methods of integrating key enabling technologies, visualization, IoT, cloud and edge computing, digital twins, and AI, within a monitoring framework, are also discussed. Finally, the on-site challenges related to the power and weather are mentioned.

2. Real-Time Field Monitoring Framework and Testbed

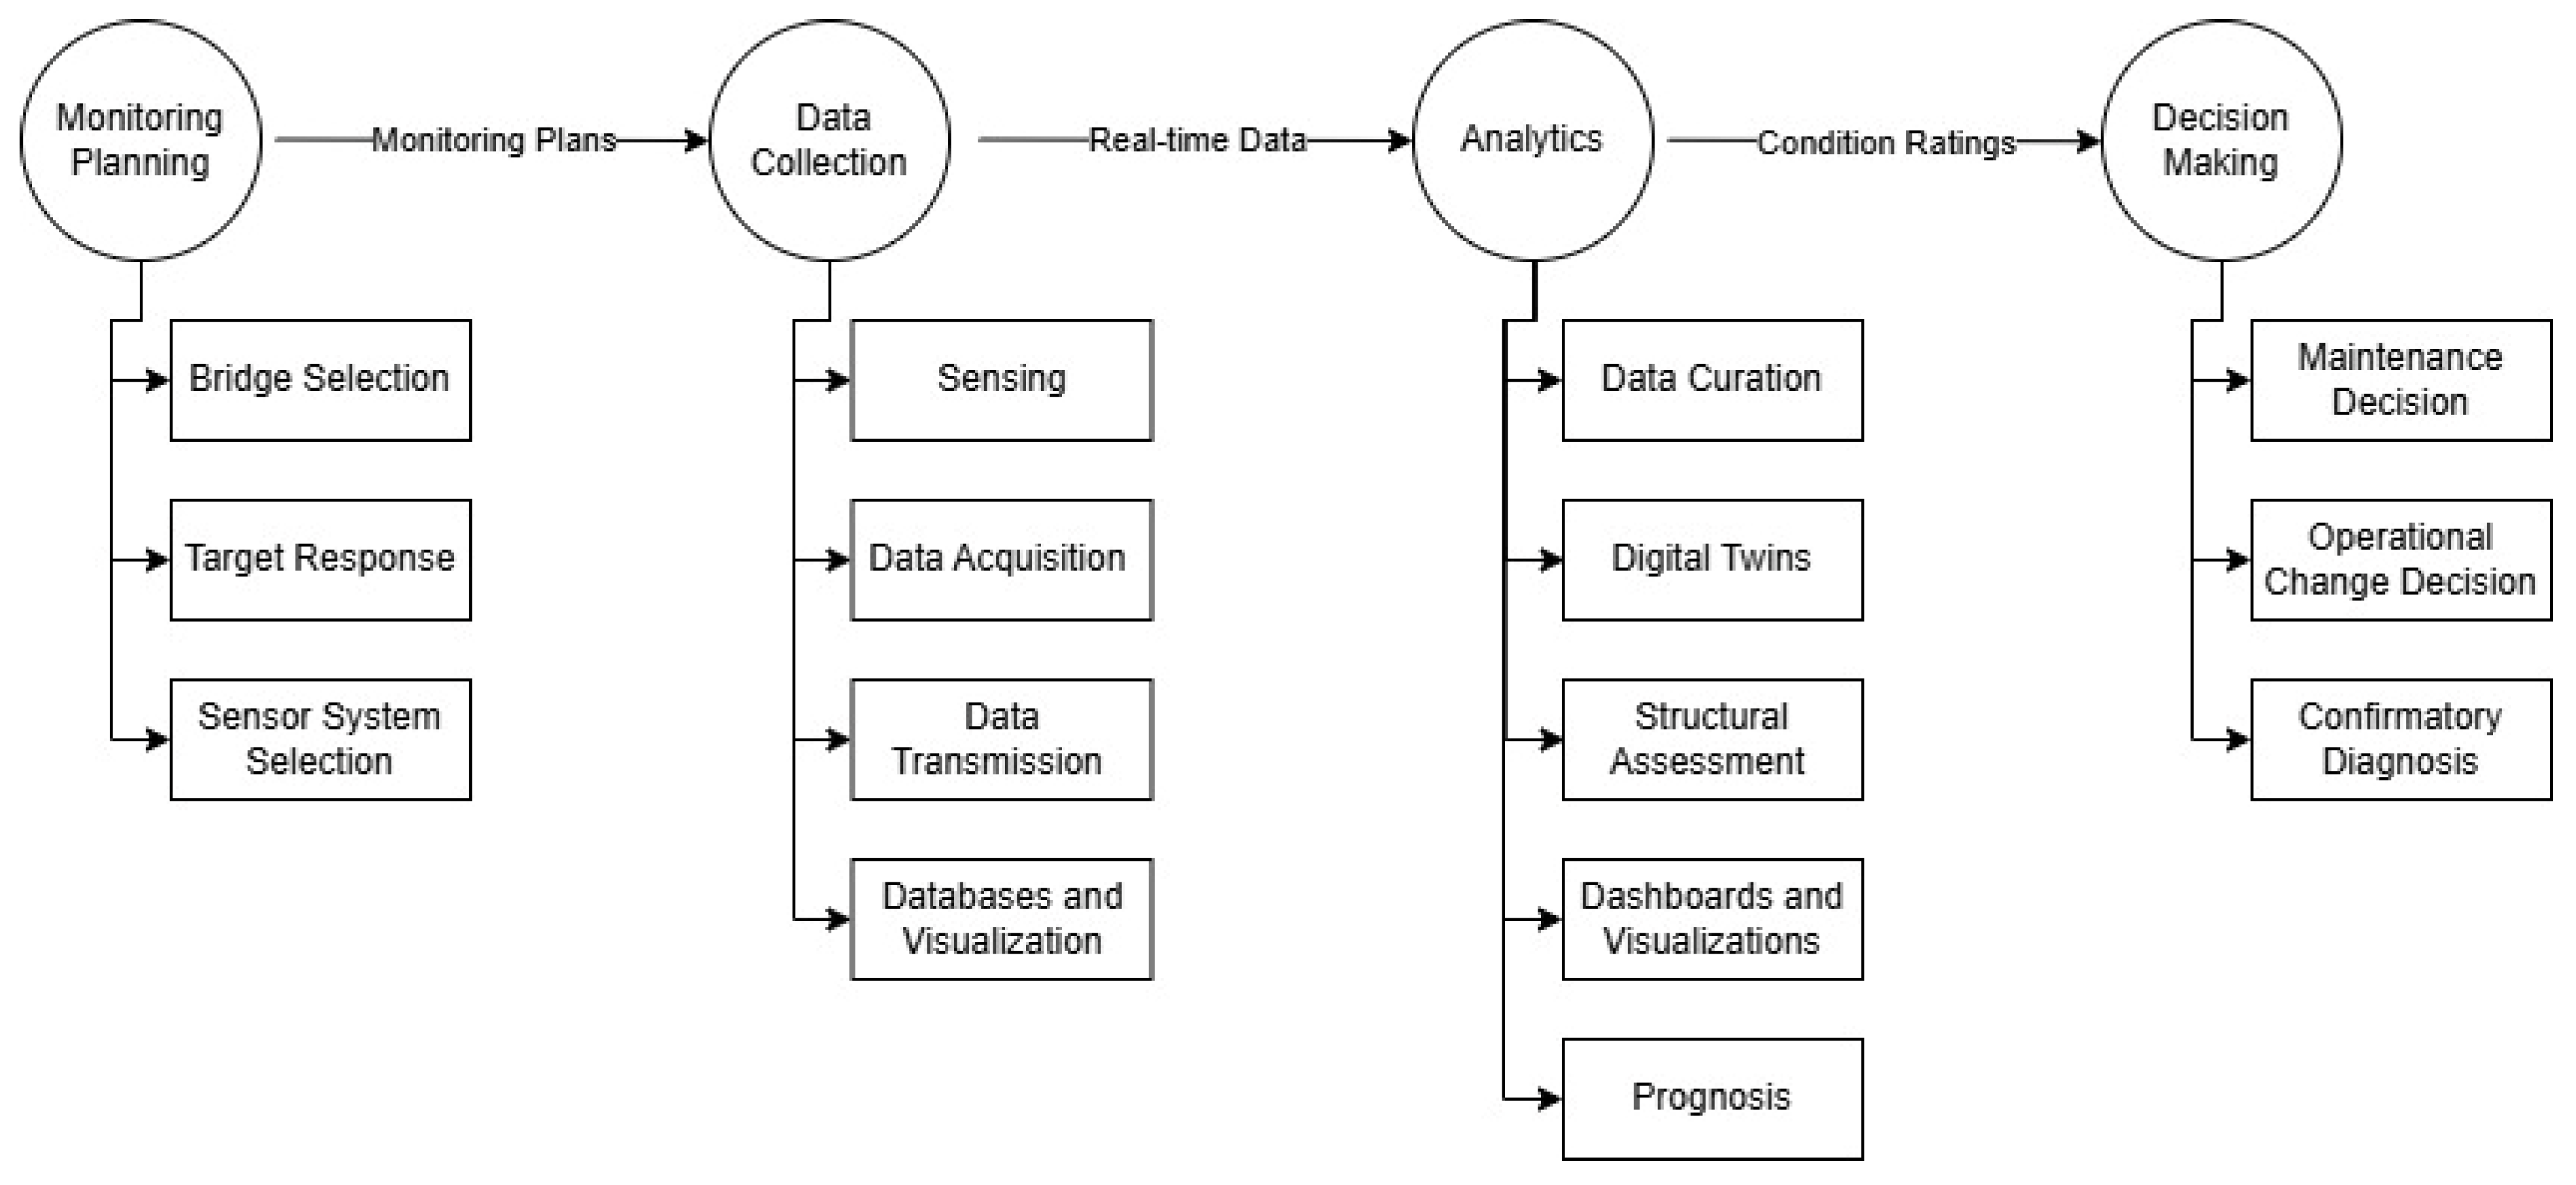
The real-time bridge monitoring and assessment framework utilized for the study involves a multi-step, multidisciplinary, and highly coordinated set of tasks. The bridge monitoring framework has four broad steps: planning, data collection, analytics, and decision making, as shown in Figure 1. The developed real-time field monitoring framework supplements prior life-cycle management formulations [20,21,23,24,25] by providing real-time monitoring data from the most vulnerable bridges, further enhancing the cost-effectiveness and safety of highway bridges. Every step requires knowledge from the disciplines of IoT, structural engineering, and computing. Achieving desired outcomes requires strong coordination across every step and effective integration among all the disciplines.
First, monitoring planning is the step that decides monitoring objectives and expectations, which govern the systems and methods used. The agencies or personnel would select the bridge/s that require real-time monitoring based on risk or uncertainty factors associated with the performance of the bridge. The target response could be selected based on the availability of sensing methods, site compatibility, and resource availability. The commonly monitored bridge responses are accelerations, velocity, displacement, slope, and strain of bridge components. In addition to the response, environmental factors like temperature, humidity, and wind are also monitored. The suitable sensors were then selected based on these target responses, required accuracy, and site conditions. This selection also depends upon the method of data collection, analytics, and the decision-making process. Therefore, planning should be based on monitoring needs and the overall monitoring scheme.
Data collection from the testbed bridges is the most challenging and resource-intensive task in real-time monitoring. This step involves the installation of sensors in the correct locations, making sensors to measure the required response, then transmitting it to the designated location through the designated route, and proper database preparation and visualization. Powering distributed sensors, sensor attachment, and orientations, wired and wireless communication systems, remote and on-site computing, and accessibility are key factors to be optimized for effective data collection.
Using the data, analysis is required to convert the collected field data into useful indicator parameters about the structural condition of the bridge. The field data curation is used to derive true structural response by eliminating noise and unnecessary signal details. The additional data from other sources, like digital twins, baseline responses from past measurements, or design calculations, can be fused with real-time data. The algorithms based on statistics, mechanics, and AI can be developed and employed to make structural assessments. These analyses and final results can be performed and visualized through interactive dashboards. Advancements in AI and computing can be exploited to develop such dashboards in an easy and cost-effective way. Overall, the interactive analytics of field data is crucial to transform field data into a desired structural condition report of the bridge.
The structural assessments can then be combined with agency policy data to formulate an appropriate decision. Generally, for a bridge, a decision can be further confirmed with a confirmatory diagnosis with more specialized testing, operational changes in the bridge, or maintenance. This data-driven decision approach facilitates optimal use of resources as well as risk-informed decision-making for the bridge owners and for effective communication with the stakeholders. The real-time monitoring system working on this framework will facilitate informed human decision-making, assist with condition assessments of bridges for inspectors, and help bridge owners to make resource-efficient proactive maintenance on bridges, promoting the safety and resiliency of bridges, all of which are the central themes of Industry 5.0.
This real-time field monitoring framework complements and advances existing life-cycle management frameworks by explicitly operationalizing their concepts within a continuously updated, data-driven decision loop. Whereas conventional life-cycle management approaches primarily assume the availability of monitoring data at discrete inspection or assessment intervals, the proposed framework formalizes the data acquisition and feedback mechanisms required to support continuous condition assessment under field conditions. By systematically integrating dense sensor networks with advanced analytics, the framework enhances the diagnosis and short-term prognosis components of existing life-cycle management models through the direct feedback of refined condition states, updated reliability indicators, and load-related information. As a result, the framework provides more realistic, bridge-specific inputs for lifecycle decision making, improves the optimization of intervention strategies, and fills a gap by enabling day-to-day operational decisions, such as temporary restrictions, targeted inspections, and rapid post-event assessments, that are only implicitly or coarsely addressed in traditional life-cycle management frameworks. In this sense, the proposed framework explicitly bridges the gap between established life-cycle management theory and practical field implementation.
The framework described herein was practically validated through long-term monitoring of in-service bridge joints, demonstrating its significance in real bridge applications [26,27,28,29]. For completeness, a short summary of the testbed is provided. Three testbed bridges were used as validation platforms, providing insight into how the framework performs under actual operational and environmental conditions on highway bridges. Three in-service bridges in Connecticut were monitored by collecting and visualizing real-time field response, the longitudinal movement patterns, and bridge temperature.
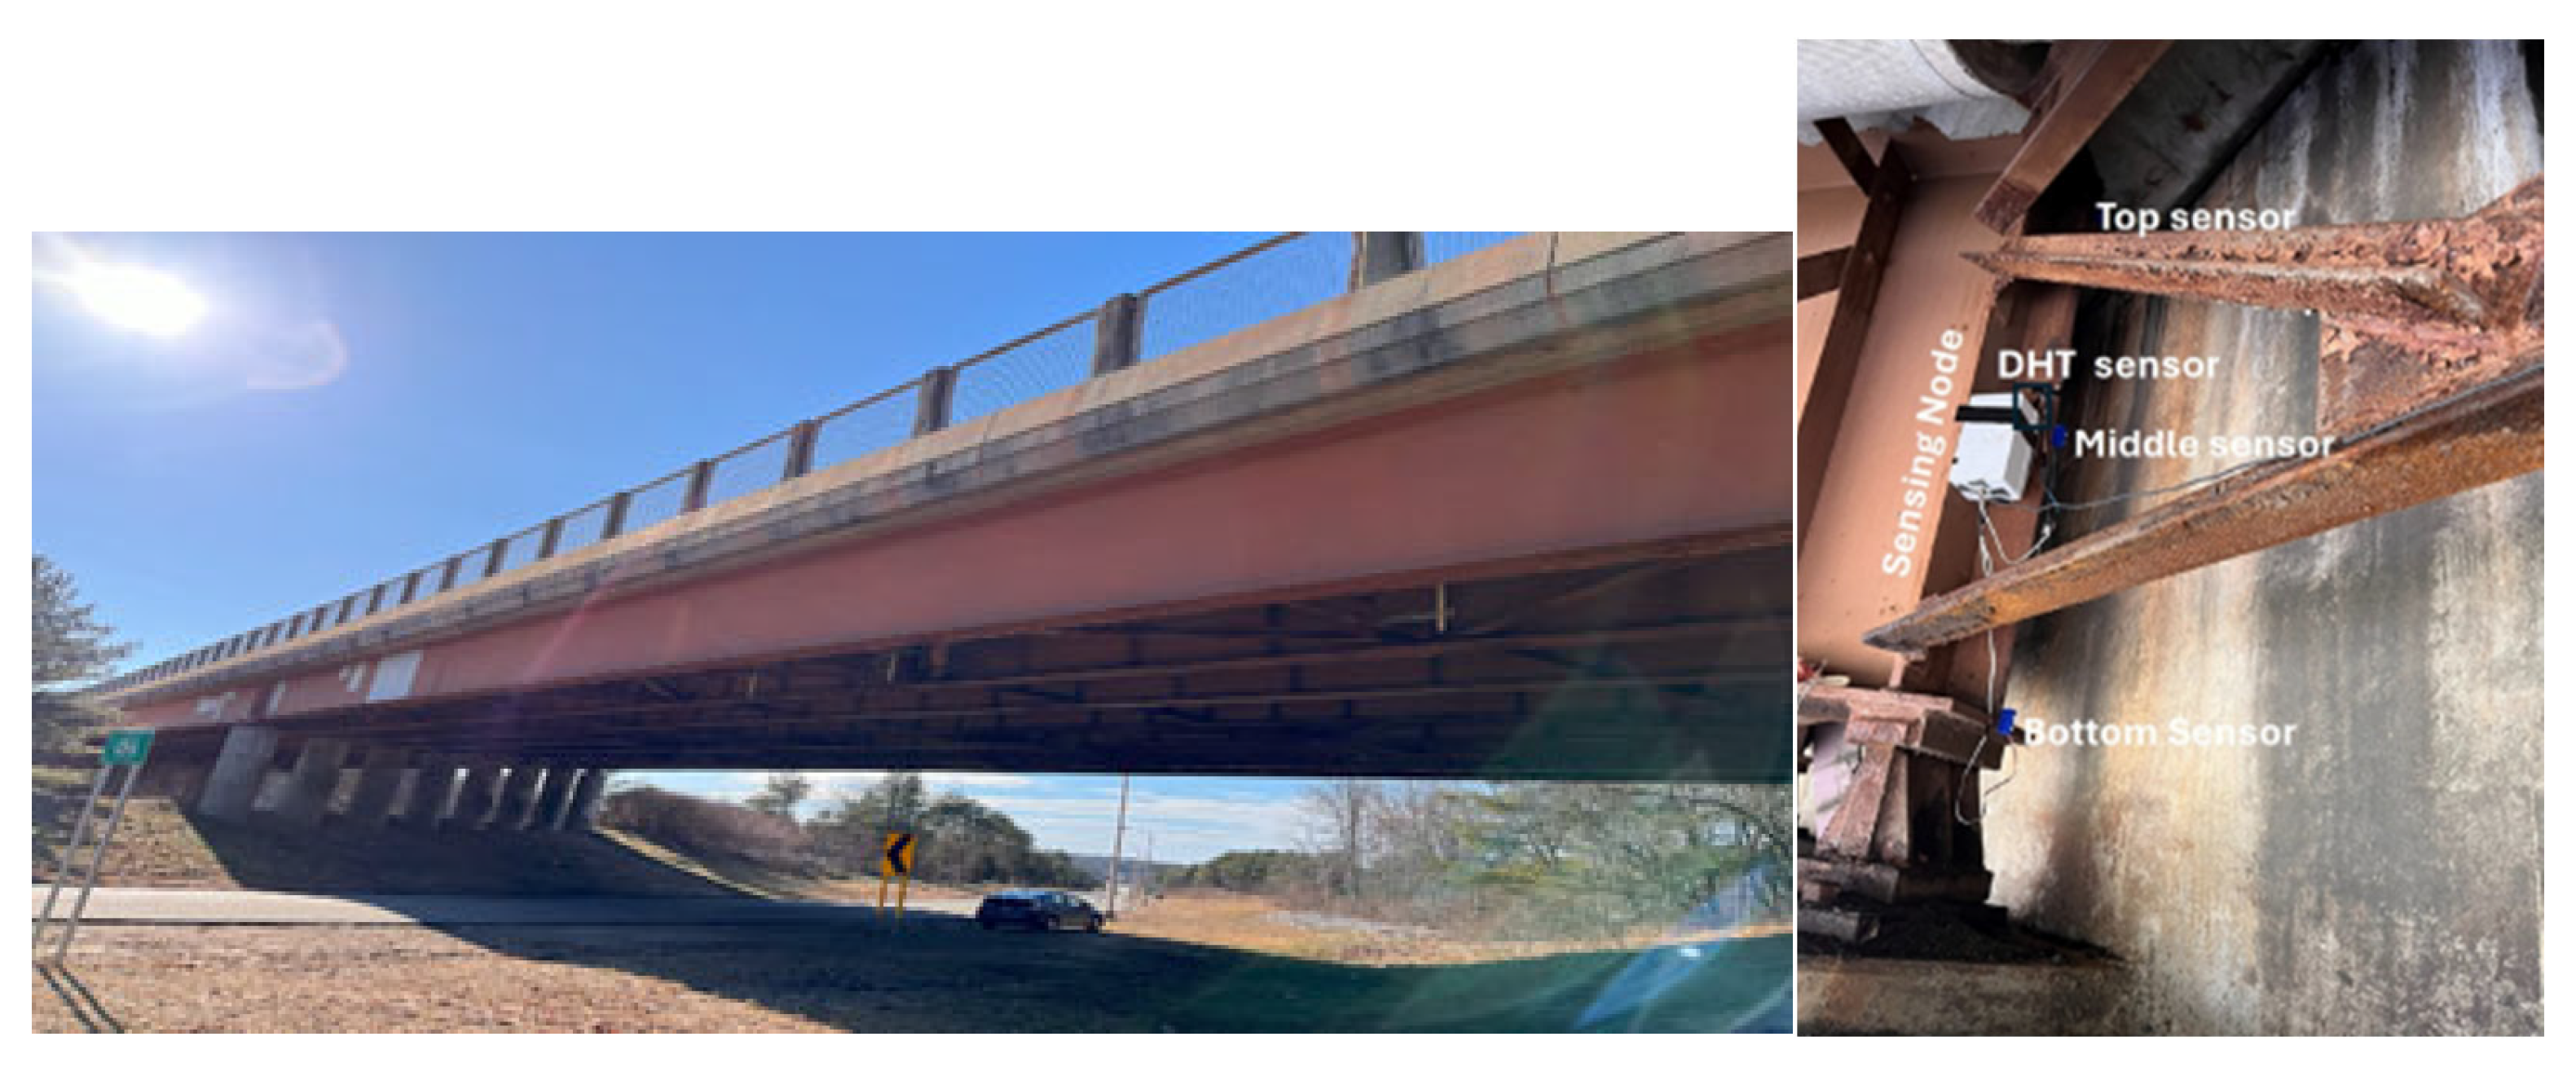
The first bridge is Connecticut National Bridge Inventory (CT NBI) ID1531, a two-span bridge with a continuous deck and simply supported girders, each a span length of 22.70 m. The bridge was originally constructed in 1959 and was rehabilitated in 1992 by extending its width. It is located on the CT-195 route over the Willimantic River in Coventry, Connecticut, carrying 12,000 vehicles per day [30]. The last periodic inspection was conducted in 2025, and the bridge was rated 6. The bridge has straight geometry and is located in a remote area without access to grid power. The north side abutment of this bridge was monitored using a real-time monitoring system, shown in Figure 2. The main objective of monitoring this bridge was to collect the longitudinal movement pattern in relation to the temperature to assess the working of its expansion joints and bearings.
The highly skewed CT NBI ID 2570 was the second bridge monitored and is shown in Figure 3. It is a two-span, fully continuous bridge with a total length of 112 m and is above US Route 6 near Windham, Connecticut, USA. Bridge 2 carries 15,000 vehicles per day [31]. It was initially constructed in 1973 and rehabilitated in 1995. The bridge was skewed by an angle of 42° at one end and 45° at the other. The last periodic inspection of this bridge was conducted in August 2024, and its superstructure was rated at 6. The monitoring systems were installed on the East side of the superstructure, as shown in Figure 3. The main objective of the field monitoring of this bridge was to evaluate the performance of bearings and the expansion joint under skewed superstructure configurations.
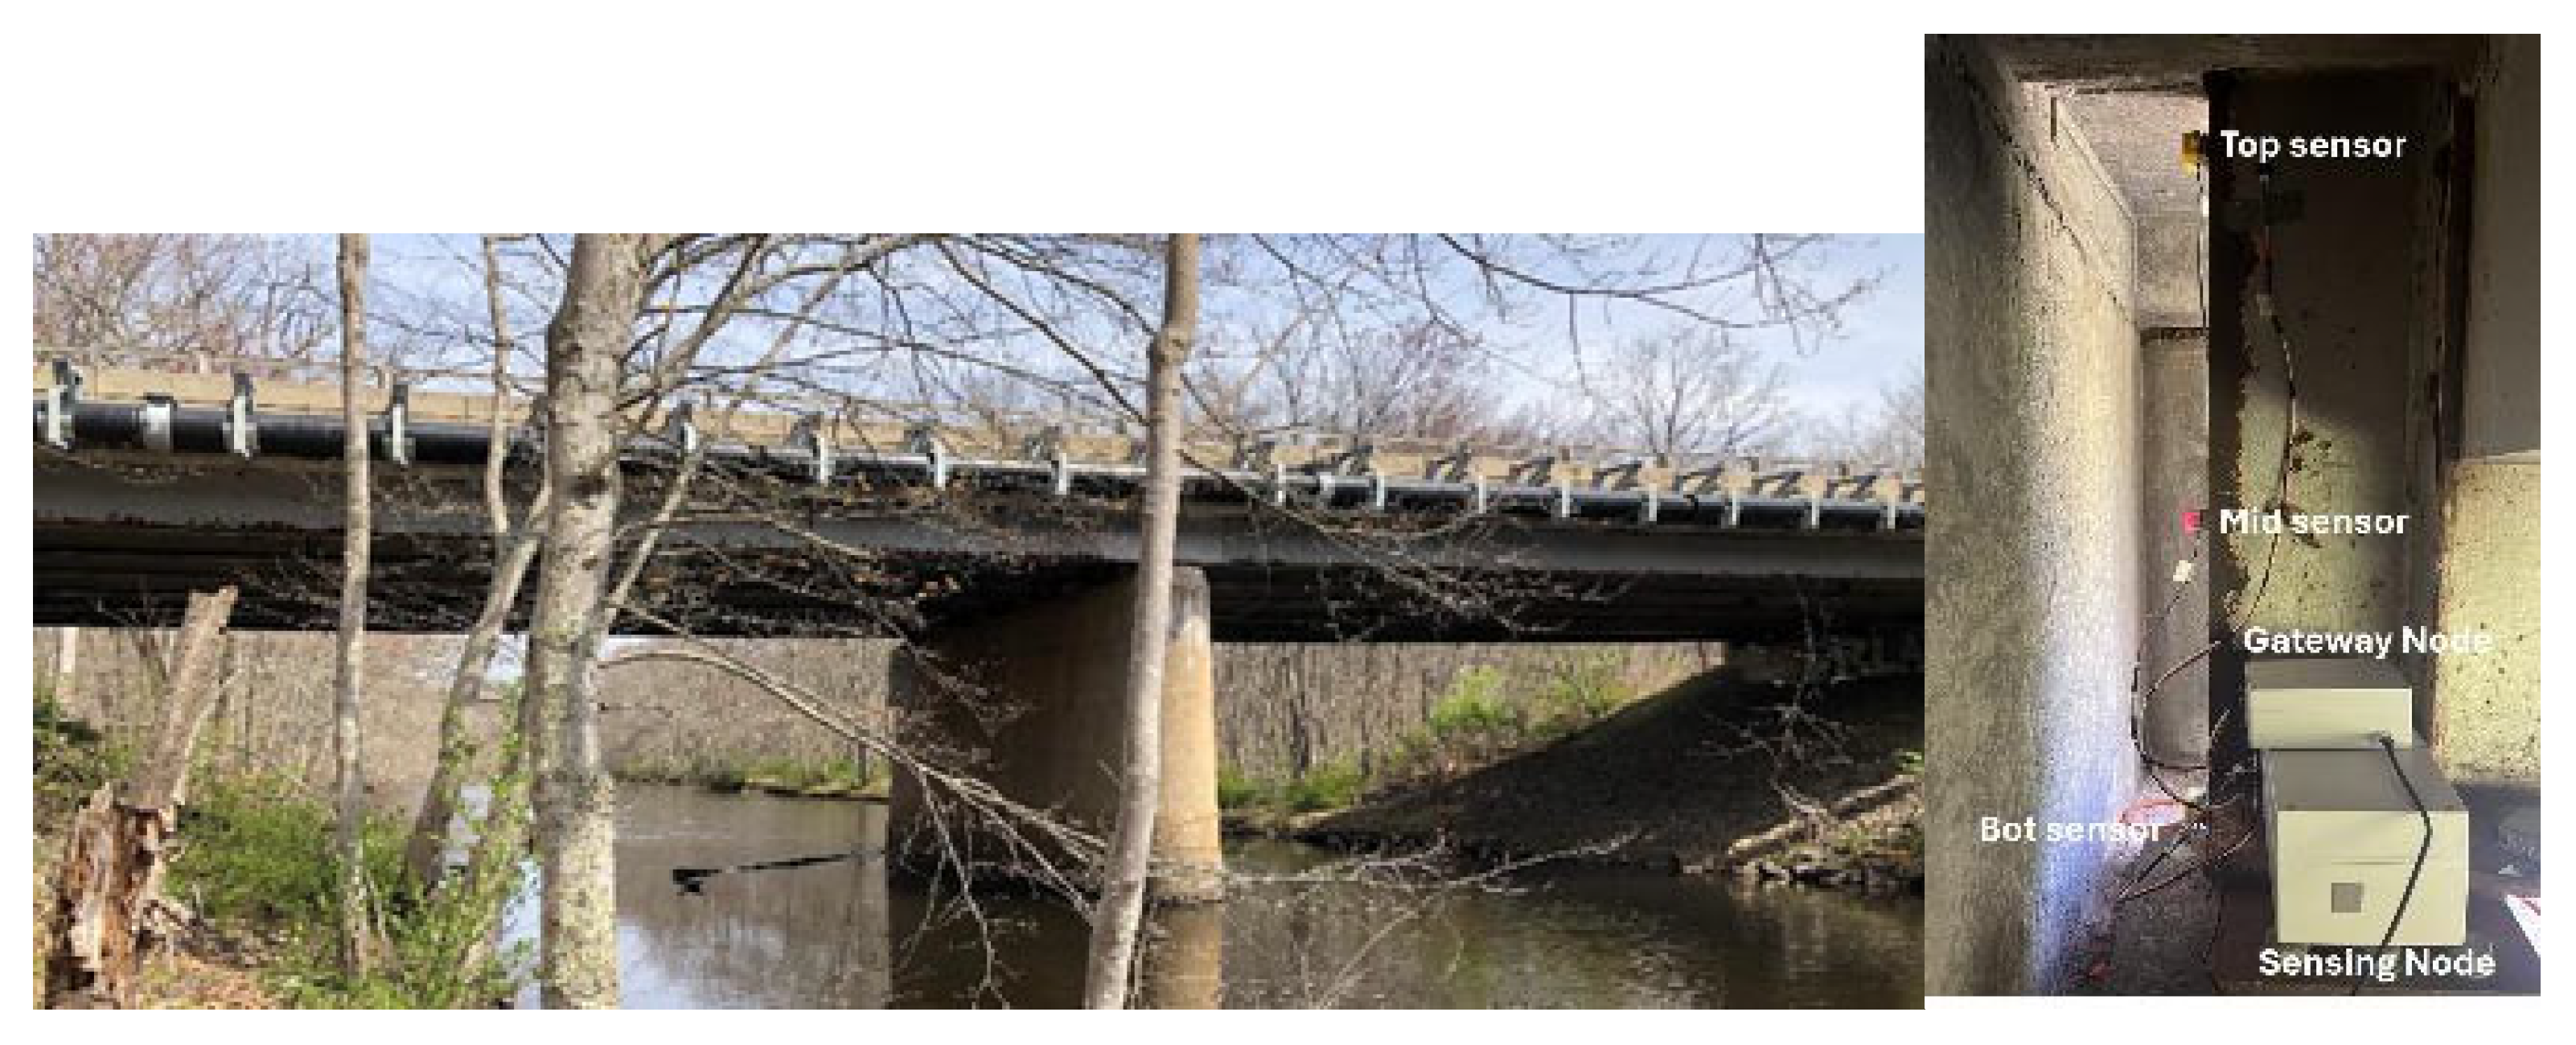
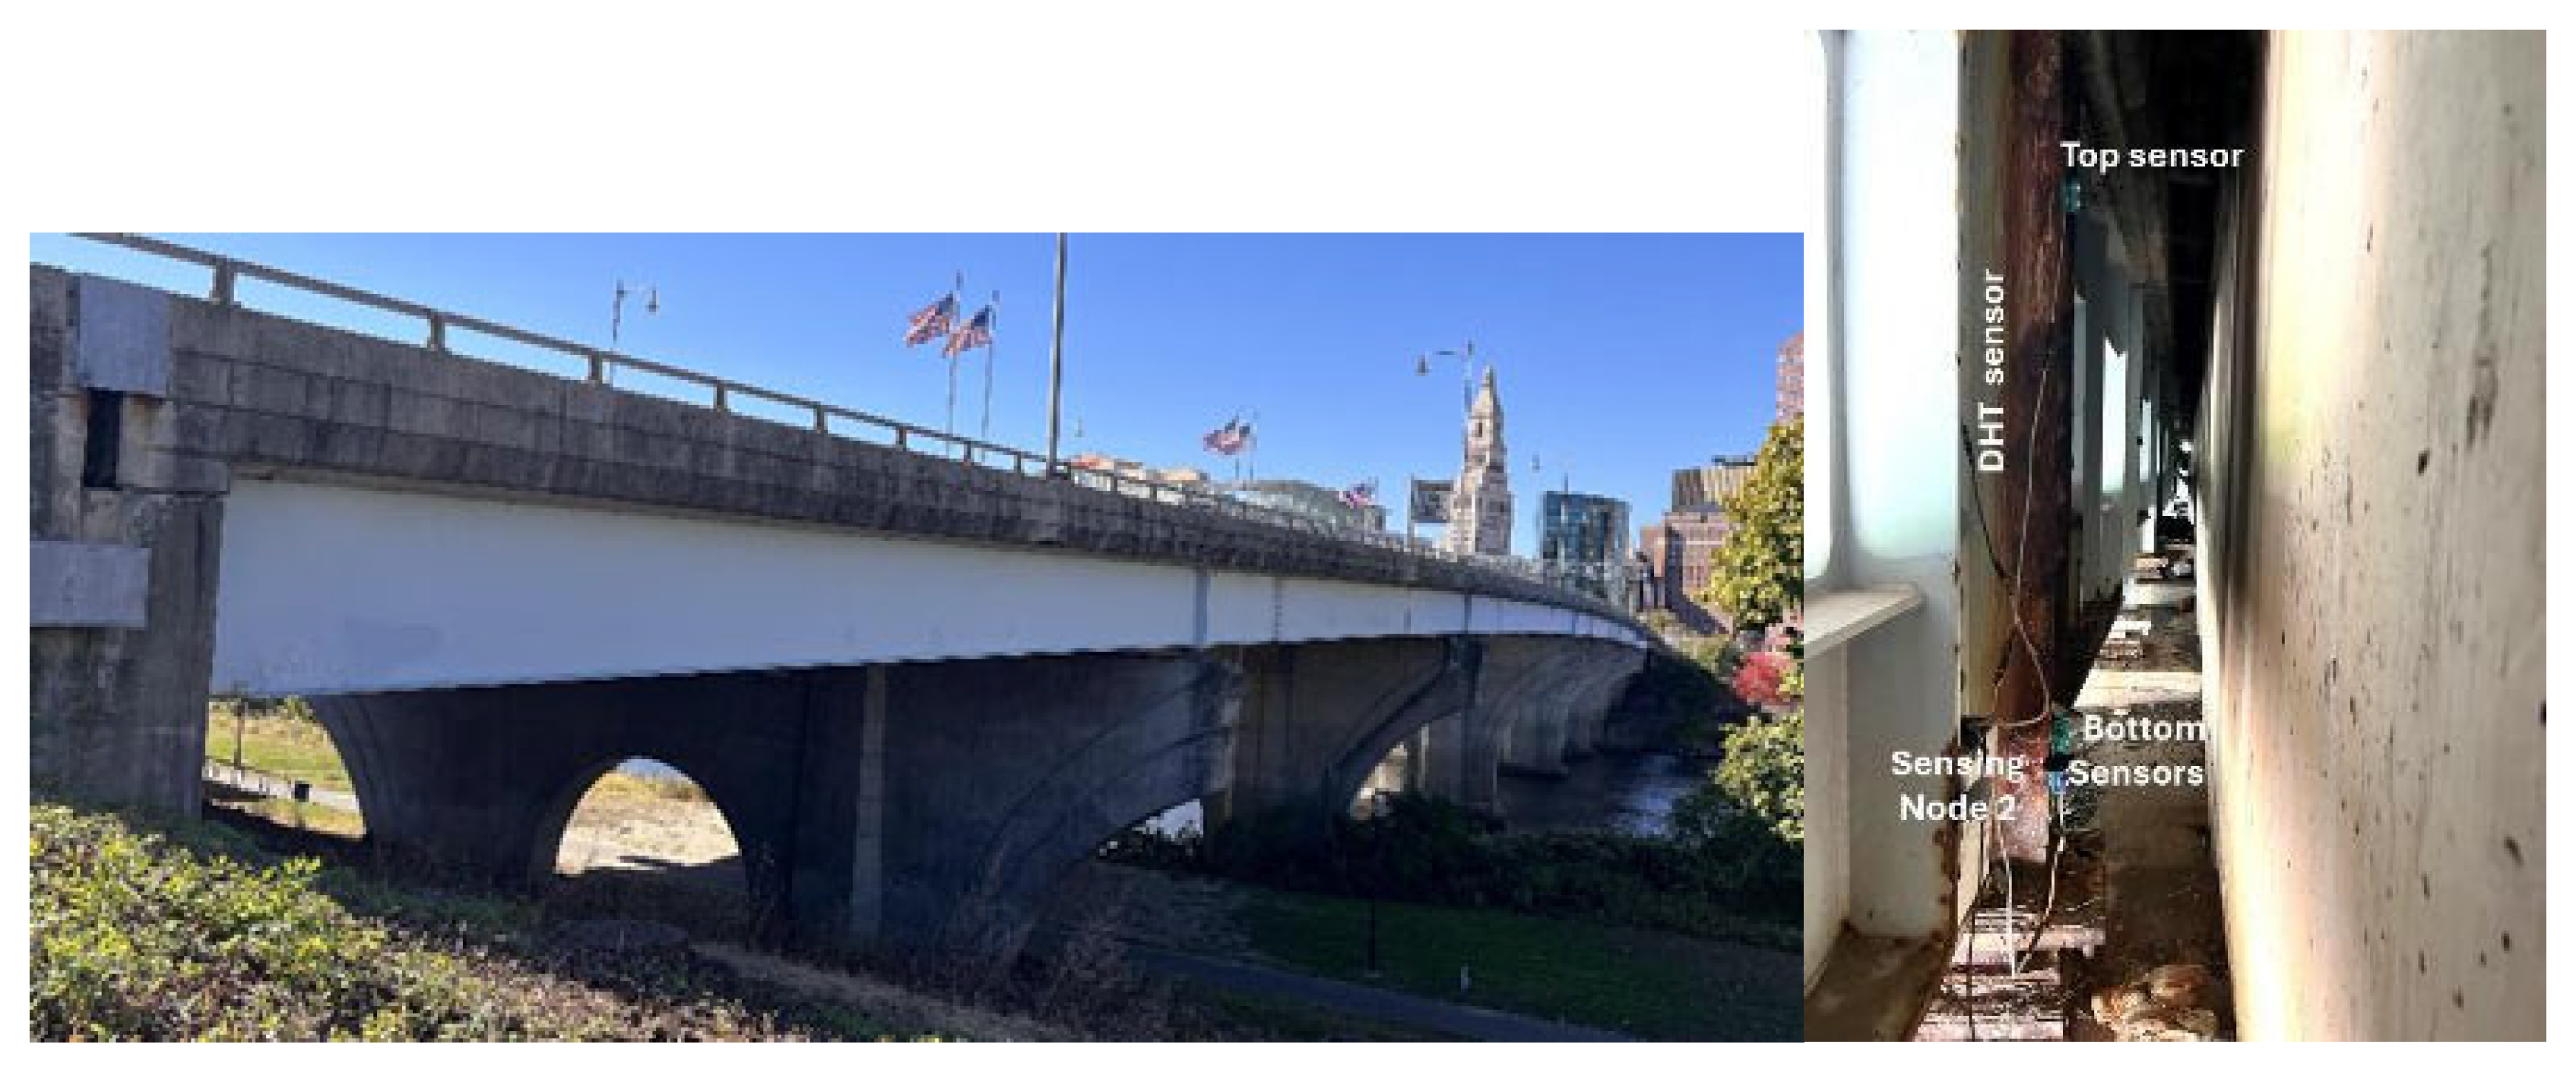
Founders Bridge, CT NBI ID 00371A, was the last bridge monitored for this research. It is a multi-span steel girder composite bridge with 356 m (center to center) in length and carries Route 2 traffic across the Connecticut River and I-91 near downtown Hartford. Founders Bridge has a mixed span configuration of simply supported and continuous spans, with the longest span being 51 m. The bridge was initially constructed in 1957 and rebuilt in 1999 to its current form. The span carries seven traffic lanes (four westbound, three eastbound) with a daily average traffic of around 28,300 [31] and includes a 5.5 m sidewalk on its south side. The bridge is located in a heavily populated urban area within a public park. The east side of the bridge was instrumented to measure the longitudinal movements and temperature distributions in vertical and transverse directions. The installed system is shown in Figure 4. The main objective for the monitoring of this bridge was to evaluate the performance of large movement expansion joints.

3. Lessons Learned from the Real-Time Bridge Joint Monitoring System

Several lessons were learned throughout the planning, monitoring system design, field data collection, and data analysis processes of the above-described bridge joint monitoring system. This section summarizes these lessons and discusses their implications for advancing Industry 5.0 objectives.

3.1. Monitoring Planning

The first step, monitoring planning, involves selecting appropriate testbed bridges, establishing the overall purpose and outline of the monitoring, and establishing target monitoring parameters. Using existing bridge databases, a priority list of candidate structures can be developed based on their relative vulnerability, after which the feasible extent of monitoring can be determined, considering available resources. The prioritization criteria should be defined using both available information and expert judgment. Decisions regarding the testbed bridge, monitoring objectives, and resource constraints directly influence subsequent stages of the monitoring workflow, including system design, instrumentation strategy, and data analytics.
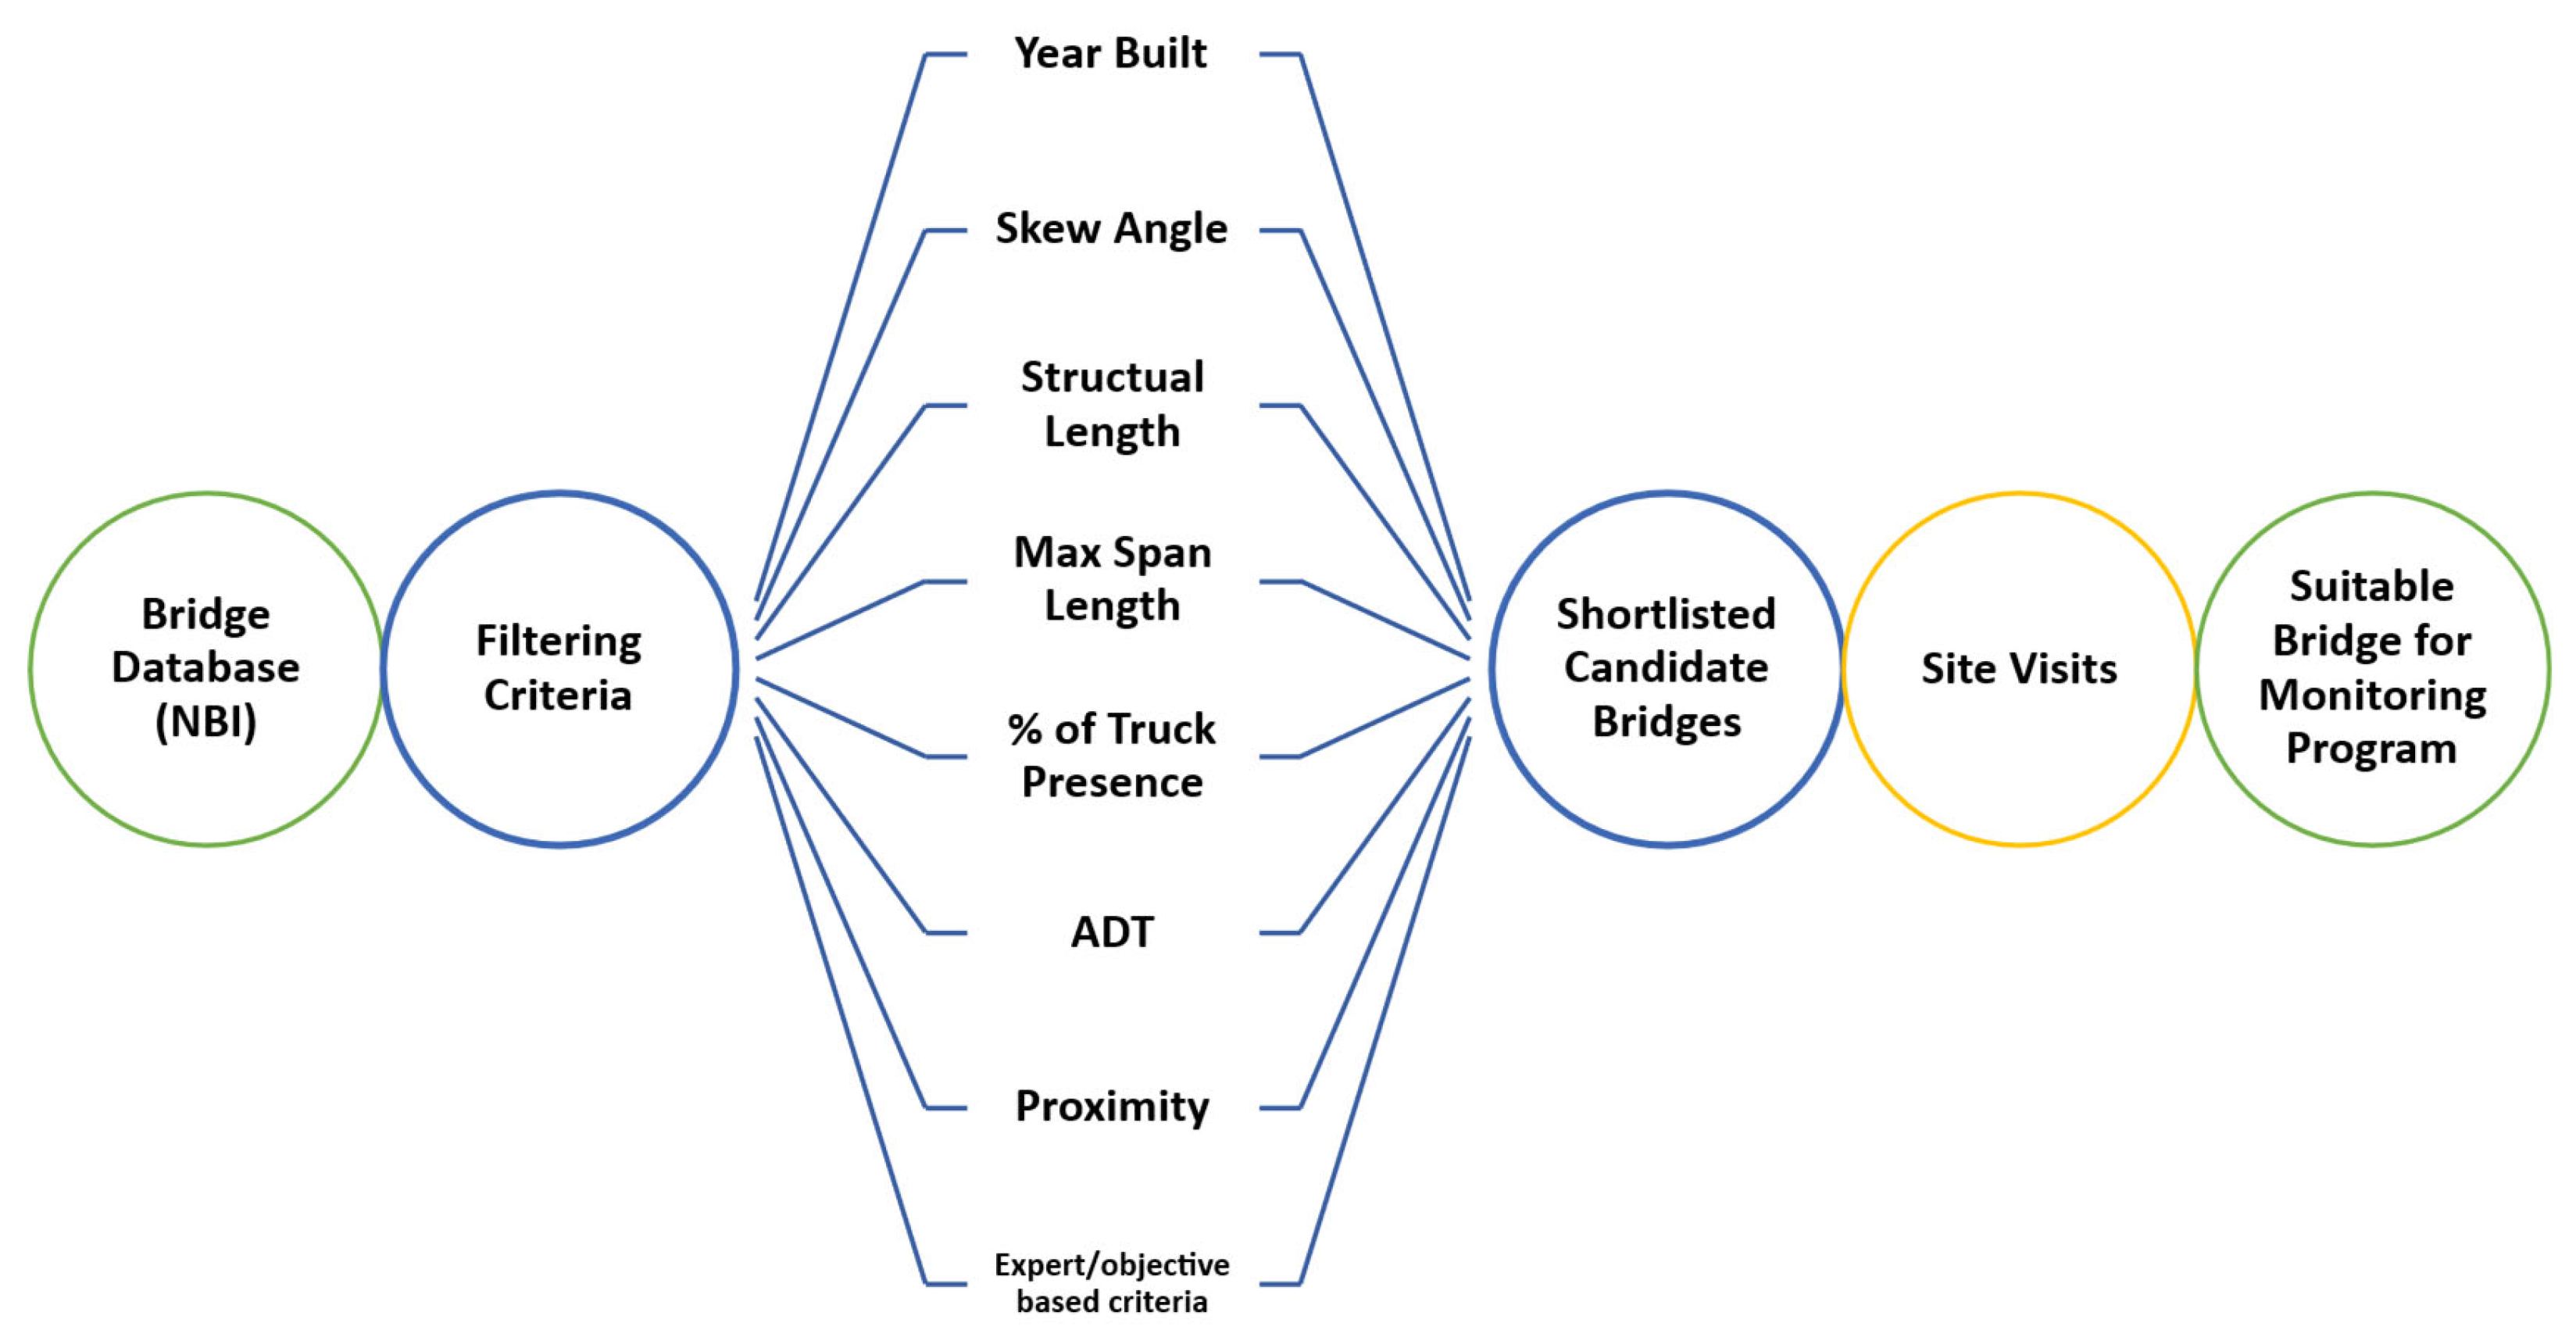
The monitoring objectives were to study the in-service performance of the expansion joint and bearings through cost-effective long-term monitoring. This objective was set because a survey of New England region transportation agencies pointed out that expansion joints are the vulnerable components that most benefit from long-term continuous monitoring with real-time data collection systems. To fulfil this objective, three testbed bridges presented in the previous section were selected based on a systematic bridge selection framework shown in Figure 5. The framework was formulated based on the 2021 NBI for Connecticut. The six filtering criteria, year built, skew angle, structure length, maximum span length, percentage truck presence, and average daily traffic (ADT), were used to select a short list of the most representative bridges from 5625 bridges within Connecticut. These criteria were chosen based on their relevance to joint and bearing performance and their availability in the NBI dataset. First, a shortlist was created by identifying bridges that spanned the full variability of these features, ensuring that the selected candidates were representative of the broader population. Final selection was then made through site visits to confirm safety and logistical feasibility to meet the proximity and expert/objective-based criteria.
The use of a systematic, data-driven framework accelerated the identification of suitable testbed bridges, reduced the need for extensive preliminary site visits, and facilitated faster administrative approvals. Such approaches can also be highly beneficial when applied to other monitoring or asset-management tasks, as they streamline decision-making, enhance transparency, and improve overall efficiency. Therefore, processes similar to this can be used to select a relevant bridge testbed for field monitoring to set the monitoring plans.

3.2. Data Collection

Data collection involves the measurement of the target response from the testbed and delivering it to the designated destination. As data collection is the key part of the field monitoring, the most innovative items were employed, including IoT, real-time wireless communication, visualization, and cloud computing. Each component will be described in detail below.

3.2.1. Real-Time Wireless Sensing System Architecture

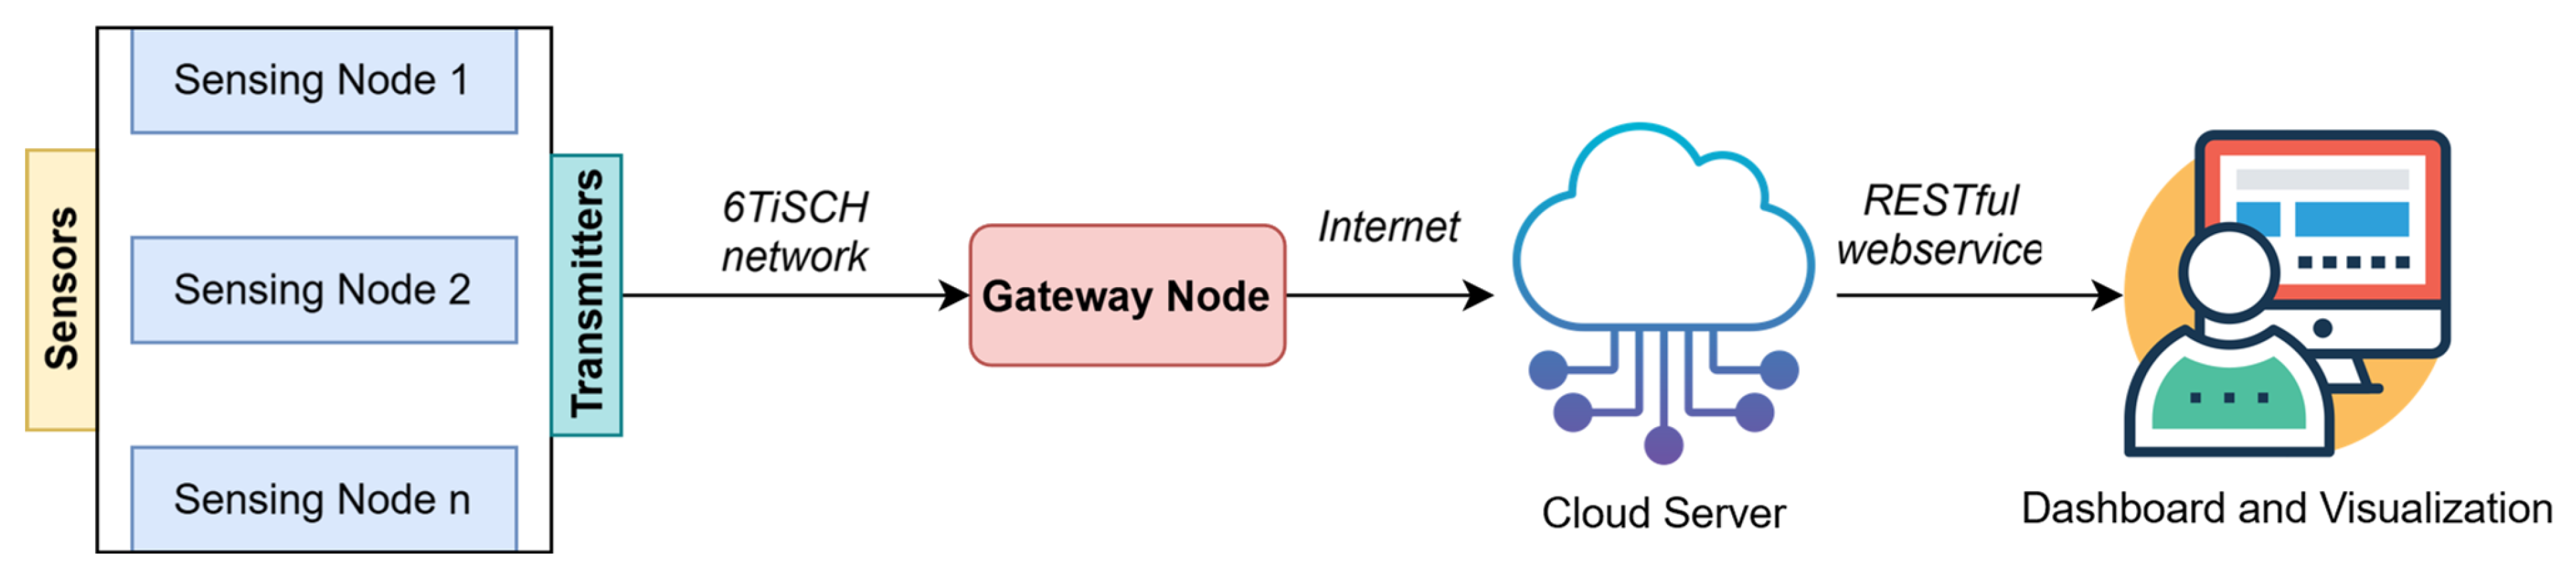
A real-time monitoring system was developed based on the transportation agency’s needs and target monitoring parameters. The schematic representation of the architecture and components of the developed real-time wireless joint monitoring system is shown in Figure 6. A scalable, modular design was developed with four distinct components. This system consists of sensors with microcontrollers for making measurements from the testbed, a gateway node for coordination between sensing nodes and data delivery, a cloud server as a database and analytics, and a webpage as an interactive dashboard for the user. The sensors measure the displacement of the bridge, the temperature of the girders, and the humidity of the atmosphere. The microcontrollers provide power to the sensors, control the operation of the sensors, and deliver the measured data to a gateway node via a designated 6TiSCH (Time Slotted Channel Hopping over Internet Protocol version 6) communication channel. The micro-computer of the gateway node receives the data from the sensors and uploads it to the database installed in the cloud server. Once the data is uploaded to the server, it can be accessed by multiple clients in real-time using web services. All the components and configurations are optimized for cost, power efficiency, performance, and operational simplicity. The details of each component, hardware, configurations, and optimization have been presented in references [27,28]. The system was successfully developed and provided a low-cost, practical solution for real-time bridge monitoring.
One of the key lessons learned at the system design and development stage is that modular system architectures are very effective for interdisciplinary coordination. With a modular design, the civil engineering team can concentrate on designing sensing nodes based on the type of structural assessment needed and targeted response, while IoT specialists focus on developing the data transmission and database framework. The dashboards and analytics need a close collaboration between developers and structural analysts. Finally, achieving seamless integration between these components requires defining system-level requirements and constraints at the outset, including expected sampling frequencies, acceptable transmission delays, and field logistics. This alignment of requirements ensures that independently developed modules can function cohesively within the overall monitoring system.

3.2.2. Sensor Selection, Environmental Hardening, and Data Acquisition Guideline

The sensing and data acquisition design for long-term, real-time bridge monitoring requires careful consideration of sensor suitability, environmental durability, and system-level power and installation constraints. Because field conditions on highway bridges impose harsh mechanical and environmental exposures, the sensor selection process must balance precision with robustness and long-term stability.
The sensors and data acquisition for the tested real-time monitoring system were selected by extensive market research, laboratory, and field validation. A comprehensive market survey was first conducted to identify commercially available sensor types that could be used to measure longitudinal displacements at bridge expansion joints. Candidate technologies, listed in Table 1, were evaluated based on their compatibility with on-site conditions, long-term stability, environmental resistance, and cost-effectiveness. Following this initial screening, a series of laboratory tests were performed to assess accuracy, susceptibility to noise, and performance under harsh conditions around bridge joints. Candidate sensors were then deployed during short field trials to evaluate their performance under realistic bridge movements and weather exposure. Based on these evaluations, ultrasonic distance sensors were identified as the most suitable option for long-term deployment.
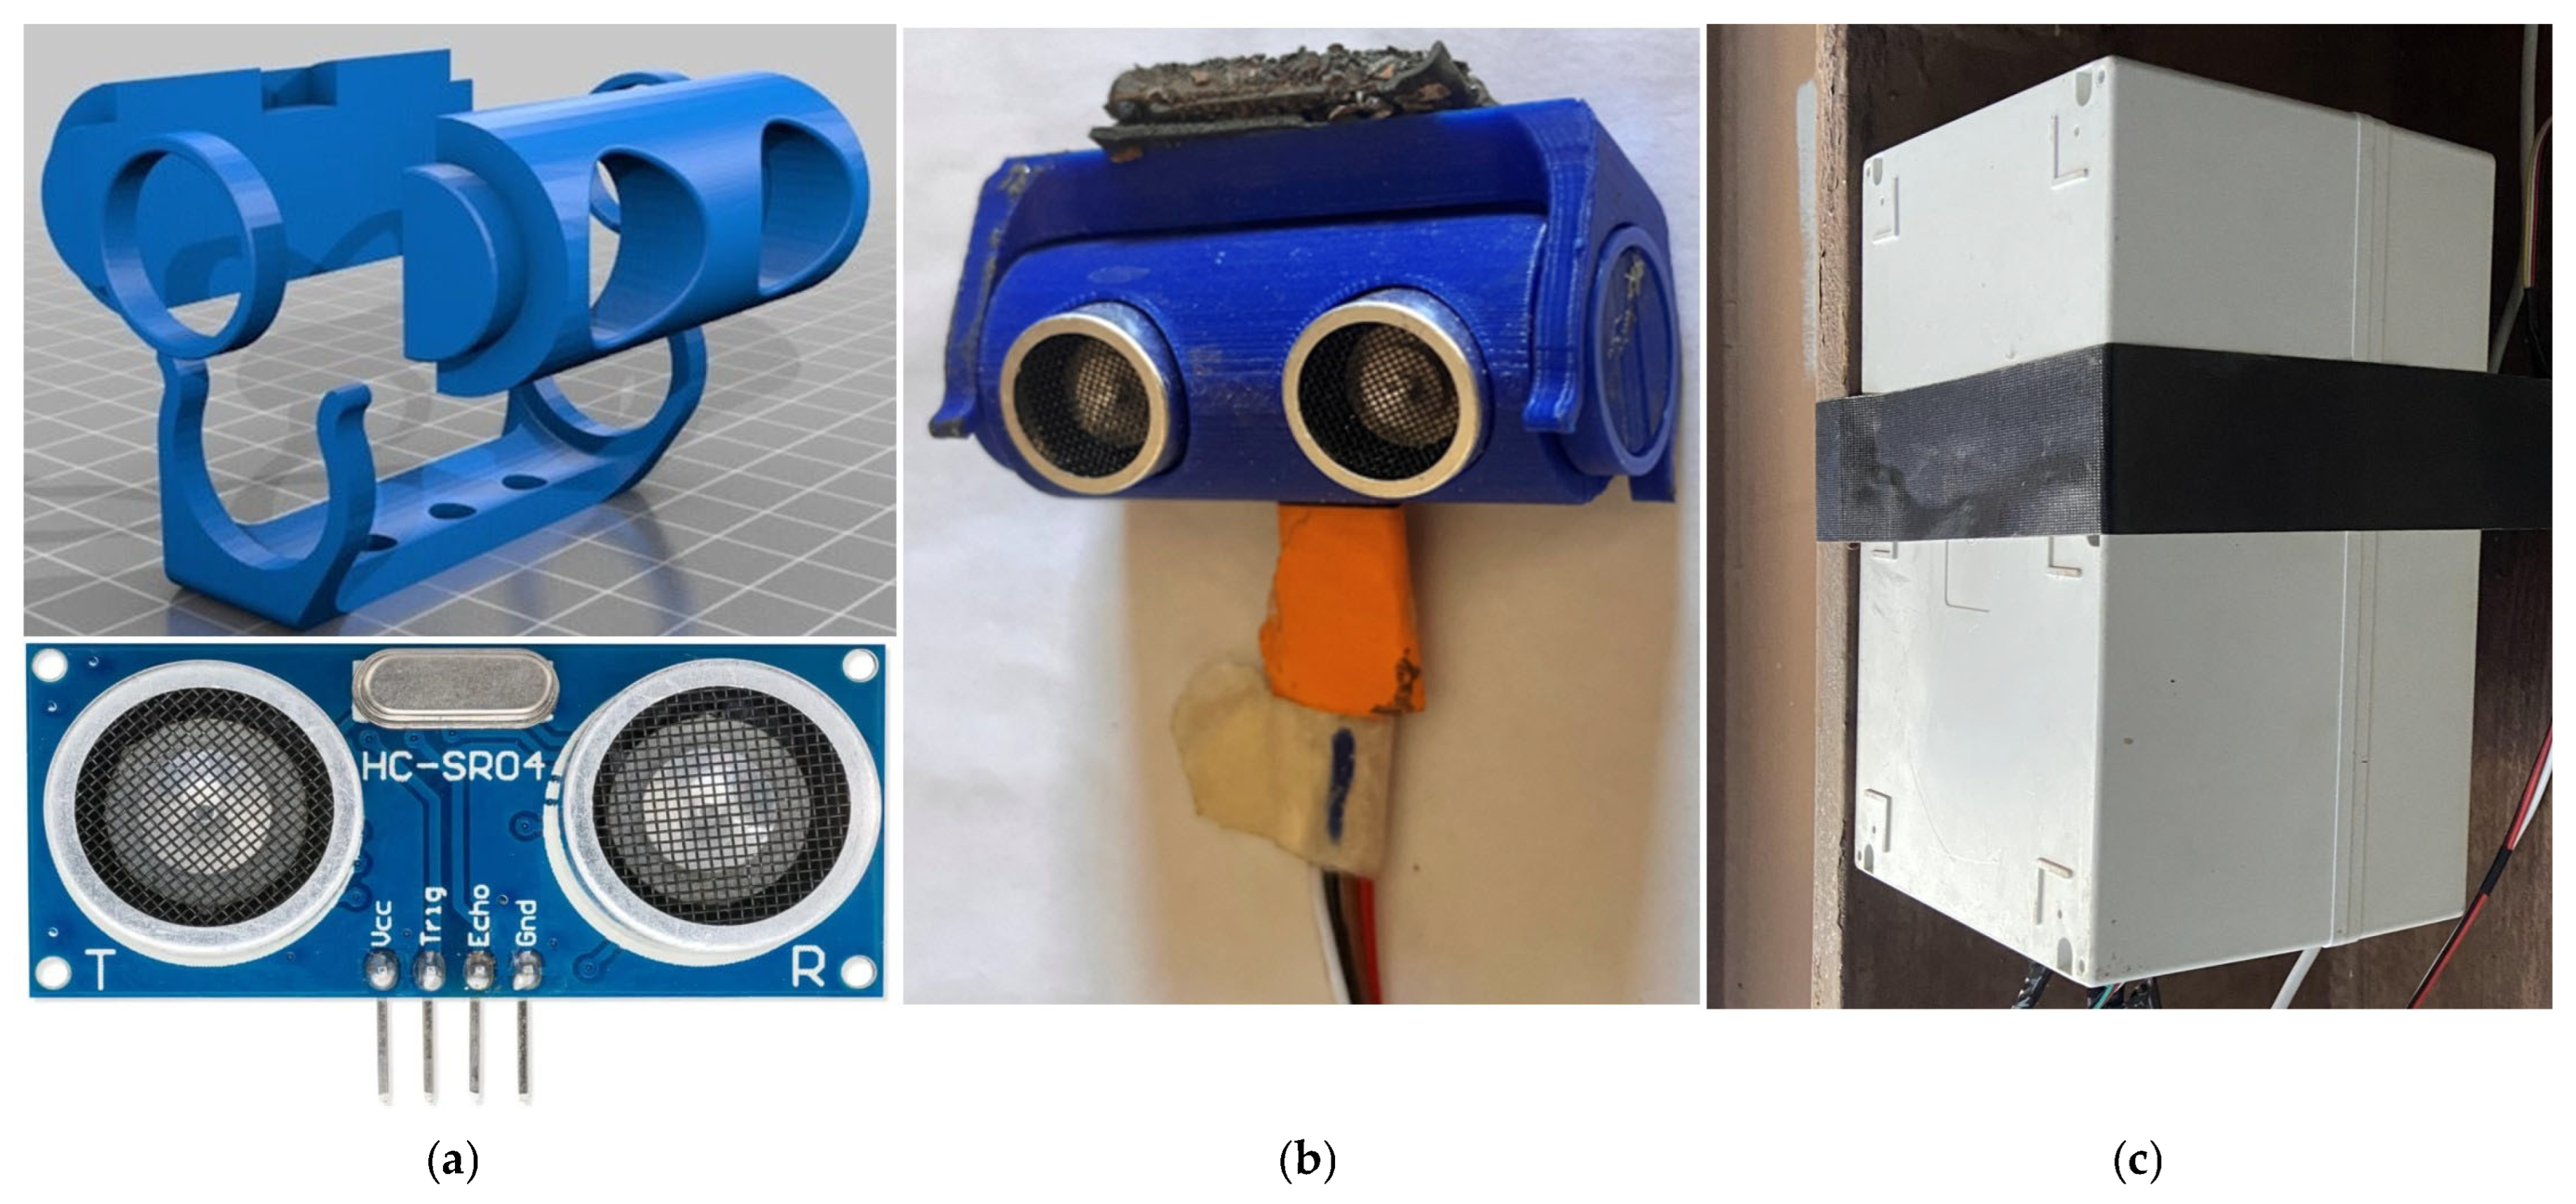
Once the ultrasonic distance sensor selection was finalized, a custom enclosure and mounting system were carefully designed to protect the sensors and to adjust angles for efficient displacement measurement for skewed bridges. Then, the final design was fabricated by 3D printing to enhance protection and ensure proper alignment in the long-term field deployment, as shown in Figure 7. The details on the design and working of this enclosure can be found in reference [26]. DHT2.0 sensor was employed along with an ultrasonic distance sensor for long-term field deployment. For short-term data validation campaigns, linear variable distance transducers (LVDTs) and commercial temperature loggers were also used in different bridges. The monitoring periods and types of sensors used in each bridge are listed in Table 2. Data from all bridges were collected at a sampling rate of 0.1 Hz for all sensors within the network, with no data loss during normal system operation. Periodic system downtime occurred within the monitoring period, primarily due to power outages or system maintenance.
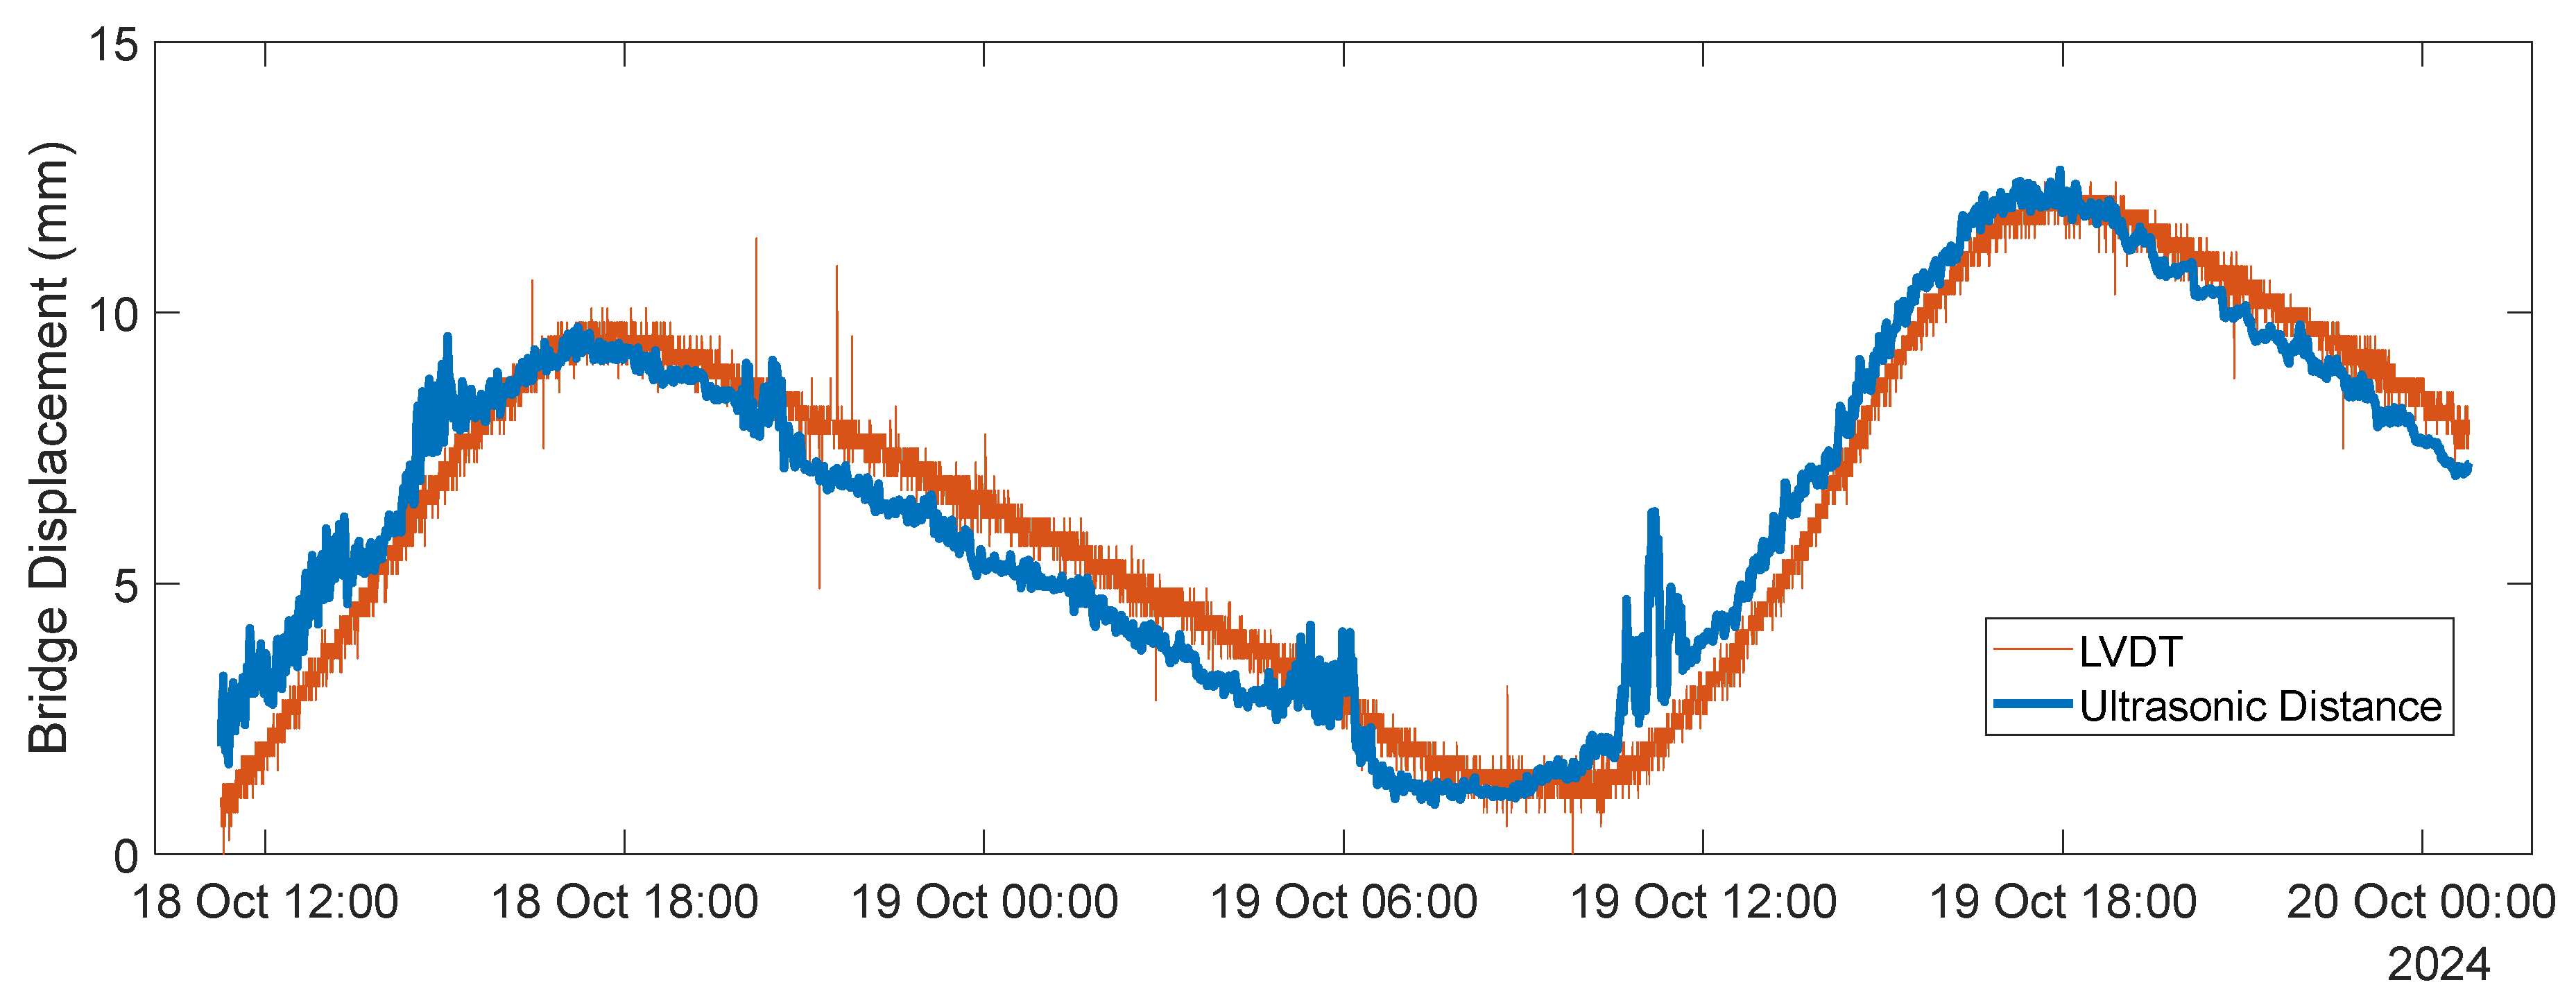
Several lessons were learned throughout the sensor testing and deployment process. First, laboratory and field testing under conditions that closely resemble the actual operating environment are indispensable. Reliance solely on manufacturer specifications or on performance in unrelated applications can lead to incorrect conclusions about their suitability under field conditions. For example, although linear variable differential transformers (LVDTs) inherently provide higher precision than ultrasonic distance sensors, the quasi-static longitudinal displacement measurements obtained from ultrasonic sensors, after applying appropriate noise filtering and signal processing, were found to be comparable to those measured by LVDTs on an in-service bridge. Figure 8 presents representative two-day longitudinal displacement measurements recorded on Bridge 3 using LVDTs and filtered ultrasonic distance sensor data. The results indicate that, after appropriate signal processing, the ultrasonic distance sensor measurements capture the overall movement trends well. The maximum absolute difference between the filtered UDS and LVDT measurements is less than 1 mm for the majority of the monitoring period, with a small number of localized deviations, corresponding to a relative discrepancy of less than 10% with respect to the peak longitudinal displacement. Furthermore, considering its compact size, low cost, low power requirements, and robustness under the harsh environmental conditions at bridge ends, the ultrasonic distance sensor proved to be the more suitable choice for long-term field deployment. The comparison of the hardware level cost of the LVDT-based system and the developed ultrasonic distance sensor is shown in Table 3. This shows how specification-based selection can be misleading without complete consideration of actual performance, cost, and logistical issues.
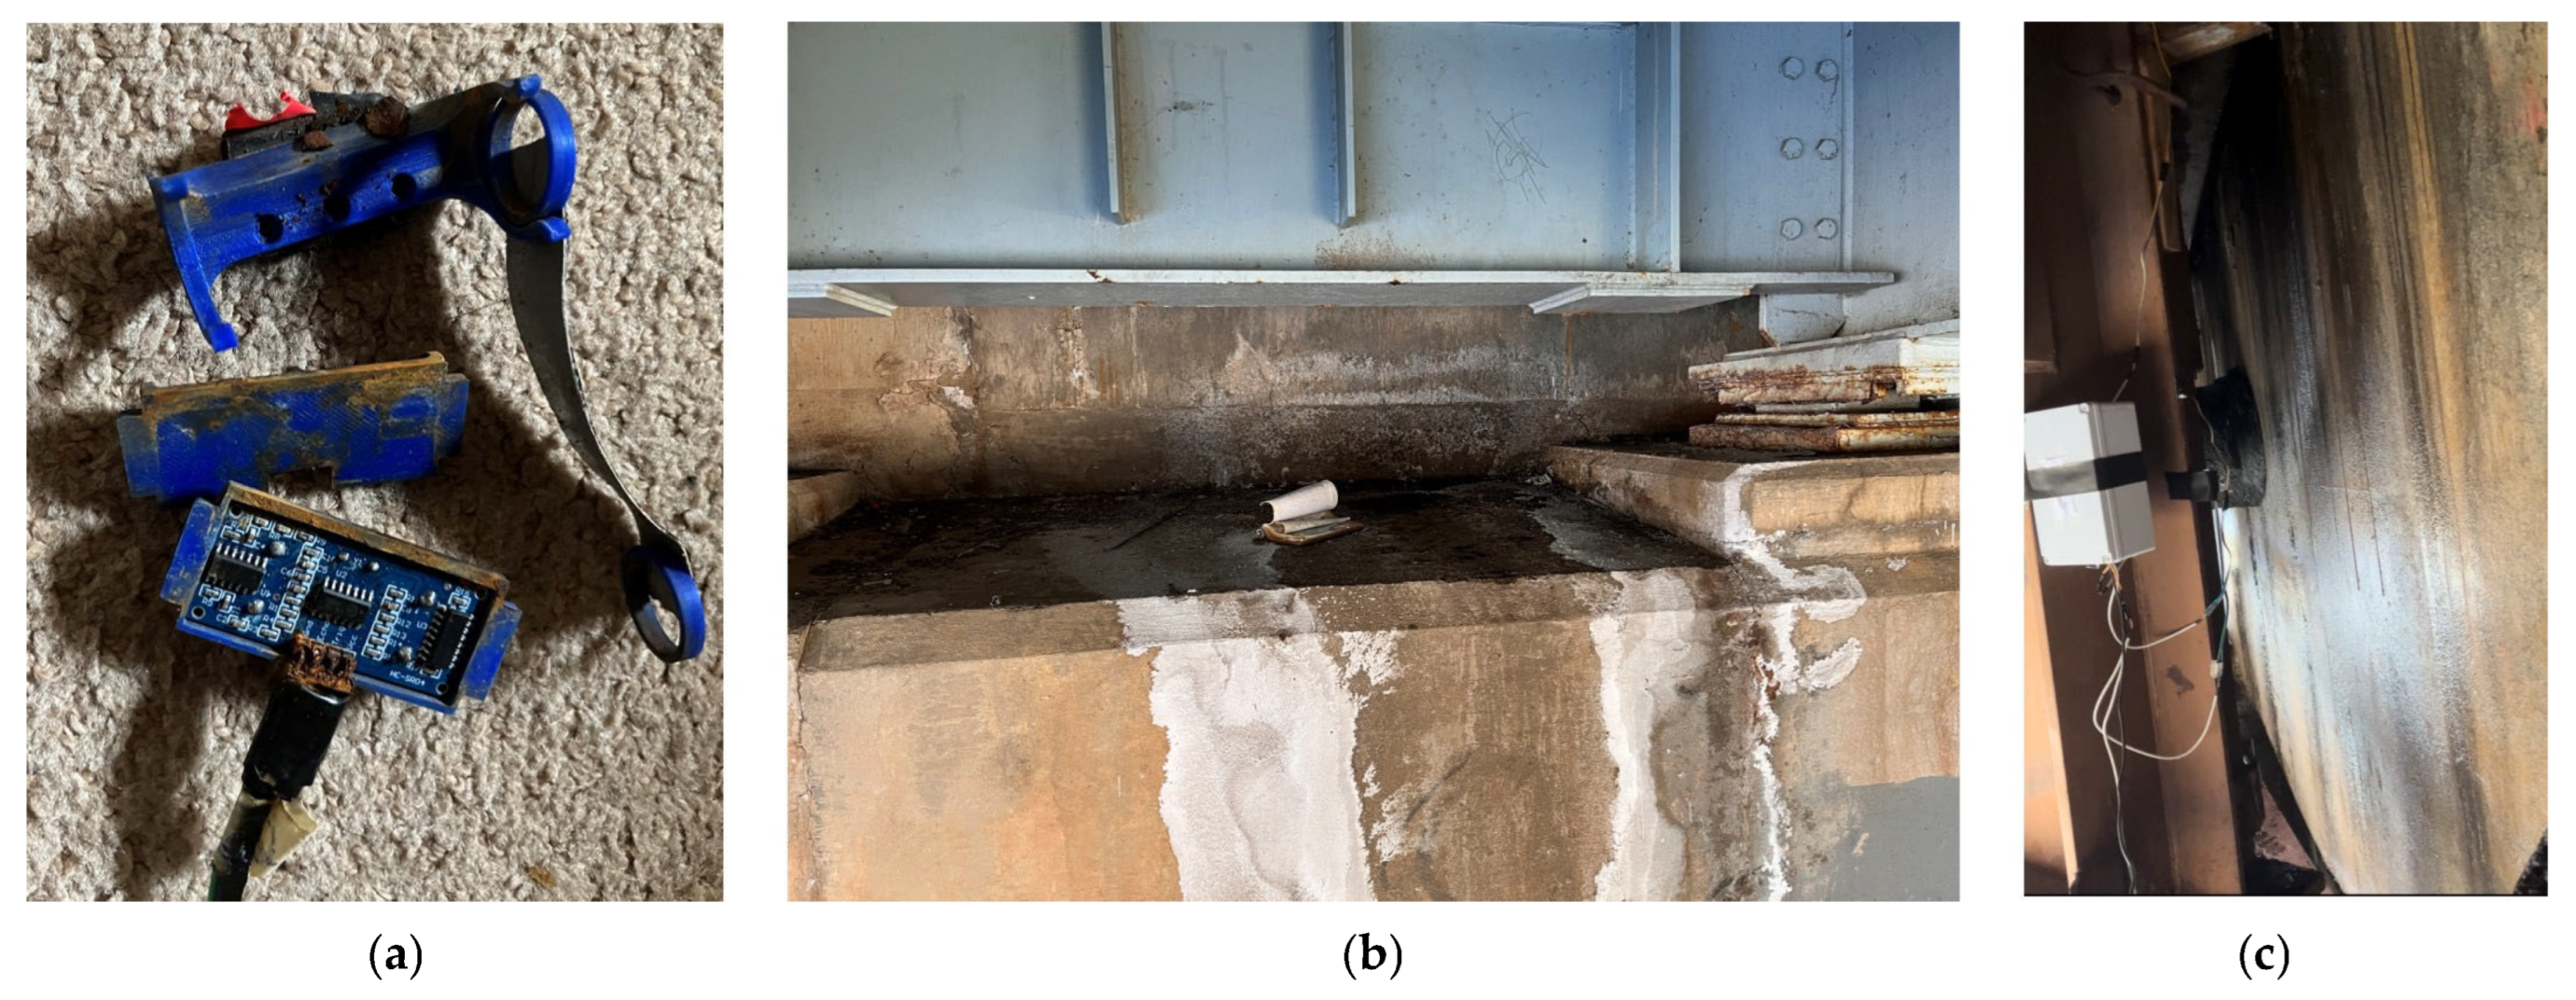
Second, proper environmental protection for both sensors and wiring systems is critical to ensuring data stability. Enclosures must protect components from water, corrosive salts, dust, and mechanical impact, and sensor elements that must remain exposed, such as pins or probes, should be of corrosion-resistant materials. Field observations confirmed that corrosion-sensitive materials degrade rapidly at bridge joints (refer to Figure 9), leading to sensor failure and measurement drift.
Third, ease of installation and robustness to sensor orientation errors are essential for successful long-term monitoring. Sensors should be easy to install accurately in restricted and geometrically complex areas. They should also maintain reliable measurements despite minor deviations in alignment over time. In this project, the selected ultrasonic sensors were sensitive to normal incidence relative to the target surface, which posed challenges during installation. To address this, a custom enclosure with an adjustable base was developed, simplifying field installation and improving measurement quality. This highlights the importance of integrating custom modifications into commercially available sensors to improve their performance.
Finally, the power efficiency of sensors was found to be a significant factor for the continuous monitoring of bridges. The energy requirements of both the sensors and the microcontroller-based data acquisition system must be minimized. Achieving this requires optimizing sampling frequency, computational workload on edge devices, and the volume of data transmitted. In the architecture developed for this study, transmitting raw data was found to be more power-efficient than implementing edge-processing algorithms on the microcontroller. However, this balance can shift when very high sampling rates are required, for example, vibration measurements, in which case local processing may reduce data volume sufficiently to become the more efficient option. These findings highlight the need to evaluate power tradeoffs during system design rather than assuming one strategy is universally optimal.

3.2.3. Real-Time Wireless Communications for Data Transmission

Wireless networks vary significantly in their design goals and trade-offs across power efficiency, scalability, data rate, cost, and ease of deployment. Popular wireless networks adopted in consumer and industrial IoT systems include WLANs (e.g., Wi-Fi), cellular networks (e.g., 4G/5G), LoWPANs (e.g., Zigbee, Bluetooth Low Energy (BLE), 6TiSCH), and LPWANs (e.g., LoRaWAN, NB-IoT) [32,33]. Among these wireless technologies, Wi-Fi provides high data rates and ease of deployment for local connectivity but suffers from high power consumption and limited scalability. Cellular networks such as 4G and 5G offer wide coverage, high reliability, and excellent scalability, albeit at the expense of higher power use, infrastructure cost, and development complexity. In contrast, Bluetooth Low Energy (BLE), Zigbee, and 6TiSCH target short-range, low-power communication for personal and industrial IoT applications; while BLE offers moderate data rates and simple integration, Zigbee and 6TiSCH support large-scale mesh networking with very low power consumption. LoRaWAN and NB-IoT, as low-power wide-area network (LPWAN) technologies, enable energy-efficient, long-range communication for massive IoT deployments, trading off data rate for scalability and endurance. LoRaWAN’s unlicensed spectrum operation offers low-cost, flexible deployment, whereas NB-IoT benefits from carrier-grade reliability and deep coverage at a moderate cost. Overall, high-throughput systems like Wi-Fi and cellular are suited for bandwidth-intensive applications, while LPWAN and LoWPAN protocols such as LoRaWAN, Zigbee, 6TiSCH, and BLE excel in low-power, large-scale sensing and monitoring scenarios.
In this paper, a 6TiSCH (time-slotted channel hopping over Internet Protocol version 6) wireless network was selected for the wireless networks to serve as the underlying communication infrastructure for supporting real-time continuous bridge health monitoring. This decision was made based on the stringent timing, reliability, scalability, and energy efficiency requirements of bridge health monitoring applications. Compared with other LPWAN technologies, such as LoRaWAN and NB-IoT, 6TiSCH provides deterministic low-latency communication and mesh-networking capability, which are critical for coordinating data from a large number of sensors in near real-time. While LoRaWAN and NB-IoT are also power-efficient and low-cost for a small number of sensors transmitting minimal data, they offer less control over radio usage and data organization across multiple sensing nodes, which may reduce reliability for long-term continuous bridge monitoring. 6TiSCH combines the IEEE 802.15.4e [34] TSCH MAC layer, which provides synchronized, channel-hopping time-slotted access to the wireless medium, with the IPv6 and 6LoWPAN protocol stack, allowing seamless integration with the broader Internet. The network layer configurations, scheduling, and technical details of the network are published in the previous publication [28].
From the field deployment, several practical insights were gained regarding the use of a 6TiSCH-based network system for bridge monitoring systems. While 6TiSCH offers deterministic, low-power, and IPv6-compatible communication through its TSCH scheduling, 6LoWPAN compression, and RPL-based multi-hop routing, field implementation showed that power management remains a critical challenge in real-world conditions. For very small networks with fewer than two sensing nodes, Wi-Fi-based distributed sensor networks might be more power efficient due to their simpler topologies and reduced synchronization overhead. However, as the number of sensing nodes increased, the power efficiency of 6TiSCH improved substantially and ultimately surpassed that of distributed sensing alternatives, owing to its tightly scheduled, collision-free communication and predictable duty cycling. Additionally, the modularity of the 6TiSCH architecture made it straightforward to add and remove additional sensing nodes or reconfigure network topology as needed during deployment. Importantly, the hardware cost of the 6TiSCH system did not scale linearly with network size, meaning that larger deployments benefited from relatively lower marginal costs per node. These observations underscore the scalability and long-term efficiency of 6TiSCH for medium- to large-scale structural monitoring applications, while highlighting important considerations for its use in smaller networks.

3.3. Analytics: Dashboards, Structural Assessments, and Computing Schemes

Analytics translates real-time data into bridge health indicator parameters that aid human evaluation and decision-making, enhancing human–machine collaboration and advancing Industry 5.0’s human-centric vision. Interactive dashboards, visualization systems, and backend processing tools like digital twins and artificial intelligence serve as key enablers for these transformations of measured data. The lessons learned from the development and use of these tools are presented in this section.

3.3.1. Dashboards and Visualization

Dashboards and visualization platforms are crucial components of modern Industry 5.0 bridge health monitoring systems. They provide bridge inspectors and bridge owners with timely access to measurements and required structural assessment reports for decision-making. Specifically, these visualization platforms are tools to incorporate cyber-physical systems into human making by integrating real-time sensor information, cloud computing, and intuitive user interaction. As such, dashboards form a critical layer in transforming raw data streams into actionable insights.
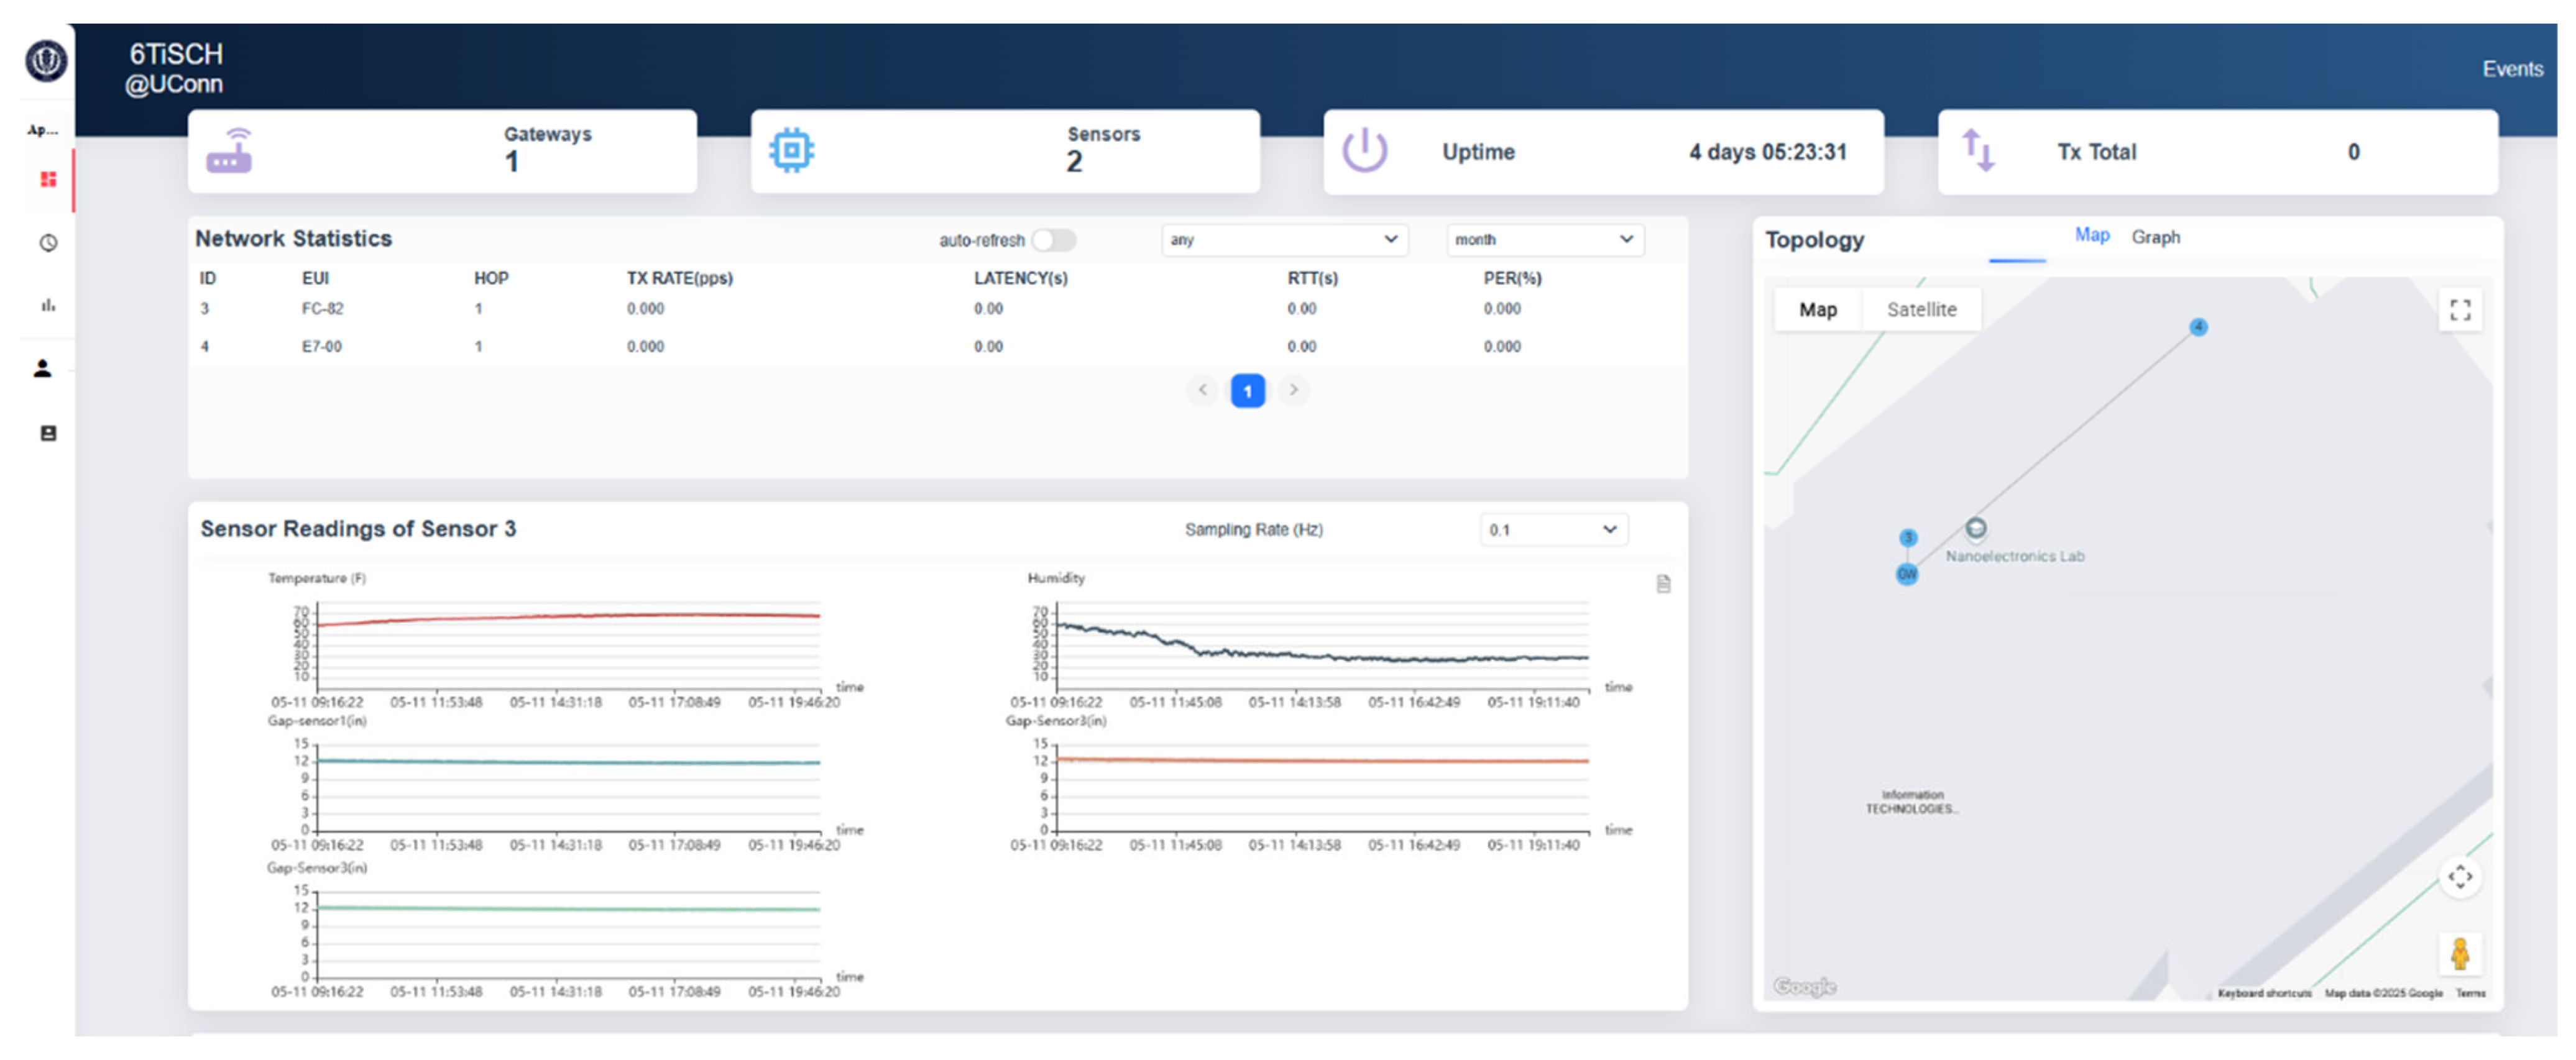
For the tested system, a web-based dashboard was developed to facilitate real-time access and interaction with field measurements. A cloud-hosted webpage provided a centralized interface through which users could view, download, and analyze sensor data from all deployed monitoring nodes. The interactive Graphical User Interface (GUI), shown in Figure 10, enabled seamless visualization of time-series records, device-specific performance indicators, and network-level communication statistics. For analytical purposes, data were downloaded directly through this platform, creating a continuous pipeline from in situ sensing to offline interrogation of bridge behavior. Sensor readings were transmitted from the virtual server to the web application using a RESTful web service, which enabled standardized, scalable, and stateless communication between the data acquisition backend and the visualization frontend. The entire web system was containerized using Docker and deployed on a cloud server. Within this architecture, separate containers were dedicated to the database, the web application, and additional analytics modules, thereby ensuring modularity, scalability, and efficient resource allocation.
The development and operation of this dashboard and cloud-based visualization framework provided valuable takeaways. First, the use of a cloud server was to be significantly more cost-effective and operationally flexible than relying on a local server. Cloud platforms eliminated several constraints commonly associated with local hosting, such as institutional network restrictions, hardware maintenance demands, and limited scalability, and offered improved security, uptime, and seamless integration with the wireless communication infrastructure. As a result, cloud-based hosting was found to be effective for real-time monitoring applications requiring continuous connectivity and remote access.
Second, the adoption of Docker-based containerization for backend development improved development flexibility by allowing easy maintenance and extensions of the visualization platform. Containerized services allowed new analytics tools, database functions, or processing modules to be added as separate containers without disrupting existing components. This modular structure also simplified platform portability and migration across different computing environments, facilitating iterative development and long-term sustainability of the monitoring system. Overall, container-based architecture was found to be an effective strategy for supporting various analytics needs in real-time bridge monitoring.

3.3.2. Structural Assessments—Digital Signal Processing, Digital Twin, and AI

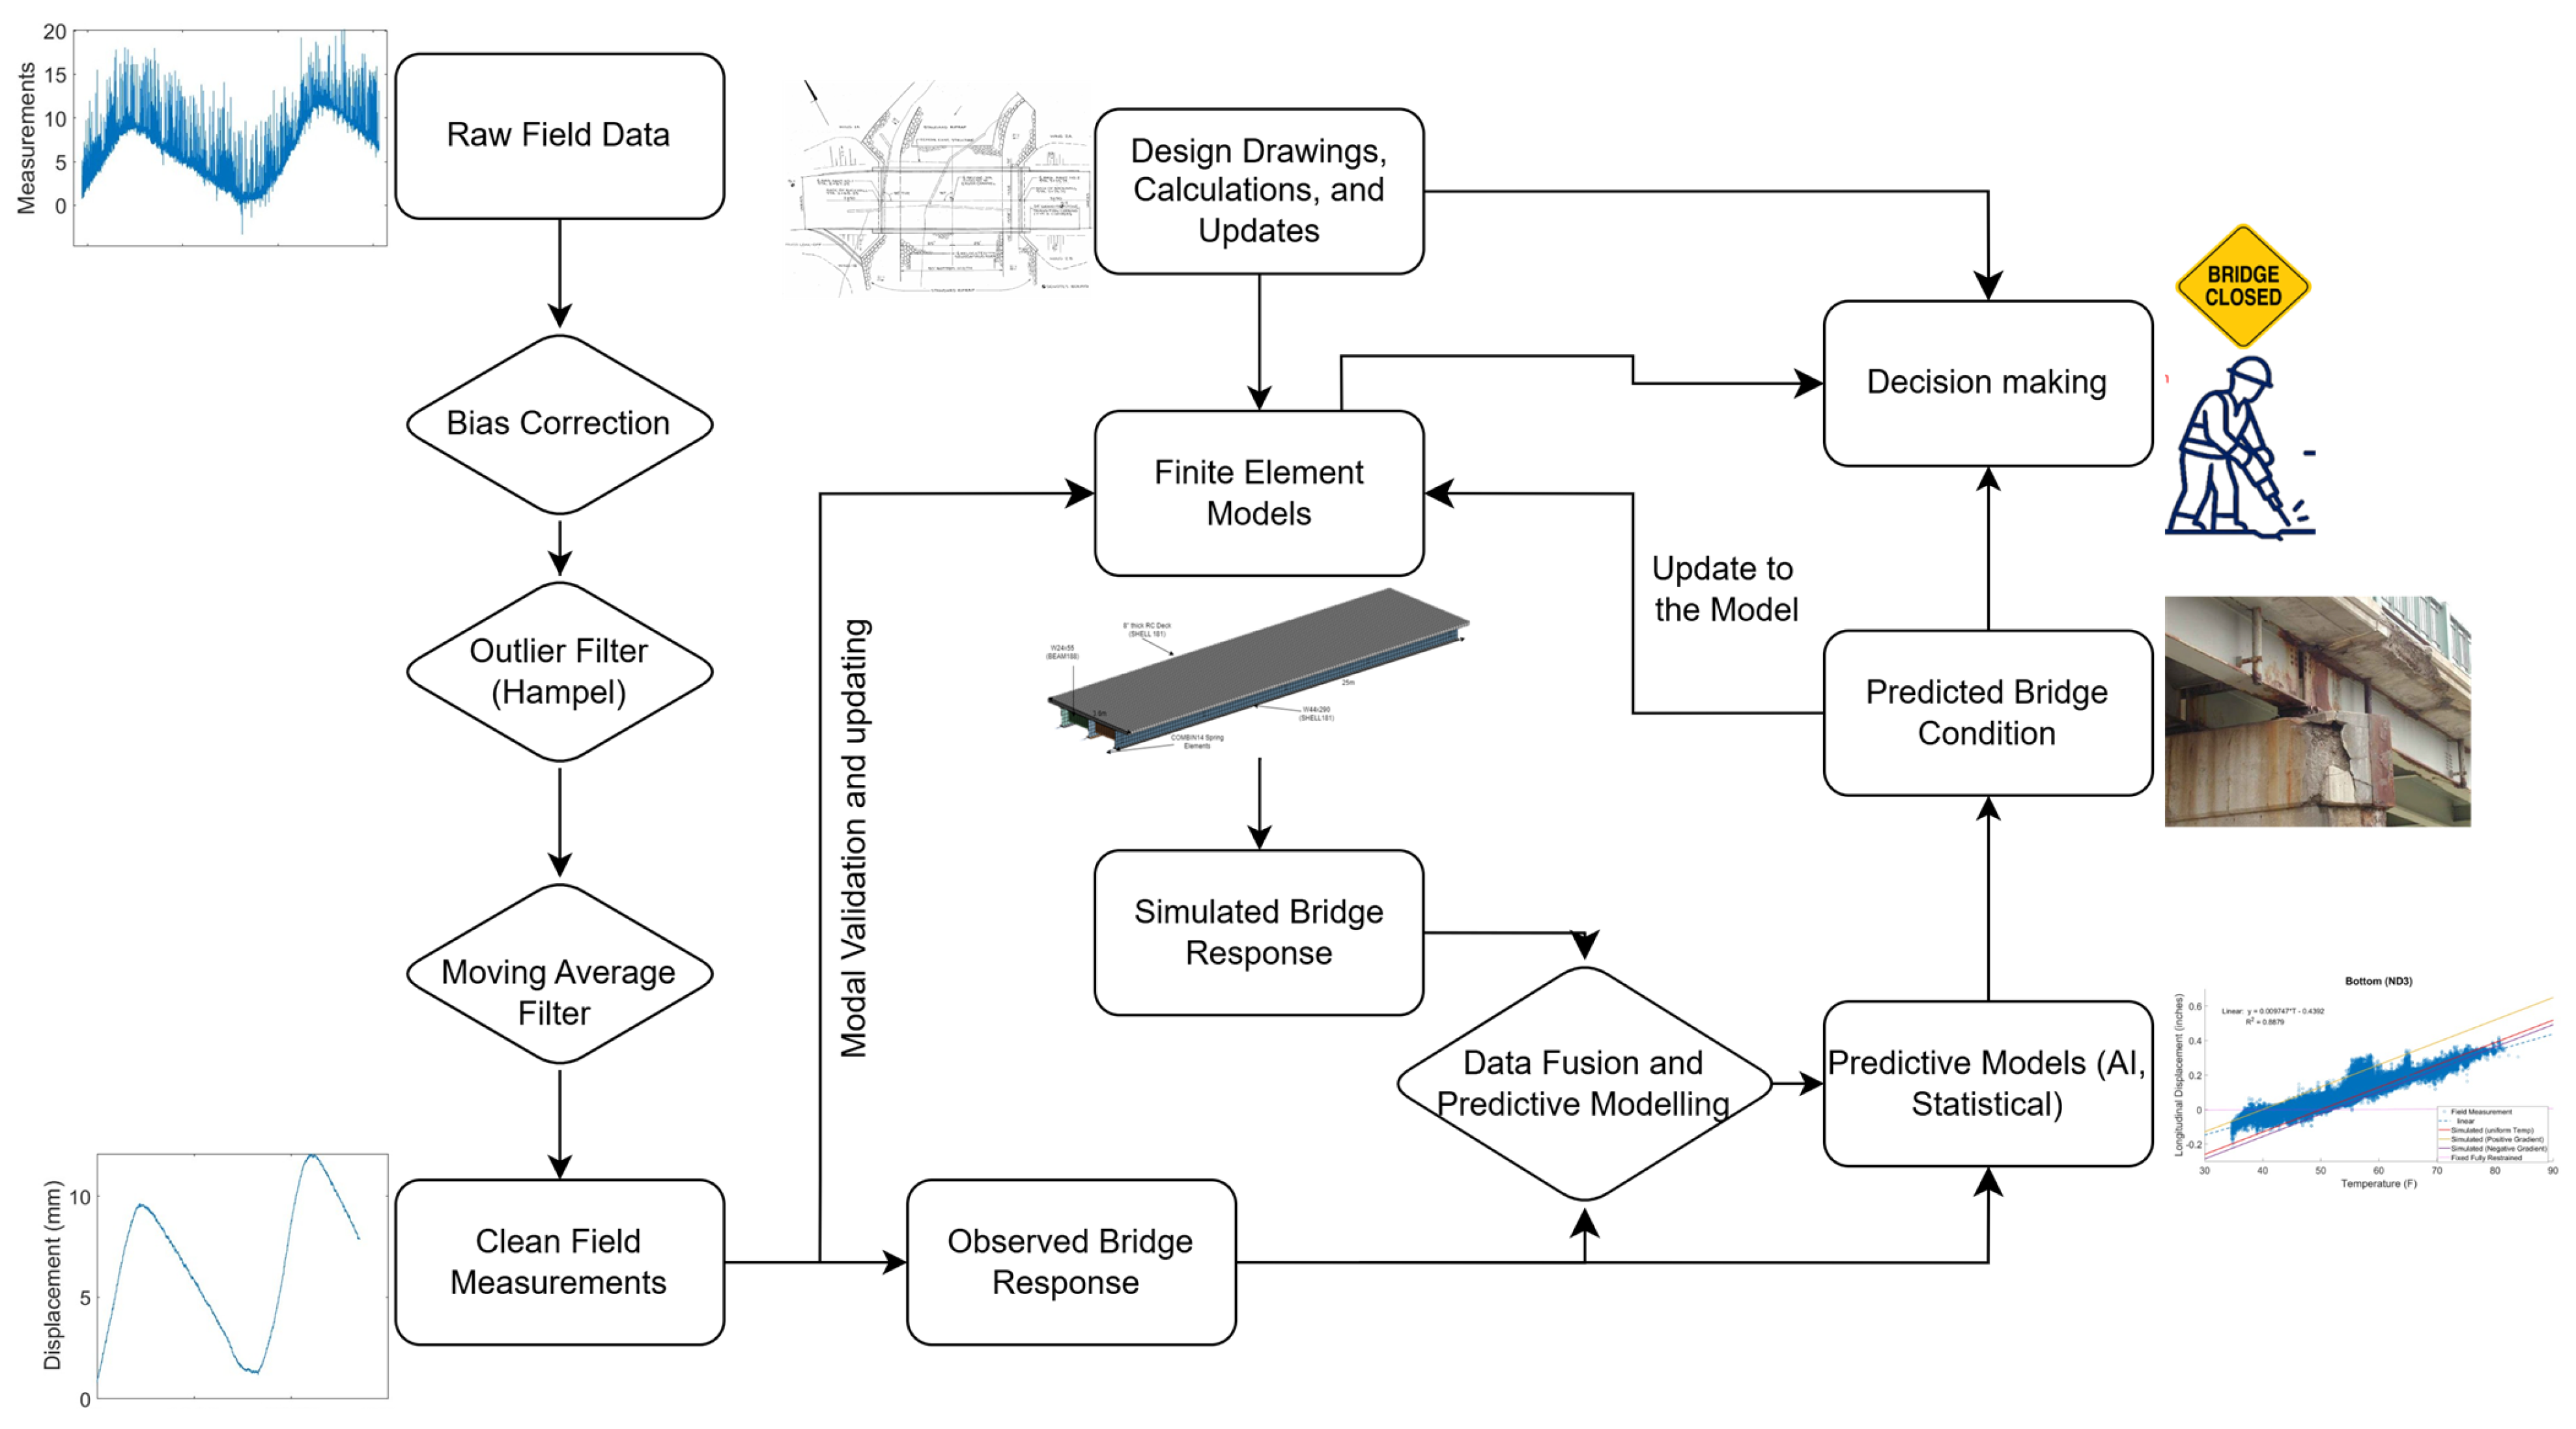
Structural assessments form the backend of the dashboard and visualization system and provide the requested information in an appropriate format by processing monitoring data. Generally, field data were cleaned first and then integrated with known information about bridges—such as existing digital twins (finite element models), statistical models, design or as-built information—to estimate their current condition. Depending upon the type of data collected and the structural assessment required by users, different data analysis frameworks can be developed. Figure 11 shows the data analytics workflow used for the project. Digital signal processing techniques were applied to denoise the raw field measurements, while finite element models were developed to generate supplementary datasets. These inputs were subsequently fused using statistical and deep learning methods to estimate critical health indicators, namely bearing stiffness and temperature-displacement relationships for the bearings and expansion joints, respectively.
Digital Signal Processing: To enhance data fidelity, filters and corrections were used for the field data. The outliers were first eliminated using a Hampel filter [35], then a moving average smoothing over a minute of measurement was applied to stabilize the signal. As the temperature and humidity were identified as factors affecting ultrasonic distance measurements, they were corrected by developing analytical correction models. The corrected field measurements were then used to calculate longitudinal movements and girder end rotations as observed bridge response parameters in subsequent analysis.
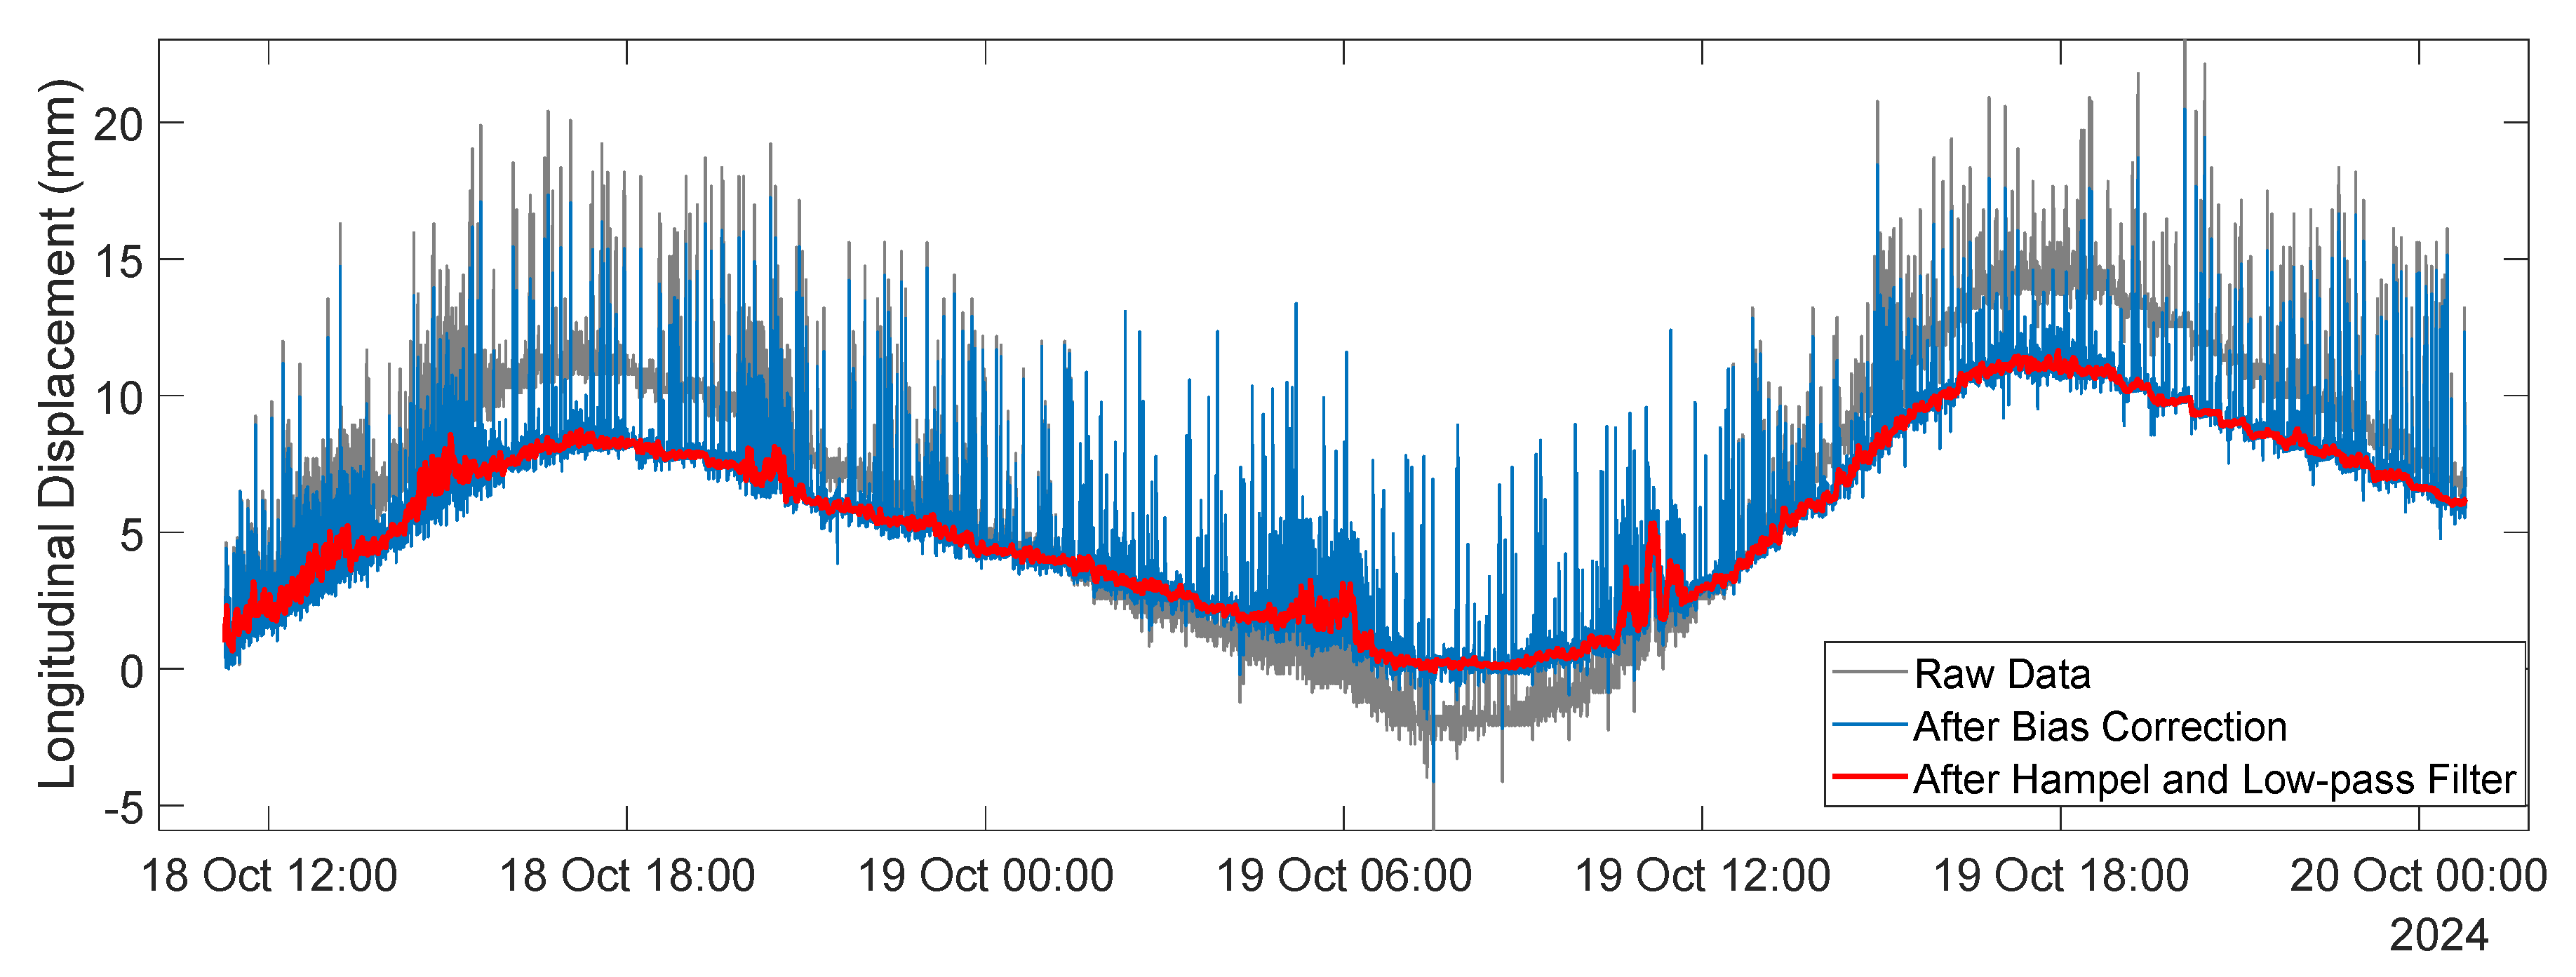
The key lesson learned from signal processing is that outliers and sensor biases are primary factors causing signal distortion in long-term monitoring, and their identification, correction, or removal must be carried out properly. Outlier detection requires judicious application, as overly aggressive filtering may inadvertently remove legitimate extreme responses that are critical for structural assessment, and lenient filtering might result in incomplete removal of outliers. Hampel filters with a large window size demonstrated superior performance relative to mean-based and quartile-based alternatives, effectively isolating anomalous points while preserving significant structural trends. The effect of the Hampel filter followed by the moving average low-pass filter on the signal is demonstrated in Figure 12. Clearly, this setup was able to eliminate noisy measurements and produce a stable signal. In addition to outliers, sensor readings are often influenced by surrounding environmental and operational conditions, necessitating systematic bias identification and corrections. Temperature, humidity, and sensor orientation were recognized, through literature review and laboratory testing, as sources of measurement bias in ultrasonic sensors and were therefore corrected in the field data processing workflow. The detailed algorithms and formulations for sensor bias corrections can be found in reference [25]. The effect of sensor bias correction is illustrated in Figure 12. Notably, the difference between corrected and uncorrected longitudinal movement measurements reached up to 25% (changed from an uncorrected value of 14.3 mm to 11.4 mm, after correction in the second peak shown in Figure 12). Therefore, proper digital signal processing, particularly outlier and sensor bias management, is critical to improve the reliability and accuracy of field monitoring data.
Digital Twins: The digital twin utilized in the study constituted a hybrid virtual representation of the bridge that integrates physics-based Finite Element (FE) simulations with data-driven predictive and statistical models, informed by monitoring data. The FE model establishes baseline structural responses, while AI and statistical models enable response prediction for health assessment and decision support.
FE Models: Finite element (FE) models were utilized as a core tool within digital twins of the bridges, enabling simulation of structural responses under various loading conditions and facilitating direct comparison with, and supplementation of, measured field data. 3D finite element models of the monitored bridges were developed in the commercial ANSYS Mechanical 2022R2 [36] package and was calibrated with field measurements. FE models were then utilized to simulate the thermal behavior of field bridges.
These FE models of bridges played a critical role in the development of data-driven algorithms for structural assessment and visualization. Supervised learning methods, such as artificial neural networks (ANNs), require large volumes of labeled training data to produce reliable prediction models; however, obtaining such data from in-service bridges is often prohibitively expensive or practically infeasible. For example, developing an ANN to predict bearing stiffness would require longitudinal movement data paired with known support stiffness values [29]. This requirement is difficult to satisfy because the bearing stiffness of an in-service bridge cannot be systematically varied across a wide range to represent all potential field conditions, and obtaining such data would further necessitate explicit measurement of bearing properties from multiple bridges along with their corresponding longitudinal responses. In contrast, well-calibrated high-fidelity FE models can generate comparable labeled datasets at minimal cost and can further serve as powerful tools for visualizing bridge behavior and evaluating the implications of various structural conditions. Such capabilities are essential for informed decision-making, maintenance planning, and broader public-safety considerations.
One challenge, however, is that high-resolution FE simulations may demand substantial computational resources. In these cases, problem size can be reduced with proper verification and validation to achieve computational efficiency, as demonstrated by the reduction of a full-bridge model to a single-girder model for thermal-response analysis in this study. Overall, when appropriately calibrated and efficiently implemented, finite element models offer valuable supplementary data, intuitive condition visualization, and robust impact assessment, thereby strengthening human–machine interaction within Industry 5.0 bridge monitoring systems.
AI models and Statistical Models: An ANN-based model for the prediction of the fixity level of bearing was developed. The model was trained to predict the stiffness of the bearing from given longitudinal movement, girder end rotation, and girder temperature. The training data was generated using FE-simulated bridge response and was tested on field-measured data. More details on the development of this model can be found in paper [29]. The predicted bearing stiffness was used as an indicator of bearing health.
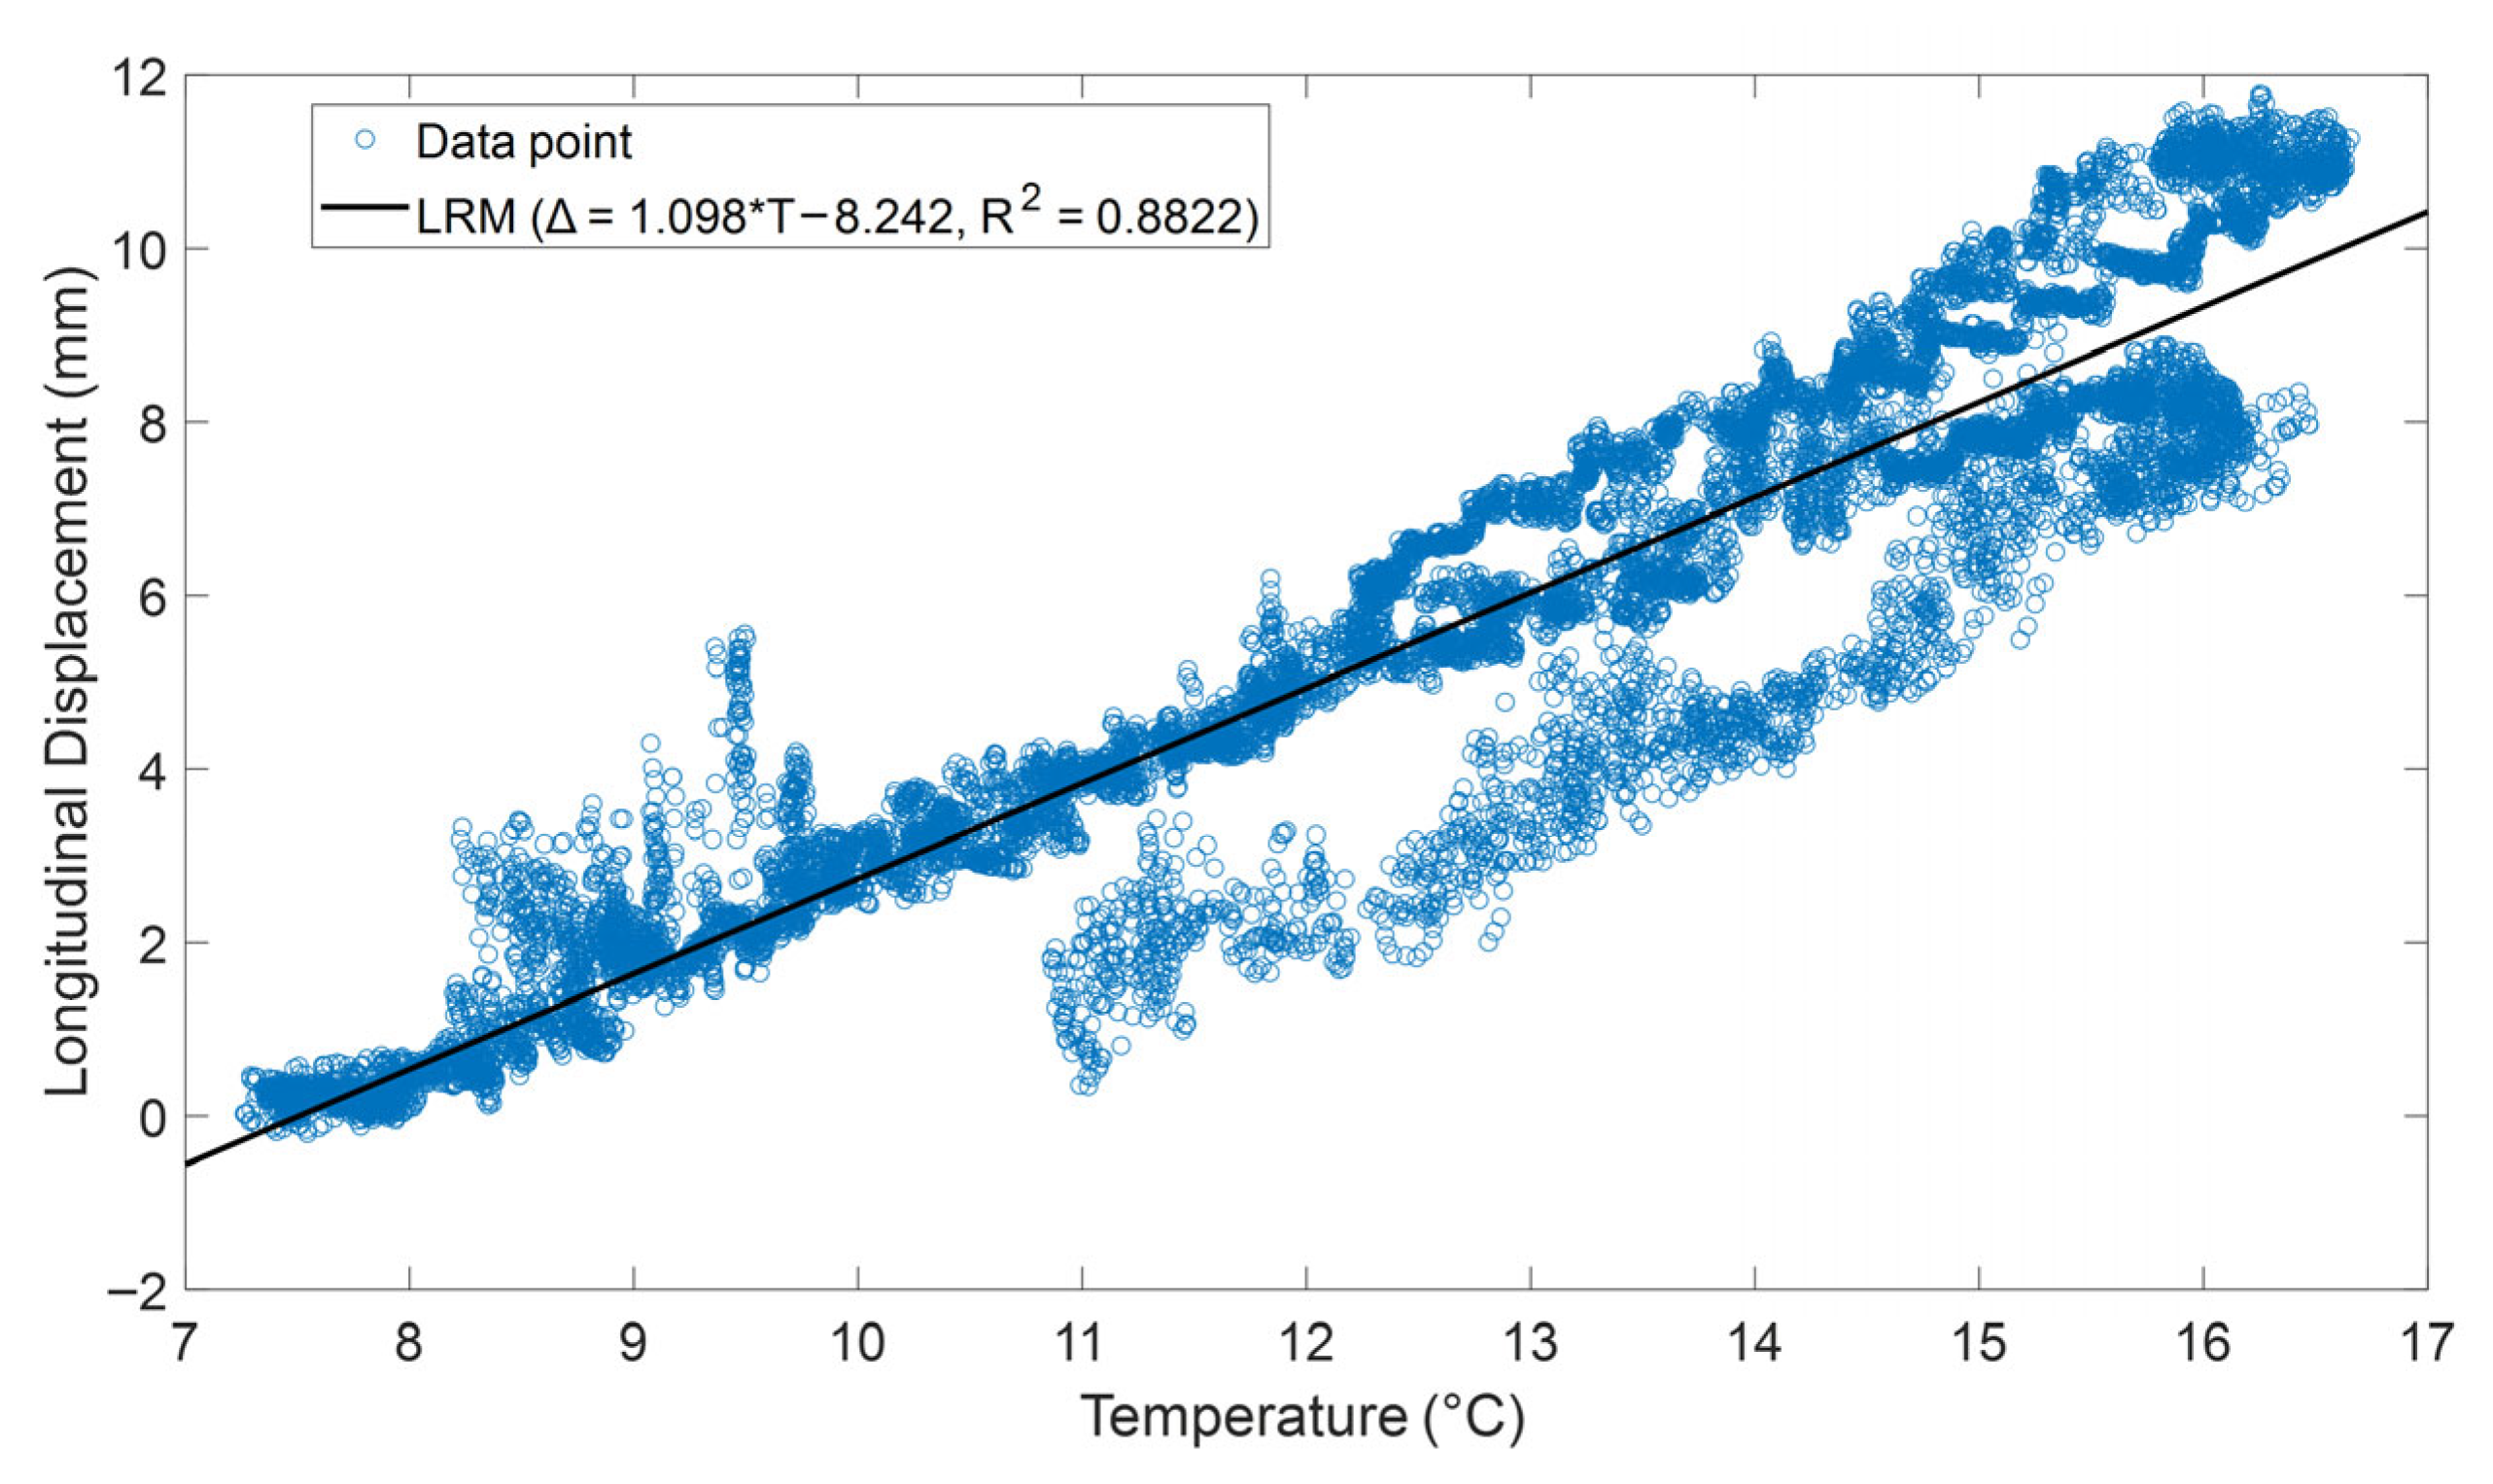
Also, linear regression models (LRMs) for longitudinal movements and girder end rotation for each bridge were established to assess the adequacy of expansion joints on them. This simple linear regression model outputs the expected movement of the bridge based on measured temperature, and the model-predicted movement could be compared with the actual field movement condition of joints. A typical LRM model developed from the field monitoring of Bridge 3 is presented in Figure 13. The LRMs exhibit a strong correlation between temperature and longitudinal displacement, with an R2 value of 0.8822. The predicted displacements closely follow the measured field data, capturing the dominant thermal-driven movement trend despite inherent scatter in the measurements. This level of agreement indicates that the developed LRM is adequate for evaluating the longitudinal performance of the expansion joint under in-service conditions.
Overall, these two algorithms help agencies identify the condition of bearings based on the level of fixity offered by them and the adequacy of the existing expansion joint to plan detailed assessments, maintenance, or rehabilitation.
From the study, it was evident that both AI and classical statistics-based models were useful if developed and used judiciously. The accuracy of the supervised AI model was found to be highly dependent on the similarity between the training data and the data used for prediction. Because labeled field data is difficult to obtain, these models are often trained on simulated datasets; however, simulation outputs typically lack the noise levels, nonlinearities, and subtle patterns present in real field measurements. Therefore, careful attention must be given to ensuring that the simulated training data adequately reflects the statistical and physical characteristics of the field data. This should be checked, and if necessary, noise infusion and other features should be added to the simulated data. Additionally, wherever possible, AI models should be calibrated or cross-validated using available field measurements or established engineering methods to improve robustness and build confidence in their operational use.
The ANN model developed for bearing fixity estimation has demonstrated cross-bridge validity for estimating bearing stiffness in composite girder bridges monitored using the developed sensor system [29]. The model was trained and validated using simulated data designed to replicate the response characteristics measured by the developed monitoring system, and it exhibited consistent predictive performance when applied to two different in-service bridges (Bridge 1 and Bridge 2). These results indicate that the model is generalizable to bridges with similar structural systems and monitoring setups. Extension of the model to other bridge types or alternative monitoring layouts would require additional training and validation. Therefore, when deploying such AI models, it is essential to consider the similarity between the training and prediction data and their context.
Statistical models possess simplicity and interpretability, but they may oversimplify the underlying structural response. For example, in the linear regression models, it fails to provide reasonable predictions when temperature–movement relationships exhibit nonlinear or hysteretic behavior. Therefore, the reliability of a model ultimately depends upon its ability to reflect the underlying behavior of field data and should be validated before practical implementation.
One key consideration in the use of digital twins is that their predictive accuracy is inherently dependent on the range of the calibration data. Under extreme events, such as rapid temperature fluctuations or abrupt loading conditions, beyond the observed operational range, model predictions may be subject to high uncertainty. As such conditions were not explicitly captured during the monitoring period; quantitative validation of model performance under these extremes is beyond the scope of the present study. Nevertheless, even when precise response prediction becomes less reliable, the digital twin remains valuable as a decision-support tool, as deviations between measured and predicted responses can provide indications of anomalous behavior during extreme events.

3.3.3. Computing Schemes: Cloud vs. Edge Computing

Another notable observation from the field monitoring was that the edge computing configuration exhibited power inefficiency. The implementation of computational routines for data curation directly on microcontroller-based sensor nodes was found to be inefficient from a power-consumption perspective. Outlier-removal procedures and moving-average smoothing were tried on Arduino platforms, leading to frequent power interruptions and reduced system uptime. Consequently, these operations were migrated to the central cloud server, where power availability was not a constraint. This observation suggests that edge-computing approaches, although central to Industry 5.0 objectives, may be suboptimal for monitoring systems that rely on low-frequency measurements and operate under stringent power limitations. Nevertheless, when an adequate and stable power supply is available, performing data-curation processes on the sensor controller board reduces noise from the signal. Moreover, when the sampling frequency is high, edge computing reduces transmission load, making the overall system power-efficient. Therefore, the implementation of edge computing in real-time bridge monitoring should be implemented with consideration of power efficiency.

3.4. Decision Making

Although formal decision-making was not part of the project scope, it remains an essential component of any complete real-time monitoring framework. For bridge management agencies, predictive insights generated by structural assessment models should be incorporated into existing maintenance and prioritization workflows in a structured manner. It is recommended to ensure human oversight when interpreting model outputs, verifying the plausibility of predicted conditions and deterioration rates before integrating them into institutional decision metrics. Such human-in-the-loop evaluation enhances the reliability, transparency, and acceptance of data-driven decision processes, supporting safer and more informed maintenance planning.

3.5. Power Management

Power availability emerged as a major factor influencing the design, deployment, and performance of real-time bridge monitoring systems. Ensuring a continuous and sufficient power supply for on-site instrumentation was challenging, particularly due to the unavailability of accessible grid power near the bridge site and regulatory and safety constraints associated with accessing it, even when available. Solar energy harvesting was a practically viable alternative; however, its reliability and efficiency, along with the complexities of managing harvested power within distributed sensor networks, posed significant difficulties. These challenges collectively limit the autonomous and uninterrupted operation of real-time monitoring systems.
A Li-Po battery with a nominal capacity of 1000 Wh was used to power the field sensor network. The measured power consumption of the system was 20–25 W during normal operation, resulting in a standalone battery endurance of approximately 40 h in the absence of energy harvesting. Under winter conditions, when solar availability is limited, this battery-only endurance defines the minimum guaranteed operational time of the system. Solar energy harvesting performance was found to be highly dependent on weather conditions and panel configuration. The harvested energy was sufficient to offset system consumption only in conducive weather conditions in non-winter months.
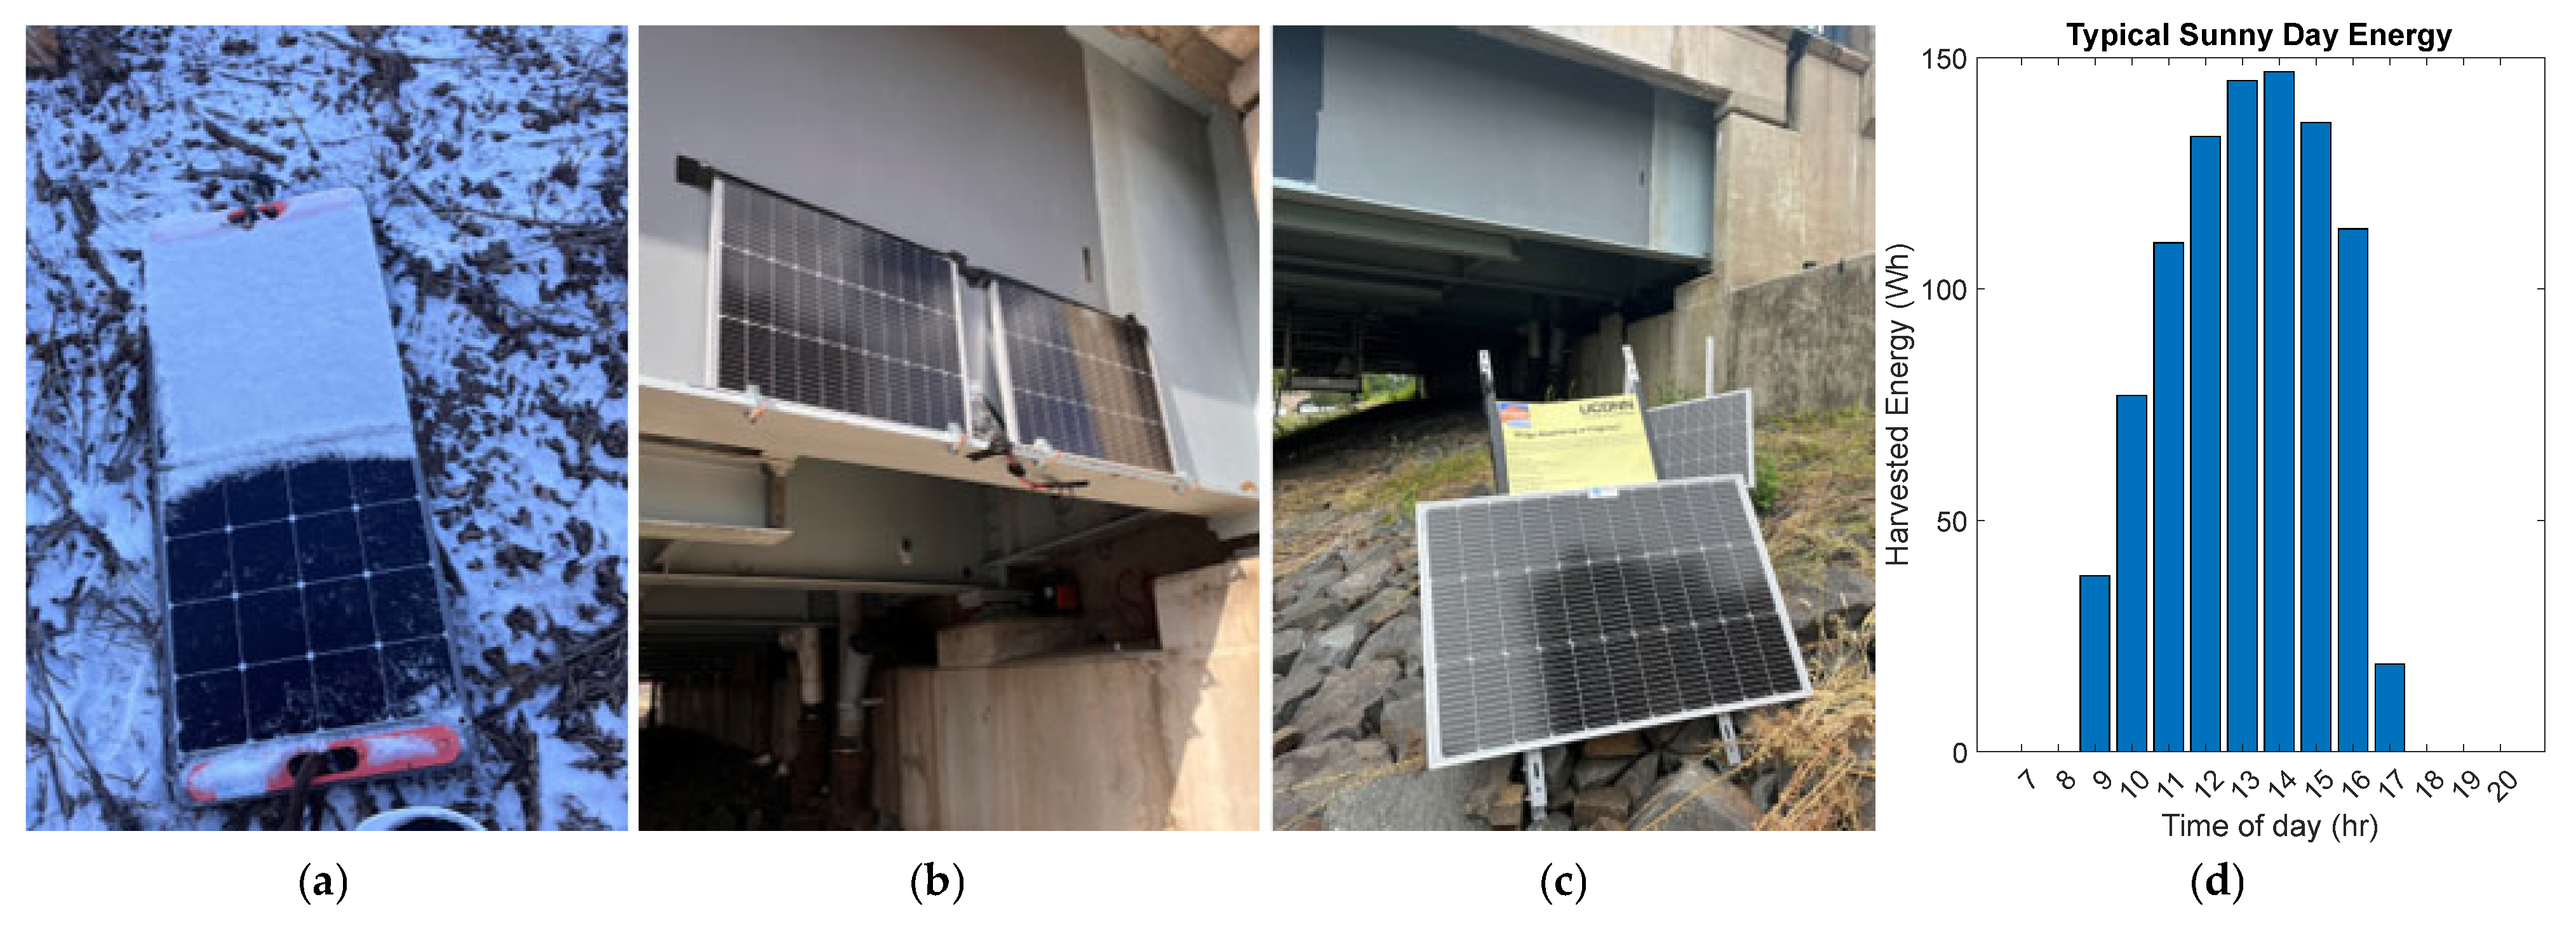
Power harvesting was a significant problem, causing system blackouts. Site conditions, weather, and panel configuration affect energy production. Identifying a suitable location for solar panel installation proved to be a major difficulty. Installing panels above the road surface was not permitted, as reflections from the panels could create safety hazards for drivers, while locations below or on the side of the bridge suffered from significant shadowing due to the bridge structure itself and surrounding vegetation. Installing the panels farther from the bridge could improve sunlight access but required long power cables, which increased safety risks, installation complexity, and exposure to damage, and in some cases, was not permitted due to site conditions. Several locations on different bridges were employed, depending on site conditions and energy harvesting pattern, as shown in Figure 14. The solar panel was fixed on the ground on the side slope of Bridge 1 and Bridge 2, as shown in Figure 14a. The method is safe to withstand wind and easy to install, but it does not harvest power efficiently and is heavily affected by snow. Mounting the panels directly on the bridge structure, such as on the side of girders, as shown in Figure 14b, was also attempted, but faced challenges due to self-shading and difficulty orienting the panels at an optimal tilt. Ground-mounted adjustable frames, as shown in Figure 14c, provided high energy outputs; however, they were costly, vulnerable to snow cover, high winds, and winter storms. Battery-related issues further compounded these challenges, including automatic shutdowns, overheating during the summer months, and energy losses over prolonged low-temperature exposure. These issues collectively made a continuous and reliable power supply a challenge in maintaining uninterrupted data collection. Therefore, efficient energy management through multi-modal energy harvesting, robust storage, low-power sensors, network designs, and remote power monitoring will maximize uptime, reduce maintenance, and allow the collection of continuous measurements over the long term.

4. Conclusions

This paper presented lessons learned from long-term deployment of a novel real-time field monitoring framework on multiple highway bridges as an enabler of Industry 5.0 objectives by augmenting human expertise with reliable data-driven decision-making. Specific considerations and lessons for the practical implementation of a real-time monitoring system for expansion joints and bearings of three in-service bridges were presented. A framework for the successful development and implementation of an Industry 5.0-compliant bridge monitoring system was developed. The modular system architecture designs optimized for cost and power were found to be efficient to develop and deploy. Use of appropriate sensors was found to be crucial to maintain the long-term viability of field monitoring under harsh weather impacts. 6TiSCH-based wireless communication was found to be optimal for mid to large-sized sensor networks based on cost and power efficiency. The use of Docker-based containerized applications for data analytics and visualization proved efficient in development, modification, and portability. The findings also underscore the importance of high-quality field data, judicious outlier and bias correction, and high-fidelity FE-model integration to support advanced data-driven structural assessments. Moreover, different use cases of cloud computing and edge computing for the bridge monitoring system were outlined. Field observations showed that a balanced integration of cloud- and edge-computing strategies can effectively mitigate several on-site challenges and better support Industry 5.0-oriented monitoring practices. Collectively, these insights provide actionable guidance for developing next-generation monitoring systems that can strengthen human–machine collaboration, enhance decision-making, and advance bridge management practices toward an Industry 5.0 paradigm.

Author Contributions

Conceptualization, P.B. and S.J.; resources, S.J., R.B.M., and S.H.; data curation, P.B., and S.J.; writing—original draft preparation, P.B., S.H., and S.J.; writing—review and editing, S.J., R.B.M., S.H., and P.B.; supervision, S.J., R.B.M., and S.H.; project administration, S.J., R.B.M., and S.H.; funding acquisition, S.J., R.B.M., and S.H. All authors have read and agreed to the published version of the manuscript.

Funding

This work is partially funded by the U.S. Department of Transportation Region 1 (New England) University Transportation Center (UTC), Transportation Infrastructure Durability Center (TIDC) under grant 69A3551847101, and the University of Connecticut IDEA Grant.

Data Availability Statement

The data and information used to write this article can be obtained from the corresponding author upon request.

Acknowledgments

The authors of the report would like to acknowledge the valuable contribution to the field and laboratory tests from the following individuals to the completion of this project: Jiachen Wang (Computer Science and Engineering), Jimmy Padilla (College of Engineering), Romy Reichenberger (Civil & Environmental Engineering), and Sandhya Pandey (Civil & Environmental Engineering). Sincere thanks and appreciation are also due to the Connecticut Department of Transportation (CTDOT) for their support in making the testbed bridge available for testing and other in-kind contributions (Contacts: Bao Chuong, P.E, Andrew Cardinali, P.E., and Sangyul Cho, Ph.D., P.E.). During the preparation of this manuscript/study, the author(s) used ChatGPT5.0 for the purposes of linguistic proofreading. The authors have reviewed and edited the output and take full responsibility for the content of this publication.

Conflicts of Interest

The authors declare no conflicts of interest. The funders had no role in the design of the study; in the collection, analyses, or interpretation of data; in the writing of the manuscript; or in the decision to publish the results.

References

  1. U.S. Department of Transportation Federal Highway Administration and Federal Transit Administration. Status of the Nation’s Highways, Bridges, and Transit: Conditions and Performance; Report to Congress; U.S. Department of Transportation Federal Highway Administration and Federal Transit Administration: Washington, DC, USA, 2021.
  2. Bridges. ASCE’s 2025 Infrastructure Report Card; American Society of Civil Engineers (ASCE): Washington, DC, USA, 2017. [Google Scholar]
  3. National Bridge Inspection Standards—Bridge Inspection—Safety Inspection—Bridges & Structures—Federal Highway Administration. Available online: https://www.fhwa.dot.gov/bridge/nbis.cfm (accessed on 19 November 2025).
  4. Agdas, D.; Rice, J.A.; Martinez, J.R.; Lasa, I.R. Comparison of Visual Inspection and Structural-Health Monitoring as Bridge Condition Assessment Methods. J. Perform. Constr. Facil. 2016, 30, 04015049. [Google Scholar] [CrossRef]
  5. Graybeal, B.A.; Phares, B.M.; Rolander, D.D.; Moore, M.; Washer, G. Visual Inspection of Highway Bridges. J. Nondestruct. Eval. 2002, 21, 67–83. [Google Scholar] [CrossRef]
  6. Moore, M.E.; Phares, B.M.; Graybeal, B.A.; Rolander, D.D.; Washer, G.A. Reliability of Visual Inspection for Highway Bridges; Federal Highway Administration: Washington, DC, USA, 2001.
  7. Federal Highway Administration (FHWA). 23 CFR Part 650 Subpart C—National Bridge Inspection Standards; Federal Register; U.S. Department of Transportation Federal Highway Administration: Washington, DC, USA, 2022.
  8. Federal Highway Administration (FHWA). Specifications for the National Bridge Inventory (SNBI); Federal Highway Administration (FHWA): Washington, DC, USA, 2022.
  9. American Association of State Highway and Transportation Officials (AASHTO). Manual for Bridge Element Inspection, 2nd ed.; AASHTO: Washington, DC, USA, 2019. [Google Scholar]
  10. Industry 5.0—Research and Innovation—European Commission. Available online: https://research-and-innovation.ec.europa.eu/research-area/industrial-research-and-innovation/industry-50_en (accessed on 23 November 2025).
  11. Bah, A.S.; Zhang, Y.; Sasai, K.; Conciatori, D.; Chouinard, L.; Zufferey, N.; Power, G.J.; Sanchez, T.; Chen, X. Bridge Service Life and Impact of Maintenance Events on the Structural State Index. Case Stud. Constr. Mater. 2025, 22, e04766. [Google Scholar] [CrossRef]
  12. Ghafoori, M.; Abdallah, M.; Ozbek, M.E. Machine Learning–Based Bridge Maintenance Optimization Model for Maximizing Performance Within Available Annual Budgets. Case Stud. Constr. Mater. 2024, 29, 04024011. Available online: https://ascelibrary.org/doi/epdf/10.1061/JBENF2.BEENG-6436 (accessed on 27 August 2025).
  13. Nguyen, T.Q.; Vu, T.B.; Shafiabady, N.; Nguyen, T.T.; Nguyen, P.T. Real-Time Structural Health Monitoring of Bridges Using Convolutional Neural Network-Based Loss Factor Analysis for Enhanced Energy Dissipation Detection. Structures 2024, 70, 107733. [Google Scholar] [CrossRef]
  14. Jin, C.; Jang, S.; Sun, X. An Integrated Real-Time Structural Damage Detection Method Based on Extended Kalman Filter and Dynamic Statistical Process Control. Adv. Struct. Eng. 2017, 20, 549–563. [Google Scholar] [CrossRef]
  15. Aktan, A.; Catbas, N.; Pervizpour, M.; Kulcu, E.; Grimmelsman, K.; Barrish, R.; Qin, X. Real-Time Bridge Health-Monitoring for Management; Drexel Intelligent Infrastructure Institute: Philadelphia, PA, USA, 2000. [Google Scholar]
  16. Li, Z.; Lin, W.; Zhang, Y. Real-Time Drive-by Bridge Damage Detection Using Deep Auto-Encoder. Structures 2023, 47, 1167–1181. [Google Scholar] [CrossRef]
  17. Zhang, D. Research on a Bridge Health Monitoring System Based on Machine Learning. In Proceedings of the 2024 3rd International Conference on Algorithms, Data Mining, and Information Technology; ACM: Chengdu, China; Guizhou, China, 2024; pp. 214–218. [Google Scholar]
  18. Jayasinghe, S.; Sun, Z.; Sidiq, A.; Mahmoodian, M.; Shahrivar, F.; Setunge, S. Smart Structural Monitoring: Real-Time Bridge Response Using Digital Twins and Inverse Analysis. Sensors 2025, 25, 3513. [Google Scholar] [CrossRef] [PubMed]
  19. Kokane, S.R.; Jadhav, P. Real Time Monitoring of Bridge by Using Sensor Technology with Concentration on Deflection Identification. In Proceedings of the 2025 1st International Conference on AIML-Applications for Engineering & Technology (ICAET); IEEE: New York, NY, USA, 2025; pp. 1–5. [Google Scholar]
  20. Frangopol, D.M.; Strauss, A.; Kim, S. Bridge Reliability Assessment Based on Monitoring. J. Bridge Eng. 2008, 13, 258–270. [Google Scholar] [CrossRef]
  21. Frangopol, D.M.; Kong, J.S.; Gharaibeh, E.S. Reliability-Based Life-Cycle Management of Highway Bridges. J. Comput. Civ. Eng. 2001, 15, 27–34. [Google Scholar] [CrossRef]
  22. Frangopol, D.M.; Liu, M. Maintenance and Management of Civil Infrastructure Based on Condition, Safety, Optimization, and Life-Cycle Cost. Struct. Infrastruct. Eng. 2007, 3, 29–41. [Google Scholar] [CrossRef]
  23. Biondini, F.; Frangopol, D.M. Life-Cycle Performance of Deteriorating Structural Systems under Uncertainty: Review. J. Struct. Eng. 2016, 142, F4016001. [Google Scholar] [CrossRef]
  24. Akgül, F.; Frangopol, D.M. Lifetime Performance Analysis of Existing Steel Girder Bridge Superstructures. J. Struct. Eng. 2004, 130, 1875–1888. [Google Scholar] [CrossRef]
  25. Okasha, N.M.; Frangopol, D.M. Lifetime-Oriented Multi-Objective Optimization of Structural Maintenance Considering System Reliability, Redundancy and Life-Cycle Cost Using GA. Struct. Saf. 2009, 31, 460–474. [Google Scholar] [CrossRef]
  26. Bhandari, P.; Jang, S.; Han, S.; Malla, R.B. Wireless Joint Monitoring System for Large Movement Expansion Joints for Highway Bridge Resilience; University Transportation Center (Region 1), Transportation Infrastructure Durability Center; US DoT Transportation Center—Region 1: Orono, ME, USA, 2025.
  27. Bhandari, P.; Jang, S.; Fils, P.; Han, S.; Malla, R.B. Wireless Joint Monitoring System (w-JMS) for Safety of Highway Bridges; TIDC1.16; US DoT Transportation Center—Region 1: Orono, ME, USA, 2024.
  28. Fils, P.; Jang, S.; Ren, D.; Wang, J.; Han, S.; Malla, R. Full-Scale Bridge Expansion Joint Monitoring Using a Real-Time Wireless Network. Struct. Monit. Maint. 2022, 9, 359–371. [Google Scholar]
  29. Bhandari, P.; Jang, S.; Malla, R.B.; Han, S. ANN-Based Bridge Support Fixity Quantification Using Thermal Response Data from Real-Time Wireless Sensing. Sensors 2024, 24, 5350. [Google Scholar] [CrossRef] [PubMed]
  30. 2023 MANS-026—Volume. Available online: https://trafficmonitoring.dot.ct.gov/tminfo/top?year=latest,town=77,station=26,dataset=0 (accessed on 24 November 2025).
  31. CTDOT Bridges. Available online: https://connecticut-ctdot.opendata.arcgis.com/datasets/CTDOT::ctdot-bridges?layer=1 (accessed on 24 November 2025).
  32. Sisinni, E.; Saifullah, A.; Han, S.; Jennehag, U.; Gidlund, M. Industrial Internet of Things: Challenges, Opportunities, and Directions. IEEE Trans. Ind. Inform. 2018, 14, 4724–4734. [Google Scholar] [CrossRef]
  33. Georgakakis, E.; Nikolidakis, S.A.; Vergados, D.D.; Douligeris, C. An Analysis of Bluetooth, Zigbee and Bluetooth Low Energy and Their Use in WBANs. In Proceedings of the Wireless Mobile Communication and Healthcare; Lin, J.C., Nikita, K.S., Eds.; Springer: Berlin/Heidelberg, Germany, 2011; pp. 168–175. [Google Scholar]
  34. IEEE 802.15.4. Available online: https://www.ieee802.org/15/pub/TG4.html (accessed on 6 December 2025).
  35. Hampel, F.R. The Influence Curve and its Role in Robust Estimation. J. Am. Stat. Assoc. 1974, 69, 383–393. [Google Scholar] [CrossRef]
  36. ANSYS, Inc. ANSYS Mechanical; ANSYS, Inc.: Canonsburg, PA, USA, 1996. [Google Scholar]
Figure 1. The real-time field monitoring framework.
Infrastructures 11 00055 g001
Figure 2. Photograph of Bridge 1 (CT NBI ID1531) (left) and field-installed monitoring system (right).
Infrastructures 11 00055 g002
Figure 3. Bridge 2 (CT NBI ID2570) (left) and field-installed monitoring system (right).
Infrastructures 11 00055 g003
Figure 4. Bridge 3 (CT NBI ID0674A) (left) and field-installed monitoring system (right).
Infrastructures 11 00055 g004
Figure 5. The testbed bridge selection and prioritization process.
Infrastructures 11 00055 g005
Figure 6. Schematic block diagram of the real-time monitoring system developed and deployed.
Infrastructures 11 00055 g006
Figure 7. Environmental hardening of: (a) Sensors and their 3D-printed enclosure; (b) Sensor enclosure with magnetic base; (c) Data acquisition system hardware enclosure.
Infrastructures 11 00055 g007
Figure 8. Comparison of post-processed ultrasonic distance sensor and LVDT measurements.
Infrastructures 11 00055 g008
Figure 9. Glimpses of field environmental challenges: (a) Corroded sensor pins; (b) Flowing deicer through the joint; (c) Flowing water within the sensing system from the joint.
Infrastructures 11 00055 g009
Figure 10. Graphical User Interface (GUI) of the user dashboard for data visualization and analytics.
Infrastructures 11 00055 g010
Figure 11. An example of data analysis workflow on the back end of a visualization system.
Infrastructures 11 00055 g011
Figure 12. Illustrative figure showing the effect of different signal processing methods on the measured response.
Infrastructures 11 00055 g012
Figure 13. Typical LRM of displacement-temperature developed from field measurements.
Infrastructures 11 00055 g013
Figure 14. Challenges in power management: (a) snow accumulation; (b) self-shading and orientation; (c) risk of vandalism; (d) Typical Daily Energy Harvesting from frame-mounted panels in Autman season.
Infrastructures 11 00055 g014
Table 1. Summary of the comparison of shortlisted sensors for expansion joint monitoring.
Sensor TypeAdvantagesDisadvantagesResolution
Wired SensorsLVDTSub-millimeter precision, contact sensorHigh cost, power, maintenance; long-term performance issuessub-mm to ∞ (Analogs)
Keyence laserHigh sensitivity, preciseSensitive to dirt and environmental exposure, high costsub-mm
Wireless SensorsUltrasonicNon-contact, robust outdoor performance, low powerLower accuracy, angle/material-dependentmm
InfraredNon-contact, simple, low-costNon-linear response, sensitive to environmentmm
ToFNon-contact, low-cost, low powerLight exposure-dependent, lower accuracymm
Table 2. Field monitoring schedules and used sensors for each bridge.
Bridge S/NNational Bridge Inventory IDMonitoring PeriodMeasurements/Sensors
Bridge 1CT1531May 2023–June 2023LVDT *, accelerometers *, ultrasonic, DHT
Bridge 2CT2570April 2024–July 2024Ultrasonic, DHT
Bridge 3CT671AOctober 2024–September 2025LVDT *, ultrasonic, DHT, temperature loggers
* Sensors were only deployed for a short term for validation purposes.
Table 3. Partial cost comparison of traditional systems and the developed sensing system.
ComponentsTraditional SystemPrice (USD)Developed SystemPrice
Displacement sensorLVDT
Logger or DAQ
$1000+ (for 8 in)
$1000+
Ultrasonic sensor$4.5
Temperature & Humidity sensorT&H sensor$12.99Grove T&H sensor v.2$6.5
Computation coreLaptop$500–$2000
(use $1000)
Arduino Uno
RPi
$27
$35~
CommunicationWire$70–$150
(x2 per sensor)
Communication boards, TI CC265x$37 (per node)
Net Total $3312.99 $147
Disclaimer/Publisher’s Note: The statements, opinions and data contained in all publications are solely those of the individual author(s) and contributor(s) and not of MDPI and/or the editor(s). MDPI and/or the editor(s) disclaim responsibility for any injury to people or property resulting from any ideas, methods, instructions or products referred to in the content.